Article

Decomposition of Intensity and Sustainable Use Countermeasures for the Energy Resources of the Northwestern Five Provinces of China Using the Logarithmic Mean Divisia Index (LMDI) Method and Three Convergence Models

1
Key Laboratory of Poyang Lake Wetland and Watershed Research, Ministry of Education, School of Geography and Environment, Jiangxi Normal University, Nanchang 330022, China
2
Changbei Campus, Nanchang Normal University, Nanchang 330032, China
3
School of Finance, Jiangxi Normal University, Nanchang 330022, China
*
Author to whom correspondence should be addressed.
Energies 2025, 18(6), 1330; https://doi.org/10.3390/en18061330
Submission received: 16 February 2025 / Revised: 5 March 2025 / Accepted: 6 March 2025 / Published: 8 March 2025
(This article belongs to the Special Issue Energy Planning from the Perspective of Sustainability)

Abstract

:
Energy resources are a material basis for regional sustainable development and ecological security. However, this issue has not been adequately studied in Northwest China. Here, we consider the five northwestern provinces of China and break down the change in energy use intensity. Results show that the total energy intensity in the five northwestern provinces decreased from 2.389 tons/104 Chinese yuan (CNY) in 2000 to 0.92 tons/104 CNY in 2021. The main influencing factors for the decline in energy intensity are the industrial energy intensity followed by the industrial structure and the energy structure. There are eight industrial sub-sectors that contributed to the decrease in industrial energy intensity. Conversely, there are seven sub-sectors that increased industrial energy intensity. In addition, there are six sub-sectors with an energy intensity of more than 1 ton/104 CNY. The convergence parameters demonstrate that the energy intensities of the five northwestern provinces did not converge to the same steady-state level, and their gap did not narrow in the short term. While the region’s overall energy intensity has shown a consistent downward trajectory, sectors heavily reliant on traditional fossil fuels—such as coal chemical processing, petroleum refining, and coking—have experienced a paradoxical upward trend in energy consumption. To address this, governments must implement targeted sector-specific measures, including upgrading technical capabilities through advanced coal gasification technologies, optimizing heat integration systems in petroleum refining processes, and streamlining intermediate production stages to minimize energy waste.

1. Introduction

China’s economy has grown significantly and sustainably since the policy of opening up was proposed in 1978 [1]. However, this growth has come at great cost, involving massive consumption of fossil fuel energy and serious damage to the ecological environment. To tackle these issues, a strategic framework for sustainable development in the 21st century was established by the Chinese government in 1994 [2]. Within this framework, the sustainable energy development strategies are expected to make a significant contribution to guaranteeing economic growth, promoting social progress, and enhancing living standards. The massive consumption of energy means fossil fuel energy is rapidly depleting. Thus, economic development that integrates sustainable energy development is a critical challenge. Energy security and sustainability are increasing concerns for all countries [3,4,5,6]. For example, Thailand has carried out energy management on the iron and steel industry and increased the research on energy conservation and emission reduction [7]. The Swedish government aims to produce 100% renewable electricity by 2040 [8].
China, as the world’s largest energy consumer, has experienced rapid economic growth at the cost of high non-renewable energy consumption [9]. The proportion of fossil energy will decrease significantly in the coming decades, but it will still be utilized as the primary energy source [10,11]. Thus, higher efficiency and clean utilization of fossil energy are primary concerns in China. Energy intensity is the amount of energy consumed per unit of Gross Domestic Product (GDP). It can be used to evaluate the efficiency of comprehensive energy use and assess directly the resource and environmental costs of economic growth, and it is used widely in policy analysis [12]. Thus, it is essential to understand properly the characteristics of energy intensity at different stages to promote the sustainable use of energy in less-developed regions.
The five northwestern provinces of China, Shaanxi, Gansu, Ningxia, Qinghai, and Xinjiang, are rich in coal, oil, and natural-gas resources (Figure 1). However, their deeply landlocked geographic location has limited their economic and technological development. The eastern and coastal regions were the first to carry out opening-up policies and introduce advanced technology and capital from abroad. At the same time, a well-developed infrastructure and a strong industrial base were established in the eastern region, which not only contributed to the rapid development of the eastern region, but attracted an inflow of talent from the western region [13]. These facts have led to a lower level of technology and energy use efficiency in the western region. For example, ref. [14] evaluated the potential for energy intensity decrease in China and showed that the potential was most significant in the western region. Additionally, some scholars have analyzed energy efficiency in resource-rich yet underdeveloped regions of China, such as Shanxi, Inner Mongolia, Guangxi, and Anhui. They found that the industrial structure and technological level are the main factors restricting energy efficiency [15,16,17]. However, these studies have not explored the issue from a more detailed, industry-specific perspective.
The northwest China region is in the middle or near late stage of industrialization and needs to rely on large amounts of fossil energy consumption to drive economic development [18,19]. As shown in Figure 2a, the GDP of the five northwestern provinces of China has increased with energy consumption, which rose from 1.14 × 10⁸ tons of standard coal equivalent (tce) in 2000 to 5.56 × 10⁸ tce in 2021. The GDP of the region also grew from 0.48 × 10¹² CNY in 2000 to 6.08 × 10¹² CNY in 2021. As shown in Figure 2b, energy intensity in the five northwestern provinces is above the domestic average, which means that the decrease in energy intensity in the northwest has also contributed to the improvement of domestic energy efficiency. Therefore, to reduce the energy intensity in Northwest China and the continuous improvement of energy use efficiency at the nationwide level, it is urgent to analyze the energy intensity of Northwest China.
Generally, two decomposition methods are commonly used in studies on energy consumption: Structural Decomposition Analysis (SDA) and LMDI (Logarithmic Mean Divisia Index [20]. SDA is supported by input–output data, which is difficult to obtain and is relatively backward, so it is not conducive to in-depth research. The LMDI method is the preferred method because it has no unexplainable residuals, and it can handle problems of zero value and negative value [21,22]. Therefore, LMDI is widely used for energy consumption decomposition in different perspectives [12,23,24].
The initial focus of convergence is on the growth trend of the economy over time. The commonly used convergence methods include σ convergence, β convergence, club convergence, and Gamma convergence [25,26,27]. Club convergence and Gamma convergence are suitable for large numbers of observations and wide analytical dimensions. The spatial position of the five northwestern provinces of China is clustered, and the number is small, which is more suitable for σ and β convergence. Energy intensity convergence is used to explain how the energy intensity gap varies over time in different regions and whether there is convergence or divergence between regions [28]. Energy intensity has been studied by many scholars using convergence methods from different perspectives [29,30].
In summary, the potential for energy intensity reduction in Northwest China is enormous [14,31,32]. Although some researchers have investigated energy consumption in Northwest China, there are still notable gaps in the exiting literature. First, most studies are limited to the decomposition analysis of driving factors and focus solely on individual provinces or industries, without extending to a comprehensive, cross-sectoral perspective. Second, there is a pressing need for further investigation into which provinces and sectors exhibit lower energy efficiency. Third, the future development patterns of energy efficiency in Northwest China also require further assessment. More traditional fossil energy will be consumed in the future economic development of the northwest, but the improvement of energy use efficiency can effectively alleviate this problem. Therefore, this research has two main contributions. First, we study the five provinces of Northwest China as a whole for the first time and use a more optimal approach to decompose and analyze the main factors influencing energy intensity. Second, we complete the research from the perspective of each industrial sub-sector and combine three convergence models to explore the paths of decreasing energy intensity. This study fills the gaps and shortcomings of previous research. In addition, the study can promote sustainable energy use in the region by providing a reference for the government as well as provide policy recommendations for other lagging regions.

2. Materials and Methods

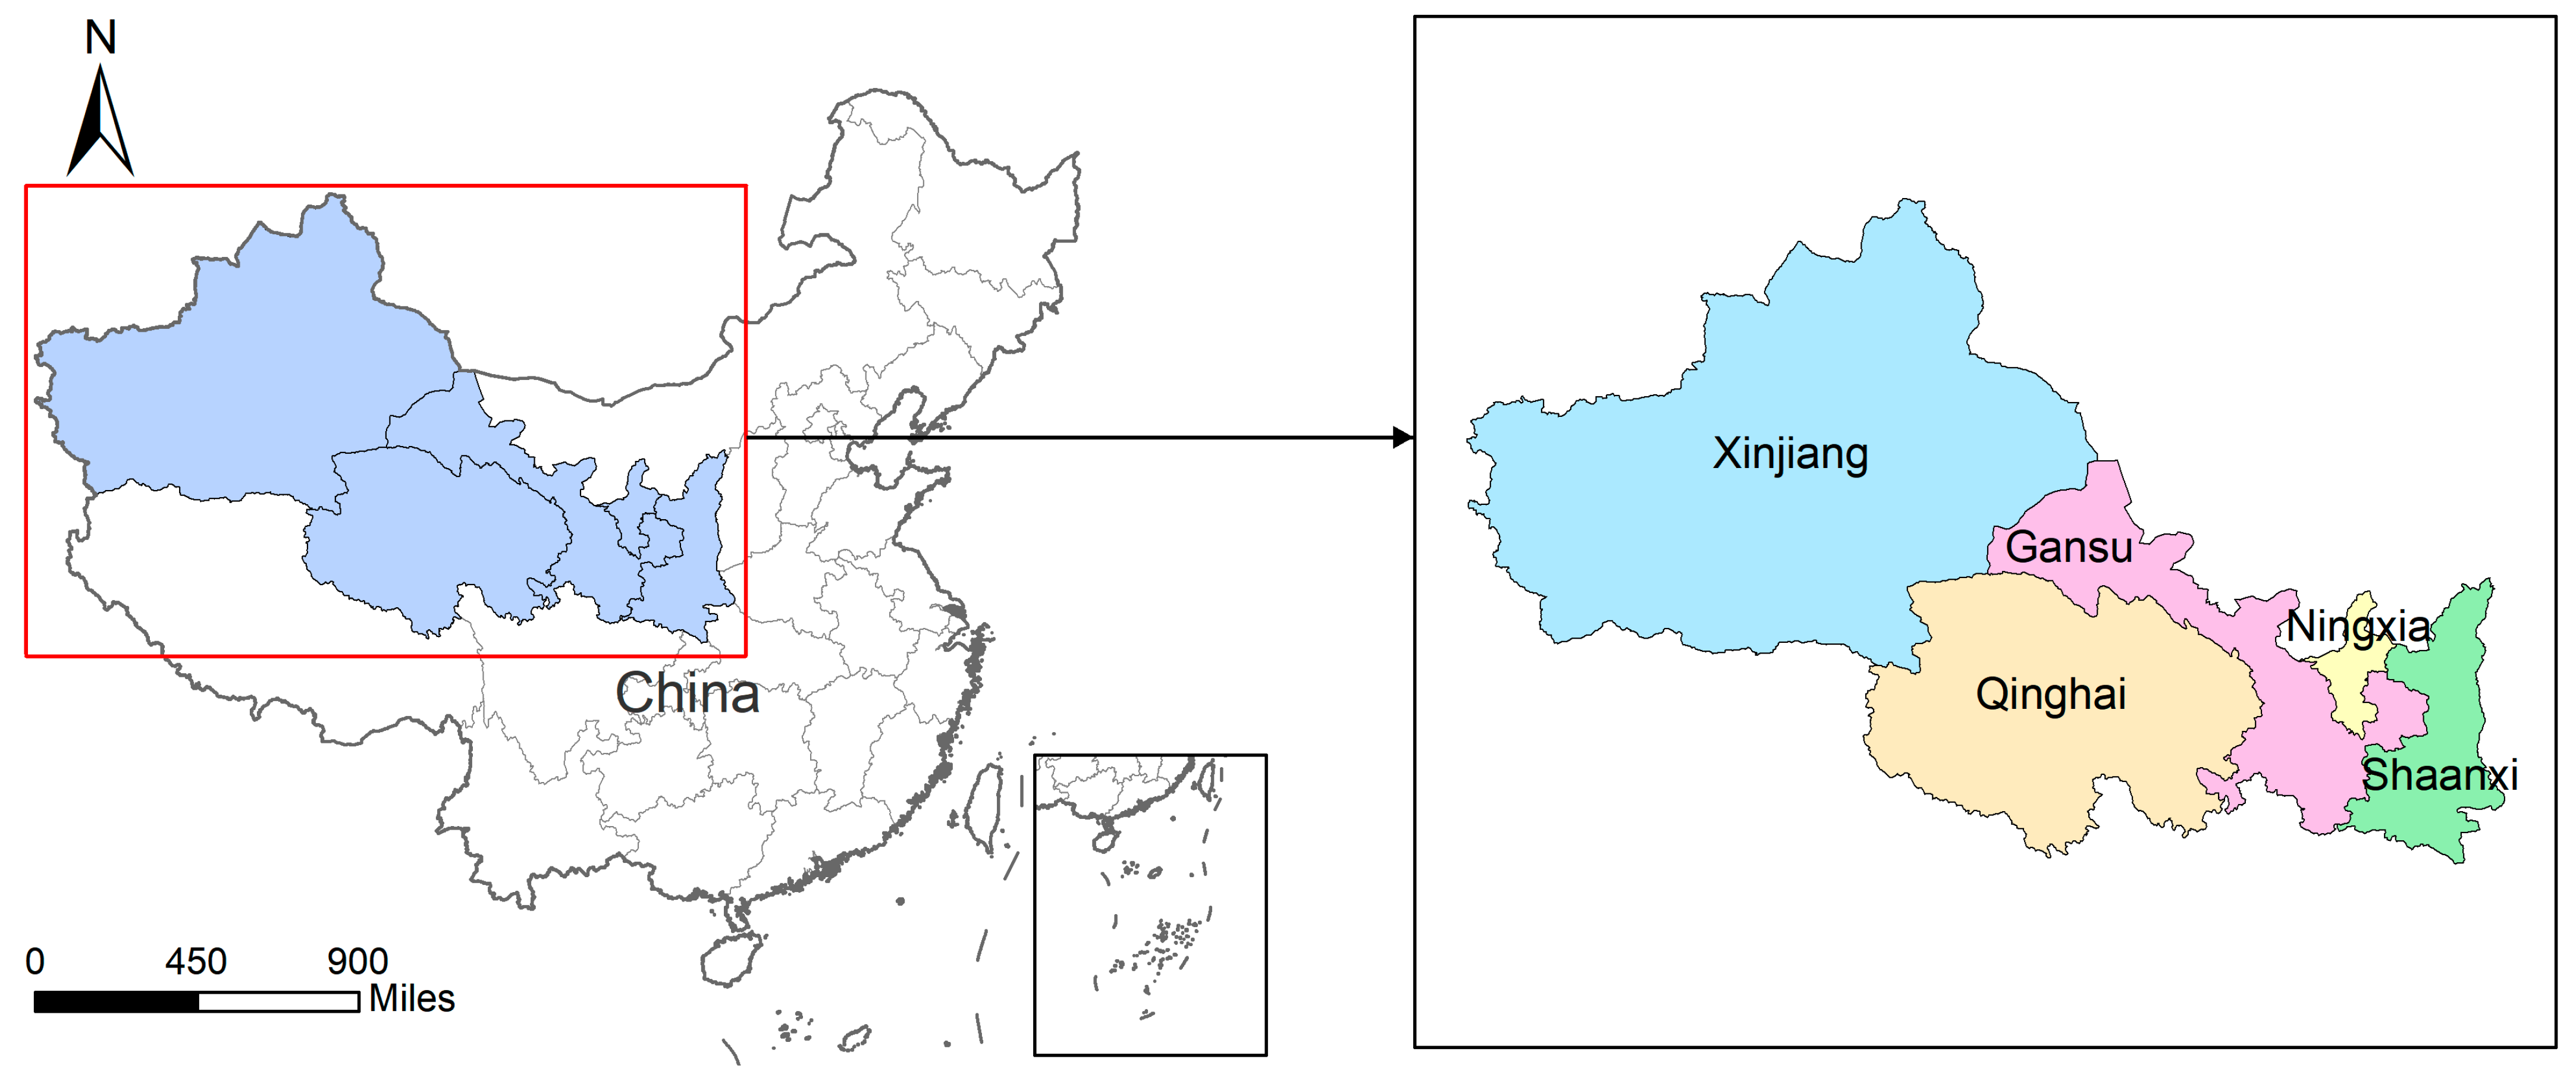
2.1. Data Source and Processing

Terminal energy consumption data from major industries in the five provinces from 2000 to 2021 were used. There was a lack of data on industrial energy consumption in Ningxia from 2000 to 2003, so it was interpolated using a trend-fitting method. However, to ensure proper estimation of convergence parameters, panel data from 2004 to 2021 were used. The terminal energy consumption was classified by type: coal, oil products, natural gas, and electricity. They were all converted into their equivalent quantity in standard coal according to the corresponding energy conversion coefficient. To eliminate the influence of price changes, the value added by each sector in past years was converted to constant 2000 prices. In addition, China’s GDP (the value of the final output of the whole economy) was obtained by summing up the value added of each sector. Thus, we used the value added of each sector when analyzing the energy intensity of each industry. All data were obtained from provincial statistical yearbooks.

2.2. LMDI Decomposition Method

Energy intensity is highly related to industrial structure, industrial energy intensity, and consumption structure. Thus, we consider these three factors as the influencing factors of energy intensity changes according to the expanded Kaya identity and LMDI model [33]. The classification of industrial structure is consistent with the Industrial Classification of National Economy Activities published by China in 2017 (see Appendix A, Table A1). The energy intensity is expressed as follows:
e t = E t y i = i m y i , t y i E i , t y i , t E i m , t E i , t = S i , t × I i , t × F i m , t .
All variables are defined in Table 1. Furthermore, e 0 , e T represent the base period and target period, respectively. Thus, the change in total energy intensity ( Δ e T o t ) can be written as
Δ e T o t = e T e 0 = Δ S i , t + Δ I i , t + Δ F i m , t
According to the LMDI additive decomposition method, each sub-effect can be written as follows:
Δ S i , t = i m e i , m T e i , m 0 ln e i , m T ln e i , m 0 × ln S i , t T S i , t 0
Δ I i , t = i m e i , m T e i , m 0 ln e i , m T ln e i , m 0 × ln I i , t T I i , t 0
Δ F i m , t = i m e i , m T e i , m 0 ln e i , m T ln e i , m 0 × ln F i m , t T F i m , t 0
where Δ e T o t is the total effect, Δ S i , t is the industrial structure effect, Δ I i , t is the industrial energy intensity effect, and Δ F i m , t is the energy structure effect.

2.3. Convergent Regression Method

2.3.1. Energy Intensity σ Convergence

Energy intensity σ convergence reflects the difference in regional energy intensity deviations from the overall mean [34]. The usual methods for testing σ convergence are the coefficient of variation (CV), σ coefficient (σ), and Gini coefficient (G) approaches. If the coefficient decreases gradually, it indicates that there is energy intensity σ convergence. We simultaneously apply all three methods to test the σ convergence of energy intensity, as shown below:
C V = i ( q d i , t q d ¯ ) 2 / N q d t ¯
σ = i [ ( ln ( q d i , t ) ln ( q d t ) ¯ ) 2 ] / N
G = 1 + 1 N 2 N 2 1 q d t ¯ ( q d 1 t + 2 q d 2 t + + n q d n t )   where ,   q d 1 t > 2 q d 2 t > n q d n t .
All variables are defined in Table 1.

2.3.2. Energy Intensity β Convergence Regression Test

Before performing the convergence regression, a unit root test is required to avoid pseudo-regression [35]. We used Levin, Lin and Chu (LLC); Fisher-ADF (ADF); Im, Pesaran and Shin W-stat (IPS); and Fisher-PP (PP) to perform unit root tests for each variable [36,37]. The test results are shown in Table 2. All variables are smooth series after taking first-order differences. For further clarifying the long-term stable equilibrium relationships between the variables, the Engle and Granger two-step methods, including the Kao and Pedroni tests, were used in this study [38]. The results of the tests are shown in Table 3. This suggests that an obvious co-integrated relationship exists between the variables.

2.3.3. Absolute β Convergence

Absolute β convergence means that the energy intensity gap between different provinces will continue to decrease as time goes by and converge ultimately to the same level [27], according to
ln = ( q d i , t + 1 q d i , t ) = α + β ln ( q d i , t ) + ε .
If β is negative, it means that there is an absolute β convergence of energy intensity.

2.3.4. Conditional β Convergence

Conditional β convergence indicates that the energy intensity of each province will evolve according to its own trend over time after adding the control variables [31], according to
ln = ( q d i , t + 1 q d i , t ) = α + β ln ( q d i , t ) + i β i λ i . t + ε .
Lin et al. [12] and Wang et al. [14] have found that industrial structure, industrial energy intensity, and energy structure are the three key factors influencing energy intensity. Here, considering the consistency with the factors of the decomposition analysis, we have also incorporated these three factors as control variables into the aforementioned model. Referring to the approach of Yu and Wang et al. [39,40], these three variables are reflected by the ratio of tertiary sector to secondary sector output, secondary sector energy intensity to total energy intensity, and coal use to gross energy use, respectively. If β is less than zero, it signifies the existence of conditional β convergence.

3. Results

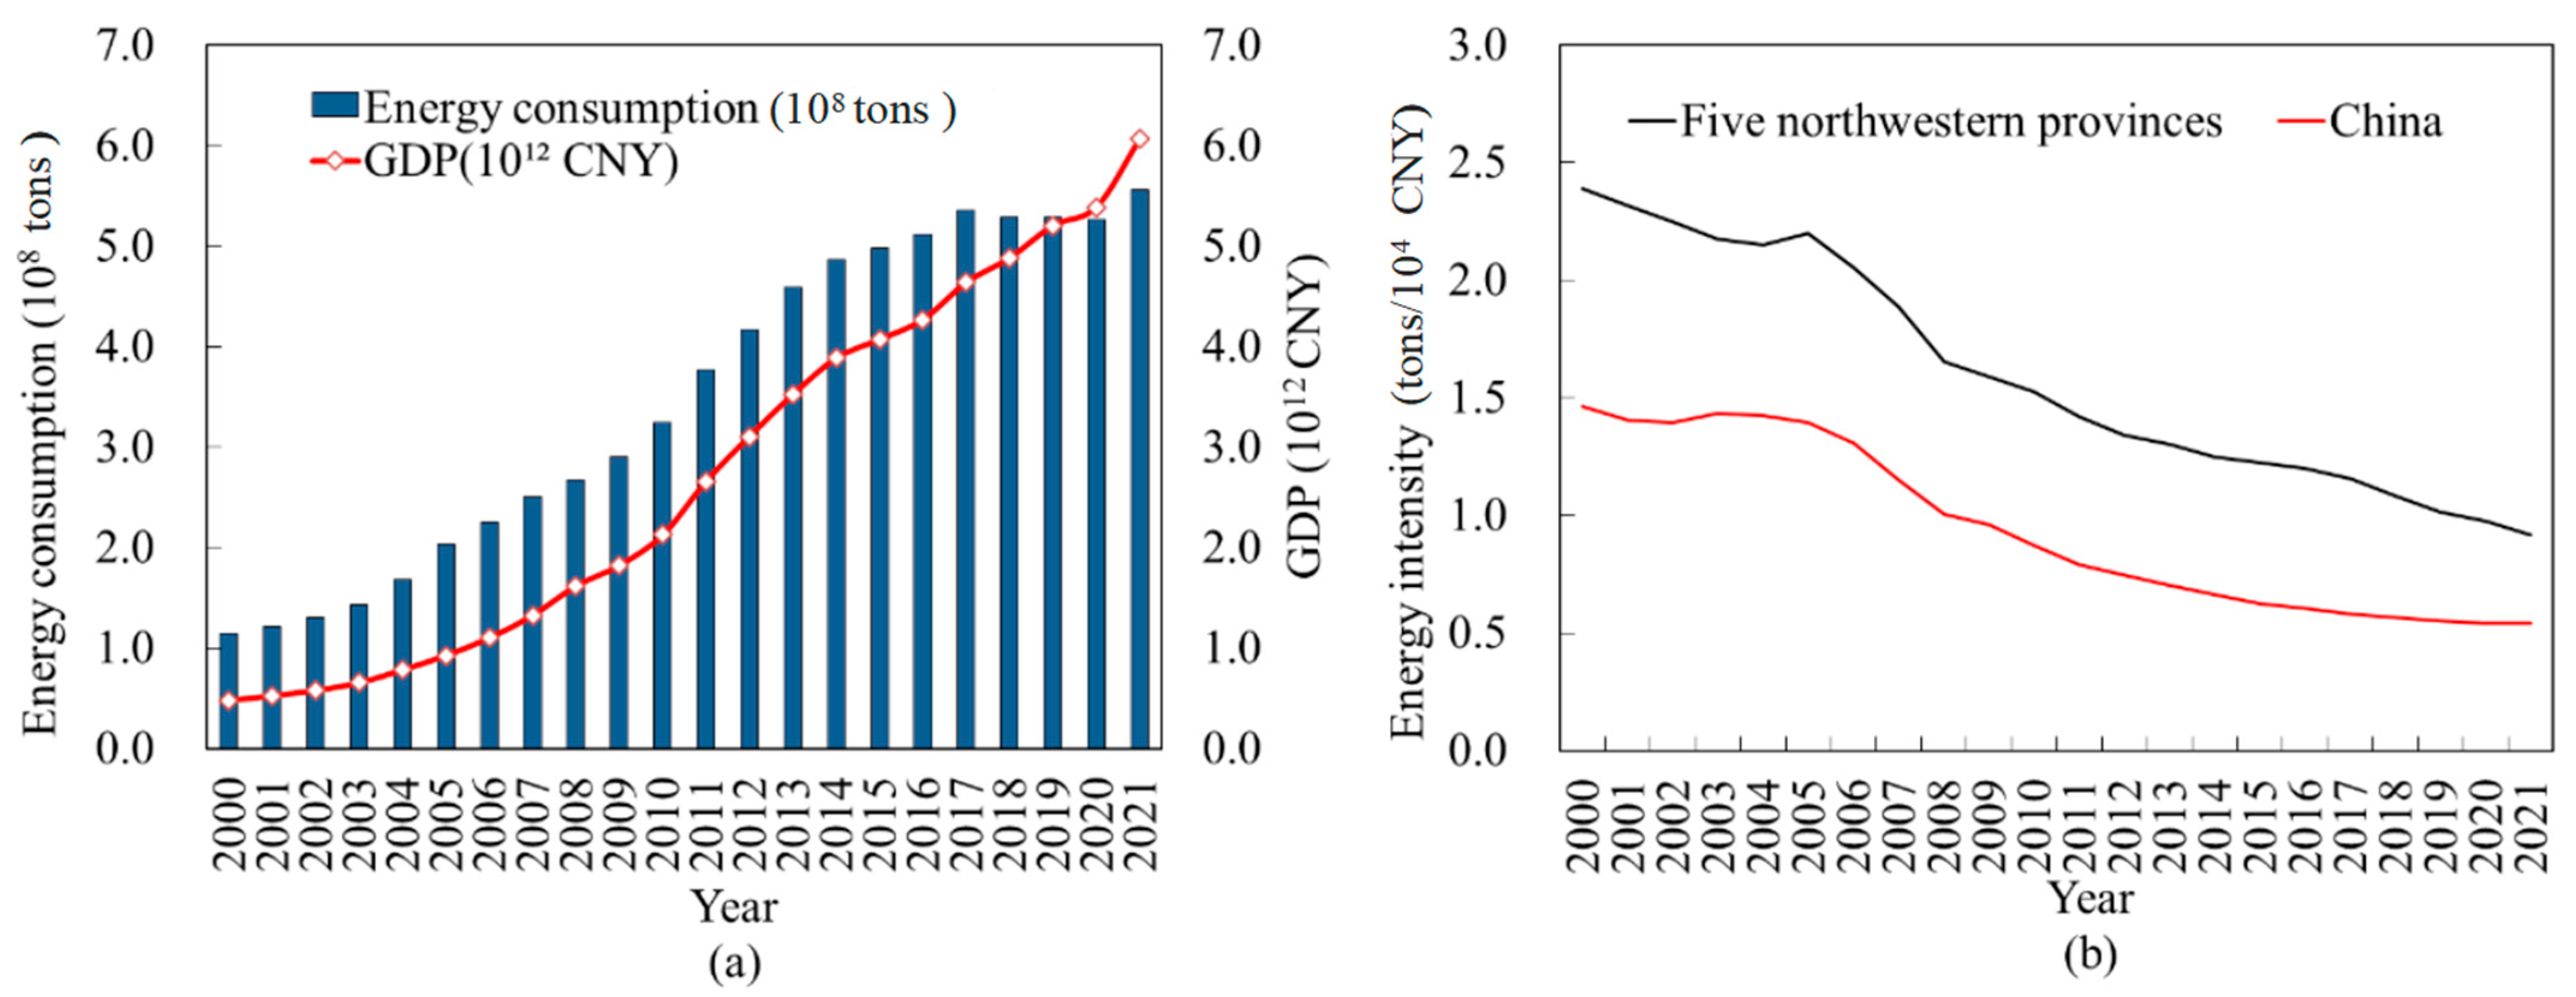
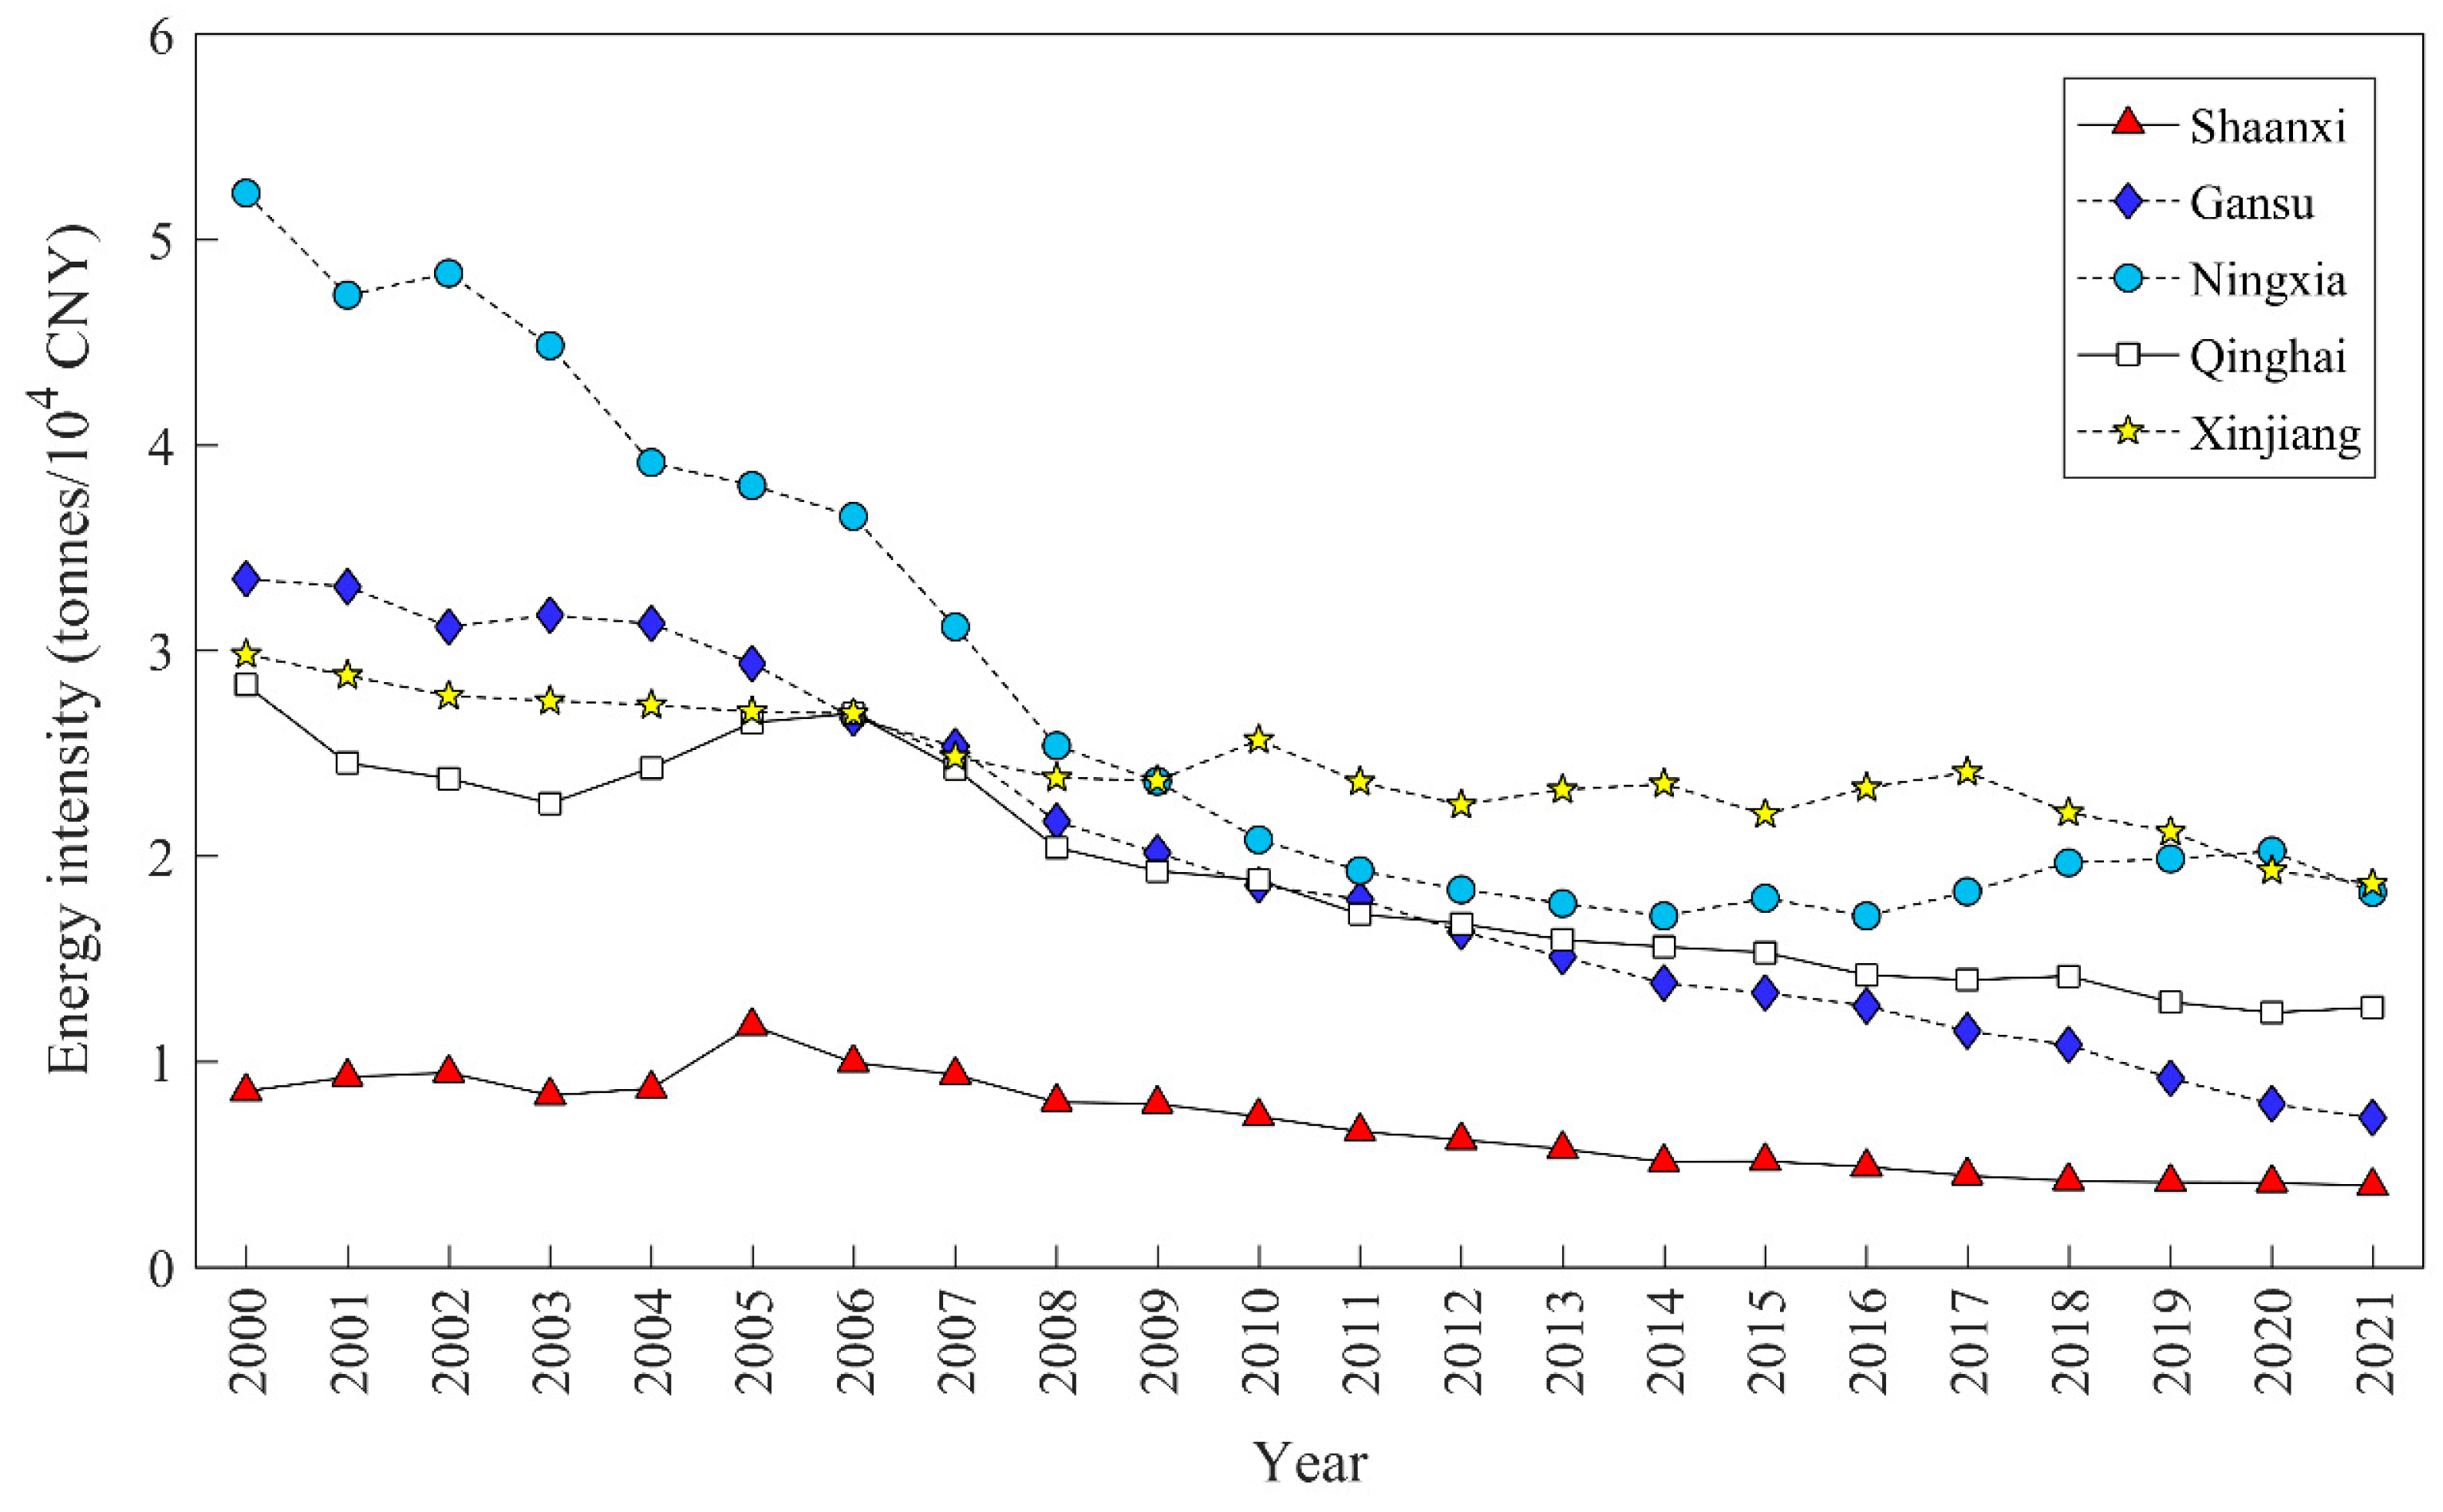
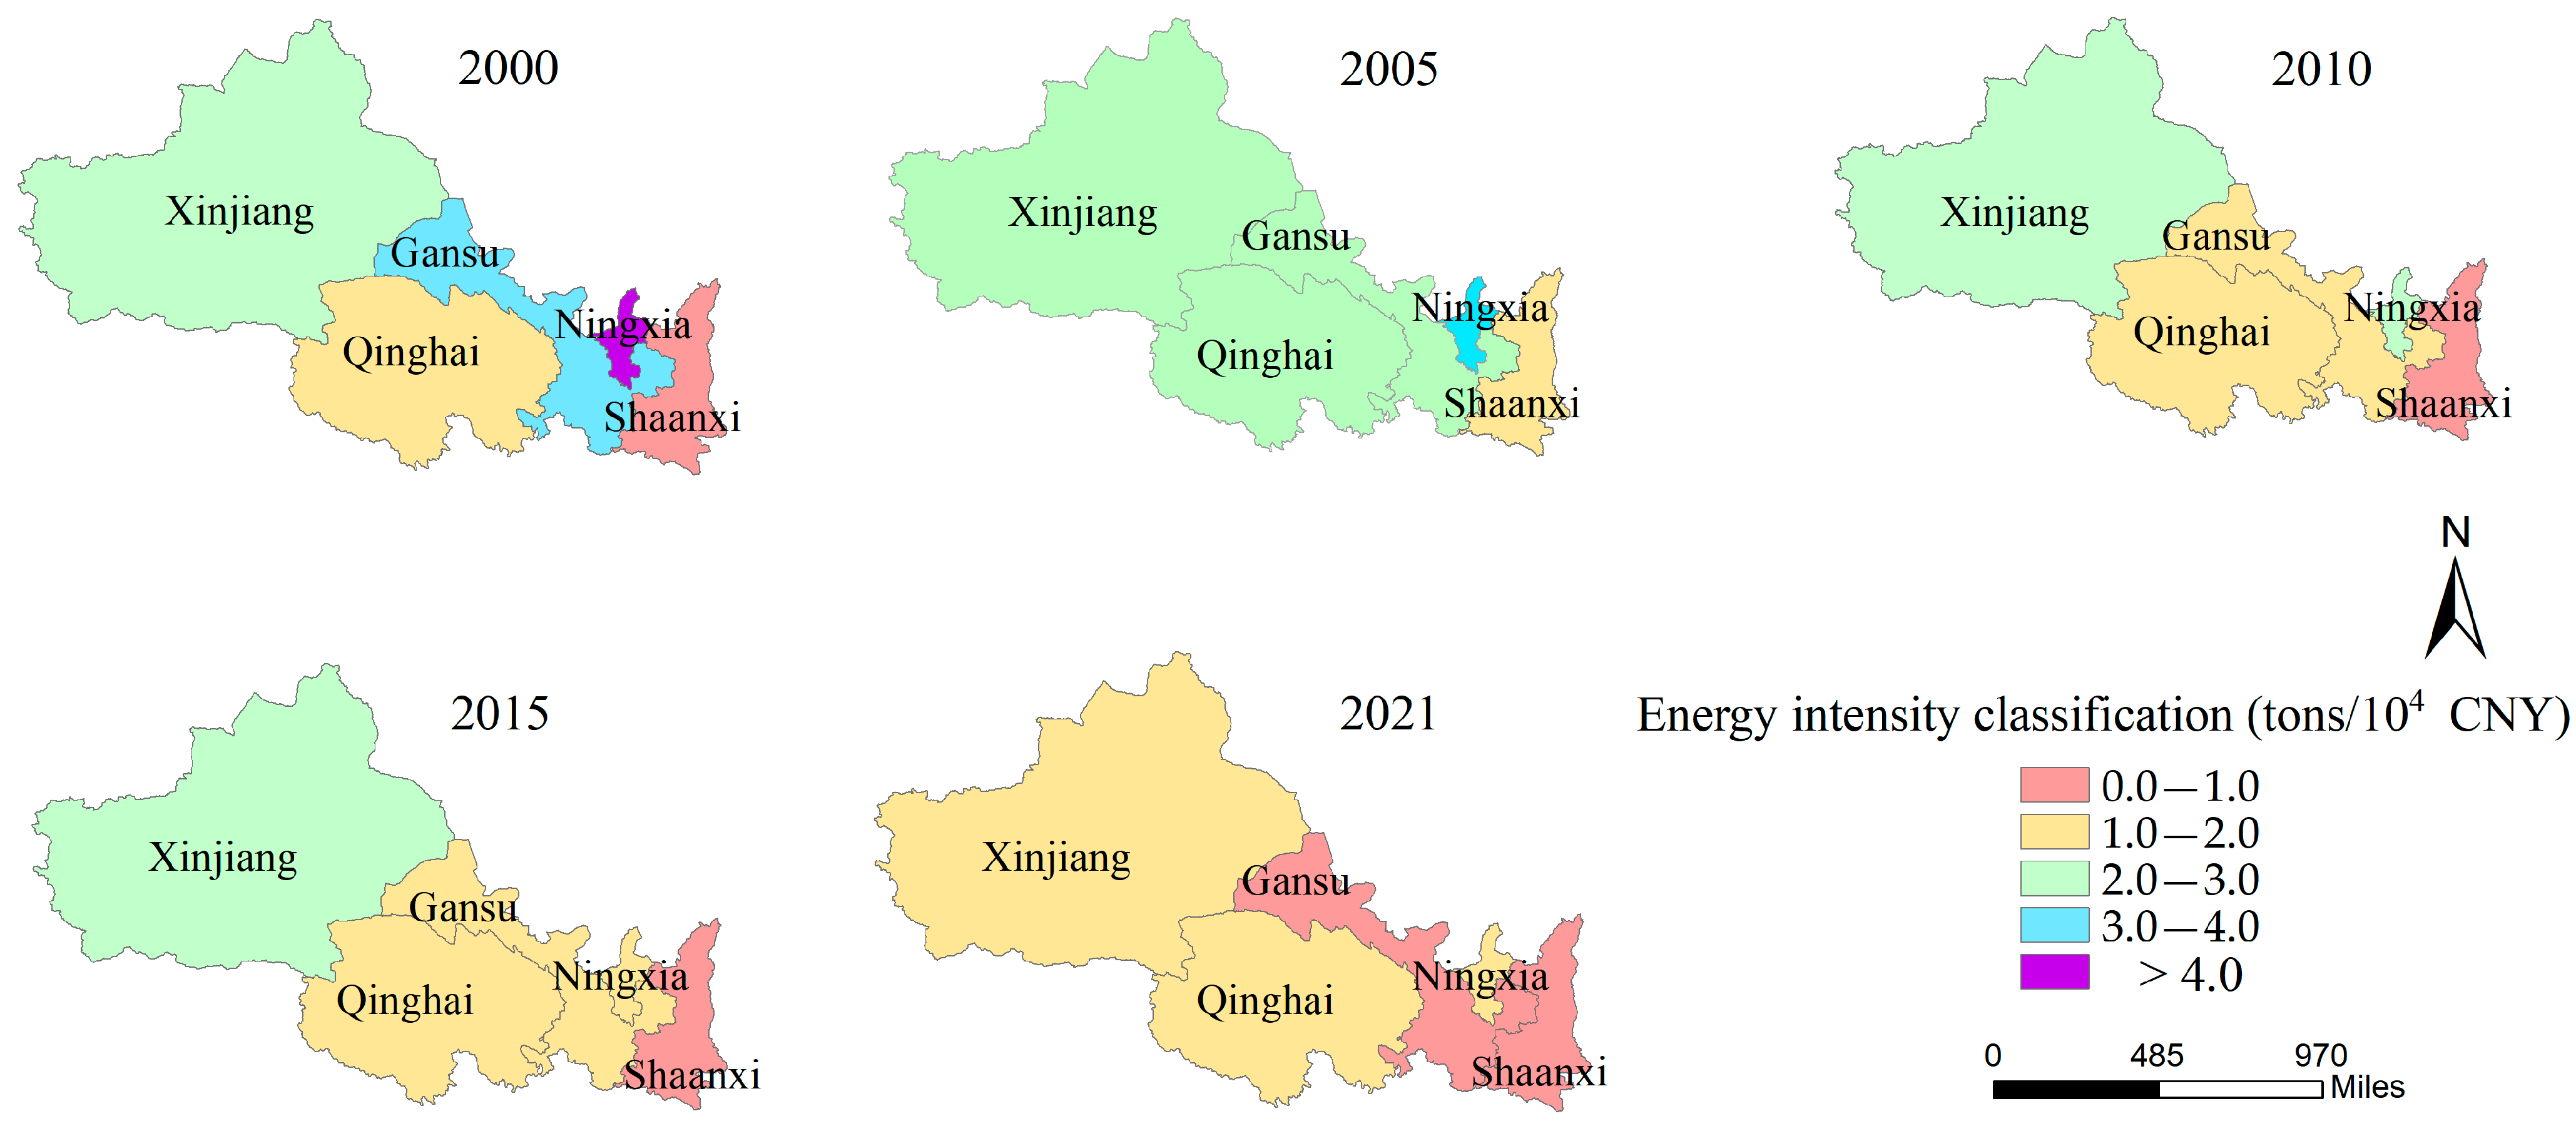
3.1. Trends in Energy Intensity in the Five Northwestern Provinces of China

The trend of energy intensity in the five northwestern provinces of China from 2000 to 2021 is shown in Figure 3. The energy intensity of each province had a downward but fluctuating trend. The decrease rates from largest to smallest were Gansu, Ningxia, Qinghai, Shaanxi, and Xinjiang. Gansu was from 3.34 tons/104 CNY in 2000 to 0.73 tons/104 CNY in 2021, with a decrease of 78.3%; Xinjiang was from 2.98 tons/104 CNY in 2000 to 1.86 tons/104 CNY in 2021, with a decrease of 37.5%. The energy intensity of all three provinces except Shaanxi and Gansu was greater than 1.0 tons/104 CNY in 2021. This result indicates that provinces have enhanced the efficiency of their energy use, though further improvements are still needed.

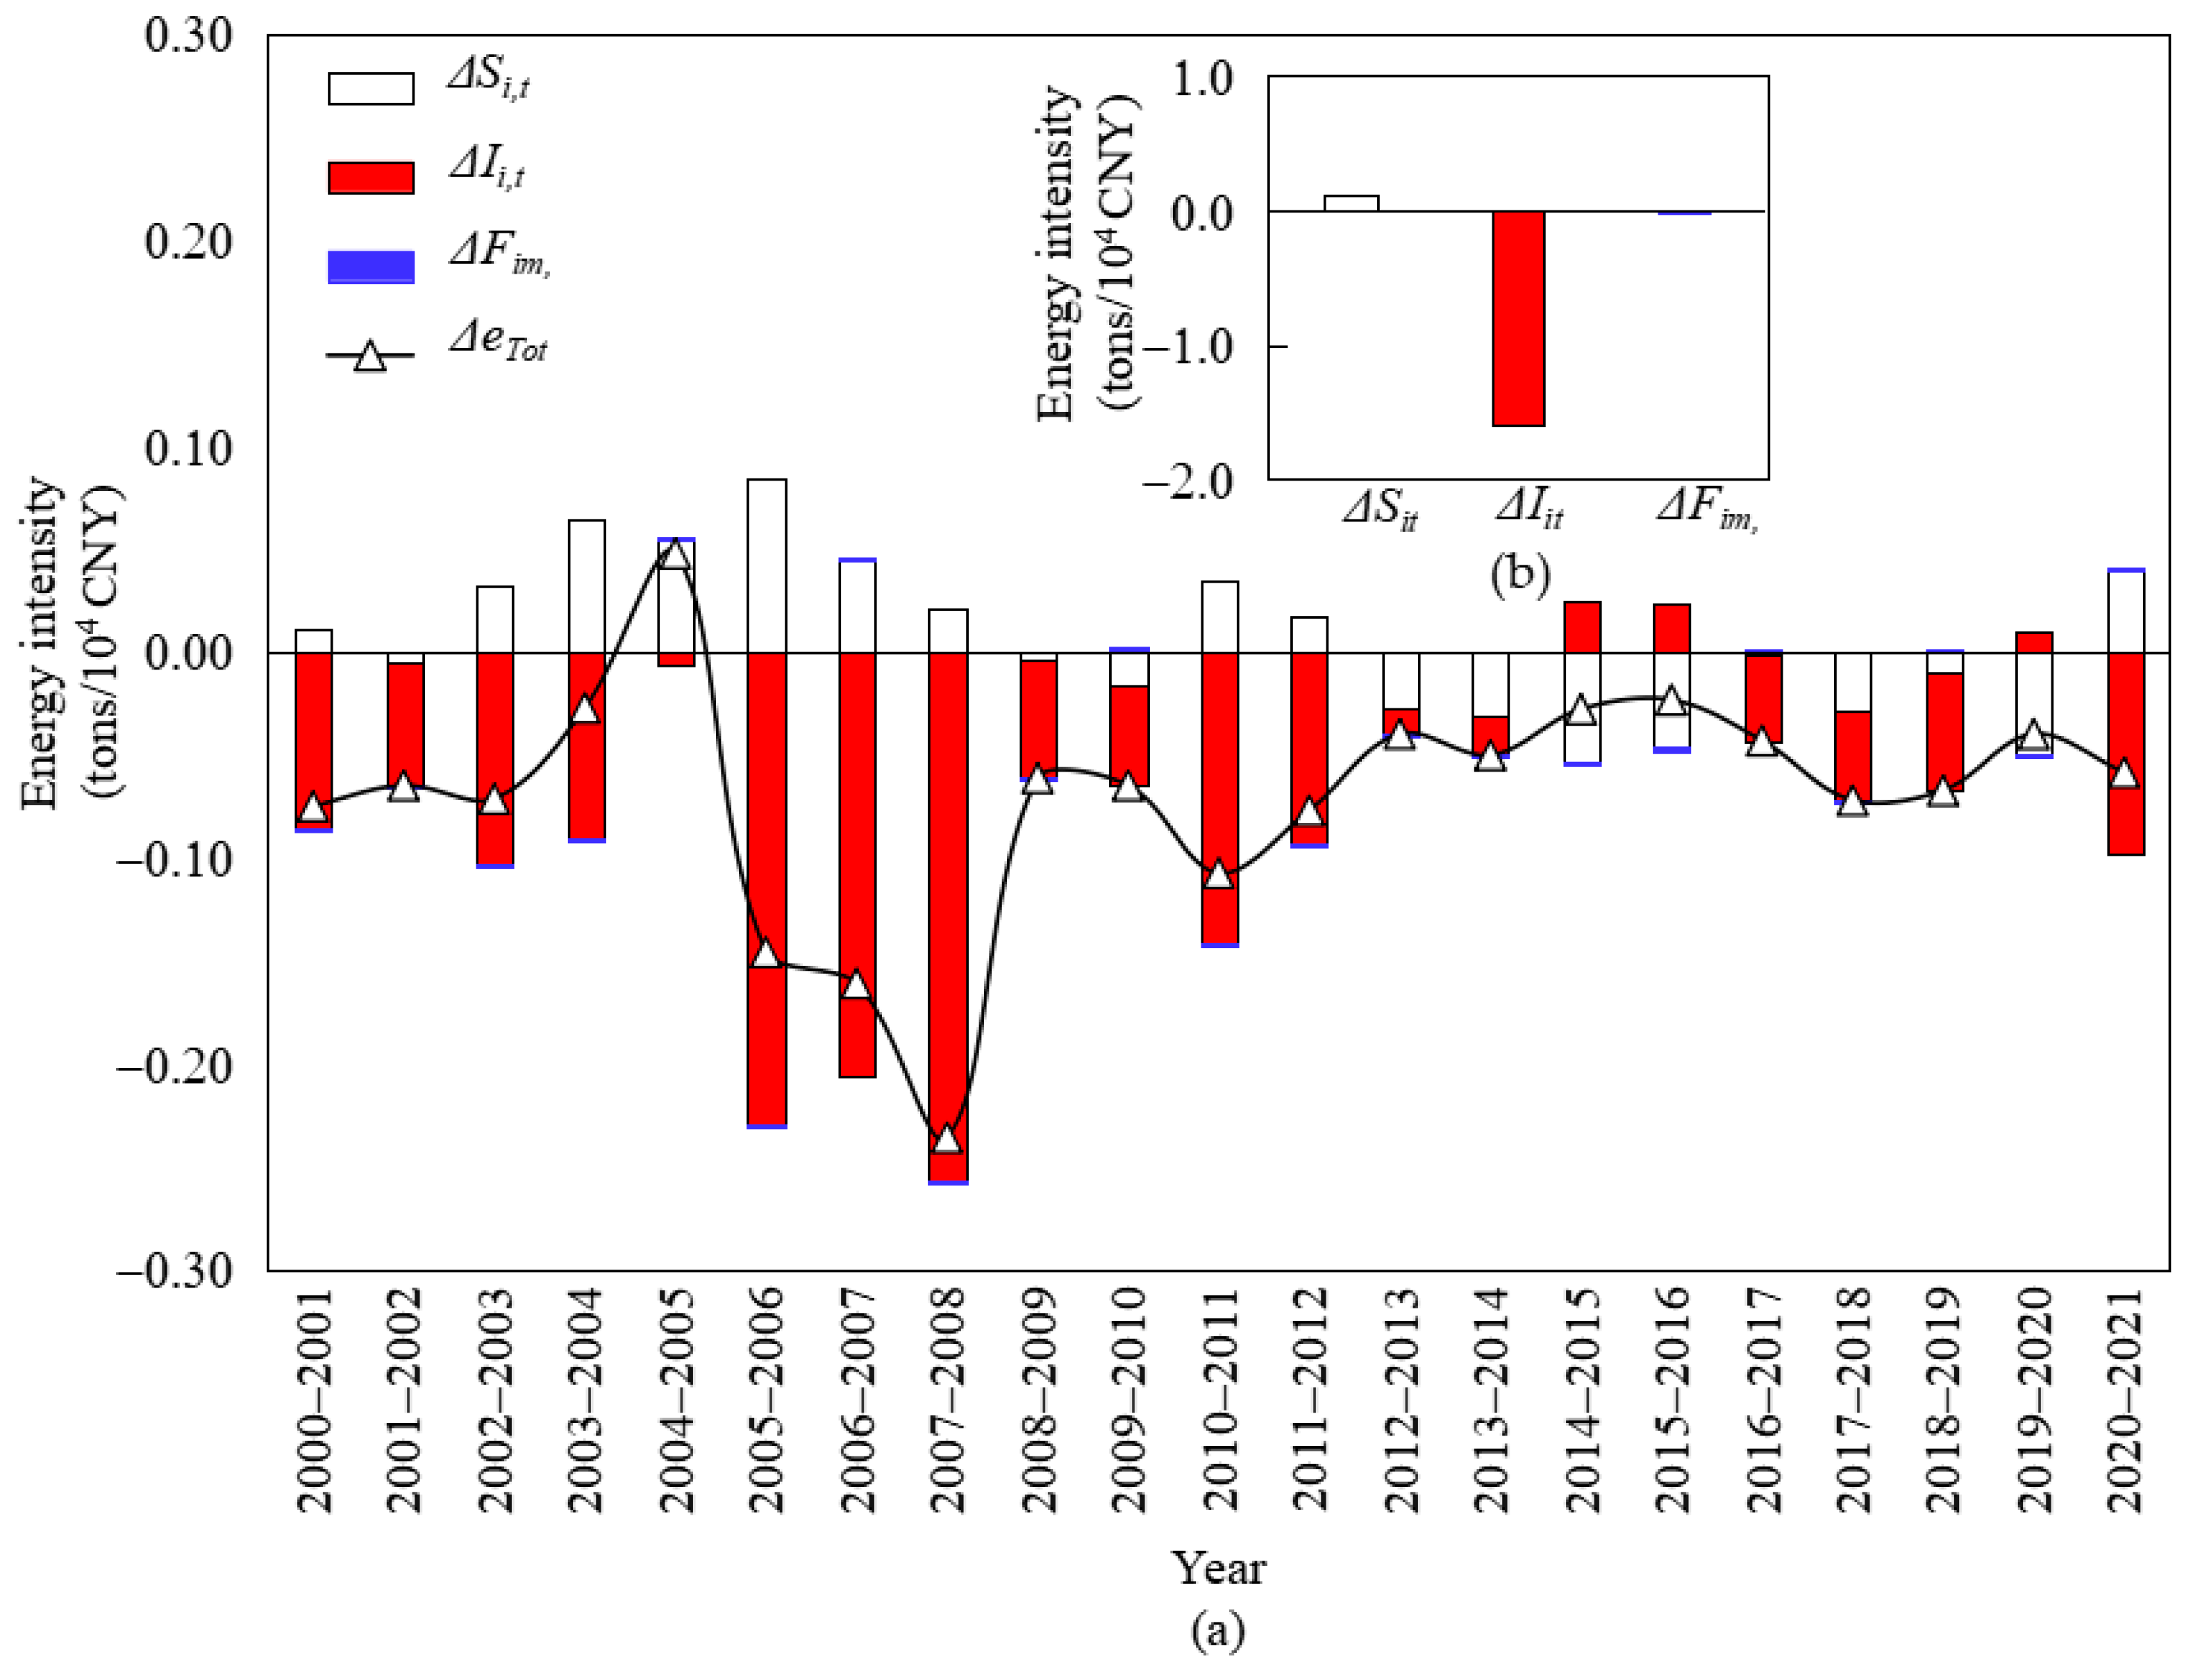
3.2. Energy Intensity Decomposition Results

The LMDI decomposition results of energy intensity in Northwestern China are shown in Figure 4. There was an overall decrease in energy intensity except during 2004–2005 (Figure 4a).
The increase in energy intensity in 2004–2005 was mainly influenced by Shaanxi and Qinghai provinces. In 2005, energy consumption in Shaanxi and Qinghai provinces increased by 17.58 million tce and 3.02 million tce, respectively, compared with 2004. This was attributed to the western development of the “10th Five-Year Plan”. A number of major infrastructure goals such as transportation, thermal power, water conservancy, energy, and other areas increased energy demand, which in turn led to a rebound in total energy intensity.

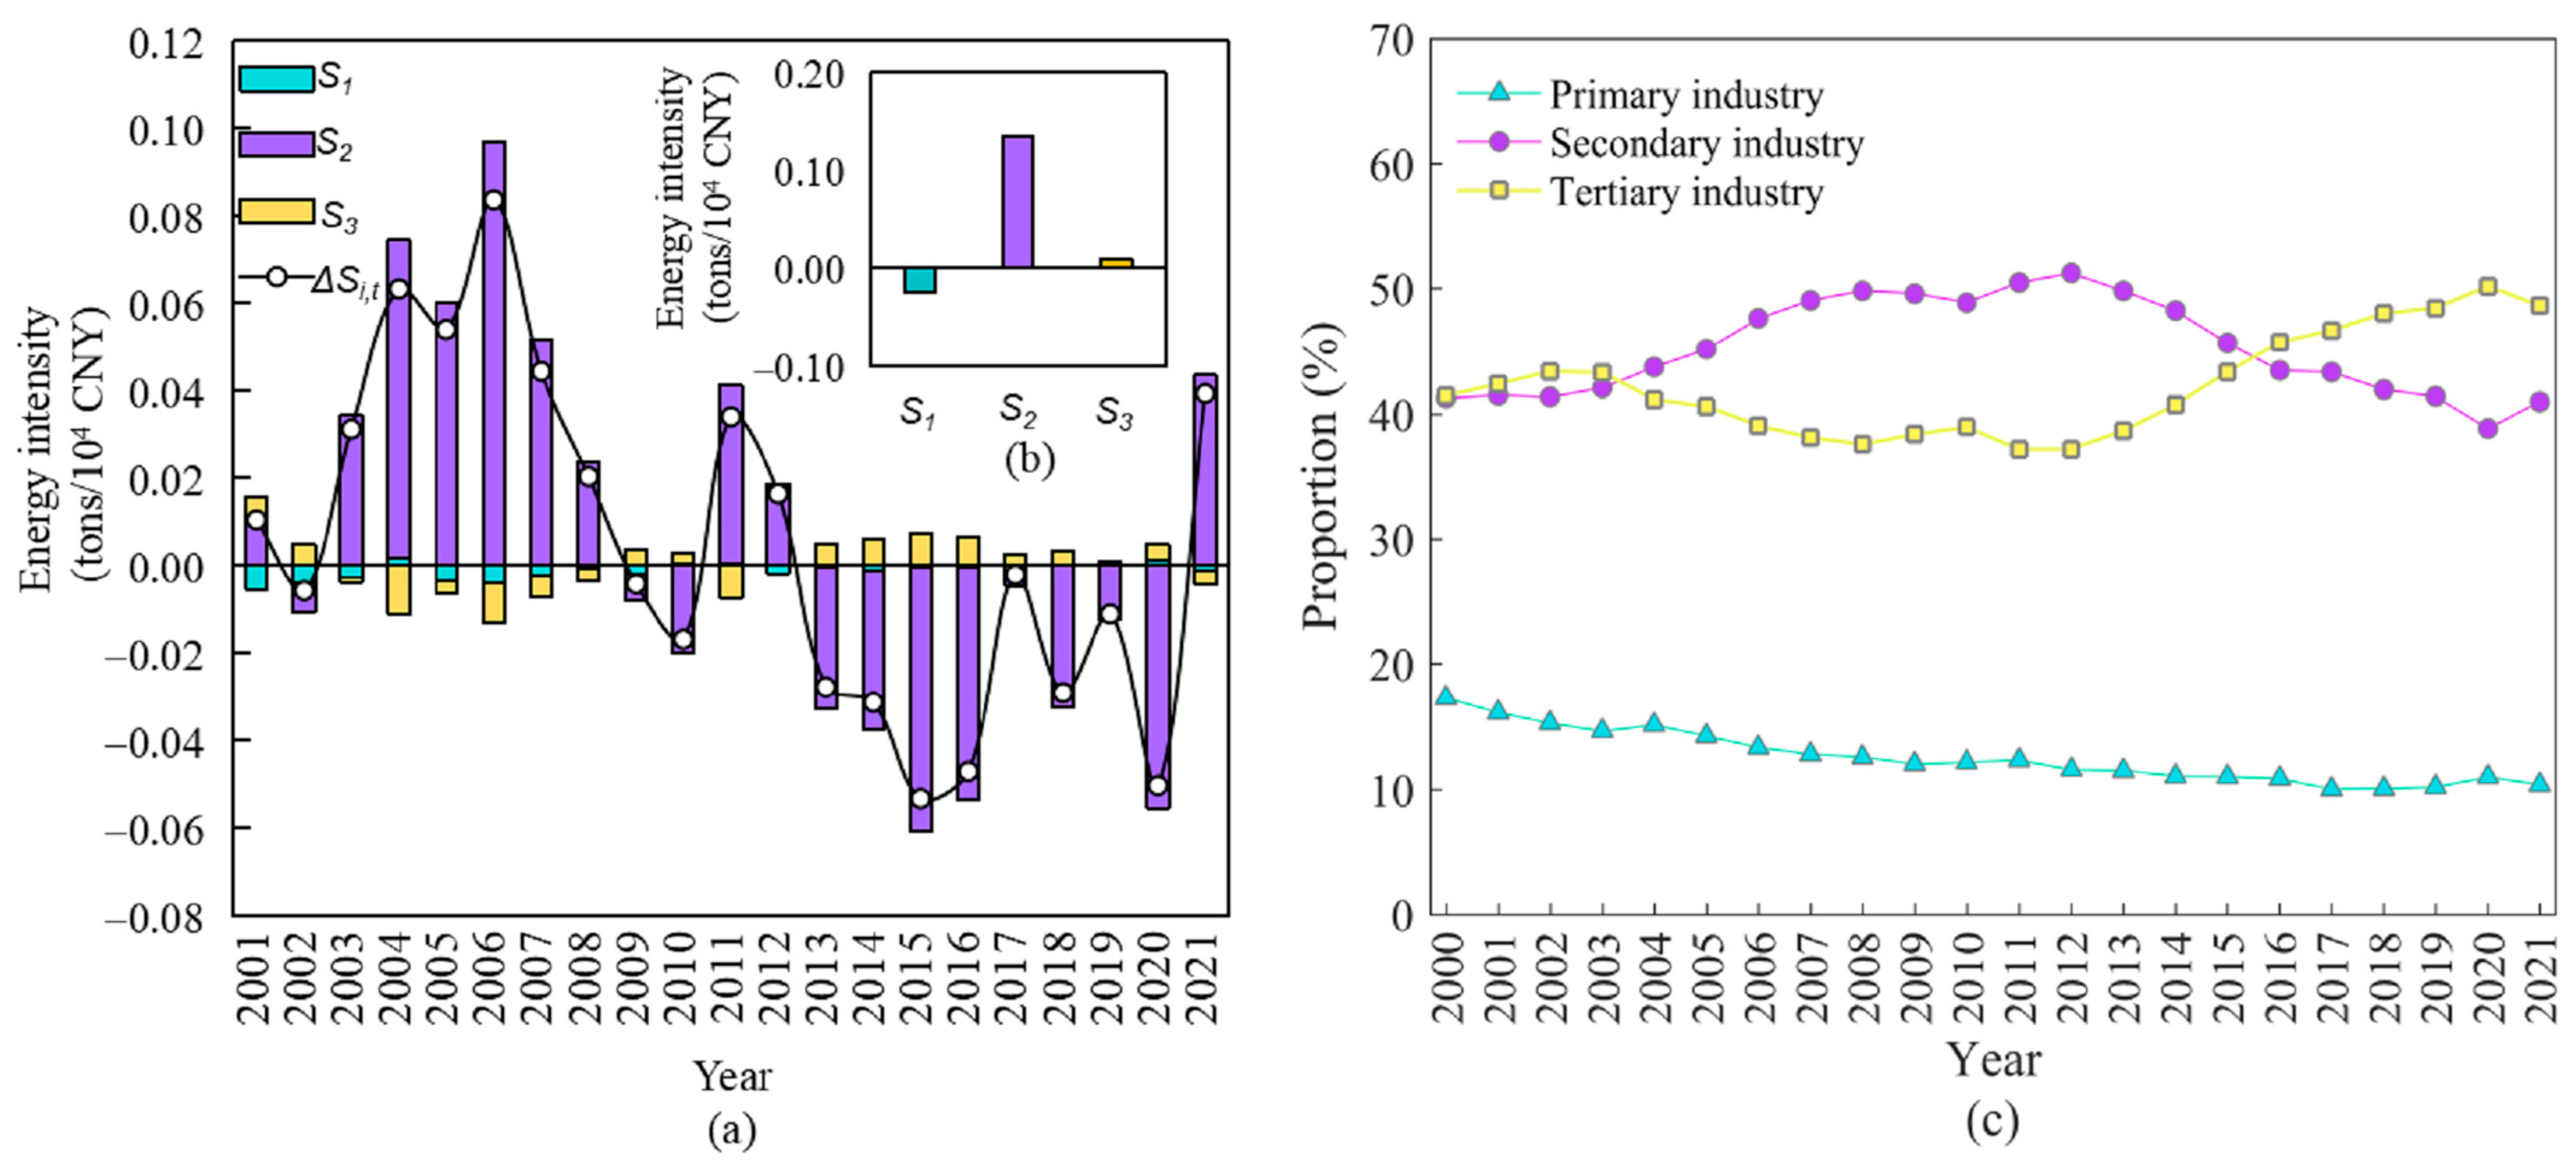
3.2.1. Industrial Structure Effect

As shown in Figure 5, the industrial structure effect increased energy intensity, with a cumulative increase of 0.1205 tons/104 CNY and a cumulative contribution of −8.17%.
The secondary industry structure effect (S2) had the largest increase in energy intensity, followed by the tertiary industry structure effect (S3) (Figure 5a). Their changes in energy intensity were 0.135 tons/104 CNY and 0.0097 tons/104 CNY, respectively (Figure 5b). The effect of primary industry structure (S1) decreased the energy intensity, and its cumulative change in energy intensity was −0.025 tons/104 CNY.
The proportion of the primary industry structure dropped by 6.33%, and the proportion of the tertiary industry structure fluctuated up by 8.75% from 2000 to 2021 (Figure 5c). The primary and tertiary industries themselves were lower in energy intensity, so the changes in the share of both have no greater effect on the total energy intensity. The secondary industry structure had a higher energy intensity and increased from 2000 to 2012, which led to an increase in the total energy intensity. But it decreased from 2012 to 2021, resulting in a decrease in total energy intensity. However, the former phase exceeds the latter phase, leading to an overall increase.
The five northwestern provinces of China are in the middle and late stages of industrialization and are dominated by heavy industry [18]. During the 10th Five-Year Plan (FYP) period, China began to implement the Western Development, investing in a large number of heavy chemical industries and establishing nationally important energy production and processing bases, such as coal production and coal chemical bases, coal power integration bases, and other industries. These facts led to an increase in the share of secondary industry between 2000 and 2012, which increased the energy intensity. During the 12th FYP period, the northwestern region developed a new industrialization path and issued the “Industrial Transformation and Upgrading Plan” to upgrade the traditional industries. In addition, the northwestern region also developed a modern industrial system using advanced, clean, and safe technologies with a high added value, which promoted the optimization of the regional industrial structure. Therefore, the share of secondary industry gradually decreased after 2012, which decreased the energy intensity. However, its percentage has remained between 41% and 52%. Therefore, as long as the share of the secondary sector structure does not continue to decline, the effect of the industry structure will not be significant.

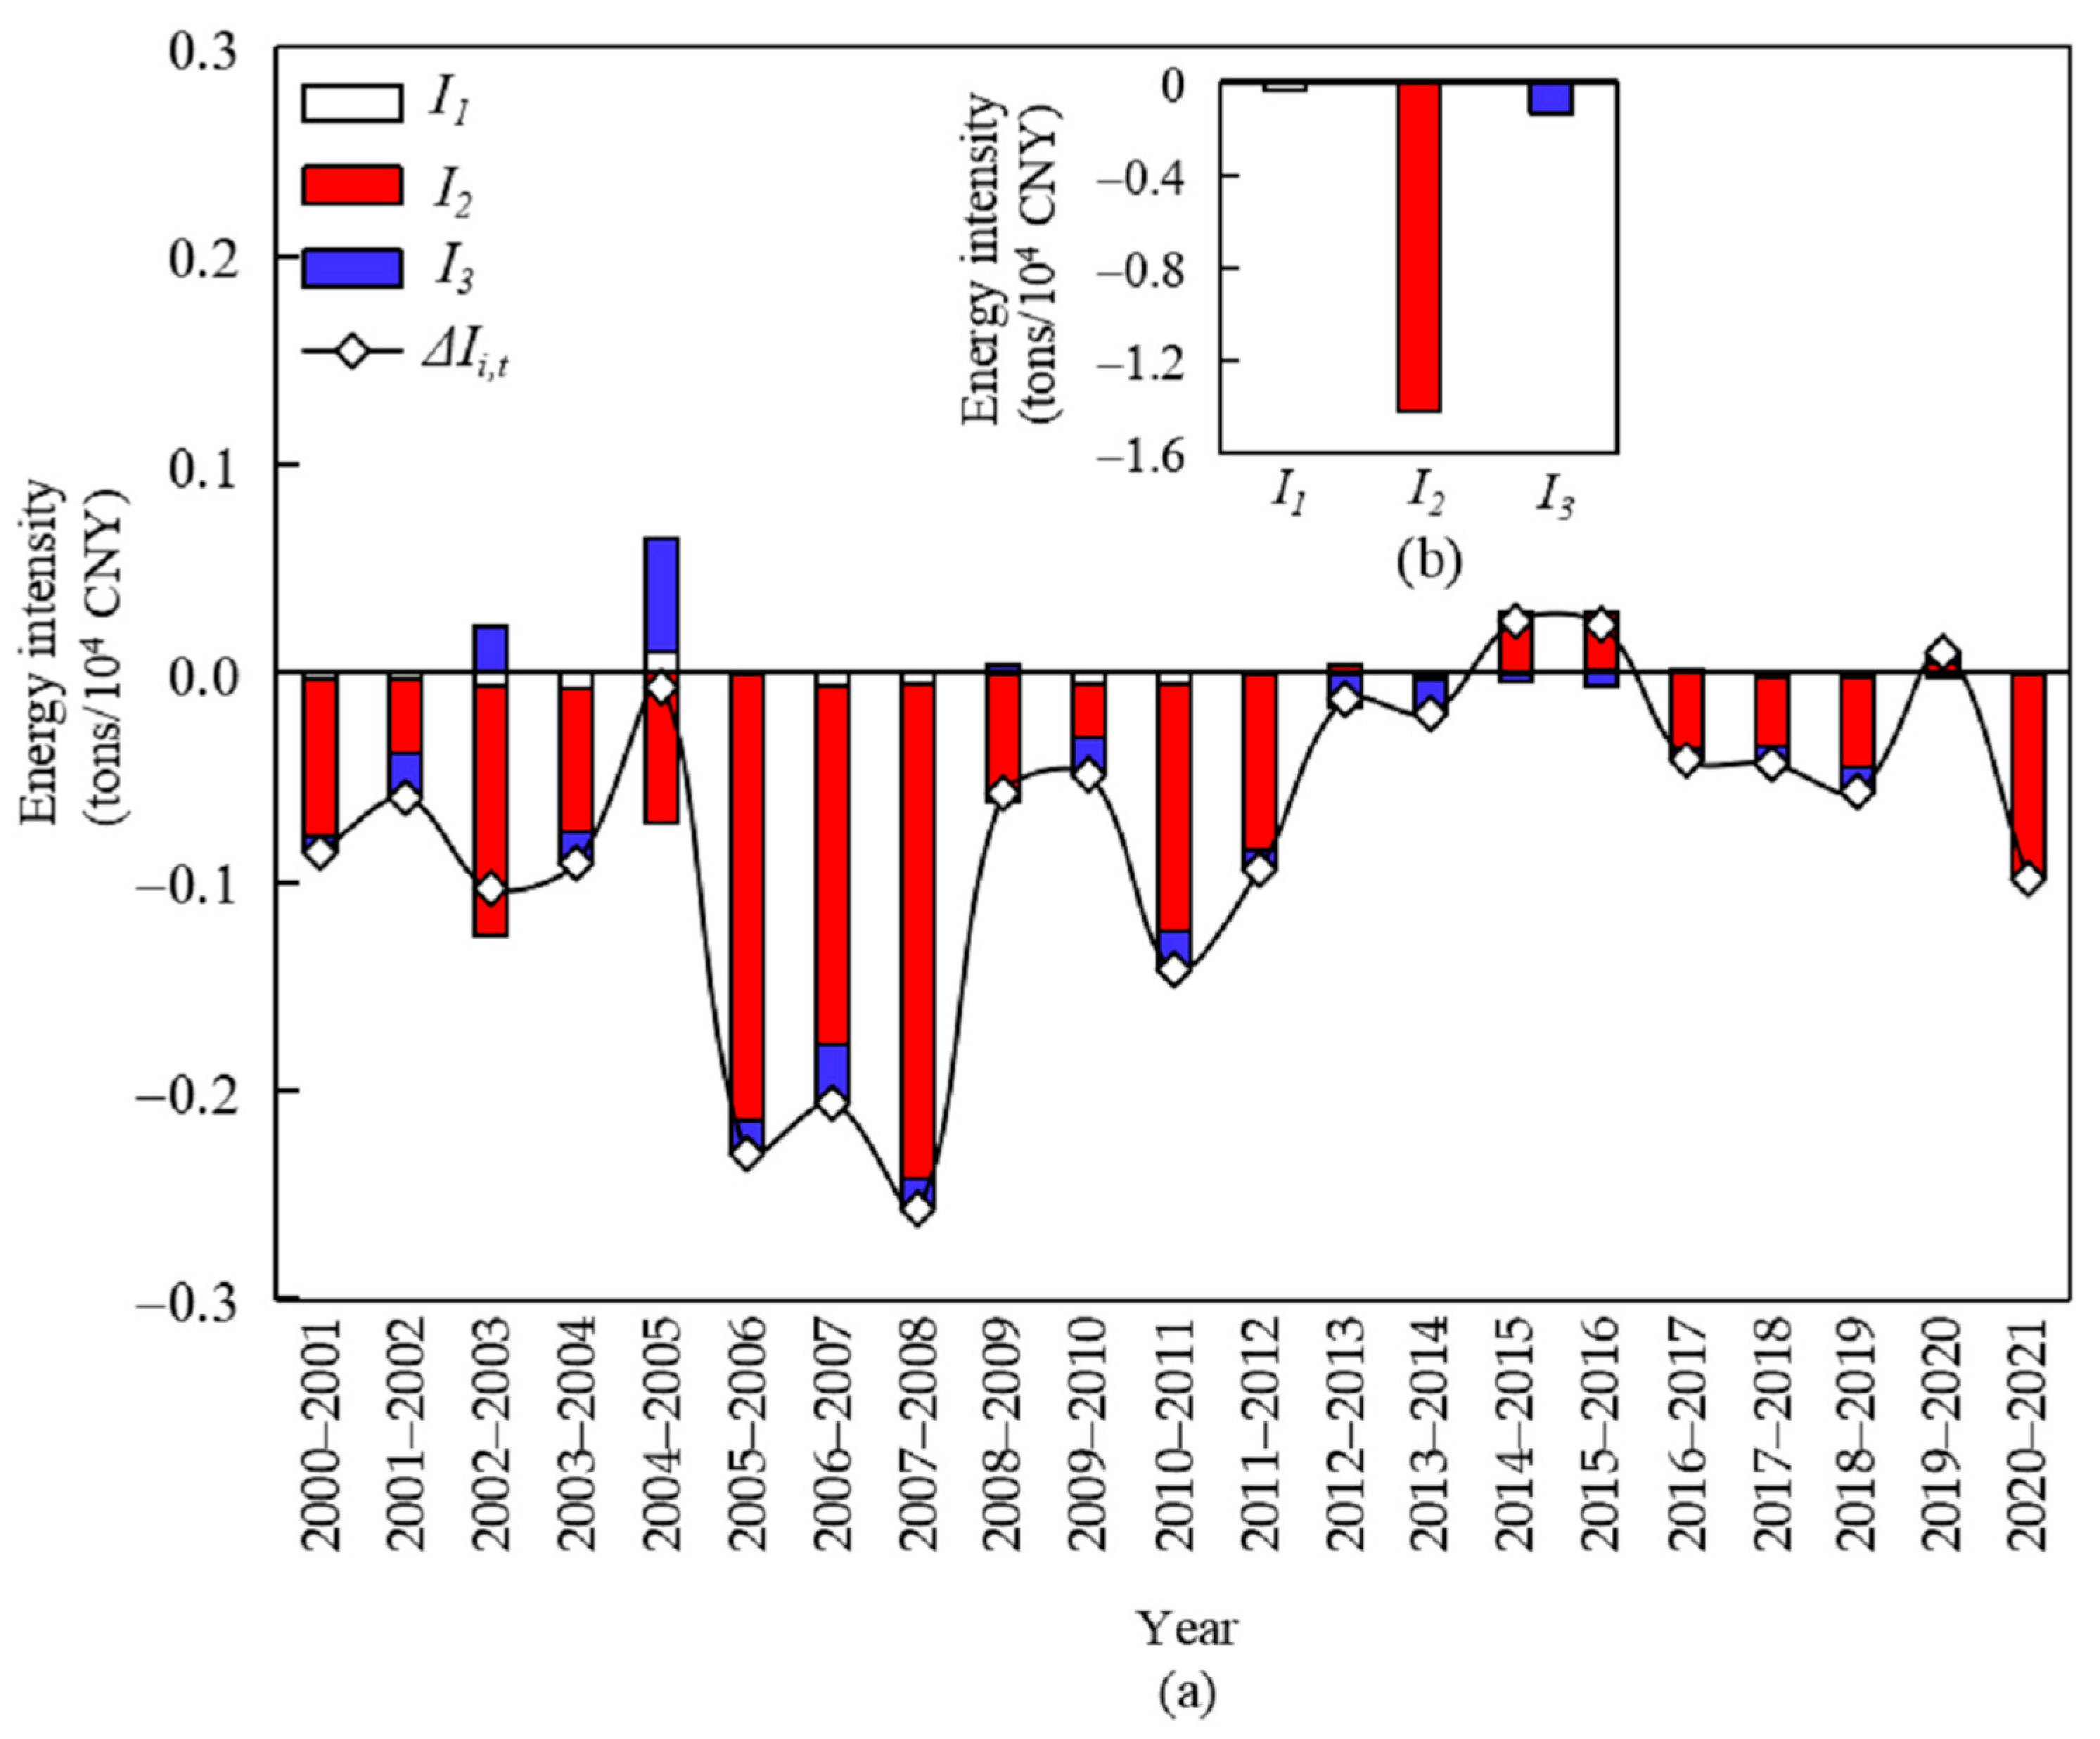
3.2.2. Industrial Energy Intensity Effect

As shown in Figure 6, the contribution of the industrial energy intensity effect to the decline in the total energy intensity is the greatest, with a cumulative contribution of −1.5941 tons/104 CNY and a cumulative contribution rate of 108.16%.
Figure 6a shows that the biggest contributor to the reduction in industrial energy intensity is the secondary industry energy intensity effect (I2), followed by the energy intensities of the tertiary (I3) and primary industries (I1). Their cumulative changes to energy intensity were −1.424 tons/104 CNY, −0.132 tons/104 CNY, and −0.038 tons/104 CNY, respectively (Figure 6b). Thus, I2 is the key factor for the reduction in industrial energy intensity.
The industrial energy intensity effect, especially I2, led to a decrease in total energy intensity because the quality of economic growth was improved in the northwest of China. The region used advanced technology to restructure and transform traditional industries during the 10th FYP, which improved the technological level and innovation capability of enterprises and promoted the enhancement of the overall industry level. During the 11th FYP period, the northwestern region encouraged the development of deep processing products with high technological content and high added value and improved the overall level of major equipment manufacturing and processing manufacturing. During the 12th FYP, the northwestern region improved its energy use efficiency and strengthened energy-saving efforts, such as promoting the construction of desulfurization and denitrification in key industries such as electricity, petrochemicals, and building materials. In addition, the northwest provinces promoted the reform of energy utilization methods and insisted on a significant reduction in energy use intensity and carbon dioxide intensity as binding targets. The above measures caused a sustained decrease in industrial energy intensity.

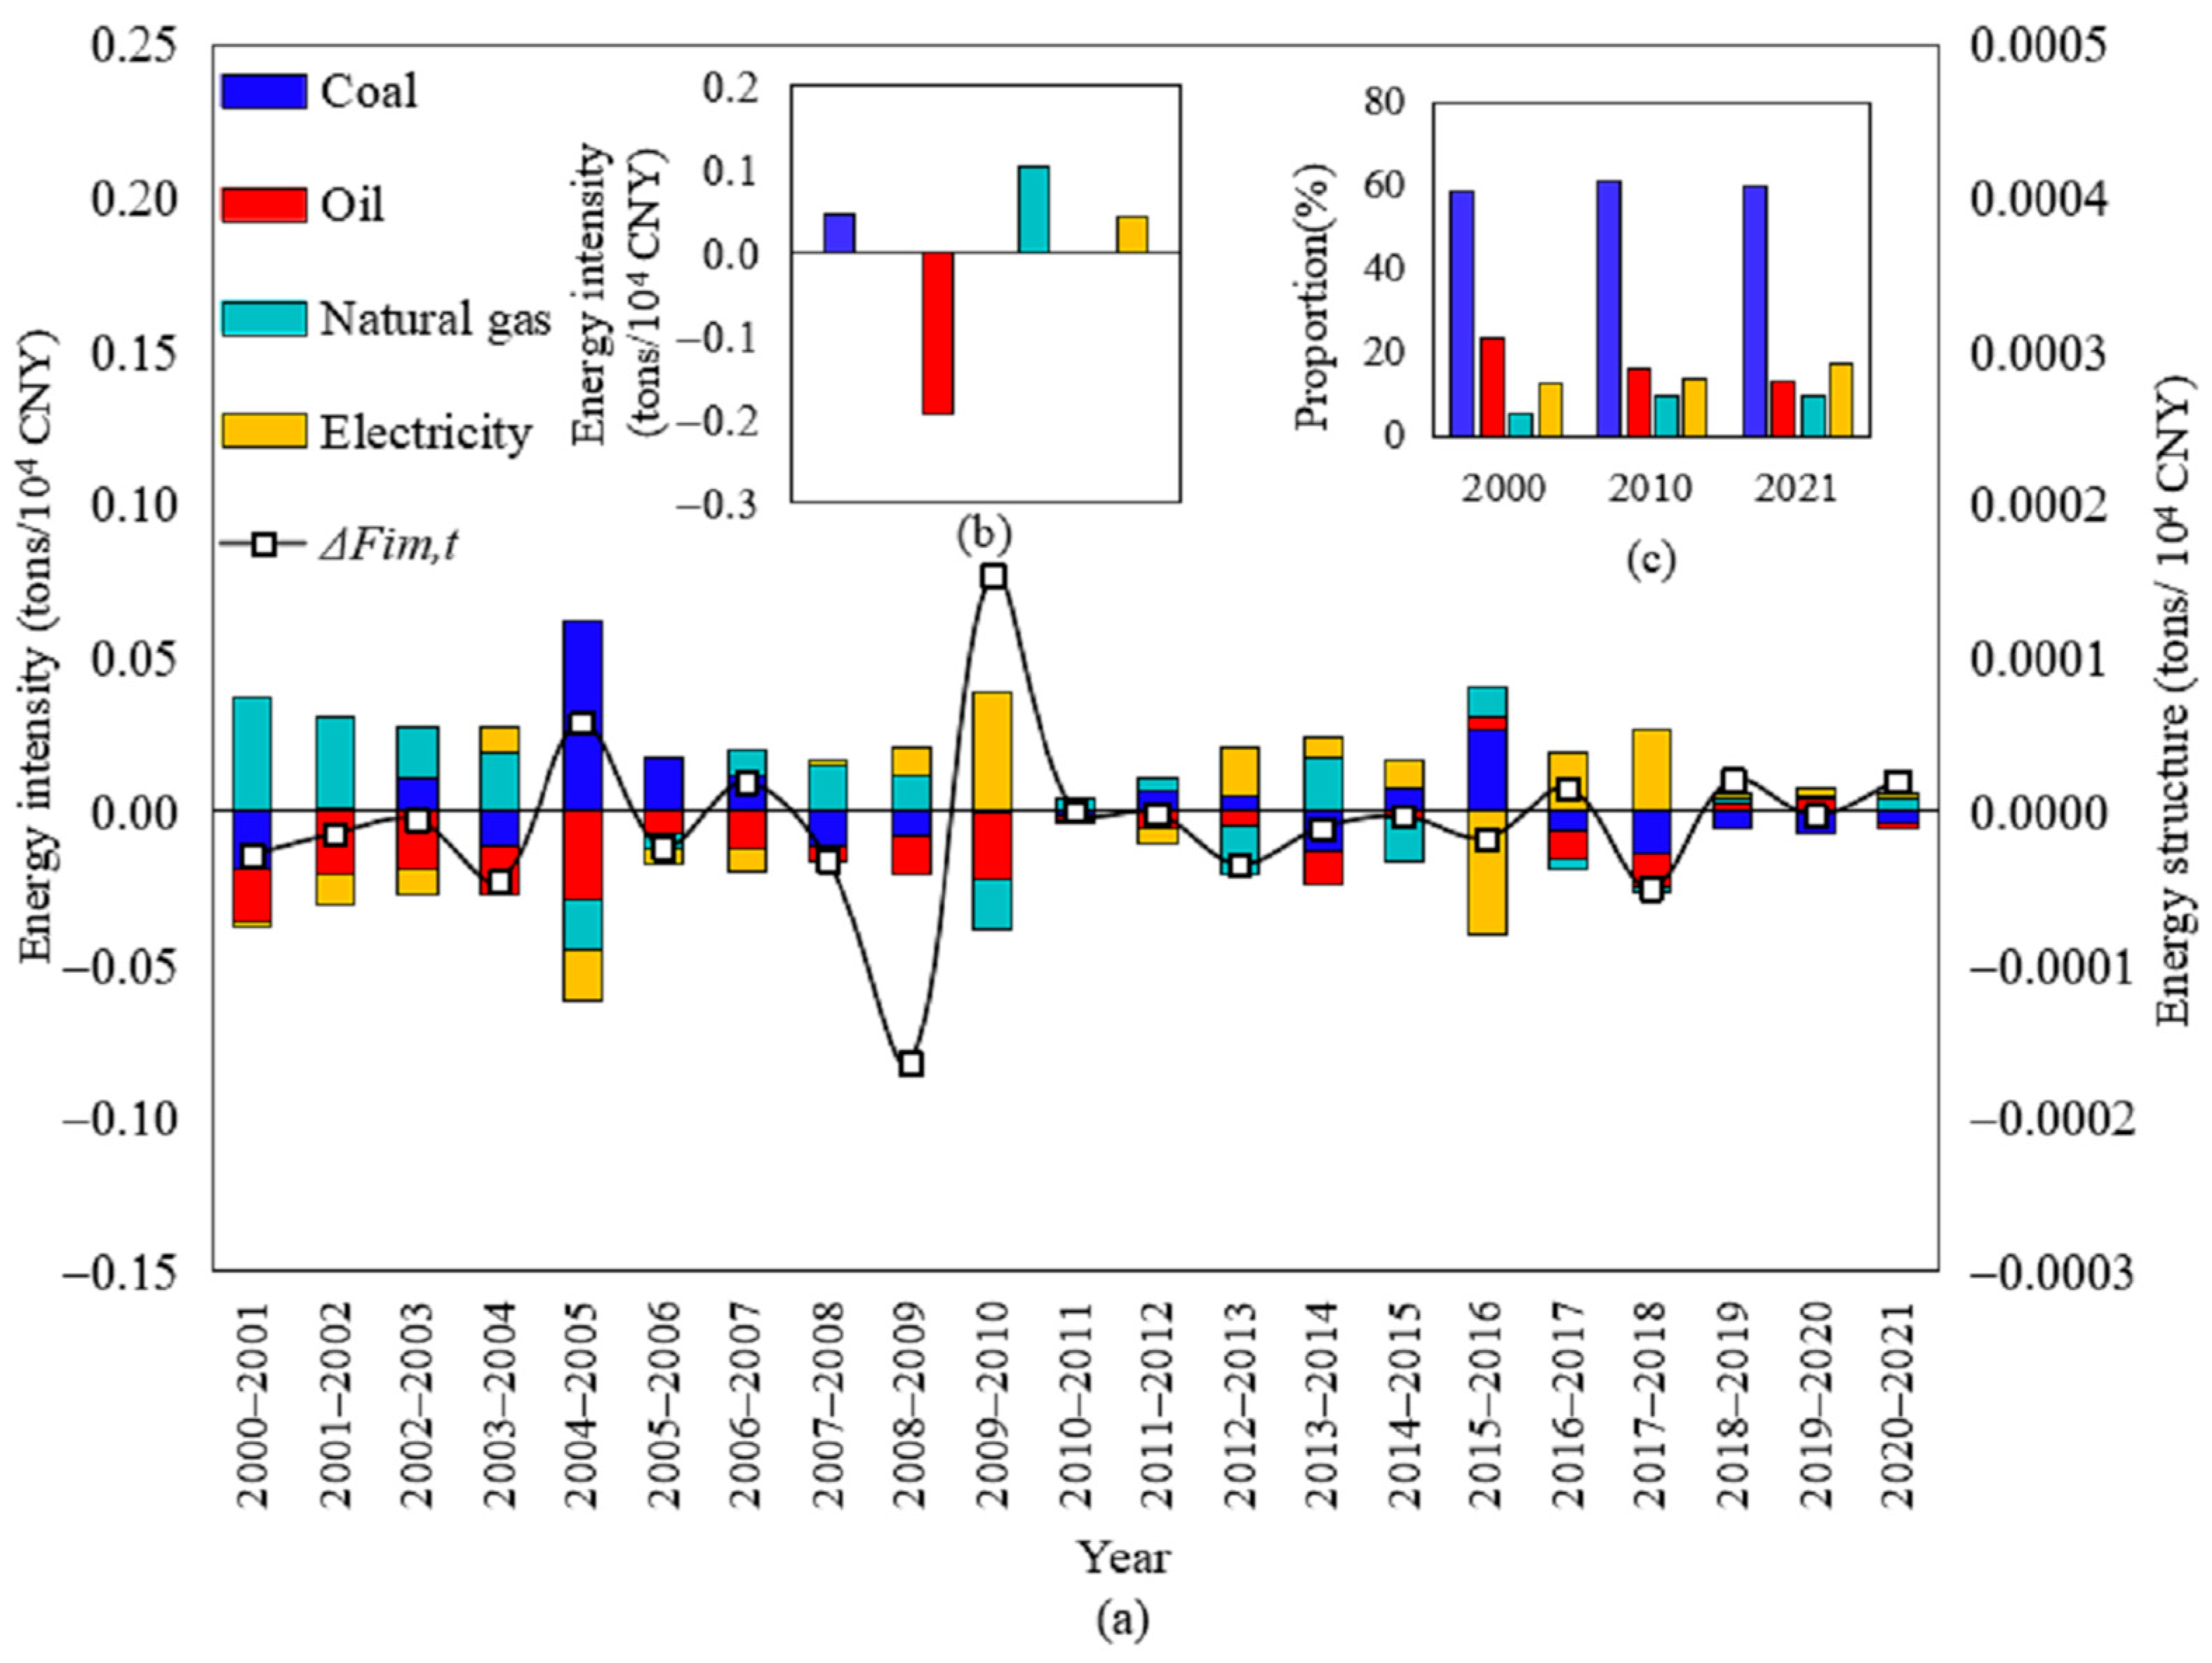
3.2.3. Energy Structure Effect

The decomposition results of the energy structure effect are shown in Figure 7. This effect had a minor impact on decreasing the energy intensity. Its cumulative contribution was −0.000163 tons/104 CNY, with a cumulative contribution of only 0.01%.
The energy structure effect decreased the energy intensity during most years (Figure 7a). The cumulative effects of the changes in coal, oil, natural gas, and electricity on energy intensity were 0.045509 tons/104 CNY, −0.194413 tons/104 CNY, 0.104416 tons/104 CNY, and 0.044326 tons/104 CNY, respectively (Figure 7b). Only the adjustment of the oil structure decreased energy intensity; the remainder led to increases. The restructuring of the energy structure occurred mainly among oil, natural gas, and electricity (Figure 7c). However, the shares of these three energy sources themselves were small, so the changes in the structure of these three energy sources did not have a big influence on the overall energy intensity. The proportion of coal, which had the highest energy share, was always between 58 and 63%. The distribution of fossil energy resources in China is characterized by a higher concentration in the north and west and a lower concentration in the south and east. Notably, 70% of the high-quality coal is produced in the northwest provinces. Furthermore, due to the relatively lagging technological development in the northwest, there remains considerable potential for the development of clean energy. As a result, the energy consumption structure in this region, which is dominated by coal, has not significantly declined within the study period. This is the primary reason for the minimal effect of the energy consumption structure. However, the northwest of China is also an abundant producer of wind and solar energy. Thus, it is an obvious direction for sustainable development in Western China that we could actively explore and effectively exploit these renewables to replace coal resources.

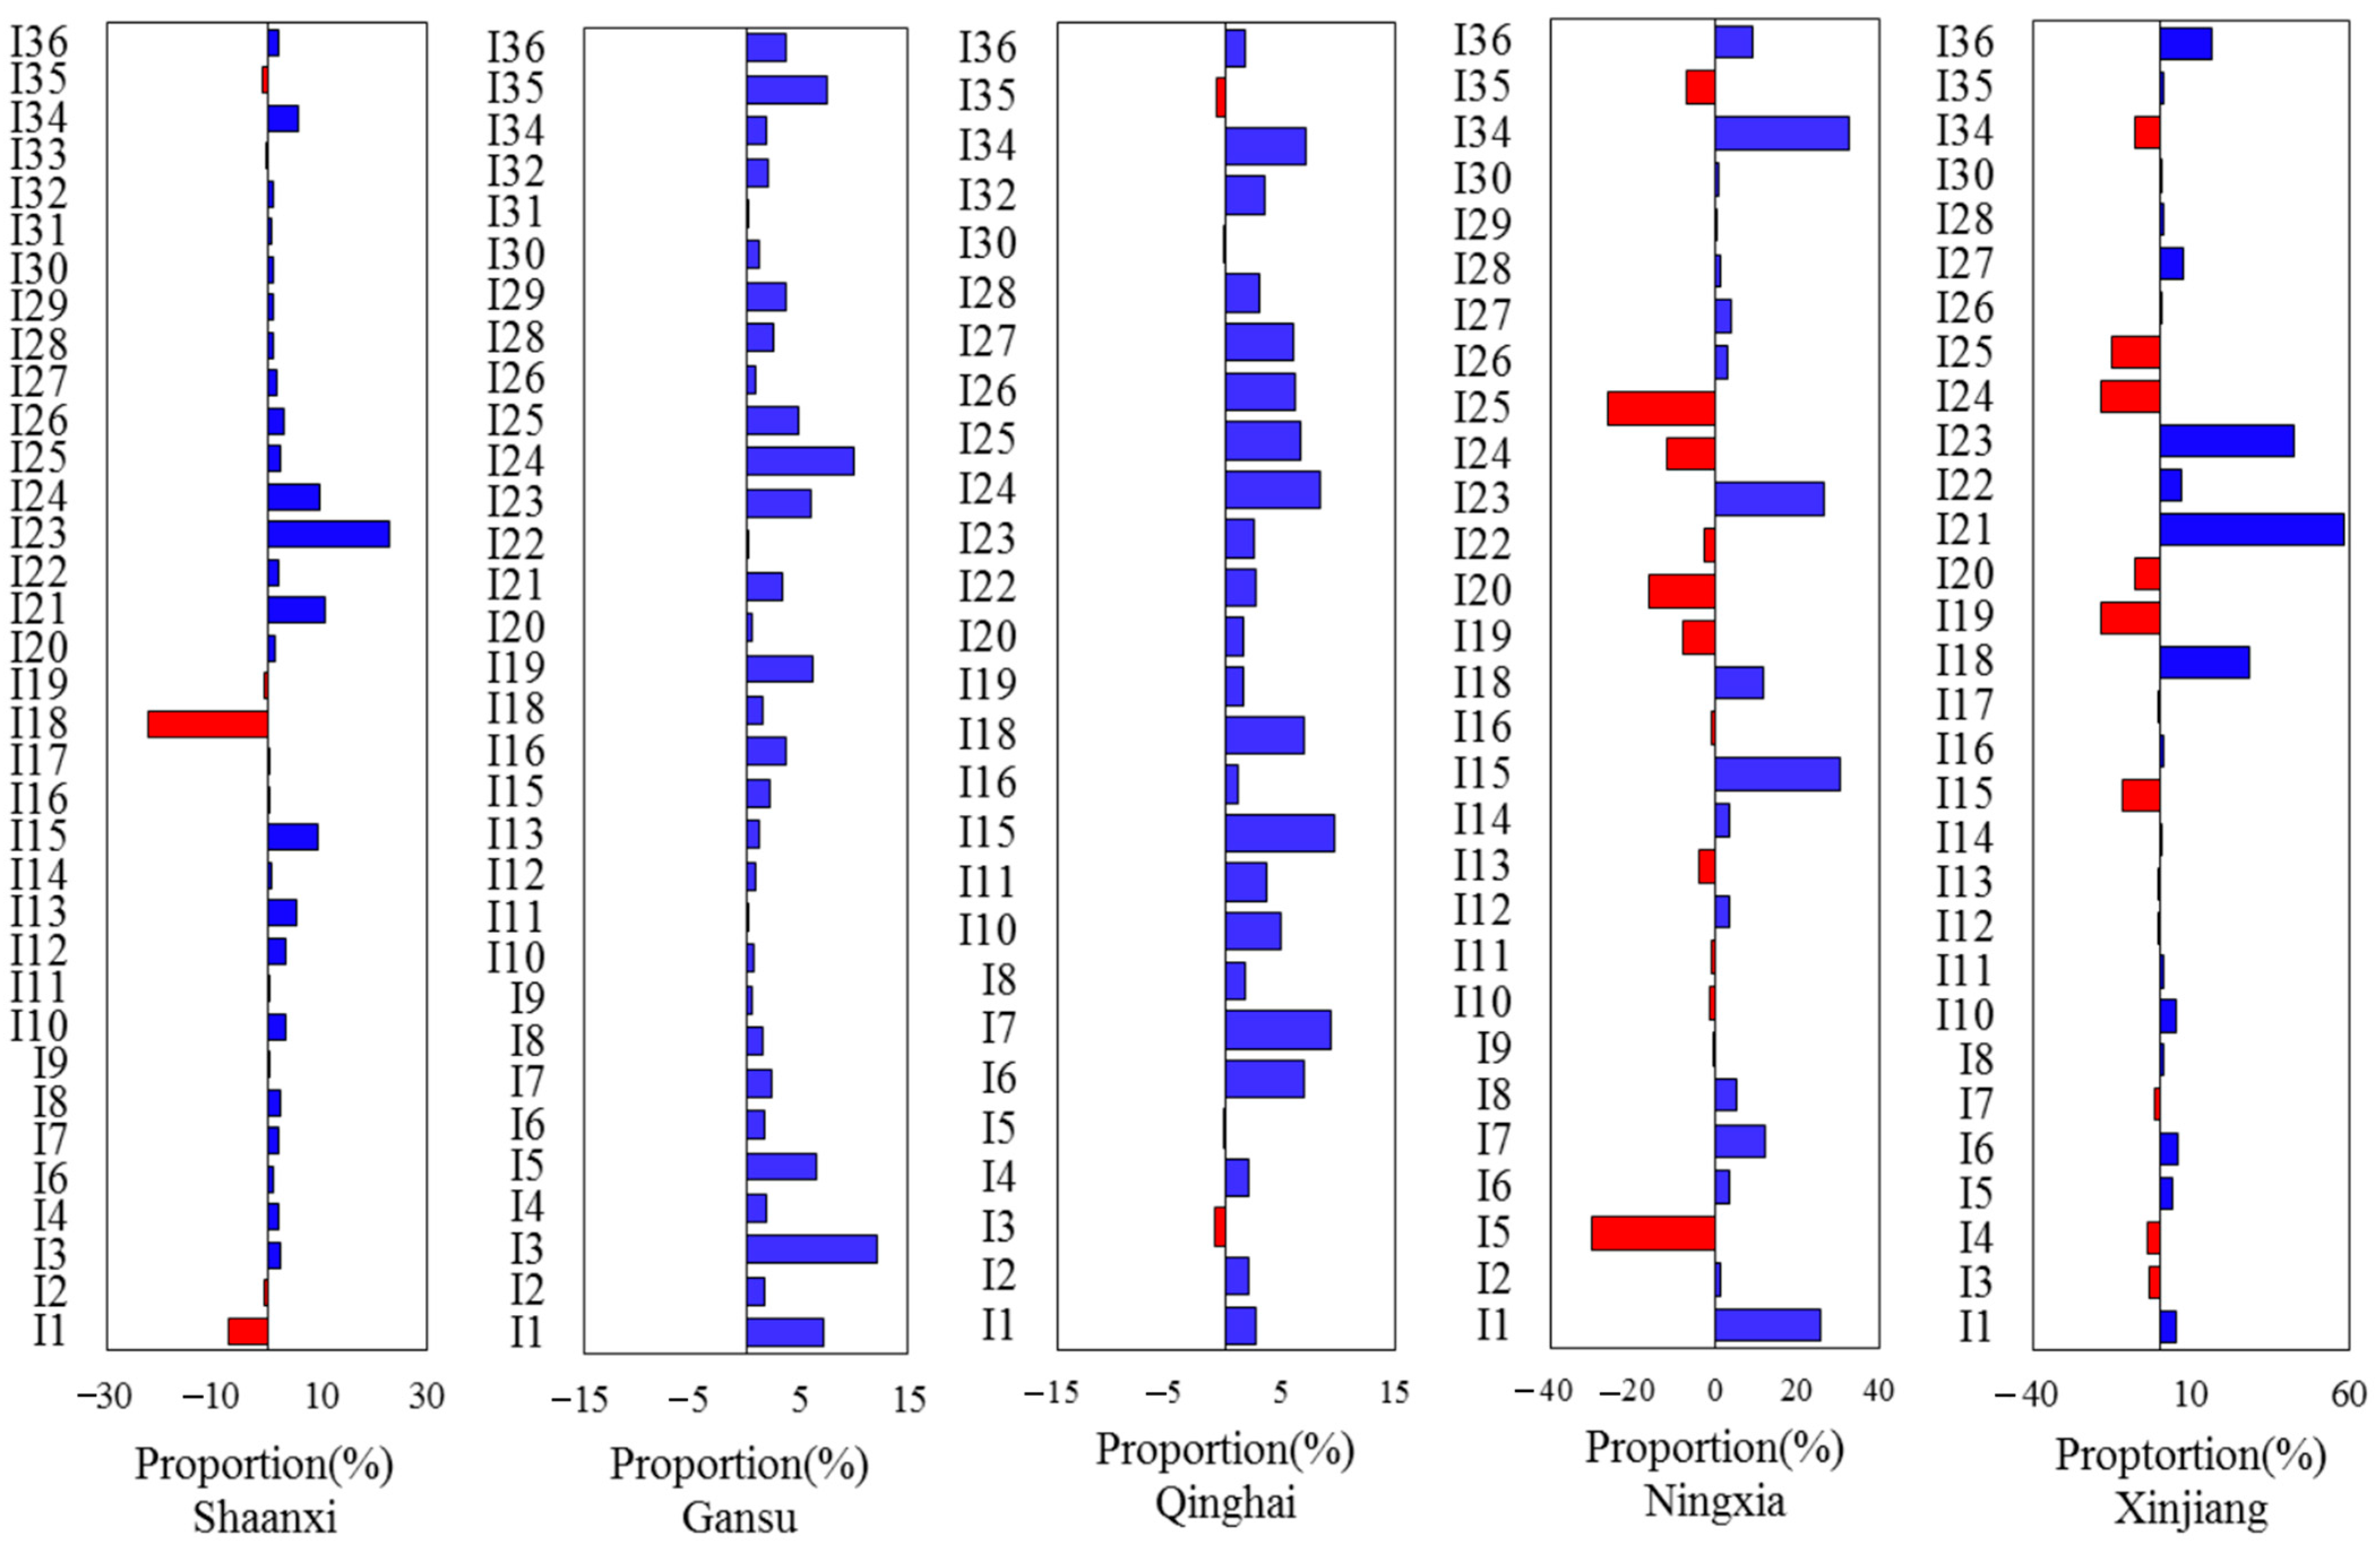
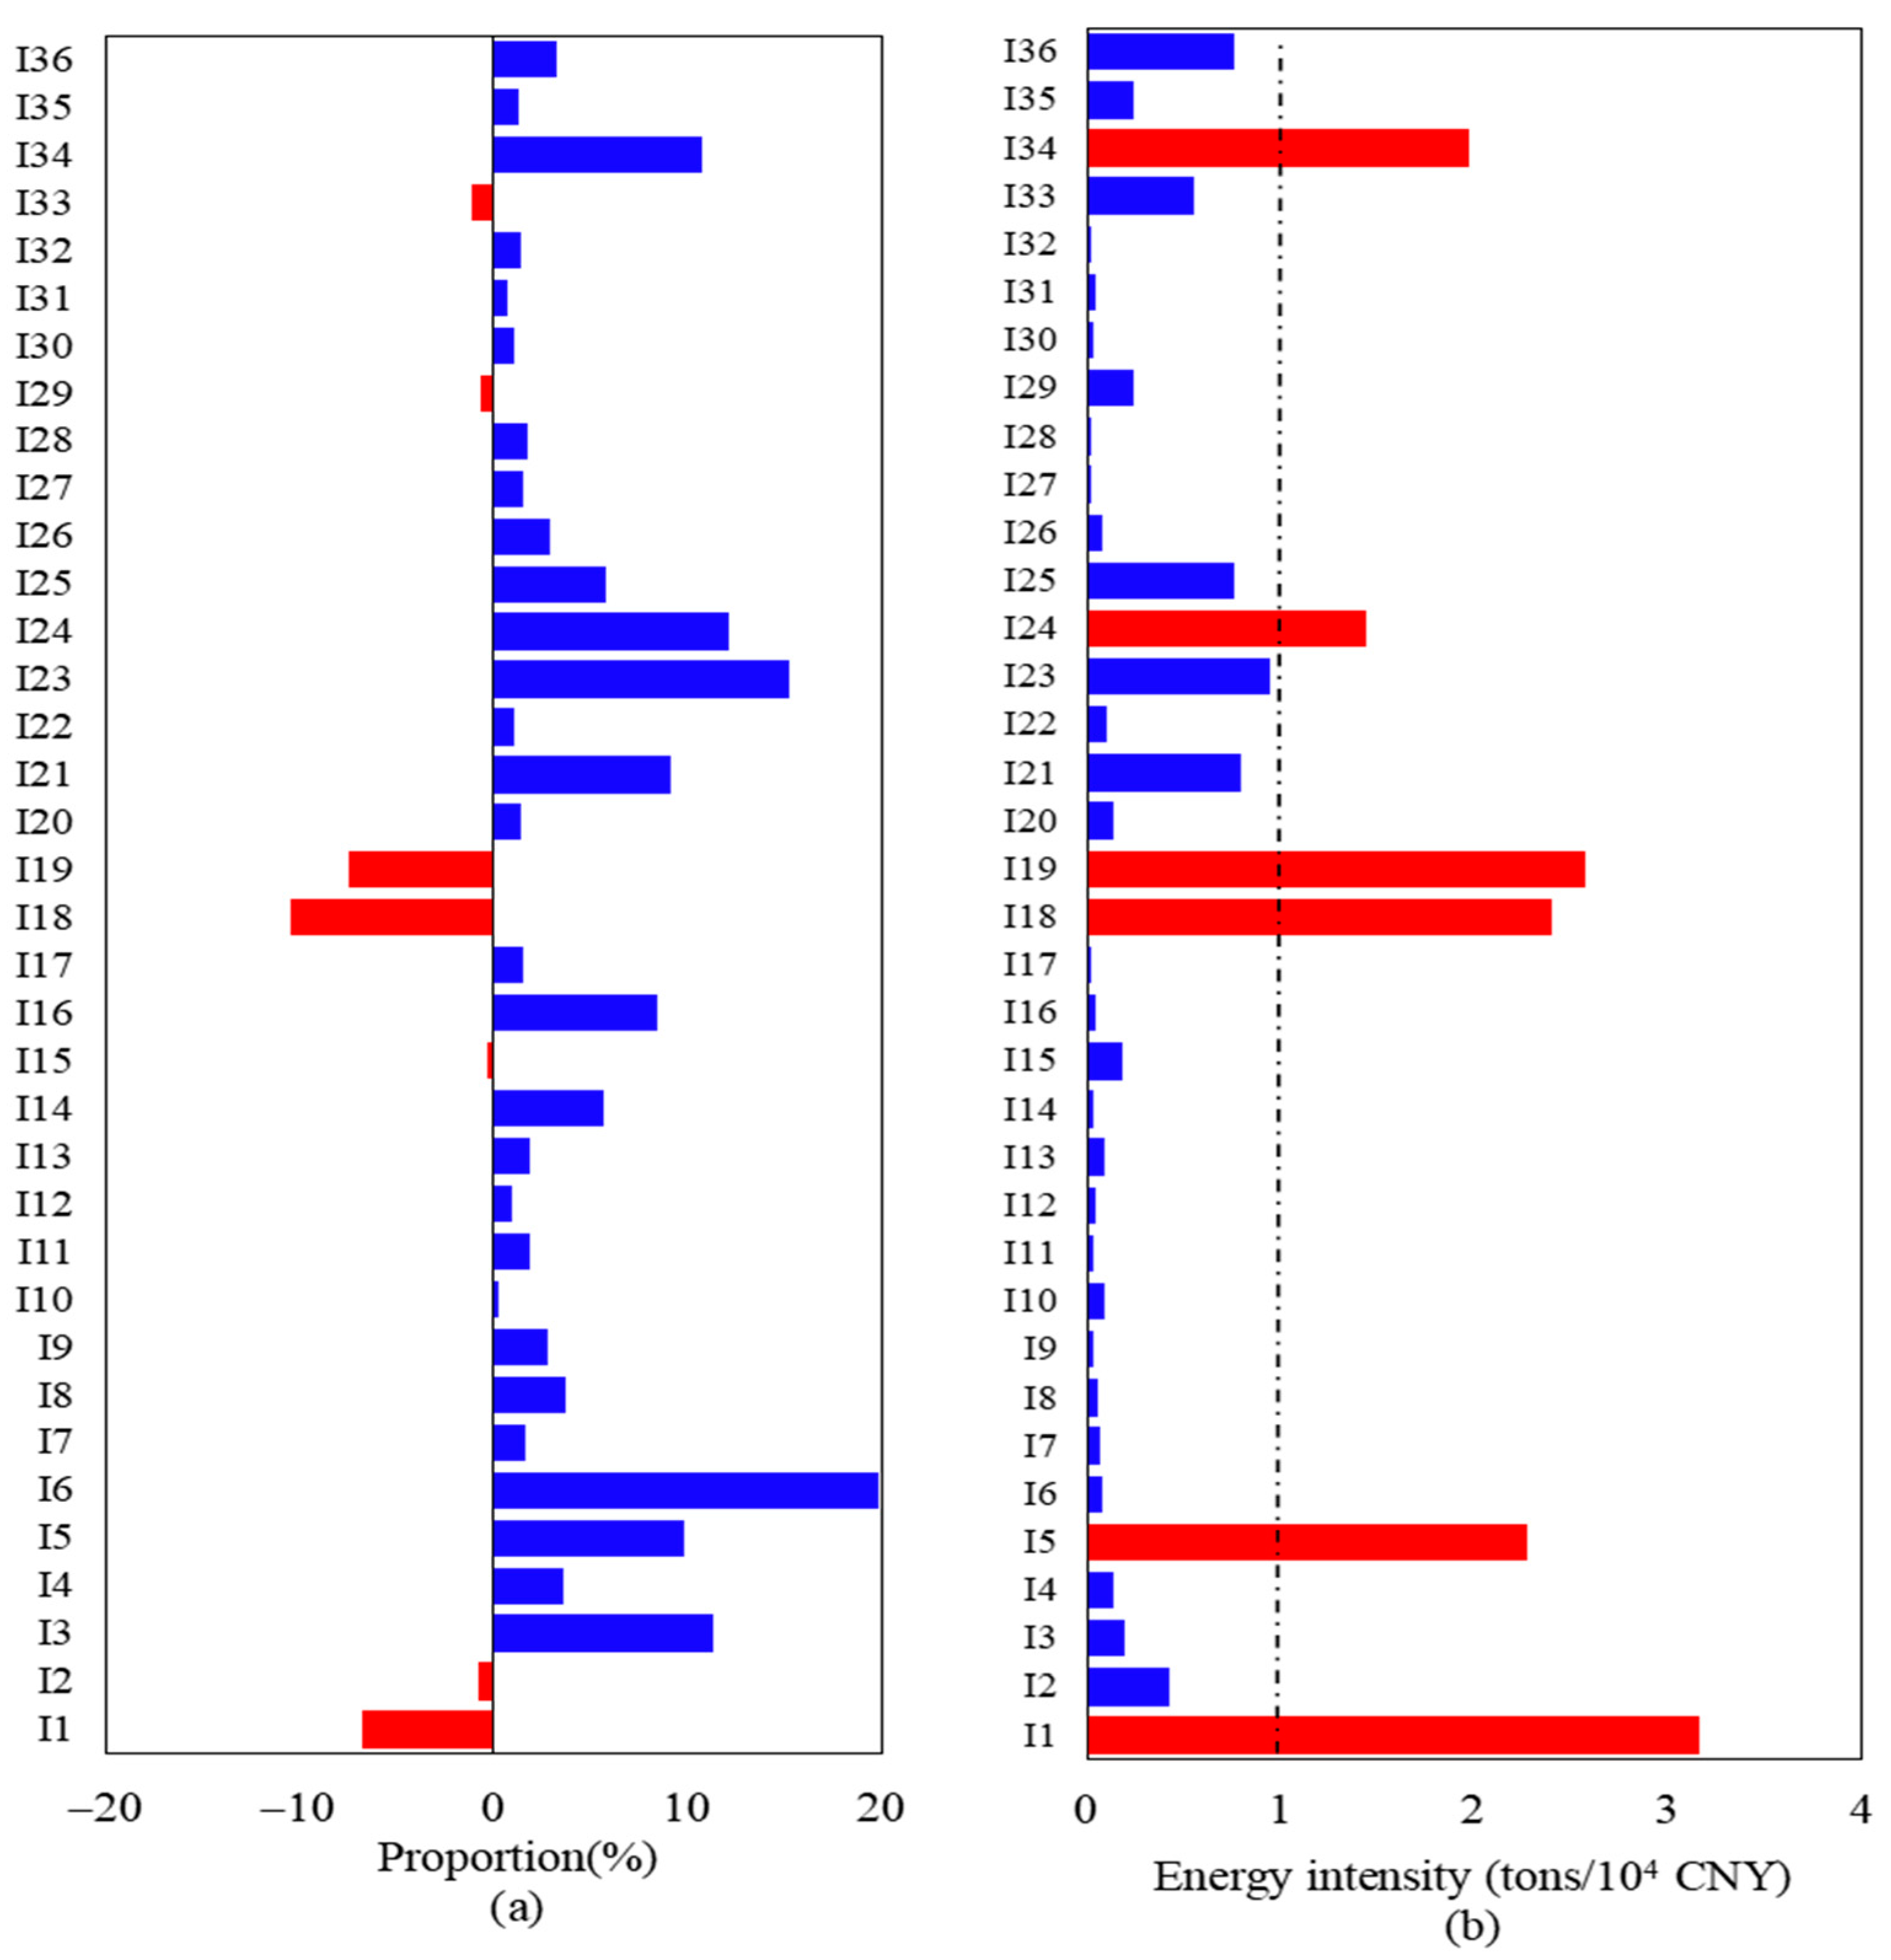
3.2.4. Contribution Rate of Energy Intensity by Industry Sub-Sectors

The decrease in energy intensity in the five northwestern provinces is due to the continued decline in energy intensity of the secondary sector (I2). Therefore, to further reveal the reasons for the decrease in energy intensity, we analyzed the energy intensity of industries above the scale in the five northwestern provinces (Figure 8). The sub-sectors are shown in Appendix A, Table A2.
In Shaanxi, most of the sub-sectors decreased energy intensity. Among them, these manufacturing sub-sectors—I10, I12, I13, I15, I21, I23, I24, I26, and I34—had a major effect on reducing energy intensity, with a cumulative contribution of more than 70%. During the 11th and 12th FYPs, Shaanxi seized the opportunity of the transfer of international manufacturing centers to China and promoted the transformation and upgrading of the equipment manufacturing industry through independent innovation, technology introduction, and capital grouping. This improved the energy use efficiency of the industry. However, the six sub-sectors I1, I2, I18, I19, I33, and I35 in Shaanxi Province increased the industrial energy intensity.
In Gansu, all sub-sectors decreased the energy intensity. Gansu made great efforts to develop the economy as well as improve the development quality. Gansu initiated the “General Plan of Circular Economy of Gansu Province” during the 11th FYP and promoted the development of key sectors such as coal production, the petrochemical industry, non-ferrous metallurgy, and equipment manufacturing in the direction of resource conservation and environmental friendliness. These measures reduced the energy intensity.
In Qinghai, except for four sub-sectors (I3, I5, I30, and I35), all others decreased energy intensity. Qinghai Province improved its low-carbon, recycling, ecological, and green development and expanded its advantageous industries (salt-lake chemicals, non-ferrous metals, steel industry, etc.) in the 11th and 12th FYPs. At the same time, Qinghai actively developed wind energy and photovoltaic power generation instead of fossil energy to reduce energy intensity.
There are 12 sub-sectors in both Ningxia and Xinjiang that increased energy intensity, and their cumulative contributions to industrial energy intensity were −94.10% and −88.74%, respectively. This indicates that some industries in Ningxia and Xinjiang are continuing the old path of traditional industrialization. On the one hand, in the process of western development, Ningxia and Xinjiang have undertaken a large number of high-energy-consuming industries in the east; coupled with Ningxia and Xinjiang’s resource endowment, coal-based industries represented by coal mining, coal power, and coal gas have become hot spots for local investment. The energy use per unit GDP of these industries is greater than that of general manufacturing and other industries. On the other hand, due to the excessive scale of coal mining in Ningxia and Xinjiang, the local coal market price has been drastically reduced, and the excessively low price will form a crowding-out effect on the relatively high-priced clean energy, which makes it difficult to form an endogenous motivation for energy conservation within the enterprises and is not favorable to the use of sustainable energy.
The cumulative contribution of most sub-sectors decreased industrial energy intensity (Figure 9a). The cumulative contribution of these sub-sectors (I3, I5, I6, I16, I21, I23, I24, and I34) in decreasing industrial energy intensity was more than 80%, and they are the primary sectors for the decline in industrial energy intensity in Northwestern China from 2000–2021. During this period, the northwestern region implemented a series of policy measures to drive down energy intensity, including the introduction of mandatory systems such as “energy efficiency labeling” and “energy audits”. Additionally, local governments allocated fiscal funds to support enterprises in implementing energy-saving technological upgrades. For example, Shaanxi Province invested 7.28 billion CNY during the “11th FYP” period to fund over 200 industrial energy conservation projects, achieving energy savings equivalent to 2.8 million metric tons of standard coal. These policies compelled enterprises to conduct regular inspections and evaluations of their energy usage, effectively pushing industries to minimize energy consumption throughout production processes. However, seven sub-sectors (I1, I2, I15, I18, I19, I29, and I33) were the main sectors increasing the industrial energy intensity in the region, with a cumulative contribution of −23.4%. Reasons include the following: Sectors I1, I2, and I18—pillar industries in Shaanxi, Gansu, and Ningxia—are traditional energy-dependent industries. Increased market demand directly triggers their expansion, driving up total energy consumption while achieving only limited improvements in energy efficiency per unit of output value. For instance, the northwestern provinces have already planned coal-related projects exceeding 1 trillion CNY, such as coal-to-chemicals and coal-to-liquid-fuels initiatives. In addition, certain sectors, such as I19 and I29, continue to rely on outdated production processes in their newly added capacity, resulting in stagnant or even regressive energy efficiency per unit of output. Therefore, adequate attention should be given to these seven sub-sectors when promoting energy intensity reduction in the future.
Sub-sectors whose energy intensity exceeded 1 ton/104 CNY (Figure 9b) were I1, I5, I18, I19, I24, and I34. Thus, these sub-sectors are the ones with the biggest potential to decrease the energy intensity. In addition, sub-sectors I1, I18, and I19 not only increased the energy intensity, but also had higher energy intensities (greater than 1.0 ton/104 CNY). This suggests that these sub-sectors are the main sectors for sustainable energy utilization.

3.3. Energy Intensity Convergence

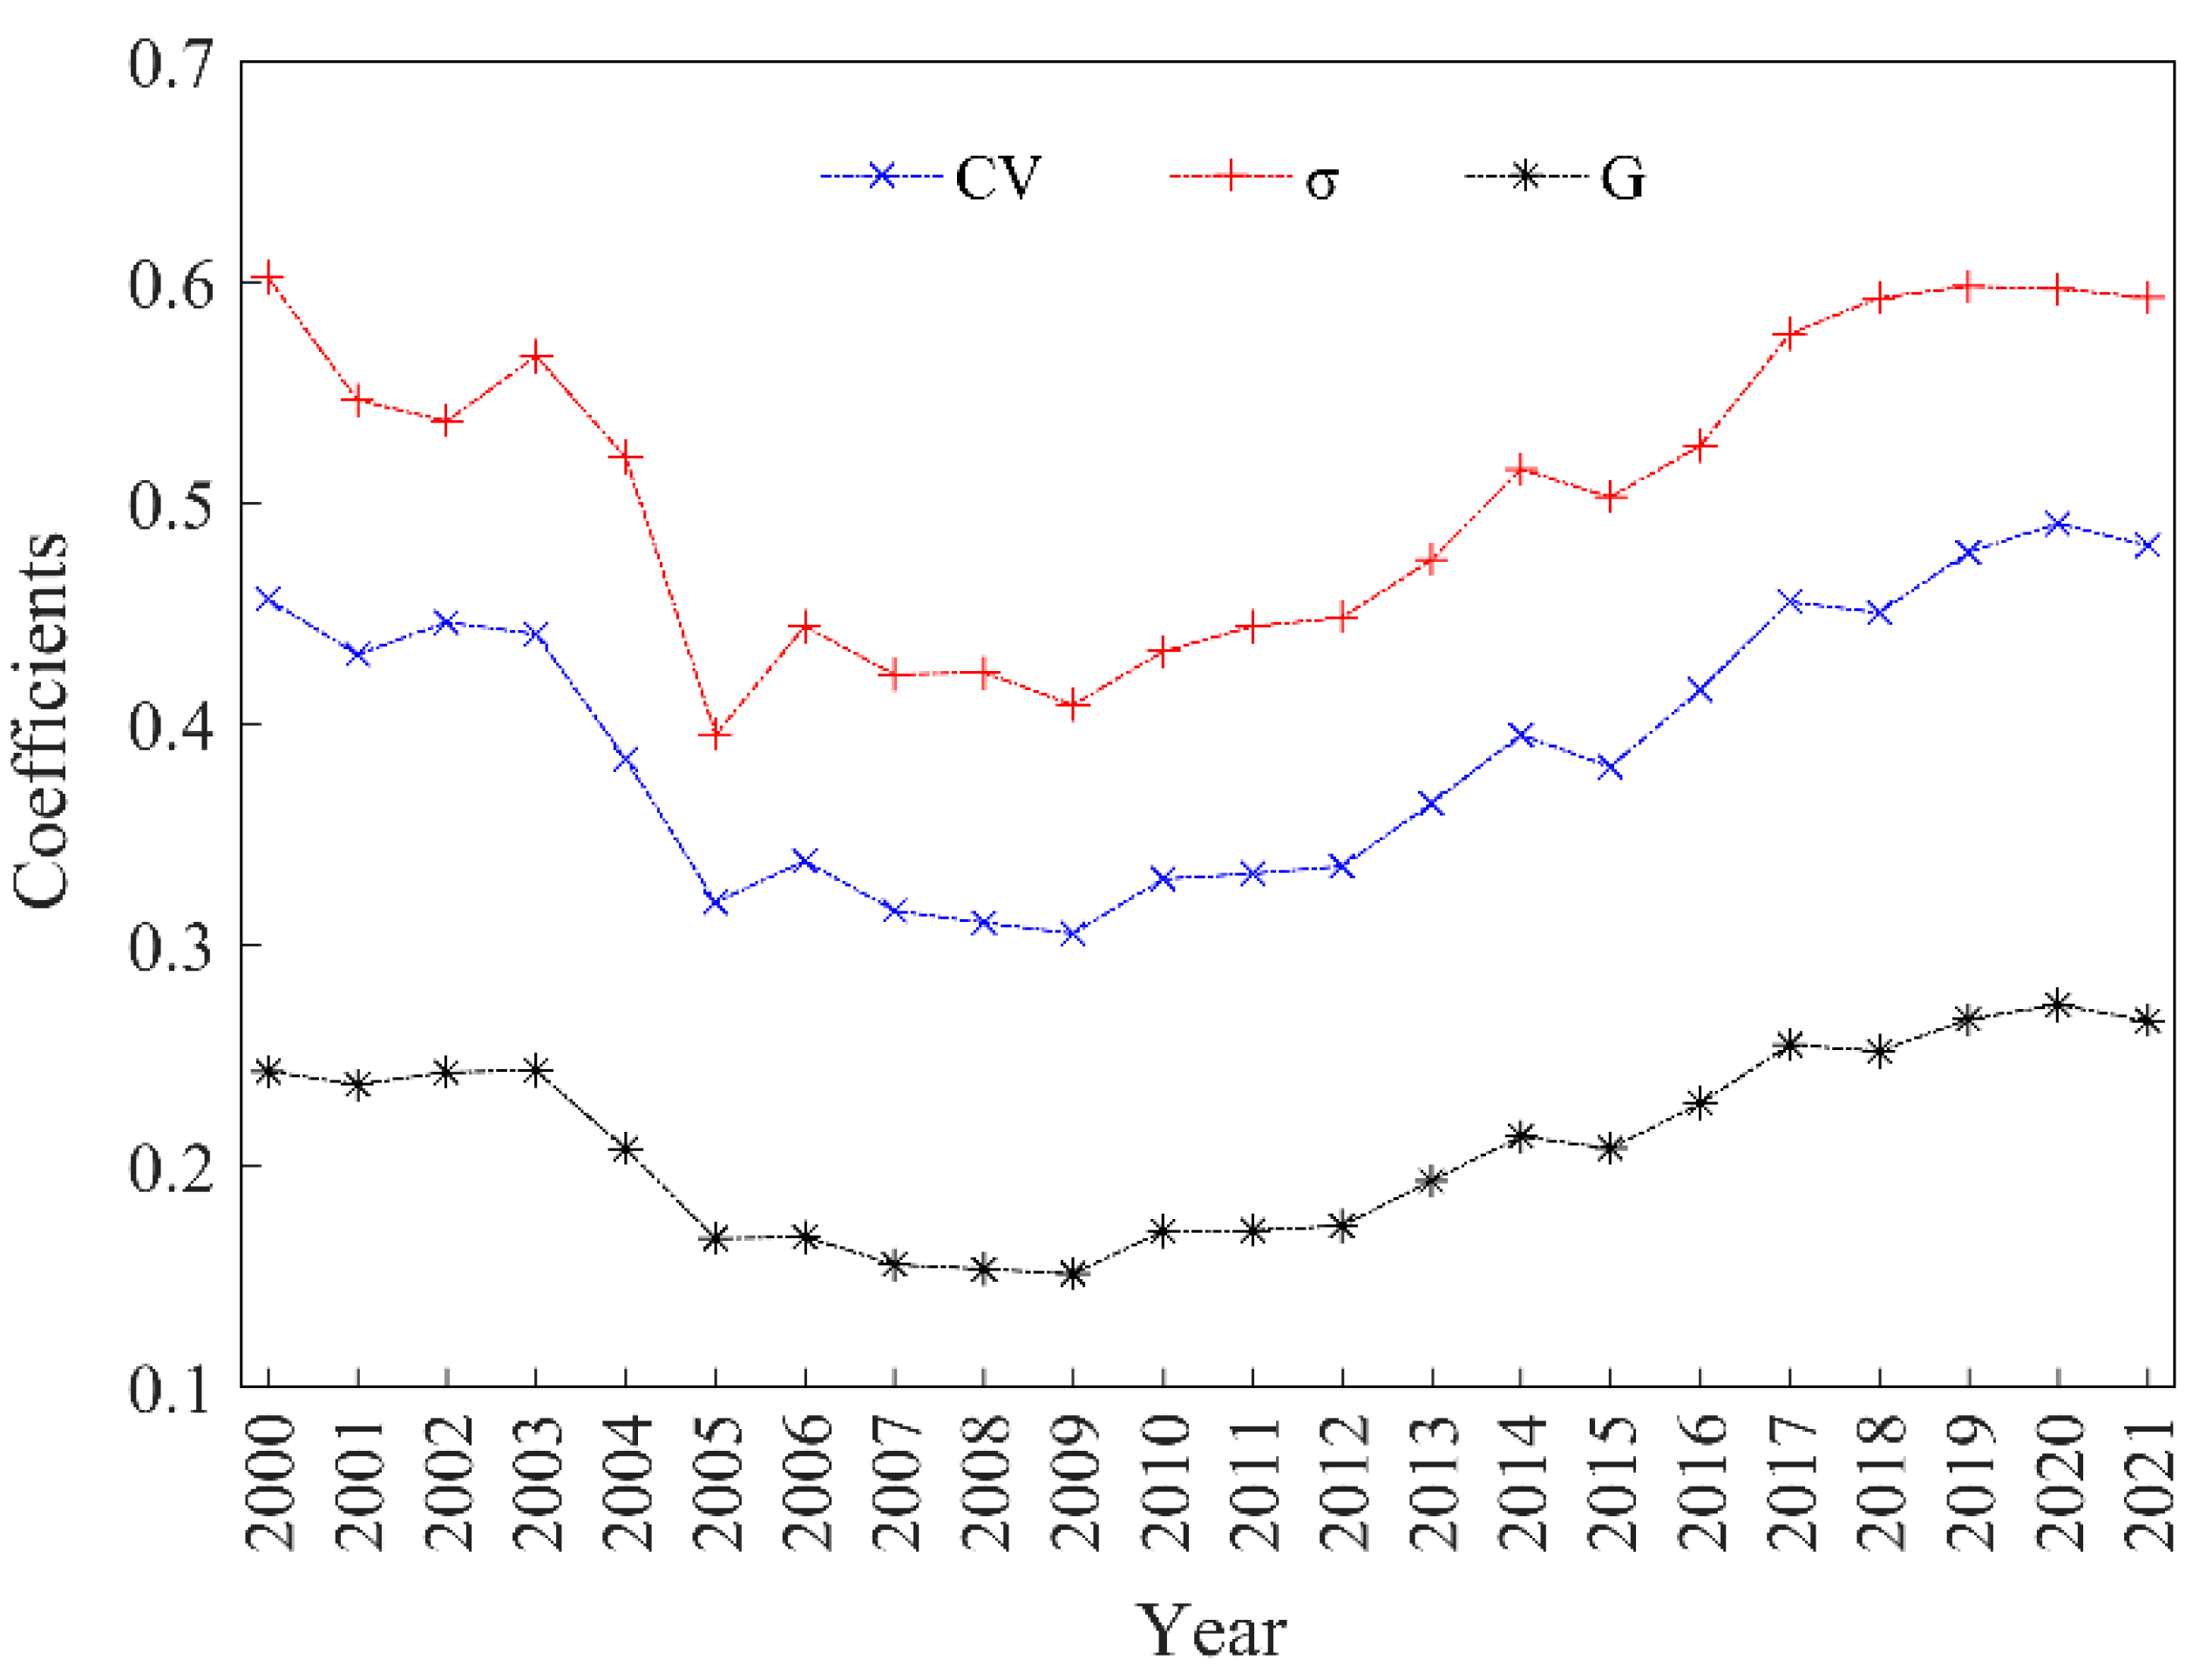
3.3.1. σ Convergence

In Figure 10, the coefficient of variation (CV), σ coefficient (σ), and Gini coefficient (G) were not significantly lower in 2021 compared with 2000.
This indicates no significant energy intensity σ convergence among the five northwestern provinces. However, the energy intensity σ convergence had two distinct phases of convergence and divergence. During 2000–2009, the coefficient of variation, σ coefficient, and Gini coefficient showed a decreasing trend, whereas during 2010–2021, they all increased. This suggests that the energy intensity gap first converged and then diverged.

3.3.2. Absolute β Convergence of Energy Intensity

The estimation of convergence coefficients is affected by cross-sectional and time-series factors, so we selected the optimal model based on the likelihood ratio (LR). Following Equations (9) and (10), the regressions of model coefficients and correlation tests were conducted using MATLAB (2016) and Eviews (2016) software. The outcomes are listed in Table 4. In the absolute β convergence of energy intensity, LR tests were first adjusted for time and spatial fixed effects. Based on the test results, we chose a model with spatial fixed effects. The coefficient β was −0.01286 under the spatial fixed effect, which did not pass the 10% significance test. This indicates that a steady-state level of energy intensity was not achieved among the five northwestern provinces.

3.3.3. Conditional β Convergence of Energy Intensity

The regression results of conditional β convergence of energy intensity are shown in Table 4. After conducting LR tests, we chose the space–time dual fixed effects. The coefficient β was −0.3962, which is significant at the 1% level under the space–time fixed effect. This suggests that the conditional β convergence is evident in the five northwestern provinces.
Although there was significant conditional β convergence, σ and absolute β convergence were not obvious. This suggests that the energy intensity gap in the northwestern regions will not disappear in the short term. The energy intensity of the different provinces may converge individually. As shown in Figure 11, the energy intensity of the five northwestern provinces did not fall within the same range at each time point. The Western Development Strategy and the establishment of energy reserve bases contributed to economic and technological advancements in Northwestern China, supporting a reduction in energy intensity. However, since each province had different initial values of energy intensity, different economic and technological levels, and different industrial sector structures, the energy intensity of each province did not converge to the same steady-state. Therefore, it is hardly possible for the energy intensity of the different provinces to converge at the same rate, and the gap between provinces still exists in the long-term.

4. Discussion

Our results indicate that the energy use efficiency in the five northwestern provinces is at a low stage in China, and there is more room for their energy efficiency to be improved. Ahmad et al. [15], Li et al. [23], and Guan et al. [32] confirmed our findings. For the decomposition of energy intensity, our results demonstrate that the decrease in industrial energy intensity (especially in the energy-intensive secondary sector) is the primary reason for the decrease in total energy intensity. The result is similar to the results of Zhang et al. [16], Huang et al. [41], Xin et al. [42], and Qin et al. [43]. Industry is the dominant sector of national economic development in less-developed areas of China. The industrialization in Northwest China began more recently and at a lower level, and it is still continuing to go forward. Therefore, the energy intensity of energy-intensive sectors (especially the secondary industry sector) inevitably has a greater effect on the total energy intensity. However, existing scholarship has yet to examine regional energy intensity from a sector-specific perspective, thereby failing to reveal critical disparities in energy intensity across distinct industrial sectors. By adopting a sector-focused analytical approach, this study identifies key sectors that drive industrial energy intensity levels. These findings provide actionable insights for policymakers to develop targeted energy regulation frameworks tailored to specific industrial sectors.
In terms of convergence, our results indicate that there is obvious conditional β convergence in energy intensity in the five northwestern provinces, while σ and absolute β convergence are not obvious. Our results are in agreement with the findings of Zhao et al. [44] and Jiang et al. [45]. They investigated the convergence of energy intensity from the perspective of industrial transfer and the perspective of spatial distribution, respectively, and their findings all indicate that conditional β convergence is obvious in the northwest of China. However, our findings are not in agreement with the results that absolute β convergence is obvious in Northwestern China found by Yu et al. [46] and Huang et al. [47]. The reasons are as follows. The first is that different influencing factors and time scales lead to different results, and the second is that their studies link Western China with Central and Eastern China and add a spatial factor, which has a spillover impact on the convergence of energy intensity in Northwest China, making their absolute β convergence in the region. In short, the conditional β convergence pattern in Northwestern China reveals divergent development paths among the five provinces, highlighting the lack of interprovincial policy coordination. To address this, the region needs differentiated energy efficiency targets: Gansu and Ningxia should focus on reducing energy consumption in the coal chemical industries, Qinghai and Xinjiang should prioritize upgrading photovoltaic capabilities, and Shaanxi should concentrate on advancing energy system technologies. Achieving provincial energy intensity absolute β convergence requires overcoming administrative boundaries through coordinated infrastructure development―particularly, improving regional energy internet connectivity―and establishing a collaborative governance framework focused on differentiated targets, technology sharing, market synergy, and data-driven optimization.

5. Conclusions and Suggestions

5.1. Conclusions

The potential for decreasing energy intensity in Northwestern China is huge, and research on energy intensity and convergence in the region is of great practicality in promoting sustainable energy development. Our findings are as follows:
First, the total energy intensity of the five northwestern provinces decreased from 2.389 tons/104 CNY in 2000 to 0.916 tons/104 CNY in 2021, with a decrease of 61.6%. Among the five provinces, the decrease rates in energy intensity, from largest to smallest, were in Gansu, Ningxia, Qinghai, Shaanxi, and Xinjiang.
Second, the industrial energy intensity effect (especially the secondary industry) emerged as the primary driver of the decline in total energy intensity, with the energy structure effect playing a secondary role, while the industrial structure effect conversely impeded the reduction process. Their changes to energy intensity were −1.594 tons/104 CNY, −0.000163 tons/104 CNY, and 0.1205 tons/104 CNY, respectively.
Third, the impact of each sub-sector on energy intensity varies by province. Overall, there are eight sub-sectors (I3, I5, I6, I16, I21, I23, I24, and I34) in the five northwestern provinces that have cumulatively contributed more than 80% to the decline in industrial energy intensity. This is the primary explanation for the continued decrease in energy intensity in the region. In addition, there are six sub-sectors (I1, I5, I18, I19, I24, and I34) with energy intensities above 1 ton/104 CNY. They were the main reason for the higher energy intensity in the region, and they are also the sectors with the greatest potential for improving the efficiency of energy use.
Last, there was no obvious σ and absolute β convergence of energy intensity in the five northwestern provinces, but there was an obvious conditional β convergence. This suggests that the gap in energy use efficiency among the five northwestern provinces will persist in the long term.

5.2. Suggestions

For the above issues, we provide the following suggestions for the improvement and promotion of the sustainable use of energy in the northwestern region in China:
First, a continued decrease in energy intensity relies on the improvement of technology levels. Therefore, the government should strengthen technological research and give financial and policy support to the business sectors with higher energy efficiency.
Second, the decrease in overall energy intensity provided by the industrial structure and energy structure is not adequate. Thus, the northwest region should establish a strict market access system and elimination mechanism to control the number of industries with high-energy consumption and low output. In addition, the region’s renewable and clean energy sources such as solar and wind power should be fully utilized to replace coal consumption.
Third, among the industry sub-sectors in the northwestern region, those that increase the energy intensity (I1, I2, I15, I18, I19, I29, and I33) and those with higher energy intensities (I1, I5, I18, I19, I24, and I34) are the key sectors for sustainable energy use in the future. Therefore, the northwest should strive to achieve high-quality development in these sectors. Specific measures include promoting energy-saving technologies in the coal chemical industry, such as advanced coal gasification systems and low-energy synthesis processes, while actively recovering high-temperature flue gas, steam, and other waste heat during production for power generation or district heating. In the petroleum refining and coking sectors, enterprises should optimize heat integration systems and establish an integrated “refining–chemicals–power” industrial chain to increase product value and enhance output per unit of energy consumed.
Finally, the five northwestern provinces are geographically close to each other, and they all have a higher energy intensity. Only when the energy intensity of the five provinces converges to the same level can they promote the green, synergistic, and sustainable use of regional energy. Thus, the region should strengthen exchanges and cooperation and take advantage of regional cooperation in energy development and energy-saving technologies to enhance the effective flow of renewable energy, low-carbon industries, and advanced technology among the provinces.

6. Limitations and Future Research Directions

The limitations of this study are appreciated for further research. First, the decomposition of energy intensity in this study considered only three main factors. However, other factors, such as education level, urbanization rate, foreign trade, and energy policy also have non-negligible impacts on energy intensity. Therefore, these factors should be considered in future studies. Second, the convergence of energy intensity in this study is only a common panel data regression analysis without considering the spatial correlation between regions, which is an issue that should be addressed in the future. Third, this study did not consider the energy consumption during processing and transformation, which may lead to some errors between the computed energy intensity and the actual one, which is also a direction that needs further in-depth attention in the future.

Author Contributions

Conceptualization, J.J.; data curation, Z.Z. and J.J.; formal analysis, Z.Z. and J.J.; methodology, Z.Z. and J.J.; software, Z.Z.; supervision, C.Z. and C.L.; validation, M.J.; writing—original draft, Z.Z.; writing—review and editing, J.J. All authors have read and agreed to the published version of the manuscript.

Funding

This research was funded by the National Natural Science Foundation of China [Grant No. 72264016], the Foundation Project of Philosophy and Social Science in Jiangxi Province [Grant No. 21JL03], and the Research Project of Humanities and Social Science from Jiangxi’s Provincial Department of Education [Grant No. GL19225].

Data Availability Statement

The data are available upon reasonable request from the authors.

Conflicts of Interest

The authors declare no conflicts of interest.

Appendix A

Table A1. Industrial classification for national economic activities in China.
GroupingsCategories
Primary IndustryAgriculture, forestry, animal husbandry, and fishery
Secondary IndustryIndustryMining
Manufacturing
Electricity, heat, gas and water production, and supply industry
ConstructionConstruction industry
Tertiary IndustryWholesale, retail, accommodation, and catering
Transportation, storage, and postal industry
Information transmission, software, and information technology services
Financial industry
Real estate industry
Leasing and business services
Scientific research and technical services
Water, environment, and public facilities management industry
Residential services, repairs, and other services
Education
Health and social work
Culture, sports, and entertainment
Public administration, social security, and social organizations
Table A2. The classification of industry sectors used in this paper.
NumberIndustry
I1
I2
I3
I4
I5
I6
I7
I8
I9
I10
I11
I12
I13
I14
I15
I16
I17
I18
I19
I20
I21
I22
I23
I24
I25
I26
I27
I28
I29
I30
I31
I32
I33
I34
I35
I36
Coal mining and washing
Extraction of petroleum and natural gas
Ferrous metal mining industry
Non-ferrous metal mining industry
Non-metallic mining industry
Agricultural and sideline food processing industry
Food manufacturing
Beverage manufacturing
Tobacco manufacturing
Textile industry
Textile and apparel industry
Leather, fur, down, and products
Wood processing and wood, bamboo, rattan, palm, and grass products industry
Furniture manufacturing
Paper and paper products industry
Printing and recording media reproduction industry
Cultural, educational, industrial, sports, and recreational goods manufacturing
Petroleum processing, coking, and nuclear fuel processing industry
Chemical raw materials and chemical products manufacturing
Pharmaceutical manufacturing
Chemical fiber manufacturing
Rubber and plastic products industry
Non-metallic mineral products industry
Ferrous metal smelting and rolling processing industry
Non-ferrous metal smelting and rolling processing industry
Metal products industry
General equipment manufacturing
Specialized equipment manufacturing
Transportation equipment manufacturing
Electrical machinery and equipment manufacturing
Communications and other electronic equipment manufacturing
Instrument manufacturing
Other manufacturing
Electricity and heat production and supply industry
Gas production and supply industry
Water production and supply industry

References

  1. Fuzhan, X. China’s Economic Development and Development Economics Innovation. Soc. Sci. China 2019, 40, 100. [Google Scholar] [CrossRef]
  2. China Agenda 21. White Paper on China’s Population, Environment and Development in the 21st Century; China Environmental Science Press: Beijing, China, 1994. [Google Scholar]
  3. Hewitt, N.J. Decarbonizing Energy of a City: Identifying Barriers and Pathways. Energies 2024, 17, 267. [Google Scholar] [CrossRef]
  4. Augutis, J.; Krikštolaitis, R.; Martišauskas, L.; Urbonienė, S.; Urbonas, R.; Ušpurienė, A.B. Analysis of energy security level in the Baltic States based on indicator approach. Energy 2020, 199, 117427. [Google Scholar] [CrossRef]
  5. Atstāja, D. Renewable Energy for Sustainable Development: Opportunities and Current Landscape. Energies 2025, 18, 196. [Google Scholar] [CrossRef]
  6. Liu, X.; Huang, Y.; Shi, X.; Bai, W.; Huang, S.; Li, P.; Xu, M.; Li, Y. Offshore Wind Power—Seawater Electrolysis—Salt Cavern Hydrogen Storage Coupling System: Potential and Challenges. Energies 2025, 18, 169. [Google Scholar] [CrossRef]
  7. Juntueng, S.; Towprayoon, S.; Chiarakorn, S. Assessment of energy saving potential and CO2 abatement cost curve in 2030 for steel industry in Thailand. Environ. Dev. Sustain. 2021, 23, 2630–2654. [Google Scholar] [CrossRef]
  8. Zhong, J.; Bollen, M.; Rönnberg, S. Towards a 100% renewable energy electricity generation system in Sweden. Renew. Energy 2021, 171, 812–824. [Google Scholar] [CrossRef]
  9. BP Statistical Review. BP Statistical Review of World Energy. Available online: http://www.bp.com/statisticalreview (accessed on 5 May 2024).
  10. National Bureau of Statistic of China. China Energy Statistical Yearbook. 2019. Available online: https://www.stats.gov.cn/sj/ndsj/ (accessed on 7 May 2024).
  11. Du, X. Energy Revolution: For a Sustainable Future. China Popul. Resour. Environ. 2014, 24, 1–4. (In Chinese) [Google Scholar] [CrossRef]
  12. Lin, B.; Xu, M. Quantitative assessment of factors affecting energy intensity from sector, region and time perspectives using decomposition method: A case of China’s metallurgical industry. Energy 2019, 189, 116280. [Google Scholar] [CrossRef]
  13. Zeng, L.; Lu, H.; Liu, Y.; Zhou, Y.; Hu, H. Analysis of Regional Differences and Influencing Factors on China’s Carbon Emission Efficiency in 2005–2015. Energies 2019, 12, 3081. [Google Scholar] [CrossRef]
  14. Wang, Z.; He, W. Regional energy intensity reduction potential in China: A non-parametric analysis approach. J. Clean. Prod. 2017, 149, 426–435. [Google Scholar] [CrossRef]
  15. Ahmad, F.; Draz, M.U.; Ozturk, I.; Su, L.; Rauf, A. Looking for asymmetries and nonlinearities: The nexus between renewable energy and environmental degradation in the Northwestern provinces of China. J. Clean. Prod. 2020, 266, 121714. [Google Scholar] [CrossRef]
  16. Zhang, H.; Shen, L.; Zhong, S.; Elshkaki, A. Economic Structure Transformation and Low-Carbon Development in Energy-Rich Cities: The Case of the Contiguous Area of Shanxi and Shaanxi Provinces, and Inner Mongolia Autonomous Region of China. Sustainability 2020, 12, 1875. [Google Scholar] [CrossRef]
  17. Zhou, X.; Zhou, M.; Zhang, M. Contrastive analyses of the influence factors of inter-provincial carbon emission induced by industry energy in China. Nat. Hazard. 2016, 81, 1405–1433. [Google Scholar] [CrossRef]
  18. Ren, B.; Zhang, X. The Evolution of the Development Process of Industrialization in New China in 70 Years and Its Future Trends. J. Xi’an Univ. Financ. Econ. 2019, 4, 17–23. (In Chinese) [Google Scholar]
  19. Jia, J.; Ma, G.; Qin, C.; Wang, L. Place-based Policies, State-Led Industrialisation, and Regional Development: Evidence from China’s Great Western Development Programme. Eur. Econ. Rev. 2020, 123, 103398. [Google Scholar] [CrossRef]
  20. Xiao, B.; Niu, D.; Guo, X. The driving forces of changes in CO2 emissions in China: A structural decomposition analysis. Energies 2016, 9, 259. [Google Scholar] [CrossRef]
  21. Wang, W.; Liu, X.; Zhang, M.; Song, X. Using a new generalized LMDI (logarithmic mean Divisia index) method to analyze China’s energy consumption. Energy 2014, 67, 617–622. [Google Scholar] [CrossRef]
  22. Ang, B.W. Decomposition analysis for policymaking in energy: Which is the preferred method? Energy Policy 2004, 32, 1131–1139. [Google Scholar] [CrossRef]
  23. Zheng, X.; Lu, Y.; Yuan, J.Y.B.; Zhang, S.; Nils, C.; Dag, O.H.S.; Tian, M.O.; Deliang, C. Drivers of change in China’s energy-related CO2 emissions. Proc. Natl. Acad. Sci. USA 2020, 117, 29–36. [Google Scholar] [CrossRef]
  24. Jia, J.; Lei, J.; Chen, C.; Song, X.; Zhong, Y. Contribution of Renewable Energy Consumption to CO2 Emission’s Mitigation: A Comparative Analysis from a Global Geographic Perspective. Sustainability 2021, 13, 3853. [Google Scholar] [CrossRef]
  25. Jaunky, V.C.; Zhang, L. Convergence of operational efficiency in China’s provincial power sectors. Energy J. 2016, 37, 3–28. [Google Scholar] [CrossRef]
  26. Barro, R.J. Convergence. J. Political Econ. 1992, 100, 223–251. [Google Scholar] [CrossRef]
  27. Sala-I-Martin, X. The Classical Approach to Convergence Analysis. Econ. J. 1996, 106, 1019–1036. [Google Scholar] [CrossRef]
  28. Mussini, M. Inequality and convergence in energy intensity in the European Union. Appl. Energy 2020, 261, 114371. [Google Scholar] [CrossRef]
  29. Solarin, S.A. Parametric and non-parametric convergence analysis of electricity intensity in developed and developing countries. Environ. Sci. Pollut. Res. 2019, 26, 8552–8574. [Google Scholar] [CrossRef]
  30. Zhang, P.; Wang, X.; Zhang, N.; Wang, Y. China’s energy intensity target allocation needs improvement! Lessons from the convergence analysis of energy intensity across Chinese Provinces. J. Clean. Prod. 2019, 223, 610–619. [Google Scholar] [CrossRef]
  31. Li, W.J.; Zhang, M.; Ouyang, J.; Shi, W. Regional differences in carbon emission of China’s industries and its decomposition effects. J. Clean. Prod. 2020, 270, 122528. [Google Scholar] [CrossRef]
  32. Guan, W.; Xu, S. Study of spatial patterns and spatial effects of energy eco-efficiency in China. J. Geogr. Sci 2016, 26, 1362–1376. [Google Scholar] [CrossRef]
  33. Ang, B.W. LMDI decomposition approach: A guide for implementation. Energy Policy 2015, 86, 233–238. [Google Scholar] [CrossRef]
  34. Pettersson, F.; Maddison, D.; Acar, S.; Soderholm, P.D. Convergence of Carbon Dioxide Emissions: A Review of the Literature. Int. Rev. Environ. Resour. Econ. 2014, 7, 141–178. [Google Scholar] [CrossRef]
  35. Pesaran, M.H. On the interpretation of panel unit root tests. Econ. Lett. 2012, 116, 545–546. [Google Scholar] [CrossRef]
  36. Levin, A.; Lin, C.F.; Chu, C.S.J. Unit root tests in panel data: Asymptotic and finite sample properties. J. Econom. 2002, 108, 1–24. [Google Scholar] [CrossRef]
  37. Choi, I. Unit root tests for panel data. J. Int. Money Financ. 2001, 20, 249–272. [Google Scholar] [CrossRef]
  38. Kao, C. Spurious regression and residual-based tests for cointegration in panel data. J. Econom. 1999, 90, 1–44. [Google Scholar] [CrossRef]
  39. Yu, B. Economic Growth Effects of Industrial Restructuring and Productivity Improvement—An Analysis Based on Dynamic Spatial Panel Model of Chinese Cities. China Ind. Econ. 2015, 12, 85–100. (In Chinese) [Google Scholar]
  40. Wang, Z.; Wang, L. Research on the relationship between R&D input, industrial structure upgrading and carbon emission. Ind. Technol. Econ. 2019, 5, 64–72. (In Chinese) [Google Scholar]
  41. Huang, C.; Zhou, Y.J.; Cheng, J.H. Research on Energy-Related CO2 Emissions Characteristics, Decoupling Relationship and LMDI Factor Decomposition in Qinghai. Front. Energy Res. 2021, 9, 700385. [Google Scholar] [CrossRef]
  42. Xin, L.; Jia, J.; Hu, W.; Zeng, H.; Chen, C.; Wu, B. Decomposition and Decoupling Analysis of CO2 Emissions Based on LMDI and Two-Dimensional Decoupling Model in Gansu Province, China. Int. J. Environ. Res. Public Health 2021, 18, 6013. [Google Scholar] [CrossRef]
  43. Qin, J.; Tao, H.; Zhan, M.; Munir, Q.; Brindha, K.; Mu, G. Scenario Analysis of Carbon Emissions in the Energy Base, Xinjiang Autonomous Region, China. Sustainability 2019, 11, 4220. [Google Scholar] [CrossRef]
  44. Zhao, X.; Fan, L. Spatial distribution characteristics and convergence of China’s regional energy intensity: An industrial transfer perspective. J. Clean. Prod. 2019, 233, 903–917. [Google Scholar] [CrossRef]
  45. Jiang, L.; Bai, L. Study on Spatial Distribution and Convergence of China’s Energy Intensity—Analysis Based on Dynamic Spatial Panel Model. West Forum 2014, 24, 61–69. (In Chinese) [Google Scholar]
  46. Yu, H. The influential factors of China’s regional energy intensity and its spatial linkages: 1988–2007. Energy Policy 2012, 45, 583–593. [Google Scholar] [CrossRef]
  47. Huang, J.; Zheng, X.; Wang, A.; Cai, X. Convergence analysis of China’s energy intensity at the industrial sector leve. Environ. Sci. Pollut. Res. 2019, 26, 7730–7742. [Google Scholar] [CrossRef]
Figure 1. Location of the five northwestern provinces of China.
Energies 18 01330 g001
Figure 2. (a) The growth trend of energy consumption and GDP in the five northwestern provinces of China; (b) the average energy intensity of the five northwestern provinces and China.
Energies 18 01330 g002
Figure 3. Change in energy intensity in the five northwestern provinces of China.
Energies 18 01330 g003
Figure 4. (a) The decomposition results of energy intensity in the five northwestern provinces of China. (b) (inset) The cumulative effect of each effect. Δ S i , t , Δ I i , t , Δ F i m , t , and Δ e t o t are the industrial structure effect, industrial energy intensity effect, energy structure effect, and total effect, respectively. ( Δ e t o t = Δ S i , t + Δ I i , t + Δ F i m , t ).
Energies 18 01330 g004
Figure 5. (a) Decomposition results of industrial structure effects. (b) (inset) The cumulative effects of each industrial structure. (c) The trends and shares of changes in each industrial structure. S1, S2, S3, and Δ S i , t denote the primary industry structure effect, secondary industry structure effect, tertiary industry structure effect, and total industry structure effect, respectively. ( Δ S i , t = S1 + S2 + S3).
Energies 18 01330 g005
Figure 6. (a) Decomposition results of the energy intensity effect of industries. (b) (inset) The cumulative effect of energy intensity by industry (tons/104 CNY). I1, I2, I3, and Δ I i , t denote the primary industry energy intensity effect, the secondary industry energy intensity effect, the tertiary industry energy intensity effect, and the total effect of industrial energy intensity, respectively. ( Δ I i , t = I1 + I2 + I3).
Energies 18 01330 g006
Figure 7. (a) Decomposition results of the energy structure effect. Insets: (b) The cumulative effect of each type of energy. (c) The share of each type of energy use. ( Δ F i m , t denotes the total energy structure effect, which is the sum of effects from coal, oil, natural gas, and electricity).
Energies 18 01330 g007
Figure 8. The cumulative contribution of the energy intensity of each sub-sector in five provinces. (I5 is missing in Shaanxi; I8, I9, I17, and I33 are missing in Gansu; I17, I31, and I33 are missing in Qinghai; I4, I17, I21, and I35 are missing in Ningxia; and I5, I17, I32, and I33 are missing in Xinjiang).
Energies 18 01330 g008
Figure 9. (a) Cumulative contribution of sub-sectors to energy intensity in the five northwestern provinces of China. (b) Energy intensity of sub-sectors.
Energies 18 01330 g009
Figure 10. Energy intensity σ convergence. (CV, σ, and G denote the coefficient of variation, σ coefficient, and Gini coefficient, respectively).
Energies 18 01330 g010
Figure 11. Energy intensity convergence in the five northwestern provinces of China.
Energies 18 01330 g011
Table 2. Unit root test.
MethodIndustrial StructureIndustrial Energy IntensityEnergy Structure ln q d i , t l n ( q d i , t + 1 q d t )
LLC−15.8680 ***−6.7824 ***−3.8113 ***−10.7632 ***−12.2001 ***
IPS−11.6247 ***−5.5452 ***−3.7529 ***−6.8995 ***−8.6583 ***
ADF82.8721 ***42.1036 ***36.7102 ***48.7000 ***62.6132 ***
PP112.431 ***49.1605 ***64.5830 ***46.498 ***84.0650 ***
Note: *** is significant at the 1% level.
Table 3. Co-integration test results.
TermKaoPedroni
ADF t-Statistic−7.3957 ***
Panel PP-Statistic −4.2184 ***
Panel ADF-Statistic −4.0202 ***
Group PP-Statistic −6.1995 ***
Group ADF-Statistic −5.0904 ***
Note: *** is significant at the 1% level.
Table 1. Definition of variables.
VariableDefinition
e t Total energy intensity in period t
E t Total energy consumption in period t
y t Total GDP in period t
y i , t Value added of industry i in period t
E i , t Energy consumption of industry i in period t
E i m , t The m type of energy consumption of industry i in period t
S i , t Value added of industry i as a share of GDP in period t (i = 1, 2, 3)
I i , t Energy intensity of industry i in period t (i = 1, 2, 3)
F i m , t The m type of energy consumption of industry i in period t as a part of total consumption (i = 1, 2, 3)
q d i , t Energy intensity of province i in period t
q d t ¯ Average energy intensity of n provinces in period t
NNumber of regions
l n ( q d i , t ) Logarithm of energy intensity of province i in period t
l n ( q d t ) ¯ Average of the logarithm of energy intensity for n provinces in period t
l n ( q d i , t + 1 q d i , t ) Logarithm of the annual change rate in energy intensity
βEnergy intensity regression coefficient
αConstant term
εError term
λ i,tVariable i in period t
βiCoefficient of each variable
Table 4. The regression results of β convergence of energy intensity.
VariableAbsolute β ConvergenceConditional β Convergence
β−0.01286
(−0.6385)
−0.3962 ***
(−5.2871)
Industrial structure −0.2235 **
(−2.9345)
Industrial energy intensity −0.2148 ***
(−3.3417)
Consumption structure −0.1039 ***
(−3.2353)
R20.38950.7883
Adjusted R20.22060.6824
F-statistic2.3062 ***7.4453 ***
Log-likelihood97.5368 **120.8814 ***
Spatial fixed effect (LR test)78.090541.6132 ***
Time fixed effect (LR test)88.5830 **87.1327 ***
Space–time fixed effectNoYes
Note: **, *** are significant at the 5% and 1% levels, respectively. The t-statistic is in parentheses.
Disclaimer/Publisher’s Note: The statements, opinions and data contained in all publications are solely those of the individual author(s) and contributor(s) and not of MDPI and/or the editor(s). MDPI and/or the editor(s) disclaim responsibility for any injury to people or property resulting from any ideas, methods, instructions or products referred to in the content.

