


Electrochemical Impedance Spectroscopy Investigation on the Charge–Discharge Cycle Life Performance of Lithium-Ion Batteries

Abstract
1. Introduction
2. Experimental Section
2.1. Li-Ion Cells
2.2. Experimental Set-Up
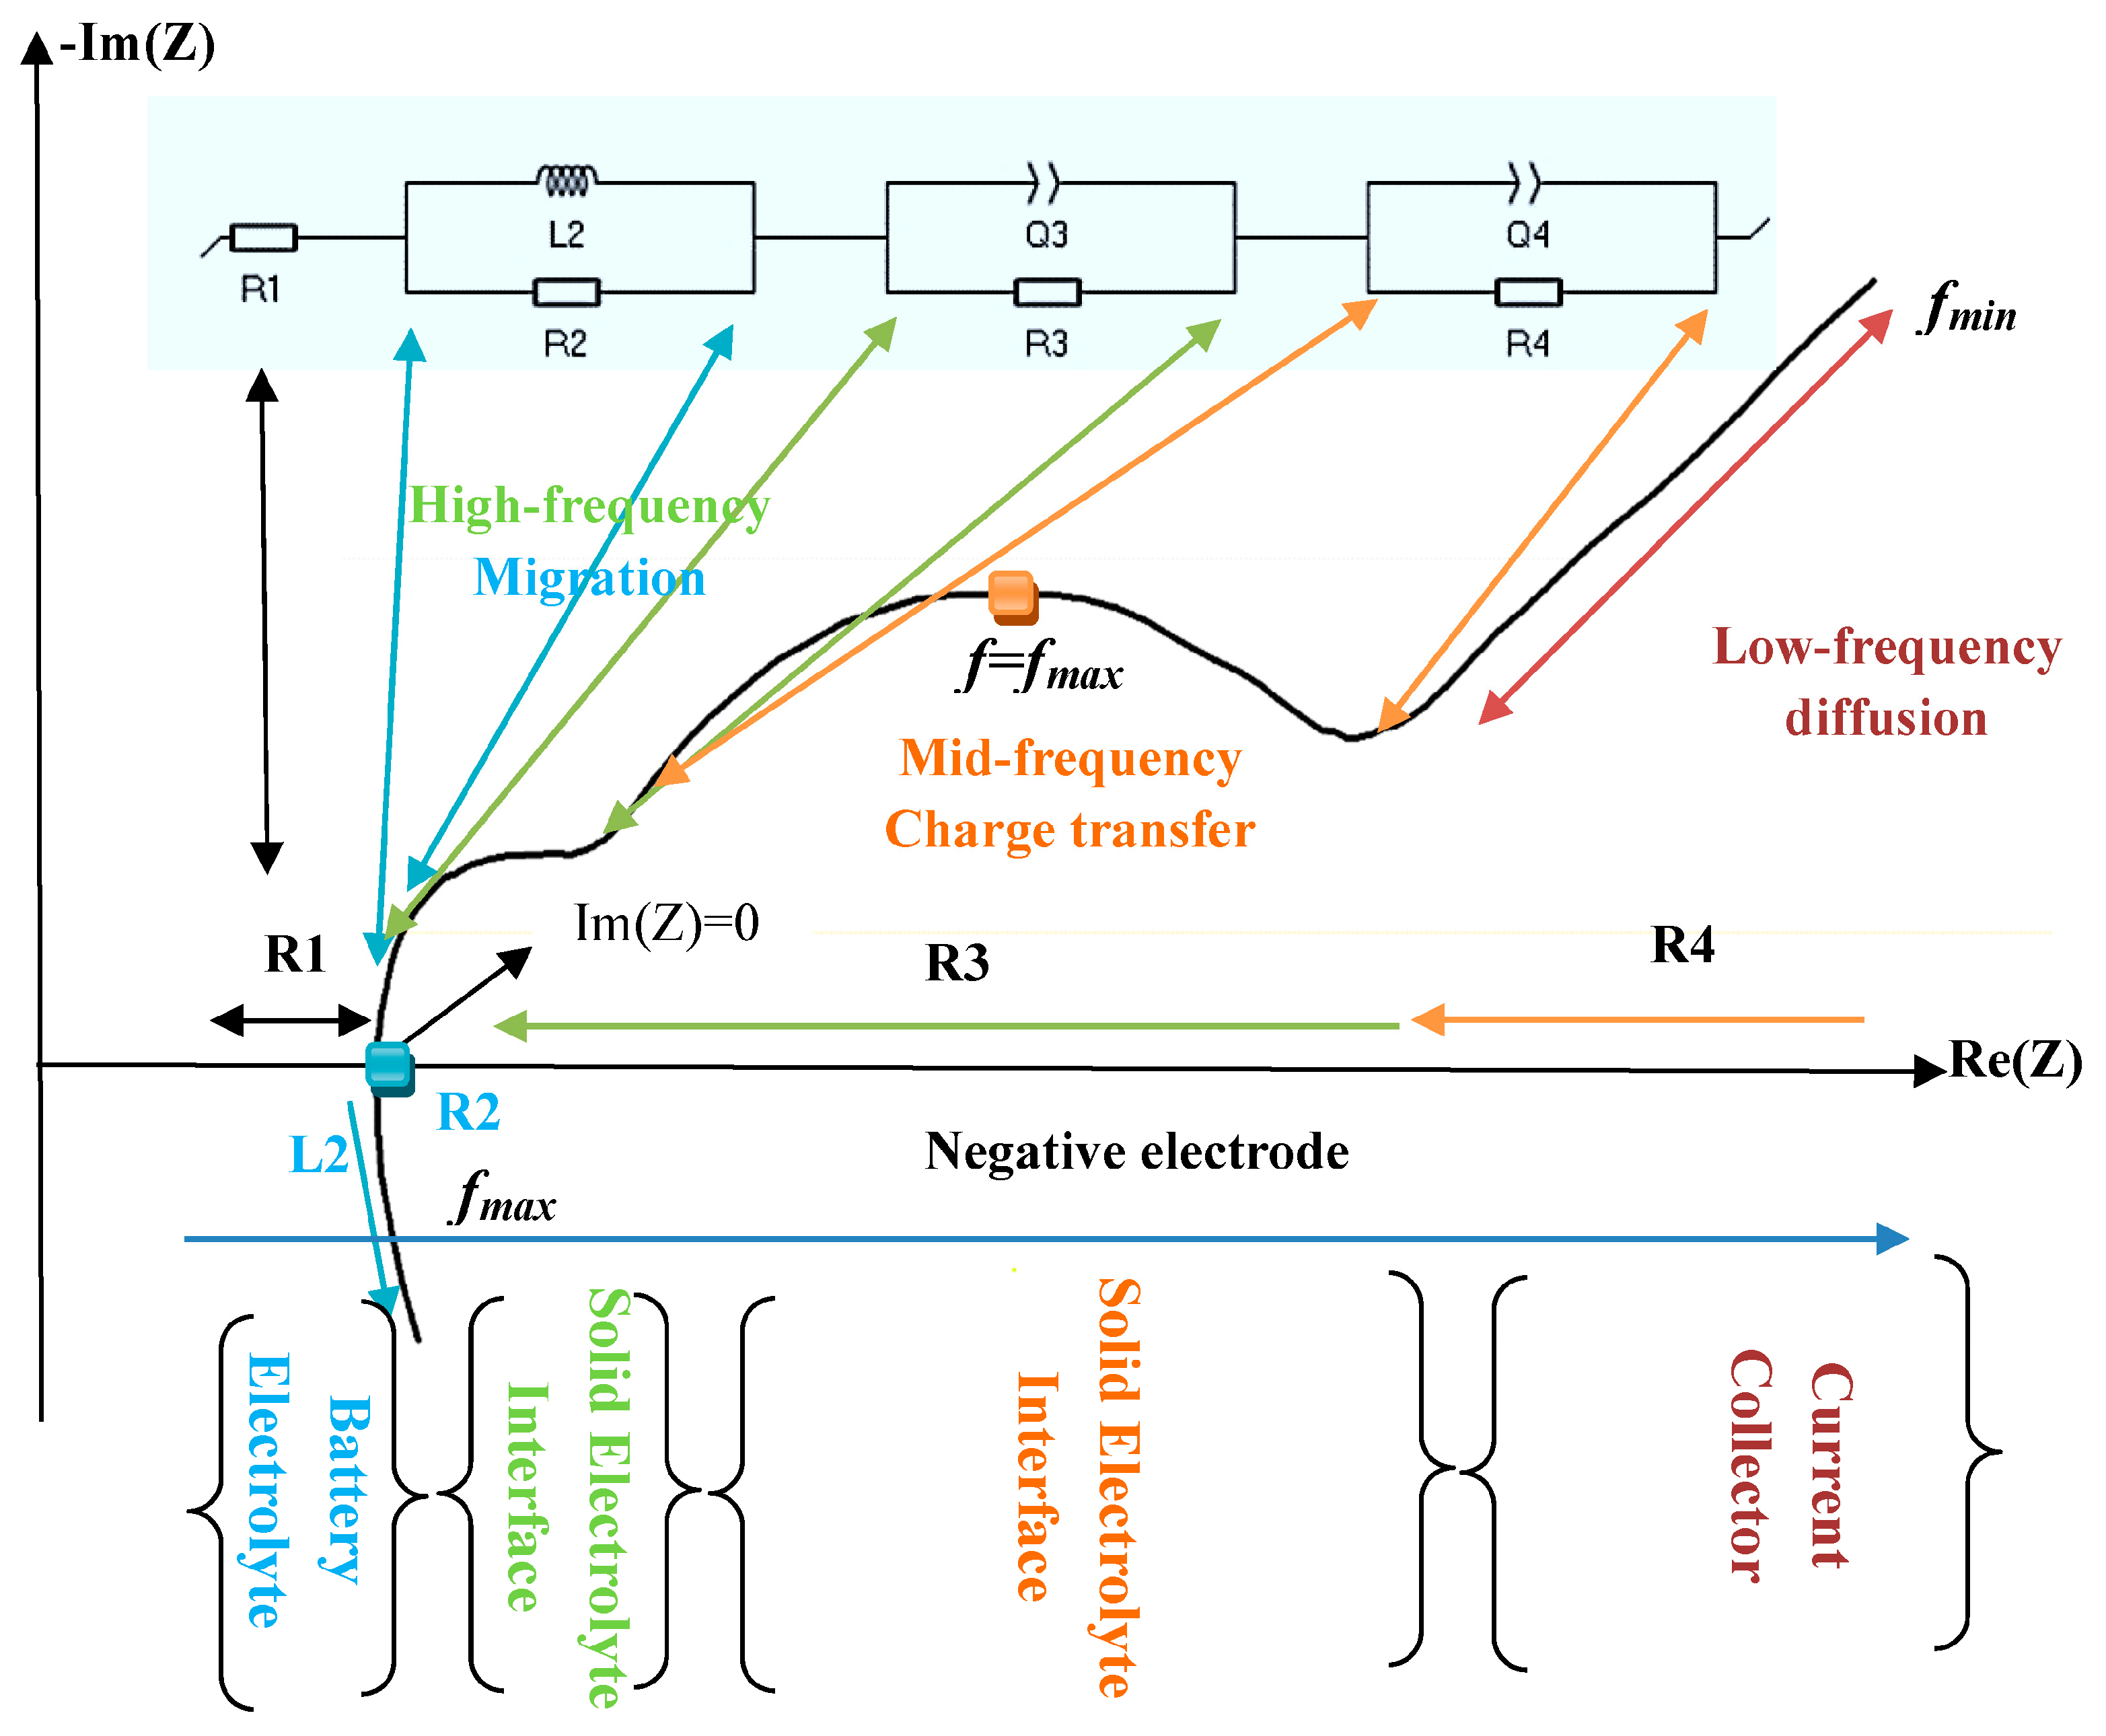
2.3. Electrochemical Impedance Spectroscopy (EIS)
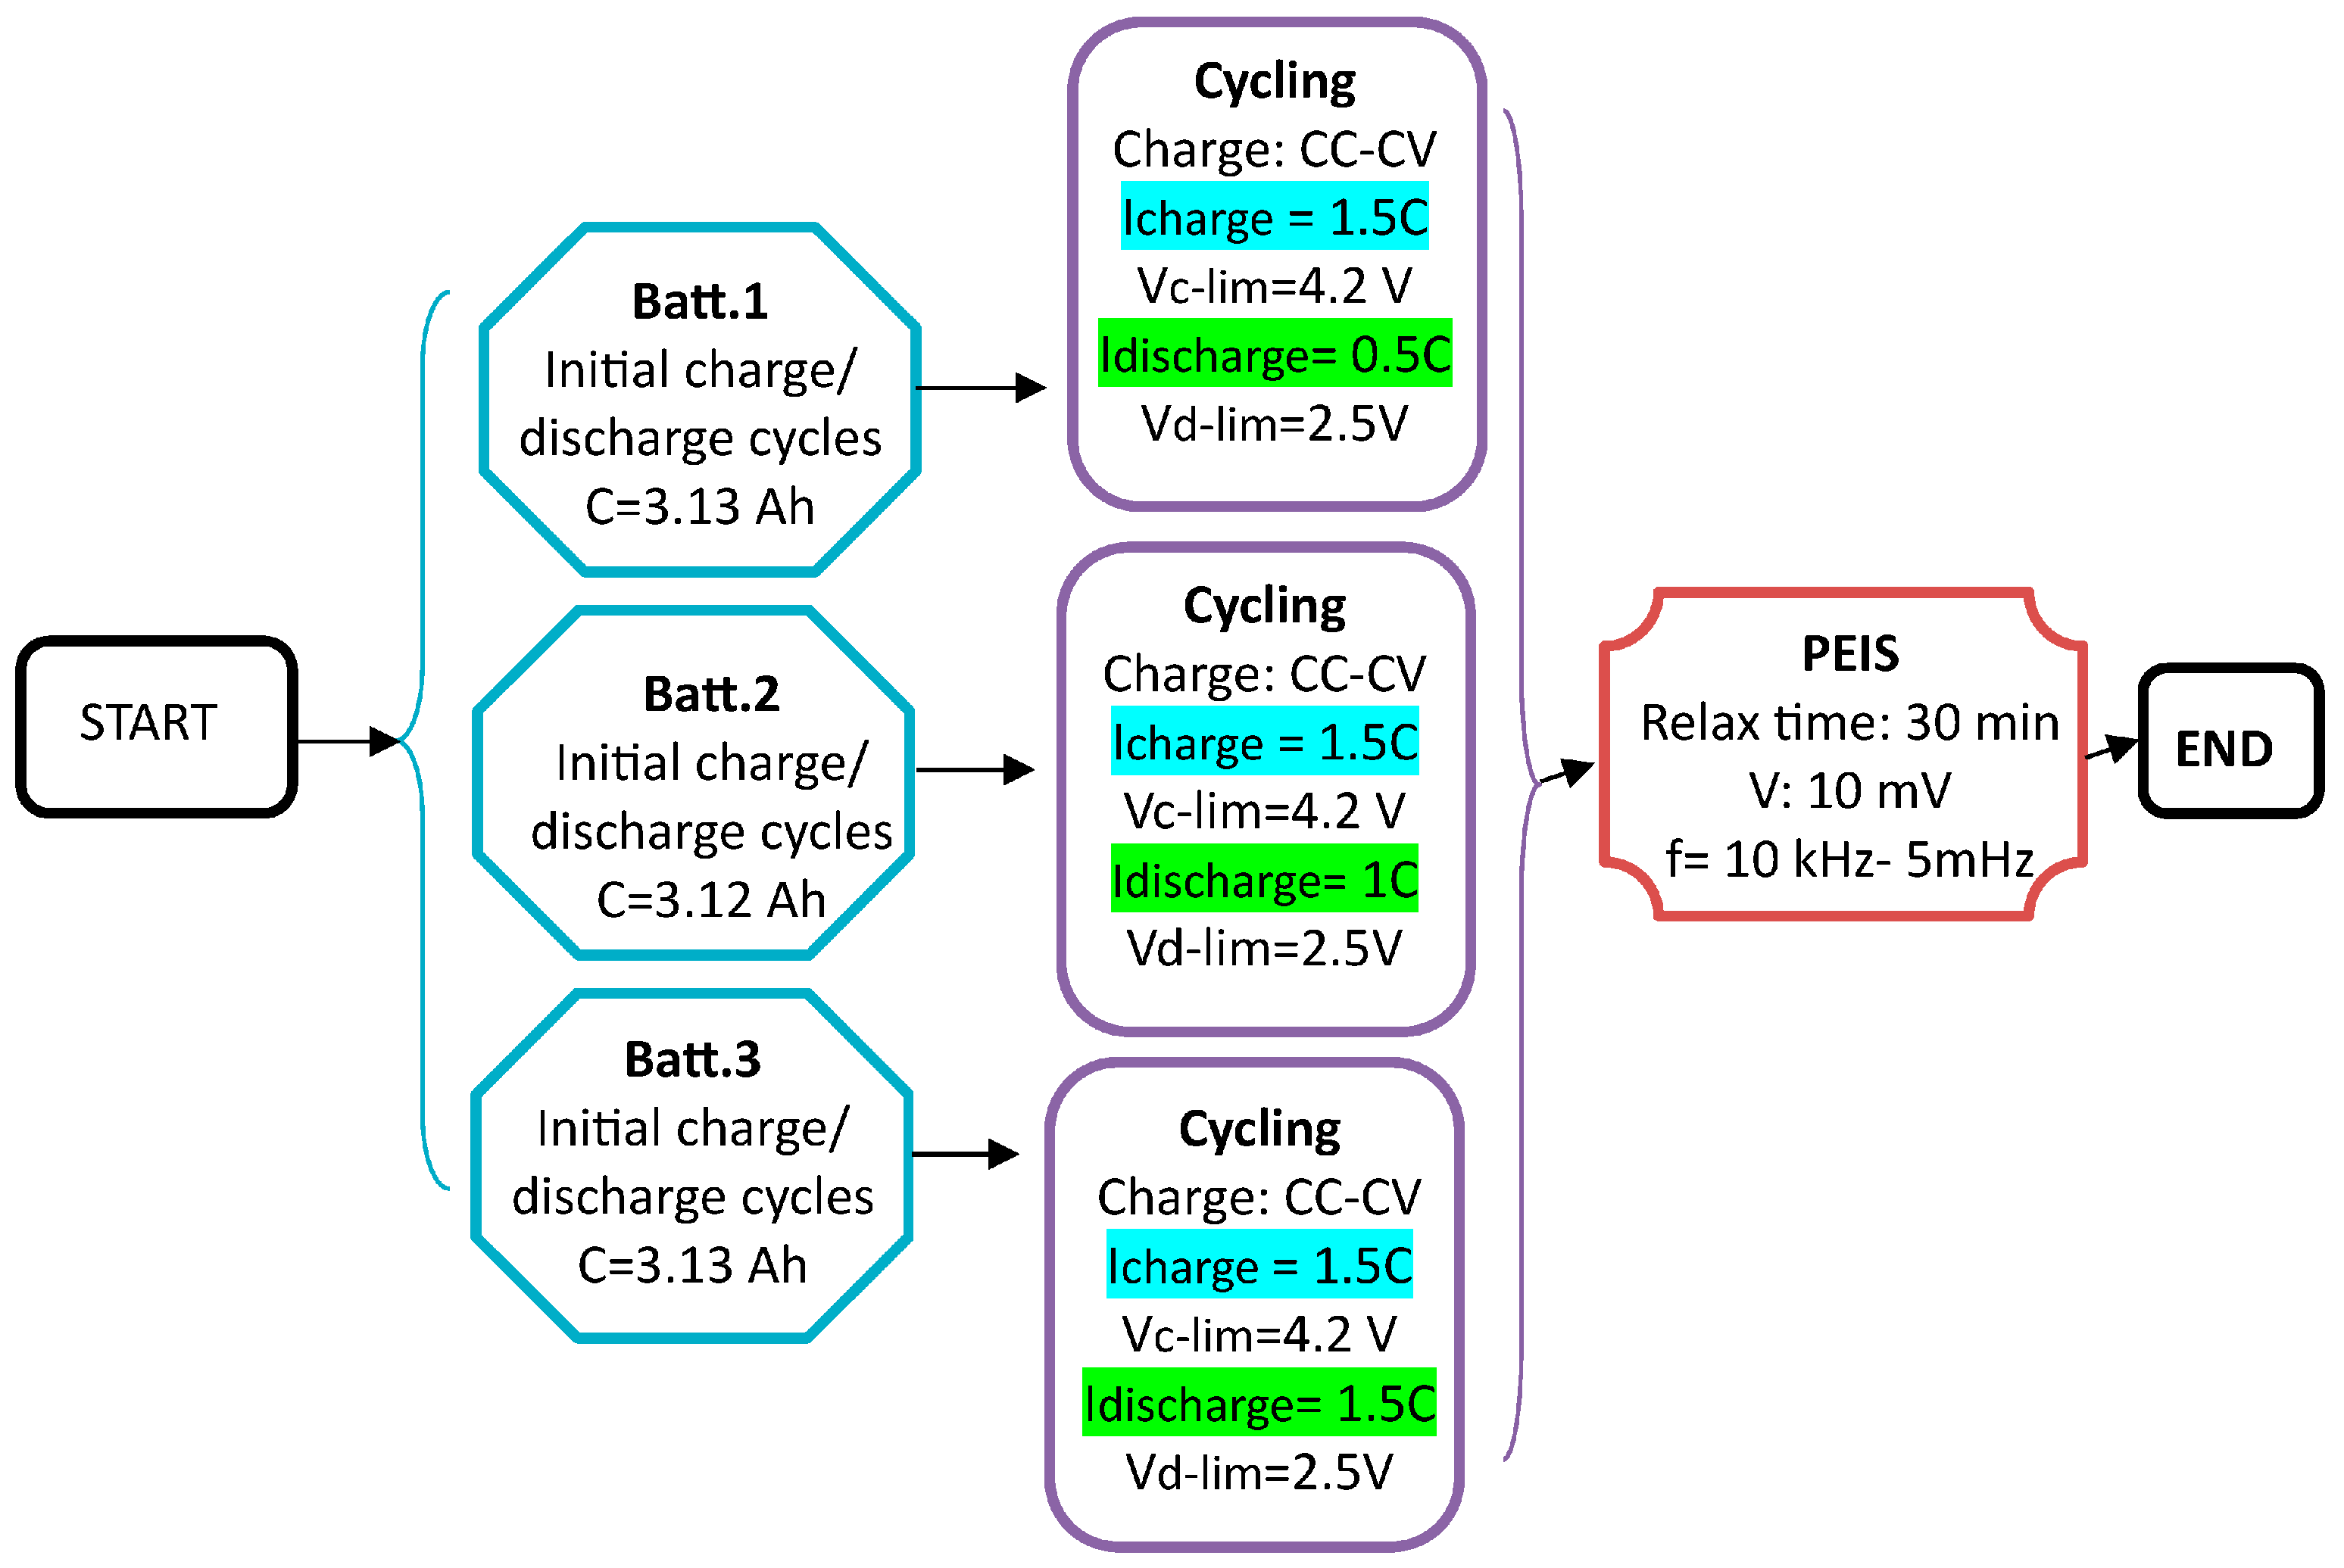
2.4. Aging Protocol
3. Results
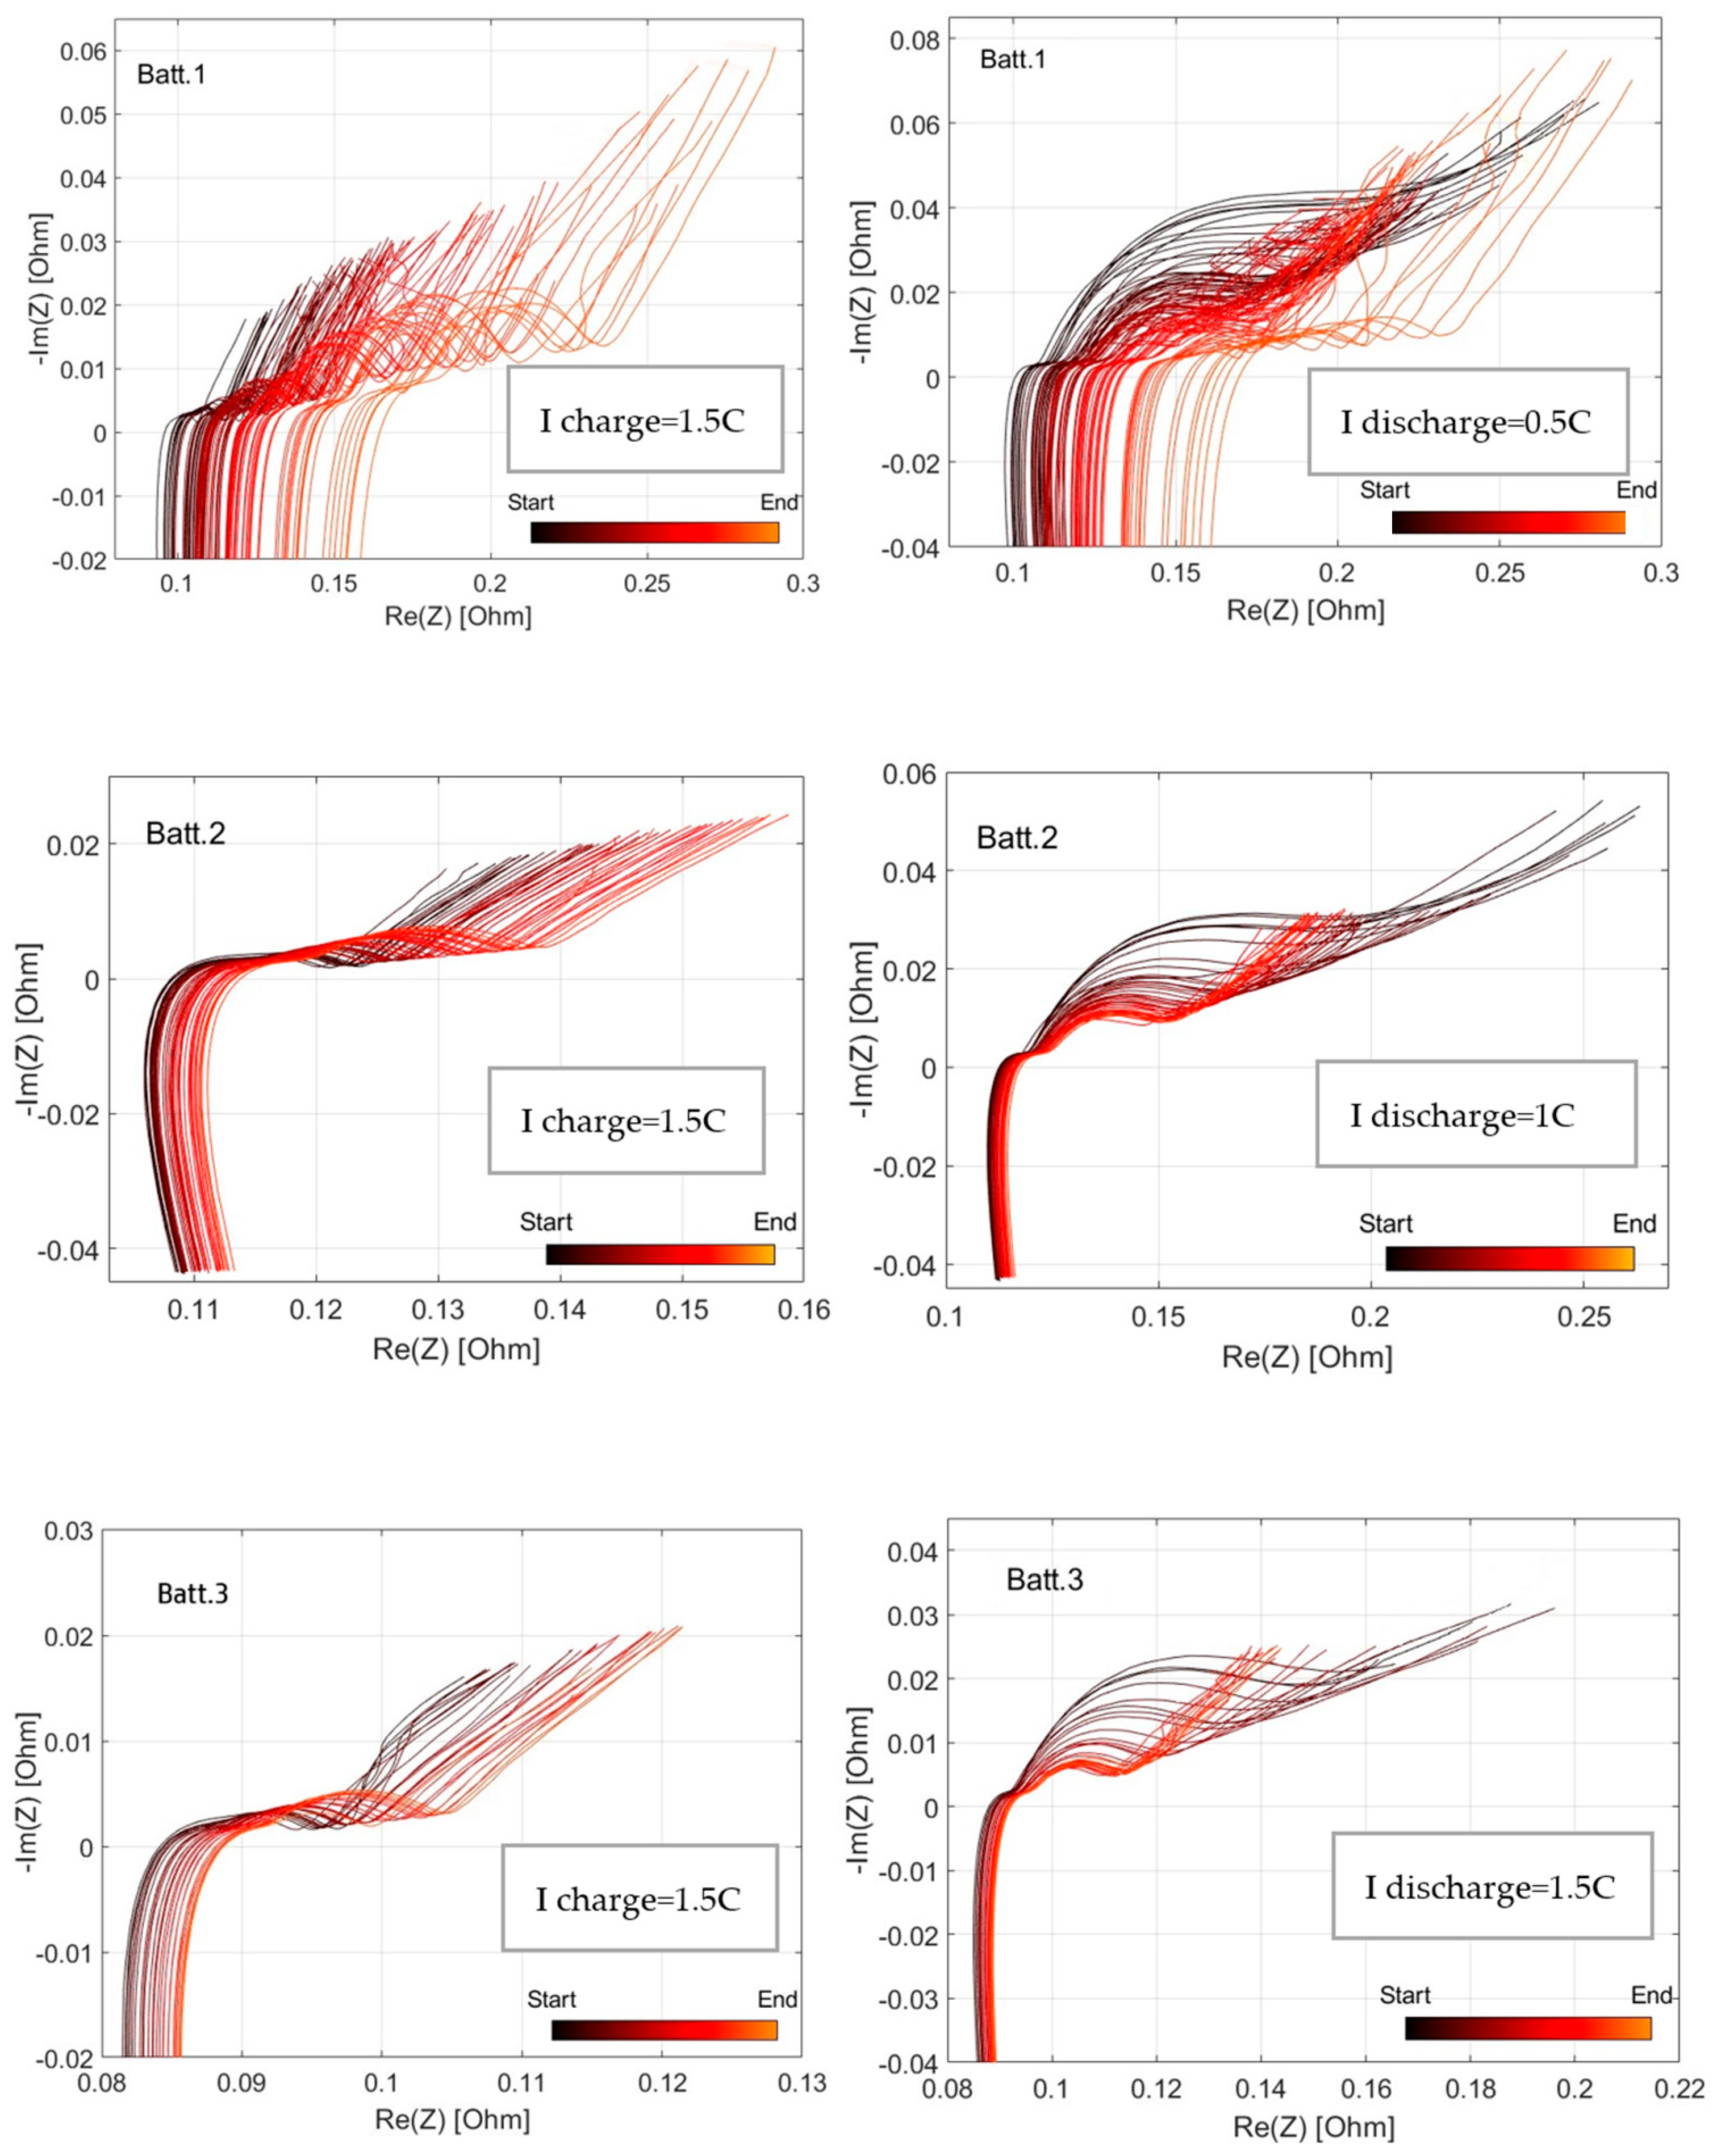
3.1. EIS Analysis
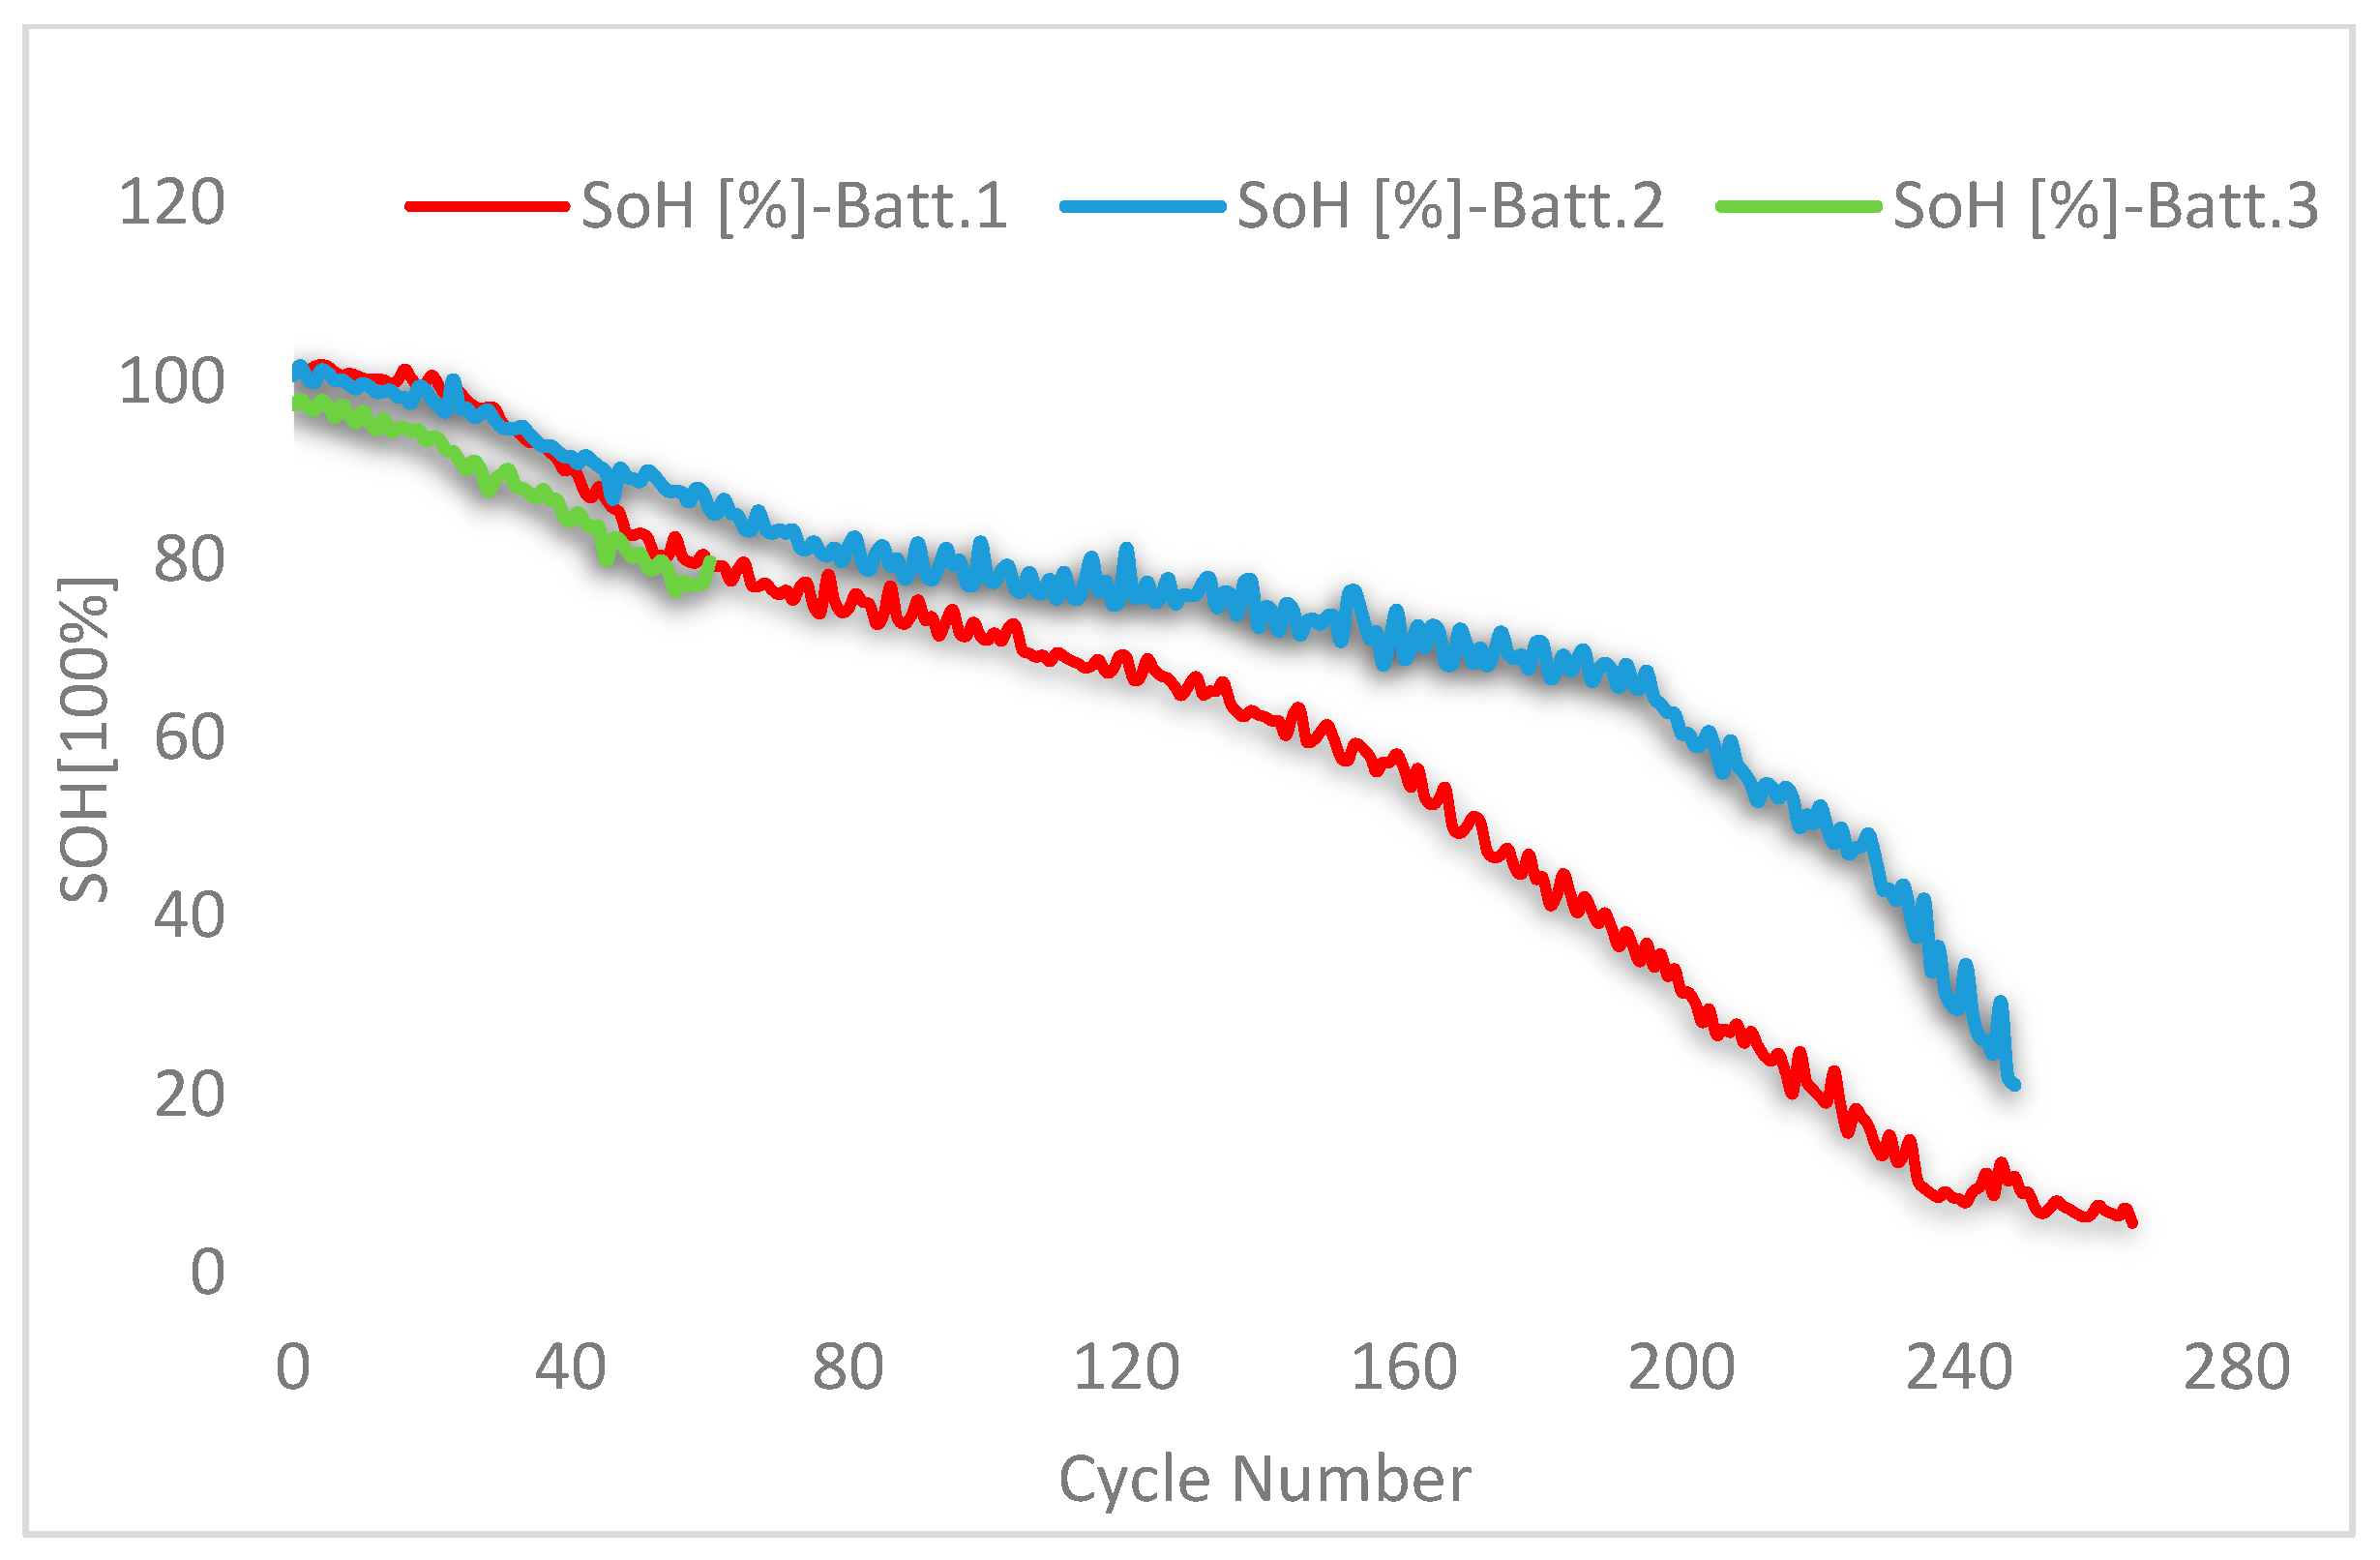
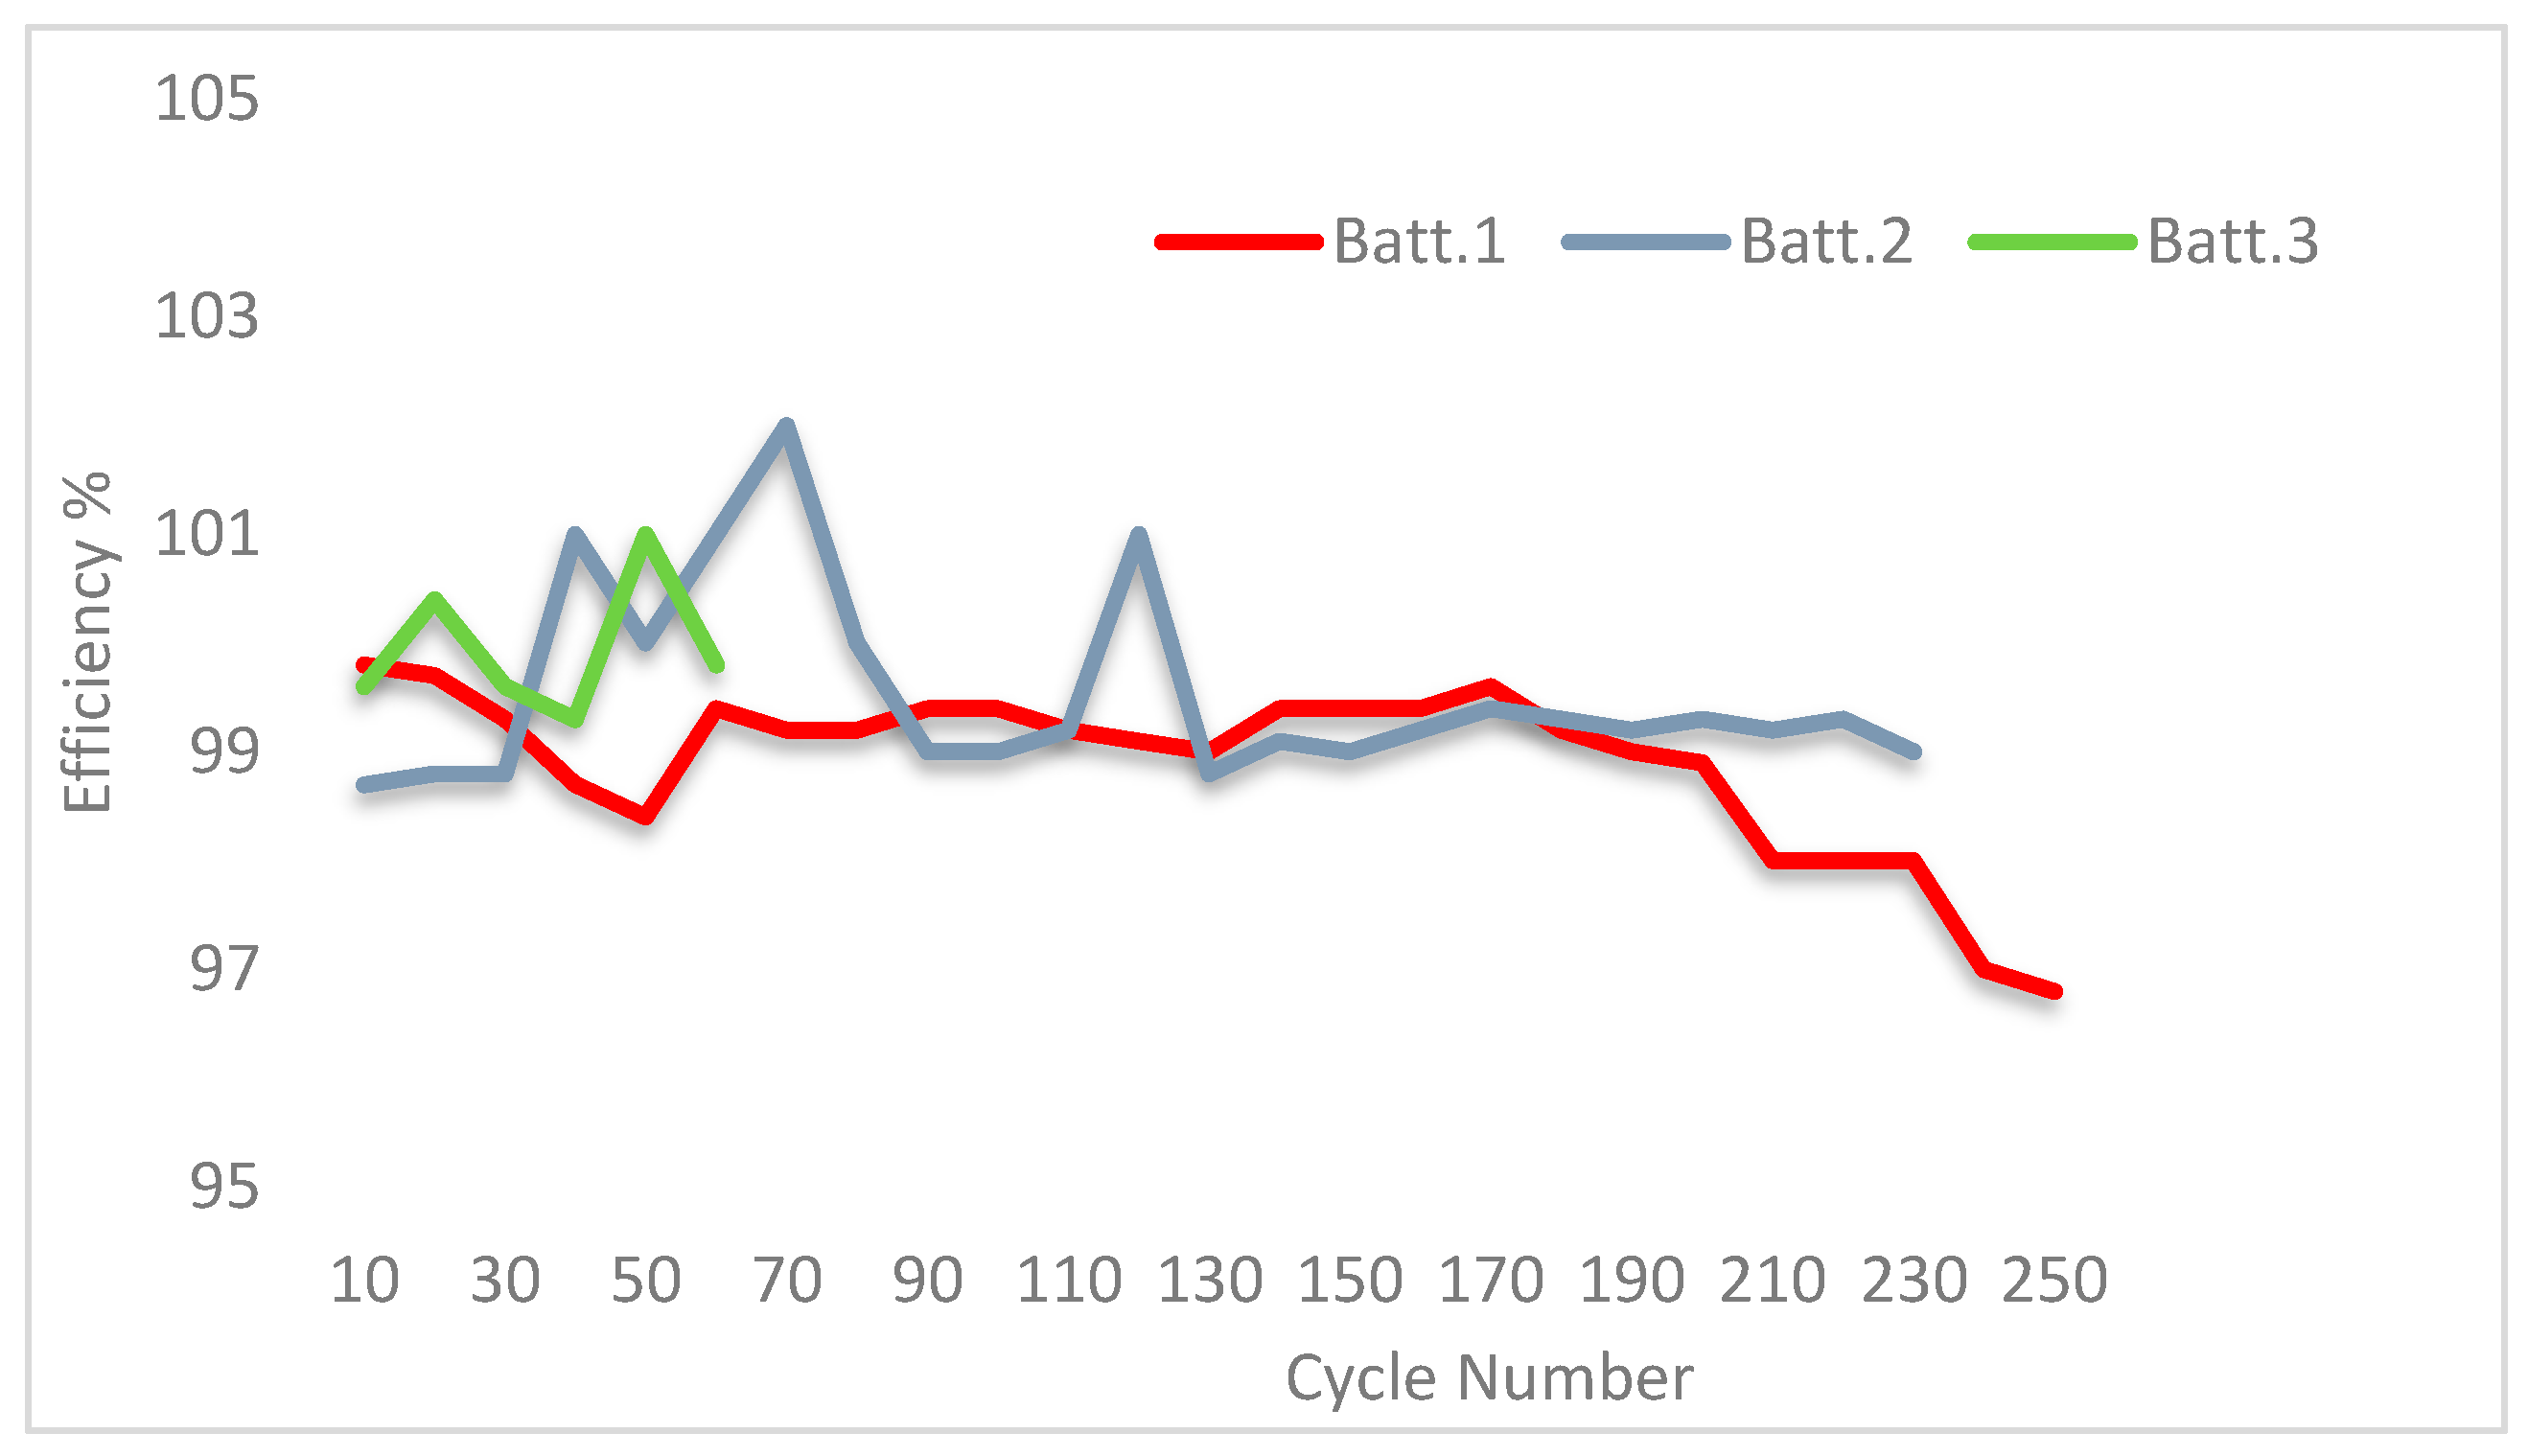
3.2. SoH Dependency vs. Discharge Rate
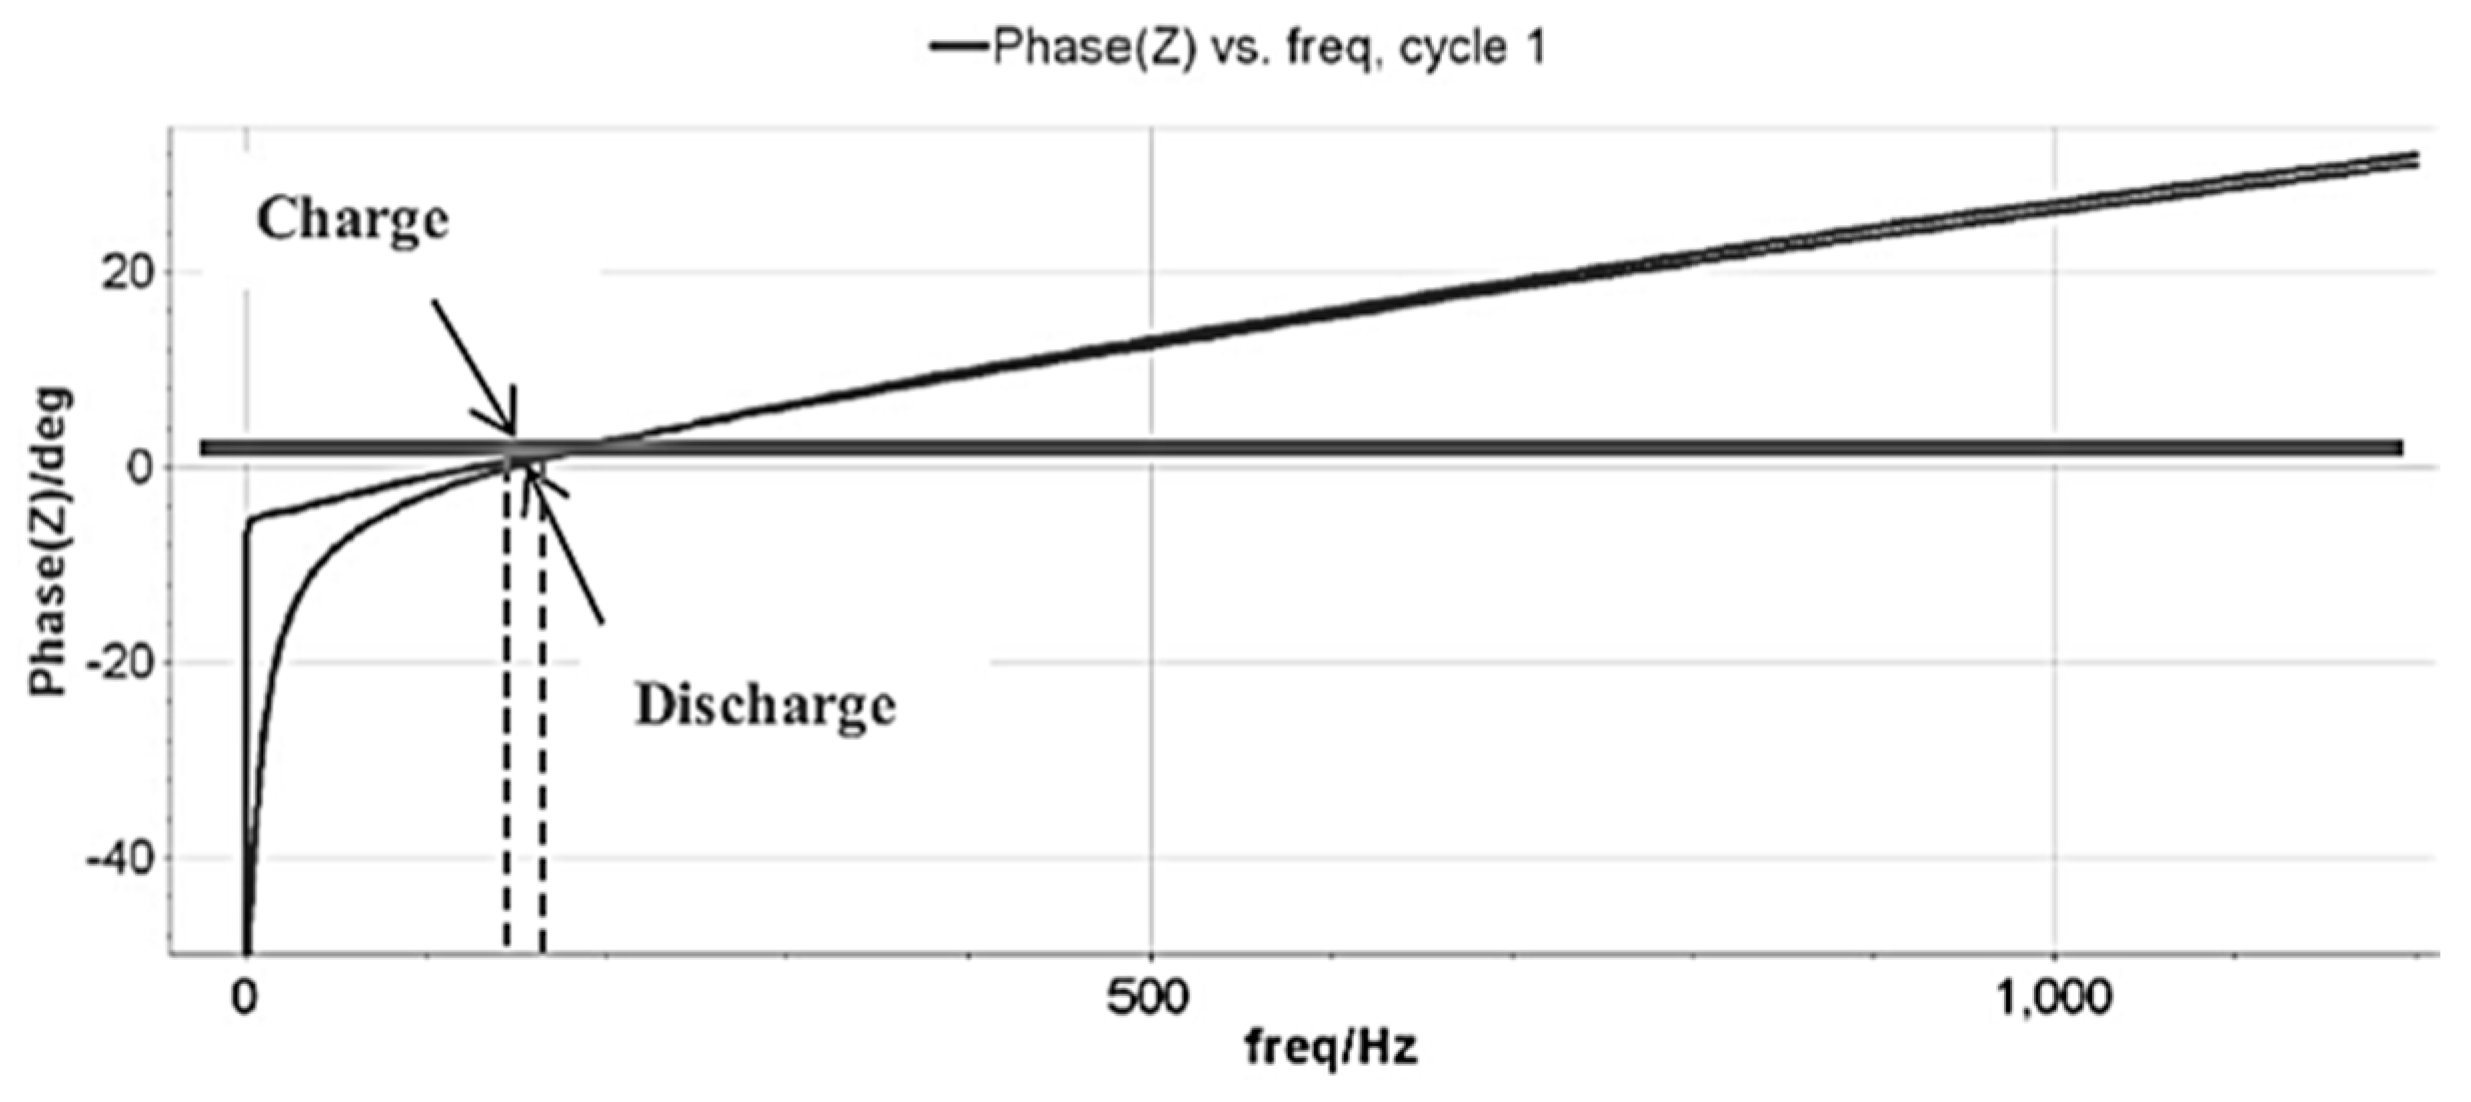
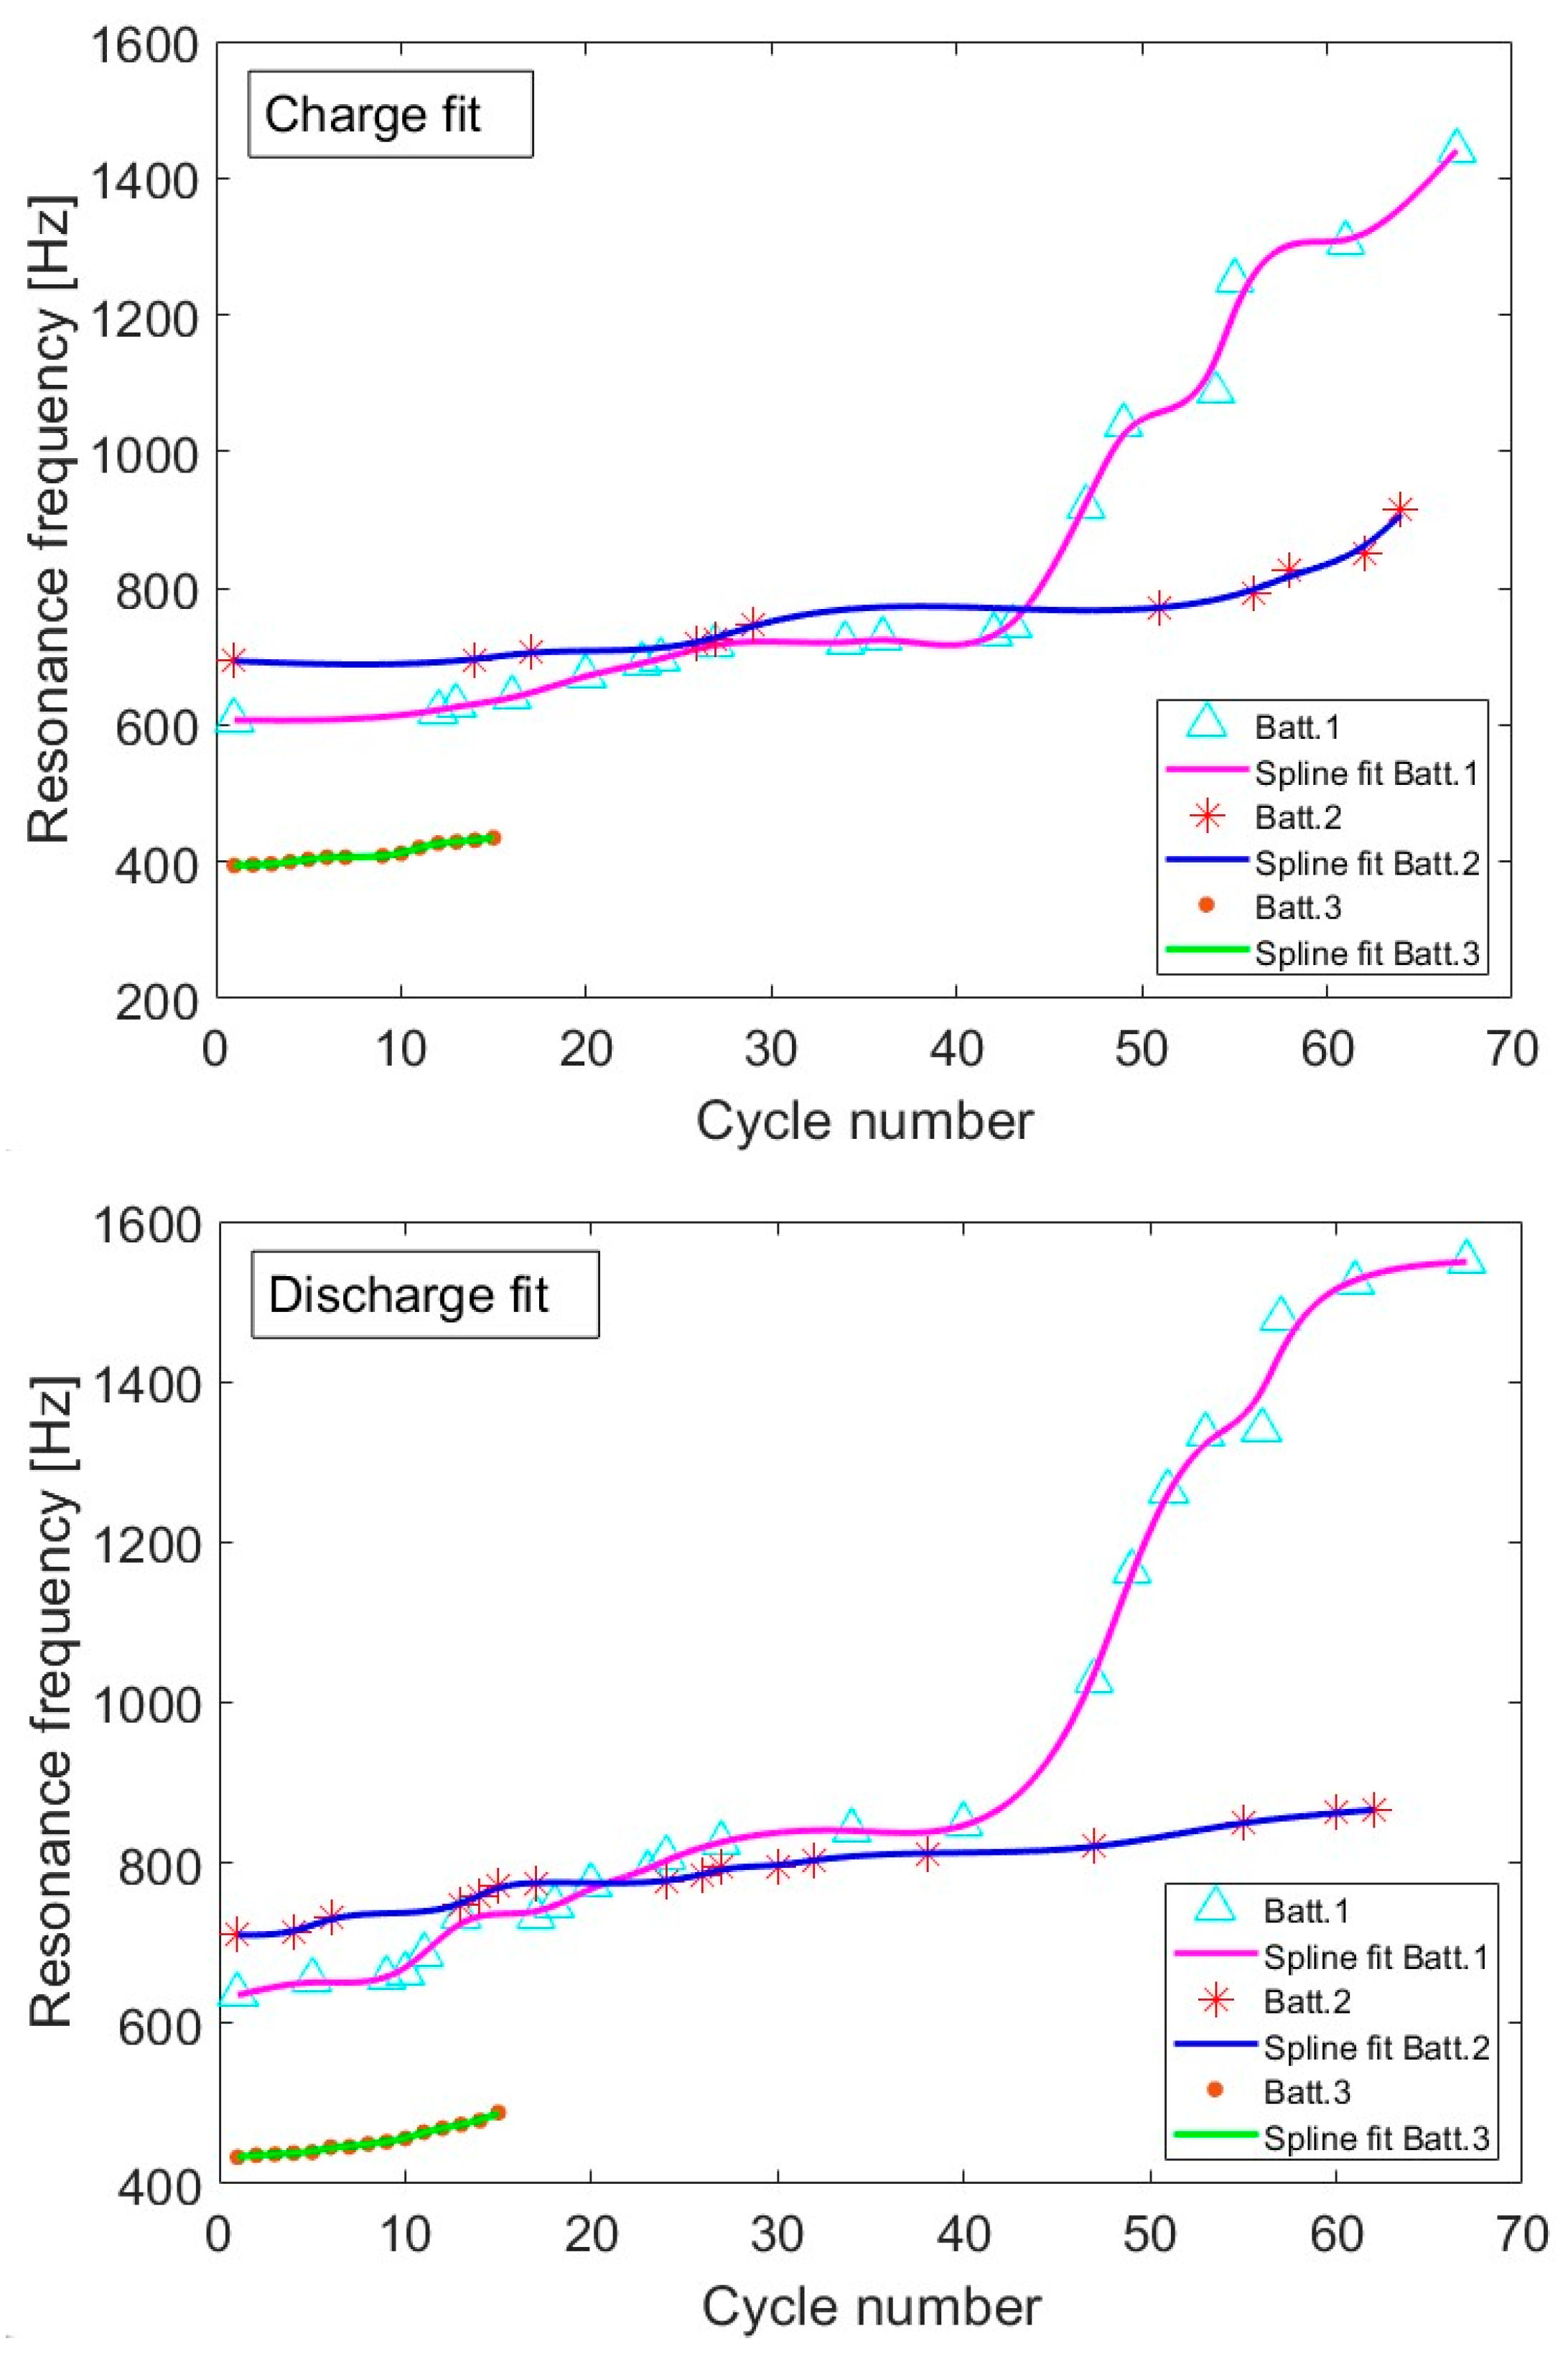
3.3. Resonance Frequency
4. Conclusions
Author Contributions
Funding
Data Availability Statement
Conflicts of Interest
References
- Pistoia, G. Battery for Portable Devices; Elsevier Science: Amsterdam, The Netherlands, 2005; ISBN 978-0-444-51672-5. [Google Scholar]
- Ralls, M.; Leong, K.; Clayton, J.; Fuelling, P.; Mercer, C.; Navarro, V.; Menezes, P.L. The role of lithium-ion batteries in the growing trend of electric vehicles. Materials 2023, 16, 6063. [Google Scholar] [CrossRef] [PubMed]
- Chen, W.; Liang, J.; Yang, Z.; Li, G. A review of lithium-ion battery for electric vehicle applibations and beyond. Energy Procedia 2019, 158, 4363–4368. [Google Scholar] [CrossRef]
- Killer, M.; Farrokhseresht, M.; Paterakis, N.G. Implementation of large-scale Li-ion battery energy storage systems within the EMEA region. Appl. Energy 2020, 260, 114166. [Google Scholar] [CrossRef]
- Chen, T.; Jin, Y.; Lv, H.; Yang, A.; Liu, M.; Chen, B.; Xie, Y.; Chen, Q. Applibations of Lithium-Ion Batteries in Grid-Scale Energy Storage Systems. Trans. Tianjin Univ. 2020, 26, 208–217. [Google Scholar] [CrossRef]
- Carmeli, M.S.; Toscani, N.; Mauri, M. Electrothermal aging model of li-ion batteries for vehicle-to-grid services evaluation. Electronics 2022, 11, 1042. [Google Scholar] [CrossRef]
- Shafee, A.; Hossain, M.M.; Moni, L.; Islam, K.M.; Ahmad, S.; Howlader, S.; Islam, M.Z.; Antor, M.M.H.; Mekhilef, S. Technical Comparison between Lead-acid and Lithium-ion Batteries Used in Microgrid UPS System. In Proceedings of the 2023 IEEE IAS Global Conference on Renewable Energy and Hydrogen Technologies (GlobConHT), Male, Maldives, 11–12 March 2023; pp. 1–6. [Google Scholar]
- Barrera, T.P.; Bond, J.R.; Bradley, M.; Gitzendanner, R.; Darcy, E.C.; Armstrong, M.; Wang, C.-Y. Next-generation aviation Li-ion battery technologies-Enabling Electrified Aircraft Electrochem. Soc. Interface 2022, 31, 69. [Google Scholar]
- Viswanathan, V.; Epstein, A.H.; Chiang, Y.M.; Takeuchi, E.; Bradley, M.; Langford, J.; Winter, M. The challenges and opportunities of battery-powered flight. Nature 2022, 601, 519–525. [Google Scholar] [CrossRef]
- Chen, H.; Abidi, A.; Hussein, A.K.; Younis, O.; Degani, M.; Heidarshenas, B. Investigation of the use of extended surfaces in paraffin wax phase change material in thermal management of a cylindrical lithium-ion battery: Applibable in the aerospace industry. J. Energy Storage 2022, 45, 103685. [Google Scholar] [CrossRef]
- Mamun, A.-A.; Liu, Z.; Rizzo, D.M.; Onori, S. An Integrated Design and Control Optimization Framework for Hybrid Military Vehicle Using Lithium-Ion Battery and Supercapacitor as Energy Storage Devices. IEEE Trans. Transp. Electrif. 2019, 5, 239–251. [Google Scholar] [CrossRef]
- Arshad, F.; Lin, J.; Manurkar, N.; Fan, E.; Ahmad, A.; Tariq, M.-U.-N.; Wu, F.; Chen, R.; Li, L. Life Cycle Assessment of Lithium-ion Batteries: A Critical Review. Resour. Conserv. Recycl. 2022, 180, 106164. [Google Scholar] [CrossRef]
- Zhao, S.; Guo, Z.; Yan, K.; Wan, S.; He, F.; Sun, B.; Wang, G. Towards high-energy-density lithium-ion batteries: Strategies for developing high-capacity lithium-rich cathode materials. Energy Storage Mater. 2021, 34, 716–734. [Google Scholar] [CrossRef]
- Behi, H.; Behi, M.; Karimi, D.; Jaguemont, J.; Ghanbarpour, M.; Behnia, M.; Berecibar, M.; Mierlo, J.V. Heat pipe air-cooled thermal management system for lithium-ion batteries: High power appLIBations. Appl. Therm. Eng. 2021, 183, 116240. [Google Scholar] [CrossRef]
- Shan, H.; Cao, H.; Xu, X.; Xiao, T.; Hou, G.; Cao, H.; Tang, Y.; Zheng, G. Investigation of self-discharge properties and a new concept of open-circuit voltage drop rate in lithium-ion batteries. J. Solid State Electrochem. 2021, 26, 163–170. [Google Scholar] [CrossRef]
- R-Smith, N.A.-Z.; Moertelmaier, M.; Gramse, G.; Kasper, M.; Ragulskis, M.; Groebmeyer, A.; Jurjovec, M.; Brorein, E.; Zollo, B.; Kienberger, F. Fast method for calibrated self-discharge measurement of lithium-ion batteries including temperature effects and comparison to modelling. Energy Rep. 2023, 10, 3394–3401. [Google Scholar] [CrossRef]
- Is Lithium-Ion the Ideal Battery? Available online: https://batteryuniversity.com/article/is-lithium-ion-the-ideal-battery (accessed on 23 February 2025).
- Barai, P.; Higa, K.; Srinivasan, V. Lithium dendrite growth mechanisms in polymer electrolytes and prevention strategies. Phys. Chem. Chem. Phys. 2017, 19, 20493–20505. [Google Scholar] [CrossRef]
- Wang, B.; Le Fevre, L.W.; Brookfield, A.; McInnes, E.J.L.; Dryfe, R.A.W. Resolution of Lithium Deposition versus Intercalation of Graphite Anodes in Lithium-Ion Batteries: An In Situ Electron Paramagnetic Resonance Study. Angew. Chem. Int. Ed. 2021, 60, 21860–21867. [Google Scholar] [CrossRef] [PubMed]
- Saju, S.K.; Chattopadhyay, S.; Xu, J.; Alhashim, S.; Pramanik, A.; Ajayan, P.M. Hard carbon anode for lithium-, sodium-, and potassium-ion batteries: Advancement and future perspective. Cell Rep. Phys. Sci. 2024, 5, 101851. [Google Scholar] [CrossRef]
- Wang, S.; Quan, W.; Zhu, Z.; Yang, Y.; Liu, Q.; Ren, Y.; Zhang, X.; Xu, R.; Hong, Y.; Zhang, Z.; et al. Lithium titanate hydrates with superfast and stable cycling in lithium ion batteries. Nat. Commun. 2017, 8, 627. [Google Scholar] [CrossRef]
- Gonzalez, F.; Yang, N.-H.; Liu, R.-S. Silibon Anode Design for Lithium-Ion Batteries: Progress and Perspectives. J. Phys. Chem. C 2017, 121, 27775–27787. [Google Scholar] [CrossRef]
- Fu, W.; Wang, Y.; Kong, K.; Kim, D.; Wang, F.; Yushin, G. Materials and Processing of Lithium-Ion Battery Cathodes. Nanoenergy Adv. 2023, 3, 138–154. [Google Scholar] [CrossRef]
- Mohamed, N.; Allam, N.K. Recent advances in the design of cathode materials for Li-ion batteries. RSC Adv. 2020, 10, 21662–21685. [Google Scholar] [CrossRef] [PubMed]
- Wang, Q.; Zhao, C.; Wang, J.; Yao, Z.; Wang, S.; Kumar, S.G.H.; Ganapathy, S.; Eustace, S.; Bai, X.; Li, B.; et al. High entropy liquid electrolytes for lithium batteries. Nat. Commun. 2023, 14, 440. [Google Scholar] [CrossRef] [PubMed]
- Zhou, D.; Shamukaraj, D.; Tkacheva, A.; Armand, M.; Wang, G. Polymer Electrolytes for Lithium-Based Batteries: Advances and Prospects. Chem 2019, 5, 2326–2352. [Google Scholar] [CrossRef]
- Park, S.; Jeong, S.Y.; Lee, T.K.; Park, M.W.; Lim, H.Y.; Sung, J.; Cho, J.; Kwak, S.K.; Hong, S.Y.; Choi, N.-S. Replacing conventional battery electrolyte additives with dioxolone derivatives for high-energy-density lithium-ion batteries. Nat. Comm. 2021, 12, 838. [Google Scholar] [CrossRef]
- Tan, S.; Ji, Y.J.; Zhang, Z.R.; Yang, Y. Recent Progress in Research on High-Voltage Electrolytes for Lithium-Ion Batteries. ChemPhysChem 2014, 15, 1956–1969. [Google Scholar] [CrossRef]
- Wang, C.; Yang, C.; Zheng, Z. Toward Practical High-Energy and High- Power Lithium Battery Anodes: Present and Future. Adv. Sci. 2022, 9, 2105213. [Google Scholar] [CrossRef]
- Xu, W.-T.; Peng, H.-J.; Huang, J.-Q.; Zhao, C.-Z.; Cheng, X.-B.; Zhang, Q. Towards Stable Lithium–Sulfur Batteries with a Low Self-Discharge Rate: Ion Diffusion Modulation and Anode Protection. ChemSusChem 2015, 8, 2892–2901. [Google Scholar] [CrossRef]
- He, Y.; Zou, P.; Bak, S.-M.; Wang, C.; Zhang, R.; Yao, L.; Du, Y.; Hu, E.; Lin, R.; Xin, H.L. Dual Passivation of Cathode and Anode through Electrode-Electrolyte Interface Engineering Enables Long-Lifespan Li Metal-SPAN Batteries. ACS Energy Lett. 2022, 7, 2866–2875. [Google Scholar] [CrossRef]
- Wang, L.; Zhang, L.; Wang, Q.; Li, W.; Wu, B.; Jia, W.; Wang, Y.; Li, J.; Li, H. Long lifespan lithium metal anodes enabled by Al2O3 sputter coating. Energy Storage Mater. 2018, 10, 16–23. [Google Scholar] [CrossRef]
- A Comparison of Lead Acid to Lithium-Ion in Stationary Storage Applications. Available online: http://www.batterypoweronline.com/wp-content/uploads/2012/07/Lead-acid-white-paper.pdf (accessed on 23 February 2025).
- Why Change from a Lead-Acid Battery to a Lithium Battery? Available online: https://www.flashbattery.tech/en/why-switch-from-lead-acid-battery-to-lithium-battery/ (accessed on 23 February 2025).
- Lithium Batteries vs Lead Acid Batteries. Available online: https://safety4sea.com/cm-lithium-batteries-vs-lead-acid-batteries/ (accessed on 23 February 2025).
- Huan, Z.; Sun, C.; Ge, M. Progress in profitable Fe-based flow batteries for broad-scale energy storage. WIREs Energy Environ. 2024, 13, e541. [Google Scholar] [CrossRef]
- Hadouchi, M.; Koketsu, T.; Hu, Z.; Ma, J. The origin of fast-charging lithium iron phosphate for batteries. Battery Energy 2022, 1, 20210010. [Google Scholar] [CrossRef]
- Ioakimidis, C.S.; Murillo-Marrodan, A.; Bagheri, A.; Thomas, D.; Genikmsakis, K.N. Life Cycle Assessment of a Lithium Iron Phosphate (LFP) Electric Vehicle Battery in Second Life Applibation Scenarios. Sustainability 2019, 11, 2527. [Google Scholar] [CrossRef]
- Lin, X.; Khosravinia, K.; Hu, X.; Li, J.; Lu, W. Lithium Plating Mechanism, Detection, and Mitigation in Lithium-Ion Batteries. Prog. Energy Combust. Sci. 2021, 87, 100953. [Google Scholar] [CrossRef]
- Movassagh, K.; Raihan, A.; Balasingam, B.; Pattipati, K. A critical look at Coulomb Counting approach for State of Charge estimation in batteries. Energies 2021, 14, 4074. [Google Scholar] [CrossRef]
- Ren, Z.; Du, C.; Wu, Z.; Shao, J.; Deng, W. A comparative study of the influence of different open circuit voltage tests on model-based state of charge estimation for lithium-ion batteries. Int. J. Energy Res. 2021, 45, 13692–13711. [Google Scholar] [CrossRef]
- Lin, Q.; Li, X.; Tu, B.; Cao, J.; Zhang, M.; Xiang, J. Stable and accurate estimation of SOC using eXogeneous Kalman filter for lithium-ion batteries. Sensors 2023, 23, 467. [Google Scholar] [CrossRef]
- Obuli, D.P.; Preethem, B.S.; Indragandhi, V.; Ashok, B.; Vedhanayaki, S.; Kavitha, C. Enhanced SOC estimation of lithium ion batteries with RealTime data using machine learning algorithms. Sci. Rep. 2024, 14, 16036. [Google Scholar]
- Weng, C.; Feng, X.; Sun, J.; Peng, H. State-of-health monitoring of lithium-ion battery modules and packs via incremental capacity peak tracking. Appl. Energy 2016, 180, 360–368. [Google Scholar] [CrossRef]
- Zhang, M.; Yang, D.; Du, J.; Sun, H.; Li, L.; Wang, L.; Wang, K. A review of SOH prediction of Li-ion batteries based on data-driven algorithms. Energies 2023, 16, 3167. [Google Scholar] [CrossRef]
- Luo, Y.-F.; Lu, K.-Y. An online state of health estimation technique forlithium-ion battery using artificial neural network and linear interpolation. J. Energy Storage 2022, 52C, 105062. [Google Scholar] [CrossRef]
- Sun, X.; Zhang, Y.; Zhang, Y.; Wang, L.; Wang, K. Summary of health-state estimation of lithium-ion batteries based on Electrochemical Impedance Spectroscopy. Energies 2023, 16, 5682. [Google Scholar] [CrossRef]
- Li, C.; Yang, L.; Li, Q.; Zhang, Q.; Zhou, Z.; Meng, Y.; Zhao, X.; Wang, L.; Zhang, S.; Li, Y.; et al. SOH estimation method for lithium-ion batteries based on an improved equivalent circuit model via electrochemical impedance spectroscopy. J. Energy Storage 2024, 86A, 111167. [Google Scholar] [CrossRef]
- Choi, W.; Shin, H.-C.; Kim, J.M.; Choi, J.-Y.; Yoon, W.-S. Modeling and Applibations of Electrochemical Impedance Spectroscopy (EIS) for Lithium-ion Batteries. J. Electrochem. Sci. Technol. 2020, 11, 1–13. [Google Scholar] [CrossRef]
- Pastor-Fernández, C.; Widanage, W.D.; Marco, J.; Gama-Valdez, M.-Á.; Chouchelamane, G.H. Identification and quantification of ageing mechanisms in Lithium-ion batteries using the EIS technique. In Proceedings of the 2016 IEEE Transportation Electrification Conference and Expo (ITEC), Dearborn, MI, USA, 27–29 June 2016; pp. 1–6. [Google Scholar]
- Crescentini, M.; De Angelis, A.; Ramilli, R.; De Angelis, G.; Tartagni, M.; Moschitta, A.; Traverso, P.A.; Carbone, P. Online EIS and Diagnostics on Lithium-Ion Batteries by Means of Low-Power Integrated Sensing and Parametric Modeling. IEEE Trans. Instrum. Meas. 2021, 70, 1–11. [Google Scholar] [CrossRef]
- Itagaki, M.; Honda, K.; Hoshi, Y.; Shitanda, I. In-situ EIS to determine impedance spectra of lithium-ion rechargeable batteries during charge and discharge cycle. J. Electroanal. Chem. 2015, 737, 78–84. [Google Scholar] [CrossRef]
- 8.4V 10.2Ah Li-Ion Bike Battery with Panasonic NCR18650B Cell Technology. Available online: https://radenite.com/product.php?prodid=0791126833886 (accessed on 23 February 2025).
- Lithium Ion NCR18650B. Available online: https://www.ancoo-battery.com/en/product/NCR18650B.html (accessed on 23 February 2025).
- 3.6V Panasonic NCR18650B. Available online: https://www.dnkpower.com/ncr18650b/ (accessed on 23 February 2025).
- VSP Potentiostat. Available online: https://www.biologic.net/products/vsp-potentiostat/ (accessed on 23 February 2025).
- Zabara, M.A.; Göçmez, H.; Karabatak, A.; Ulgut, B. Characterization of Different Electrolyte Composition Lithium Thionyl Chloride Reserve Battery by Electrochemical Impedance Spectroscopy. J. Electrochem. Soc. 2021, 168, 050529. [Google Scholar] [CrossRef]
- Meddings, N.; Heinrich, M.; Overney, F.; Lee, J.-S.; Ruiz, V.; Napolitano, E.; Seitz, S.; Hinds, G.; Raccichini, R.; Gaberšček, M.; et al. Applibation of electrochemical impedance spectroscopy to commercial Li-ion cells: A review. J. Power Sources 2020, 480, 228742. [Google Scholar] [CrossRef]
- Ezpeleta, I.; Freire, L.; Mateo-Mateo, C.; Novoa, X.R.; Pintos, A.; Valverde-Perez, S. Characterisation of Commercial Li-Ion Batteries Using Electrochemical Impedance Spectroscopy. ChemistrySelect 2022, 7, e202104464. [Google Scholar] [CrossRef]
- Cossolia, P.; Veraa, L.; Bussoa, A. Test bench for the characterization of batteries for use in SAPS. Energy Procedia 2014, 57, 763–772. [Google Scholar] [CrossRef]
- Darikas, G.; Barai, A.; Sheikh, M.; Miller, P.; Amor-Segan, M.; Greenwood, D. ECS Meeting Abstracts, Impact of Relaxation Time on the Accelerated Cycle Ageing Tests of Lithium-Ion Batteries. In Electrochemical Society Meeting Abstracts 242; The Electrochemical Society, Inc.: Pennington, NJ, USA, 2022. [Google Scholar]
- Bruj, O.; Calborean, A. EIS Ageing Prediction of Lithium-Ion Batteries Depending on Charge Rates. Batteries 2024, 10, 247. [Google Scholar] [CrossRef]
- Weber, R.; Louli, A.J.; Plucknett, K.P.; Dahn, J.R. Resistance Growth in Lithium-Ion Pouch Cells with LiNi0.80Co0.15Al0.05O2 Positive Electrodes and Proposed Mechanism for Voltage Dependent Charge-Transfer Resistance. J. Eelectrochemical Soc. 2019, 166, A1779–A1784. [Google Scholar] [CrossRef]
- Li, Y.; Luo, L.; Zhang, C.; Liu, H. State of Health Assessment for Lithium-Ion Batteries Using Incremental Energy Analysis and Bidirectional Long Short-Term Memory. World Electr. Veh. J. 2023, 14, 188. [Google Scholar] [CrossRef]
- Sanyo Lithium Ion Battery Specification. Available online: https://www.dnkpower.com/wp-content/uploads/2022/08/NCR18650B-datasheet.pdf (accessed on 23 February 2025).
- Keil, P.; Jossen, A. Charging protocols for lithium-ion batteries and their impact on cycle life—An experimental study with different 18650 high-power cells. J. Energy Storage 2016, 6, 125–141. [Google Scholar] [CrossRef]


| Rated Capacity at 25 °C | 3200 mAh |
| Nominal Capacity at 25 °C | 3250 mAh |
| Nominal Voltage | 3.6 V |
| Internal Resistance | ~50 mΩ |
| Charging Method | CC-CV |
| Charging Current | 1625 mA |
| Charging Voltage | 4.2 V |
| Charging Time | 2 h |
| Cathode Material | Nickel Oxide |
| Battery | Rel-New [Ω] | Rel-Aged [Ω] | ΔRel [Ω] | Rct-New [Ω] | Rct-Aged [Ω] |
|---|---|---|---|---|---|
| Batt.1 | 0.098 | 0.165 | 0.067 | 0.022 | 0.071 |
| Batt.2 | 0.107 | 0.114 | 0.007 | 0.016 | 0.022 |
| Batt.3 | 0.084 | 0.088 | 0.004 | 0.011 | 0.012 |
Disclaimer/Publisher’s Note: The statements, opinions and data contained in all publications are solely those of the individual author(s) and contributor(s) and not of MDPI and/or the editor(s). MDPI and/or the editor(s) disclaim responsibility for any injury to people or property resulting from any ideas, methods, instructions or products referred to in the content. |
© 2025 by the authors. Licensee MDPI, Basel, Switzerland. This article is an open access article distributed under the terms and conditions of the Creative Commons Attribution (CC BY) license (https://creativecommons.org/licenses/by/4.0/).
Share and Cite
Bruj, O.; Calborean, A. Electrochemical Impedance Spectroscopy Investigation on the Charge–Discharge Cycle Life Performance of Lithium-Ion Batteries. Energies 2025, 18, 1324. https://doi.org/10.3390/en18061324
Bruj O, Calborean A. Electrochemical Impedance Spectroscopy Investigation on the Charge–Discharge Cycle Life Performance of Lithium-Ion Batteries. Energies. 2025; 18(6):1324. https://doi.org/10.3390/en18061324
Chicago/Turabian StyleBruj, Olivia, and Adrian Calborean. 2025. "Electrochemical Impedance Spectroscopy Investigation on the Charge–Discharge Cycle Life Performance of Lithium-Ion Batteries" Energies 18, no. 6: 1324. https://doi.org/10.3390/en18061324
APA StyleBruj, O., & Calborean, A. (2025). Electrochemical Impedance Spectroscopy Investigation on the Charge–Discharge Cycle Life Performance of Lithium-Ion Batteries. Energies, 18(6), 1324. https://doi.org/10.3390/en18061324