Article

An Analysis to Identify the Key Factors in Power System Planning: The Case of Mexico

by
Ulises Hernandez-Hurtado
1,†,
Joselito Medina-Marín
1,†,
Juan Carlos Seck-Tuoh-Mora
1,*,†,
Norberto Hernández-Romero
1 and
Cecilia Martin-del-Campo
2
1
Área Académica de Ingeniería y Arquitectura, Instituto de Ciencias Básicas e Ingeniería, Universidad Autónoma del Estado de Hidalgo, Carr. Pachuca-Tulancingo km. 4.5, Pachuca 42184, Hidalgo, Mexico
2
Facultad de Ingeniería, Universidad Nacional Autónoma de México, Ciudad Universitaria, Ciudad de México 04510, Mexico
*
Author to whom correspondence should be addressed.
These authors contributed equally to this work.
Energies 2025, 18(6), 1316; https://doi.org/10.3390/en18061316
Submission received: 27 January 2025 / Revised: 27 February 2025 / Accepted: 3 March 2025 / Published: 7 March 2025

Abstract

:
COP21 represents a starting point for several nations to develop and implement energy transition strategies to face and mitigate climate change, making the electrical power sector crucial in achieving the established goals and commitments. This research presents an analysis to identify the key factors in power system planning by integrating an economic dispatch model (ED) based on linear programming to determine vulnerable aspects of power generation and transmission in strategic planning scenarios that could jeopardize the country’s energy transition. The analysis is illustrated through a case study of the Mexican Electrical Power System (SEN) during the year 2025. The case study shows that the reserve margin fluctuated due to the variable renewable energy installed despite having a vast installed capacity to supply the country’s total demand. In addition, the results showed that most of the transmission lines had a congestion frequency higher than 90% of their capacity during most of the year. Two regions were identified as the best options for reducing greenhouse gas emissions by installing new power plants. Finally, most technologies reflected an under-generation, suggesting high dependence on some fuels to supply the Mexican demand. The model’s programming is freely available in GitHub.

1. Introduction

Climate change, a phenomenon that demands the collective attention of all governments, has seen the mean temperature of the air on the land increase by 1.53 °C from 1850–1900 to 2006–2015 [1]. Collective concern has spurred the study of various adaptation policies and programs, a collaborative effort aimed at reducing the exposure and vulnerability of natural and human systems to potential changes in different regions and sectors [2,3,4,5,6]. This collaborative spirit also drives the search for strategies to adapt to new climatological and environmental conditions [7,8,9,10].
Some policies seek to mitigate climate change by increasing carbon dioxide sinks or reducing emissions. In the latter case, COP21 represents a starting point for several nations to develop an energy transition program and define specific goals for 2030 [11,12,13,14,15]. However, achieving the transition has become a complicated problem to address. Strategies have yet to be deployed as expected due to unforeseen situations with global repercussions such as the COVID-19 pandemic or the recent conflict between Ukraine and Russia [16,17,18,19]. These facts have led governments worldwide to search for strategies that contemplate possible geopolitical, economic, energy, and climate changes in the short, medium, and long term [20,21,22,23].
Mexico is one of the countries that seek to reduce their greenhouse gas emissions in the short, medium, and long term, committing to reduce emissions by 22% by 2030, equivalent to 211 million tons of CO2, during the Paris climate conference [24]. The electricity and transportation sectors should offer the most significant contribution to reducing emissions, as together they generate approximately 50% of total country emissions according to the 2015 National Emission Inventory prepared by the National Institute of Ecology and Climate Change (INECC) [25].
The main way to reduce emissions in the transport sector is to increase the use of electric cars, which transfers car emissions to the electric power sector. Hence, developing strategies to decarbonize the latter provides a double benefit in achieving energy transition and facing climate change. In addition, the Mexican government has other national climate commitments that strengthen the need to carry out the country’s energy transition, such as the National Law on Climate Change that establishes a 50% reduction in total national emissions by 2050 with respect to emissions in 2000 [26], or the Energy Transition Law that includes as a goal a minimum annual contribution to clean energy generation of 35% by 2024 [27].
With the publication of the Electricity Industry Law, the Mexican Ministry of Energy (SENER) obtained the power to lead the planning process of the National Power System (SEN), preparing the National Electric System Development Program (PRODESEN) as the primary planning instrument of the SEN regarding generation, transmission, and distribution activities [28]. Among the most relevant information contained in this document is the Indicative Program for the Installation and Retirement of Power Plants (PIIRCE), the regional annual generation of previous years and fuel price forecasts, making it very attractive to study the strategies that the Mexican government has contemplated to address the energy transition or the increase in energy demand.
A wide variety of research suggests concrete actions for decarbonizing the SEN. Vera et al. [29] identify the consequences of the growing natural gas share in Mexican electricity production and the policy alternatives to change the current trend toward dependence on natural gas for electricity production. Diezmartínez [30] uses a comparative policy analysis to study the regulatory frameworks and policy strategies pursued in Mexico, the US, and Germany to advance the deployment of energy storage. Lüpke [31] applies concepts of climate policy integration to analyze whether integration between the policy subsystems of energy and climate change occurred in Mexico in terms of political discourse and negotiation, policy goals and instruments, and implementation, as well as the factors at work that lead to climate policy integration. Castrejon-Campos [32] describes the evolution of clean energy technologies in Mexico using a multi-perspective analytical framework. Serrano-Arévalo et al. [33] propose an approach for sustainable power sector transition planning by developing deep learning models (LSTM and GRU) for energy demand forecasting and a mathematical formulation for meeting demand over a planning horizon based on a set of conventional and clean installed power plants as well as new technologies that need to be installed in the future. Bonacloche et al. [34] assess Mexico’s green investments for 2018–2030 in terms of value-added, employment, materials, land use, water, and CO2eq emissions in a multiregional input–output framework and compare the results with the IRENA proposal. Mercado et al. [35] employ a bottom–up electric power system model to identify critical geographic areas of investment for installed capacity and transmission that are robust across a set of Integrated Assessment Model-derived climate mitigation pathways.
However, it is essential to consider what is mentioned by Gu et al. [36], who examine the factors influencing the Southeast Asian power systems through a SWOT analysis. The study shows that the transition to low-carbon power infrastructure faces many constraints, such as the lack of ambitious renewable energy goals, abundant fossil fuels, underdeveloped grid infrastructure, an uncompetitive power regime, high fossil fuel subsidies, insufficient financial support, and low environmental standards for the power sector.
Robust mathematical and computational models are required to analyze the constraints of a power system. These models identify critical and vulnerable elements in deploying actions to achieve the desired objectives. Much relevant research has been carried out in the study of the development of decarbonization strategies using mathematical models and computations. These include planning the expansion of electrical networks and the economic dispatch of energy and obtaining valuable results for government and company decision-making. Some examples link models to address some of these challenges. Almalaq et al. [37] propose a stochastic power system planning model to increase the hosting capacity of networks and satisfy future load demands. The model is formulated to consider the number and size of installed generation and transmission expansion projects rather than the investment cost without violating operating and reliability constraints. Zhou et al. [38] propose a new capacity expansion planning method for wind power and energy storage considering power systems’ actual multistage operation process. In particular, the hourly robust transmission constrained unit commitment and economic dispatch are involved in this planning method. Thus, it can accurately evaluate the operational cost under certain planning decisions. He et al. [39] propose an economic dispatch model for multi-area integrated electricity and natural gas systems considering tie-line congestion, maximum allowable emission bounds, and hourly spinning reserve constraints. Deng et al. [40] point out that focusing on short-term system operations in the planning models integrating variable renewables is increasingly important, especially the constraints of flexible generation, interregional transmission, energy storage, and demand side response. Wang et al. [41] propose a novel modeling framework to guide the representation of concentrating solar power in different planning and operation scenarios and offer a theoretical foundation for the integration and large-scale deployment of concentrating solar power within the grid. Maulén et al. [42] present a novel long-term model for the joint expansion planning of power and hydrogen systems with short-term operational considerations. It was observed that the proposed methodology generates an investment plan that achieves a lower total cost compared to other methodologies. Cho et al. [43] show a new optimization model and algorithm for long-term capacity expansion planning of reliable power generation systems. The model optimizes both investment decisions and hourly operation decisions. The proposed algorithm was computationally efficient for solving large-scale problems with millions of variables and constraints through long-term planning case studies. Huanca et al. [44] present a modeling and solution approach to the static and multistage transmission network expansion planning problem considering series capacitive compensation and active power losses formulated as a mixed integer nonlinear programming problem.
In Mexico, developing energy policy commitments involves a technical, economic, and environmental evaluation of the scenarios outlined in PRODESEN. Currently, these scenarios utilize medium-term study horizons and annual, non-regionalized data. However, this approach lacks specific details, such as regional hourly energy shortages caused by the growing presence of intermittent renewable energy sources, hours of congestion in the transmission network, the performance of regional reserve margins, critical locations for power plant installations that could significantly help reduce emissions, and technologies with varying capacity factors.
There are numerous opportunities to achieve the country’s energy supply and decarbonization goals based on this information. Therefore, additional research is needed to evaluate the strategies and scenarios for the energy transition within the SEN. This research should focus on specifying, modifying, and programming new mathematical models to include additional variables and datasets and to develop scenarios with more precise input information and results. These models must provide detailed insights to support decision-making, enhance existing models, and expand the information covered by PRODESEN.
This article introduces a robust analysis to identify key factors in the power system planning by integrating an ED based on linear programming. The primary objective of this analysis is to determine the level of energy shortage, congestion of transmission networks, and regions for installing new power plants. By leveraging the base information of two planning scenarios proposed in the PRODESEN, this analysis considers several factors such as generation–consumption regions, maximum transmission capacity, hourly availability factors, and annual regional demand by hour.
The significant contributions of this paper are listed below.
  • The analysis integrates elements to obtain energy shortage, congestion in transmission network, regional reserve margin performance, power plant installation regions that could significantly impact emission reduction, and technologies with higher/lower plant factors.
  • Disaggregated data are included for different parameters such as generation cost, availability factors, or regional transmission capacity.
  • The case study demonstrates the importance of disaggregating data for the identification of vulnerabilities in decarbonization scenarios of a Power Electrical System.
  • The general ED is extended to consider the characteristics of the SEN using four sets of variables and parameters (technologies, generation regions, consumption regions, and time steps).
  • The model programming runs under the open-source Python Optimization Modeling (PYOMO) platform, which is freely available in the repository https://github.com/IhanKaydarin/Multi-regional-time-step-and-technology-economic-dispatch, accessed on 30 September 2024.
The remainder of the paper is structured as follows: Section 2 contains the methodology to analyze an ED; Section 3 presents a case study with the SEN in Mexico; Section 4 shows and discusses the results of the case study; Section 5 provides the conclusions, limitations, and future research. Finally, Appendix A presents the terms used for the mathematical model.

2. Methodology

Climate policies, such as emissions targets and renewable energy mandates, promote the integration of clean energy sources, reduce the dependency on fossil fuels, and encourage technological innovation. In response, power system planning incorporates strategies like integrated resource planning, scenario analysis, and capacity expansion to meet these objectives while ensuring reliability, affordability, and resilience. In this way, climate policies and power system planning methodologies are closely linked, as these policies establish the goals and constraints that shape the design and improvement of power systems. This approach is essential for supporting decarbonization, complying with regulations, and addressing the challenges posed by climate change.
This paper addresses the problem of improving decision-making in energy transition strategies by determining parameters that restrict the deployment of decarbonization strategies in SENER’s scenarios through an analysis that integrates a model that simulates the hourly dispatch in the different control regions of the country.
The parameters to be determined are the regional hourly energy shortages to show the most critical hours and the lack of installed capacity to supply demand, hours of congestion in the power grid to identify vulnerable consumption regions, the performance of the reserve margin to warn of the low diversification of installed capacity, regions with higher potential to install new power plants to reduce emissions, and technologies with the highest/lowest capacity factor to point out crucial power plants.
The proposed analysis consists of 5 steps, which are shown below.
  • Characterization of electrical power system;
  • Mathematical modeling;
  • Data collection;
  • Model programming;
  • Identification of vulnerabilities.

2.1. Characterization of Electrical Power System

The first step in characterizing the electrical power system is to select and determine the parameters necessary to simulate the dispatch. The number of parameters corresponds to the extension of the model to be developed, the available information, and the computing power, since the number of parameters required is proportional to the number of combinations among the generation and consumption regions, technologies, and time steps considered. When modeling annual dispatch, time steps of 1 h, 24 h, or 168 h can be chosen. It is essential to note that smaller time steps determine vulnerabilities with greater precision.

2.2. Mathematical Modeling

Mathematical modeling of the electrical power system is fundamental to obtaining the desired results, that is, to determining the vulnerabilities of an energy transition scenario. A model based on linear programming is proposed to simulate economic dispatch [45,46,47]. Economic dispatch models present several advantages over other alternatives, such as their simplicity, computational efficiency, transparency, and proven reliability. They are cost-effective, easy to integrate with existing systems, and align well with traditional regulatory frameworks, unlike stochastic or dynamic optimization approaches. Although they have limitations in managing uncertainty and complexity, economic dispatch remains a trusted and practical tool for power system planning [48].
Describing the assumptions considered in the model’s development that support understanding the model’s scope and possible improvements is essential.

2.2.1. Assumptions

The first step in constructing the mathematical model is to identify the key assumptions that need to be considered. To ensure a realistic approximation of these parameters, specific values can be obtained from official online sources provided by relevant government agencies, as presented in this study. The base information used to determine the projections of fuel costs, demand, availability factors, installed capacity, and transmission capacity in this study was obtained from freely accessible official documents published by SENER [49,50,51,52].

2.2.2. Objective Function

The model’s objective function seeks to minimize the total cost of dispatching the energy requested by the different consumption regions in each time step. The total price is calculated by adding the result of the multiplication between the decision variable x i , g , c , t , and the parameter c i , g , c , t through the different sets, as shown in Equation (1).
T o t a l C o s t = t T c C g G i I x i , g , c , t c i , g , c , t
where Total Cost (USD) is the total cost of energy dispatch for the SEN during one year, x i , g , c , t (MWh) represents the energy that technology i installed in generation region g sends to consumption region c during hour t. The parameter c i , g , c , t (USD/MWh) is the generation cost of technology i installed in the generation region g to send electricity to the consumption region c during hour t.

2.2.3. Restrictions

The first restriction is shown in Equation (2), which represents the balance of energy production and demand. The sum of the variable x i , g , c , t (MWh) through Sets I and G denotes the total energy produced in each region of the SEN for each hour. The parameter D c , t (MWh) is the energy demand in each region of the SEN for each hour.
g G i I x i , g , c , t = D c , t c C , t T
The second restriction is illustrated in Equation (3), which denotes the maximum amount of energy that each technology can produce based on its installed capacity, its type of technology, and the region to which it belongs. In this case, the summation of variable x i , g , c , t (MWh) through Set C expresses the total energy generated by each technology in each region for each hour, and parameter f d i , g , t (fraction) represents the availability factor of each technology in each generation region for each hour. Parameter F i , g (MW) is the installed capacity of each technology in each generation region.
c C x i , g , c , t f d i , g , t F i , g i I , g G , t T
Equation (4) delimits the maximum transmission capacity between the different regions. The sum of the variables x i , g , c , t (MWh) through Set I indicates the electricity produced by each generation region transmitted to each consumption region during each hour. This result must be less than or equal to the value of parameter M C T g , c (MWh), which represents the maximum capacity that each link can transmit between each region.
i I x i , g , c , t M C T g , c g G , c C , t T
Finally, Equation (5) represents the results of the energy generation variable x i , g , c , t (MWh) in exclusively positive values.
x i , g , c , t 0

2.3. Data Collection

This step is one of the most complicated, mainly due to the divergence of values between the information that can be accessed from different sources for specific parameters. Obtaining data is an element that determines modeling of the electrical power system and precision of the results. It is recommended that official reports be used to provide greater precision and value reliability.

2.4. Model Programming

Once the mathematical model is developed and the data for the different parameters are available, the model must be programmed. It is necessary to employ a specialized program that uses advanced algorithms with the capacity to handle a large number of equations, decision variables, and values. Different software such as the General Algebraic Modeling System (DAMS), Python Optimization Modeling Objects (PYOMO), GUROBI, or MATLAB can be used. Each software has advantages and disadvantages that must be considered to make the best choice.

2.5. Identification of Vulnerabilities

The identification of vulnerabilities consists of analyzing the meaning of the values obtained for the aspects shown below.
  • Hourly energy shortage: If any restrictions are unmet, they can be determined. There are diverse reasons why this situation could occur, such as the low availability of intermittent technologies, congestion or limited transmission capacity, or the region’s lack of self-supply capacity. However, it is possible to overcome this inconvenience by proposing an additional technology with the highest generation cost so that when it is dispatched, the quantity, hours, and region of missing energy can be known.
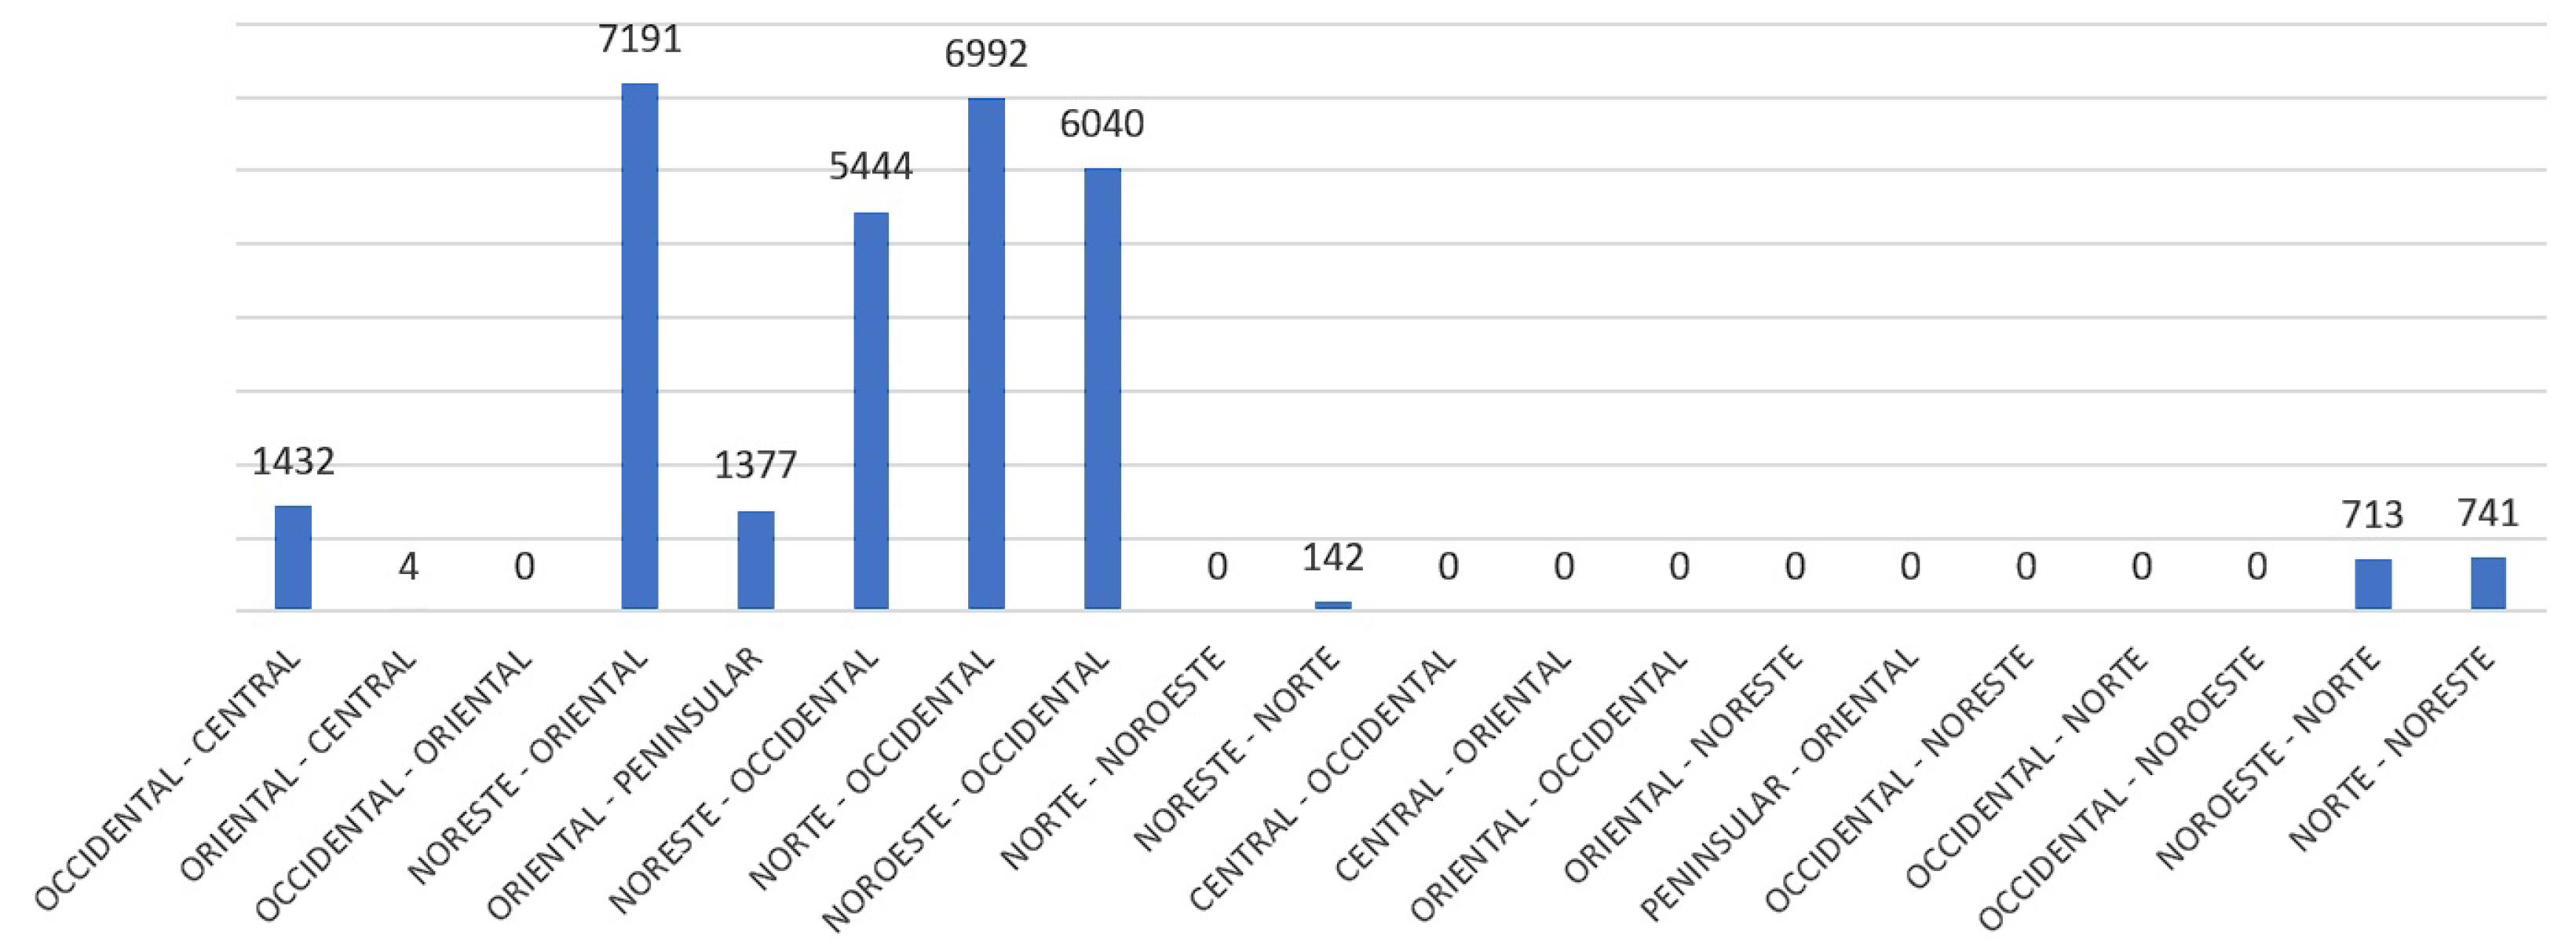
  • Hours of congestion on transmission lines: This aspect is obtained by counting the hours in which the energy transmitted from one region to another is equal to or greater than 90% of the link capacity. This calculation is shown in Equation (6).
    i I x i , g , c , t M C T g , c g G , c C , t T
    The links with the highest number of hours of congestion represent the regions with the most significant external power dependence, high potential to increase the national transmission network, and areas of opportunity to reduce generation costs.
  • Regional reserve margin performance: This factor identifies the regions vulnerable to changes in the generation availability of the power units installed in the region. In addition, those regions that meet the indicative values established in the reliability policy are identified. The regional reserve margin is determined through Equation (7):
    R e g i o n a l R e s e r v e M a r g i n t = g G i I f d i , g , t F i , g c C g G i I x i , g , c , t t T
  • Regions that can install power plants that could significantly reduce emissions must be identified: The plants with the highest emission factor and the highest generation must be identified. However, it is essential to remember that proposing to install a new plant with a low emission factor requires a more exhaustive analysis than those described in this research.
  • Technologies with a higher/lower capacity factor: This parameter provides valuable information on the units essential for energy supply and the underutilized plants.
The following chapter presents a case study with the SEN in which the methodology described above is applied.

3. Case Study

3.1. Characterization of SEN

For the SEN case, 13 different power plant technologies were considered: thermoelectric, combined cycle, coal-fired, turbogas, internal combustion, fluidized bed, hydroelectric, wind, geothermal, solar, bioenergy, cogeneration, and nuclear. Regarding regionalization and transmission lines, information from PRODESEN was used (Figure 1), where nine generation regions and nine consumption regions were considered, having the exact location and name, which are Central, Oriental, Occidental, Noroeste, Norte, Noreste, Peninsular, Baja California (BC), and Baja California Sur (BCS). Likewise, Regions 1 to 7 are interconnected according to their geographic location. However, Regions 9 and 9 were isolated. Finally, 1 h time steps were used, totaling 8760 for the annual scenario.

3.2. Mathematical Modeling

3.2.1. Assumptions for SEN 2025

For the SEN 2025 scenario, the following assumptions were taken into account:
  • International interconnections were not considered.
  • Availability factors were averaged for thermoelectric, combined cycle, coal-fired, turbogas, internal combustion, fluidized bed, geothermal, bioenergy, cogeneration, and nuclear technologies.
  • The total installed capacity for each technology in each region was used.
  • The generation cost considers the levelized fuel cost, the regional increase in fuel costs, and the operation and maintenance cost.
  • Availability factors for thermal technologies were annual averages.
  • Seasons of unavailability due to preventive maintenance of the plants were not considered.

3.2.2. Objective Function of SEN 2025

According to Equation (1), the objective function for optimization in Equation (8) is the total cost of energy dispatch over one year (USD), considering 13 technologies, 9 generation regions, 9 consumption regions, and 8760 h:
T o t a l C o s t = t = 1 8760 c = 1 9 g = 1 9 t = 1 13 c i , g , c , t x i , g , c , t

3.2.3. Restrictions of SEN 2025

Below are the respective restrictions of the SEN 2025 case.
  • In agreement with Equation (2), the first restriction outlined in Equation (9) represents the balance between energy production and demand by consumption region. It assesses the total energy produced across the 9 generation regions using each of the 13 technologies. Parameter D c , t (MWh) denotes the energy demand in each region of the SEN for every hour:
    g = 1 9 i 13 x i , g , c , t = D c , t c C , t T
  • The restriction in Equation (10) is derived from Equation (3), which limits the maximum power generation (MWh) based on installed capacity, taking into account the availability factor of each technology in every generation region for each hour:
    c = 1 9 x i , g , c , t f d i , g , t F i , g i I , g G , t T
  • Equation (11) defines the maximum transmission capacity (MWh) between the 9 regions, as indicated by Equation (4). The electricity produced by each generation region and transmitted to each consumption region during each hour must not exceed the maximum capacity of the links connecting these 9 regions:
    i 13 x i , g , c , t M C T g , c g G , c C , t T
  • The final constraint in Equation (12) is based on Equation (5) and ensures no negative energy generation in each hour:
    x i , g , c , t 0
The mathematical equations were programmed using the Python 3.12.8 programming language through the PYOMO tool for mathematical modeling. PYOMO aims to provide a platform for specifying economic dispatch models that embody central ideas found in modern algebraic modeling language within a framework that promotes flexibility, extensibility, portability, openness, and maintainability [53].
The main advantage of using PYOMO is the simplicity of programming the definition of sets, parameters, decision variables, objective functions, and constraints. In addition, it is flexible enough to incorporate the use of different solvers easily. In this sense, by default, the solver included in PYOMO is “GLPK”. However, to solve the economic dispatch model for the SEN, the solver “CPLEX” was used. The code that includes the economic dispatch model was shared in the GitHub repository.

3.3. Data Collection

The information provided by the following official documents and platforms of the Mexican government was used: PRODESEN 2018–2032, PRODESEN 2019–2033, PRODESEN 2020–2034, PRODESEN 2021–2035, PRODESEN 2022–2036, Costos y Parámetros de Referencia 2021 (COPAR 2021), Programa de Ampliación y Modernización de la Red Nacional de Transmisión (PAMRNT), y Sistema de Información Energética (SIE-SENER). Information from various studies developed by the Faculty of Engineering of the National Autonomous University of Mexico (FI-UNAM) was also employed.
Table 1 shows the sets contemplated by each parameter and decision variable considered in the SEN dispatch model and the amount of data required and obtained in simulating the annual scenario.
Figure 2 shows the regional hourly demand values used to dispatch the SEN 2025 scenario. The hour of lowest coincident demand is number 8565 of the year, i.e., 9:00 pm on 22 December. On the other hand, the hour of highest coincident demand is number 4064, corresponding to 8:00 am on 18 June.

4. Results and Discussion

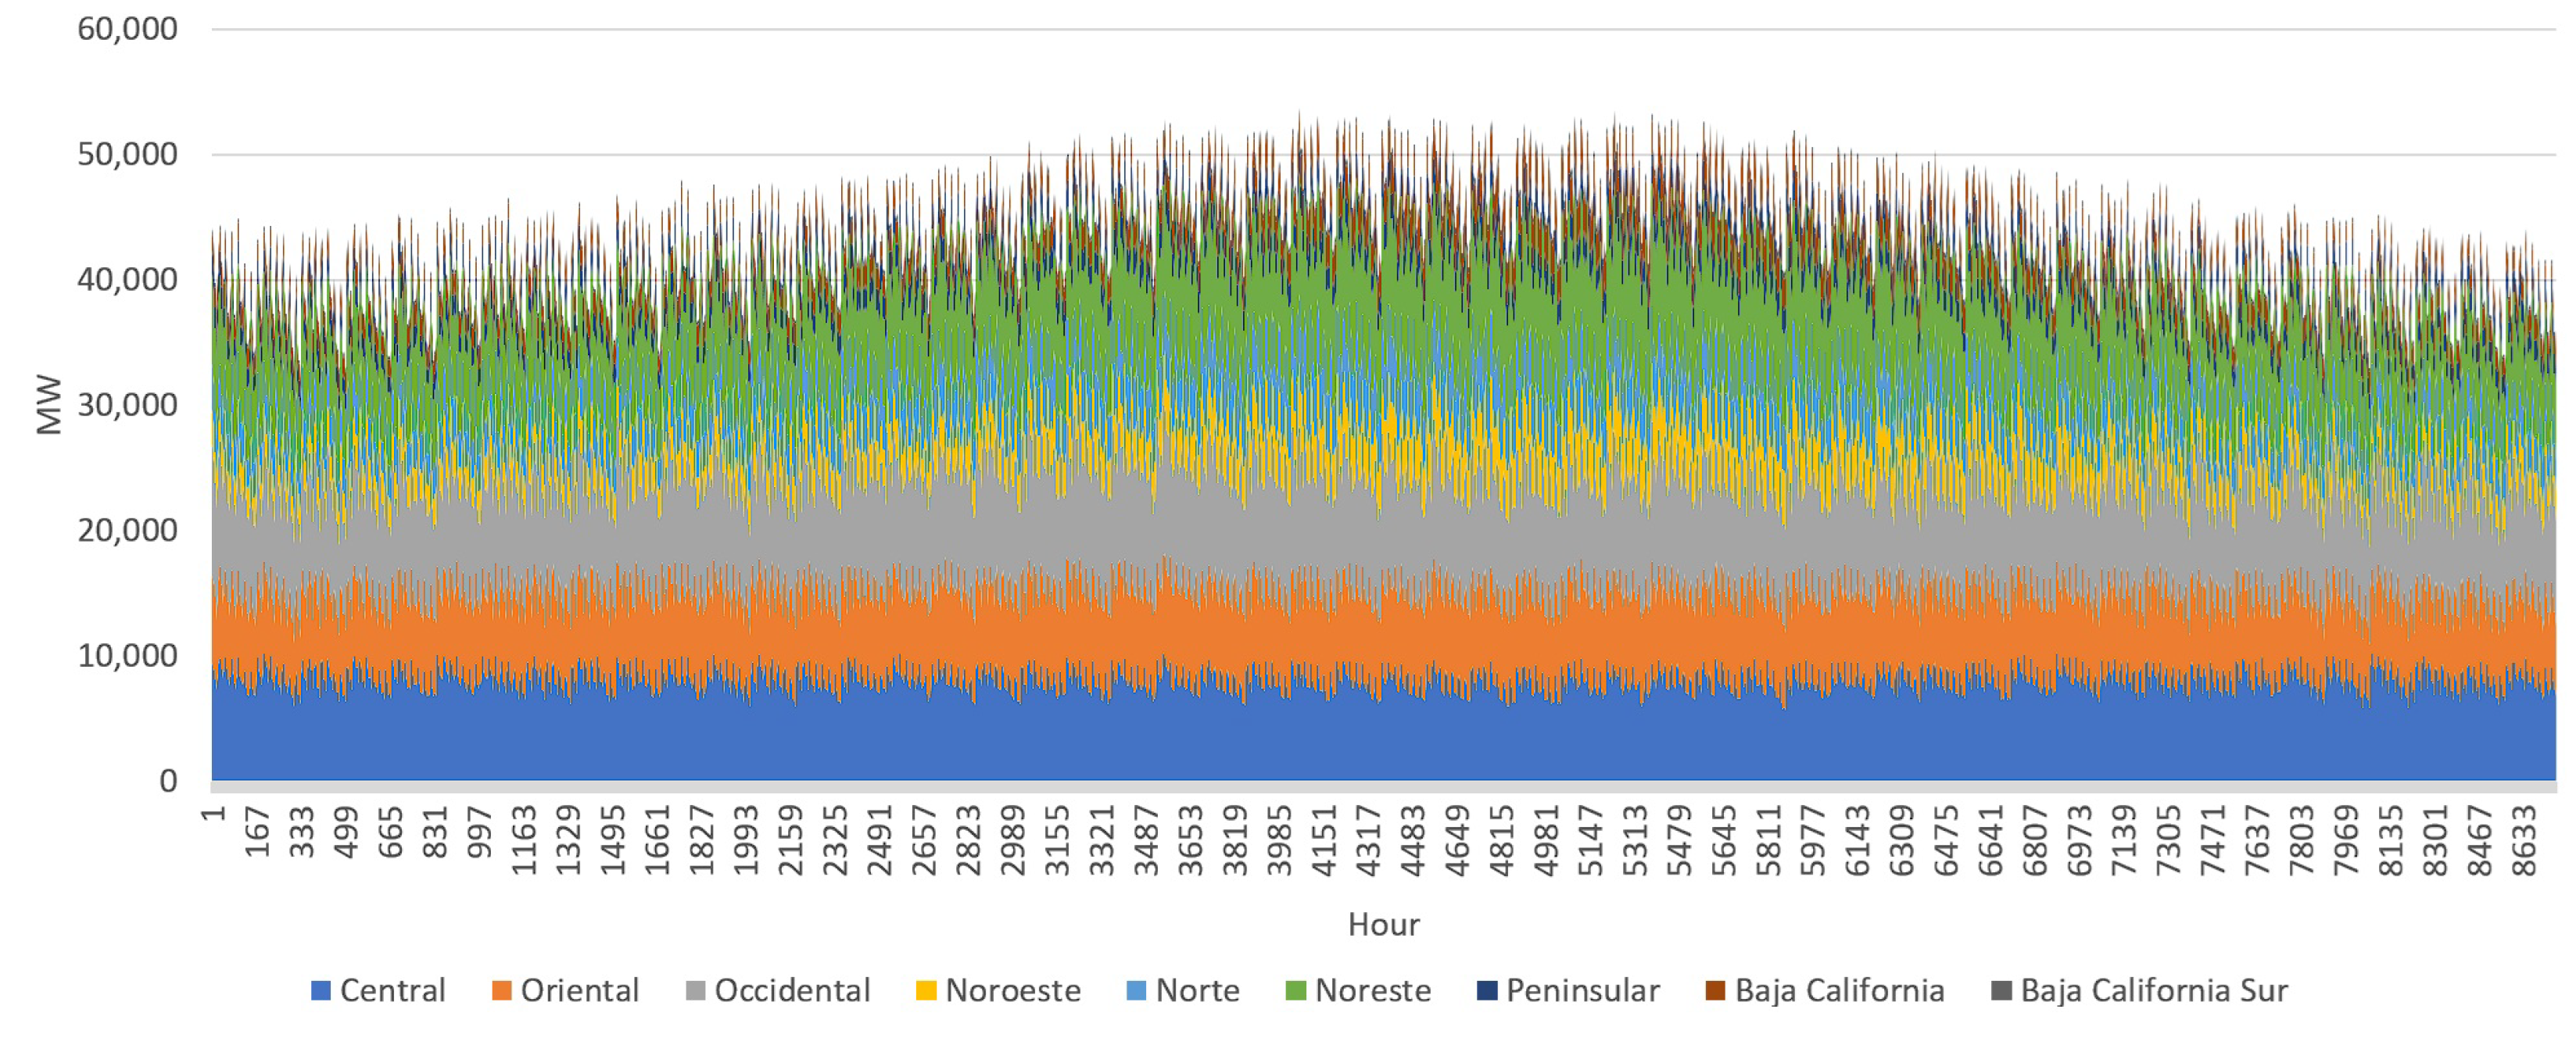
4.1. Results of SEN 2025

This section shows the results obtained by the SEN 2025 scenario to determine key aspects.

4.1.1. Hourly Energy Shortage

Figure 3 shows the hourly energy dispatch by technology in the SEN, in which there were no hours of energy shortage. However, a more detailed analysis of the results reveals that the minimum and maximum reserve capacities are 4643 and 48,461 MW, respectively, which indicates a high fluctuation in availability during critical hours by the most intermittent technologies and poor technology diversification in some regions. To prevent power shortages, the capacity of transmission lines or the power of firm capacity plants could be increased, and distributed generation could be encouraged. Knowing the other parameters calculated can offer greater solidity to these recommendations.

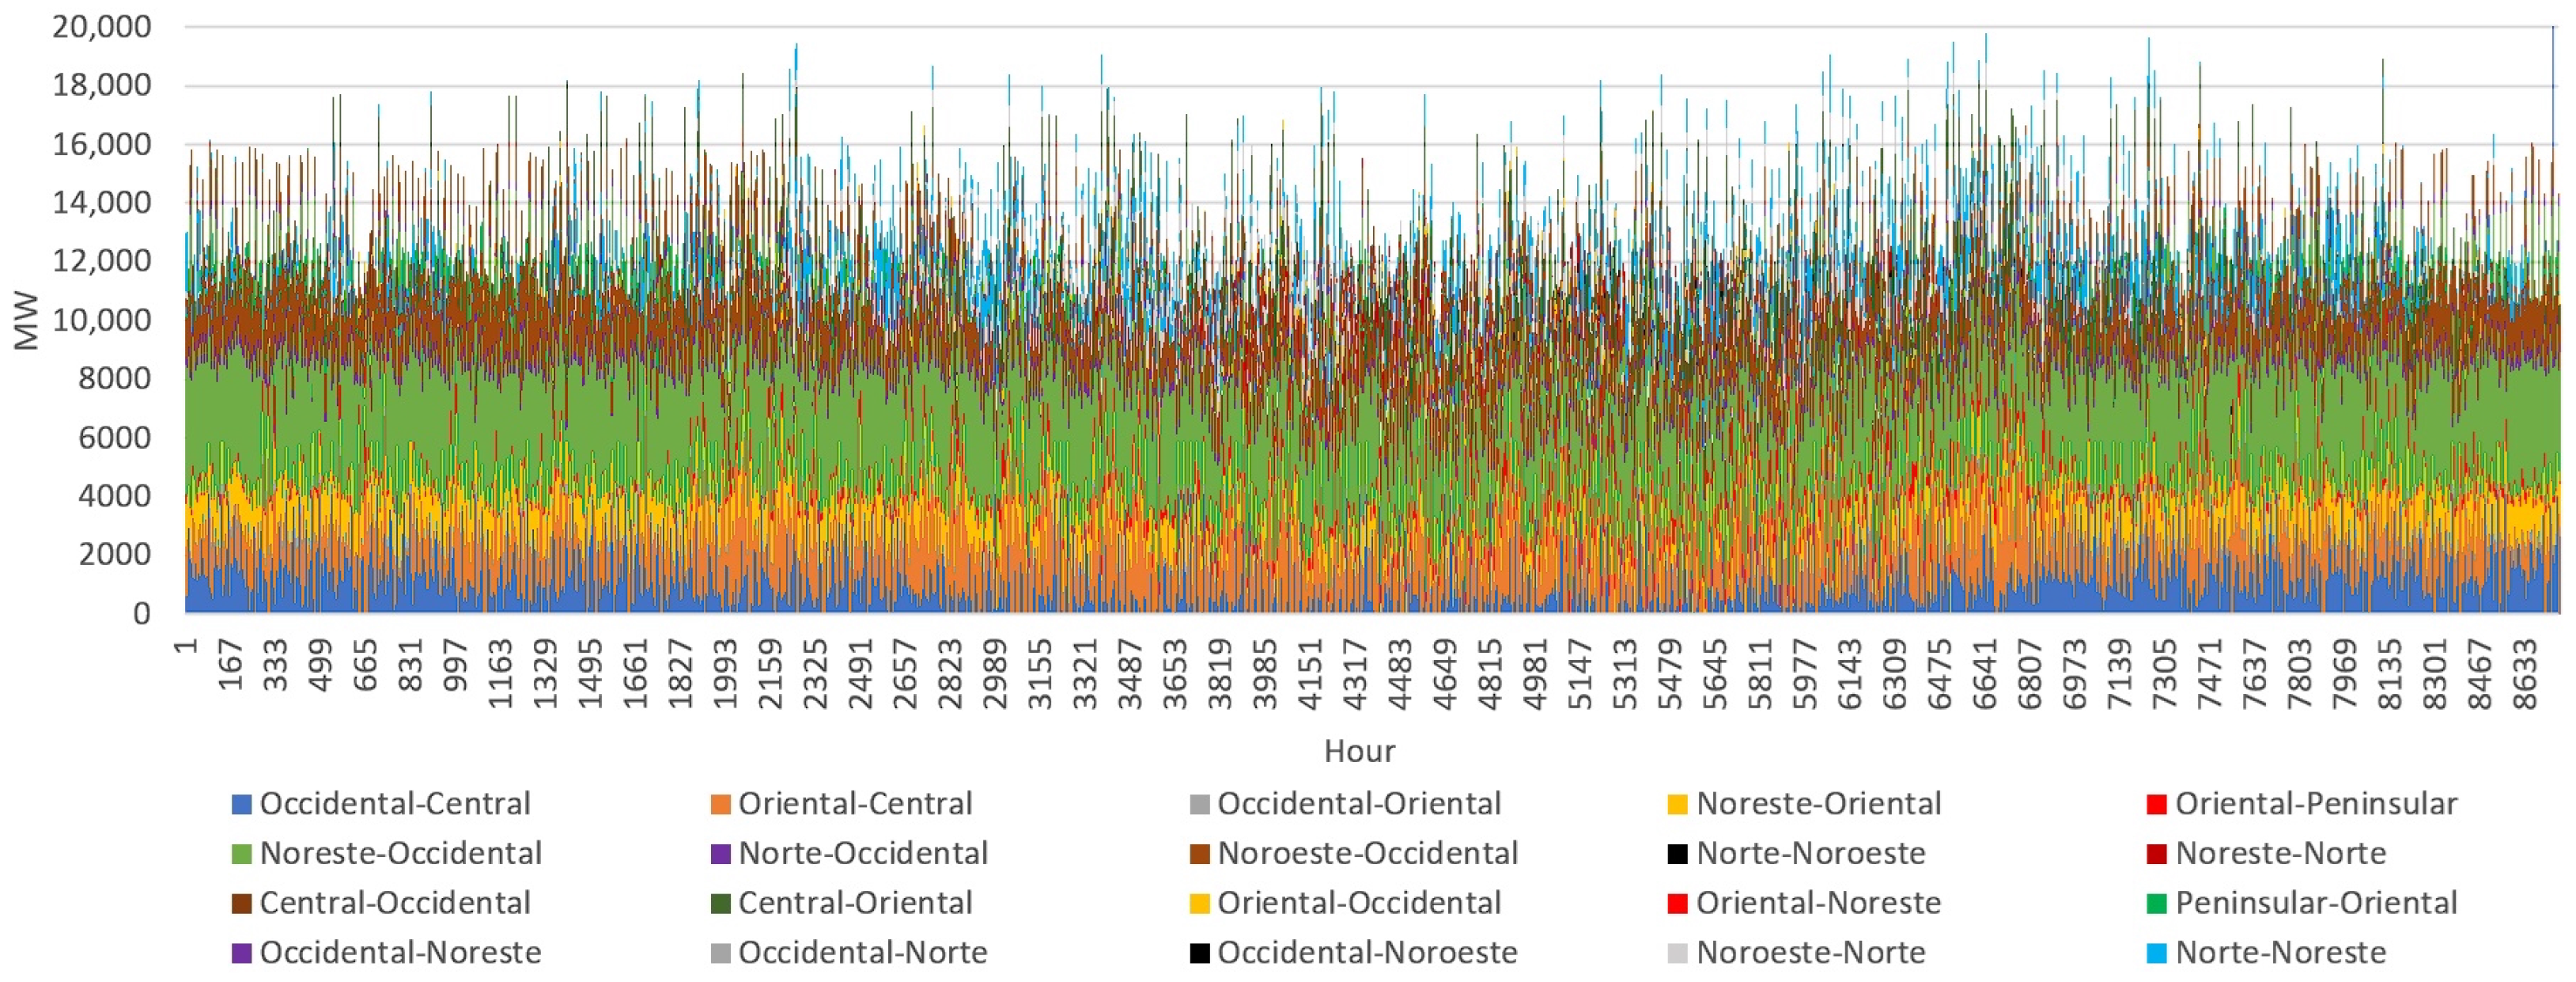
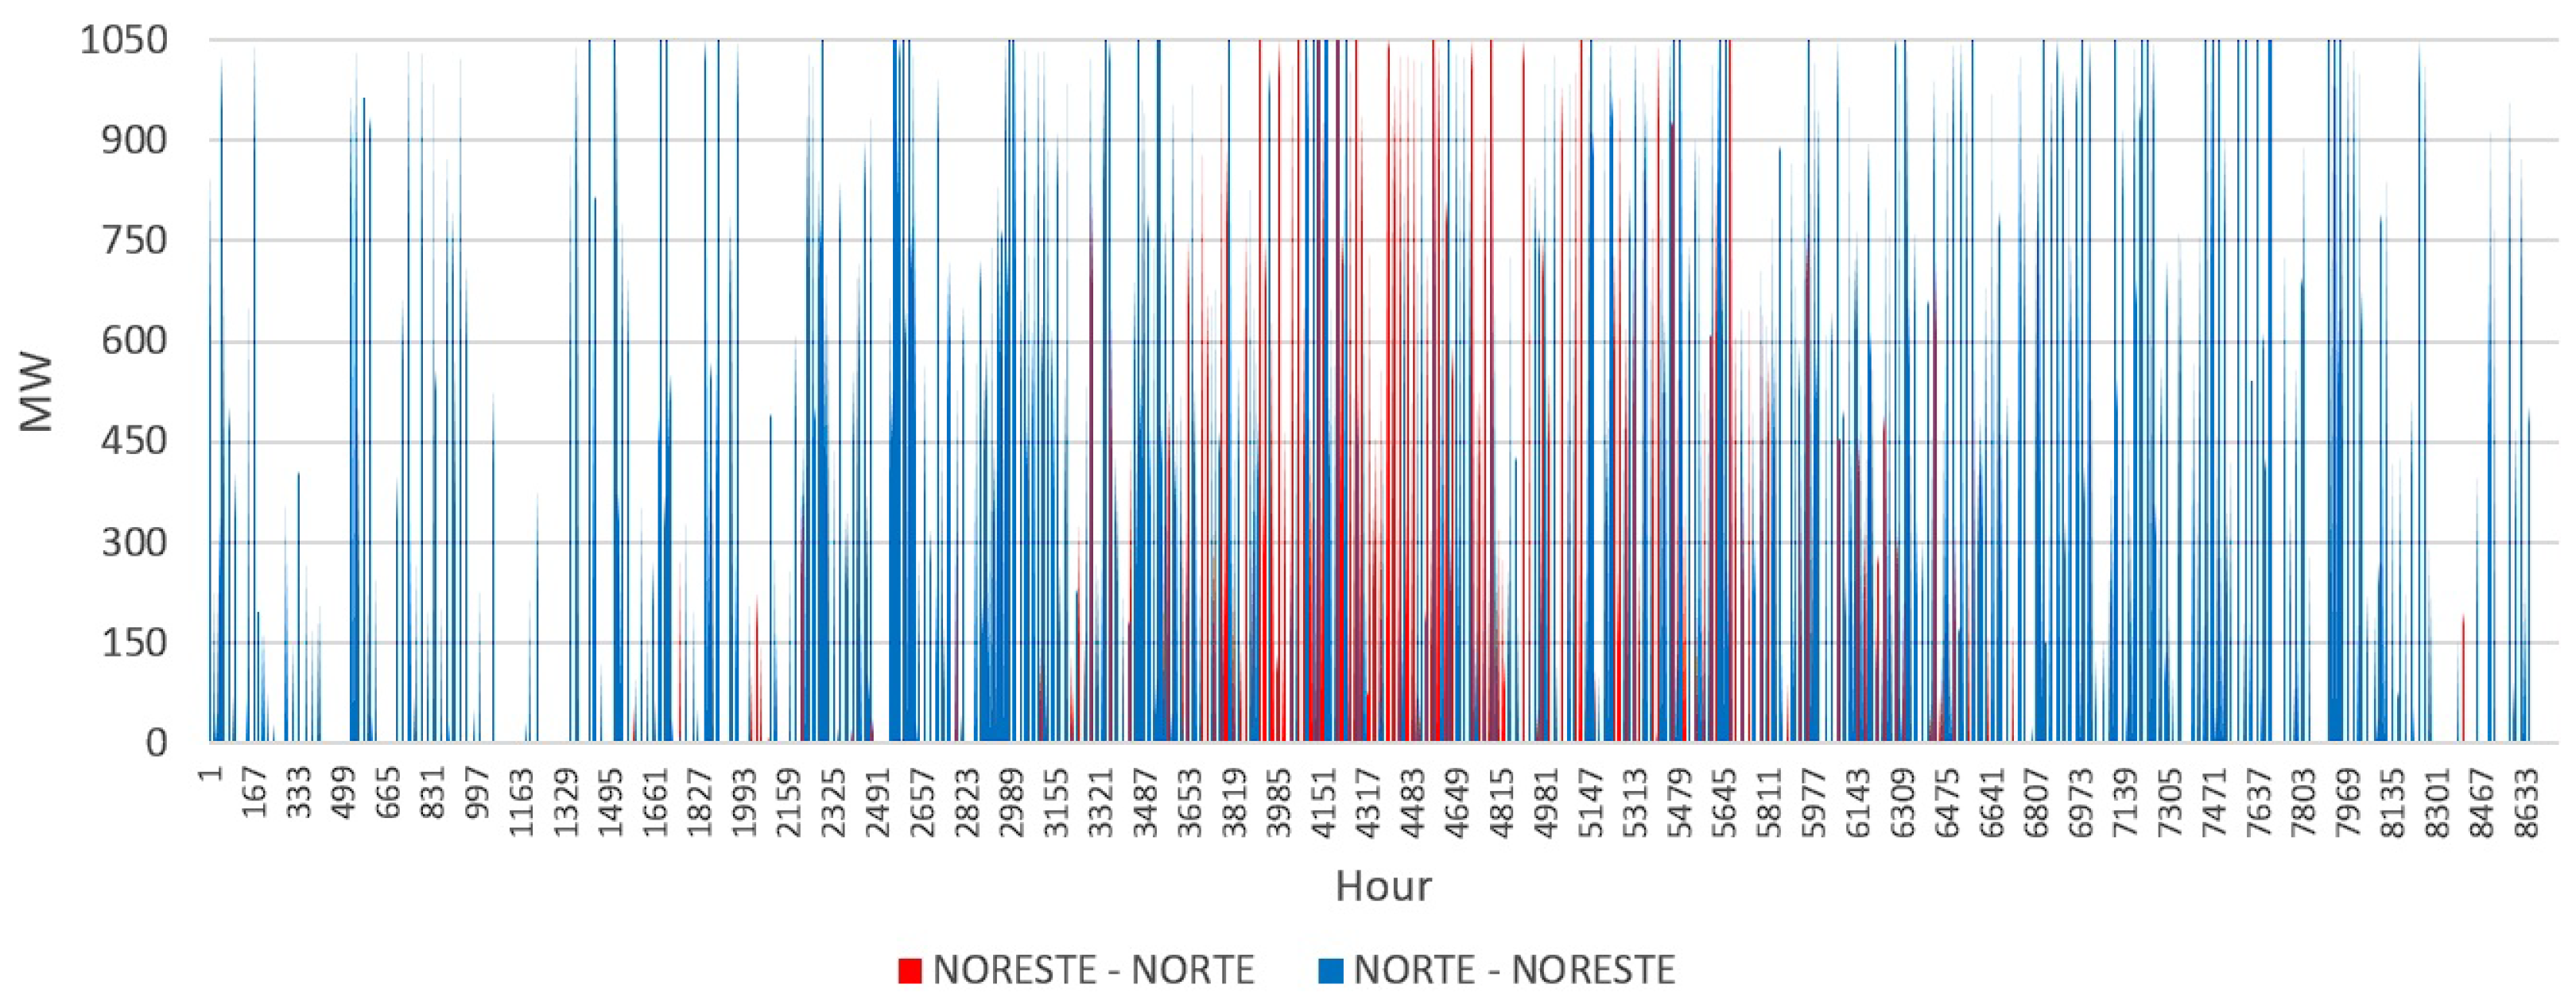
4.1.2. Hours of Congestion on Transmission Lines

Figure 4 illustrates the power transmitted between the different regions at each hour of the year for the SEN 2025 scenario, where the links with the highest energy exchanges and the flow direction can be observed, with the first name being the emitting region and the second the receiving region. In addition, this figure supports us in locating the regions with higher and lower concentrations of technologies with low generation costs. It should be noted that the extensive use of a transmission line does not mean that the receiving region is not self-sufficient, e.g., when analyzing the Noreste–Oriental link, we can observe that it maintains energy exchanges throughout the year, which could indicate that the Oriental region does not have sufficient self-supply capacity. Nevertheless, the Oriental–Central and Oriental–Peninsular links are also in constant use, with the Oriental region being the energy-emitting region.
The situation is described above because the aim is to carry out dispatch at minimum cost, so it was concluded that the Oriental region has technologies with lower generation costs than those installed in the Peninsular and Central regions. Therefore, more installed capacity is needed to meet demand at minimum costs than those installed in the Peninsular and Central regions. Similarly, more installed capacity is needed to supply demand at a minimum cost, so importing energy from the Noreste region is necessary.
On the other hand, the regions with the highest dependence on the RNT for the SEN 2025 scenario are Central and Occidental, which import around 48% and 55% of their annual demand, respectively. This demonstrates the importance of interconnection in the SEN to adequately address decarbonization and the increase in electricity demand as well as making more significant investments in transmission lines or increasing self-generation in regions with high energy imports.
To complement the information obtained from the results of the SEN 2025 scenario, Figure 5 illustrates the number of hours of congestion on each of the modeled transmission lines. In this case, the links with the highest congestion frequency are Noreste–Este, Norte–Occidental, Noroeste–Occidental, and Noreste–Occidental, which indicates which links could be an option to increase their transmission capacity.
Likewise, it is interesting to analyze the Noreste–Norte link, as it is one of the few links that presents bidirectional energy exchanges throughout the year, as illustrated in Figure 6. The change in flow direction in this link is due to the variation in wind energy generation in the Noreste region, which is exported to the Oriental region. In the event of a reduction in wind energy, this export is compensated by combined cycle technology.

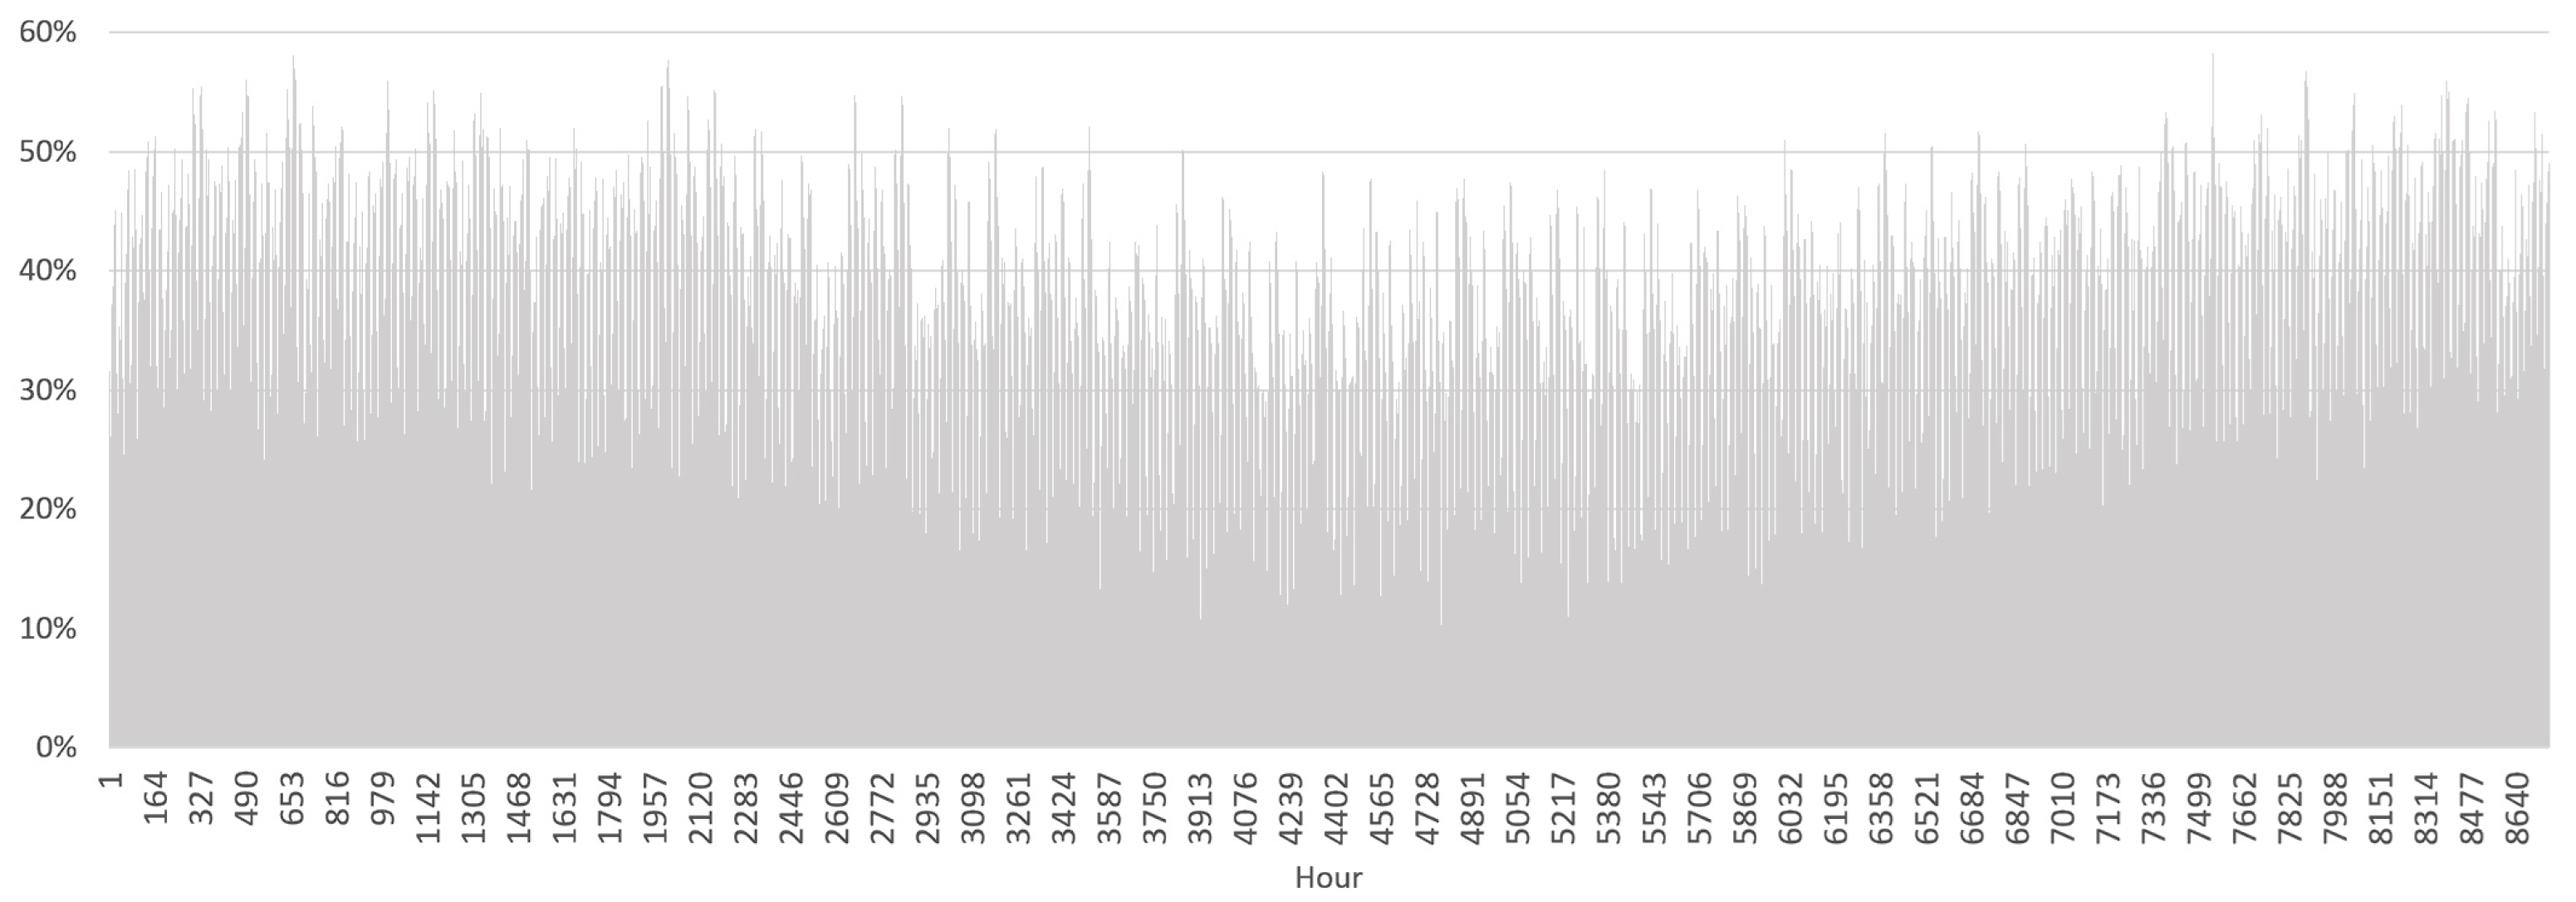
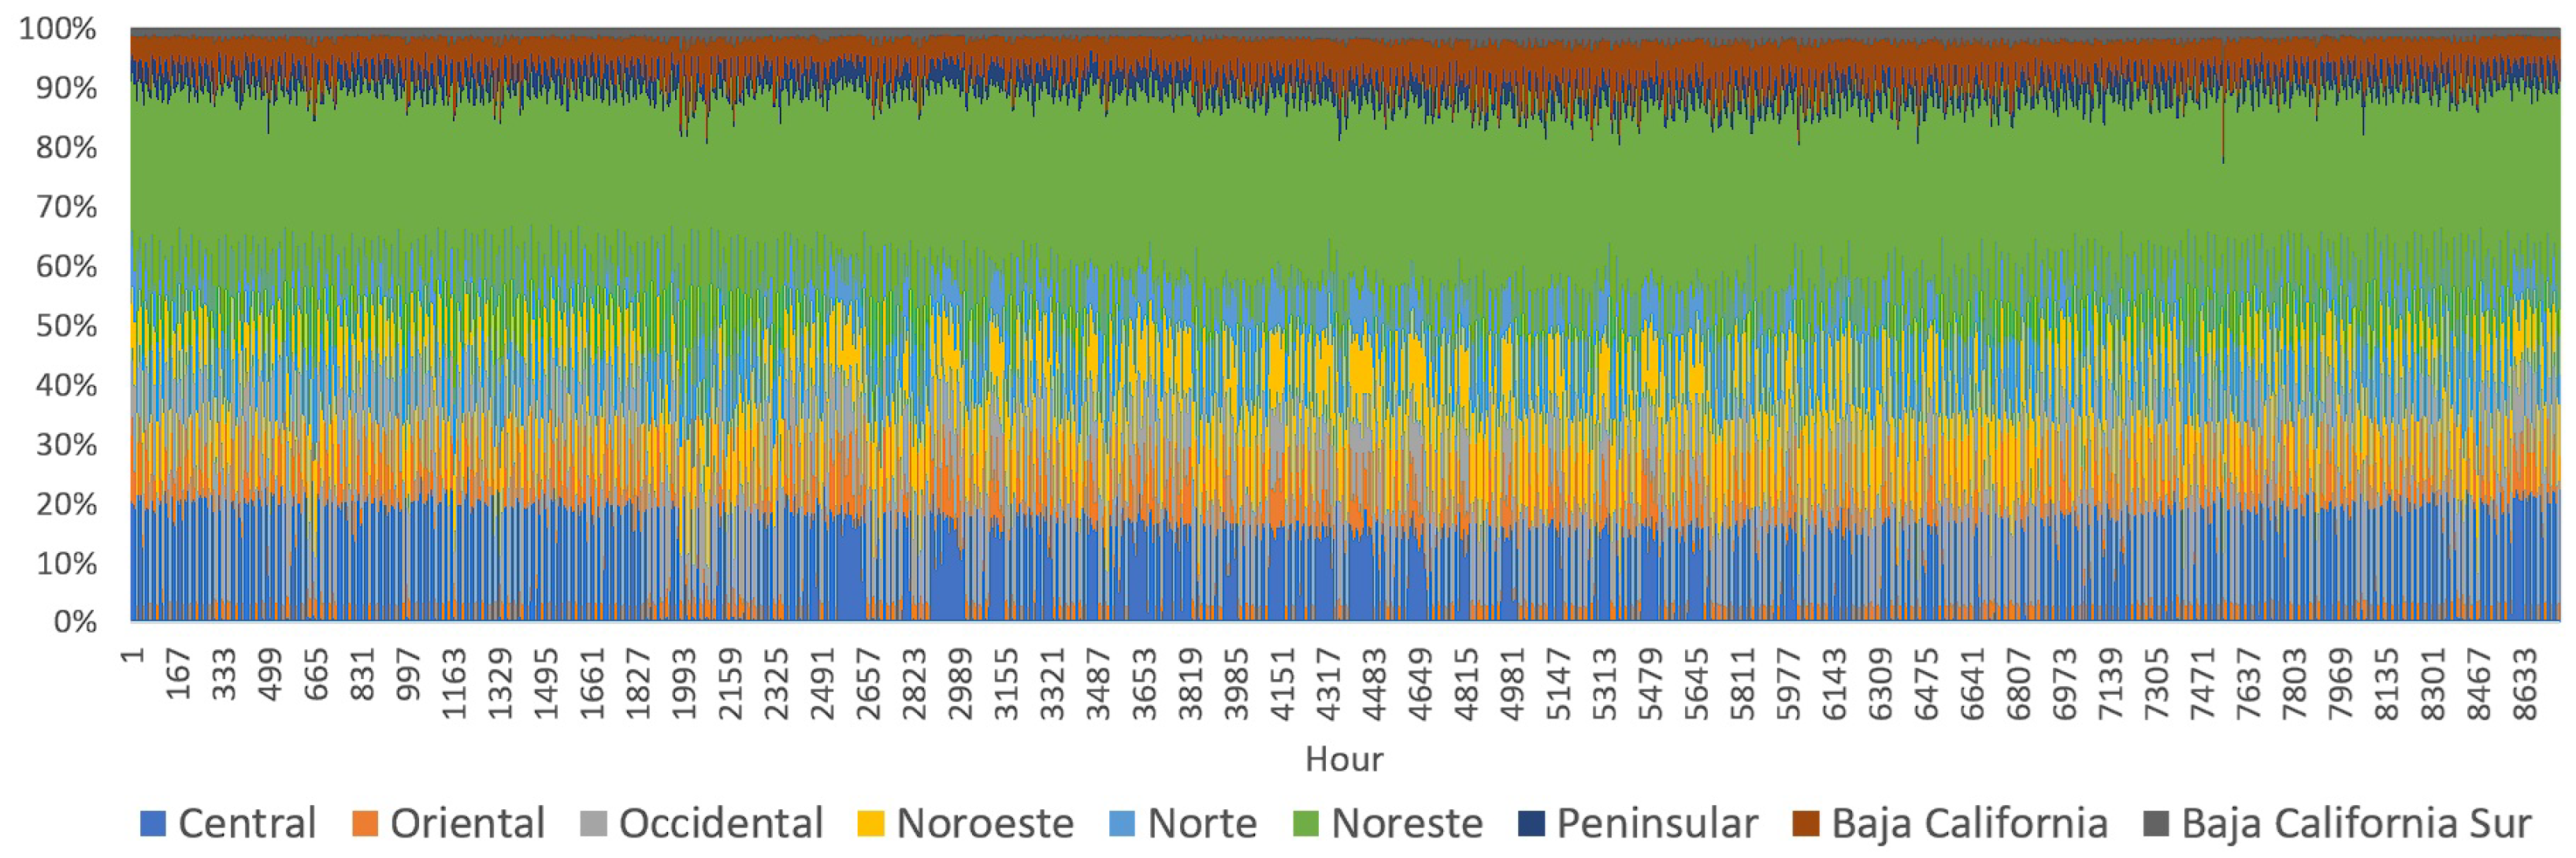
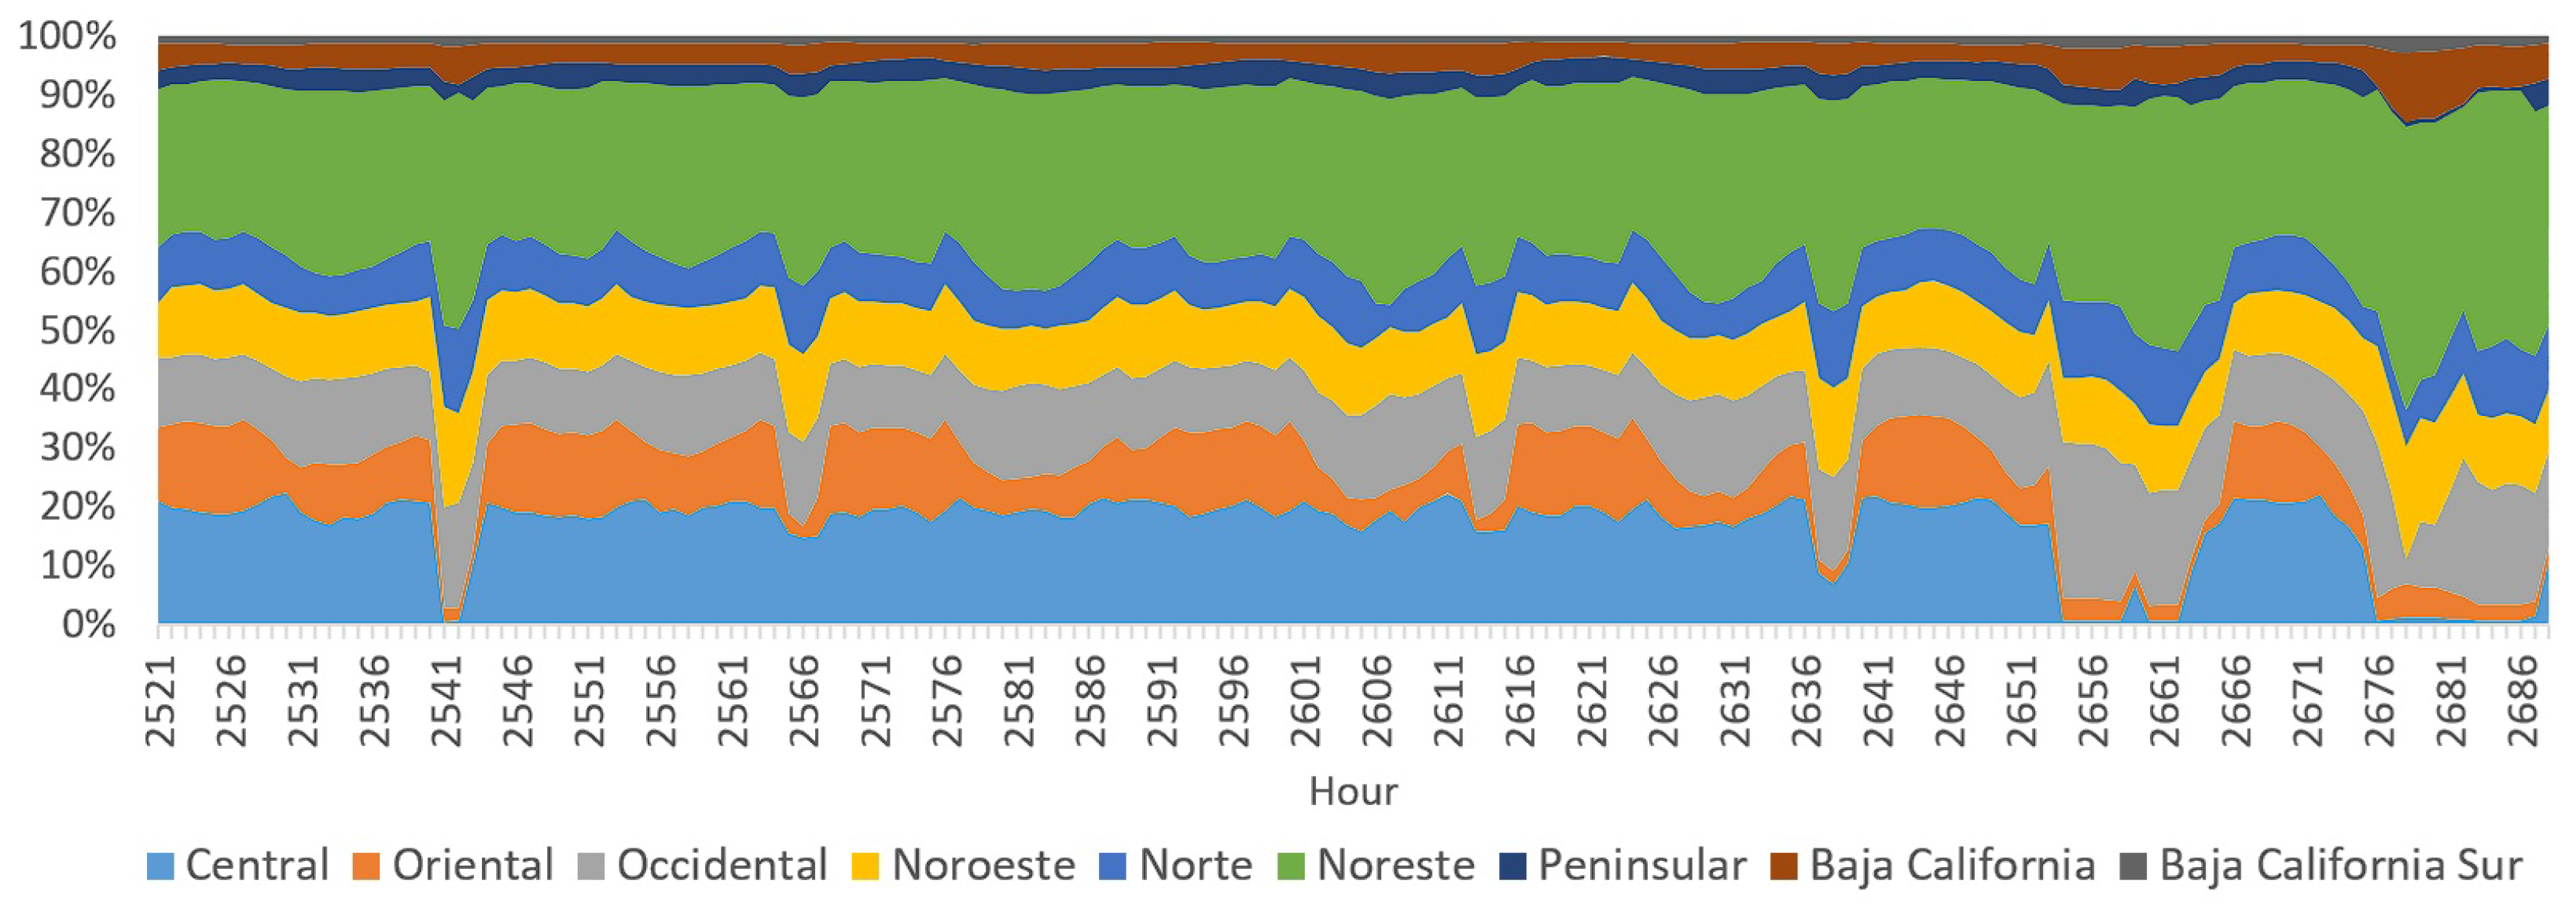
4.1.3. Regional Reserve Margin Performance

The reserve margin results obtained in the SEN 2025 scenario shown in Figure 7 indicate that it maintains a value greater than 25% for most of the year. However, the importance of this methodology lies in analyzing the most critical hours when the power supply may be compromised due to a low reserve margin, as shown in Figure 8 and Figure 9.
In this case, the reduction in the total available capacity margin is due to the coincidence of the low availability factor between solar, wind, and hydroelectric technologies, which reflects a significant dependence on climate conditions in some regions to ensure their power supply, which is why the increase in intermittent plants in these regions should be conditioned.

4.1.4. Regions Where Power Plants Are Installed That Could Significantly Impact Reducing Emissions Must Be Identified

The hourly emission by region can be determined using emission factor values for each technology in Mexico, as shown in Figure 10. It can be observed that there is an increase in emissions during the middle of the year, which is predictable since during that season there is greater demand and therefore more significant power generation. However, due to the disparity in power by region, these emissions must be normalized to identify the regions with the highest concentration of emissions per unit of energy generated, as shown in Figure 11.
By analyzing calendar weeks 16 and 32 of the SEN 2025 scenario (Figure 12 and Figure 13), we can identify that the high energy exchange between the northeast, central, and eastern regions encourages using technologies with higher emissions. Therefore, the central and eastern regions can be identified as possible candidates for the installing of new power plants to support the decarbonization of the SEN.

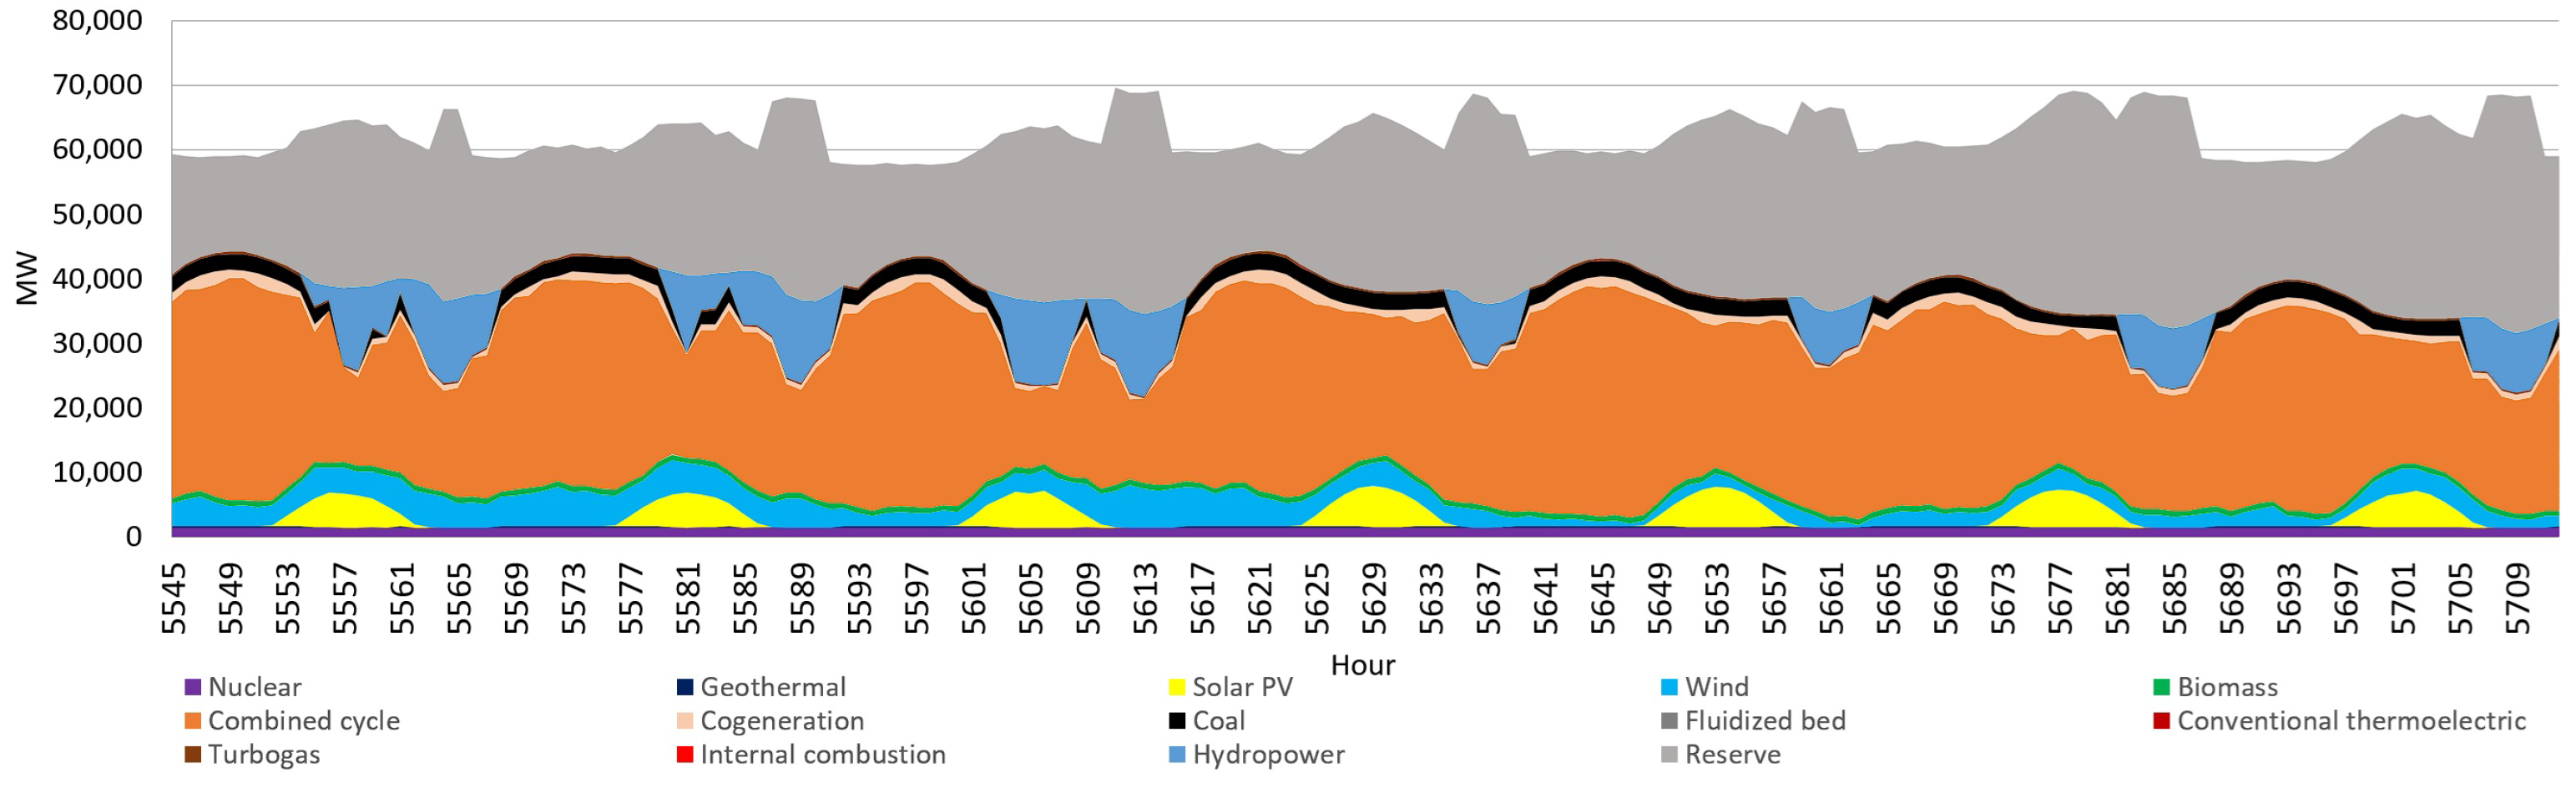
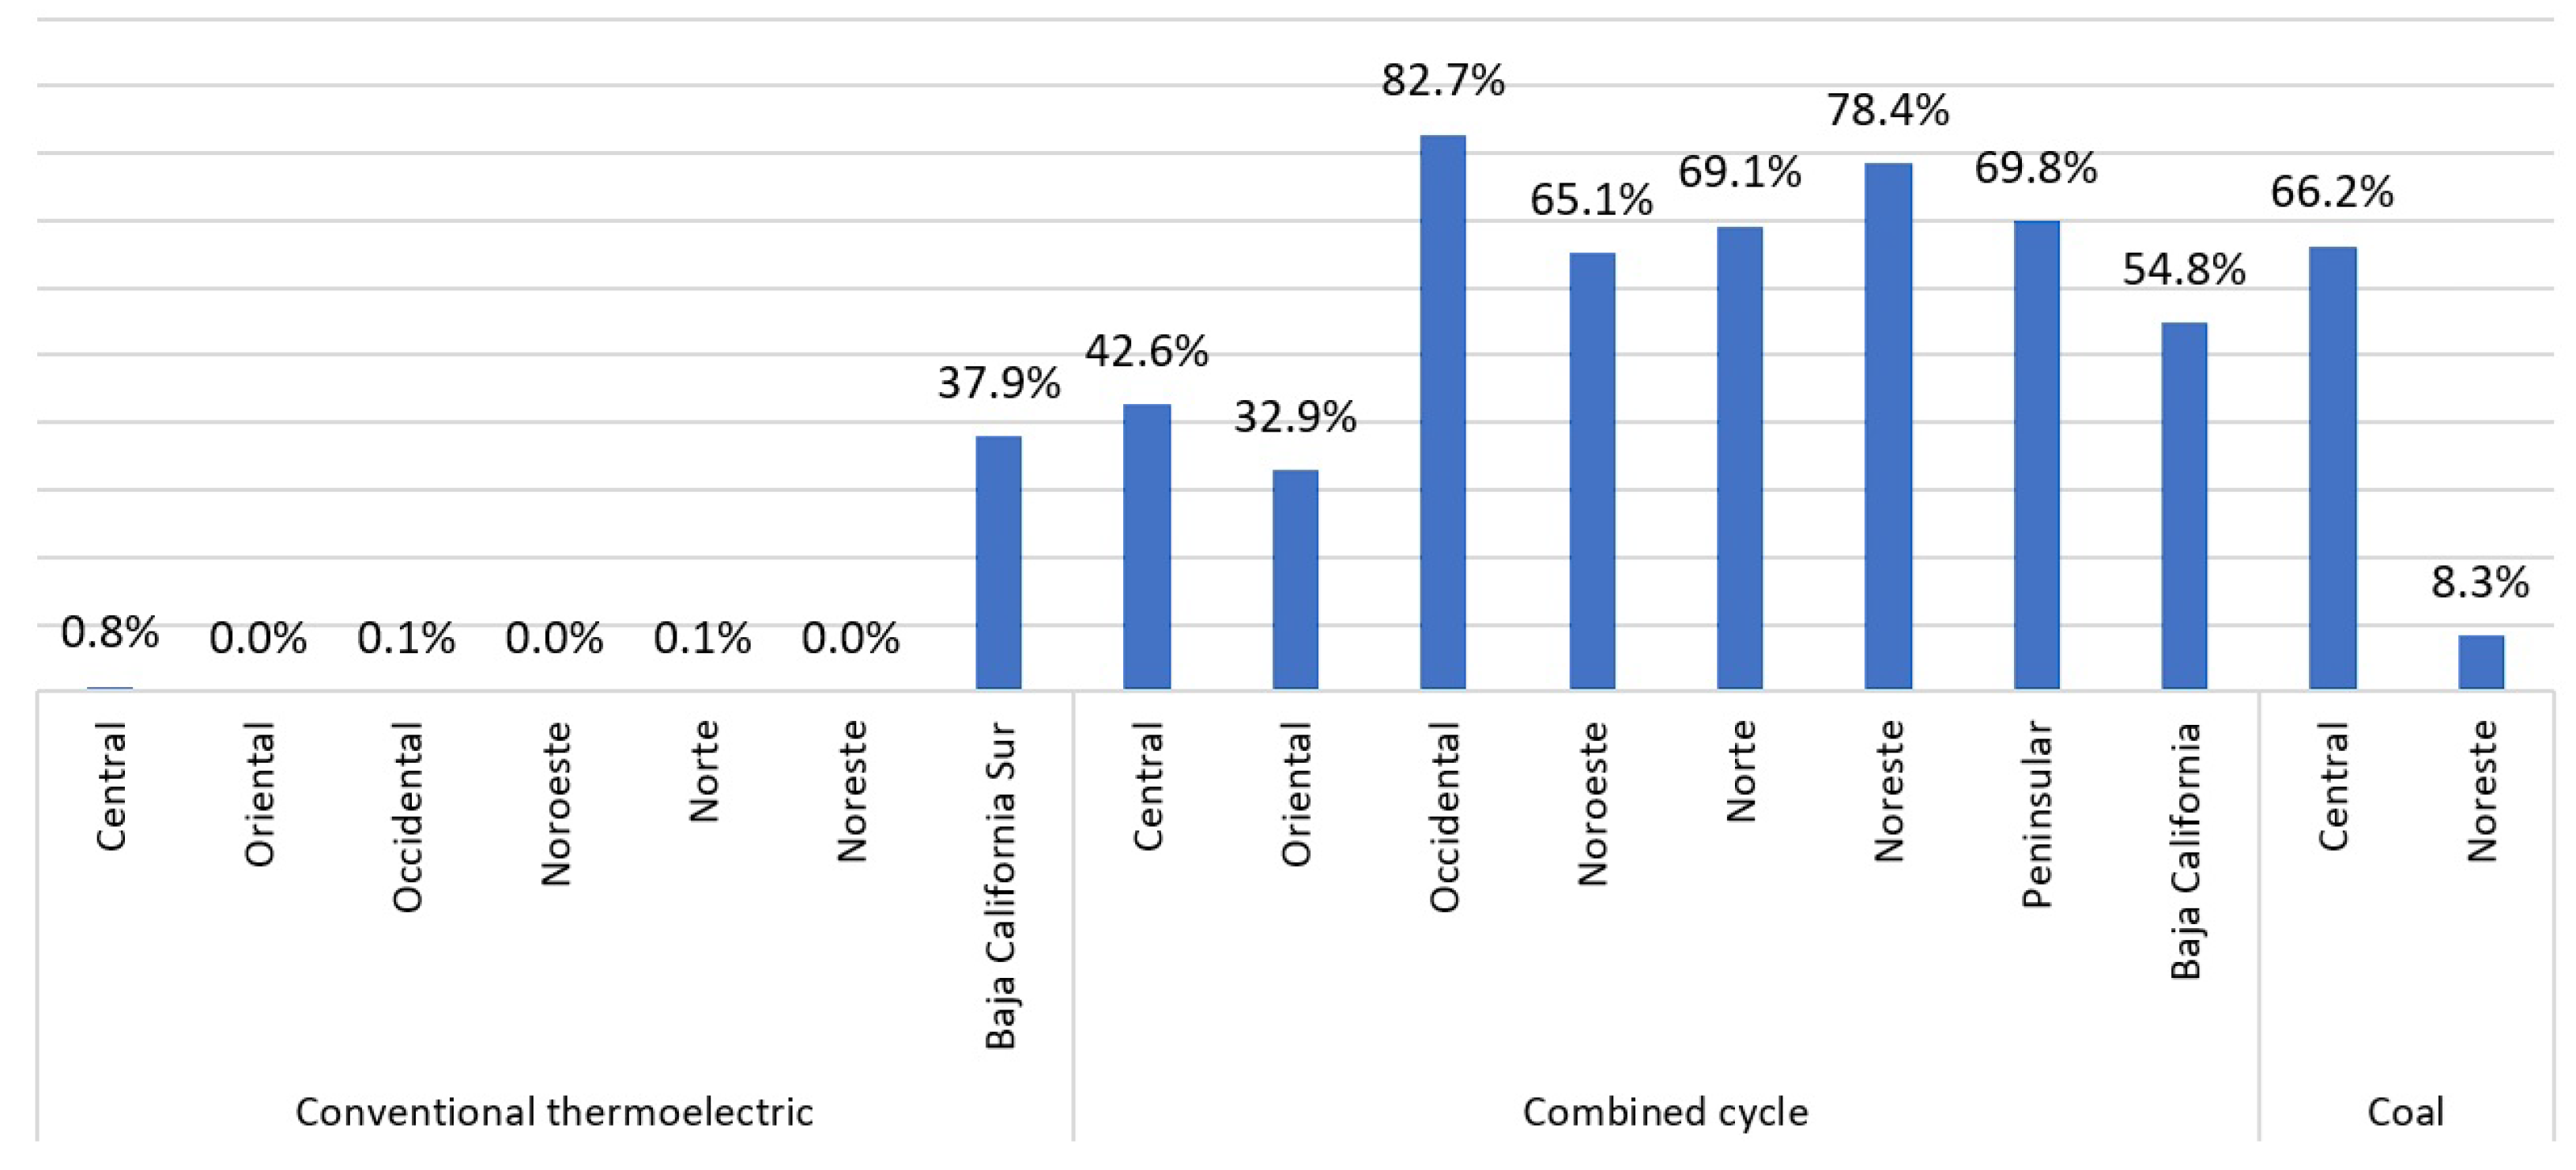
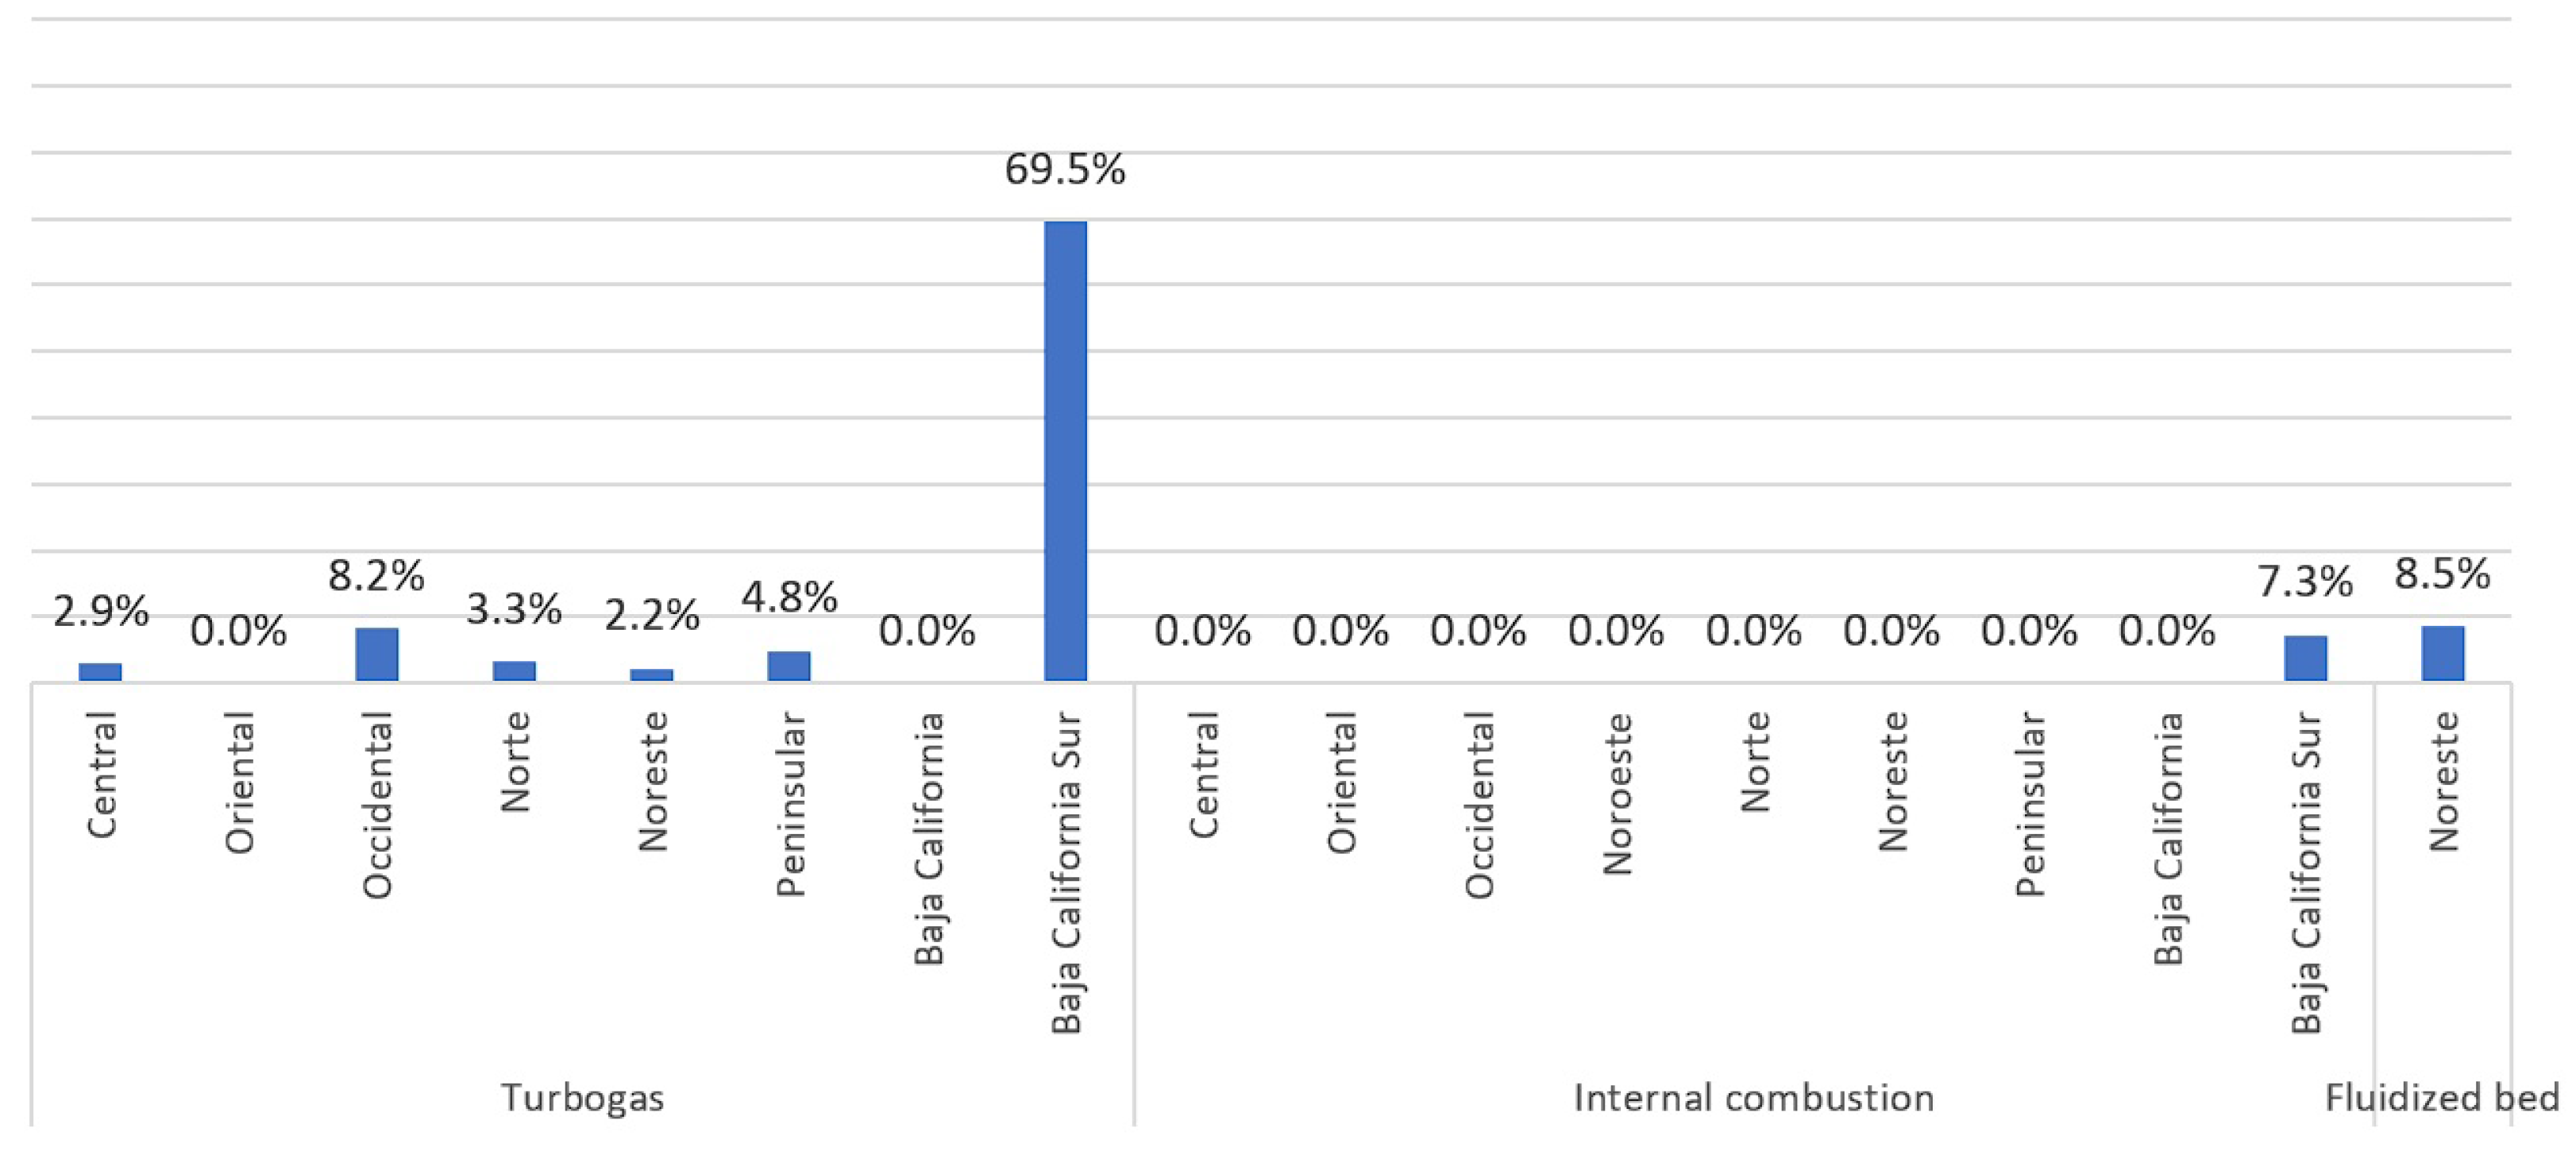
4.1.5. Technologies with Higher/Lower Capacity Factor

In the SEN 2025 scenario, as mentioned above, the economic dispatch objective is to minimize the dispatch cost so that technologies with the lowest generation cost and highest availability factor have a higher capacity factor, as in the case of bioenergy and nuclear technologies. On the other hand, some technologies are used as backup or primary generation based on the conditions of each region. For example, unlike other regions, the Baja California Sur region has extensive generation through thermoelectric and turbogas technologies.
When observing the results obtained in the SEN 2025 scenario (Figure 14, Figure 15, Figure 16 and Figure 17), we can mention that by using highly disaggregated information, it was possible to detect areas of opportunity to carry out correct planning of the SEN for the coming years, e.g., although the installed capacity may seem considerably large to supply the total demand of the country throughout the year, there are hours with a minimum reserve margin to respond to situations of unexpected failure by power technologies, with the central region being the most vulnerable.
By regionalizing the SEN and analyzing the transmission lines, it was possible to contemplate the areas of opportunity for the expansion of the RNT or the diversification of installed capacity. On the other hand, it was possible to determine that the regions with the most significant potential to reduce emissions in the SEN are highly related to the technologies installed within the region itself and the interconnections with other regions. Finally, it was possible to determine the plants in each region that have subgeneration, which is an opportunity to develop strategies to improve decision-making on the issue of installing new power plants.
The significance of these findings becomes evident when compared to studies conducted in other countries, each offering unique insights into clean energy transitions. Park et al. [54] analyzed South Korea’s path to an economically optimal clean electricity generation mix by 2035, using capacity expansion and production cost modeling. Their findings suggest that electricity demand can be met without increasing reliance on coal-fired generation and that building sufficient clean energy transmission capacity requires only modest investments. They also highlighted the potential of expanding renewable energy in southern regions by developing new transmission lines. Similarly, Acar et al. [55] explored Türkiye’s transition to a cleaner power system, aligning with current and planned government policies. Their study reveals significant benefits, including economic growth, job creation, improved income distribution, and a healthier environment, underscoring the broader societal advantages of such a transformation.
Further insights come from studies in other regions. Zhong et al. [56] examined decarbonization pathways for ten ASEAN countries, noting that fossil fuels will remain a significant part of the energy mix in the near term. However, they emphasized that cross-border transmission can reduce system costs and support net-zero emissions goals. Slimani et al. [57] focused on Morocco, using an enhanced Open-Source Energy Modeling System to analyze long-term energy strategies. They found that pumped-storage hydroelectric plants are a viable backup option for a country reliant on natural gas imports and they stressed the importance of a diversified energy mix and energy efficiency plans for a feasible transition. Meanwhile, Battisti et al. [58] assessed greenhouse gas emissions in Italy under various electric energy growth scenarios. Their study concludes that relying solely on renewable energy expansion is insufficient to achieve zero emissions, highlighting the need for additional strategies to meet decarbonization targets.
These results underscore the importance of strategic planning and regional analysis in optimizing energy systems. Findings from various international studies highlight the necessity of tailored approaches for clean energy transitions. This includes investing in renewable energy, enhancing transmission infrastructure, and promoting diversified energy mixes. The studies also point out the limitations of relying solely on renewables to achieve decarbonization goals, as illustrated in the Italian context.
In the scenario involving SEN 2025, vulnerabilities such as low reserve margins in the central region reveal opportunities for improving transmission networks and diversifying installed capacity. Moreover, reducing emissions through regional interconnections and subgeneration strategies can be achieved through detailed planning and operational improvements based on highly disaggregated information.
These studies together highlight the relevance of this issue for future research, the complexity of energy transitions, and the need for region-specific, multi-faceted approaches to achieve sustainable energy systems.

5. Conclusions

This article presents a five-step methodology to enhance decision-making in energy transition strategies for the power sector. It assesses regional hourly power shortages, transmission line congestion, reserve margin performance, optimal power plant locations for emission reduction, and capacity factors of various technologies. The approach uses an economic dispatch model applied to the SEN to simulate the dispatch of technologies set to operate in 2025. The main conclusions are summarized below.
  • There was no power shortage during the simulated year, indicating adequate capacity to meet demand.
  • The minimum reserve margin was 8% of total capacity, suggesting sufficiency.
  • High congestion occurred in the Noreste–Oriental, Norte–Occidental, Noroeste–Occidental, and Noreste–Occidental links, exceeding 5000 h, highlighting an opportunity to diversify power plant capacity.
  • Central and Noreste regions had the highest emissions and contributed most to the global emission factor.
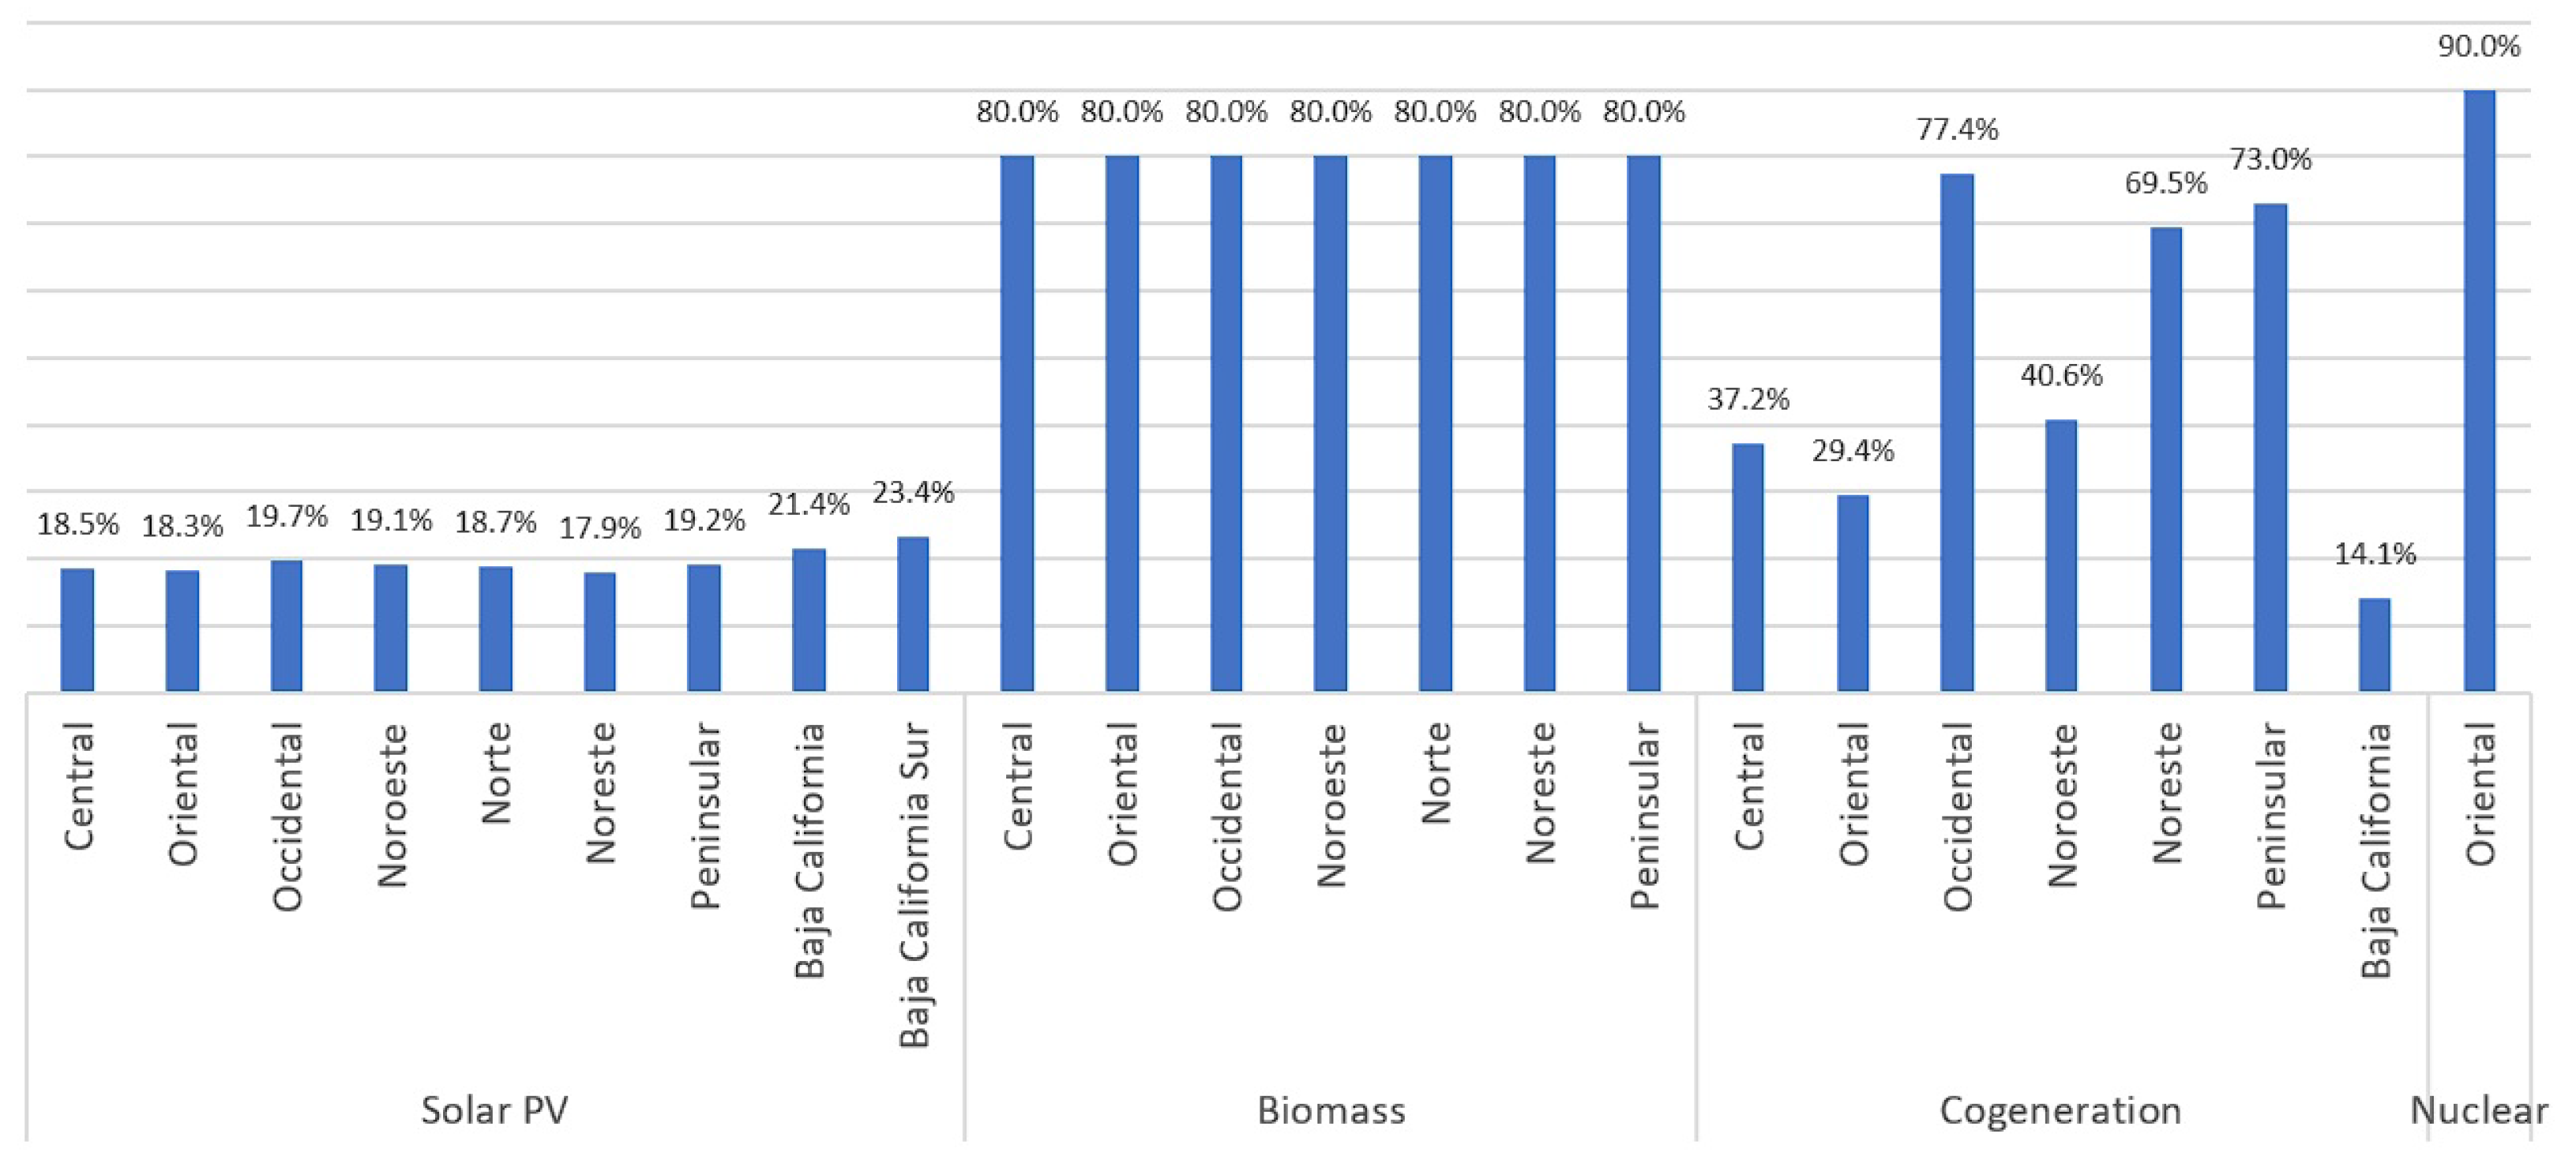
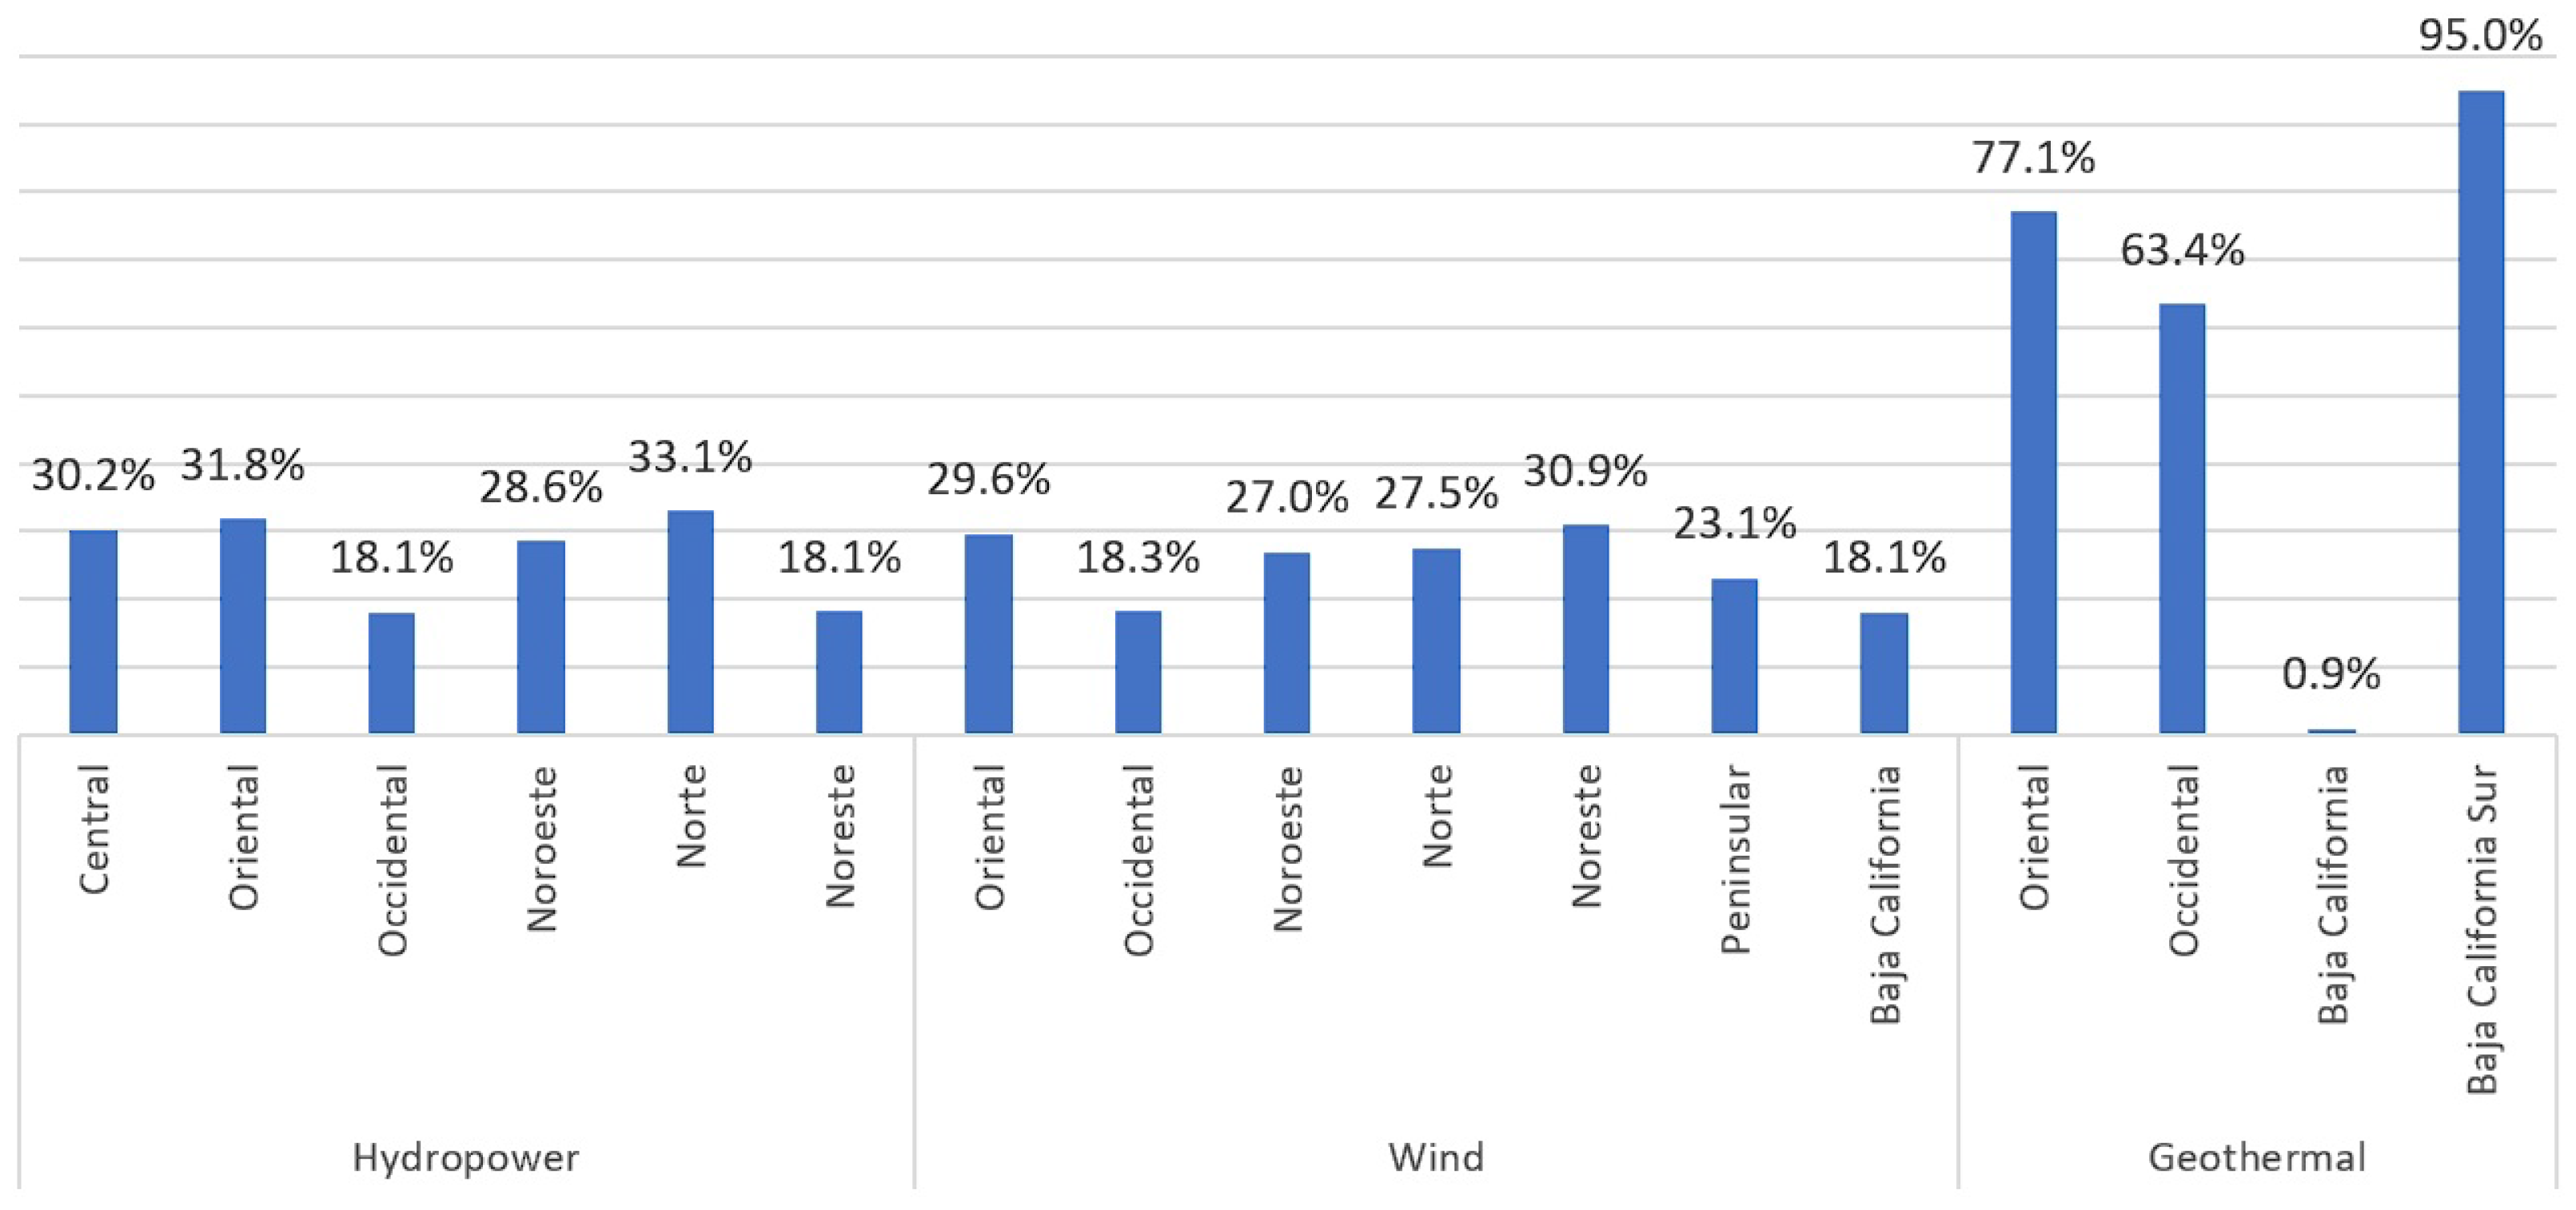
  • Combined cycle, biomass, geothermal, and nuclear technologies achieved capacity factors of 75% or higher.
Several policy recommendations can be implemented to achieve a sustainable and resilient energy system. First, diversifying the installed capacity of clean energy plants is crucial to reducing reliance on a single energy source and enhancing grid stability. This includes investing in a mix of solar, wind, hydro, and geothermal technologies tailored to the availability of regional resources. Second, encouraging distributed generation through incentives for rooftop solar, community energy projects, and small-scale renewable sources can empower consumers, reduce transmission losses, and improve energy access in remote areas. Third, increasing the installed capacity in the Central region is important to balance supply and demand, considering its high energy consumption and strategic location. Finally, strengthening interconnections in key regions, such as Noreste–Oriental, Norte–Occidental, Noroeste–Occidental, and Noreste–Occidental, will enhance grid reliability, facilitate the integration of renewable energy, and support economic development by ensuring a stable and efficient energy supply.
The simulation of the SEN 2025 case has some limitations that must be noted. Computationally, the model, executed on an Intel i7 with 32 GB of RAM, requires 55 min per year for weekly runs, suggesting a need for parallel or distributed strategies for larger or stochastic models. Data simplifications, such as uniform availability factors, fixed maintenance periods, and static fuel prices, may reduce accuracy, highlighting the potential for improvement with more precise information. Additionally, modeling constraints like deterministic demand forecasting, exclusion of power plant start-up processes, and fixed installed capacity until 2024 limit the model’s realism. Incorporating stochastic interpretations and dynamic constraints could enhance its effectiveness.
The results presented are subject to many uncertainties associated with the assumptions and information used to determine demand forecasts, the availability factors of intermittent technologies, generation costs, and fuel prices. However, this paper contributes to analyzing key factors in the generation and transmission of power planning that could jeopardize a power system’s energy transition.
Further work can enhance the economic dispatch model presented in this paper by optimizing the installation and decommissioning of power plants. This optimization will determine the appropriate capacity, location, timing, and technology type to address energy shortages. Additionally, the model can be expanded to evaluate congestion hours, locational marginal prices, emissions, capacity factors, and shadow prices while incorporating detailed transmission network elements such as nodes, direct current lines, and distributed generation.
A multi-criteria decision analysis framework would be beneficial to approximate various scenarios, balancing economic, environmental, and technical criteria. Concrete next steps include developing a dynamic capacity expansion model, integrating renewable energy sources and storage solutions, validating the model with real-world data, and formulating policies on carbon pricing, transmission investments, and incentives for distributed generation. This comprehensive approach will help advance both research and policy formulation desired for sustainable energy systems.

Author Contributions

Conceptualization, U.H.-H. and J.C.S.-T.-M.; methodology, U.H.-H., J.M.-M. and J.C.S.-T.-M.; validation, U.H.-H., J.C.S.-T.-M. and C.M.-d.-C.; formal analysis, U.H.-H., C.M.-d.-C. and N.H.-R.; investigation, U.H.-H., J.C.S.-T.-M. and J.M.-M.; resources, N.H.-R. and C.M.-d.-C.; writing—original draft preparation, U.H.-H., J.C.S.-T.-M. and J.M.-M.; writing—review and editing, N.H.-R. and C.M.-d.-C.; visualization, U.H.-H., J.C.S.-T.-M. and N.H.-R.; supervision, J.C.S.-T.-M., J.M.-M. and C.M.-d.-C.; funding acquisition, J.C.S.-T.-M. All authors have read and agreed to the published version of the manuscript.

Funding

The National Council for Humanities, Sciences, and Technology (CONAHCYT) provided a scholarship to Ulises A. Hernandez-Hurtado (CVU 665616) as a Postdoctoral researcher of the Autonomous University of the State of Hidalgo (UAEH) and financial support with project number F003-320109. Special thanks to the team researches of the UPE for the support in providing the data required to simulate the scenario.

Data Availability Statement

The model’s programming runs under the open-source platform Python Optimization Modelling (PYOMO), which is freely available in the repository https://github.com/IhanKaydarin/Multi-regional-time-step-and-technology-economic-dispatch (accessed on 30 September 2024).

Conflicts of Interest

The authors declare that they have no known competing financial interest or personal relationships that could have appeared to influence the work reported in this paper.

Appendix A. Glossary of Terms

Table A1. Terms used in the definition of the mathematical model.
TypeIndexDescription
Setsi ∈ IThe index for technology
g ∈ GThe index for generation regions
c ∈ CThe index for consumption regions
t ∈ TThe index for time step
Parameters and variablesxEnergy that technology i installed in generation region g
sends to consumption region c during hour t (MWh)
cGeneration cost of technology i installed in generation
region g to send electricity to consumption region c during
hour t (USD/MWh)
DEnergy demand in each region for each hour (MWh)
fdAvailability factor of each technology in each generation
region for each hour (fraction)
FInstalled capacity of each technology in each generation
region (MW)
MCTMaximum capacity that each link can transmit
between generation and consumption regions (MWh)

References

  1. Intergovernmental Panel on Climate Change (IPCC). Climate Change and Land: IPCC Special Report on Climate Change, Desertification, Land Degradation, Sustainable Land Management, Food Security, and Greenhouse Gas Fluxes in Terrestrial Ecosystems; Cambridge University Press: Cambridge, UK, 2022. [Google Scholar] [CrossRef]
  2. Intergovernmental Panel on Climate Change (IPCC). Climate Change 2021: The Physical Science Basis; Cambridge University Press: Cambridge, UK, 2021. [Google Scholar] [CrossRef]
  3. Intergovernmental Panel on Climate Change (IPCC). Climate Change 2022: Impacts, Adaptation and Vulnerability; Cambridge University Press: Cambridge, UK, 2022. [Google Scholar] [CrossRef]
  4. Advani, N.K. Assessing species vulnerability to climate change, and implementing practical solutions. Biol. Conserv. 2023, 286, 110284. [Google Scholar] [CrossRef]
  5. Kim, M.J.; Hong, J.B.; Han, I.S.; Lee, J.S.; Kim, D.H. Vulnerability assessment of Korean fisheries to climate change. Mar. Policy 2023, 155, 105735. [Google Scholar] [CrossRef]
  6. Tee Lewis, P.G.; Chiu, W.A.; Nasser, E.; Proville, J.; Barone, A.; Danforth, C.; Kim, B.; Prozzi, J.; Craft, E. Characterizing vulnerabilities to climate change across the United States. Environ. Int. 2023, 172, 107772. [Google Scholar] [CrossRef]
  7. Adeagbo, O.; Bamire, A.; Akinola, A.; Adeagbo, A.; Oluwole, T.; Ojedokun, O.; Ojo, T.; Kassem, H.; Emenike, C. The level of adoption of multiple climate change adaptation strategies: Evidence from smallholder maize farmers in Southwest Nigeria. Sci. Afr. 2023, 22, e01971. [Google Scholar] [CrossRef]
  8. Rathnayaka, B.; Robert, D.; Siriwardana, C.; Adikariwattage, V.; Pasindu, H.; Setunge, S.; Amaratunga, D. Identifying and prioritizing climate change adaptation measures in the context of electricity, transportation and water infrastructure: A case study. Int. J. Disaster Risk Reduct. 2023, 99, 104093. [Google Scholar] [CrossRef]
  9. Sedtha, S.; Pramanik, M.; Szabo, S.; Wilson, K.; Park, K.S. Climate change perception and adaptation strategies to multiple climatic hazards: Evidence from the northeast of Thailand. Environ. Dev. 2023, 48, 100906. [Google Scholar] [CrossRef]
  10. Muzammil, M.; Zahid, A.; Farooq, U.; Saddique, N.; Breuer, L. Climate change adaptation strategies for sustainable water management in the Indus basin of Pakistan. Sci. Total Environ. 2023, 878, 163143. [Google Scholar] [CrossRef]
  11. United Nations Framework Convention on Climate Change (UNFCCC). Adoption of the Paris Agreement. 2015. Available online: https://www.un.org/en/development/desa/population/migration/generalassembly/docs/globalcompact/FCCC_CP_2015_10_Add.1.pdf (accessed on 10 September 2024).
  12. Bashir, M.F.; MA, B.; Hussain, H.I.; Shahbaz, M.; Koca, K.; Shahzadi, I. Evaluating environmental commitments to COP21 and the role of economic complexity, renewable energy, financial development, urbanization, and energy innovation: Empirical evidence from the RCEP countries. Renew. Energy 2022, 184, 541–550. [Google Scholar] [CrossRef]
  13. Singh, K.; Meena, R.S.; Kumar, S.; Dhyani, S.; Sheoran, S.; Singh, H.M.; Pathak, V.V.; Khalid, Z.; Singh, A.; Chopra, K.; et al. India’s renewable energy research and policies to phase down coal: Success after Paris agreement and possibilities post-Glasgow Climate Pact. Biomass Bioenergy 2023, 177, 106944. [Google Scholar] [CrossRef]
  14. Yang, G.; Zha, D.; Cao, D.; Zhang, G. Time for a change: Rethinking the global renewable energy transition from the Sustainable Development Goals and the Paris Climate Agreement. Innovation 2024, 5, 100582. [Google Scholar] [CrossRef]
  15. Umar, M.; Ji, X.; Kirikkaleli, D.; Xu, Q. COP21 Roadmap: Do innovation, financial development, and transportation infrastructure matter for environmental sustainability in China? J. Environ. Manag. 2020, 271, 111026. [Google Scholar] [CrossRef]
  16. Crnčec, D.; Penca, J.; Lovec, M. The COVID-19 pandemic and the EU: From a sustainable energy transition to a green transition? Energy Policy 2023, 175, 113453. [Google Scholar] [CrossRef]
  17. Tian, J.; Yu, L.; Xue, R.; Zhuang, S.; Shan, Y. Global low-carbon energy transition in the post-COVID-19 era. Appl. Energy 2022, 307, 118205. [Google Scholar] [CrossRef]
  18. Mišík, M.; Nosko, A. Post-pandemic lessons for EU energy and climate policy after the Russian invasion of Ukraine: Introduction to a special issue on EU green recovery in the post-Covid-19 period. Energy Policy 2023, 177, 113546. [Google Scholar] [CrossRef]
  19. Żuk, P.; Żuk, P. National energy security or acceleration of transition? Energy policy after the war in Ukraine. Joule 2022, 6, 709–712. [Google Scholar] [CrossRef]
  20. Xin, B.; Zhang, M. Evolutionary game on international energy trade under the Russia-Ukraine conflict. Energy Econ. 2023, 125, 106827. [Google Scholar] [CrossRef]
  21. Ślusarczyk, B.; Chłąd, M.; Michałek, J.; Dacko-Pikiewicz, Z.; Androniceanu, A. Strategies for supplying enterprises with energy in the context of changing coal prices on the Polish market—The effect of the war in Ukraine. Resour. Policy 2023, 85, 104028. [Google Scholar] [CrossRef]
  22. Liu, W.; Chen, X.; Zhang, J. The Russia-Ukraine conflict and the automotive energy transition: Empirical evidence from China. Energy 2023, 284, 128562. [Google Scholar] [CrossRef]
  23. Cui, L.; Yue, S.; Nghiem, X.H.; Duan, M. Exploring the risk and economic vulnerability of global energy supply chain interruption in the context of Russo-Ukrainian war. Resour. Policy 2023, 81, 103373. [Google Scholar] [CrossRef]
  24. Gobierno de México. Contribución Prevista y Determinada a Nivel Nacional (INDC) de México. 2015. Available online: https://www.gob.mx/cms/uploads/attachment/file/162974/2015_indc_esp.pdf (accessed on 11 September 2024).
  25. Gobierno de México—Instituto Nacional de Ecología y Cambio Climático (INECC). Inventario Nacional de Emisiones de Gases y Compuestos de Efecto Invernadero. 2024. Available online: https://www.gob.mx/inecc/acciones-y-programas/inventario-nacional-de-emisiones-de-gases-y-compuestos-de-efecto-invernadero (accessed on 11 September 2024).
  26. Procuraduría Federal de Protección al Ambiente (PROFEPA). Ley General de Cambio Climático. 2024. Available online: https://www.profepa.gob.mx/innovaportal/file/6583/1/ley_general_de_cambio_climatico.pdf (accessed on 11 September 2024).
  27. Diario Oficial de la Federación (DOF). Decreto por el que se expide la Ley de Transición Energética. 2015. Available online: https://dof.gob.mx/nota_detalle.php?codigo=5421295&fecha=24/12/2015#gsc.tab=0 (accessed on 11 September 2024).
  28. Secretaría de Energía (SENER). Programa de Desarrollo del Sistema Eléctrico Nacional 2024–2038. 2024. Available online: https://www.gob.mx/sener/articulos/programa-de-desarrollo-del-sistema-electrico-nacional-2024-2038 (accessed on 11 September 2024).
  29. Santillán Vera, M.; García Manrique, L.; Rodríguez Peña, I.; De La Vega Navarro, A. Drivers of electricity GHG emissions and the role of natural gas in mexican energy transition. Energy Policy 2023, 173. [Google Scholar] [CrossRef]
  30. Diezmartínez, C. Clean energy transition in Mexico: Policy recommendations for the deployment of energy storage technologies. Renew. Sustain. Energy Rev. 2021, 135, 110407. [Google Scholar] [CrossRef]
  31. von Lüpke, H.; Well, M. Analyzing climate and energy policy integration: The case of the Mexican energy transition. Clim. Policy 2020, 20, 832–845. [Google Scholar] [CrossRef]
  32. Castrejon-Campos, O. Evolution of clean energy technologies in Mexico: A multi-perspective analysis. Energy Sustain. Dev. 2022, 67, 29–53. [Google Scholar] [CrossRef]
  33. Serrano-Arévalo, T.I.; López-Flores, F.J.; Raya-Tapia, A.Y.; Ramírez-Márquez, C.; Ponce-Ortega, J.M. Optimal expansion for a clean power sector transition in Mexico based on predicted electricity demand using deep learning scheme. Appl. Energy 2023, 348, 121597. [Google Scholar] [CrossRef]
  34. Banacloche, S.; Cadarso, M.A.; Monsalve, F.; Lechon, Y. Assessment of the sustainability of Mexico green investments in the road to Paris. Energy Policy 2020, 141, 111458. [Google Scholar] [CrossRef]
  35. Fernandez, R.M.; Baker, E.; Galicia, J.H. Regional Power Planning Robust to Multiple Models: Meeting Mexico’s 2050 Climate Goals. Energy Clim. Chang. 2022, 3, 100076. [Google Scholar] [CrossRef]
  36. Gu, B.; Zhai, H.; An, Y.; Khanh, N.Q.; Ding, Z. Low-carbon transition of Southeast Asian power systems—A SWOT analysis. Sustain. Energy Technol. Assess. 2023, 58, 103361. [Google Scholar] [CrossRef]
  37. Almalaq, A.; Alqunun, K.; Refaat, M.M.; Farah, A.; Benabdallah, F.; Ali, Z.M.; Aleem, S.H.E.A. Towards Increasing Hosting Capacity of Modern Power Systems through Generation and Transmission Expansion Planning. Sustainability 2022, 14, 2998. [Google Scholar] [CrossRef]
  38. Zhou, Y.; Zhai, Q.; Yuan, W.; Wu, J. Capacity expansion planning for wind power and energy storage considering hourly robust transmission constrained unit commitment. Appl. Energy 2021, 302, 117570. [Google Scholar] [CrossRef]
  39. He, L.; Lu, Z.; Zhang, J.; Geng, L.; Cai, Y.; Li, X. Economic dispatch of multi-area integrated electricity and natural gas systems considering emission and hourly spinning reserve constraints. Int. J. Electr. Power Energy Syst. 2021, 132, 107177. [Google Scholar] [CrossRef]
  40. Deng, X.; Lv, T. Power system planning with increasing variable renewable energy: A review of optimization models. J. Clean. Prod. 2020, 246, 118962. [Google Scholar] [CrossRef]
  41. Wang, Y.; Luo, S.; Yao, L.; Du, E.; Guan, Z.; Xiao, X. Modeling concentrating solar power plants in power system optimal planning and operation: A comprehensive review. Sustain. Energy Technol. Assess. 2024, 71, 103992. [Google Scholar] [CrossRef]
  42. Maulén, L.; Castro, M.; Lorca, Á.; Negrete-Pincetic, M. Optimization-based expansion planning for power and hydrogen systems with feedback from a unit commitment model. Appl. Energy 2023, 343, 121207. [Google Scholar] [CrossRef]
  43. Cho, S.; Tovar-Facio, J.; Grossmann, I.E. Disjunctive optimization model and algorithm for long-term capacity expansion planning of reliable power generation systems. Comput. Chem. Eng. 2023, 174, 108243. [Google Scholar] [CrossRef]
  44. Huanca, D.H.; Gallego, L.A.; López-Lezama, J.M. Transmission Network Expansion Planning Considering Optimal Allocation of Series Capacitive Compensation and Active Power Losses. Appl. Sci. 2022, 12, 388. [Google Scholar] [CrossRef]
  45. Sharifian, Y.; Abdi, H. Multi-area economic dispatch problem: Methods, uncertainties, and future directions. Renew. Sustain. Energy Rev. 2024, 191, 114093. [Google Scholar] [CrossRef]
  46. Zare, M.; Azizipanah-Abarghooee, R.; Terzija, V. A review on economic dispatch problems from problem formulations point of view and required data. In Encyclopedia of Electrical and Electronic Power Engineering; García, J., Ed.; Elsevier: Oxford, UK, 2023; pp. 9–29. [Google Scholar] [CrossRef]
  47. Sharifzadeh, H. A reliable deterministic method for multi-area economic dispatch considering power losses. Energy Rep. 2024, 12, 2720–2731. [Google Scholar] [CrossRef]
  48. Marzbani, F.; Abdelfatah, A. Economic dispatch optimization strategies and problem formulation: A comprehensive review. Energies 2024, 17, 550. [Google Scholar] [CrossRef]
  49. Secretaría de Energía (SENER). Prospectiva de Gas Natural 2023–2037. 2023. Available online: http://base.energia.gob.mx/Prospectivas23/PGN_23-37_F.pdf (accessed on 11 September 2024).
  50. Secretaría de Energía (SENER). Prospectiva de Petróleo Crudo y Petrolíferos 2023–2037. 2023. Available online: http://base.energia.gob.mx/Prospectivas23/PPP_23-37.pdf (accessed on 11 September 2024).
  51. Secretaría de Energía (SENER). Prospectiva de Gas L.P. 2023–2037. 2023. Available online: http://base.energia.gob.mx/Prospectivas23/PGLP_23_37_F.pdf (accessed on 11 September 2024).
  52. Secretaría de Energía (SENER). Prospectiva del Sector Eléctrico 2023–2037. 2023. Available online: http://base.energia.gob.mx/Prospectivas23/PSE_23-37_VF.pdf (accessed on 11 September 2024).
  53. Hart, W.; Laird, C.; Watson, J.P.; Woodruff, D.; Hackebeil, G.; Nicholson, B.; Siirola, J. Pyomo—Optimization Modeling in Python; Springer: Berlin, Germany, 2017. [Google Scholar] [CrossRef]
  54. Park, W.Y.; Song, Y.H.; Abhyankar, N.; Moon, H.S.; Paliwal, U.; Kim, E.; Khanna, N.; Hong, S.; Kim, J.H.; Shiraishi, K.; et al. A clean energy Korea by 2035: Transitioning to 80% carbon-free electricity generation. Cell Rep. Sustain. 2025, 2, 100262. [Google Scholar] [CrossRef]
  55. Acar, S.; Kat, B.; Rogner, M.; Saygin, D.; Taranto, Y.; Yeldan, A.E. Transforming Türkiye’s power system: An assessment of economic, social, and external impacts of an energy transition by 2030. Clean. Energy Syst. 2023, 4, 100064. [Google Scholar] [CrossRef]
  56. Zhong, S.; Yang, L.; Papageorgiou, D.J.; Su, B.; Ng, T.S.; Abubakar, S. Accelerating ASEAN’s energy transition in the power sector through cross-border transmission and a net-zero 2050 view. iScience 2025, 28, 111547. [Google Scholar] [CrossRef] [PubMed]
  57. Slimani, J.; Kadrani, A.; El Harraki, I.; Ezzahid, E. Towards a sustainable energy future: Modeling Morocco’s transition to renewable power with enhanced OSeMOSYS model. Energy Convers. Manag. 2024, 317, 118857. [Google Scholar] [CrossRef]
  58. Battisti, L. Energy, power, and greenhouse gas emissions for future transition scenarios. Energy Policy 2023, 179, 113626. [Google Scholar] [CrossRef]
Figure 1. Capacity of the 9 transmission lines (red arrows, in MW) between the SEN’s different generation and consumption regions https://www.gob.mx/cms/uploads/attachment/file/331770/PRODESEN-2018-2032-definitiva.pdf (accessed on 4 February 2025).
Energies 18 01316 g001
Figure 2. Regional hourly demand forecast for the SEN 2025 scenario. The maximum and minimum demand is 53738 MW for the hour 4063 and 31676 MW for the hour 8565, respectively.
Energies 18 01316 g002
Figure 3. Simulation results of hourly dispatch by type of technology (MW) by generation region in the SEN for the SEN 2025 scenario. Noreste and Oriental show to be net generation regions. On the other hand, Central, Occidental, Noroeste, Norte, and Peninsular are net consumption regions.
Energies 18 01316 g003
Figure 4. Bidirectional power flow (MW) for each generation region to consumption region for the SEN 2025 scenario. The highest power flow is presented in the Noreste–Occidental link, which had over 32 TWh during the period.
Energies 18 01316 g004
Figure 5. Annual hours of grid congestion for each generation region to consumption region for the SEN 2025 scenario. Occidental and Oriental regions are critical for generation–demand balance.
Energies 18 01316 g005
Figure 6. Bidirectional power flow (MW) between Noreste and Norte regions for the SEN 2025 scenario. Congestion hours in red and blue links were 105 and 550, respectively.
Energies 18 01316 g006
Figure 7. Hourly reserve margin (%) for the SEN 2025 scenario. June and July require greater technology availability to adequately supply demand. On the other hand, December and January are excellent options for performing preventive maintenance.
Energies 18 01316 g007
Figure 8. Hourly dispatch results by technology (MW) in calendar week 29 for the SEN 2025 scenario. The unavailability of renewable technologies caused the reserve margin to drop to 8% in hour 4782.
Energies 18 01316 g008
Figure 9. Hourly dispatch results by technology (MW) in calendar week 51 for the SEN 2025 scenario. Minimum demand reflects a vast margin reserve.
Energies 18 01316 g009
Figure 10. Hourly emissions produced by generation region (TonCO2eq) for the SEN 2025 scenario. Total emissions for the period were over 111.5 million tons of CO2 equivalent.
Energies 18 01316 g010
Figure 11. Regional contribution to the average hourly emission factor (%) for the SEN 2025 scenario. Solar, wind, and hydro generation is reflected in hourly emission factor variations.
Energies 18 01316 g011
Figure 12. Percentage of hourly emissions produced by region during week 16 in the SEN 2025 scenario. Emissions are evenly distributed on low-demand weeks.
Energies 18 01316 g012
Figure 13. Percentage of hourly emissions produced by region during week 32 in the SEN 2025 scenario. Due to more energy production from high-polluting technologies, emissions do not appear evenly distributed during weeks of high demand.
Energies 18 01316 g013
Figure 14. Capacity factor results for thermoelectric, combined cycle, and coal-fired technologies by generation region for the SEN 2025 scenario. Fuel prices are critical for competitive energy production among thermal technologies.
Energies 18 01316 g014
Figure 15. Capacity factor results for turbogas, internal combustion, and fluidized bed technologies by generation region for the SEN 2025 scenario. Baja California Sur highly depends on costly technologies such as turbogas or internal combustion to meet power demand.
Energies 18 01316 g015
Figure 16. Capacity factor results for solar PV, biomass, cogeneration, and nuclear technologies by generation region for the SEN 2025 scenario. Solar PV generation is an engaging option to reduce generation costs and emissions in Baja California Sur.
Energies 18 01316 g016
Figure 17. Capacity factor results for hydropower, wind, and geothermal technologies by generation region for the SEN 2025 scenario. Oriental and Noreste regions are the highest potential nodes for wind power production in Mexico.
Energies 18 01316 g017
Table 1. Sets corresponding to each parameter/variable and number of values required or generated in the SEN 2025 scenario.
Parameter/VariableSetsNumber of Values
Technologies (13)Generation Region (9)Consumption Region (9)Time Steps (8760)
CostXXXX9,224,280
Demand XX78,840
Availability factorXX X1,024,920
Installed capacityXX X1,024,920
Transmission capacity XXX709,560
Energy dispatchXXXX9,224,280
Disclaimer/Publisher’s Note: The statements, opinions and data contained in all publications are solely those of the individual author(s) and contributor(s) and not of MDPI and/or the editor(s). MDPI and/or the editor(s) disclaim responsibility for any injury to people or property resulting from any ideas, methods, instructions or products referred to in the content.

