Abstract
Battery cell voltage is an important evaluation index for electric vehicle condition estimation and one of the main monitoring parameters of the battery management system, and accurate voltage prediction is crucial for electric vehicle battery failure warning. Therefore, this paper proposes a novel hybrid gated recurrent unit and long short-term memory (GRU-LSTM) neural network to predict electric vehicle lithium-ion battery cell voltage. Firstly, Pearson coefficient correlation analysis is carried out to determine the input parameters of the neural network by analyzing the influence factors of the voltage parameters, and the hyperparameters of the neural network are determined through cross-validation to construct the lithium-ion battery single-unit voltage prediction model based on GRU-LSTM. Secondly, the voltage prediction accuracy and robustness of the GRU-LSTM model are verified by training the historical data of real vehicles in spring, summer, fall, and winter, combined with four different error indicators. Finally, the feasibility of the proposed method is verified by designing hierarchical warning rules based on the prediction data to realize the accurate warning of multiple voltage anomalies.
1. Introduction
Facing energy security and environmental challenges, new energy vehicles have become an international consensus and a key part of China’s national strategy, offering a crucial path to sustainable development [1,2]. In the field of new energy vehicles, lithium-ion power batteries are favored for their high energy density, long life, and no memory effect. However, with the increase in the number of new energy vehicles, the number of fire accidents due to power battery problems has increased [3]. These problems include overcharging, over-discharging, overheating, external and internal short-circuiting, electrolyte leakage, swelling [4,5], etc. These failures may trigger an abnormal increase in the internal temperature and pressure of the battery pack, which may lead to thermal runaway of the battery system. Among them, voltage abnormalities in the battery system are a major factor leading to failures, and these abnormalities include over-voltage, under-voltage, and single-unit voltage inconsistency [6].
Knowledge-based fault diagnosis techniques do not rely on precise mathematical models and can be categorized into the graph theory method [7], expert system method [8], and fuzzy logic method [9]. One study [10] established a fuzzy expert system model for battery packs by giving the rules used in the expert system based on the principles of fuzzy mathematics and fuzzy diagnosis. Another study [11] proposed a data-driven comprehensive judgmental reasoner model based on common battery pack failures as well as examples, combined with the experience of battery troubleshooting experts. Knowledge-based diagnosis methods do not require mathematical models and are easy to understand but still have limitations such as difficulty in knowledge acquisition and poor adaptive and learning abilities.
The model-based fault diagnosis method involves deriving estimated and actual measured values from the battery correlation model, calculating system residuals, and using these residuals as fault indicators to provide theoretical support for system fault diagnosis [12]. This type of generic fault diagnosis structure includes two major steps of residual generation and residual evaluation [13], which can be utilized for residual generation using the state estimation method [14] and parameter identification method [15], etc., for residual generation. Zhang Yuanxing et al. adjusted parameters such as battery charge state, voltage, and temperature in real time. They simulated the power battery charging response through online estimation of the battery model’s charge state and electric potential [16]. This method has improved the reliability of battery systems. However, it is limited by the complexity of the battery system, parameter variation, model generalization ability, and computational cost. Therefore, it needs to be combined with other techniques to enhance the accuracy and robustness of fault diagnosis.
Data-driven fault diagnosis methods based on data mainly include the machine learning method [17], information fusion method [18], multivariate statistical analysis [19], and other methods. Jiang et al. calculated the real-time state of each battery by utilizing the big data of EV operation from the EV network platform. They used the SRM algorithm to describe the internal characteristics of the battery and recorded the state changes to realize the fault diagnosis and thermal runaway warning of lithium-ion batteries [20]. Based on a large amount of data on the battery system of EVs, Barre, and Adnan et al. established the EV battery health state diagnostic model to achieve fault warning of the battery aging state [21,22]. Nuhic et al. utilized multiple fault diagnostic strategies, for example, a single-cell battery short-circuit fault diagnosis strategy based on interleaved voltage measurement topology and improved correlation coefficient methodology [23]. Hong et al. proposed a new loss function to solve the overfitting and distortion problems caused by training models using sparse data, which lays the foundation for a full life cycle study of battery BMSs [24]. Zhang et al. proposed a modified dual extended Kalman filter (MDEKF) method based on a modified gray wolf optimizer for state-of-charge (SOC) estimation and online parameter identification of lithium-ion batteries [25]. The method improves the accuracy and convergence speed of parameter estimation by optimizing the algorithm, which significantly improves the accuracy of battery state estimation. This study details the application of the improved gray wolf optimizer in battery parameter identification, which provides a new technical path for condition monitoring of lithium-ion batteries. In addition, Liu et al. proposed an improved method for state-of-health (SOH) prediction of lithium-ion batteries under different temperature conditions [26]. According to the above, power battery fault diagnosis methods are summarized and compared with the advantages and disadvantages of the methods in the literature, as shown in Table 1:

Table 1.
Comparative summary of power battery troubleshooting methods.
The power battery system itself is a complex nonlinear system, and its performance is affected by multiple factors such as the operating conditions of new energy vehicles, driving behavior, climate conditions, etc., which leads to differences in the failure mechanism of the same fault under different conditions. Most of the current research is based on the control variable method of the research idea of simulation and experimental testing, though there is a lack of analysis of the fault failure mechanism of the power battery system under multi-parameters. In addition, the traditional battery voltage prediction method lacks the ability to predict the voltage value in future periods except for estimating current–voltage characteristics through historical experimental data, and existing methods are also more difficult to use to detect and locate the voltage abnormality in the practical application of electric vehicles. The current multi-factor coupling research on lithium-ion battery modeling is still insufficient, and most of the studies are based on data analysis of a single influencing factor. Based on the above study, this paper proposes a new GRU-LSTM model for the prediction of single-cell voltage parameters of lithium-ion batteries for electric vehicles. Specifically, the following aspects highlight the differences and improvements compared to prior studies:
- (1)
- Unlike many existing studies that rely on laboratory test data or simulations, this paper utilizes one year of actual operation data from electric vehicles, provided by the National Big Data Alliance of New Energy Vehicles (NDANEV). This approach overcomes the limitations of unrealistic simulation data and incomplete experimental data, which were common issues in previous research. By using real-world operational data, the study ensures that the model is more reflective of actual EV usage conditions and can better capture the complexities and variability associated with real driving scenarios.
- (2)
- The paper proposes a novel electric vehicle voltage prediction model based on the GRU-LSTM algorithm. This hybrid model leverages the strengths of both gated recurrent units (GRUs) and long short-term memory (LSTM) networks to address the limitations of traditional models. For instance, while LSTM and GRUs have been widely used for voltage prediction, they often struggle with long-term dependencies and parallel processing of time-series data. The proposed GRU-LSTM model aims to improve prediction accuracy and robustness by combining the efficient gating mechanisms of GRUs with the long-term memory capabilities of LSTM. In contrast to previous studies that have used a limited set of features or less rigorous feature selection methods, this paper employs a thorough data selection and analysis process. The key feature parameters are screened using Pearson coefficient correlation analysis, which ensures that only the most relevant and informative features are used as input parameters. This approach enhances the model’s performance by reducing noise and focusing on the most significant factors that influence voltage characteristics. The hyperparameters of the model are determined through a cross-validation experiment, which is a more robust method compared to the arbitrary or experience-based selection of hyperparameters in some existing research. Additionally, the model’s accuracy and robustness are verified using four different error indexes, providing a comprehensive evaluation of its performance. This rigorous validation process ensures that the model is reliable and effective in predicting voltage characteristics under various conditions.
- (3)
- Existing research often focuses on voltage prediction without providing detailed analysis and warning mechanisms for voltage anomalies. This paper goes beyond prediction by establishing corresponding fault warning thresholds, warning states, and warning levels based on the predicted data. Furthermore, it divides voltage abnormality levels and types, allowing for graded warnings and in-depth analysis of specific voltage anomalies. This comprehensive approach not only predicts voltage characteristics but also provides actionable insights for early fault detection and prevention, thereby enhancing the safety and reliability of EVs.
The rest of the paper is organized as follows: Section 1 describes the design of the EV battery cell voltage prediction model; Section 2 describes the data analysis and model hyperparameter determination; Section 3 details the model training results as well as the error analysis; Section 4 demonstrates the effectiveness of early warning for different voltage anomalies of EVs; and Section 5 concludes the paper.
2. Battery Cell Voltage Prediction Modeling
When an electric vehicle fails during charging, the voltage of its single battery or even the entire battery pack will deviate significantly from the normal value. The degree of deviation increases with the severity of failure. Therefore, the state of the electric vehicle can be judged in real time by monitoring the difference between the actual and predicted values of the single-battery voltage. The design of the electric vehicle battery voltage safety warning model is mainly divided into three steps: data acquisition, data prediction, and fault warning. Among them, the prediction of voltage data in the second step is a key component of the model, and only an accurate prediction of voltage fluctuation can provide an accurate warning range for the third step [27]. In this paper, the flowchart of electric vehicle battery voltage fault warning based on GRU-LSTM is shown in Figure 1:
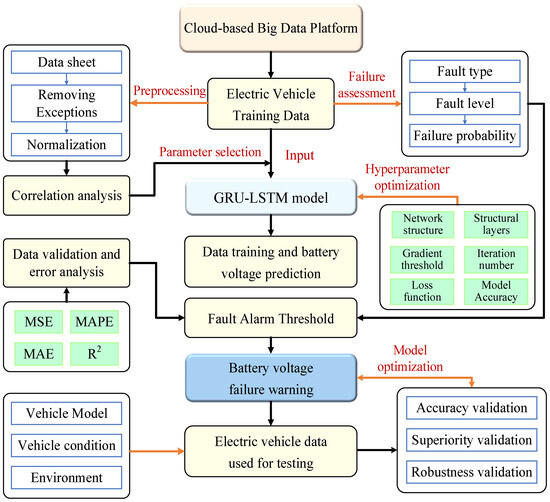
Figure 1.
Electric vehicle battery voltage fault warning flow chart.
3. Battery Voltage Prediction Model
The voltage prediction problem of electric vehicle battery is a typical time series data prediction problem, so the vehicle state EV(t) at the current moment and the battery state EV(t − 1) at the previous moment have the following relationship:
where f is the prediction model, and the specific input and output of the model can be calculated using Equation (2):
where h(t) is the input parameter state, which needs to be selected according to the specific dataset (e.g., battery current, SOC, etc.), w is the weight matrix assigned, and b is the bias matrix. The relevant neural networks are described in detail next.
The Recurrent Neural Network (RNN) is a common prediction method. One of its best features is that certain outputs of a neuron can be re-transmitted as inputs, allowing it to retain and use previous information. However, while RNNs can process complete sequential information, they lack long-term memory capabilities. This can lead to issues such as gradient vanishing and gradient explosion. LSTM (Long Short-Term Memory) is a special type of Recurrent Neural Network (RNN) architecture that controls the flow of information through a gated recurrent mechanism designed with an input gate, a forgetting gate, and an output gate. These gating mechanisms allow the LSTM network to selectively remember or forget information in the input sequence, solving the gradient vanishing or gradient exploding problem. The GRU (gated recurrent unit) is a simplified version of LSTM, which merges the input and forgetting gates, thus reducing the number of parameters. Compared to LSTM, the GRU has a simpler structure and is more computationally efficient, so the model can be trained faster in some cases. Figure 2 illustrates the basic LSTM network structure unit.
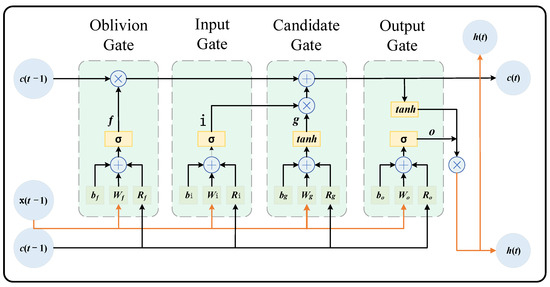
Figure 2.
LSTM network architecture unit.
Where the previous-moment LSTM cell hiding state is associated with the bias component, and the weight and bias components of each gate are calculated with Equation (3). and denote the weight component of each gate, and denotes the bias component of each gate, respectively.
At moment t, the output of each gate of LSTM is divided into the following:
where represents the Sigmoid activation function of the forgetting gate, input gate, and output gate, and its value range is (0, 1); represents the value of the hidden layer in the previous moment; represents the output of the forgetting gate; represents the output of the input gate; represents the output of the candidate gate; and represents the output of the output gate. After activation function processing, the output will be very close to 0 or 1. When the output value is close to 0 the information contained in the previous cell will be forgotten; otherwise, vice versa, the relevant information of the previous cell will be memorized. After that, the state of the LSTM network cell can be solved computationally based on the relationship between the gates:
where denotes the current state of the LSTM network cell; denotes the state value of the LSTM network cell at the previous moment; and denotes the Hadamard product of the computation matrix, i.e., the multiplication of the corresponding positional elements of the two matrices.
Finally, the updated unit state is processed by the function to obtain the output value, the calculated value is controlled through the output gate, the required output value is appropriately filtered, and the hidden state of the LSTM unit is the following:
The GRU unit, on the other hand, simplifies the gating structure of LSTM to achieve the effect of improving the computational speed, and Figure 3 illustrates the basic GRU network structure.
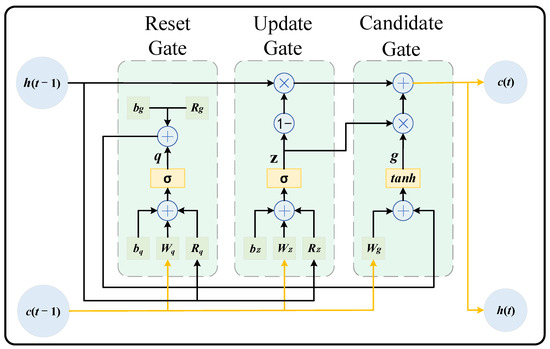
Figure 3.
GRU network architecture.
As shown in Figure 3, the structure of the GRU is similar to that of the LSTM unit, but compared to the LSTM unit, the GRU merges the forgetting gate and input gate in the LSTM unit into a brand new update gate, and this improved method can effectively reduce the information received by the gate and reduce the risk of model overfitting. The weight and bias components of each gate of the GRU unit are shown in Equation (12).
At the moment t, the outputs of each gate of the GRU are as follows:
Based on the previous analysis, this paper proposes a hybrid GRU-LSTM neural network as shown in Figure 4. The LSTM neural network has more gates than the GRU neural network, which can guarantee the accuracy of the algorithm well, while the GRU neural network has fewer structural parameters than the LSTM, and the combination of the LSTM and GRU neural networks can learn more training information and achieve faster computation speed. Therefore, combining LSTM and GRU can achieve greater learning capability using fewer network parameters.
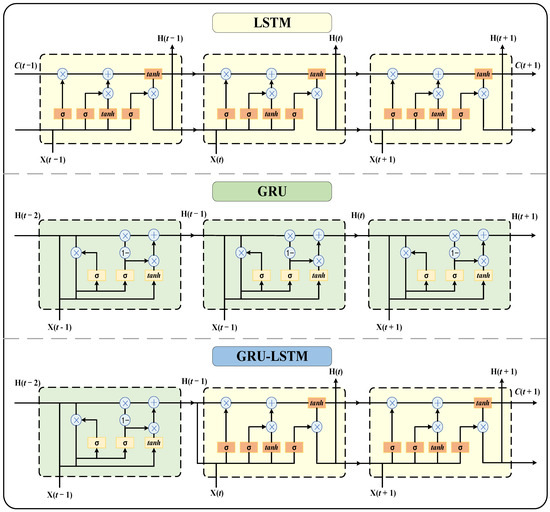
Figure 4.
GRU-LSTM hybrid model structure.
The specific internal structure of the GRU-LSTM model proposed in this paper is shown in Figure 5. After inputting the historical time series data of battery voltage, data preprocessing is carried out on it, short-term dependent feature behaviors are extracted by the GRU module, and long-term dependent feature behaviors are extracted by the LSTM module, after which the outputs of the two modules are fused with features, the predicted voltage value is obtained through the fully connected layer, and, if it does not satisfy the demand for iterative accuracy, cyclic training is carried out; if it satisfies the demand for iterative accuracy, after the inverse normalization process, the final predicted value is obtained.
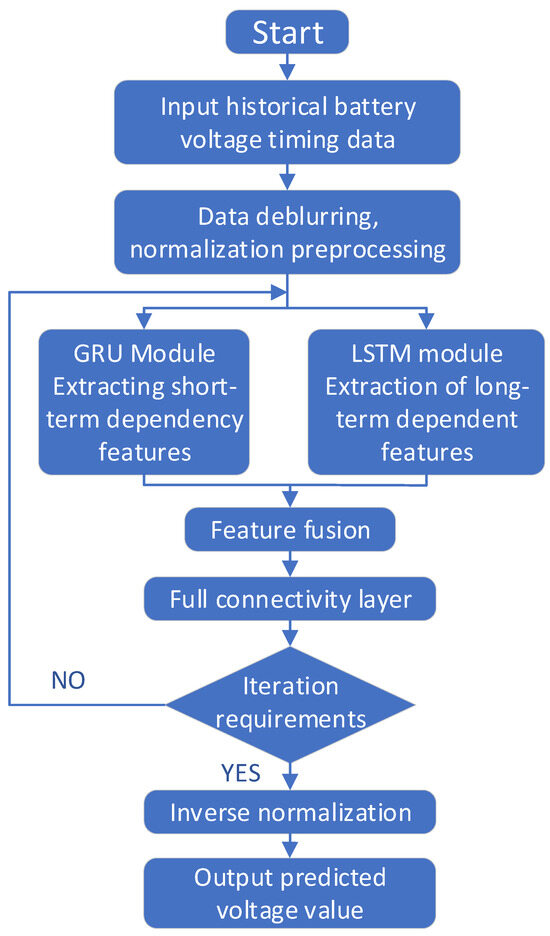
Figure 5.
Flowchart of the GRU-LSTM prediction model.
4. Data Analysis and Model Hyper Parameterization
4.1. Parameters Selection
The vehicles studied in this paper are electric cabs fitted with ternary lithium-ion battery packs. Table 2 summarizes the main parameters of one of the studied vehicles, where the battery pack consists of 96 individual cells with a total energy of 54.4 kWh, an energy density of 125 Wh/kg, and a rated voltage of 350 V.
Table 2.
The main parameters of electric vehicles.
Since factors such as driving behavior, charging behavior, and weather all affect the characteristics of EV battery voltage, to achieve a comprehensive analysis during both vehicle driving hours and vehicle charging hours, correlation analysis needs to be performed when pre-processing the input dataset so that several of the above factors can be considered at the same time when predicting the battery voltage. As an example, some typical parameter profiles for one day of vehicle operation data from 19 November 2020 are shown in Figure 6. As can be seen from the partial view in Figure 6, the voltage and current curves are inversely proportional when the EV transitions from the driving state to the charging state. However, it is difficult to see the precise relationship between the various parameters and the battery voltage just from these curves.
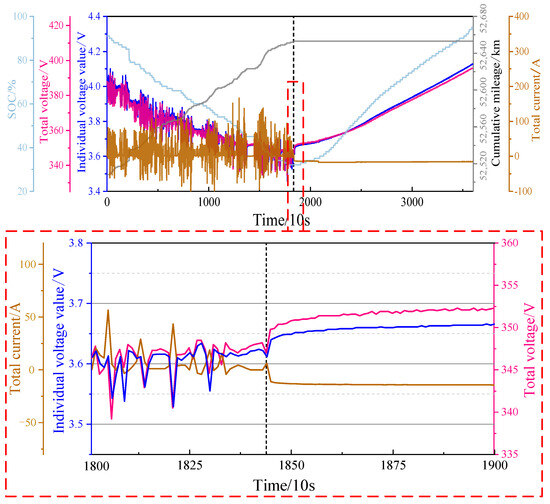
Figure 6.
Electric vehicle battery-related parameter curve.
In order to better construct the model to adapt to various datasets, the selection of parameters is particularly important. Ten parameters, including battery cell voltage, cell temperature, and current, are first considered as the training parameters of the voltage model. However, there are some weak correlations between these parameters, which can cause them to interfere with each other during the training process. Therefore, correlation analysis of all input parameters before training the dataset is very necessary, and the selection of input parameters with strong correlations with the study parameters can be better analyzed and studied, i.e., a more reasonable data selection can be made according to different datasets, which can also make the method have a wider application. Using the Pearson correlation coefficient (PCC), which is widely used in scientific research, the correlation between two variables is defined as the quotient of the covariance and the standard deviation of the two variables:
where and denote the mean and standard deviation of the samples, respectively, and Pearson correlation coefficient, , is obtained according to Equation (18). and denote the mean of the samples and , respectively.
The Pearson correlation coefficients between the 10 parameters selected in this paper are shown in Figure 7. From Figure 7, it can be seen that the matching parameters related to voltage are the cell temperature, total current, SOC, drive motor temperature, and drive motor speed, while accumulated mileage and insulation resistance are weakly correlated with other parameters.
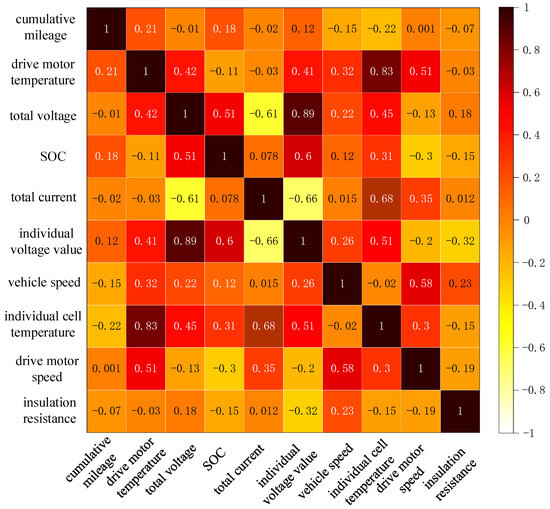
Figure 7.
Pearson correlation coefficient between influencing factors.
The correlation coefficients between the influencing factors of electric vehicle batteries are shown in Table 3. The correlation coefficient between monomer voltage and monomer temperature is 0.68, indicating a strong positive correlation between the two. This means that changes in monomer temperature may significantly affect the monomer voltage, and thus monomer temperature is an important factor in predicting monomer voltage. The correlation coefficient between total voltage and monomer voltage is 0.89, showing a very strong positive correlation; this is because the monomer voltage is the basic unit that constitutes the total voltage. The correlation coefficient between total current and unit voltage is 0.26, and although the correlation is not as strong as that between total voltage and unit temperature, it still shows that the total current has a certain influence on the unit voltage. The correlation coefficient between the SOC (state of charge) and unit voltage is 0.51, which shows that the state of charge has a moderate influence on the unit voltage. The correlation coefficient between the drive motor temperature and the cell voltage is 0.41, showing a moderately strong positive correlation, which may be due to the fact that variations in the motor temperature affect the operating state of the battery, which in turn affects the cell voltage.
Table 3.
Correlation coefficients between factors affecting electric vehicle batteries.
Finally, we analyzed the correlations among all matchable parameters. Based on this analysis, five input parameters were selected for training the voltage fitting model. These parameters are the battery cell temperature, total voltage, total current, SOC (state of charge), and drive motor temperature.
4.2. Determination of Hyperparameters
For prediction models, it is usually necessary to train with a large amount of data to achieve the function of prediction. In neural network training, due to the characteristics of the gradient descent method, once all the data are used for training, the network parameters obtained are often not optimal, and it is usually necessary to repeatedly train the network parameters before they converge to the optimal value along the direction of the gradient descent method.
In this paper, we use the battery data of 10 electric cars of two models for training. Among the conventional parameters for training the model are the number of hidden layer nodes, the number of single training iterations (Epoch), the batch size, the learning rate, the activation function, and the loss function. Parameters such as the activation function and loss function are only for the optimization of the training process of the network but have a limited impact on the model accuracy, and the parameters that have a key impact on the model accuracy are the number of nodes in the hidden layer, the number of single training iterations, the batch size, and the learning rate. Therefore, this paper determines the optimal values of the above parameters of the neural network model through cross-validation tests.
First, cross-experiments are conducted from the perspective of the number of hidden layer nodes and the number of single training iterations, with the first 80% of the original dataset used for training, the second 20% used for testing, and the RMSE used as the output to determine the optimal number of hidden layer nodes and the number of single training iterations, or Epochs, through the error curve.
From Figure 8, it can be seen that the training effect is better when the number of hidden layer nodes is 120, the number of iterations is 60, and the RMSEs are all below 1.5%. Therefore, the number of iterations of 60 and the number of hidden layer nodes of 120 are chosen as the best parameters of the model.
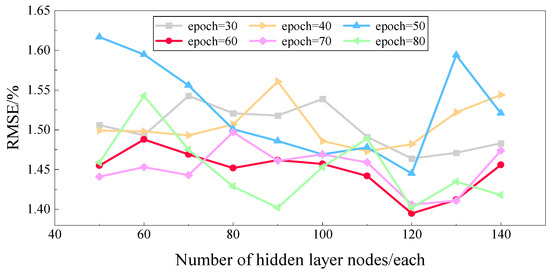
Figure 8.
Training under different hidden layer nodes and iteration times.
Batch size and learning rate are also two important parameters for model training. As the dataset in the study of this paper is relatively large, the dataset needs to be processed in batches, but if the batch size is blindly increased, the training complexity will increase; in addition, during the training process, the size of the learning rate will directly affect the convergence of the model. Therefore, different batch sizes and learning rates are set for cross-validation experiments. MAE values of test data are calculated based on different batch sizes and learning rates for verifying the prediction accuracy of the battery voltage, as shown in Figure 9. From Figure 9, it can be seen that the model exhibits the best test performance when the batch size is 64 and the learning rate is 0.005.
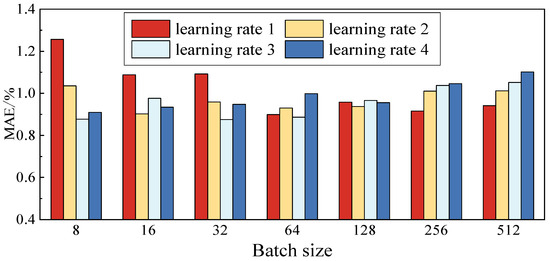
Figure 9.
Training of different batch sizes at different learning rates.
Based on the above analysis, firstly, we employed the grid search method to conduct an exhaustive search for the key hyperparameters of the model. We meticulously defined a parameter grid that encompasses several crucial parameters, including the learning rate, the number of iterations, and the number of hidden layer units. Secondly, during the hyperparameter optimization process, we adopted the cross-validation method to rigorously evaluate the model’s performance. By partitioning the dataset into multiple subsets and conducting training and validation on different subsets, we effectively ensured the robustness and reliability of hyperparameter selection. Finally, through the results of the cross-validation experiments, we successfully identified the optimal hyperparameters of the model. The specific hyperparameters are presented in Table 4:
Table 4.
The final hyperparameter of the model.
5. Data Analysis and Model Hyper Parameterization Training Results and Error Analysis
After the training and optimization of the hyperparameters of the neural network, the reliability and validity of the model were ensured, and then, the mean squared error (MSE), the mean absolute error (MAE), the mean absolute percentage error (MAPE), and the coefficient of determination (R-squared, R2) were used to comprehensively evaluate the prediction performance of the model, given in the following formulas:
where denotes the sample size, denotes the true value of the voltage of the th sample, denotes the predicted value of the voltage of the th sample, and denotes the average of the predicted values of the voltage of the th sample.
5.1. Model Accuracy Validation
In this paper, the accuracy of the model is analyzed using one day’s operation and charging data of a single electric vehicle, and Figure 10 illustrates the results of comparing the true and predicted values of the battery’s voltage and the battery pack voltage.
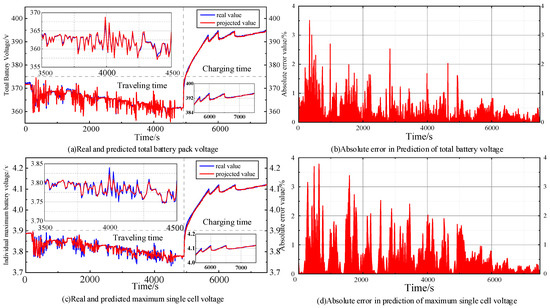
Figure 10.
Battery voltage fitting during driving and charging periods.
As can be seen from Figure 10, the GRU-LSTM model achieves good prediction results. The MAE for the total battery voltage and the individual battery voltage are 1.713% and 1.822%, respectively. Figure 10 demonstrates a driving and charging process, and the voltage profiles show different characteristics in the driving and charging states. During driving hours, the power output of the electric vehicle’s drive system is adjusted according to the driving demand, which leads to changes in voltage parameters. The charging period curve appears to be more regular than the driving period, but at the end of the charging period curve, it can be seen that the voltage has changed in a jagged manner, which is because the charging current and charging rate of the electric vehicle may change at the end of the charging period, resulting in a corresponding change in voltage.
5.2. Model Superiority Validation
In order to reflect the superiority of the proposed algorithms in this paper, real vehicle data are used for validation and the predicted results under the three algorithms are shown in Figure 11.
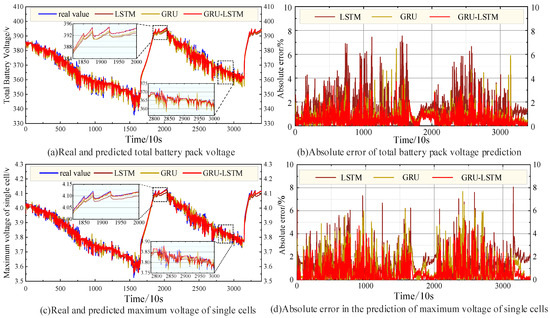
Figure 11.
Prediction results and absolute errors of three algorithms.
According to Figure 11, it can be seen that the voltage prediction of the GRU-LSTM model proposed in this paper is better than the LSTM model and the GRU model. Among them, in terms of total battery voltage prediction, the MAE value of the LSTM model is 1.634%, the MAE value of the GRU model is 1.427%, and the MAE value of the GRU-LSTM model is 1.085%; in terms of individual battery voltage prediction, the MAE value of the LSTM model is 1.348%, the MAE value of the GRU model is 1.187%, and the MAE value of the GRU-LSTM model is 0.985%.
Figure 12 shows the R2 values of the prediction effect of the three algorithms, where the R2 value is closer to 1, indicating the better model fitting effect. Compared to the prediction effect of the LSTM algorithm and the GRU algorithm, the R2 value of the GRU-LSTM algorithm proposed in this paper is 0.994, and the prediction results are more centralized, i.e., the prediction effect is better, reflecting the superiority of the model proposed in this paper.
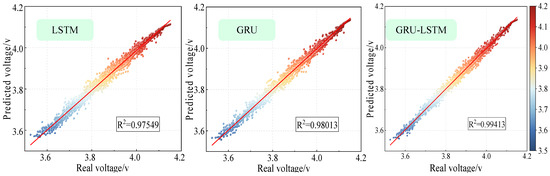
Figure 12.
The R2 values of the results predicted by the three algorithms.
5.3. Model Robustness Validation
To comprehensively evaluate the stability and reliability of the proposed GRU-LSTM model under different environmental conditions, four representative dates, 15 April, 15 July, 15 October, and 15 January 2020, were selected as training data. These four dates represent spring, summer, fall, and winter, covering the different temperatures and usage conditions that EV lithium-ion batteries may encounter. In this way, the variation in battery performance throughout the year can be simulated to verify the robustness of the model, and Figure 13 shows the voltage parameter curves of a single cell before and after prediction for the four seasons.
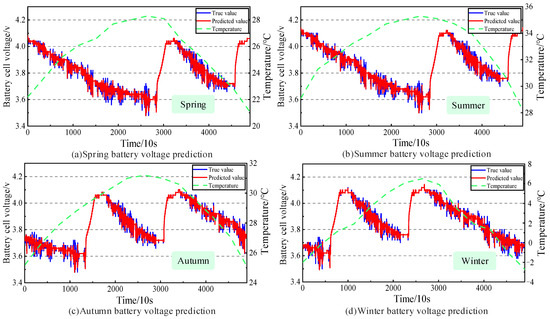
Figure 13.
Battery voltage prediction effect in different seasons.
Figure 14 illustrates the prediction error metrics for the four seasons, where MSE is 0.017 7%, 0.018 5%, 0.019 1%, and 0.031 9%; MAE is 0.739%, 0.767%, 0.778%, and 1.016%; MAPE is 0.196%, 0.201%, 0.211%, and 0.267%; and R2 is 0.993, 0.991, 0.989 and 0.982, respectively.
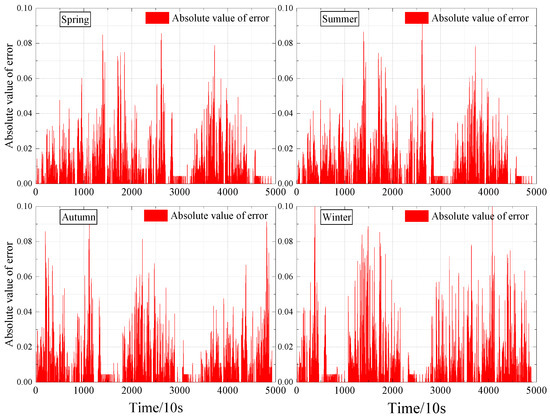
Figure 14.
Absolute value of battery voltage prediction error for different seasons.
Figure 14 represents the absolute errors of the predictions for the four seasons, and we provide an in-depth analysis of the causes of the errors in the prediction models, with a special focus on the reduced prediction performance in winter. Through the residual analysis plots, we observe that the prediction errors show a clear trend under different time and driving conditions. In winter, the volatility of the battery performance increases due to the reduced chemical activity of the battery and the decrease in ambient temperature, leading to an increase in the model prediction error. In addition, the residual plots show that the errors are also more significant under certain specific driving conditions, such as high-speed driving or frequent acceleration and deceleration.
According to Figure 13, Figure 14 and Figure 15, it can be seen that the proposed GRU-LSTM model has better prediction performance in all four seasons, especially in spring, summer, and fall than in winter. In winter, the lower outdoor temperature reduces the actual capacity of the battery. This leads to a lower cutoff voltage and more drastic voltage fluctuations when the vehicle is traveling. As a result, predicting battery voltage is more challenging in winter than in other seasons. Therefore, the GRU-LSTM model proposed in this paper is highly robust and adaptable. It provides data support for subsequent warning work and makes the warning method feasible.
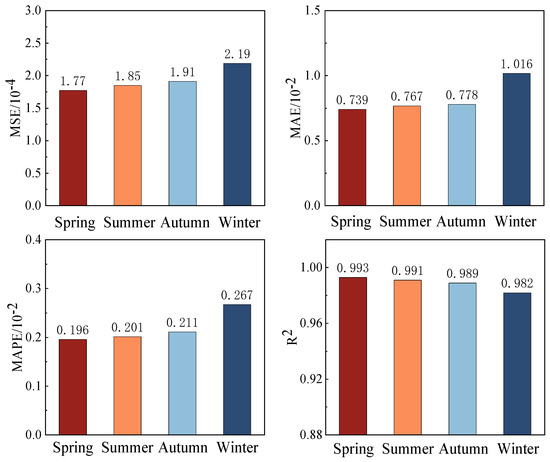
Figure 15.
Battery voltage prediction error metrics for four seasons.
6. Early Warning of Abnormal Voltage Conditions
In the previous section, the single-unit voltage data were obtained by predicting the battery voltage of electric vehicles, the voltage anomalies were analyzed through the predicted data, and the types of early warning, classification ranges, and corresponding processing measures were given in combination with the fitted data. According to the standard T/CSAE 254-2022 [28], Table 5 lists the alarm thresholds of the studied battery system voltage abnormalities and the corresponding processing measures. It should be noted that this method applies to other battery systems, but the parameters of different types of batteries will vary, and the corresponding alarm thresholds will also change.
Table 5.
Alarm thresholds and handling measures for abnormal battery voltage.
As can be seen from Table 5, this paper proposes that the voltage-related alarm thresholds are categorized into three levels, i.e., primary alarm, secondary alarm, and tertiary alarm. The three-level alarm state is also a safety state, which requires regular checking of the battery’s capacity and other key parameters, and attention to prevent the battery voltage from deteriorating; the two-level alarm state means that the battery is in a dangerous state, which requires stopping the car and checking the location where the alarm occurs under permissible conditions; when the first-level alarm is triggered, drivers need to stop the car or wait for the professionals to arrive at a safe place and for the relevant personnel to confirm the abnormal situation.
In order to verify the effectiveness of the method for voltage anomaly warning, this paper analyzes the specific voltage anomalies based on the actual battery data with faults, and the real and predicted voltage curves of the study vehicles are shown in Figure 16.
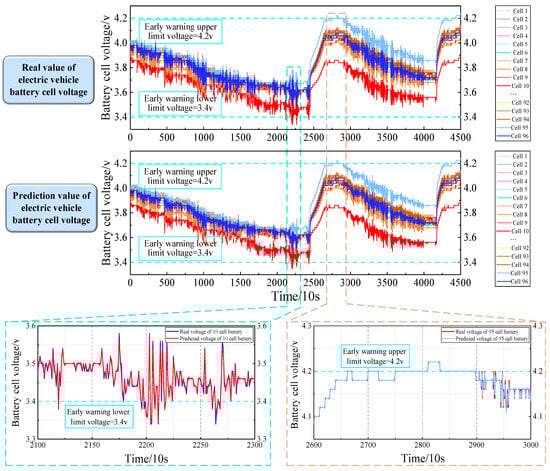
Figure 16.
The real voltage and predicted voltage curve of vehicle battery are studied.
As can be seen in Figure 16, the EV was driven twice and charged twice during the day, starting at 9:34:01 a.m. on 29 October 2020. Battery 10 experienced an undervoltage alarm from 15:27:10 p.m. to 15:52:38 p.m., and Battery 95 cell experienced an overvoltage alarm from 16:58:11 p.m. to 17:37:34 p.m. and was in operation since the vehicle began operating that day. From then, the Battery 10 cell exhibited different fluctuation characteristics from the other cells and remained at a lower voltage than the other cells at all times, which indicates that the Battery 10 cell may have had a more serious aging problem than the other cells and needed to be replaced promptly; otherwise, it would greatly affect the cycle life of the battery pack.
In addition, the Battery 95 cell began to separate during the first charge. During subsequent charging and driving, it had a higher voltage than the other batteries. Near the end of the first charge, an overvoltage alarm occurred. This could have been due to the reduced capacity of the Battery 95 cell. Its voltage was not aligned with the rest of the batteries in the group, leading to over-charging and triggering the overvoltage alarm.
According to the predicted single-cell voltage data, to calculate the voltage pressure difference, single-cell voltage mean, and standard deviation, in which the single-cell voltage difference changes as shown in Figure 17, each cell single-cell voltage pressure difference is less than 0.3 V; that is, it is in a normal state, with no alarm information.
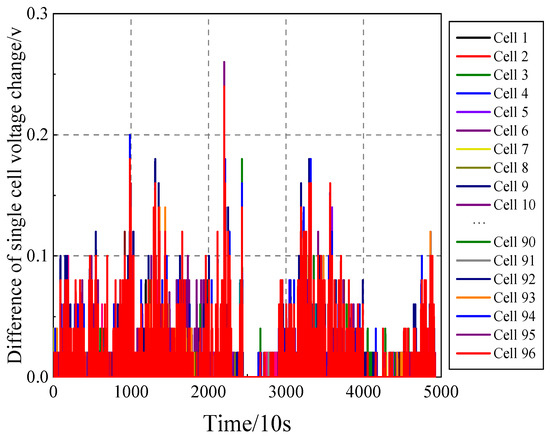
Figure 17.
Change in voltage difference in a single battery.
Figure 18 shows the standard deviation comparison between the real value and the predicted value. From Figure 18, it is easy to see that the standard deviation of the voltage has a significant upward trend when the electric vehicle transitions from the driving state to the charging state, with a standard deviation value greater than 0.03 at the beginning of the first charging and the second level of the alarm of the poor battery voltage consistency occurring; this is because, in the charging stage, the individual battery a has different capacity, health degree, and other parameters. This is due to the fact that during the charging stage, the inconsistency of the battery properties is more obvious.
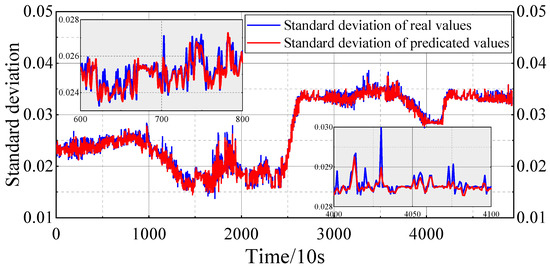
Figure 18.
Standard deviation comparison between the true value and the predicted value.
Traditional early warning methods are generally carried out based on fixed thresholds and according to different types of batteries; by setting the corresponding fault thresholds, the system determines that a voltage fault occurs when the actual voltage data exceeds the fixed thresholds. In addition, this paper sets the dynamic warning range based on the mean and standard deviation of the single-cell voltage and realizes the dynamic warning of the highest/lowest voltage of the single cell at the side end of the car. Since the voltage of each battery in the same electric vehicle actually follows a normal distribution, the normal distribution is a distribution that is uniquely determined by the mean and the standard deviation . In the normal distribution, the interval is the range of values over which the random variable may fall. In the normal distribution, the interval is the actual possible value of the random variable interval, and if the probability of falling outside the interval is less than three thousandths, in the actual problem, it is generally considered that this event will not occur if the voltage exceeds the interval, recognized as anomalous. Based on the fitted voltage data, the voltage mean value and standard deviation are calculated according to the formula, n is the number of samples, i.e., the number of batteries, and is the voltage value of the th sampling point.
Therefore, in this paper, the interval is used as the threshold range for dynamic warning to realize the dynamic warning of the highest/lowest single-cell voltage at the automobile end. As shown in Figure 19, during the first charging stage, the highest single-cell voltage exceeds the dynamic threshold range, triggering an alarm. Similarly, during the driving stage, the highest single-cell voltage exceeds the dynamic threshold range from the beginning. This indicates that there are inconsistencies in one or more batteries within the battery pack. It also proves the effectiveness and feasibility of the method for timely early warning of voltage anomalies in electric vehicles.
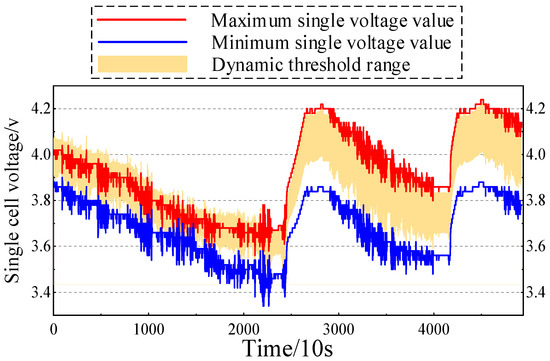
Figure 19.
Dynamic early-warning effect of maximum/minimum cell voltage.
7. Conclusions
In this study, the voltage prediction of lithium-ion batteries in electric vehicles was thoroughly investigated. By combining the data-driven approach with the voltage prediction of single batteries and utilizing the actual operation data of electric vehicles, the proposed GRU-LSTM model can efficiently predict the multidimensional battery voltage parameters. The accuracy and validity of the model are fully proved by comparing and verifying with single-structure models. In terms of single-cell voltage prediction, the mean absolute errors (MAE) of LSTM, GRU, and GRU-LSTM are 1.348%, 1.187%, and 0.985%, respectively, which indicate that the GRU-LSTM model has significant superiority. In addition, the stability and robustness of the model are verified by seasonal prediction. Measuring the seasonal prediction errors in terms of mean square error (MSE), mean absolute error (MAE), mean absolute percentage error (MAPE), and the coefficient of determination (R2), GRU-LSTM performs well throughout the year and especially outperforms the winter months in spring, summer, and fall. Based on voltage anomaly classification and alarm level, accurate voltage prediction can set the threshold for effective anomaly warning. By analyzing actual faulty battery data from multiple perspectives, it is verified that the model is able to accurately warn of voltage anomalies of lithium-ion batteries in electric vehicles.
Although this study has achieved significant results in the voltage prediction of lithium-ion batteries, there are still some directions that deserve further exploration. First, the current study mainly focuses on lithium-ion batteries, and in the future, the model is planned to be applied to other types of battery systems, such as lithium iron phosphate (LFP) and solid-state batteries. LFP batteries have a broad application prospect in the field of electric vehicles due to their high safety, long cycle life, and good thermal stability. However, the voltage characteristics of LFP batteries differ from those of lithium-ion batteries, so further model optimization is needed to adapt to their characteristics. In addition, solid-state batteries, as the next-generation battery technology, have higher energy density and safety, but their voltage dynamic behavior is more complex, and the applicability of the model and the direction of improvement need to be explored.
Second, this study has not yet been tested in a real vehicle environment. In the future, we plan to integrate the GRU-LSTM model into the real-time battery management system (BMS) of electric vehicles to verify its performance and reliability under complex working conditions. The integration of GRU-LSTM model with BMS can not only improve the accuracy of voltage prediction but also provide more accurate decision support for battery health management. In addition, considering the effects of different operating conditions (e.g., high currents, extreme temperatures, and battery aging) on voltage prediction, future research will carry out more extensive experimental validation to evaluate the robustness of the model under extreme conditions. This will help to further optimize the model structure and parameters to enhance its adaptability and reliability in practical applications.
Author Contributions
Conceptualization, L.Z. and Q.W.; investigation, L.W. and L.L.; resources, L.Z., Q.W. and L.W.; writing—original draft, L.Z., Q.W., L.W., L.L., L.J. and Y.S.; writing—review and editing, L.Z., Q.W., L.W., L.L. and Y.S.; supervision, L.Z.; funding acquisition, L.J. and Y.S. All authors have read and agreed to the published version of the manuscript.
Funding
This research was funded by the Key R&D Program of the Jilin Provincial Science and Technology Department under Grant 20220203052SF.
Data Availability Statement
The original contributions presented in the study are included in the article, further inquiries can be directed at the corresponding author.
Conflicts of Interest
Author Linru Jiang was employed by the company China Electric Power Research Institute Limited. The remaining authors declare that the research was conducted in the absence of any commercial or financial relationships that could be construed as a potential conflict of interest.
References
- Li, J.; Li, Y.; Lv, C.; Zhao, W.; Wu, Y.; Ma, S. Key Technology of Retired Batteries’ Screening and Clustering Under Target of Carbon Neutrality. Power Syst. Technol. 2022, 46, 429–441. [Google Scholar] [CrossRef]
- Fang, X.; Xie, L.; Dimarogonas, D.V. Simultaneous distributed localization and formation tracking control via matrix-weighted position constraints. Automatica 2025, 175, 112188. [Google Scholar] [CrossRef]
- Bo, L.; Zheng, H.; Zhang, S.; Wu, Q.; Fan, J. Review on health state equalization technology for lithium batteries. Electr. Meas. Instrum. 2023, 60, 11–18. [Google Scholar] [CrossRef]
- Peng, X.; Ma, H.; Xu, H.; Li, C.; Wu, Y.; Qian, K. A new method for early warning of abnormal working conditions of energy storage batteries based on vibration. Electr. Meas. Instrum. 2023, 60, 167–171. [Google Scholar] [CrossRef]
- Yu, D.; Yang, C.; Jiang, L.; Li, T.; Yan, G.; Gao, F.; Liu, H. Review on Safety Protection of Electric Vehicle Charging. Proc. CSEE 2022, 42, 2145–2164. [Google Scholar] [CrossRef]
- Cai, T.; Zhang, Z.; Yuan, A.; Shi, Z.; Zhang, B. Review of machine learning for safety management of li-ion battery energy storage. Power Syst. Prot. Control 2022, 50, 178–187. [Google Scholar] [CrossRef]
- Liu, P.; Zuo, H.; Su, Y.; Sun, J. Review of Research Progresses for Graph-based Models in Fault Diagnosis Method. China Mech. Eng. 2013, 24, 696–703. [Google Scholar]
- Filippetti, F.; Martelli, M.; Franceschini, G.; Tassoni, C. Development of expert system knowledge base to on-line diagnosis of rotor electrical faults of induction motors. In Proceedings of the Conference Record of the 1992 IEEE Industry Applications Society Annual Meeting, Houston, TX, USA, 4–9 October 1992; Volume 1, pp. 92–99. [Google Scholar]
- Liu, J.; Li, Q.; Chen, W.; Yan, Y. A Fault Diagnosis Method of Fuel Cell Systems for Tramways Based on the Multi-class Relevance Vector Machine and Fuzzy C Means Clustering. Proc. CSEE 2018, 38, 6045–6052. [Google Scholar] [CrossRef]
- Gong, M.; Wu, J.; Jiao, C. SOC Estimation Method of Lithium Battery Based on Fuzzy Adaptive Extended Kalman Filter. Trans. China Electrotech. Soc. 2020, 35, 3972–3978. [Google Scholar] [CrossRef]
- Hong, J.; Liang, F.; Yang, H.; Li, K. Research on Intelligent Safety Management and Control Methods for Big-data-driven Battery Systems. Automot. Eng. 2023, 45, 1845–1861. [Google Scholar] [CrossRef]
- Wang, P.; Zhang, J.; Cheng, Z. State of Health Estimation of Li-ion Battery Based on Least Squares Support Vector Machine Error Compensation Model. Power Syst. Technol. 2022, 46, 613–623. [Google Scholar] [CrossRef]
- Dong, G.; Lin, M. Model-based thermal anomaly detection for lithium-ion batteries using multiple-model residual generation. J. Energy Storage 2021, 40, 102740. [Google Scholar] [CrossRef]
- Qian, Y.; Yang, B.; Zheng, R.; Liang, B.; Wu, P. State-of-health Estimation of Lithium-ion Batteries Based on EMD-DO-Elman and GRA. Power Syst. Technol. 2024, 48, 3695–3704. [Google Scholar] [CrossRef]
- Wang, J.; Song, J.; Li, Y.; Ren, T.; Yang, Z. State of charge estimation for lithium-ion battery based on improved online parameters identification and adaptive square root unscented Kalman filter. J. Energy Storage 2024, 77, 109977. [Google Scholar] [CrossRef]
- Zhang, H.; Hong, J.; Li, K. A fast data analysis method for abnormity detecting of lithium-ion batteries in electric vehicles. J. Energy Storage 2024, 84, 110855. [Google Scholar] [CrossRef]
- Wang, Z.; Yang, Z.; Luo, W.; Lu, Y. Review of Remaining Useful Life Prediction for Lithium-ion Battery Based on Data-driven. Sci. Technol. Eng. 2023, 23, 6279–6289. [Google Scholar]
- Peng, Y.; Xia, F.; Yuan, B.; Wang, Z.; Luo, Z. Fault Diagnosis of Traction Battery Pack Based on Improved Convolution Neural Network and Information Fusion. Automot. Eng. 2020, 42, 1529–1536. [Google Scholar] [CrossRef]
- Wang, G.; Zhao, J.; Yang, J.; Jiao, J.; Xie, J.; Feng, F. Multivariate statistical analysis based cross voltage correlation method for internal short-circuit and sensor faults diagnosis of lithium-ion battery system. J. Energy Storage 2023, 62, 106978. [Google Scholar] [CrossRef]
- Jiang, L.; Deng, Z.; Tang, X.; Hu, L.; Lin, X.; Hu, X. Data-driven fault diagnosis and thermal runaway warning for battery packs using real-world vehicle data. Energy 2021, 234, 121266. [Google Scholar] [CrossRef]
- Barré, A.; Suard, F.; Gérard, M.; Montaru, M.; Riu, D. Statistical analysis for understanding and predicting battery degradations in real-life electric vehicle use. J. Power Sources 2014, 245, 846–856. [Google Scholar] [CrossRef]
- Kang, Y.; Duan, B.; Zhou, Z.; Shang, Y.; Zhang, C. A multi-fault diagnostic method based on an interleaved voltage measurement topology for series connected battery packs. J. Power Sources 2019, 417, 132. [Google Scholar] [CrossRef]
- Nuhic, A.; Terzimehic, T.; Soczka-Guth, T.; Dietmayer, K. Health diagnosis and remaining useful life prognostics of lithium-ion batteries using data-driven methods. J. Power Sources 2013, 239, 680. [Google Scholar] [CrossRef]
- Hong, J.; Zhang, H.; Zhang, X.; Yang, H.; Chen, Y.; Wang, F.; Huang, Z.; Wang, W. Online accurate voltage prediction with sparse data for the whole life cycle of Lithium-ion batteries in electric vehicles. Appl. Energy 2024, 369, 123600. [Google Scholar] [CrossRef]
- Qian, K.; Liu, X.; Wang, Y.; Yu, X.; Huang, B. Modified Dual Extended Kalman Filters for SOC Estimation and Online Parameter Identification of Lithium-ion Battery via Modified Gray Wolf Optimizer. J. Automob. Eng. 2020, 101, 113756. [Google Scholar] [CrossRef]
- Liu, J.; Liu, X. An Improved Method of State of Health Prediction for Lithium Batteries Considering Different Temperature. J. Energy Storage 2023, 63, 107028. [Google Scholar] [CrossRef]
- Zhang, L.; Gao, T.; Cai, G.; Hai, K.L. Research on electric vehicle charging safety warning model based on back propagation neural network optimized by improved gray wolf algorithm. J. Energy Storage 2022, 49, 104092. [Google Scholar] [CrossRef]
- T/CSAE 254-2022; Specification for Battery System Safety Risk Monitoring and Fault Early Warning in Electric Vehicle Charging Process. Society of Automotive Engineers of China: Foshan, China, 2022.
Disclaimer/Publisher’s Note: The statements, opinions and data contained in all publications are solely those of the individual author(s) and contributor(s) and not of MDPI and/or the editor(s). MDPI and/or the editor(s) disclaim responsibility for any injury to people or property resulting from any ideas, methods, instructions or products referred to in the content. |
© 2025 by the authors. Licensee MDPI, Basel, Switzerland. This article is an open access article distributed under the terms and conditions of the Creative Commons Attribution (CC BY) license (https://creativecommons.org/licenses/by/4.0/).