
Simulation of Low-Salinity Water-Alternating Impure CO2 Process for Enhanced Oil Recovery and CO2 Sequestration in Carbonate Reservoirs


Abstract
1. Introduction
2. Materials and Methods
2.1. CO2-Enhanced Oil Recovery
2.2. Geochemical Reaction
2.3. Low-Salinity Water Injection
2.4. Fluid Modeling
2.5. Reservoir Modeling
2.6. Injection Design
3. Results and Discussions
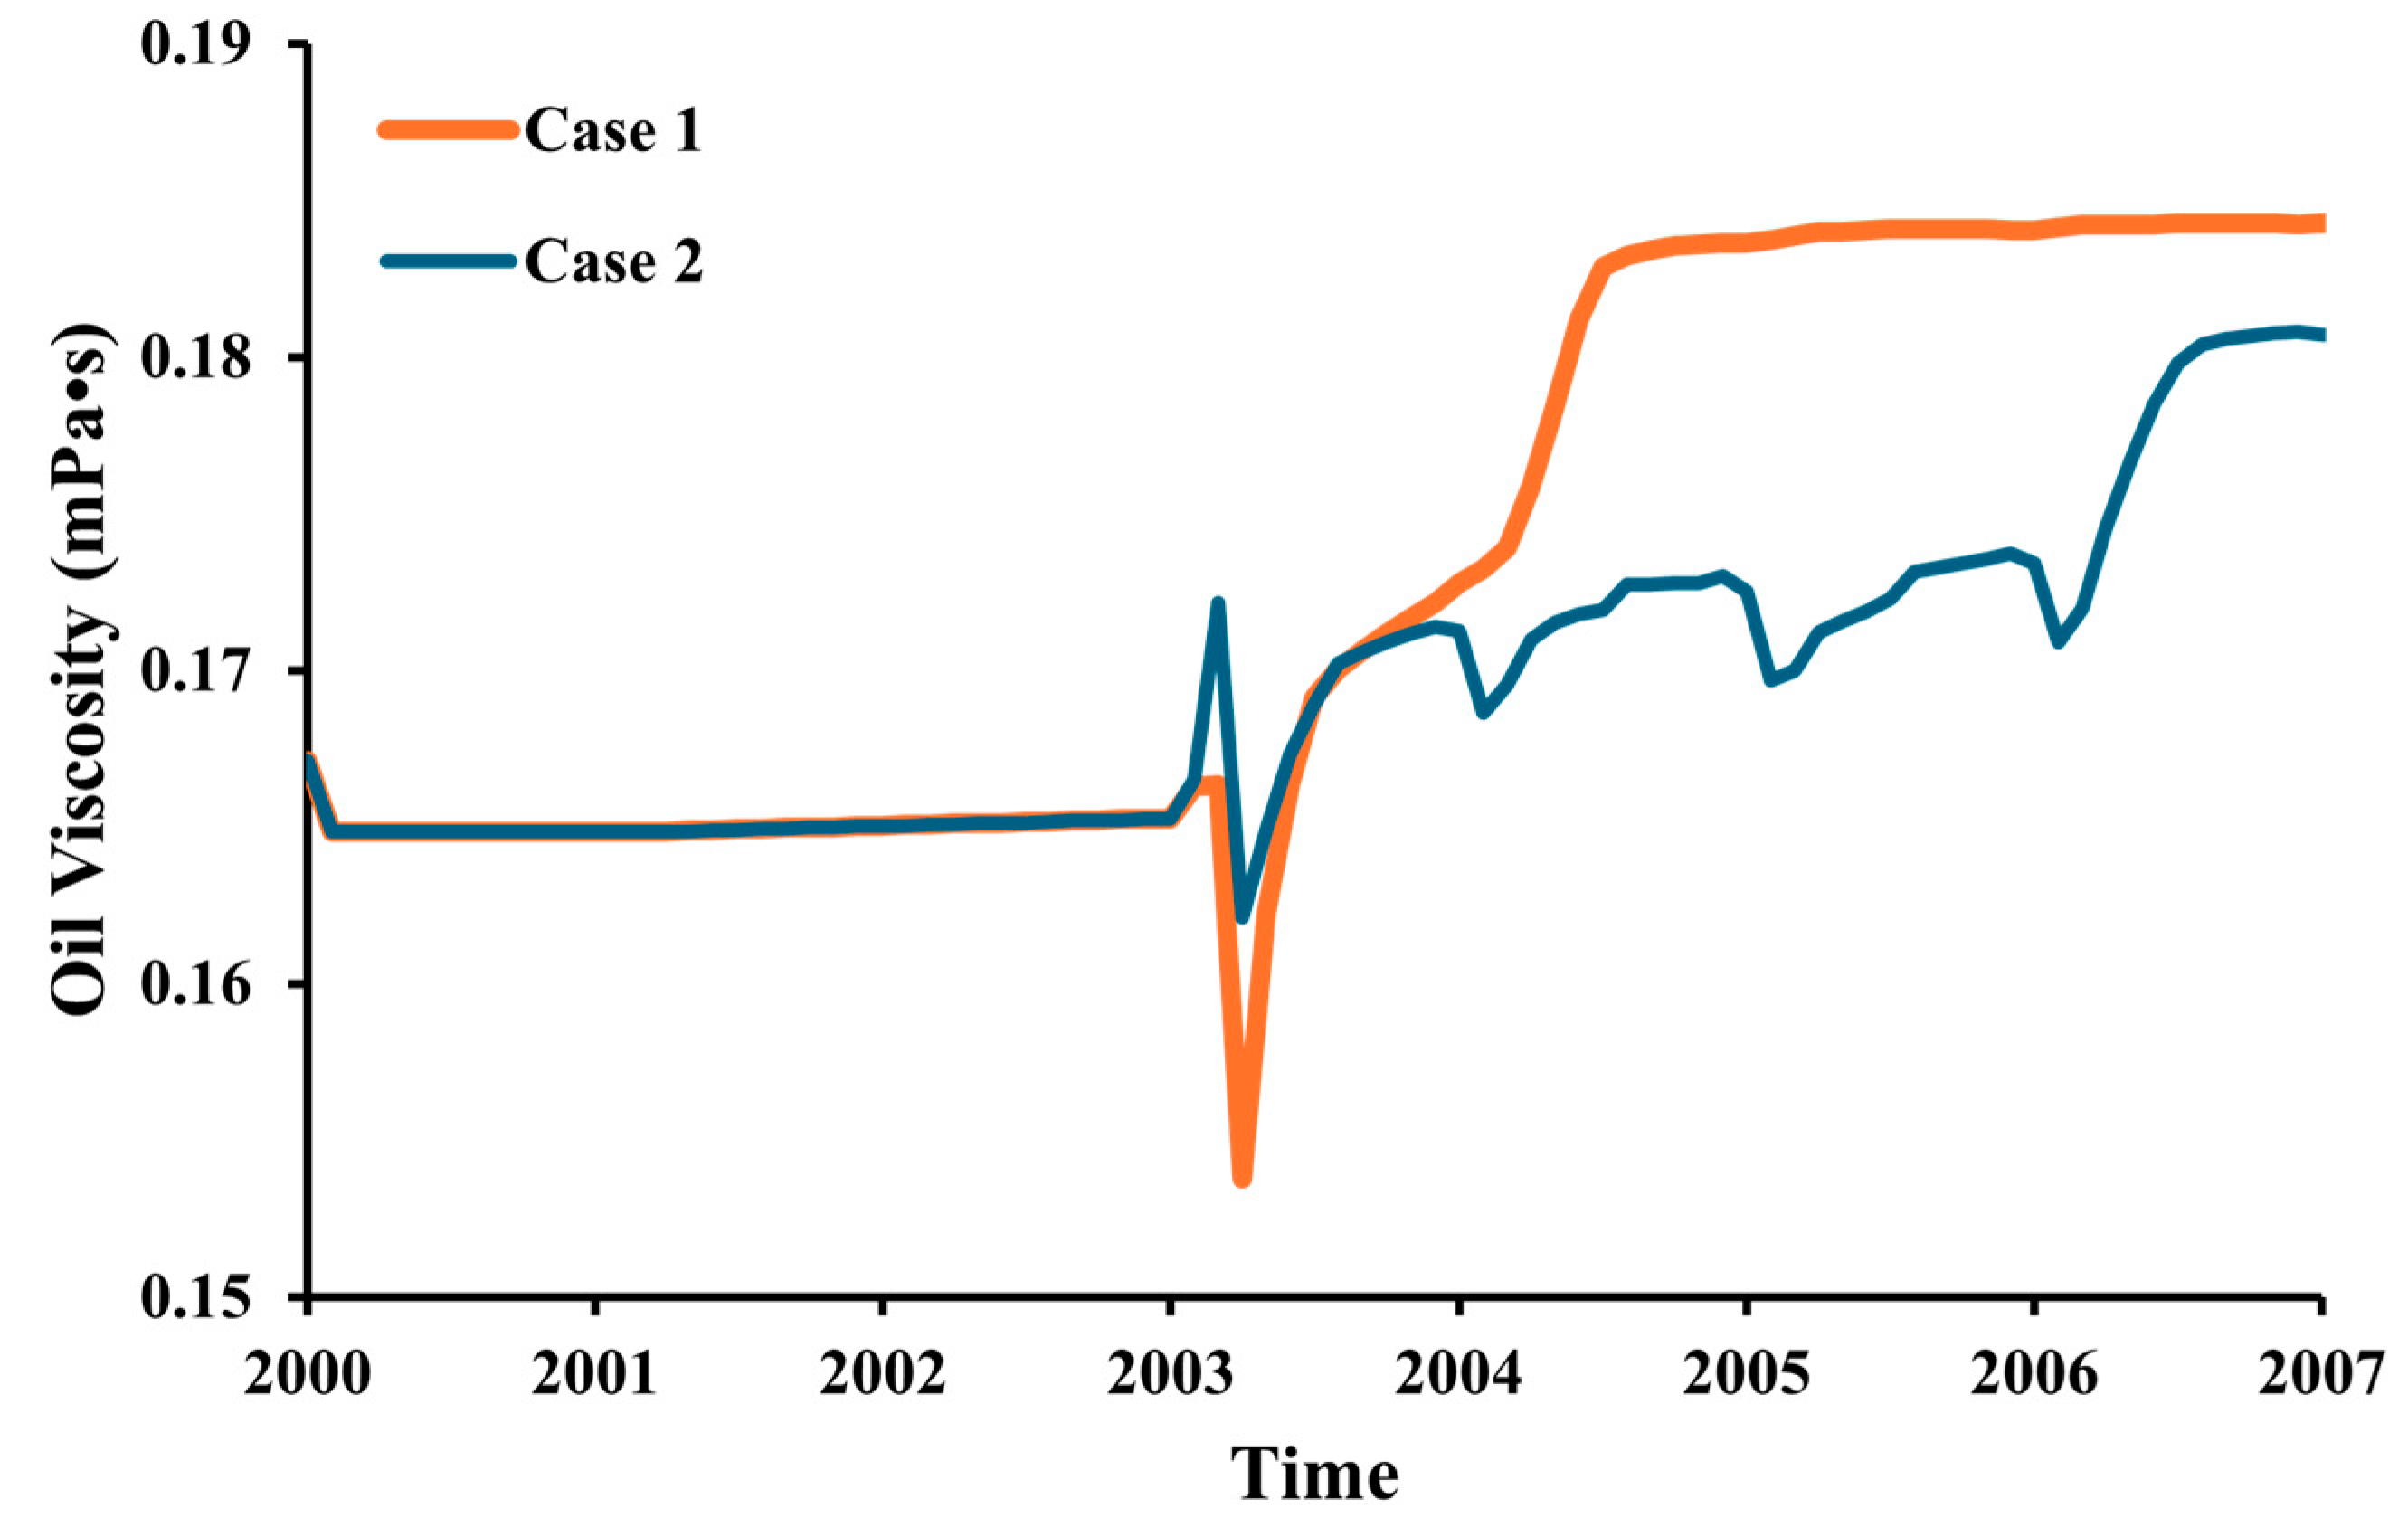
3.1. Impact of Impurities
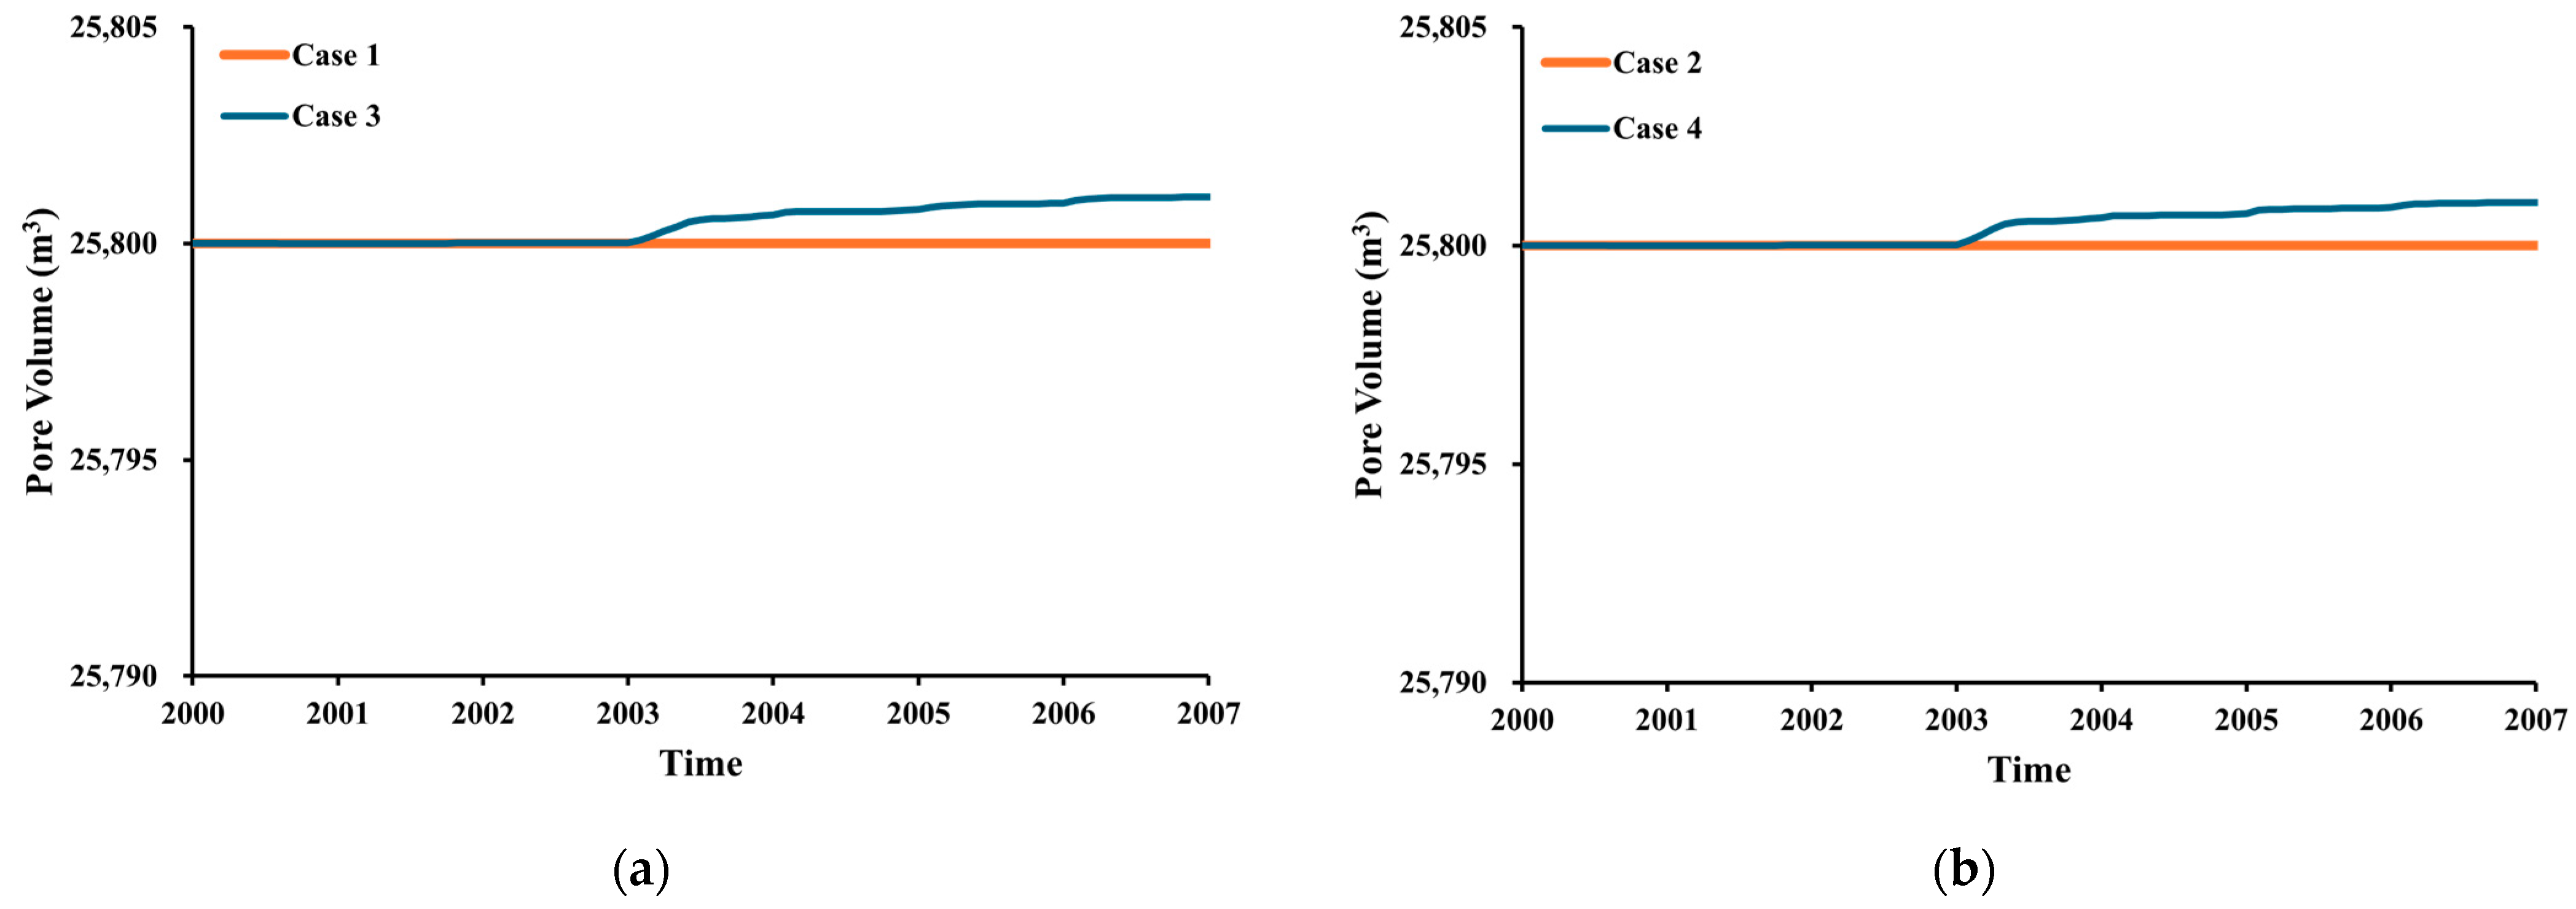
3.2. Impact of Geochemistry
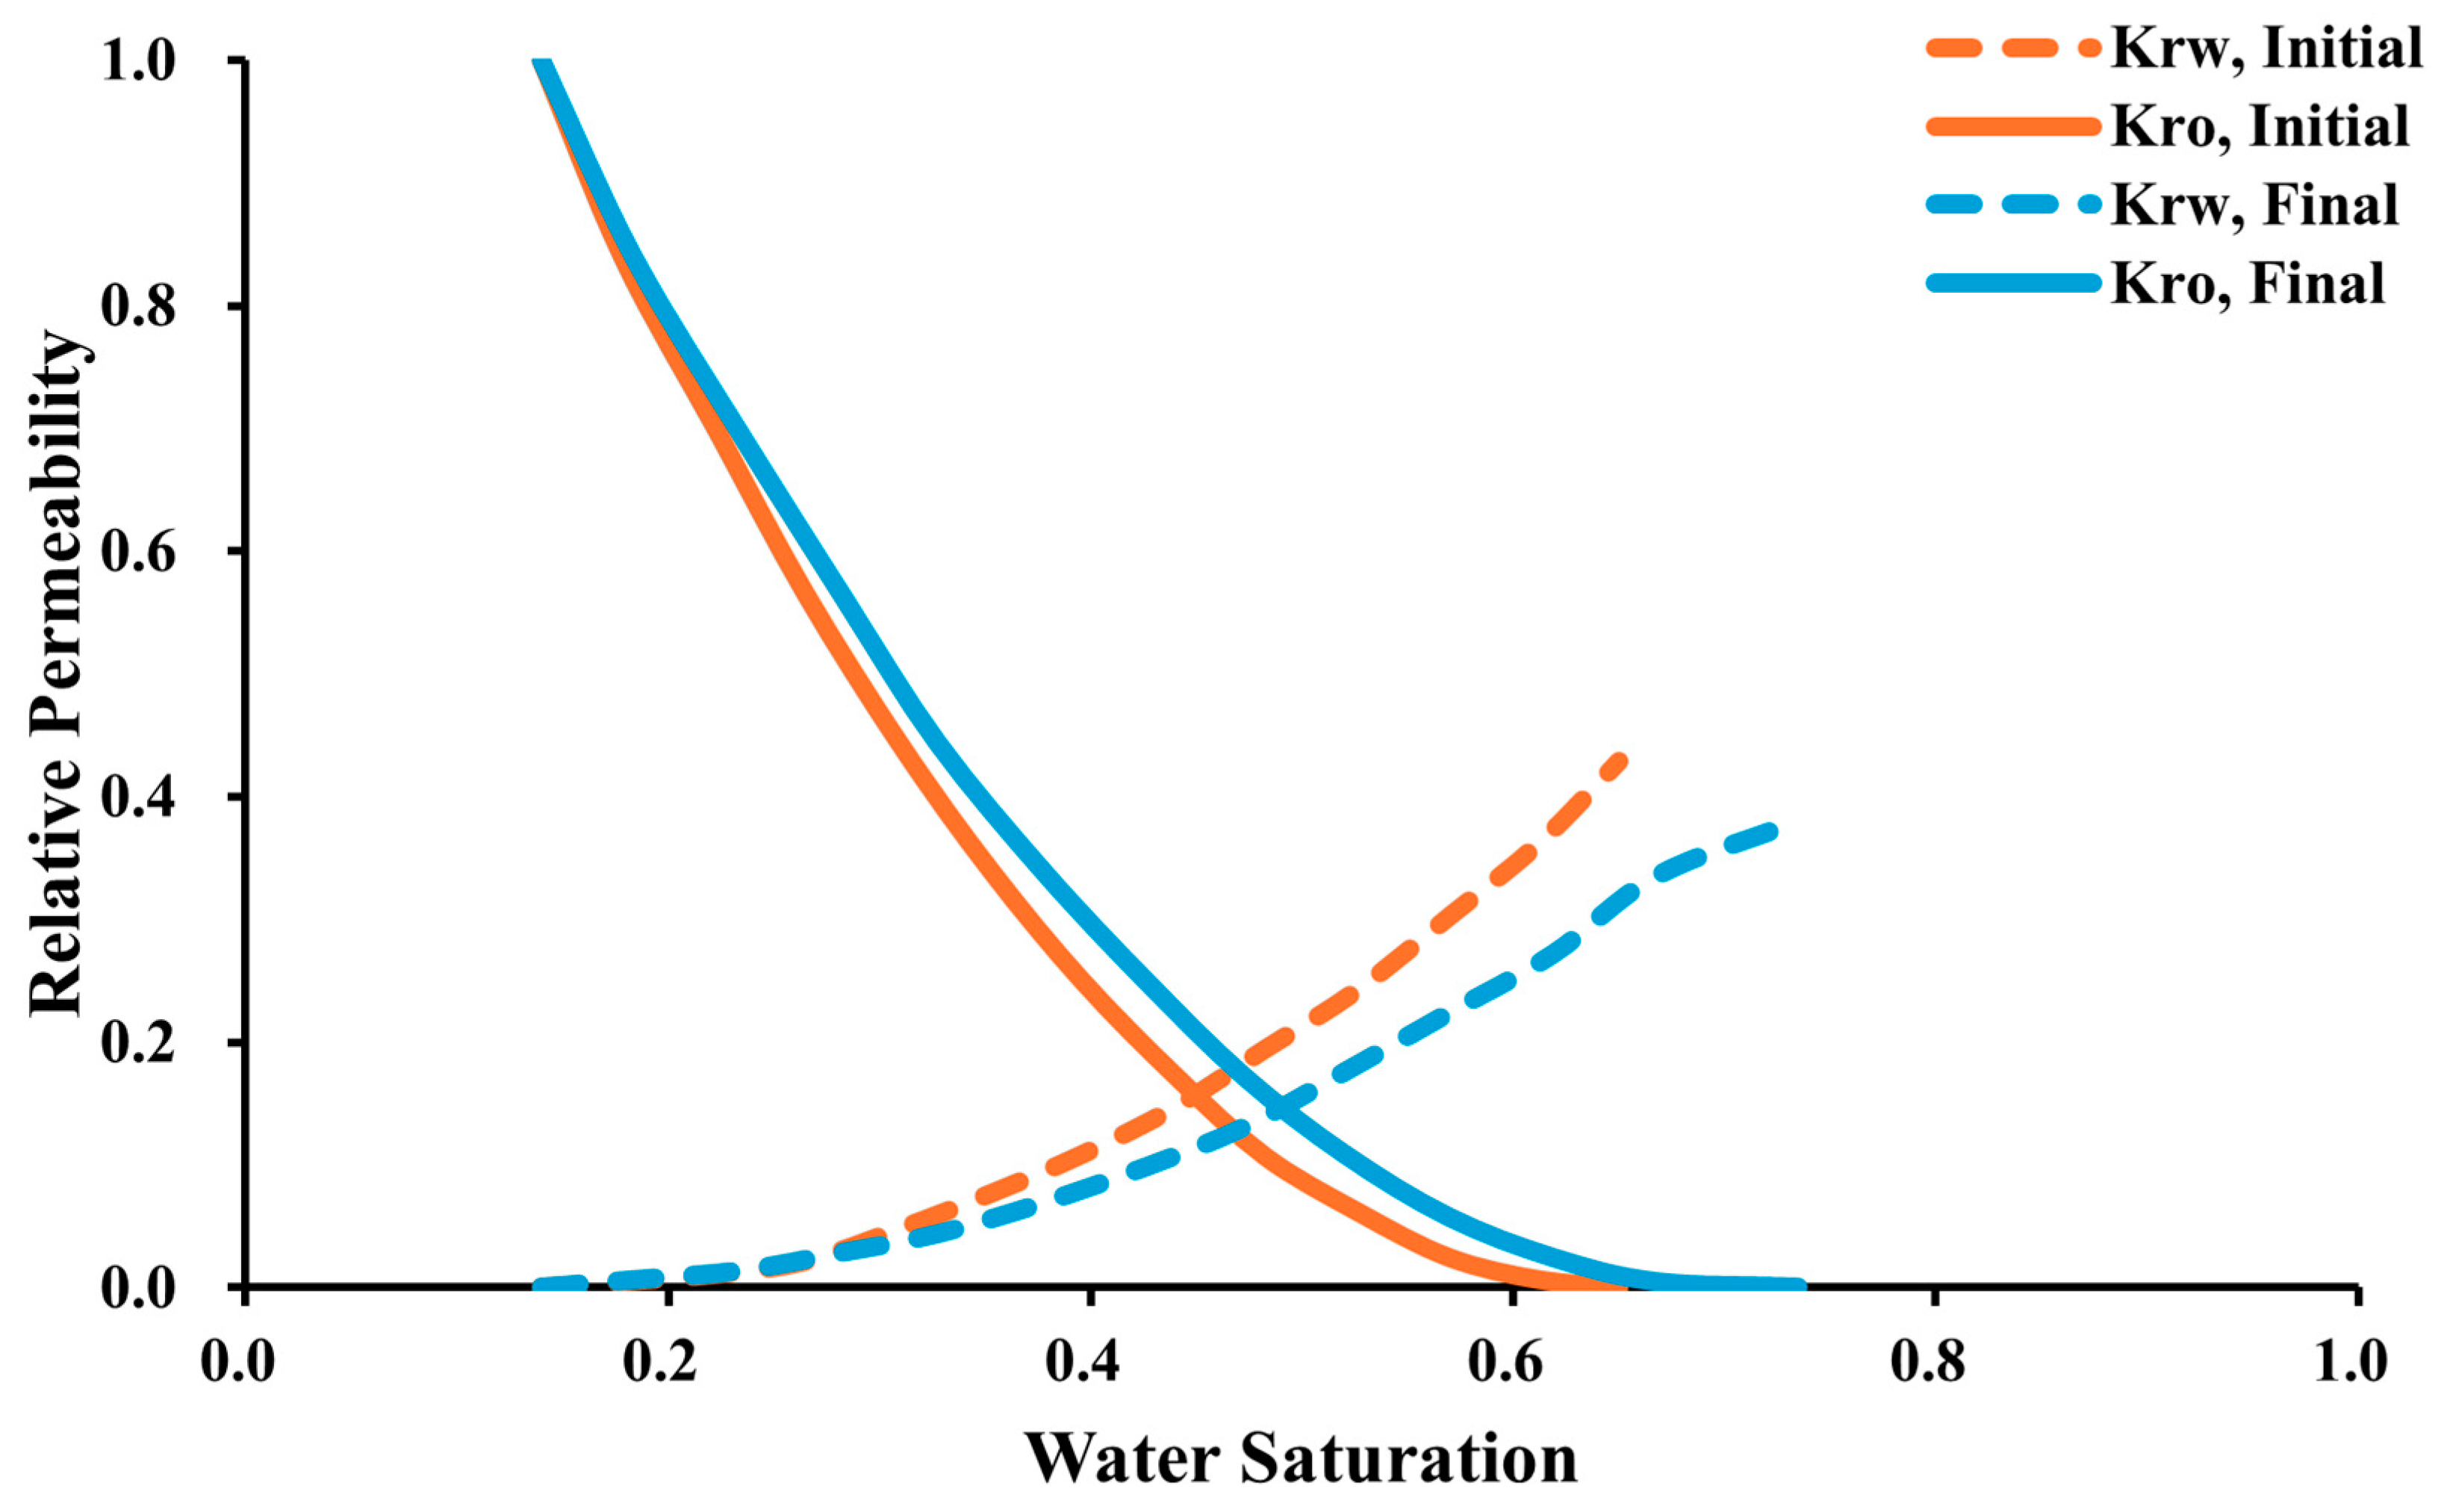
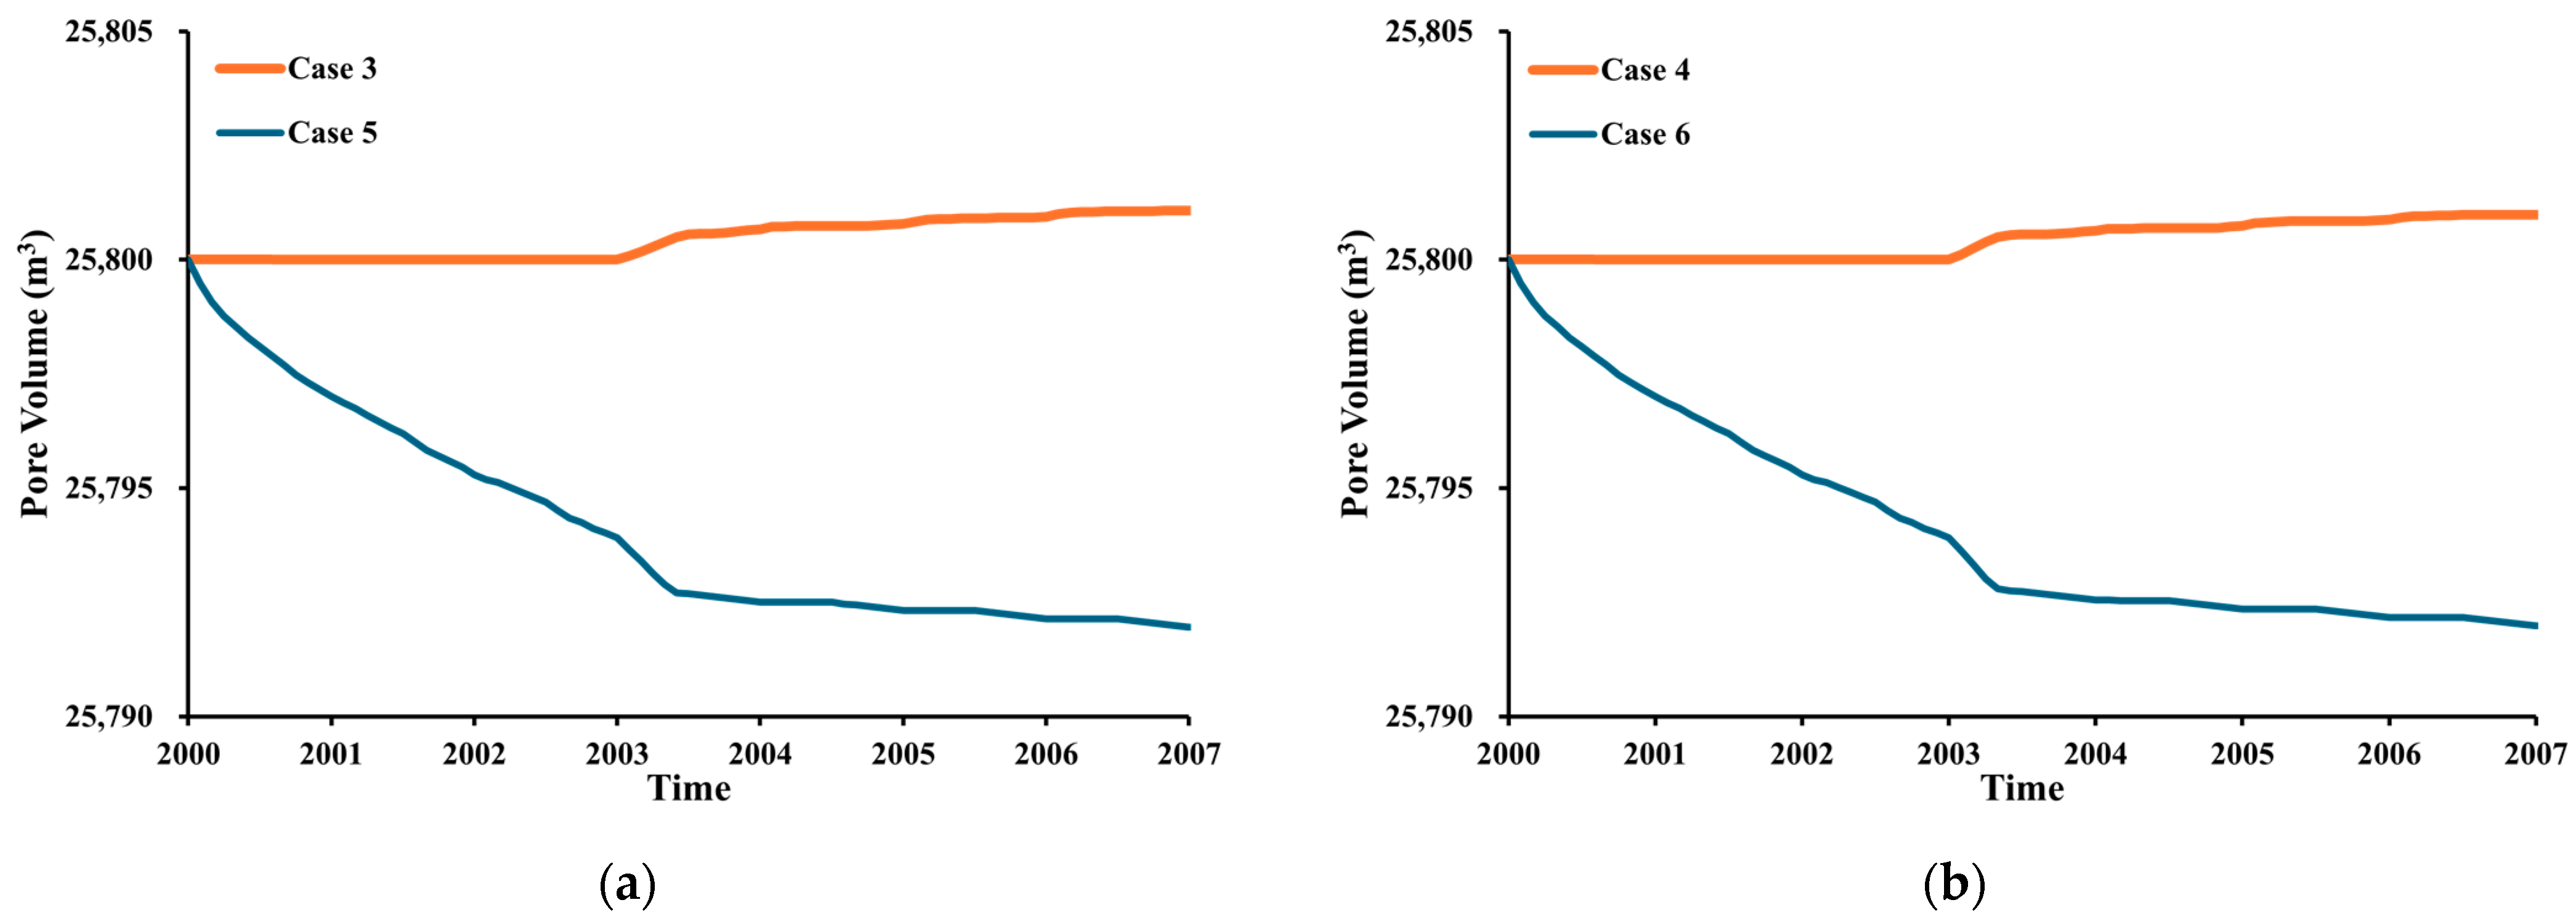
3.3. Impact of Low-Salinity Water Injection
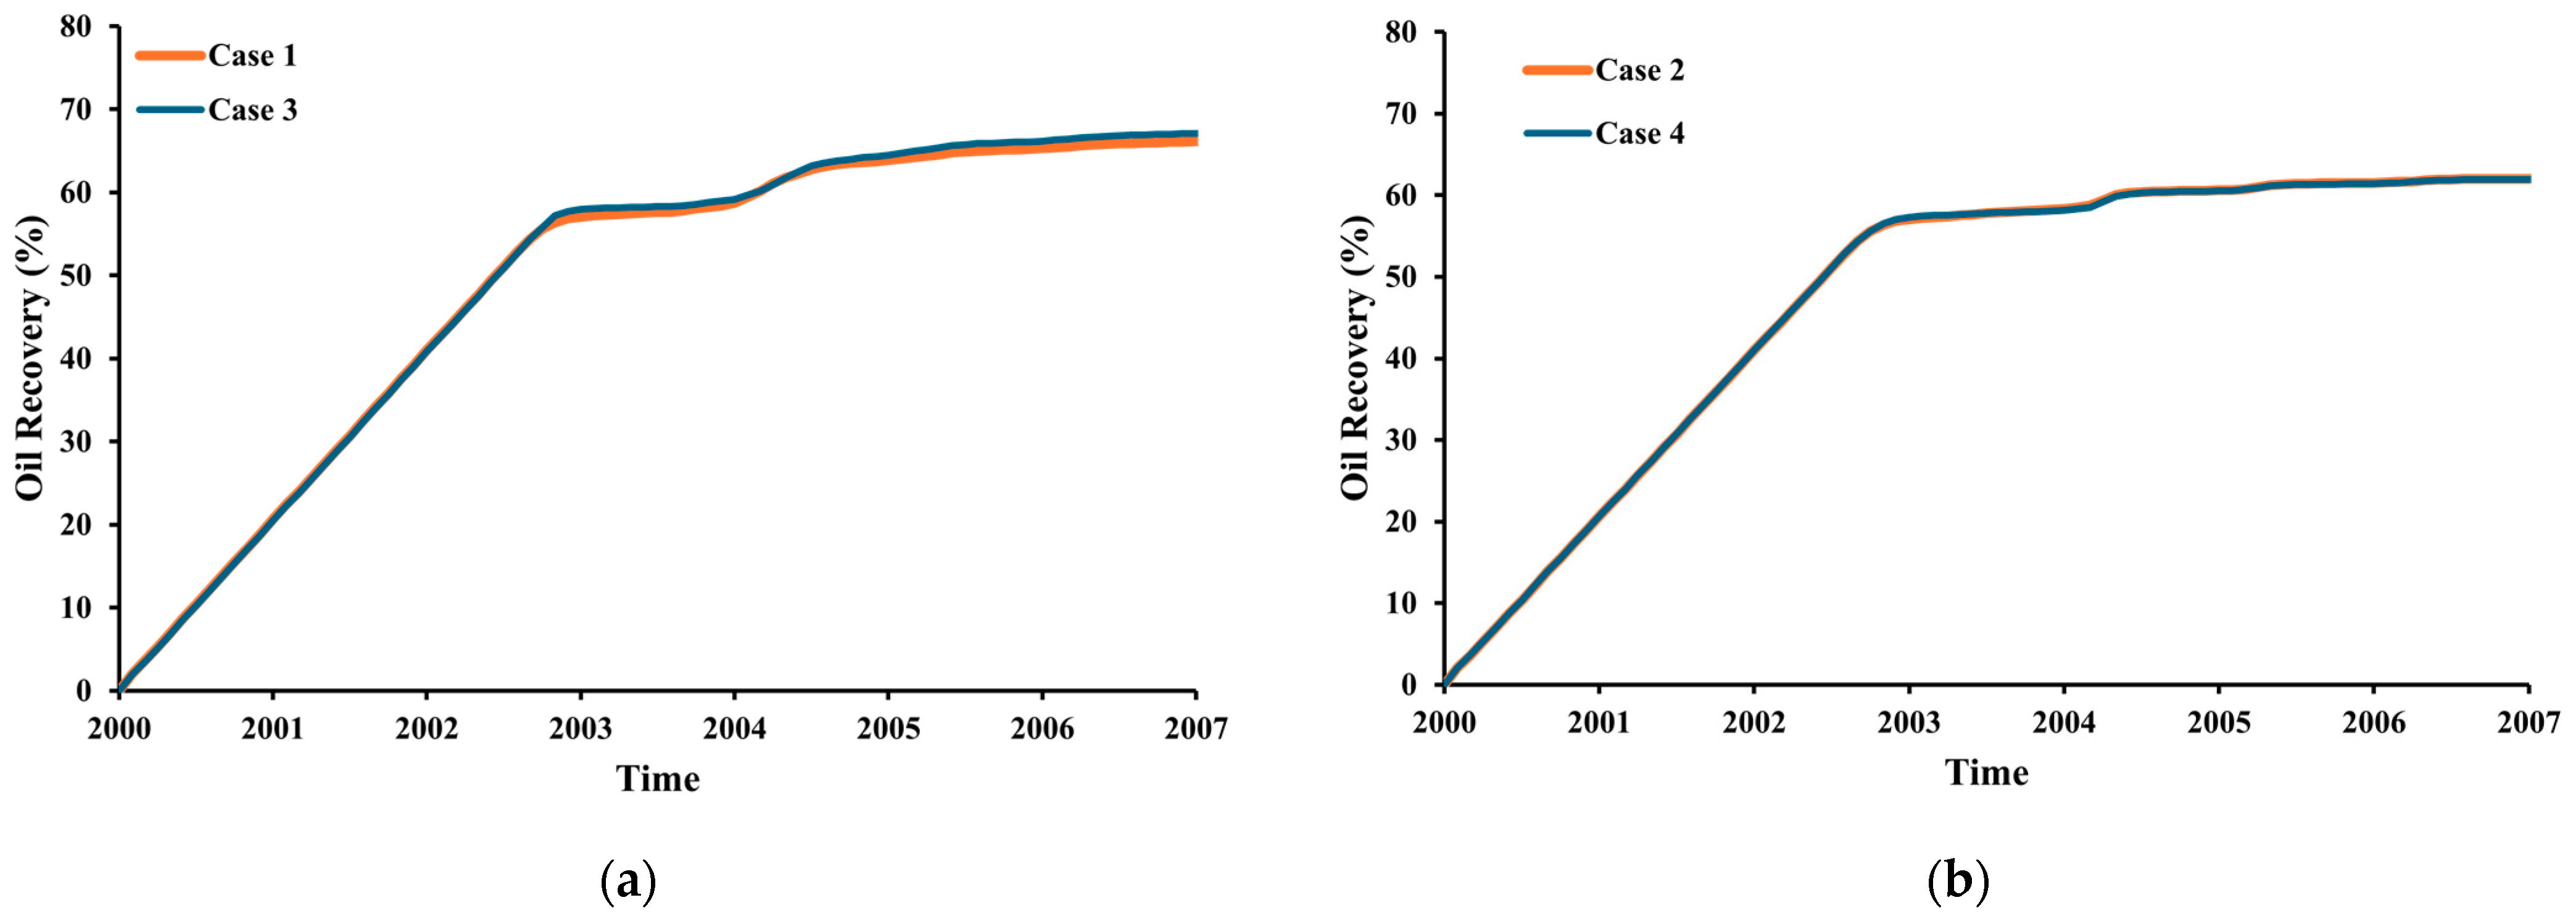
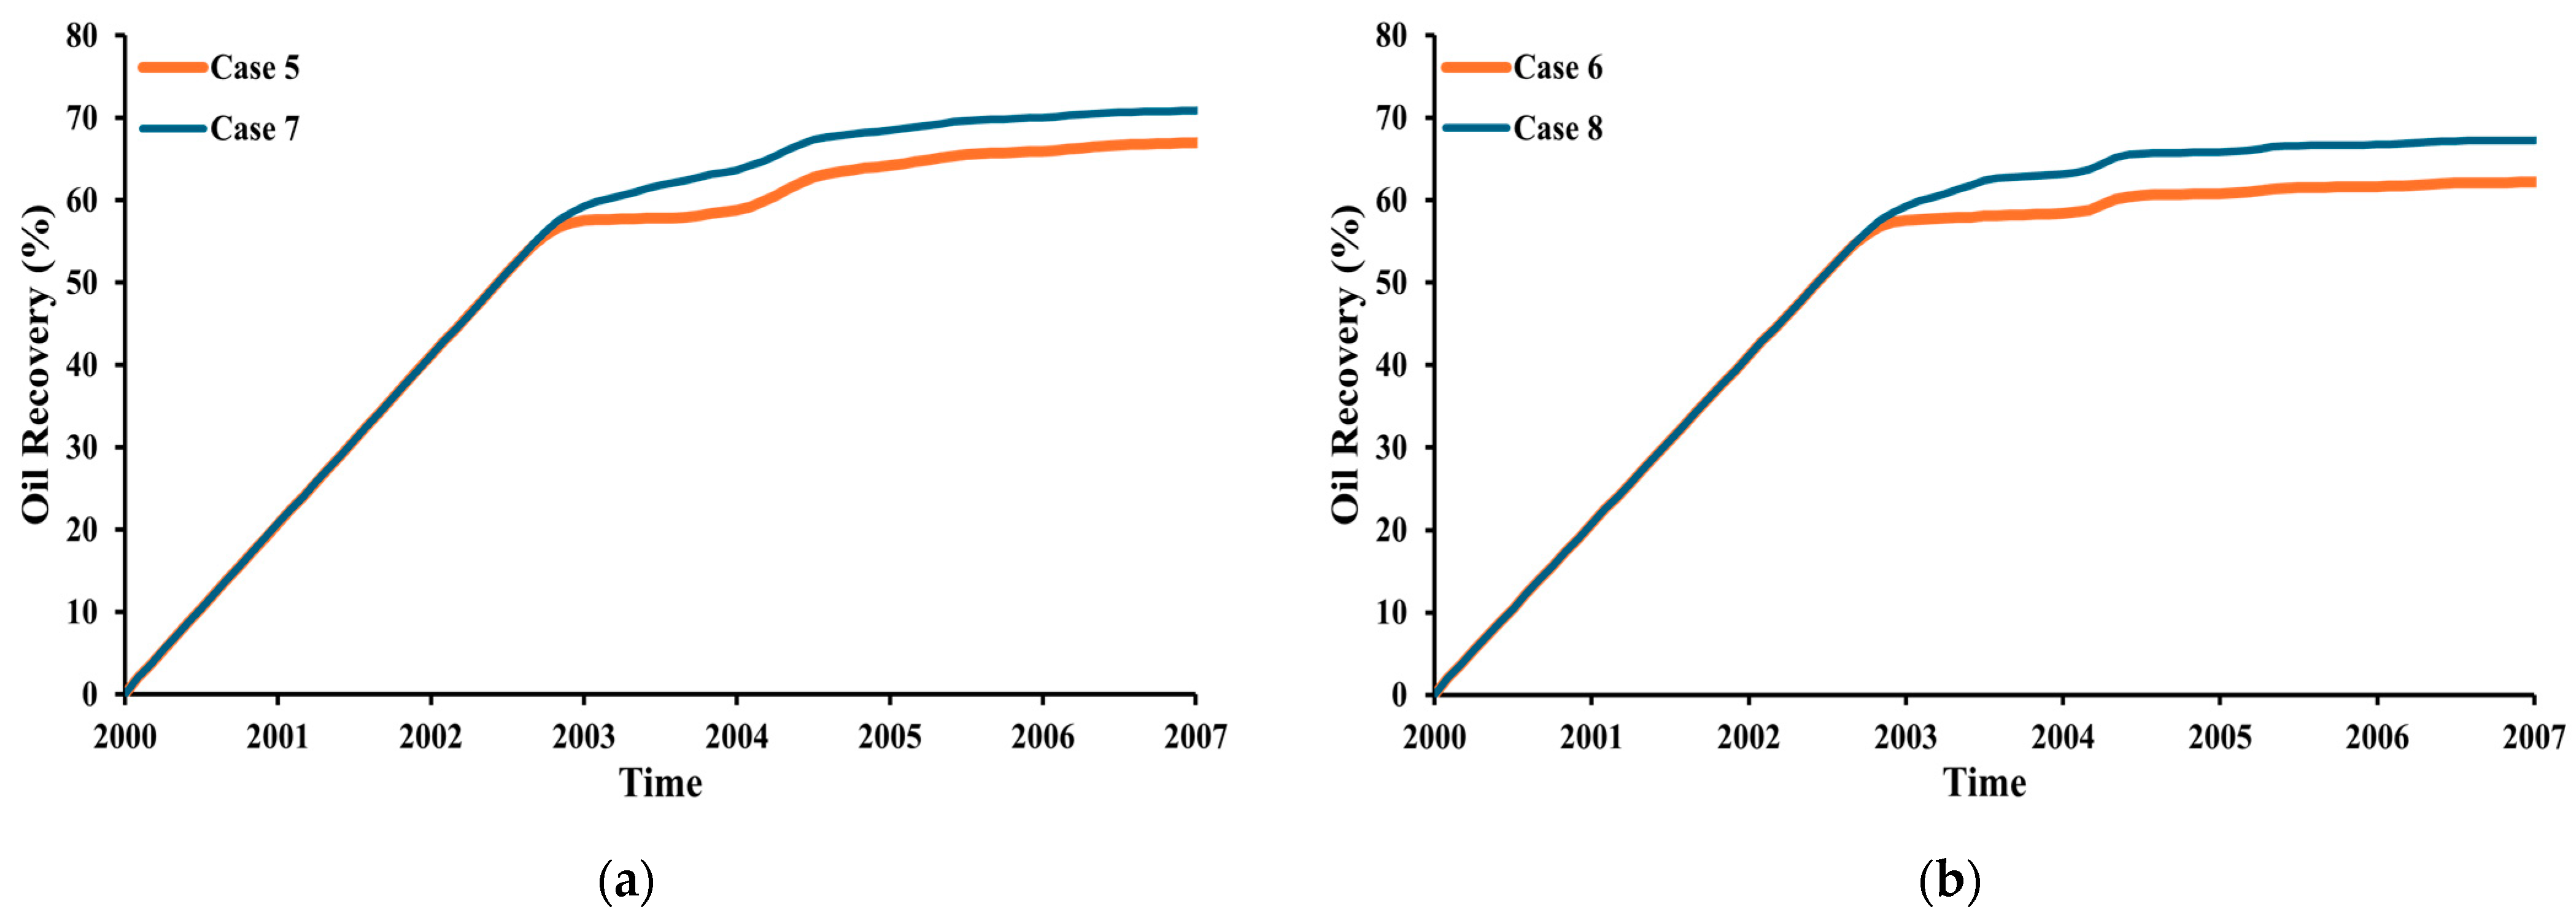
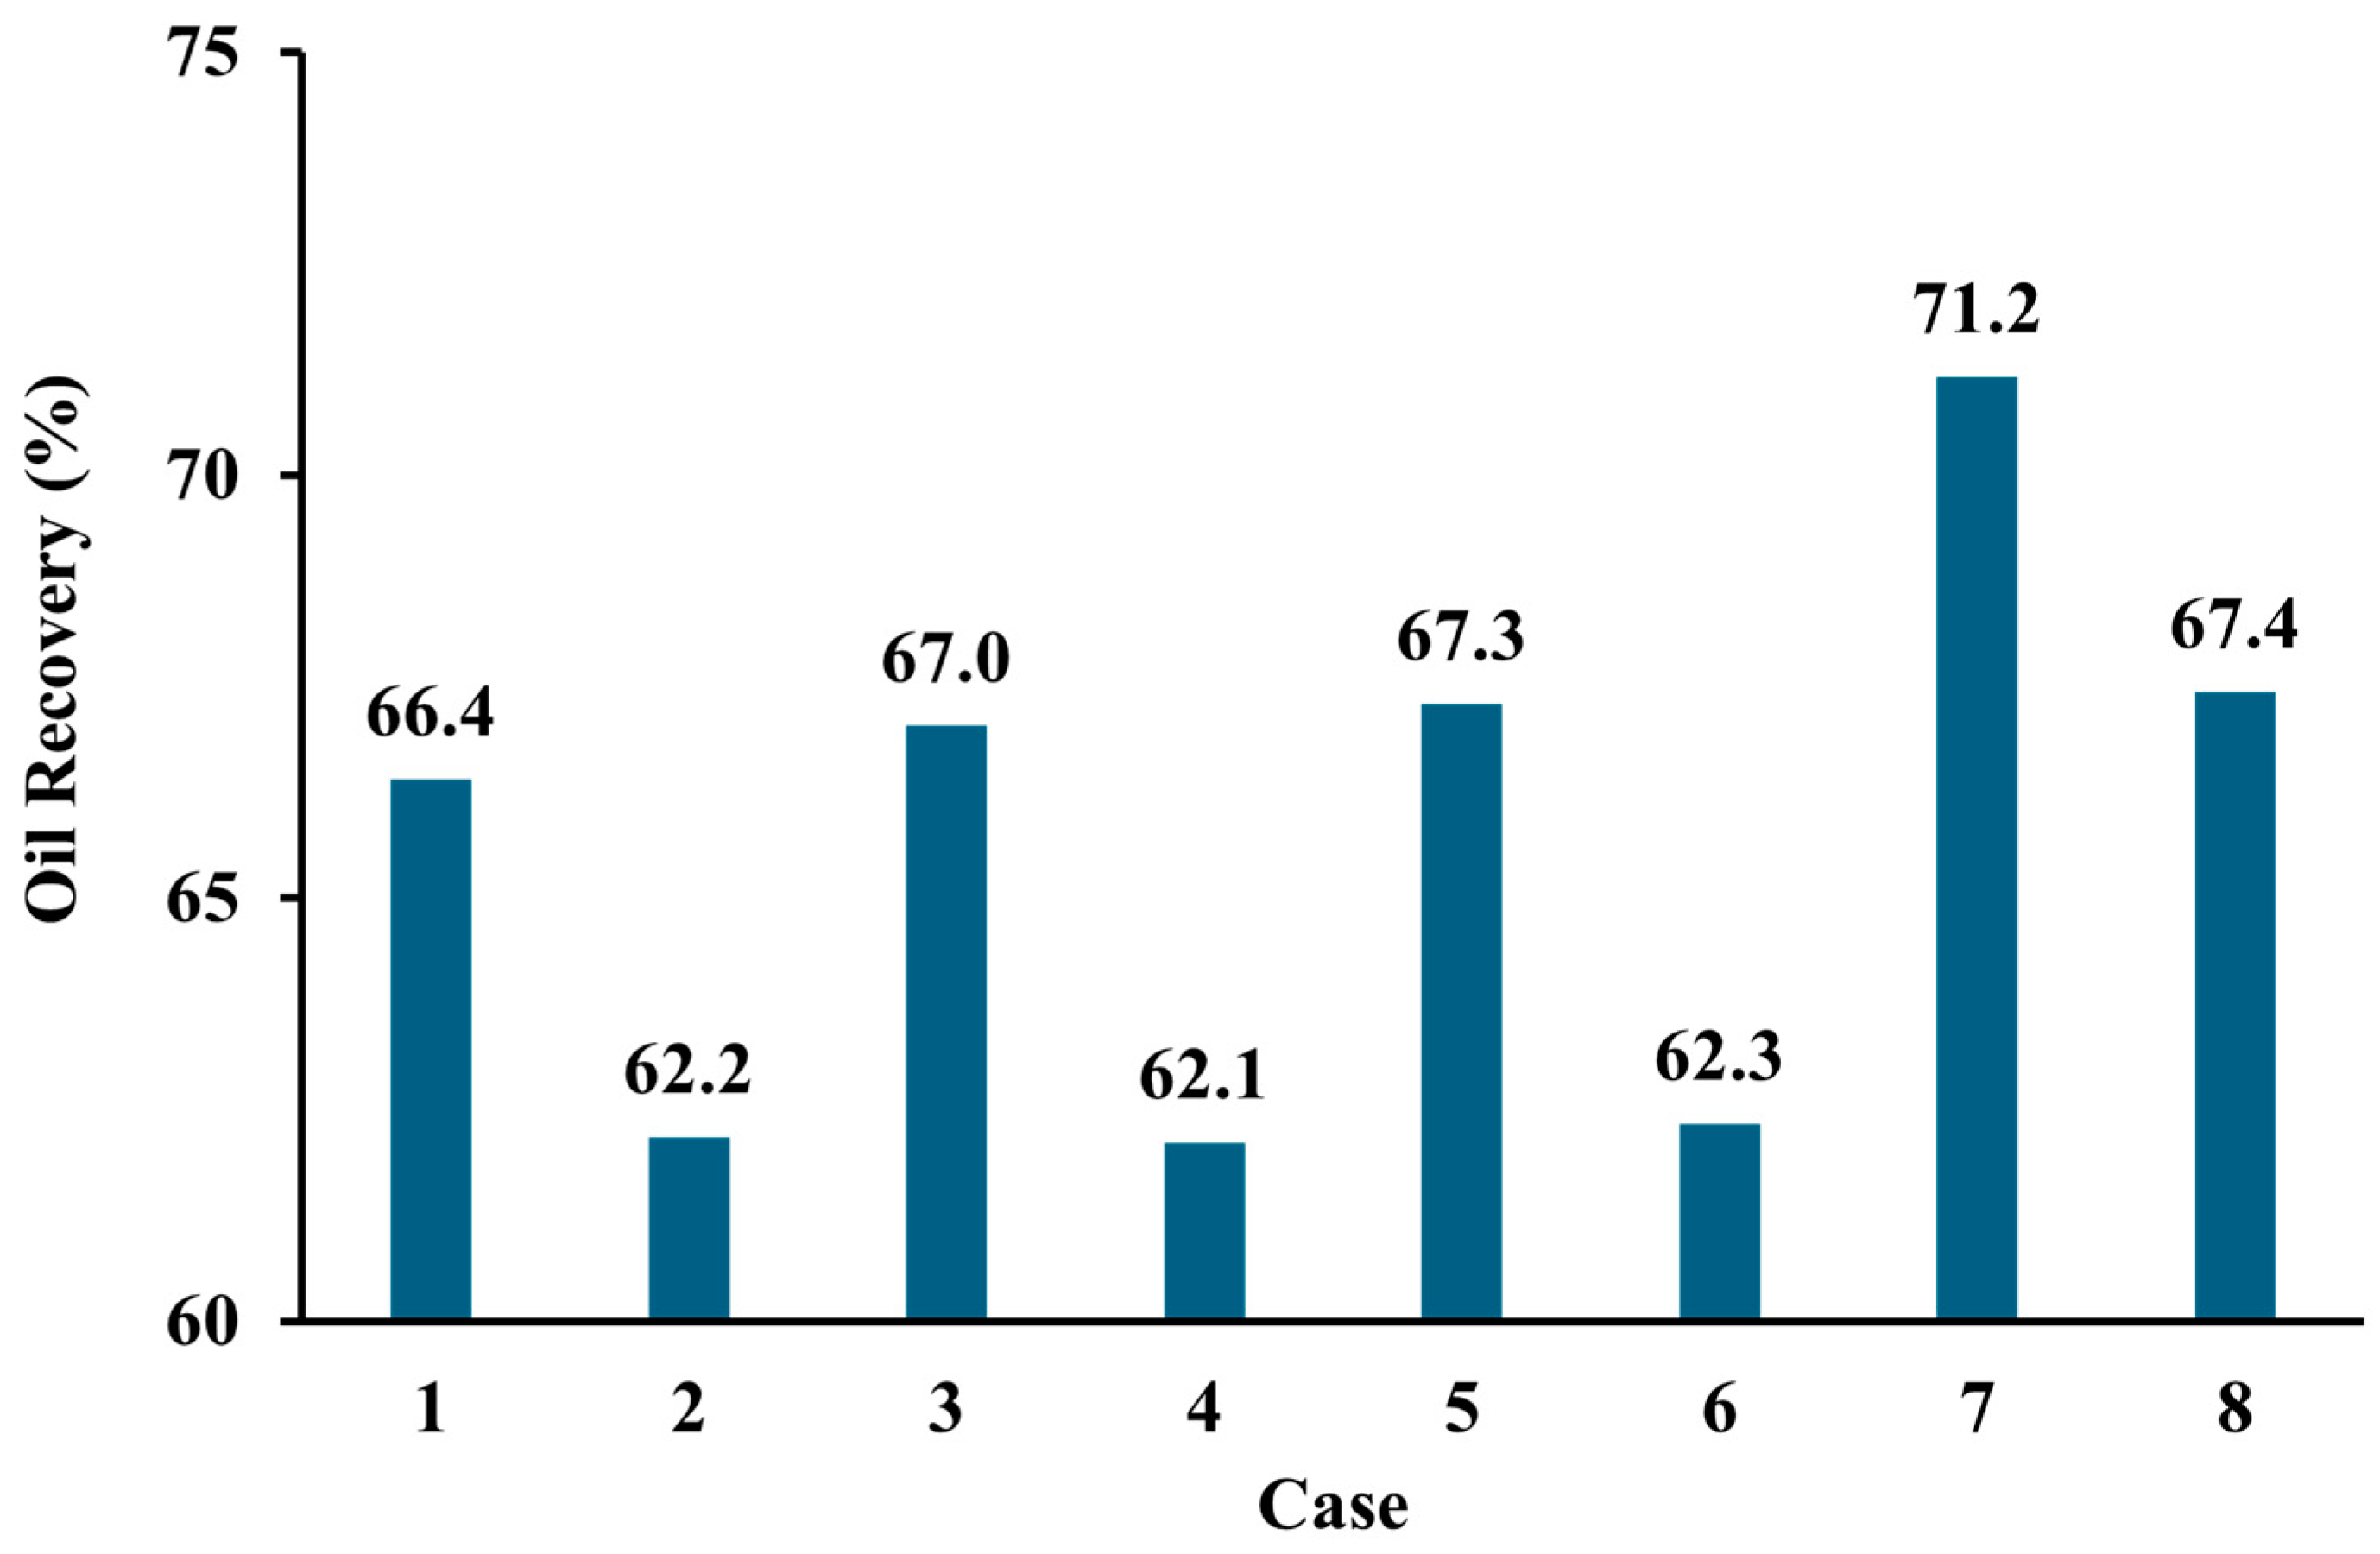
3.4. Oil Recovery
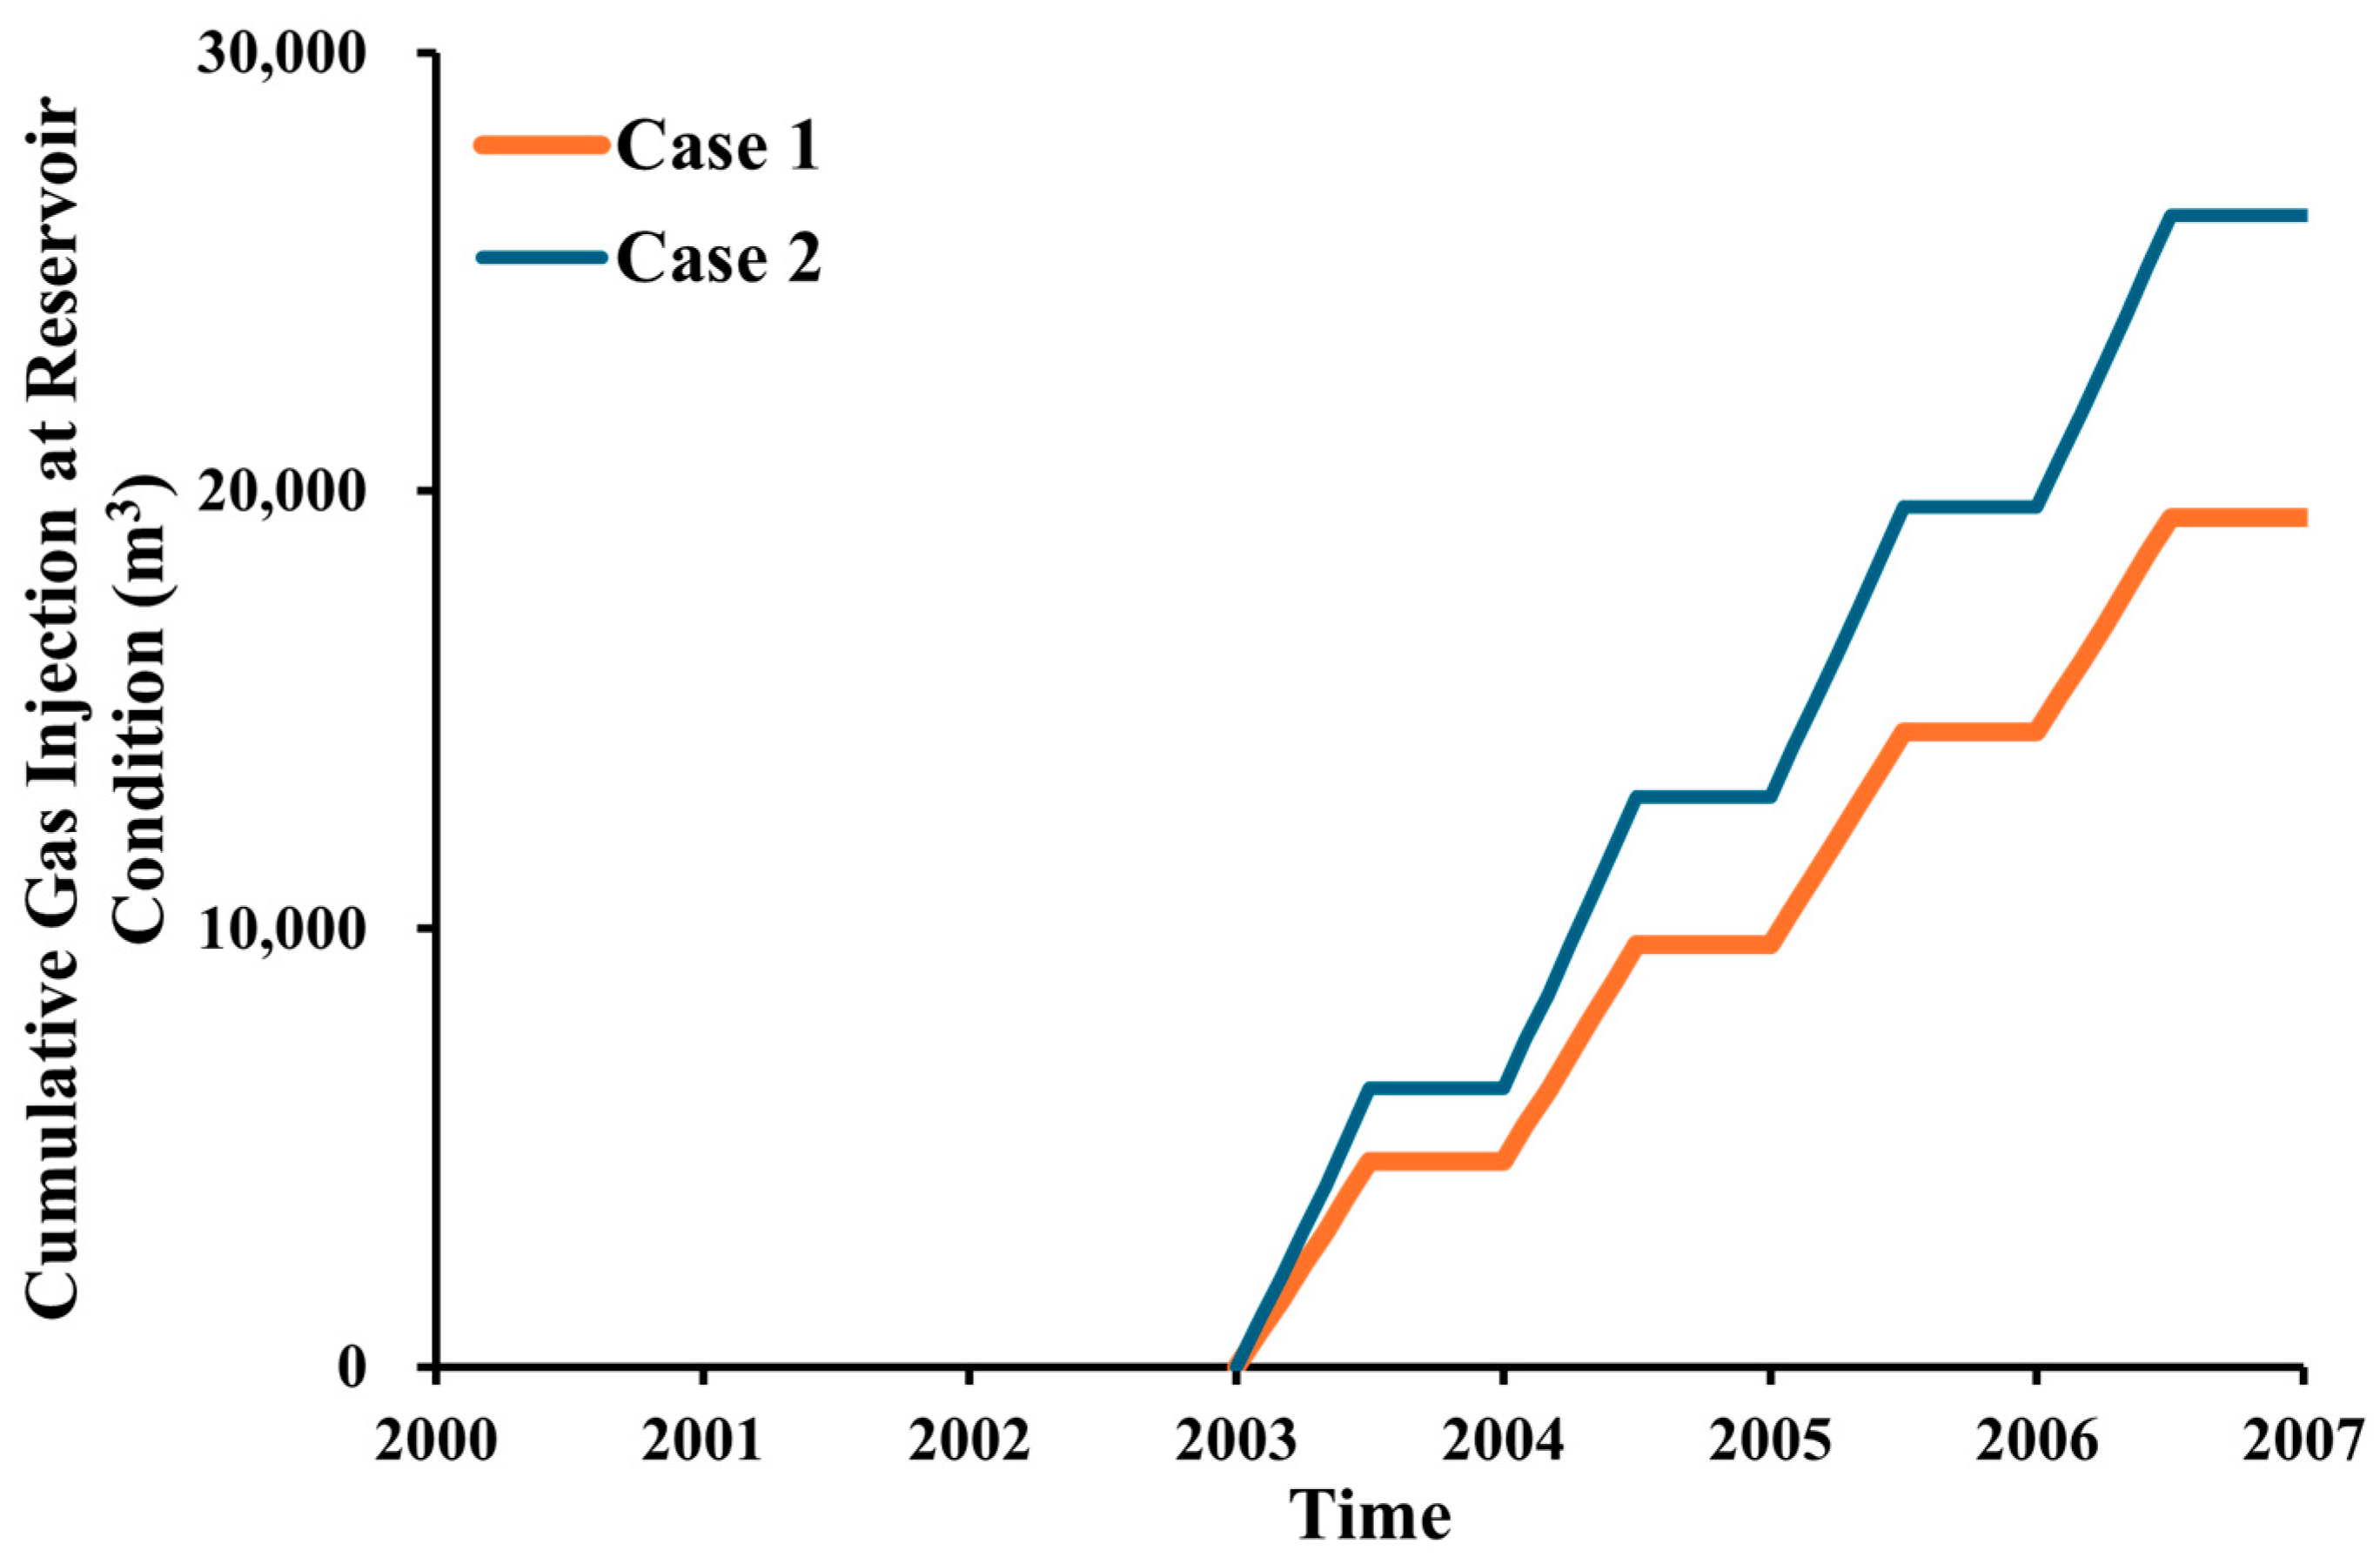
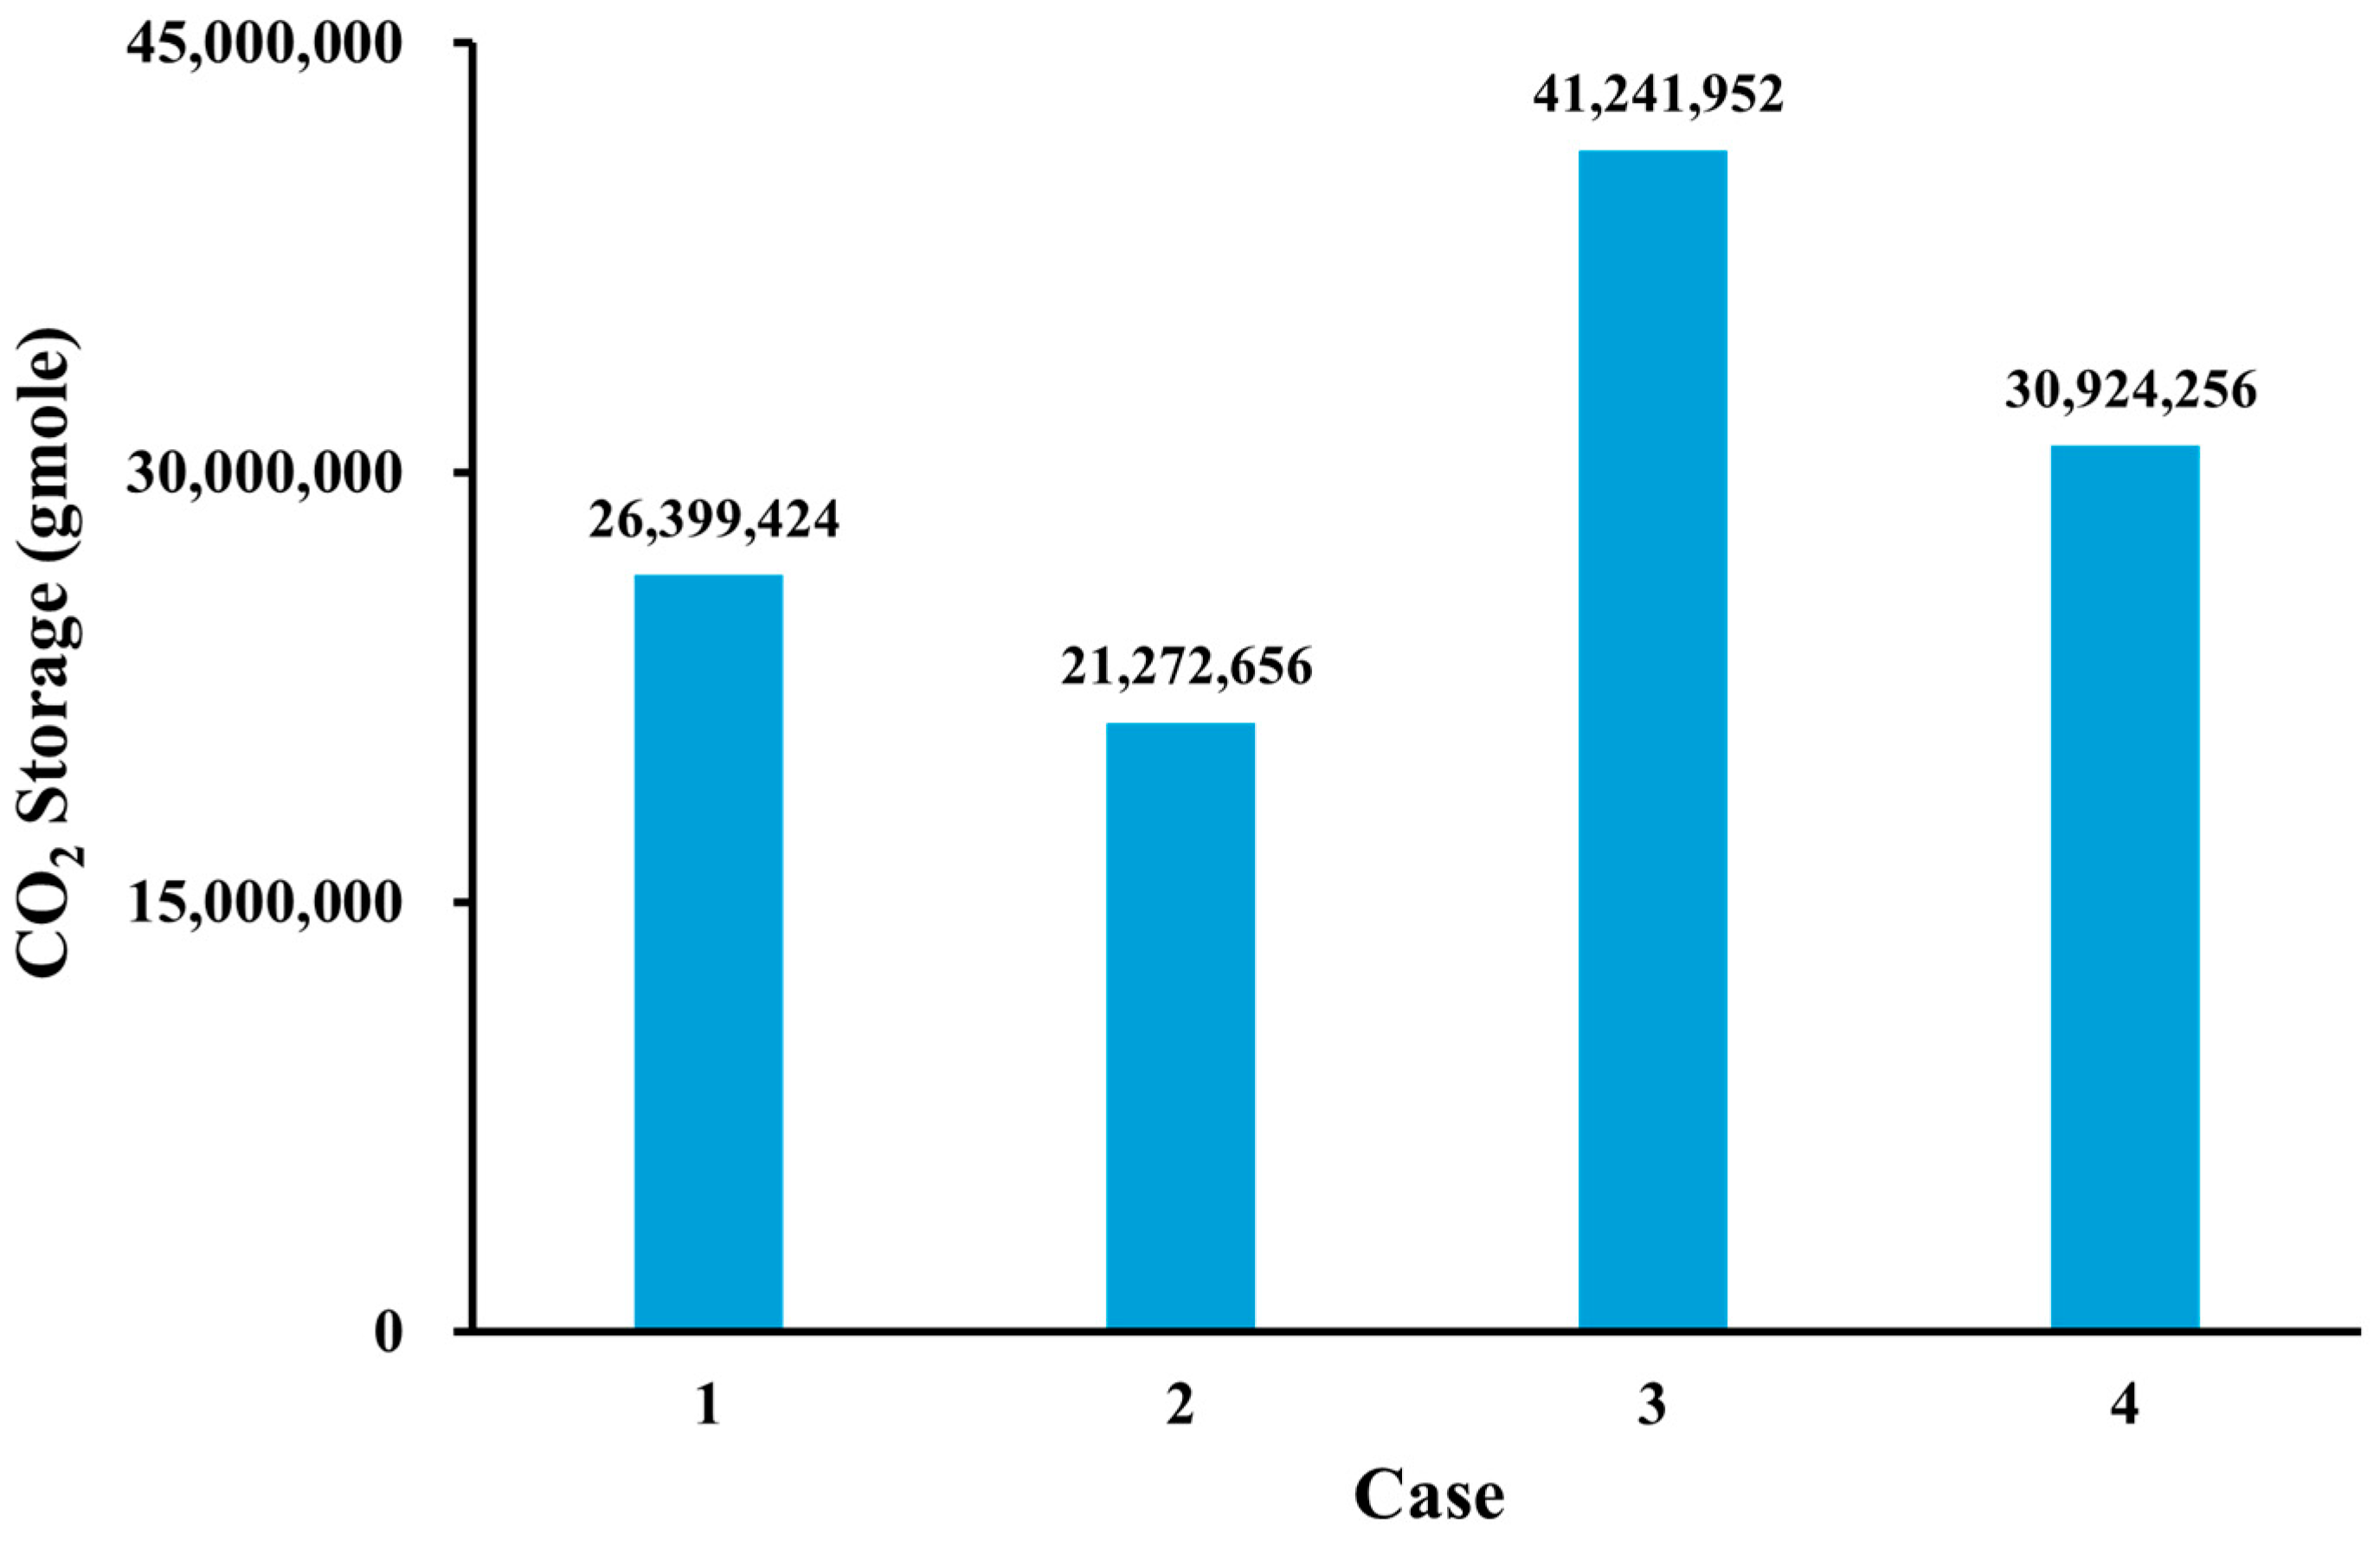
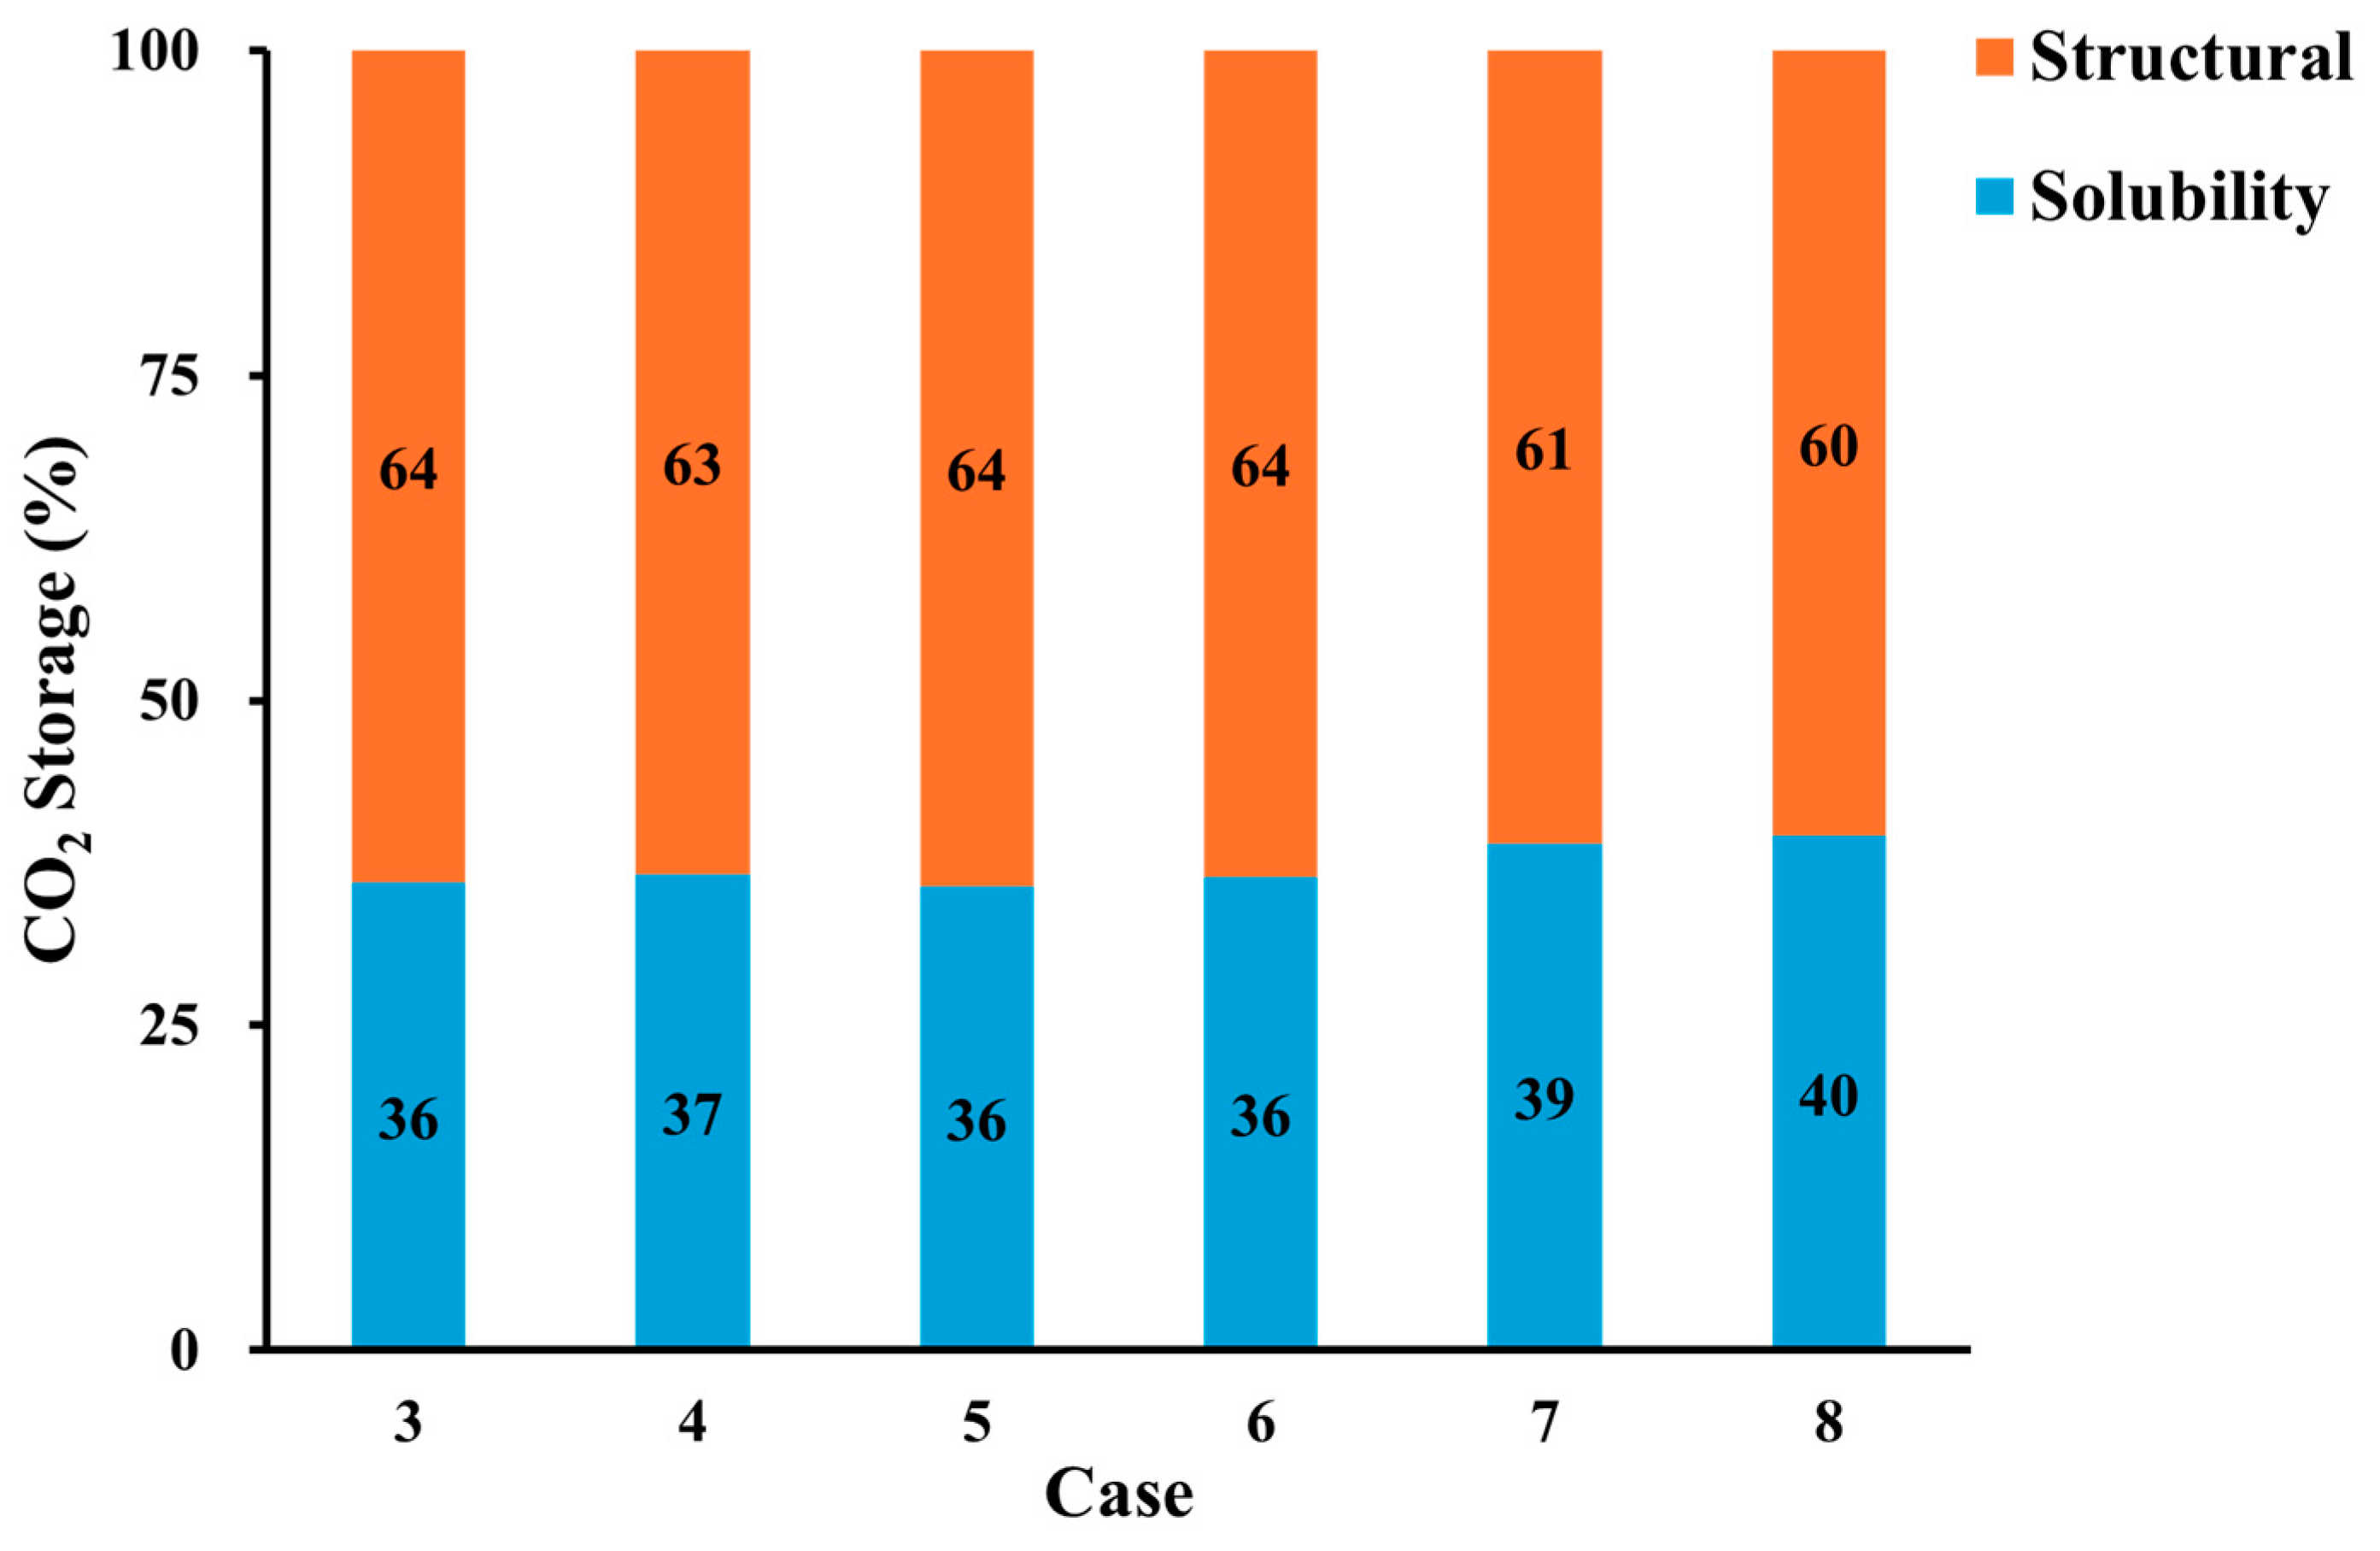
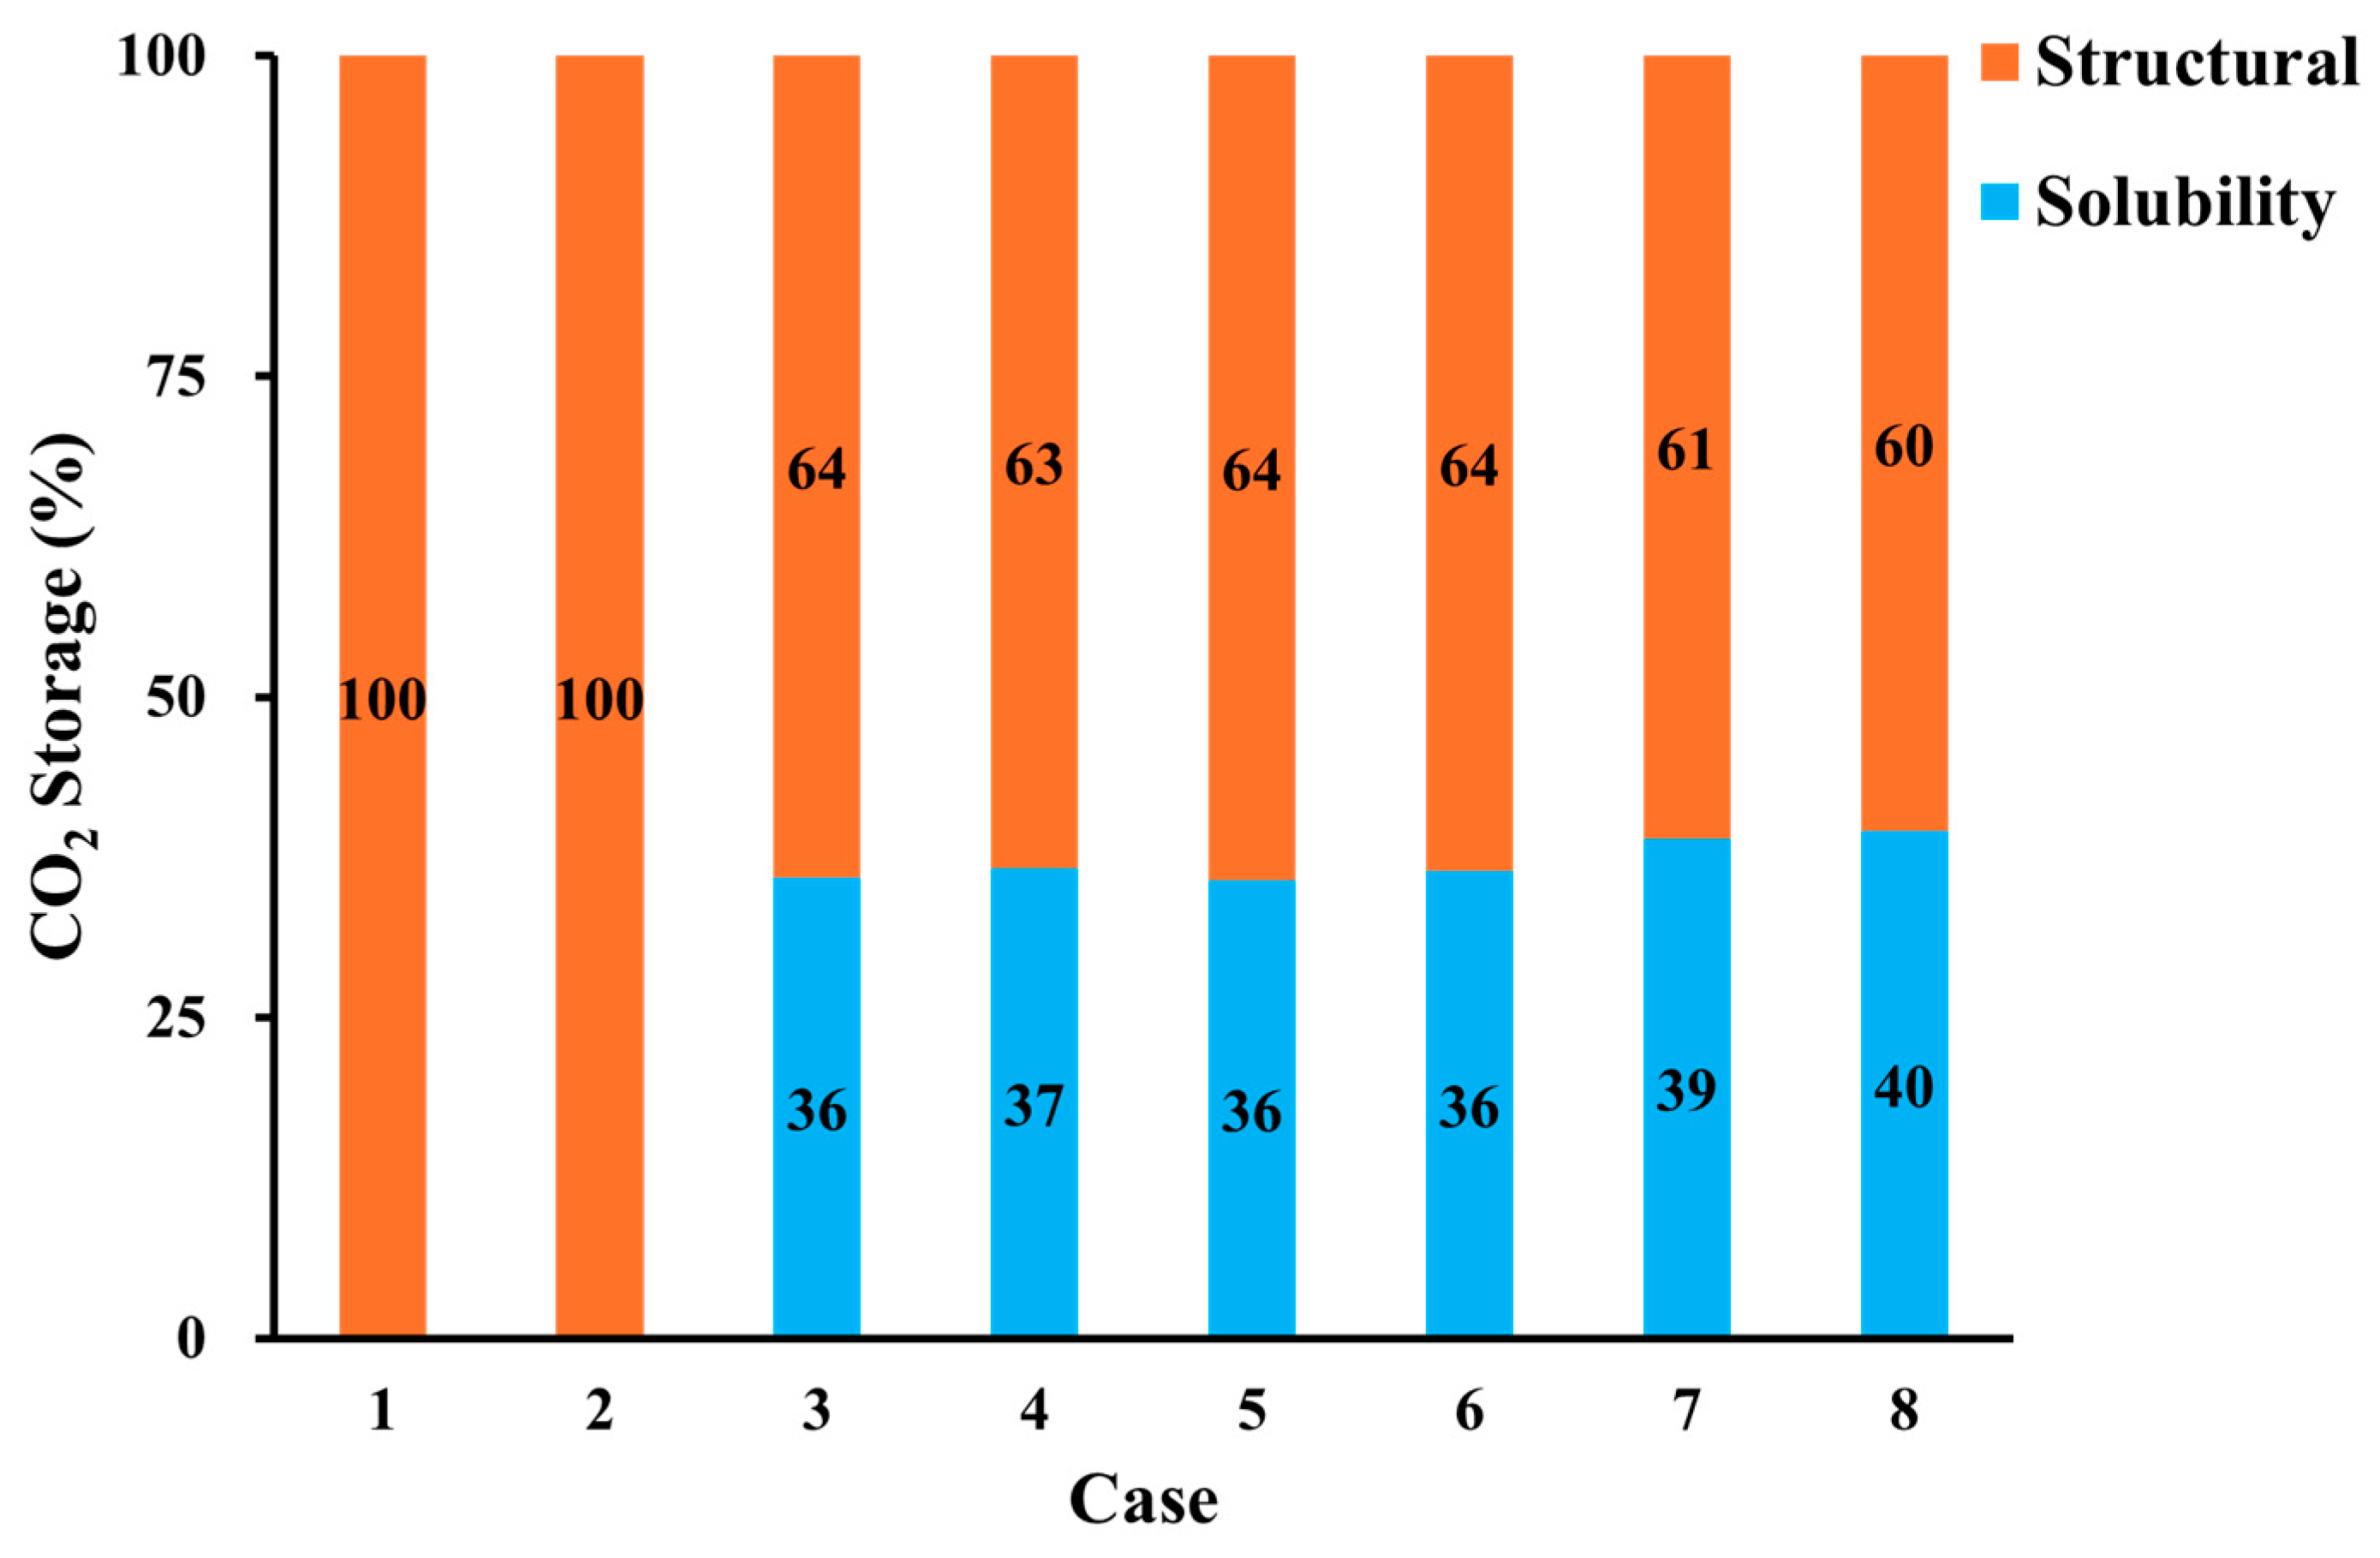
3.5. CO2 Storage
3.6. Optimization
4. Conclusions
- (1)
- The injection of CO2 into a carbonate reservoir results in an increase in the recovery factor of up to 9% compared to waterflooding. The oil-recovery factor from pure CO2-WAG is 4% higher than that obtained with impure CO2 WAG injection methods.
- (2)
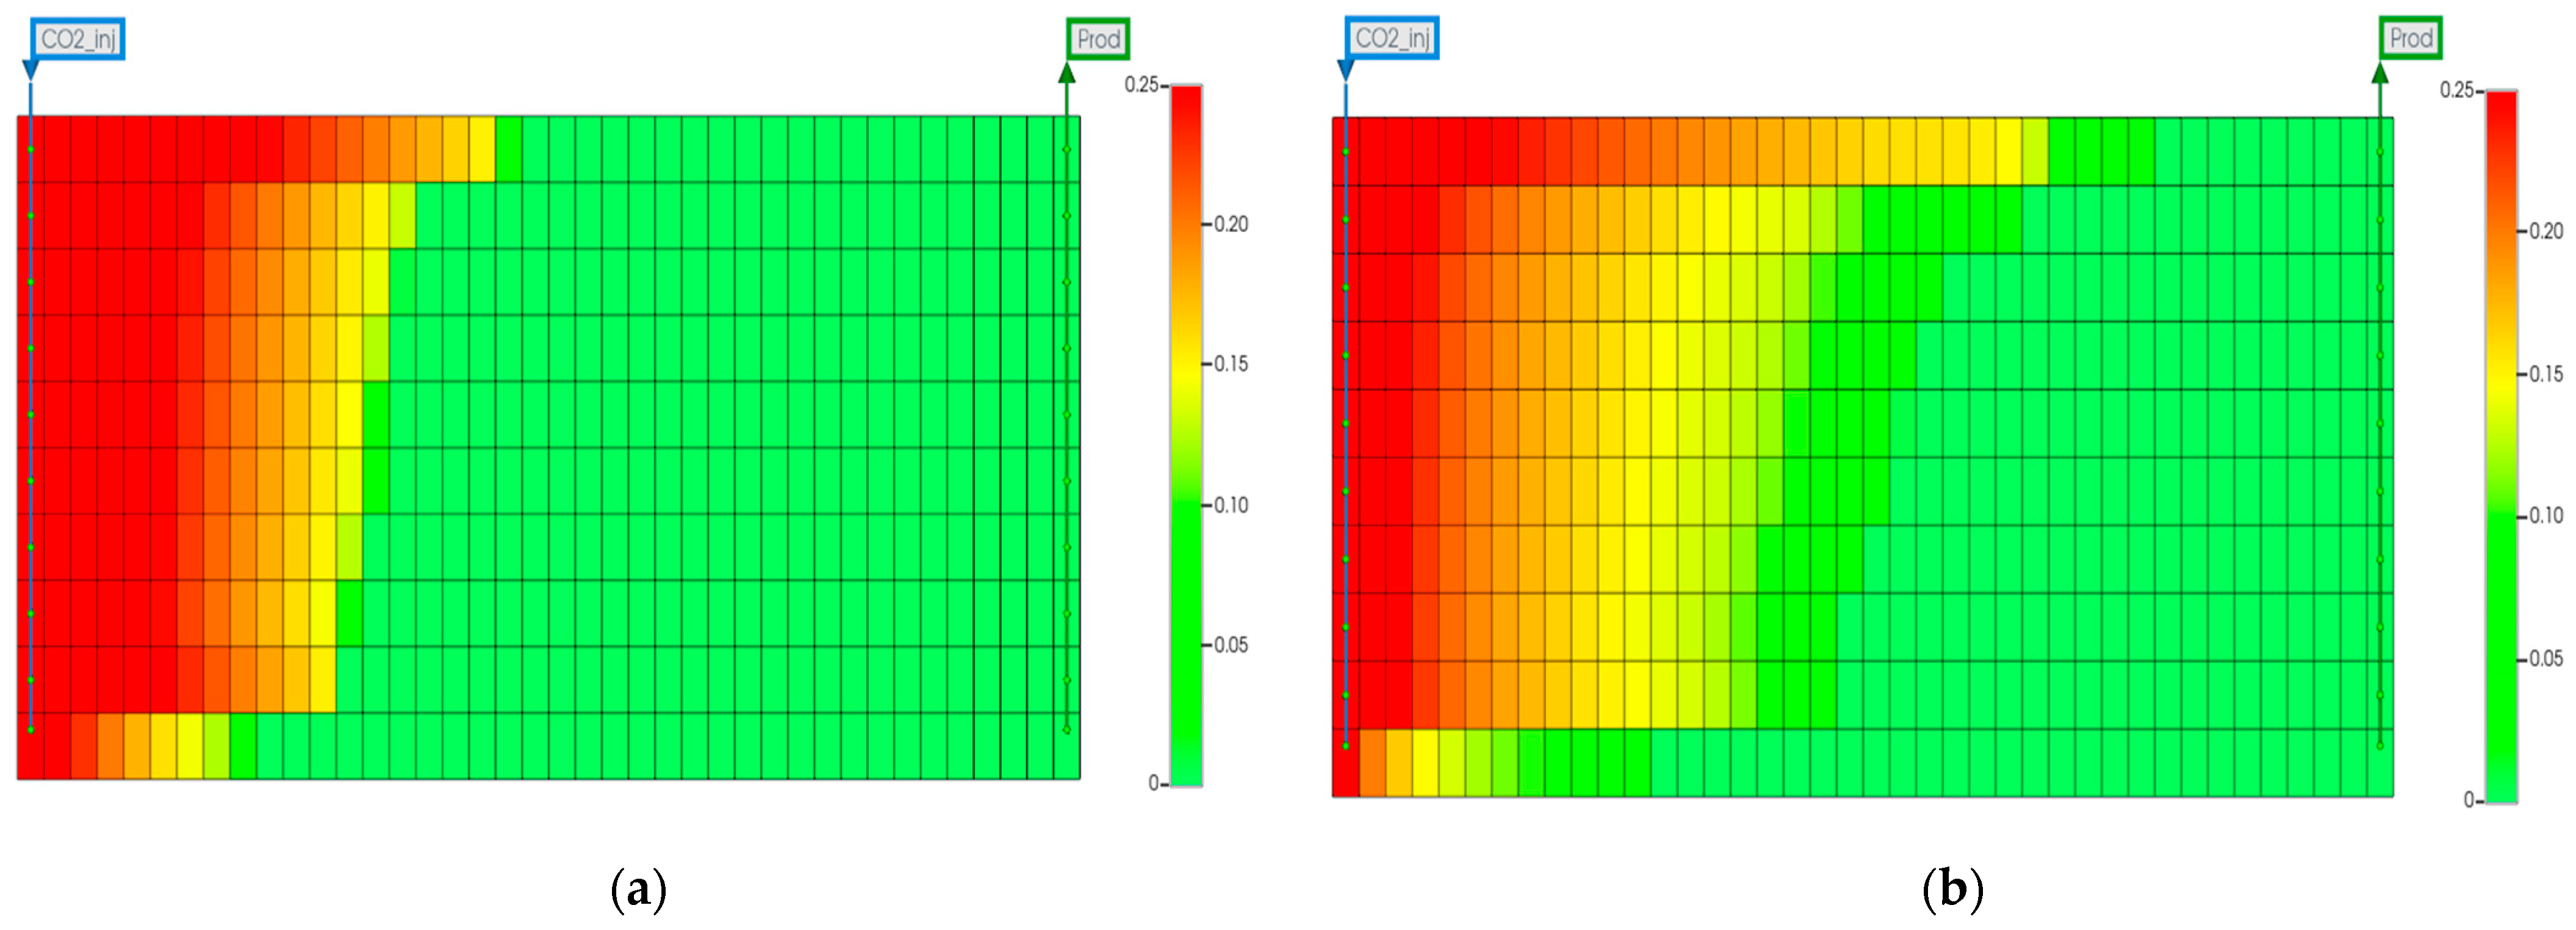
- The purity of the injection CO2 gas stream has a crucial role in the efficiency of both oil recovery and CO2 sequestration. Impurities in the CO2 stream exhibit reduced effectiveness in CO2-EOR. Impure CO2 demonstrates a 6% less reduction in oil viscosity efficiency compared to pure CO2, along with a 1258% increase in IFT and increased reservoir pressure. It leads to gas channeling and reduced sweep efficiency, resulting in approximately 4.5% lower oil recovery than pure CO2 injection. Gas channeling results in a 20–25% decline in storage efficiency compared to pure CO2.
- (3)
- The incorporation of CO2 with low-salinity water in the WAG injection exhibits the highest oil recovery compared to other injection methods. The rock wettability change from oil-wet to water-wet surface has a remarkable impact on the recovery factor.
- (4)
- Geochemical reaction leads to CO2 solubility trapping and increases overall CO2 storage capacity. This proposes that geochemical reaction is a key factor in CCS to estimate CO2 storage.
- (5)
- Based on the simulation results, the use of impure CO2 gas in LSWAG injection leads to a higher oil-recovery factor and CO2 storage capacity than pure CO2-WAG injection. This suggests that wettability alteration by LSWI has a greater impact on recovery and geochemical reaction has a greater impact on CO2 storage than the purity of the CO2.
- (6)
- Based on the optimization results, to increase oil recovery, the injection rate of the injected fluid should be increased. In the case of the storage ratio, as the CO2 injection rate increases, the gravity override effect is intensified, leading to a decrease in the storage ratio and resulting in lower efficiency.
Author Contributions
Funding
Data Availability Statement
Conflicts of Interest
References
- Kargarpour, M.A. Carbonate reservoir characterization: An integrated approach. J. Pet. Explor. Prod. Technol. 2020, 10, 2655–2667. [Google Scholar] [CrossRef]
- Hao, J.; Mohammadkhani, S.; Shahverdi, H.; Esfahany, M.N.; Shapiro, A. Mechanisms of smart waterflooding in carbonate oil reservoirs-A review. J. Pet. Sci. Eng. 2019, 179, 276–291. [Google Scholar] [CrossRef]
- Green, D.W.; Willhite, G.P. Enhanced Oil Recovery, 2nd ed.; Society of Petroleum Engineers: Richardson, TX, USA, 2018. [Google Scholar]
- Adegbite, J.O.; Al-Shalabi, E.W. Effect of heterogeneity on engineered water injection in carbonates using five-spot sector model: A numerical study. Petroleum 2022, 8, 375–390. [Google Scholar] [CrossRef]
- Honsy, R.; Zahran, A.; Abotaled, A.; Ramzi, M.; Mubarak, M.F.; Zayed, M.A.; Shahawy, A.E.; Hussein, M.F. Nanotechnology impact on chemical-enhanced oil recovery: A review and bibliometric analysis of recent developments. ACS Omega 2023, 8, 46325–46345. [Google Scholar]
- Khelkhal, M.A.; Eskin, A.A.; Varfolomeev, M.A. Optimizing in situ combustion with manganese (II) oxide nanoparticle-catalyzed heavy oil oxidation. Catalysts 2023, 13, 491. [Google Scholar] [CrossRef]
- Murzakhanov, F.; Ponomarev, A.; Khelkhal, M.A.; Amziane, O.; Vakhin, A.V.; Gafurov, M. Conventional and high-field pulsed EPR experimental studies on Bazhenov oil formation under the influence of 50Hz electromagnetic field. Fuel 2023, 334, 126580. [Google Scholar] [CrossRef]
- Nassabeh, M.; You, Z.; Keshavarz, A.; Iglauer, S. Hybrid EOR performance optimization through flue gas–water alternating gas (WAG) injection: Investigating the synergistic effects of water salinity and flue gas incorporation. Energy Fuel 2024, 38, 13956–13973. [Google Scholar] [CrossRef]
- You, J.; Ampomah, W.; Sun, Q. Co-optimizing water-alternating-carbon dioxide injection projects using a machine learning assisted computational framework. Appl. Energy 2020, 279, 115695. [Google Scholar] [CrossRef]
- Hafez, M.; Ratanpara, A.P.; Martiniere, Y.; Dagois, M.; Ghazvini, M.; Kavosi, M.; Mandin, P.; Kim, M. CO2-monoethanolamine-induced oil swelling and viscosity reduction for enhanced oil recovery. J. Pet. Sci. Eng. 2021, 206, 109022. [Google Scholar] [CrossRef]
- Davoodi, S.; Thanh, H.V.; Wood, D.A.; Mehrad, M.; Al-Shargabi, M.; Rukavishnikov, V.S. Machine learning insights to CO2-EOR and storage simulations through a five-spot pattern–a theoretical study. Expert Syst. Appl. 2024, 250, 123944. [Google Scholar] [CrossRef]
- Siqueira, T.A.; Iglesias, R.S.; Ketzer, J.M. Carbon dioxide injection in carbonate reservoirs—A review of CO2-water-rock interaction studies. Greenh. Gases 2017, 7, 802–816. [Google Scholar] [CrossRef]
- Bacci, G.; Korre, A.; Durucan, S. An experimental and numerical investigation into the impact of dissolution/precipitation mechanisms on CO2 injectivity in the wellbore and far field regions. Int. J. Greenh. Gas Control 2011, 5, 579–588. [Google Scholar] [CrossRef]
- Perera, M.S.A.; Gamage, R.P.; Rathnaweera, T.D.; Ranathunga, A.S.; Koay, A.; Choi, X. A review of CO2-enhanced oil recovery with a simulated sensitivity analysis. Energies 2016, 9, 481. [Google Scholar] [CrossRef]
- Lei, H.; Yang, S.; Zu, L.; Wang, Z.; Li, Y. Oil recovery performance and CO2 storage potential of CO2 water-alternating-gas injection after continuous CO2 injection in a multilayer formation. Energy Fuel 2016, 30, 8922–8931. [Google Scholar] [CrossRef]
- Schreiber, P.E.; Osorio Ochoa, A.; Hild, J.C.; Prinet, C.; Bourgeois, M.; Kumar, A.; Bartolome, P. A comprehensive analysis of water alternating gas recovery mechanisms in a Giant Middle East Field. In Proceedings of the SPE EOR Conference at Oil and Gas West Asia, Muscat, Oman, 21–23 March 2022. [Google Scholar]
- AlRassas, A.M.; Vo Thanh, H.; Ren, S.; Sun, R.; Al-Areeq, N.M.; Kolawole, O.; Hakimi, M.H. CO2 sequestration and enhanced oil recovery via the water alternating gas scheme in a mixed transgressive sandstone-carbonate reservoir: Case study of a large Middle East oilfield. Energy Fuel 2022, 36, 10299–10314. [Google Scholar] [CrossRef]
- Wilson, A. CO2 low-salinity water alternating gas: A promising new approach for EOR. J. Pet. Technol. 2015, 67, 84–86. [Google Scholar] [CrossRef]
- Ma, S.; James, L.A. Literature review of hybrid CO2 low salinity water-alternating-gas injection and investigation on hysteresis effect. Energies 2022, 15, 7891. [Google Scholar] [CrossRef]
- Yang, Y.; Yuan, W.; Hou, J.; You, Z.; Li, J.; Liu, Y. Stochastic and upscaled analytical modeling of fines migration in porous media induced by low-salinity water injection. Appl. Math. Mech. 2020, 41, 491–506. [Google Scholar] [CrossRef]
- Vivek, R.; Sivasankar, P.; Kumar, G.S. Accelerating dissolution trapping by low saline WAG injection scenario. Energy Procedia 2017, 114, 5038–5047. [Google Scholar] [CrossRef]
- Al-Shalabi, E.W.; Sepehrnoori, K.; Pope, G. Geochemical interpretation of low-salinity water injection in carbonate oil reservoir. SPE J. 2015, 20, 1212–1226. [Google Scholar] [CrossRef]
- Rego, F.B.; Mehrabi, M.; Sanaeri, A.; Sepehrnoori, K. Improvements on modelling wettability alteration by engineered water injection: Surface complexation at the oil/brine/rock contact. Fuel 2021, 284, 118991. [Google Scholar] [CrossRef]
- Chapoy, A.; Nazeri, M.; Kapateh, M.; Burgass, R.; Coquelet, C.; Tohidi, B. Effect of impurities on thermophysical properties and phase behaviour of a CO2-rich system in CCS. Int. J. Greenh. Gas Control 2013, 19, 92–100. [Google Scholar] [CrossRef]
- Jin, L.; Pekot, L.J.; Hawthorne, S.B.; Salako, O.; Peterson, K.J.; Bosshart, N.W.; Jiang, T.; Hamling, J.A.; Gorecki, C.D. Evaluation of recycle gas injection on CO2 enhanced oil recovery and associated storage performance. Int. J. Greenh. Gas Control 2018, 75, 151–161. [Google Scholar] [CrossRef]
- Choubineh, A.; Helalizadeh, A.; Wood, D.A. The impacts of gas impurities on the minimum miscibility pressure of injected CO2-rich gas–crude oil systems and enhanced oil recovery potential. Pet. Sci. 2019, 16, 117–126. [Google Scholar] [CrossRef]
- Cho, J.; Min, B.; Kwon, S.; Park, G.; Lee, K.S. Compositional modeling with formation damage to investigate the effects of CO2-CH4 water alternating gas (WAG) on performance of coupled enhanced oil recovery and geological carbon storage. J. Pet. Sci. Eng. 2021, 205, 108795. [Google Scholar] [CrossRef]
- Seo, K.; Choi, Y.; Lee, K.S. Impact of impurities on the economic assessment of carbon dioxide capture, transport, and storage. In Proceedings of the SPE Canadian Energy Technology Conference and Exhibition, Calgary, AB, Canada, 13–14 March 2024. [Google Scholar]
- Chaczykowski, M.; Osiadacz, A.J. Dynamic simulation of pipelines containing dense phase/supercritical CO2-rich mixtures for carbon capture and storage. Int. J. Greenh. Gas Control 2012, 9, 446–456. [Google Scholar] [CrossRef]
- Koenen, M.; Tambach, T.J.; Neele, F.P. Geochemical effects of impurities in CO2 on a sandstone reservoir. Energy Procedia 2011, 4, 5343–5349. [Google Scholar] [CrossRef]
- Wei, N.; Li, X.; Wang, Y.; Zhu, Q.; Liu, S.; Liu, N.; Su, X. Geochemical impact of aquifer storage for impure CO2 containing O2 and N2: Tongliao field experiment. Appl. Energy 2015, 145, 198–210. [Google Scholar] [CrossRef]
- Lee, H.S.; Cho, J.; Lee, Y.W.; Lee, K.S. Compositional modeling of impure CO2 injection for enhanced oil recovery and CO2 storage. Appl. Sci. 2021, 11, 7907. [Google Scholar] [CrossRef]
- Cui, G.; Zhu, L.; Zhou, Q.; Ren, S.; Wang, J. Geochemical reactions and their effect on CO2 storage efficiency during the whole process of CO2 EOR and subsequent storage. Int. J. Greenh. Gas Control 2021, 108, 103335. [Google Scholar] [CrossRef]
- Chaturvedi, K.R.; Ravilla, D.; Kaleem, W.; Jadhawar, P.; Sharma, T. Impact of low salinity water injection on CO2 storage and oil recovery for improved CO2 utilization. Chem. Eng. Sci. 2021, 229, 116127. [Google Scholar] [CrossRef]
- Enick, R.M.; Ammer, J. A Literature Review of Attempts to Increase the Viscosity of Dense Carbon Dioxide. 1998. Available online: https://citeseerx.ist.psu.edu/document?repid=rep1&type=pdf&doi=899dccfc1e36981b94973f48d5bf62064ae56e14 (accessed on 4 March 2025).
- Claridge, E.L. CO2 flooding strategy in a communicating layered reservoir. J. Pet. Technol. 1982, 34, 2746–2756. [Google Scholar] [CrossRef]
- Kolster, C.; Mechleri, E.; Krevor, S.; Mac Dowell, N. The role of CO2 purification and transport networks in carbon capture and storage cost reduction. Int. J. Greenh. Gas Control 2017, 58, 127–141. [Google Scholar] [CrossRef]
- Nghiem, N.; Sammon, P.; Grabenstetter, J.; Ohkuma, H. Modeling CO2 storage in aquifers with a fully-coupled geochemical EOS compositional simulator. In Proceedings of the SPE/DOE Fourteenth Symposium on Improved Oil Recovery, Tulsa, OK, USA, 17–21 April 2004. [Google Scholar]
- Kumar, A.; Datta-Gupta, A.; Shekhar, R.; Gibson, R. Modeling time lapse seismic monitoring of CO2 sequestration in hydrocarbon reservoirs including compositional and geochemical effects. Pet. Sci. Technol. 2008, 26, 887–911. [Google Scholar] [CrossRef]
- Awolayo, A.N.; Sarma, H.K.; Nghiem, L.X. A comprehensive geochemical-based approach at modeling and interpreting brine dilution in carbonate reservoirs. In Proceedings of the SPE Reservoir Simulation Conference, Montgomery, TX, USA, 20–22 February 2017. [Google Scholar]
- Helgeson, H.C.; Brown, T.H.; Leeper, R.H. Handbook of Theoretical Activity Diagrams Depicting Chemical Equilibria in Geologic Systems Involving an Aqueous Phase at One Atm and 0°C to 300°C; Freeman, Cooper: San Francisco, CA, USA, 1969. [Google Scholar]
- Rego, F.B.; Eltahan, E.; Sepehrnoori, K. Wettability alteration and improved oil recovery in unconventional resources. J. Pet. Sci. Eng. 2022, 212, 110292. [Google Scholar] [CrossRef]
- McGuire, P.; Chatham, J.; Paskvan, F.; Sommer, D.; Carini, F. Low salinity oil recovery: An exciting new EOR opportunity for Alaska’s North Slope. In Proceedings of the SPE Western Regional Meeting, Irvine, CA, USA, 30 March–1 April 2005. [Google Scholar]
- Bidhendi, M.M.; Garcia-Olvera, G.; Morin, B.; Oakey, J.S.; Alvarado, V. Interfacial viscoelasticity of crude oil/brine: An alternative enhanced-oil-recovery mechanism in smart waterflooding. SPE J. 2018, 23, 803–818. [Google Scholar] [CrossRef]
- Strand, S.; Høgnesen, E.J.; Austad, T. Wettability alteration of carbonates—Effects of potential determining ions (Ca2+ and SO42−) and temperature. Colloids Surf. A Physicochem. Eng. Asp. 2006, 275, 1–10. [Google Scholar] [CrossRef]
- Lager, A.; Webb, K.J.; Black, C.; Singleton, M.; Sorbie, K.S. Low salinity oil recovery-An experimental investigation. Petrophysics 2008, 49, 28–35. [Google Scholar]
- Ligthelm, D.J.; Gronsveld, J.; Hofman, J.; Brussee, N.; Marcelis, F.; Van der Linde, H. Novel waterflooding strategy by manipulation of injection brine composition. In Proceedings of the SPE Europec Featured at EAGE Conference and Exhibition, Amsterdam, The Netherlands, 8–11 June 2009. [Google Scholar]
- Austad, T.; RezaeiDoust, A.; Puntervold, T. Chemical mechanism of low salinity water flooding in sandstone reservoirs. In Proceedings of the SPE Improved Oil Recovery Symposium, Tulsa, OK, USA, 24–28 April 2010. [Google Scholar]
- Hiorth, A.; Cathles, L.; Madland, M. The impact of pore water chemistry on carbonate surface charge and oil wettability. Transp. Porous Media 2010, 85, 1–21. [Google Scholar] [CrossRef]
- Awolayo, A.; Sarma, H.; AlSumaiti, A.M. A laboratory study of ionic effect of smart water for enhancing oil recovery in carbonate reservoirs. In Proceedings of the SPE EOR Conference at Oil and Gas West Asia, Muscat, Oman, 31 March–2 April 2014. [Google Scholar]
- Mahani, H.; Keya, A.L.; Berg, S.; Bartels, W.B.; Nasralla, R.; Rossen, W.R. Insights into the mechanism of wettability alteration by low-salinity flooding (LSF) in carbonates. Energy Fuel 2015, 29, 1352–1367. [Google Scholar] [CrossRef]
- Ahmadi, S.; Hosseini, M.; Tangestani, E.; Mousavi, S.E.; Niazi, M. Wettability alteration and oil recovery by spontaneous imbibition of smart water and surfactants into carbonates. Pet. Sci. 2020, 17, 712–721. [Google Scholar] [CrossRef]
- Ratanpara, A.; Kim, M. Wettability alteration mechanisms in enhanced oil recovery with surfactants and nanofluids: A review with microfluidic applications. Energies 2023, 16, 8003. [Google Scholar] [CrossRef]
- Kenyon, D. Third SPE comparative solution project: Gas cycling of retrograde condensate reservoirs. J. Pet. Technol. 1987, 39, 981–997. [Google Scholar] [CrossRef]
- Zhang, Y.; Sarma, H. Improving waterflood recovery efficiency in carbonate reservoirs through salinity variations and ionic exchanges: A promising low-cost “smart-waterflood” approach. In Proceedings of the Abu Dhabi International Petroleum Exhibition and Conference, Abu Dhabi, United Arab Emirates, 11–14 November 2012. [Google Scholar]
- Coats, K.H. An equation of state compositional model. SPE J. 1980, 20, 363–376. [Google Scholar] [CrossRef]
- Betté, S.; Hartman, K.J.; Heinemann, R.F. Compositional modeling of interfacial tension effect in miscible displacement processes. J. Pet. Sci. Eng. 1991, 6, 1–14. [Google Scholar] [CrossRef]


| Literature | Geochemistry | LSWI | Impure CO2 | CO2 Storage | Carbonate Reservoir |
|---|---|---|---|---|---|
| Nassabeh et al. [8] | × | ○ | ○ | × | ○ |
| Seo et al. [28] | × | × | ○ | ○ | × |
| AlRassas et al. [17] | × | × | × | ○ | ○ |
| Adegbite et al. [4] | × | ○ | × | × | ○ |
| Lee et al. [32] | × | × | ○ | ○ | × |
| Cui et al. [33] | ○ | × | × | ○ | × |
| Chaturvedi et al. [34] | × | ○ | × | ○ | × |
| Composition | Pure CO2 | Impure CO2 |
|---|---|---|
| CO2 (% v/v) | 100 | 77.4 |
| Ar (% v/v) | - | 3.19 |
| N2 (% v/v) | - | 11.4 |
| O2 (% v/v) | - | 7.96 |
| SO2 (ppm) | - | 200 |
| Hydrocarbon solubility | |
| (R1) | |
| (R2) | |
| Aqueous reactions | |
| (R3) | |
| (R4) | |
| (R5) | |
| (R6) | |
| (R7) | |
| (R8) | |
| (R9) | |
| (R10) | |
| Mineral reactions | |
| (R11) | |
| Ion exchange reactions | |
| (R12) | |
| (R13) | |
| Component | Composition | Critical Pressure (atm) | Critical Temperature (K) | Molecular Weight |
|---|---|---|---|---|
| C1 | 0.0140 | 45.4 | 190.6 | 16.04 |
| C2 | 0.0143 | 48.2 | 305.4 | 30.07 |
| C3 | 0.0243 | 41.9 | 369.8 | 44.09 |
| C4 | 0.0173 | 37.5 | 425.2 | 58.12 |
| C5 | 0.0357 | 33.3 | 469.6 | 72.15 |
| C6 | 0.0418 | 32.5 | 507.5 | 86.00 |
| C7–13 | 0.3554 | 26.2 | 606.5 | 12.59 |
| C14–20 | 0.1646 | 16.9 | 740.0 | 22.78 |
| C21–28 | 0.0854 | 12.3 | 823.6 | 32.55 |
| C29+ | 0.2472 | 79.6 | 925.9 | 48.47 |
| CO2 | 0.0000 | 72.8 | 304.2 | 44.01 |
| Property | Values |
|---|---|
| Porosity | 0.258 |
| Permeability (md) | 50/50/5 |
| Mineral Volume Fraction (%) | Calcite 74, Quartz 26 |
| Initial Pressure (kPa) | 20,000 |
| Temperature (°C) | 70 |
| Initial Oil Saturation | 0.86 |
| Initial Water Saturation | 0.14 |
| Pore Volume (m3) | 25,800 |
| Ion type | Concentration (ppm) |
|---|---|
| Na+ | 56,200 |
| Ca2+ | 19,800 |
| Mg2+ | 770 |
| SO42− | 56 |
| HCO3− | 96 |
| Cl− | 124,100 |
| Total Salinity | 201,022 |
| Case | Injected Gas | Geochemistry | Injected Water | Wettability Alteration |
|---|---|---|---|---|
| 1 | CO2 | × | Water | × |
| 2 | Impure CO2 | × | Water | × |
| 3 | CO2 | ○ | Water | × |
| 4 | Impure CO2 | ○ | Water | × |
| 5 | CO2 | ○ | LSWI | × |
| 6 | Impure CO2 | ○ | LSWI | × |
| 7 | CO2 | ○ | LSWI | ○ |
| 8 | Impure CO2 | ○ | LSWI | ○ |
| Ion Type | Concentration (ppm) |
|---|---|
| Na+ | 13,700 |
| Ca2+ | 521 |
| Mg2+ | 1620 |
| SO42− | 3310 |
| HCO3− | 0 |
| Cl− | 24,468 |
| Total Salinity | 43,619 |
| Injected Gas | Water Injection Rate at Standard Condition (bbl/day) | Gas Injection Rate at Standard Condition (m3/day) |
|---|---|---|
| Pure CO2 | 15–25 | 12,000–20,000 |
| Impure CO2 |
| Injected Gas | Objective Function | Scenario | Gas Injection Rate (m3/day) | Water Injection Rate (bbl/day) | Oil Recovery | Storage Ratio (%) |
|---|---|---|---|---|---|---|
| Pure CO2 | Oil Recovery | Base | 16,000 | 20 | 73.95 | 6.65 |
| Optimal | 20,000 | 24.8 | 74.90 | 4.78 | ||
| 142 | 19,240 | 24.8 | 74.76 | 5.06 | ||
| 6 | 12,000 | 22 | 73.70 | 8.68 | ||
| Lowest | 12,000 | 15 | 72.68 | 9.79 | ||
| Storage Ratio | Base | 16,000 | 20 | 73.95 | 6.65 | |
| Optimal | 12,000 | 15.25 | 72.71 | 9.89 | ||
| 136 | 12,000 | 15.35 | 72.73 | 9.61 | ||
| 90 | 12,640 | 16.05 | 72.99 | 8.86 | ||
| Lowest | 20,000 | 25 | 74.88 | 4.74 | ||
| Impure CO2 | Oil Recovery | Base | 16,000 | 20 | 69.49 | 6.61 |
| Optimal | 19,640 | 24.85 | 70.91 | 4.51 | ||
| 1 | 15,200 | 15 | 68.02 | 7.54 | ||
| 219 | 18,680 | 24.35 | 70.66 | 5.12 | ||
| Lowest | 12,000 | 15 | 67.96 | 9.55 | ||
| Storage Ratio | Base | 16,000 | 20 | 69.49 | 6.61 | |
| Optimal | 12,000 | 15.5 | 68.16 | 9.59 | ||
| 10 | 19,200 | 24 | 70.68 | 4.98 | ||
| 229 | 12,840 | 15.35 | 68.11 | 8.84 | ||
| Lowest | 20,000 | 25 | 70.86 | 4.44 |
Disclaimer/Publisher’s Note: The statements, opinions and data contained in all publications are solely those of the individual author(s) and contributor(s) and not of MDPI and/or the editor(s). MDPI and/or the editor(s) disclaim responsibility for any injury to people or property resulting from any ideas, methods, instructions or products referred to in the content. |
© 2025 by the authors. Licensee MDPI, Basel, Switzerland. This article is an open access article distributed under the terms and conditions of the Creative Commons Attribution (CC BY) license (https://creativecommons.org/licenses/by/4.0/).
Share and Cite
Seo, K.; Kim, B.; Liu, Q.; Lee, K.S. Simulation of Low-Salinity Water-Alternating Impure CO2 Process for Enhanced Oil Recovery and CO2 Sequestration in Carbonate Reservoirs. Energies 2025, 18, 1297. https://doi.org/10.3390/en18051297
Seo K, Kim B, Liu Q, Lee KS. Simulation of Low-Salinity Water-Alternating Impure CO2 Process for Enhanced Oil Recovery and CO2 Sequestration in Carbonate Reservoirs. Energies. 2025; 18(5):1297. https://doi.org/10.3390/en18051297
Chicago/Turabian StyleSeo, Kwangduk, Bomi Kim, Qingquan Liu, and Kun Sang Lee. 2025. "Simulation of Low-Salinity Water-Alternating Impure CO2 Process for Enhanced Oil Recovery and CO2 Sequestration in Carbonate Reservoirs" Energies 18, no. 5: 1297. https://doi.org/10.3390/en18051297
APA StyleSeo, K., Kim, B., Liu, Q., & Lee, K. S. (2025). Simulation of Low-Salinity Water-Alternating Impure CO2 Process for Enhanced Oil Recovery and CO2 Sequestration in Carbonate Reservoirs. Energies, 18(5), 1297. https://doi.org/10.3390/en18051297