1. Introduction
As the significance of global warming issues is underscored and the interest in utilizing renewable energy as a mitigative solution grows, the demand for biofuels is consistently rising worldwide. Biofuel demand was 170,000 million liters in 2022, with projections to increase by approximately 30% over the next five years, reaching 38 billion liters by 2028 [
1]. A substantial portion of this demand emanates from India, Brazil, and Indonesia, attributable to low production costs enabled by abundant domestic raw material availability, smooth expansion of production capacity, and supportive energy security policies. For instance, in 2021, 87% of India’s crude oil supply relied on imports, Indonesia’s net imports constituted 20% of its supply, and Brazil imported 19% of its gasoline and diesel [
2]. Adopting biofuels can reduce crude oil consumption, enhance national energy security, and contribute to addressing environmental change issues through renewable energy utilization.
In 2022, out of the 170,000 million liters of biofuel produced, ethanol accounted for 1,057,000 million liters (62.18%), and biodiesel constituted 451,000 million liters (26.53%), with ethanol representing the majority [
1]. Specifically, the United States was the leading producer of ethanol, manufacturing 111.6575 billion liters in 2023, 53% of which (58.857 billion liters) originated from the United States. The balance of ethanol production was distributed among Brazil, the EU, India, China, Canada, and other regions, producing 28% (31.264 billion liters), 5% (5.450 billion liters), 5% (5.412 billion liters), 3% (3.596 billion liters), 2% (1.741 billion liters), and 5% (5.412 billion liters), respectively [
3].
Ethanol production is intricately linked to the geographical region of feedstock cultivation, which facilitates reduced production costs through efficient supply chain management [
4]. In the United States, ethanol is primarily produced from grains, utilizing food crops such as corn and sugarcane as raw materials. Thus, to produce 58.857 billion liters of ethanol in the United States in 2023, approximately 5.3 billion bushels of corn valued at USD 32 billion were utilized. Furthermore, crop prices profoundly influence ethanol prices. For instance, with corn priced at USD 5.99 per bushel in 2023, USD 6.53 worth of ethanol could be produced, along with USD 1.64 of distillers grains and USD 0.53 of distillers corn oil as byproducts [
3]. Consequently, the U.S. Environmental Protection Agency (EPA) is actively pursuing strategies to promote renewable energy use and mitigate the volatility of crop prices such as corn by setting biofuel quantitative mandates and corresponding percentage standards for cellulosic biofuels, biomass-based diesel (BBD), advanced biofuels, and total renewable fuels [
4].
Unlike the first-generation biofuels that utilize food crops as feedstocks, second-generation cellulosic biofuels (SGCBs) derived from non-food crops such as switchgrass are proposed as an alternative, considering food security. Since SGCBs utilize non-food crops, concerns regarding the impact of ethanol production on food supply are mitigated, and consequently, extensive research has been devoted to the production of these second-generation SGCBs. For instance, Zhang et al. [
5] analyzed the environmental impacts of SGCB crop growth using the Environmental Policy Integrated Climate (EPIC) model. Kim et al. [
6] studied the growth of switchgrass under various extant and prospective climate scenarios. Moreover, active research continues on third-generation cellulosic biofuels (SGCBs) utilizing microalgae, which are heralded for their easy cultivation and rapid growth rates [
7]. Despite these diverse studies, producing commercially cost-effective ethanol from SGCB remains a significant challenge. Therefore, as of 2023, 98% of the 198 ethanol refineries in the U.S. primarily use corn feedstock, while the remaining 2% depend on alternatives such as sorghum and cellulosic fiber [
3]. In summary, most ethanol refineries maintain corn-based operations to enable economical biofuel production.
First-generation ethanol is considered a renewable and sustainable alternative to fossil fuels; however, the energy-intensive and costly processes required to obtain raw materials such as corn can elevate production costs. The supply chain for ethanol production generally comprises three principal entities: the farms that harvest the feedstock, the distribution network that transports the feedstock and fuel, and the refineries that produce the ethanol [
8]. Each entity consists of a diverse array of production activities [
9]. For instance, the refinery’s ethanol production process involves eight sequential stages: grain receiving and storage, milling, cooking, liquefaction, fermentation, distillation, molecular sieve and denaturant, and ethanol storage. Initially, grain (typically corn) received from farms or storage facilities is processed through the grain receiving, storage, and milling stages, and during liquefaction, enzymes decompose the grain’s starch into a liquid substance known as mash [
10]. At this juncture, additional enzymes are introduced to further liquefy the starch. During fermentation, enzymes convert the mash’s sugars and starches into ethanol and carbon dioxide [
11]. In the distillation stage, ethanol is purified from water and contaminants using their differing boiling points [
12]. High-purity ethanol is then produced by filtering the distilled ethanol through a molecular sieve and denaturant, with the final ethanol product being stored prior to distribution [
8]. In contrast, sugarcane-based bioethanol production involves directly extracting sugar from sugarcane juice prior to fermentation [
13], offering relatively higher production efficiency than corn-based methods due to sugarcane’s superior sugar content per unit of biomass [
14]. Moreover, alongside the intricate ethanol production process, farms must conduct requisite operational activities (tilling, planting, pruning, pest control, and irrigation) to consistently produce feedstock despite climatic variances, coupled with a distribution strategy that minimizes costs and feedstock loss during transport from the farm to the refinery [
8].
Therefore, efficient operation of the production and distribution process of biofuels necessitates the application of various optimization methods for supply chain management, just like other industries, and numerous studies on optimization methods have been conducted to date. We have conducted several studies on the management of the biofuel supply chain using various feedstocks such as corn, sugarcane, and switchgrass, and have determined that the implementation of diverse optimization techniques from Operations Research is crucial for enhancing the economic feasibility of existing biofuel supply chain operations. Recently, the authors conducted a review of various machine learning techniques applied to biodiesel production operation management and evaluated how simulation techniques are employed in ethanol production [
9,
15]. In the review study of machine learning techniques applied to crop yield estimation and demand forecasting for ethanol, we discovered that the optimal machine learning model, which is most appropriate for the given data, can be identified through optimization techniques employed in Operations Research. In addition, we found that sophisticated biofuel production processes can be modeled through high-fidelity simulation, allowing for fairly precise predictions of the performance of each production process, yet simulation modeling techniques should be integrated with optimization techniques to identify the optimal solution in simulation research. This study aims at investigating optimization methods used for the efficient management of the biofuel supply chain operations. This study reviews optimization methodologies such as linear programming, non-linear programming, and integer programming, and examines case studies where each method is applied. Furthermore, we examine simulation methods and their application cases, which have become widespread due to recent advances in computer performance, artificial intelligence (AI), and digital twin (DT) technology. The study also evaluates optimization methods that incorporate simulation techniques. To achieve this goal, the study conducted searches of the Web of Science and Scopus databases for papers focusing on optimization methods pertinent to the operations of farms, distribution networks, and refineries critical to biofuel production, and classified and reviewed these papers according to the aforementioned optimization methodology. The detailed search results and classification process are outlined in
Section 2. The contributions of this study are outlined as follows. First, we summarize cases demonstrating how various optimization techniques referenced in Operations Research are applied to various aspects of biofuel supply chain management. Second, optimization technologies are categorized, and guidance is provided for sub-fields of research where activity is currently pronounced. Third, the concepts of individual optimization methodologies are succinctly summarized by comparing them with relevant theories, which assists new researchers in navigating the fields of Operations Research and Optimization more effectively. Fourth, the latest technology, termed simulation-based optimization, is introduced; this segment also delineates how this method can be applied to managing issues in a biofuel supply chain. As a result, this study will equip researchers and engineers with guidance for selecting an appropriate methodology for their optimization objectives in the biofuel production process, thereby enhancing both work and research efficiency.
2. Materials and Methods
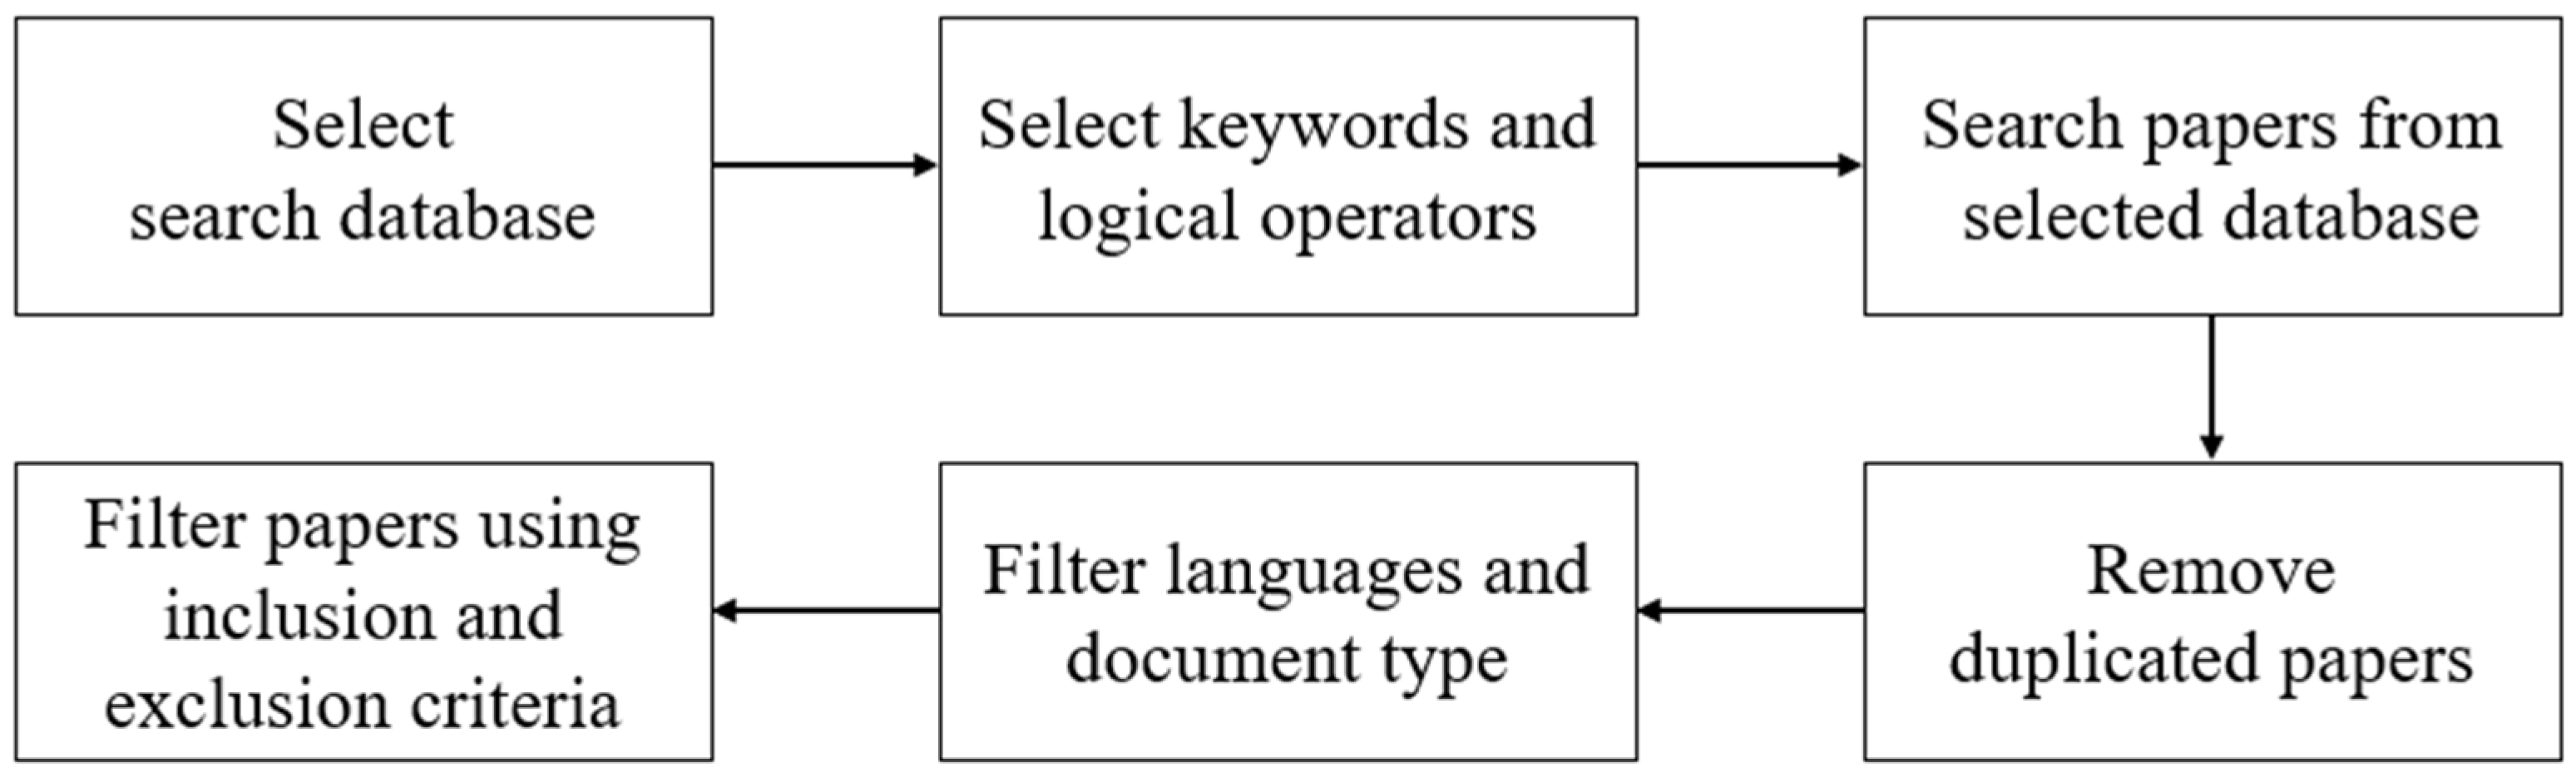
To conduct a literature review on biofuel production optimization, the study adopted a literature screening process comprising six stages as illustrated in
Figure 1. Initially, the Web of Science and Scopus databases were selected, and research articles published up to 2024 were searched using the keyword “biofuel optimization”. After the search, duplicate papers were removed, and documents were filtered by language and type. Finally, the inclusion and exclusion criteria, which were predefined, were applied for further filtering. The subsequent paragraphs detail the results for each phase.
Biofuel optimization research involves various types of feedstocks. As illustrated in
Table 1, these feedstock types are used as keywords for the search filter. Selected keywords include “biofuel optimization”, “first generation biofuel”, “second generation biofuel”, “corn”, “sugarcane”, and “soybean”. The logical operator “AND” is employed. Based on the search results, 7048 papers from the Web of Science and 7826 papers from Scopus were retrieved. Of these, 230 papers pertained to the production of first-generation biofuels, 411 to ethanol production using corn, 316 to sugarcane, and 219 to soybean in the Web of Science database. For reference, the Web of Science database contained 326 papers related to second-generation and next-generation biofuel production, indicating active research in next-generation biofuel production.
Independent of the feedstock type, 774 out of 7048 papers relating to the biofuel production supply chain were retrieved, with about 11% of the studies focusing on reducing biofuel production costs through efficient supply chain management techniques. The papers were categorized by the optimization methodology employed. Optimization (or mathematical optimization) identifies the optimal solution (either a minimum or maximum solution) to a problem by considering various constraints. Common optimization methodologies include Linear Programming (LP), Integer Programming (IP), Dynamic Programming (DP), Stochastic Programming (SP) involving simulation, and Non-Linear Programming (NLP). In this study, the analyzed literature was categorized based on the optimization methodology suggested by [
16]. The search employed keywords such as “biofuel supply chain optimization”, “linear programming”, “integer programming”, “dynamic programming”, “stochastic programming”, “nonlinear programming”, and “simulation-based optimization” using the logical operator “AND”.
As shown in
Table 2, the quantities of papers related to the keywords LP, IP, DP, SP, and NLP in the Web of Science are 187, 219, 25, 101, and 27, respectively. IP is the predominant optimization method in the biofuel supply chain. Numerous studies have explored the allocation of facilities within the biofuel supply chain, with IP being commonly employed to address this issue. LP is another popular optimization approach. Employing LP enables the visualization of product flow through each facility under optimal conditions. Furthermore, LP can ascertain the capacity of facilities in light of demand flow. Simulation modeling is extensively applied alongside traditional analytical methods such as probability modeling or queuing modeling. Nonetheless, there are relatively few studies that employ simulation-based optimization in biofuel supply chain optimization. This is attributable to simulation primarily serving as a verification tool for stochastic modeling rather than being adopted for simulation-based optimization.
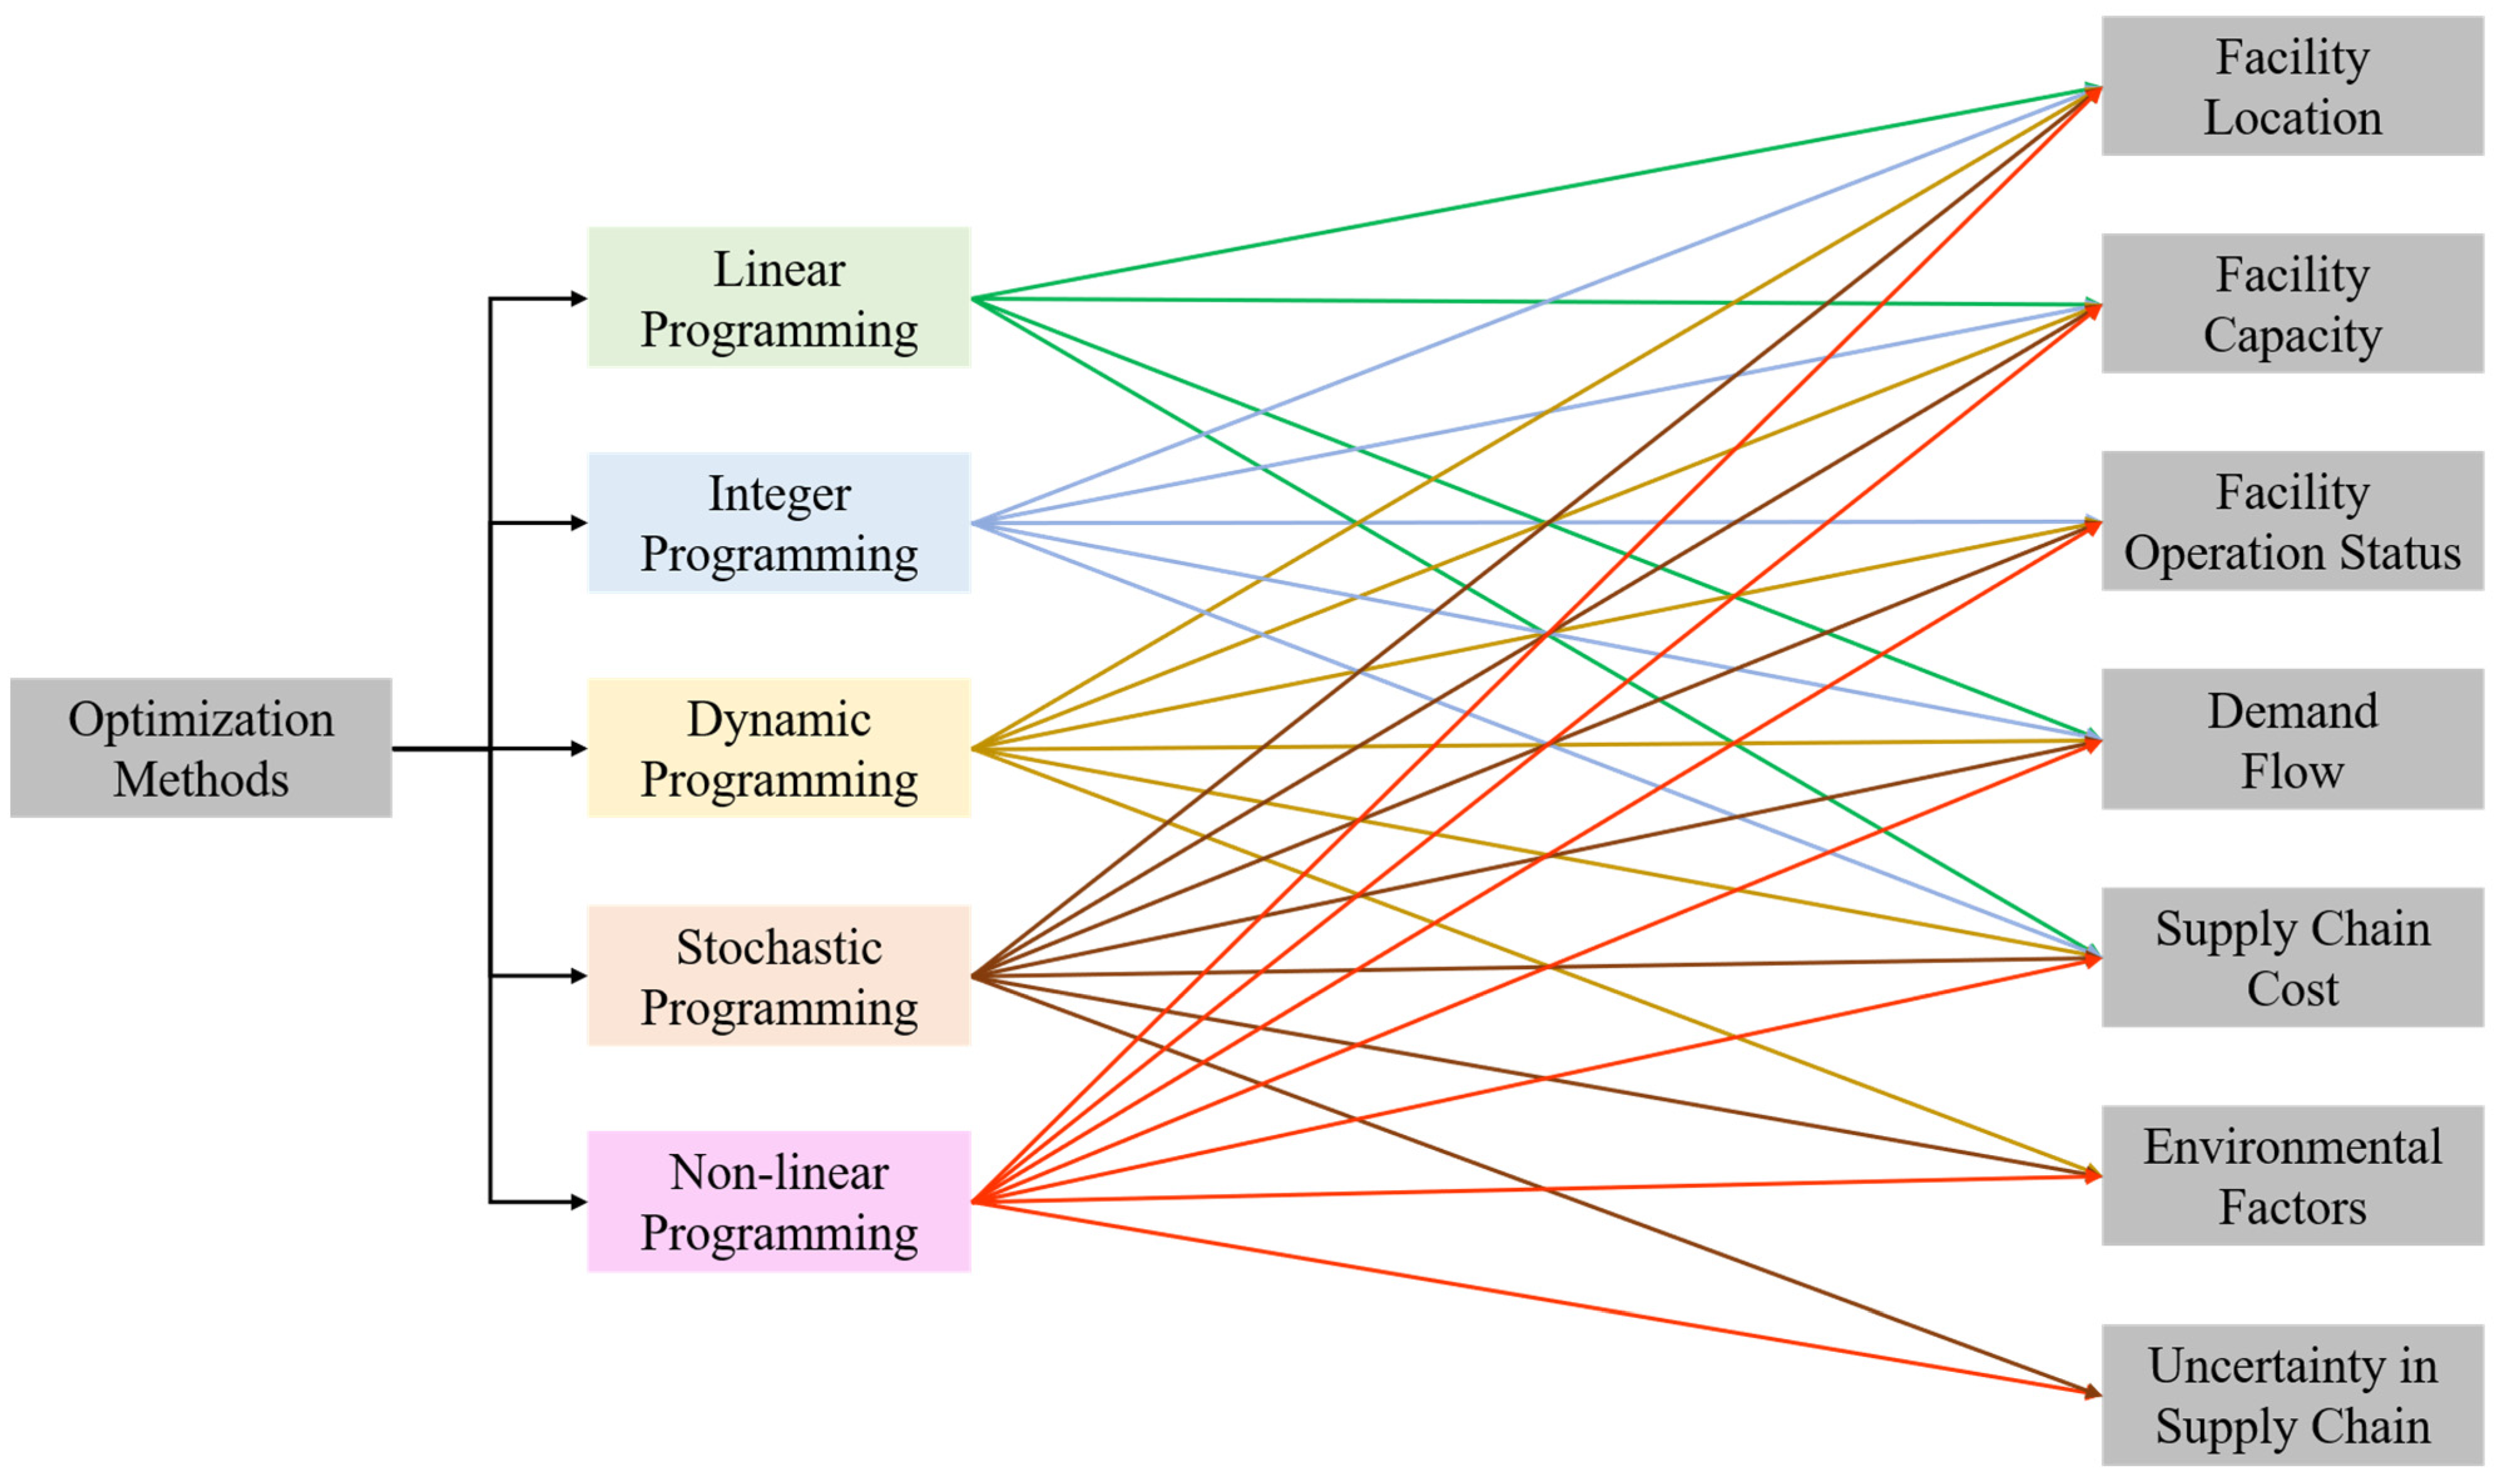
Figure 2 presents a summary diagram of optimization methods and the decision variables in the biofuel supply chain as described in
Section 3.
To analyze recent study trends, additional study selection is undertaken. Searches are conducted using the Web of Science database with the selected keywords “biofuel supply chain optimization”. The search results include 774 papers published up to December 2024. Initially, papers published in 2024 are filtered, resulting in 46 remaining papers. Subsequently, review papers and early access papers are excluded, with eight papers being removed. Finally, based on the titles and abstracts, papers are further filtered using the specified inclusion and exclusion criteria presented in
Table 3, resulting in 19 papers that meet the inclusion criteria.
Table 4 outlines the optimization methods, objectives, and case study details of the selected studies.
In 2024, seven SP papers were published. Relative to the entirety of the period, SP paper publications have increased more than any other optimization method. Most of these papers focus on resilient supply chain optimization where parameters are uncertain, a reflection of sustainability being a predominant issue in recent decades. According to the Web of Science database, publications on resilient supply chain optimization have exceeded 10 annually since 2019. Moreover, uncertainties in the supply chain are growing due to factors such as climate change, increased regulation in various countries, and rising costs of raw materials.
To optimize these complex supply chains, SP, NLP, and simulation methods are promising solutions. Simulation particularly replicates every action occurring within the supply chain, thereby enabling the identification of situations across all elements. Future research should focus on increasing the application of these stochastic methodologies.
In
Section 3 and
Section 4, we will classify the researched papers using optimization methods and review representative papers that illustrate effective application cases for each methodology.
3. Optimization Methods
Optimization (or mathematical optimization) is a mathematical approach designed to identify an optimal solution (e.g., minimum or maximum) within a feasible solution space, considering various problem-associated constraints (e.g., resource or budget constraints) [
16]. Assuming a point
, the extremum of the function
defines the maximum by Equation (1). Note that
, where
is sufficiently small for all
n.
Similarly, the extremum of the function
becomes the minimum according to Equation (2).
In this process, if , this condition acts as a constraint and alters the value of such that the optimal solution is also influenced. This will be discussed with regard to how Equations (1) and (2) are transformed and utilized across various optimization methods in subsequent sections.
3.1. Linear Programming
Linear programming (LP) has three main elements: (1) decision variables, (2) objective function, and (3) constraints. The aim of optimization is to determine the values of decision variables (
) that maximize (or minimize) the objective function
while accommodating constraints. In LP, however, both the objective function and the constraints must be represented by linear equations, with each function’s parameters (the coefficients of the objective function or constraint expression) explicitly specified.
Subject to
where
,
, and
. Equation (6) represents a vector form of
, which includes the coefficients of constraints.
LP utilizes the simplex algorithm (or simplex method) developed by Dantzig to accurately find an optimal solution through Gauss–Jordan row operations. It is highly reliable, guarantees an optimal solution under existing constraints, and has the benefit of rapidly identifying the optimal solution [
36].
An example of LP’s application involves minimizing the total cost of energy production for a country, including biofuels [
37].
In Equation (7),
represents a vector of decision variables, while
denotes the unit production cost of energy type
i associated with biofuel. This formula was derived from the draft Polish energy policy projected through 2040, published on 23 November 2018; the constraints impose limitations on the production of each energy source. For instance, one constraint mandates that the energy output from biofuels
must be at least
kWh, as specified in Equation (8). Constraints generally restrict the range of decision variables, which in turn delineates the extent of available resources or budget utilization [
16].
The optimal solution not only minimizes the total cost of energy production but also distributes the energy efficiently in alignment with local energy development objectives. The optimal construction cost for producing 1 MW of energy is calculated to be EUR 2,076,479.
The revenue maximization model for an integrated sugarcane microalgal biofuel (ISMB) plant is also proposed using LP [
38]. In Equation (9), the objective is to maximize the revenue stream
.
indicates the selling price of type
i, and
represents the production quantity of type
i across Equations (10)–(13).
The sugarcane plant, considered as an alternative, produces 20,000 kg/h of sugar, thus forming a constraint in Equation (10). Additionally, as the microalgal biodiesel production capacity is presumed to be 1300 L/h, it forms a constraint in Equation (11). Equations (12) and (13) impose constraints aimed at minimizing heat and carbon dioxide production. Two operational scenarios for the factory are considered: one focuses on maximizing profit without regard to carbon emissions, and the other involves calculating profit with a goal of zero carbon emissions. When the total revenue increases by 4.23%, carbon emissions increase sevenfold. However, a zero carbon emission scenario results in a 7.68% reduction in revenue.
Because LP can derive optimal solutions rapidly and with greater accuracy compared to other optimization methodologies, it is frequently applied to large-scale problems and has recently been utilized to develop an optimal energy production portfolio to fulfil the total energy demand from various sources.
3.2. Integer Programming
Integer linear programming (ILP) is a specific subtype of linear programming where all variables are integers. If some variables are non-integer continuous space variables, the technique is referred to as Mixed-integer linear programming (MILP). If either the objective function or the constraints are nonlinear, the method is known as nonlinear Integer programming (NLIP). When some variables in NLIP are non-integer continuous space variables, it is termed Mixed-integer nonlinear programming (MINLP) [
39]. However, since ILP involves integer decision variables, its solution space is not convex like that of conventional LP. Consequently, solutions cannot be derived using the Simplex method; instead, they must be determined through the branch and bound or cutting-plane methods [
16].
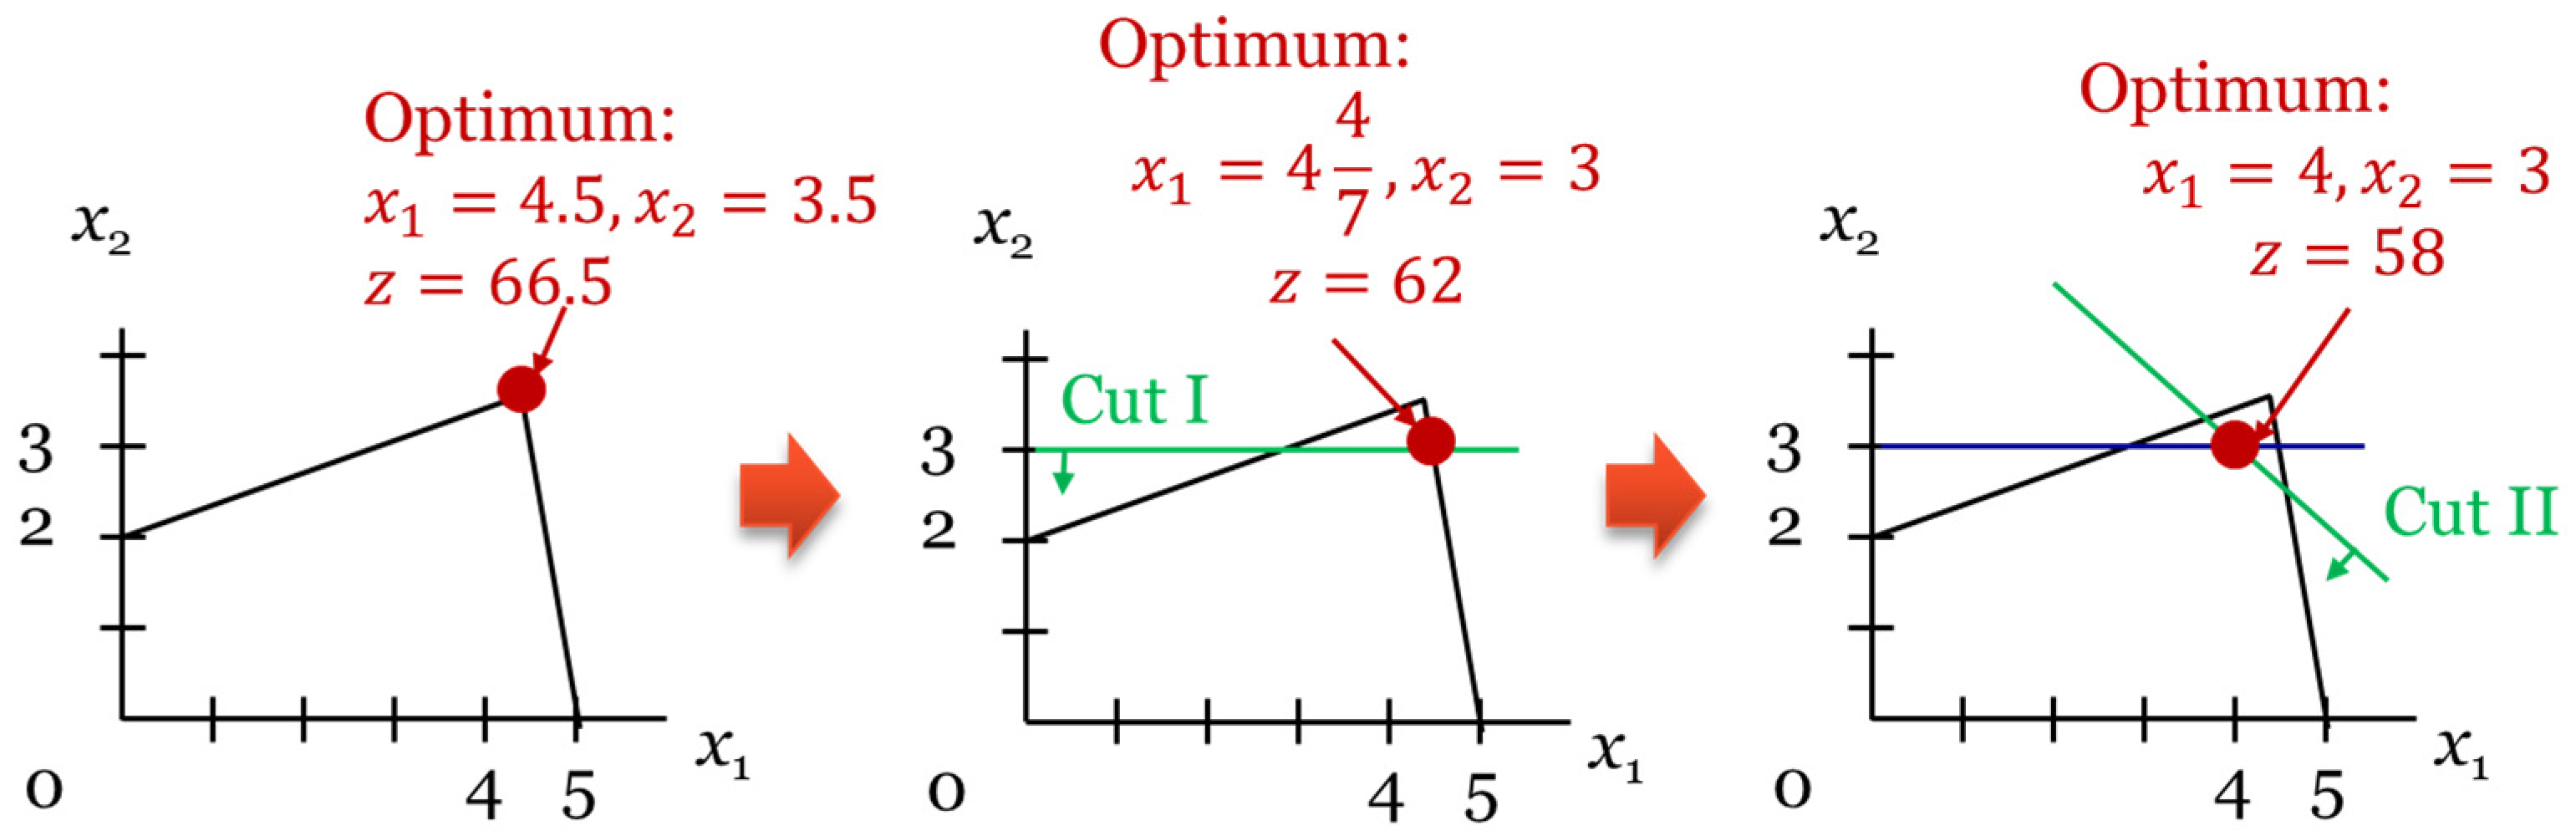
Figure 3 illustrates the process of determining the optimal ILP solution using the cutting-plane method. In standard LP scenarios, such as when
x1 = 4.5 and
x2 = 3.5, the optimization problem-solving process might conclude with these non-integer optimal solution values. However, in ILP, where all decision variables are integers, the solution space must undergo slicing by the cutting plane. This operation can be conceptualized as the search for a scenario with integer values (
,
), proximate to the non-integer optimal solution (
and
) achieved through conventional LP [
16]. Indeed, IP is utilized as frequently as LP because it is applicable to a broad spectrum of decision-making optimization problems (for instance, determining the number of transport vehicles, fermentation tanks, or types of crops), where decision variables typically have integer values.
IP can be employed to construct a decision-making model, which will facilitate the selection of the optimal vegetable oil for bio-based diesel production, thus enabling decision-makers to choose the ideal vegetable oil-derived bio-based diesel, taking into consideration factors such as fuel economy and emission standards [
40]. To maximize the Cetane number summation (
) across multiple vegetable oil manufacturing facilities, IP is structured to represent the binary decision variable of whether the
jth plant produces (
), as delineated in Equations (14)–(19).
Equation (14) serves as the objective function to maximize the total Cetane number for selecting plant j, whereas Equation (19) specifies that the decision variables are binary, and Equation (18) imposes a constraint ensuring the selection of only one plant by mandating that the sum of the decision variables equals 1. In Equation (15), denotes the oil density of the jth plant, with and representing the upper and lower bounds of the density standard, respectively. In Equation (16), denotes the viscosity of the oil from the jth plant, while and denote the upper and lower viscosity standards, respectively. Equation (17) has representing the heating value of the oil from the jth plant, and and setting the upper and lower bounds of the heating standard, respectively. Various types of plant oils, such as canola, corn, moringa, olive, and soybean, are considered; however, moringa is selected as the most effective. Consequently, only the decision variable for moringa is set to 1, with all others set to 0. This approach, known as 0–1 integer programming, is extensively utilized in models for facility and location selection among IP models.
In recent applications, the predominant IP model is MILP. For instance, Kim et al. [
41] developed an MILP model for optimizing a biomass supply chain network. This model determines the optimal number of processing plants, the locations of these plants, and their sizes. It also specifies the volume of biomass to be transported. The primary goal of the objective function is to maximize supply chain profits. Using the MILP model, the number and locations of the biomass processing plant sites are optimized. Out of 27 candidate sites, 15 are selected. As the demand for biodiesel and gasoline alters to 90%, 75%, and 60%, the optimal number of locations changes to 14, 11, and 10, respectively. Given that the MILP model’s decision variables are integers, the optimal number of plants also conforms to integer values. Hence, IP is frequently employed to determine the requisite number of facility installations and their spatial distribution.
3.3. Dynamic Programming
Dynamic programming distinguishes from LP and IP by segmenting a large problem into several smaller components, preserving the outcomes, and reusing them to resolve the larger problem. It represents a problem-solving paradigm rather than a specific algorithm. A classic example of dynamic programming is Dijkstra’s algorithm, which adopts a greedy technique to identify the shortest path from the starting point to the destination. This method stores several potential routes in a priority queue, organized by shortest distance from the starting point, and selects the optimal path through repeated searches within the graph’s nodes.
As the problem’s size is considerable, Multi-Criteria Decision Making (MCDM) employs mathematical modeling to estimate optimal solutions. In supply chain management, it facilitates sustainable supplier selection and green supplier evaluation [
42]. MCDM is characterized by a set of alternatives, specific criteria for evaluating these alternatives, and normalized weights reflecting their importance.
Table 5 illustrates the MCDM matrix to examine the value of
, representing the relationship between a distinct and finite set of alternatives
and the set of specific criteria
used to evaluate the alternatives [
42]. A weight vector
is assigned to these criteria
as they are measured in different units [
42]. Subsequently, scores are ranked from best to worst.
Hezam et al. [
43] selected the biofuel production plant location by using fuzzy dynamic programming for MCDM. Biofuel production plant location should consider social, environmental, and economic aspects. This study conducts the case study in Gujarat, India. Four panels decided five prospective locations and thirteen criteria for selecting the location. Social effect has the highest weight value and it is determined as the most important criterion. Also, transportation cost, training employees, and energy consumption are the high weight values. Based on the weight values, the most desirable location is selected. Compared to the other existing approaches, the selected location is same as the most selected location in other approaches.
Grigorouis et al. [
44] proposed a Data Envelopment Analysis (DEA) based algorithm to design biomass supply chain network that simultaneously minimize the cost and maximizes the efficiency. The system is divided to the capacity of facility (input) and the total quantity of biomass sent and the number of power plant served (output). Equation (20) describes the matrix structure
.
where
denotes the capacity of warehouse
,
represents the number of power plants served by warehouse
, and
is the total quantity of biomass from warehouse
. To compare the efficiency of this algorithm with that of the MILP model, 10 potential warehouses were considered. The MILP model decided the installation of 10 warehouses, whereas the proposed method opted for only 3, resulting in a 233% reduction in capital costs and a 0.77% decrease in total costs.
Chen et al. [
45] investigated the use of dynamic programming in the context of a biofuel micro combined heat and power system (CHP) combined with hybrid energy storage (HES). Dynamic programming optimizes energy efficiency by determining the optimal power distribution. It effectively addresses the problem with constraints by breaking the process down into sequential stages. This study segmented the energy flow based on supplier variability, as demand fluctuates over time. The study analyzed energy demands in United Kingdom households. The decision variables included engine operation, battery operation, and supercapacitor operation. Performance was assessed based on electrical efficiency and charging duration. A comparison of system efficiencies with and without the use of dynamic programming showed a 12% higher overall efficiency with dynamic programming. Consequently, dynamic programming proves effective for location-allocation and operational decision-making challenges. Notably, multiple criteria can be considered in designing an optimal supply chain.
3.4. Stochastic Programming
Stochastic programming (SP) is a problem-solving approach that deals with uncertainty in optimization models by assuming that some or all parameters have specific probability distributions, unlike LP or IP [
16]. In practical scenarios, most parameters, such as demand or price, vary with circumstances, introducing uncertainty at any time. Stochastic programming thus provides a more realistic optimal solution by incorporating these uncertainties.
Awudu and Zhang [
46] identified factors contributing to uncertainties in the biofuel supply chain. These include supply uncertainty due to feedstock shortages and land unavailability, transportation uncertainty, which leads to delivery delays and increased costs, production and operational uncertainties stemming from machine breakdowns and limited inventory capacities, and market-driven uncertainties in demand and pricing that impact decision-making in the supply chain.
Ko et al. [
47] developed a stochastic optimization model for biomass transportation, considering transportation costs, demand, and supply quantities as uncertain factors.
Table 6 displays some of the uncertain input parameters for this optimization model. The goal is to minimize total transportation costs. Although an experiment comparing the stochastic and deterministic methods showed minimal cost difference, the stochastic approach demonstrated cost savings when using both trucks and trains for transportation.
Keith and Castillo-Villar [
48] designed a stochastic programming model for the biomass supply chain with the objective of minimizing total costs, which include infrastructure investment, transportation, and biomass costs. The properties of the biomass influence the supply chain’s uncertainty; for instance, as biomass moisture content increases, so does the transportation cost. Additionally, higher moisture content necessitates greater energy expenditure to heat the biomass and facilitate moisture removal. Equations (21) and (22) describe the model’s constraints, which adjust based on supply and moisture content variability.
where
denotes the total amount of input biomass,
represents the available supply,
indicates the variable moisture content, and
signifies the total amount of output biomass. Through these constraints, uncertainty emerges from various scenarios. A case study involving 254 counties in Texas, United States, was executed. Locations for 33 train stations in Texas serving as potential depots and 167 possible biorefinery sites were identified. The optimal solution involves installing 33 depots and 10 biorefineries. The prevailing costs in the bioenergy supply chain are investment and operational costs, with the latter significantly influenced by the quality of biomass, which impacts both production and distribution costs.
Azadeh et al. [
49] proposed a stochastic programming approach to optimize the biofuel supply chain with the objective of maximizing total profits. This model accounts for uncertainties through scenario analysis, where demand and price form the core uncertainty factors. The Monte Carlo simulation method is employed to generate random numbers for biofuel price determination. The experiment was conducted using Iran as a case study. Disruptions in supply lead to demand shortages and delays in production, negatively affecting profits and prompting decision-makers to mitigate supply chain load to avert further disruptions.
Bahmani et al. [
22] developed a resilient supply chain capable of managing uncertainties induced by climate conditions such as floods and droughts, as well as land usage. A robust-stochastic optimization method addresses the issue of parameter uncertainty. The case study involved allocating cultivation centers, biofuel refineries, distribution centers, and oil extraction sites across Iran. In scenarios comparing disrupted versus resilient situations, the increased cost in the resilient scenario was 90% of that in the disrupted scenario. By dispersing facilities and decentralizing distribution, the impact of disruptions can be diminished. Thus, stochastic programming enables consideration of various uncertain factors including capacity, supply quantity, costs, and biomass characteristics.
3.5. Non-Linear Programming
Similar to the purpose of Stochastic Programming (SP) discussed in
Section 3.4, Nonlinear Programming (NLP) aims to derive a more realistic optimal solution. It addresses problems under the assumption that either the objective function or the constraint expression is nonlinear. Unlike LP, NLP must manage a complex form of a nonlinear function, necessitating the solution of a typical non-convex problem. Consequently, whereas LP identifies an exact optimal solution, NLP seeks an approximate solution, employing various methods such as branch and bound, Simulated annealing, Lagrangian relaxation, and Generalized Reduced Gradient (GRG).
Furthermore, metaheuristic algorithms can identify an approximate solution utilizing fewer computational resources [
50]. Izquierdo et al. [
51] employed particle swarm optimization to enhance the strategy of the biomass supply chain. The objective function here is to minimize the supply chain costs, with decision variables including plant capacity, biomass yield, and the binary variable indicating the presence of technology. Given that the decision variables are both binary and continuous, the optimization problem is nonlinear. The swarm comprises 100 particles, each representing a potential solution. Particles adjust their position and velocity based on the optimal locations, and the ideal particle is determined in each iteration. Limits on updating particle velocity differ by variable type, and the optimal outcome is established after 800 iterations. This model was applied to Val Bormida, Italy, involving 2530 forest sub-parcels and varying technological capacities from 1 to 5. By implementing particle swarm optimization, the optimal quantity of biomass to be harvested in each region is computed.
Ayoub and Yuji [
52] optimized the biomass utilization network cost using a Genetic Algorithm (GA). This study concentrates on designing a local area biomass utilization system to mitigate inefficient transportation costs. The objective function seeks to minimize the total cost of constructing the biomass network (B-NET) and associated emissions. To optimize the network using GA, biomass network flow is initially randomly generated, and through processes of crossover, mutation, and selection, the optimal result is determined. The case study was conducted in Aomori, Japan, where biomass resources include sewage sludge, kitchen waste, logging residues, rice straw, pruned branches, and forest residues. Twenty production paths produced heat, electricity, gas, and heating pellets. The GA model allocated production to cost-effective paths and excluded the more expensive paths to achieve an optimal solution.
Nunes and Silva [
53] proposed a tabu search (TS) algorithm for determining the optimal route of a biomass collection vehicle. The TS process begins by generating a random route, subsequently swapping two neighboring nodes in every possible scenario, and selecting the most optimal case. Once the optimal scenario is selected, the two nodes are updated on the tabu list, prompting the algorithm to explore new solution spaces. This process is repeated until either the maximum number of iterations is reached or minimal improvement is observed in the objective. However, this study has not been applied to practical situations.
NLP is also utilized in optimizing the resilient biofuel supply chain. Khezerlou et al. [
54] developed a resilient biomass-to-biofuel supply chain that accounts for transportation disruptions between facilities. Two advanced meta-heuristic algorithms, namely improved ray optimization and colliding bodies optimization, optimize the model. The considered supply chain comprises chipping terminals, multi-modal terminals, and biorefineries. Multi-modal terminals and biorefineries are assessed for disruption based on failure probability. At high risk levels, the transportation cost increases as customers favor more reliable biorefineries. Conversely, the failure cost decreases, balancing the transportation and failure costs. Compared to the risk-neutral model, the risk-averse model incurs higher supply chain costs, but the reduction in failure costs is more pronounced. Therefore, NLP can address more realistic and complex problems involving uncertainty.
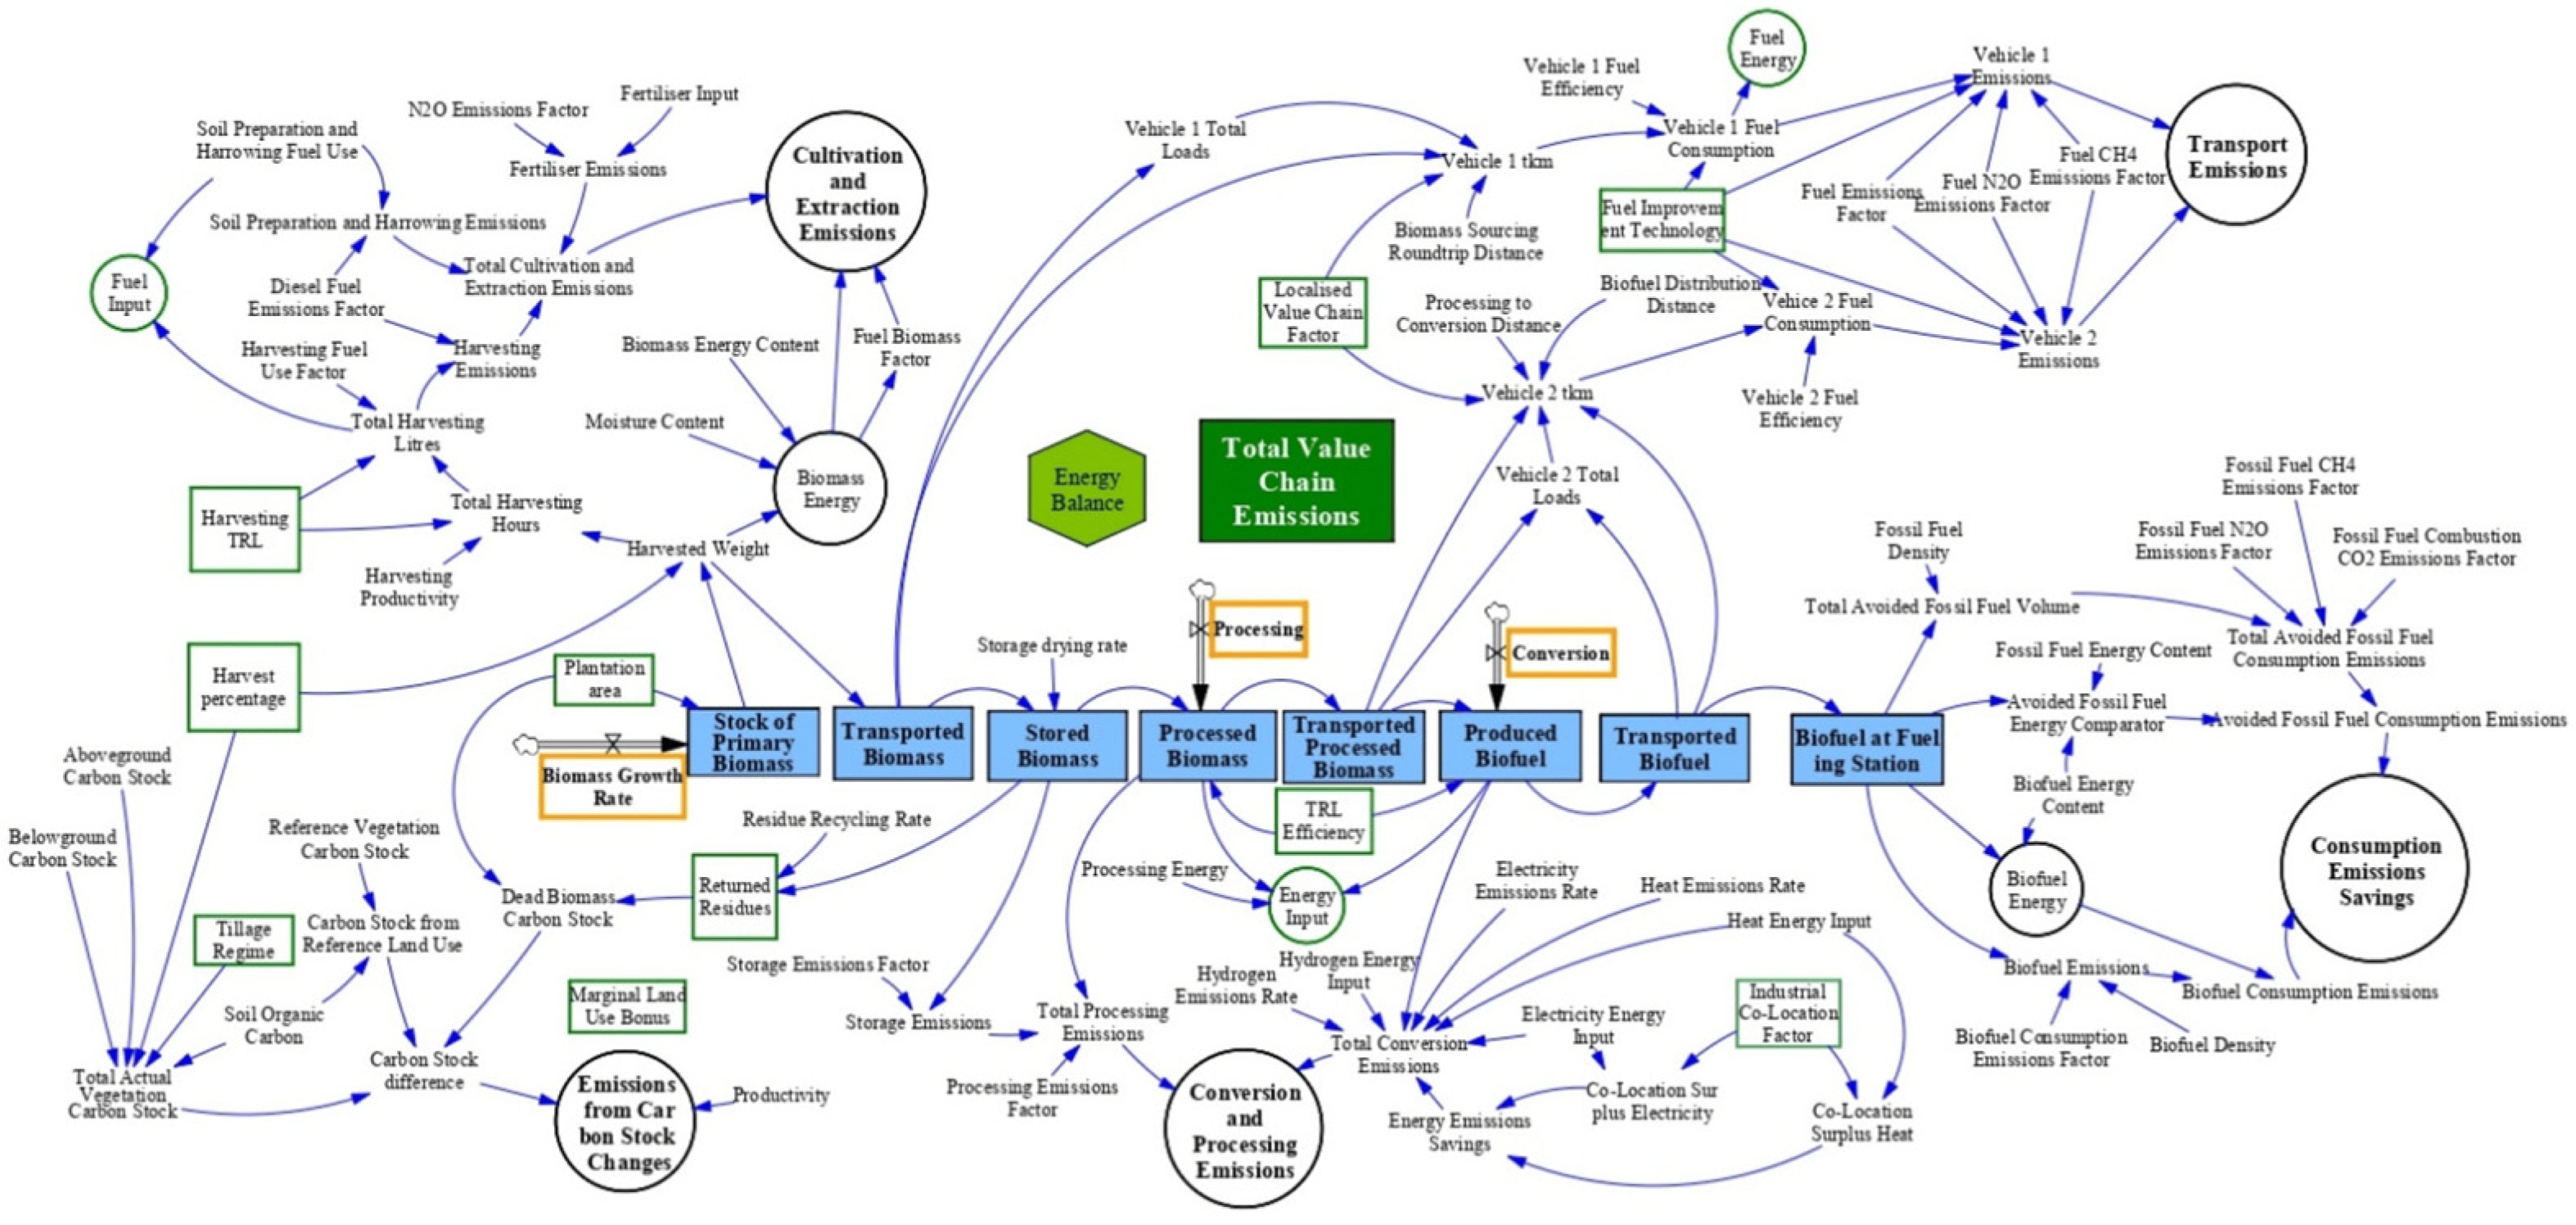
5. Discussion
This study conducted a literature review on various optimization methods for efficient supply chain management and biofuel production, as discussed in
Section 3 and
Section 4. As noted in
Section 3, an optimization model generally comprises an objective function, decision variables that ensure the objective function reaches an optimal value (maximum or minimum), and constraints (resources or budget) that are linked to these variables. The LP model, a prevalent form of optimization model, is extensively utilized due to its simplicity in modeling and its capacity to determine an exact solution using methods such as the simplex method. It is particularly well-suited for macroscopic issues, including impacts on the biofuel supply chain or deriving optimal biofuel production by considering various energy sources. IP, a subset of LP, is extensively applied in cases where decision variables such as site selection and production determination take integer values; this is pertinent to biofuel supply chain management, where all decision variables are integers. To achieve an accurate optimal solution in LP or IP, simplifying the equations typically entails making more unrealistic assumptions. Consequently, NLP or SP is employed. NLP offers the capability to manage diverse forms of nonlinear constraints and objective functions, including two-dimensional functions like crop growth curves. However, due to the increased complexity of the solution space, it typically focuses on obtaining approximate solutions through heuristic optimization algorithms rather than exact optimality. Like NLP, SP can provide a realistic optimal solution as it utilizes probability distributions to account for the uncertainty of each variable and coefficient (such as changes in consumer demand and crop yield). However, it also increases the complexity of the solution space, requiring decision-makers to consider risk and uncertainty with a statistical knowledge base.
Despite these efforts, it is challenging to assert that any methodology is universally superior because modeling inherently involves a tradeoff between fidelity to reality and manageability. During the process of identifying the optimal solution for a specific problem, accurate solution attainment is essential, as is the creation of a realistic solution space to ensure the derived solution is feasibly applicable. A model burdened with excessive assumptions may not realistically apply even if it achieves an accurate solution; similarly, even with a highly precise solution space crafted by incorporating realistic factors, it remains unviable if an accurate solution is not determined. In this regard, simulation-based optimization offers the advantage of modeling realistic constraints with high precision in the simulation space, subsequently enabling the discovery of an optimal solution based on this modeling. However, it is disadvantaged by the lengthy durations required for modeling and solution identification. For instance, if a model requires 1 min to run a simulation, and this must be repeated 30 times to gather statistical data, it would take 30 min to evaluate a single optimal parameter. In such scenarios, even with merely 1000 optimal candidates, the search for the precise solution would consume 30,000 min (20.83 days). Consequently, various heuristic algorithms employed in NLP serve as optimization engines in commercial simulation software (e.g., OptQuest (
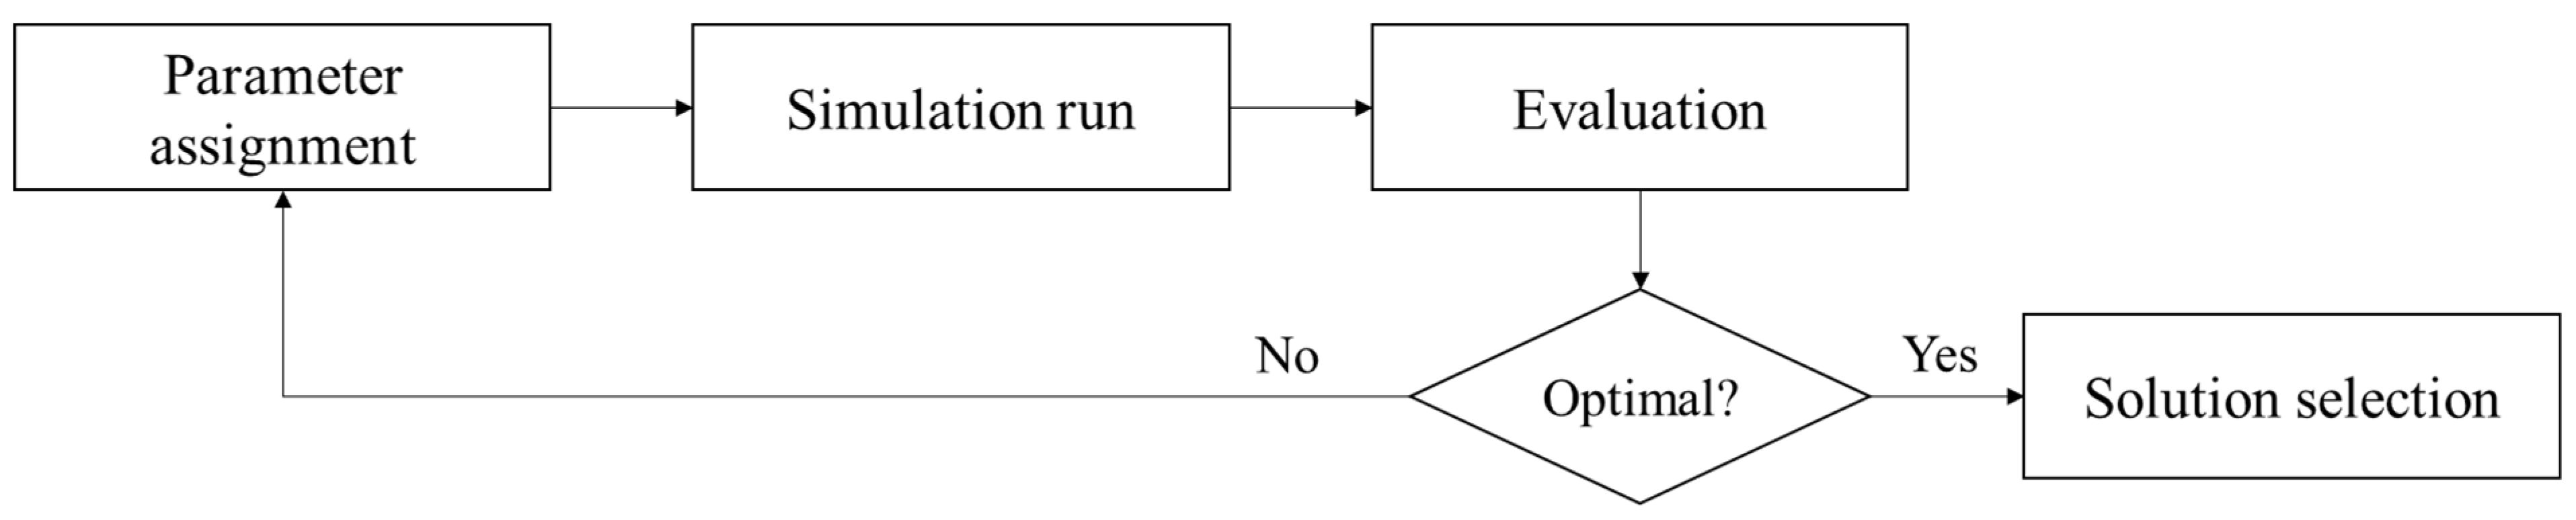
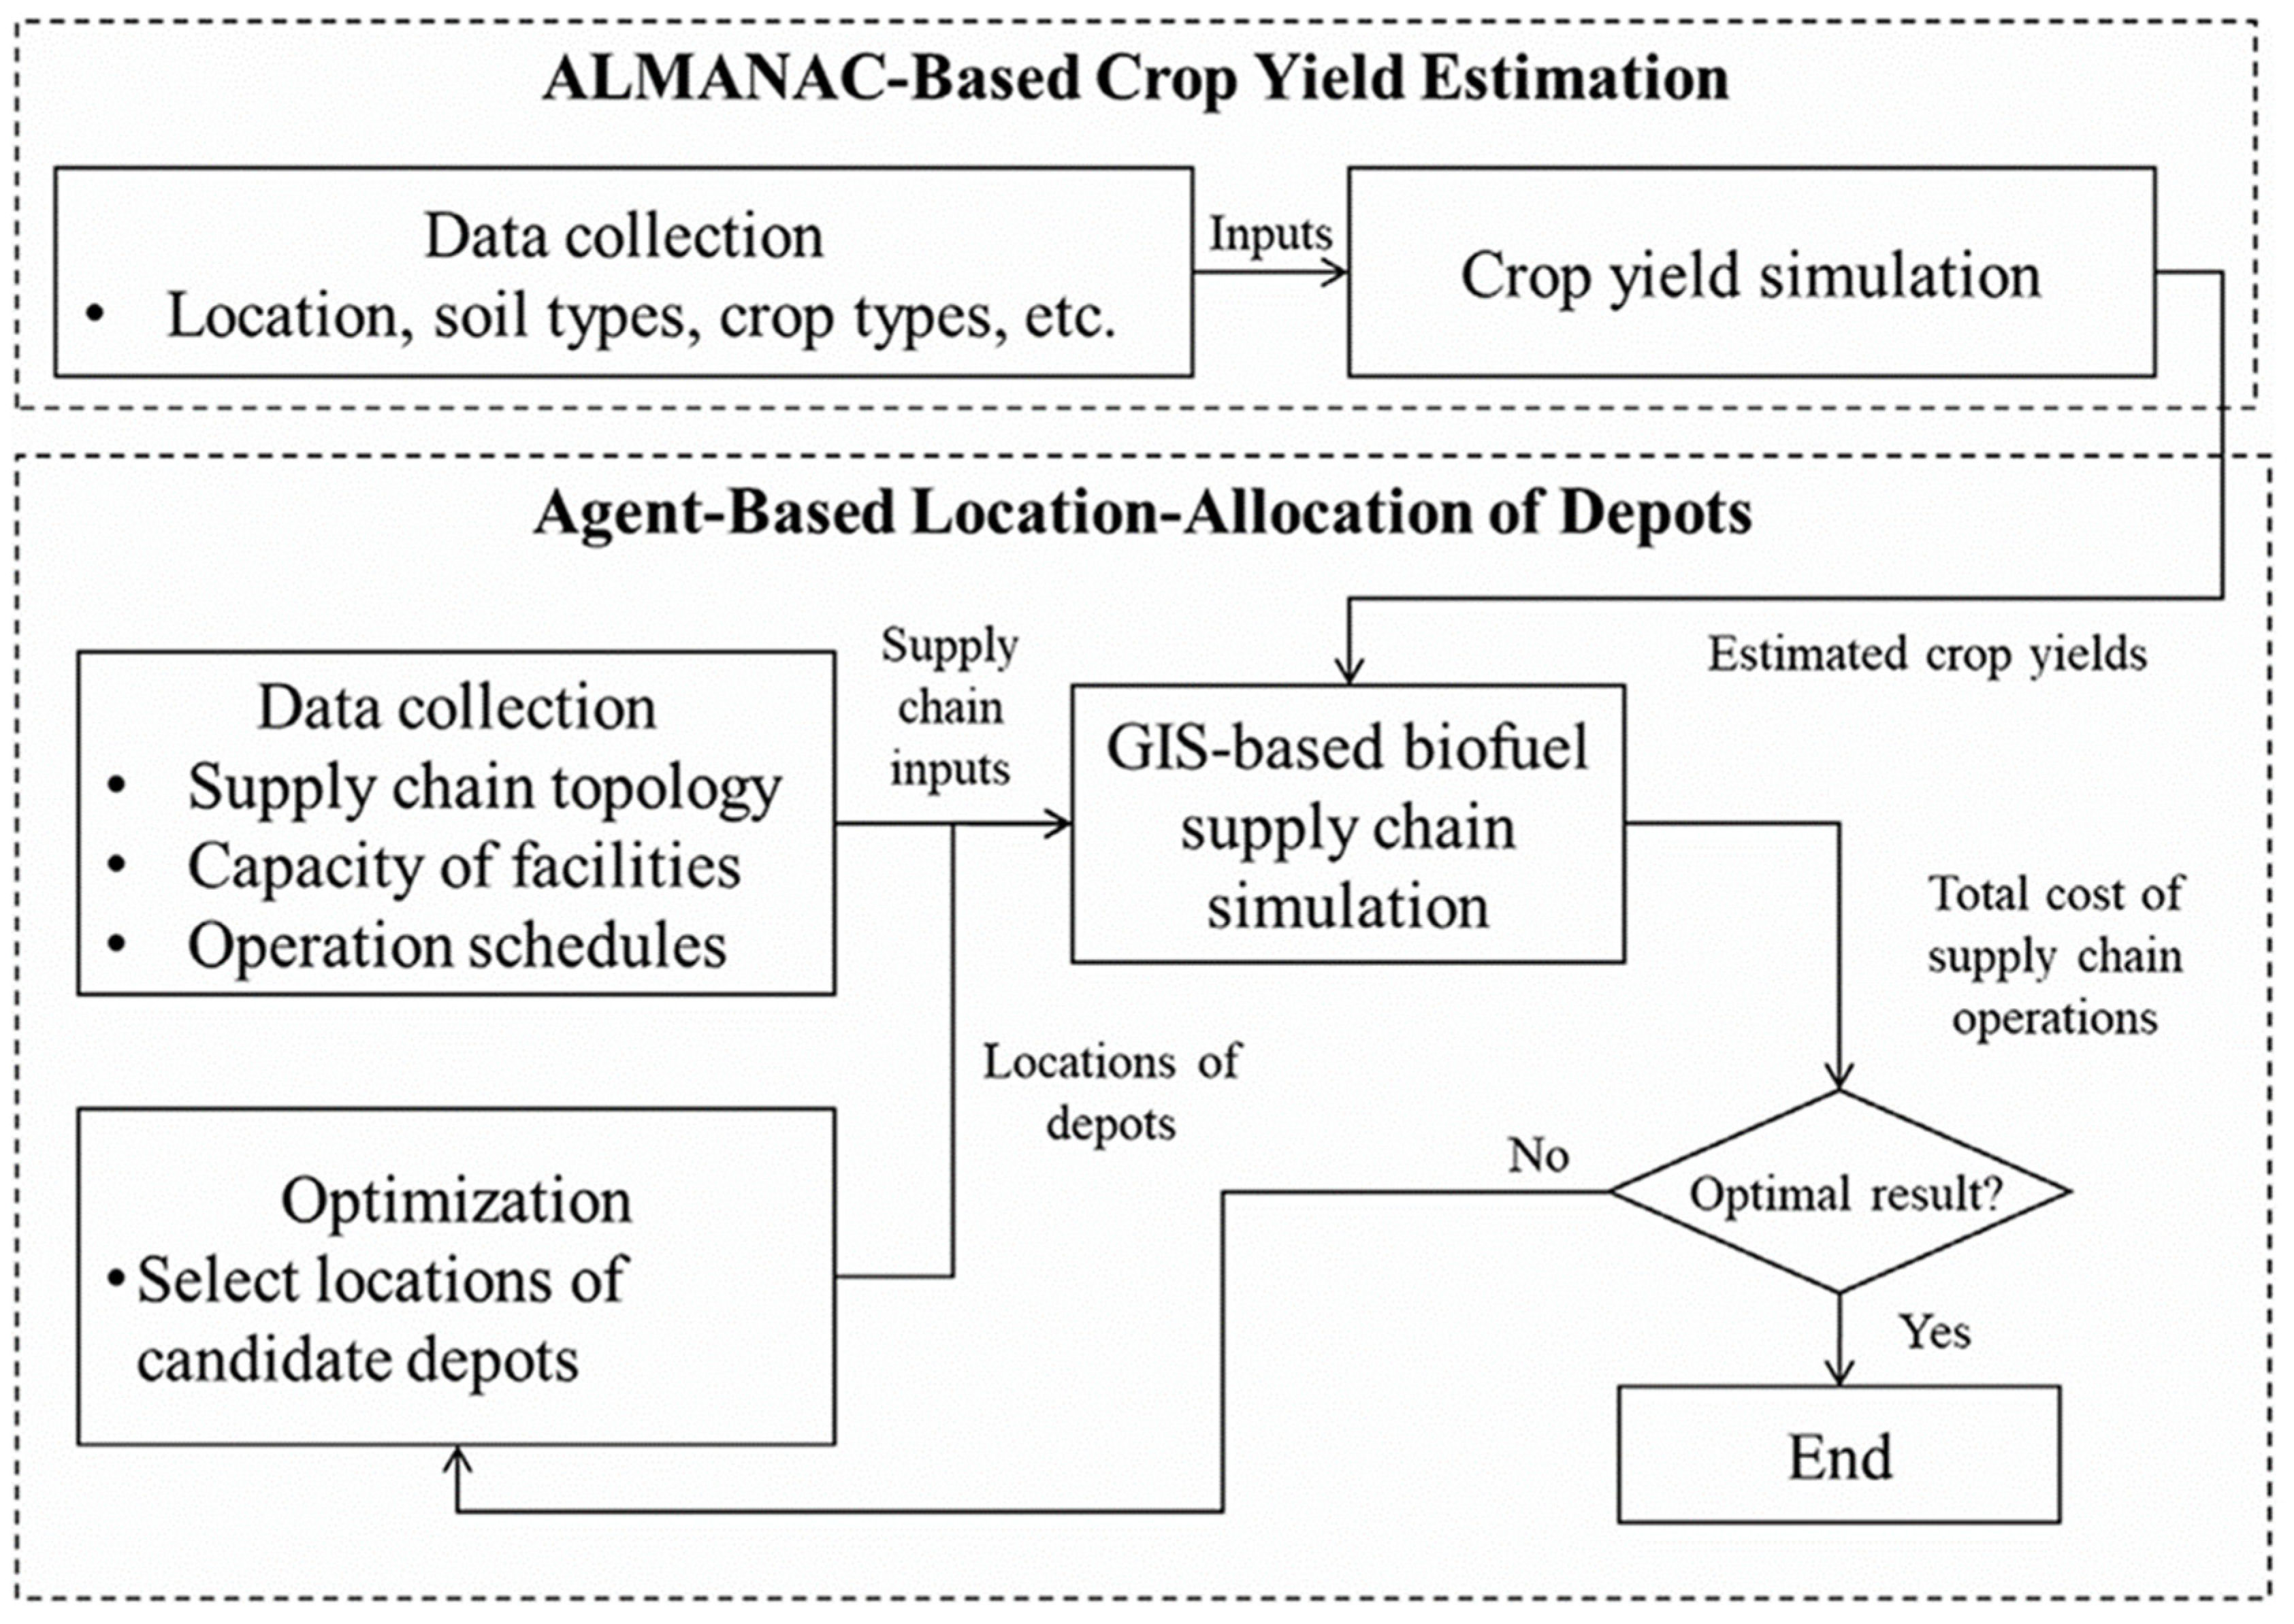
https://www.opttek.com/products/optquest/, accessed on 26 February 2025)) to concentrate on approximating solutions. Another approach involves developing a meta-model for a simulation model to facilitate optimization. By devising an abstract model for simulation as a formula, simulation execution time can be significantly reduced from 30,000 min to 300 min (5 h). However, abstracting a simulation to this extent also abstracts the solution space, making it less realistic and possibly leading to solutions that diverge from the original optimal solution. Despite this, as it is realistically unfeasible to allocate infinite time for optimal solution discovery in decision-making, applying a technique to find an approximate solution via simulation with the previously mentioned methodologies presents a viable alternative. Encouragingly, recent advancements in computer technology, the proliferation of high-performance computers, and the development of quantum computing are expected to enable researchers to more commonly conduct high-fidelity simulations to discover optimal solutions.
6. Conclusions and Future Directions
This study investigated optimization methods used for efficient operation management of the biofuel supply chain, specifically focusing on recent research trends. These were classified into linear programming (LP), integer programming (IP), dynamic programming (DP), stochastic programming (SP), nonlinear programming (NLP), and simulation-based optimization. The Web of Science and Scopus databases were utilized to explore literature related to biofuel production and optimization, with a search for “biofuel optimization” yielding 7048 related topic papers from the Web of Science database. Of these, 230 papers pertained to first-generation biofuel production and 326 to second and next-generation biofuel production, underscoring active research in next-generation biofuel production. The analysis of specific feedstocks revealed that corn-based and sugar-based ethanol, actively produced and consumed as biofuels, were the subjects of 411 and 316 papers, respectively. Optimization methods related to first-generation biofuels were primarily analyzed for efficient operation and management of the biofuel supply chain. The number of papers from Web of Science related to the keywords LP, IP, DP, SP, and NLP were 187, 219, 25, 101, and 27, respectively. Among the simpler modeling techniques, LP and simulation techniques, such as SD, were mainly used for analyzing domestic and international macroscopic impacts of biofuel and energy production. IP and NLP were frequently employed in distribution network design, and simulation-based optimization, a relatively new field, was found to be used less extensively than traditional methods. This underutilization appears to be due to the requirements for high-performance computing and expertise in both simulation modeling and optimization. Nevertheless, it has been established that simulation is extensively used as a verification tool for probability modeling and as a performance prediction tool in production and supply chain planning. Simulation-based optimization enables relatively accurate prediction of the impact on the biofuel supply chain through highly precise models, although it requires considerable effort in modeling and high computational resources for implementation. Nevertheless, with the ongoing proliferation of high-performance computers (HPC) and growing interest in simulation modeling, simulation-based optimization methods are expected to gain wider acceptance in the future.


