Article

Cluster Partitioning Method for High-PV-Penetration Distribution Network Based on mGA-PSO Algorithm

1
China Southern Power Grid Research Technology Co., Ltd., Guangzhou 510663, China
2
Guangdong Electric Power Co., Ltd. Foshan Power Supply Bureau, Foshan 528000, China
3
Guangdong Electric Power Co., Ltd. Qingyuan Yingde Power Supply Bureau, Yingde 513000, China
4
School of Electrical Engineering and Automation, Wuhan University, Wuhan 430072, China
*
Author to whom correspondence should be addressed.
Energies 2025, 18(5), 1197; https://doi.org/10.3390/en18051197
Submission received: 23 January 2025 / Revised: 20 February 2025 / Accepted: 26 February 2025 / Published: 28 February 2025

Abstract

:
To tackle the issues of scattered distributed photovoltaic access points and unbalanced cluster partitioning scales, an iterative clustering partitioning method is proposed, a which integrates micro-evolution genetic algorithm and particle swarm optimization (mGA-PSO). In this method, the complementary aspects of active and reactive power are quantified as key indicators, and node membership is incorporated to construct a comprehensive metric for the partitioning of a distributed PV cluster. Additionally, to improve the optimal search performance of high-penetration photovoltaic cluster partitioning, an enhanced learning-based modification factor is introduced in the genetic algorithm population selection, and a search and transfer mechanism based on historical population information is incorporated into the particle swarm algorithm. This enhances the particle swarm optimization capability with individual intelligent feedback. Experimental tests on the IEEE 34-node and IEEE 110-node systems demonstrate that the proposed method outperforms GA and PSO approaches in cluster partitioning, improving the convergence speed of the algorithm while avoiding local optima.

1. Introduction

In recent years, the depletion of fossil fuels has become a pressing global concern. PV power generation has emerged as a critical pathway to combat climate change and achieve carbon neutrality [1]. However, the rapid expansion of distributed PV systems has introduced new challenges, including the intermittent nature of PV power generation and the complexities of managing decentralized PV resources. These issues pose significant threats to the safety and stability of distribution networks [2,3].
Extensive research has been conducted globally in the field of PV systems. For example, Fei et al. [4] developed a scheduling model for distributed PV and microgrids to address the multi-energy demands of ships; Xu et al. [5] implemented the LLDR strategy to mitigate variable PV power and reduce voltage deviations; and Sheng et al. [6] explored the community structure of complex networks, offering valuable insights into the integration of renewable energy. Notably, management strategies for distributed PV clusters can alleviate the impact of PV output fluctuations on grid stability and improve the reliability of power systems [7,8,9]. Consequently, this work focuses on the clustering and partitioning of high-penetration PV systems.
In the field of cluster partitioning algorithms, significant attention has been devoted to determining optimal clustering strategies. Li et al. [10] introduced an entropy-weighted approach for cluster partitioning, combining dimension reduction techniques with an enhanced k-means algorithm. Xie et al. [11] proposed a self-aware deep temporal clustering model specifically tailored for PV cluster segmentation. To achieve superior cluster partitioning, Dong et al. [12] developed a particle concentration evaluation operator to refine existing model algorithms. Additionally, the research in Reference [13] integrated adaptive memory with the exploratory search capabilities of the tabu search algorithm to guide the optimization process and prevent entrapment in local optima.
In recent years, a growing number of scholars have adopted comprehensive performance indicators as decision-making criteria, combining them with intelligent algorithms to investigate optimal cluster partitioning. Ding et al. [14] considered the variability in power network topology and merged genetic algorithms (GAs) with performance indicators to enable the adaptive dynamic partitioning of distributed PV clusters. Yu et al. [15] utilized modularity as a benchmark and applied particle swarm optimization (PSO) for partitioning tasks. Pan et al. [16] employed node proximity as a metric and implemented a hierarchical clustering algorithm for partitioning purposes. Based on extensive domestic and international studies, cluster partitioning based on multiple performance metrics—which involves dividing the power grid into regions with strong internal node coupling and weak inter-region coupling—can further facilitate subsequent voltage control.
However, as distribution network topologies grow more complex and the integration of PV systems becomes more widespread, the global search capabilities of traditional intelligent algorithms are being challenged, often culminating in suboptimal cluster partitioning outcomes. In contrast, reinforcement learning algorithms have demonstrated advantages such as reduced computation times, adaptability to complex environments and multi-decision problems, scalability, and an enhanced ability to optimize for long-term objectives. Nonetheless, the utilization of reinforcement learning in network clustering and partitioning is an area that has not been extensively explored. To bridge this research gap, this work proposes an intelligent search method for PV cluster partitioning that integrates a micro-genetic algorithm with PSO. This novel approach provides an effective solution for the partitioning of active and reactive power in power grids, yielding superior network partitioning results and significantly improving convergence performance.
This paper is structured as illustrated in Figure 1: Section 2 introduces the distributed cluster partitioning indicators, while Section 3 describes a metaheuristic search algorithm for PV cluster partitioning. Section 4 presents the experimental results and evaluates the performance of the proposed method to demonstrate its effectiveness. Finally, Section 5 provides the conclusions.

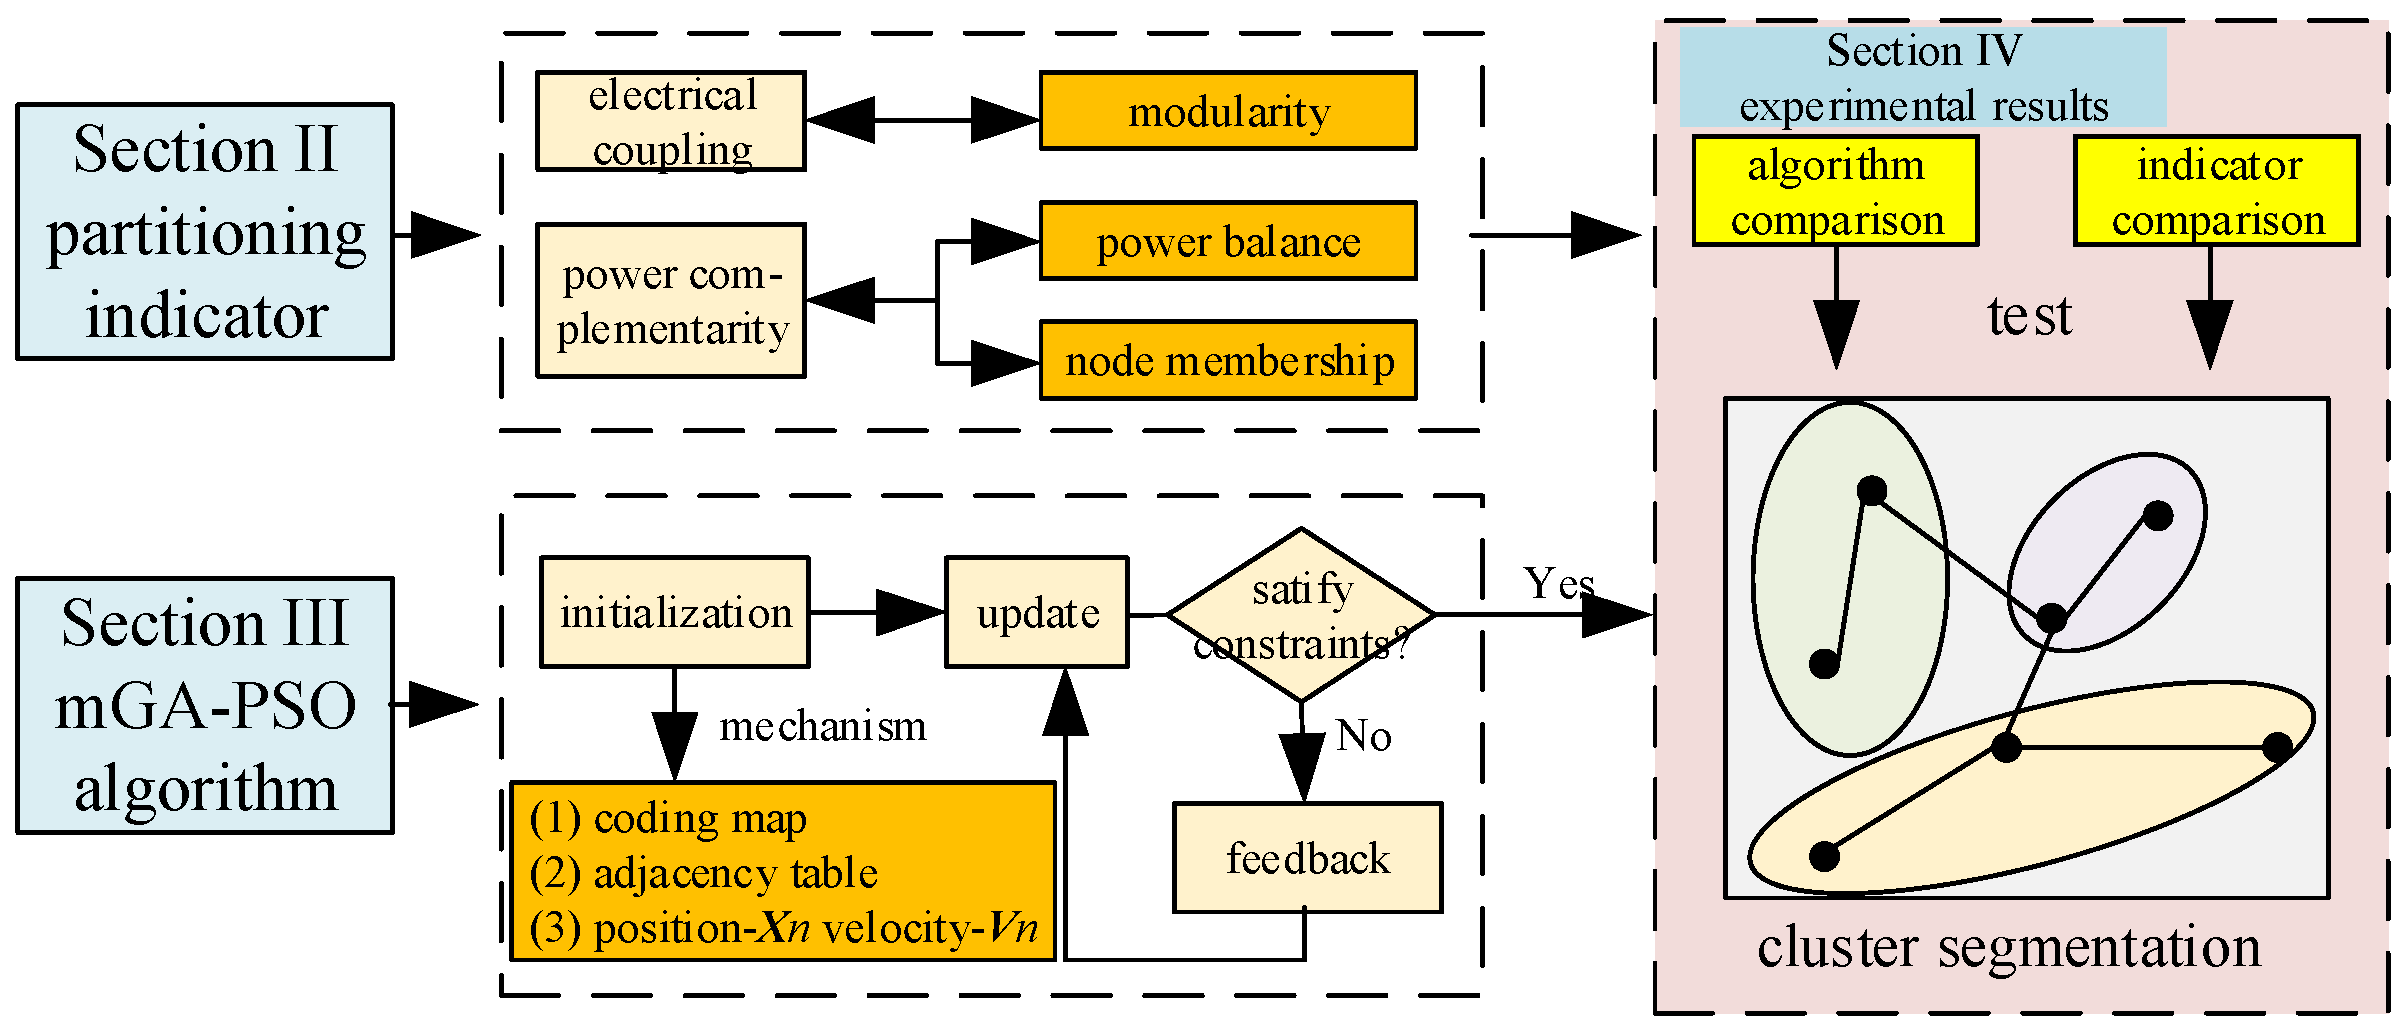
2. Distributed Cluster Partitioning Indicators

To enhance operational control following cluster partitioning, the design of clustering indicators should adhere to the principle that clusters exhibit strong internal electrical coupling while maintaining weak inter-cluster coupling between one another [17]. Furthermore, clusters should be equipped with self-regulation abilities in the event of voltage limit transgressions. The specific design considerations are described below.

2.1. Modularity Index

Modularity is an effective metric for evaluating cluster partitioning, originally derived from the Girvan–Newman algorithm [18], and it quantifies the strength of community structures. Modularity, denoted as σm, is defined as
σ m = 1 2 m T r [ M c r T ( B i j k i k j 2 m ) M c r ] ,
where Bij represents the weighted adjacency matrix of electrical distance, indicating the weight of the edge connecting node i and node j; the superscript T denotes the transpose; and Mcr represents the assignment matrix after all nodes are partitioned, where Mir= 1 indicates that the i-th node of the r-th matrix Mcr. Tr(.) denotes the trace of the matrix; c is the set of all nodes in the network system; m is the sum of the weights of all edges in the network and is expressed as
m = i , j c B i j / 2 ;
and ki represents the sum of the weights of all edges connected to node i and is expressed as
k i = j c B i j .
Taking into account the variations in the weights Bij within the structure of distributed photovoltaic networks, this work establishes a relationship between the edge weight Bij and the electrical distance dij. This is achieved by formulating an electrical distance metric that is grounded in reactive power voltage sensitivity [19], thereby quantifying the degree of electrical coupling between nodes within the network, and it is defined as
B i j = 1 k V i ( d i k d j k ) 2 k = 1 n ( d i k d j k ) 2 .
where Vi denotes the cluster to which node i belongs; and dij measures the degree of voltage influence of node i and j and is defined as
d i j = lg S V Q , j j S V Q , i j ,
where SVQ,ij represents the value of the element in row i and column j of the reactive power/voltage sensitivity matrix, i.e., SVQ,ij = (∂Qi/∂Vj)Vj [19,20]. In Equation (5), the logarithm lg is used to calculate the voltage influence of node j on node i. Notably, a smaller dij indicates a stronger electrical connection between node j and node i, as well as a closer corresponding electrical distance.

2.2. Power Balance Index

The power balance index serves as a critical metric for evaluating voltage limit violations and power feedback within distributed clusters. It consists of the net power balance index and the reactive power balance index. Through the manipulation of reactive and active power, this metric helps to maintain the stable operation of the grid and achieves complementarity between the active and reactive power characteristics of partitioning entities within the cluster.
The net power balance index is influenced by variations in supply relationships within clusters under time-varying scenarios and is defined as
φ P = 1 K c = 1 K c 1 1 T t = t 1 t n P c ( t ) max P c ( t )
P c ( t ) = i O c P i ( t ) ,
where T is the duration, i.e., tn t1; K indicates the total number of clusters to be divided; and Kc represents the number of nodes in cluster c. Pc(t) denotes the net power of cluster c at time t. Pi(t) represents the net load power of node i within the cluster at time t. Oc is the set of nodes within cluster c.
The reactive power balance index is influenced by the generation and demand of reactive power and is defined as
φ Q = 1 K c = 1 K c max ( Q s u q , c , Q n e e d , c ) Q n e e d , c ,
where Qsup,c and Qneed,c denote the reactive power supply and demand for cluster c, respectively; and Qc represents the reactive power of cluster c.
To integrate the active and reactive power balance indices into a unified power balance performance indicator, a weighted fusion technique is applied, expressed as follows:
φ = α 1 φ P + α 2 φ Q ,         α 1 + α 2 = 1 .
Without a loss of generality, let α1 = α2 = 0.5, indicating equal importance.

2.3. Node Membership Index

The balance and compactness of cluster sizes have a direct impact on the complexity of subsequent cluster optimization problems. A reasonable cluster division can avoid the generation of isolated nodes during the planning process and prevent significant differences in the complexity of optimization models within different clusters due to imbalanced sizes. To achieve balanced cluster sizes, a node membership index δi is constructed as follows:
δ i = 1 n h 2 V i j V i k = 1 n Φ d i j d k j h 2 ,
where n represents the total number of nodes, Φ(.) denotes the Epanechnikov kernel function; h is the bandwidth of the electrical distance; Vi is the cluster to which node i belongs, and VVi represents the complement of Vi in V; and the symbol |.| denotes the sum of nodes within a cluster. It can be observed that the distribution of electrical distances among nodes within a cluster is more compact, while the distribution between clusters is relatively dispersed. This implies that it should meet the following requirement:
max         ϕ = k = 1 K ω c i , j V c d i j u k 2 ,
where ωc represents the distribution weight of the c-th cluster Vc, i.e., ω c = i V c δ i ; and uk denotes the mean of the electrical distance for the k-th cluster, expressed as
u k = i , j V k δ i d i j i V k δ i .

2.4. Comprehensive Cluster Partitioning Index

To ensure balanced cluster sizes, the normalized electrical modularity, power balance, and node membership indicators are integrated and assigned corresponding weights to reflect the relative importance of each metric [21]. Accordingly, a comprehensive performance index is constructed as follows:
max f = λ 1 σ m + λ 2 φ + λ 3 δ i
where λ1, λ2, and λ3 are the weighting coefficients for each index, satisfying λ1 + λ2 + λ3 = 1 (λ1, λ2, λ3 > 0).

3. Clustering Partitioning Method Based on mGA-PSO

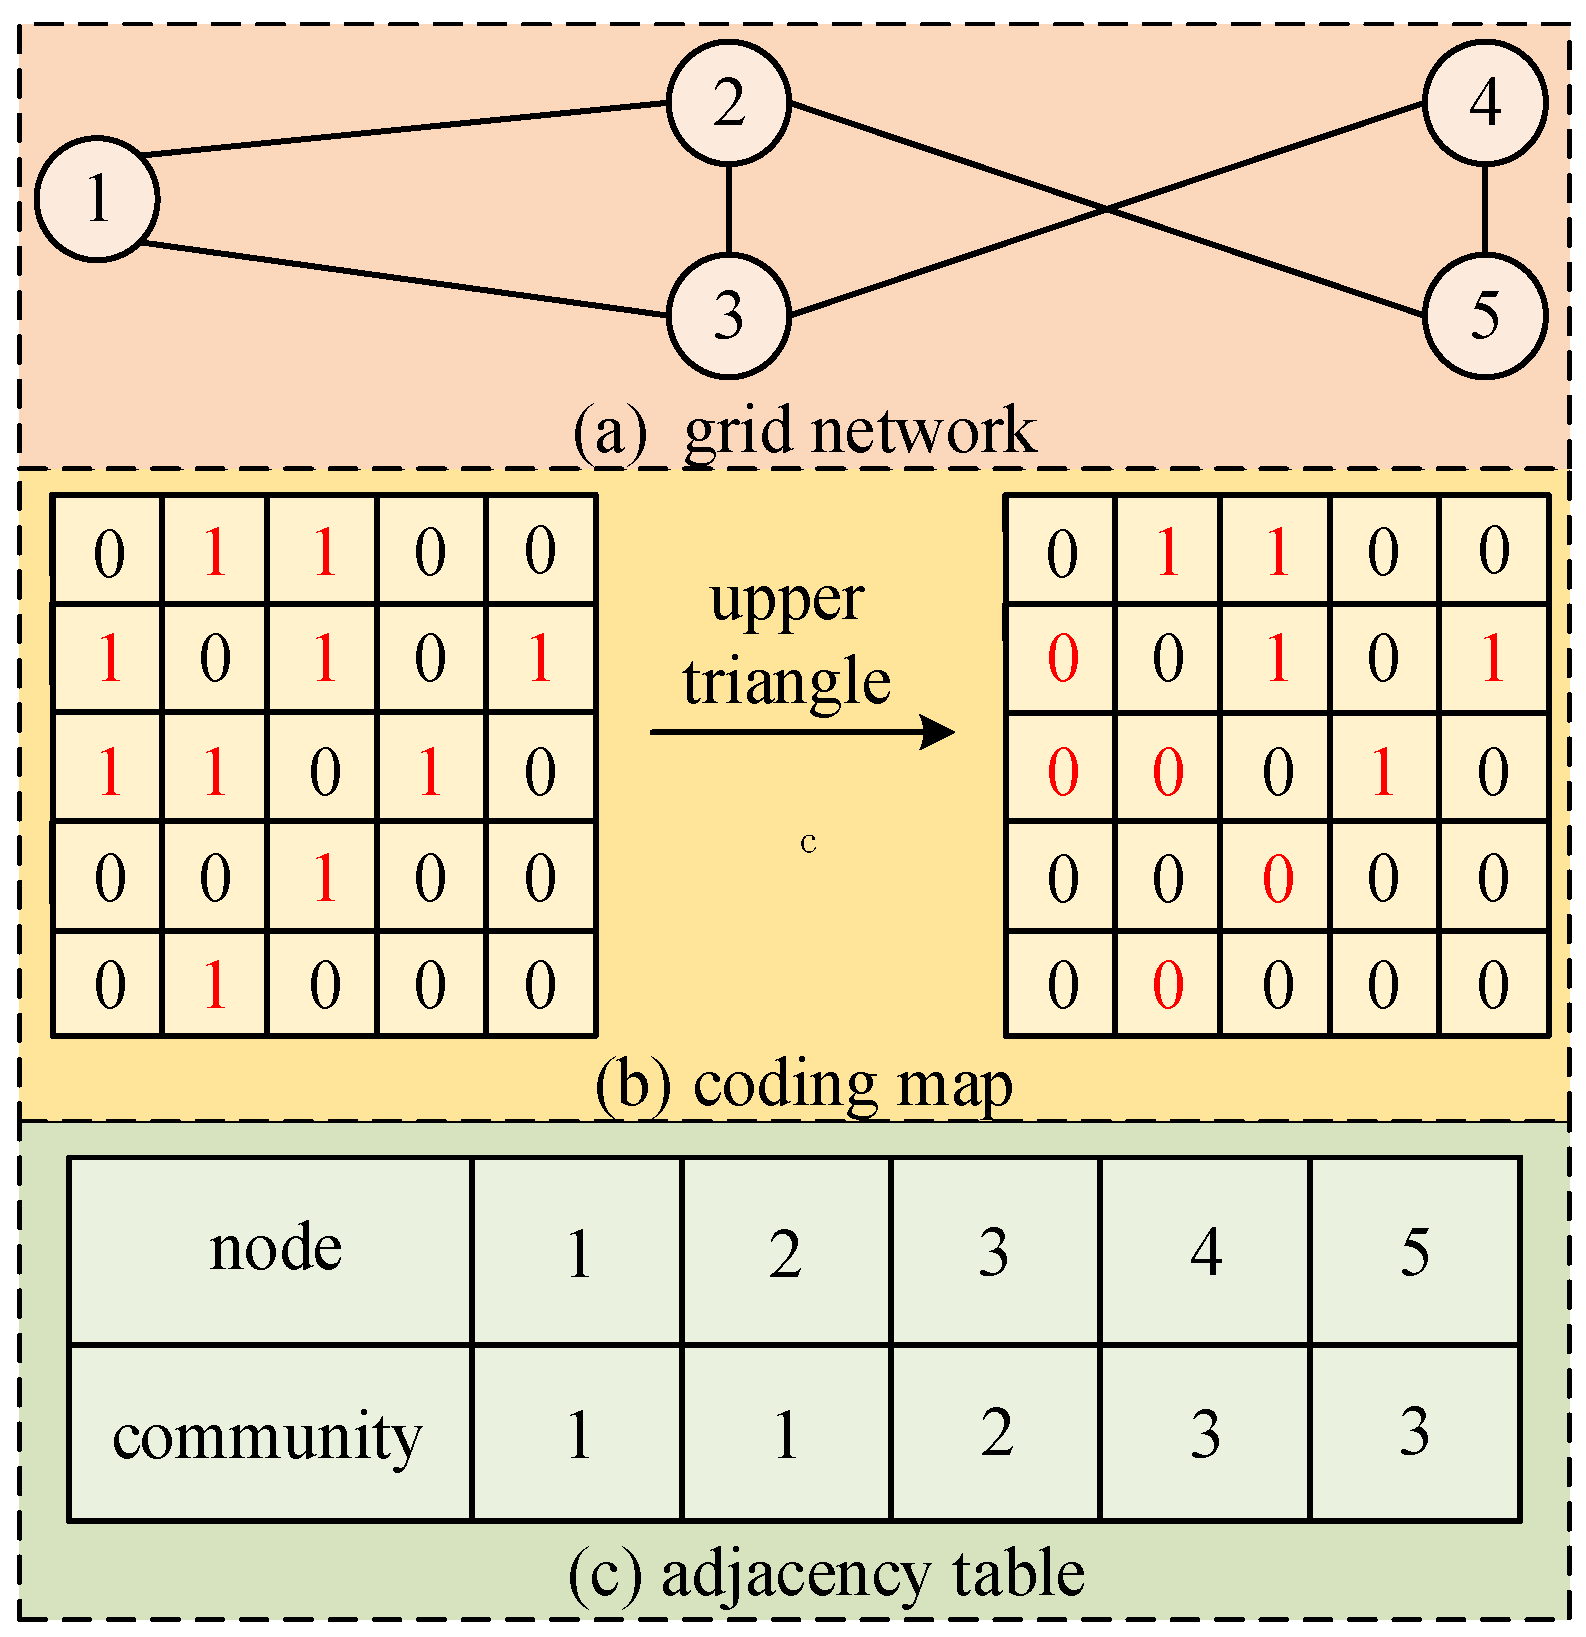
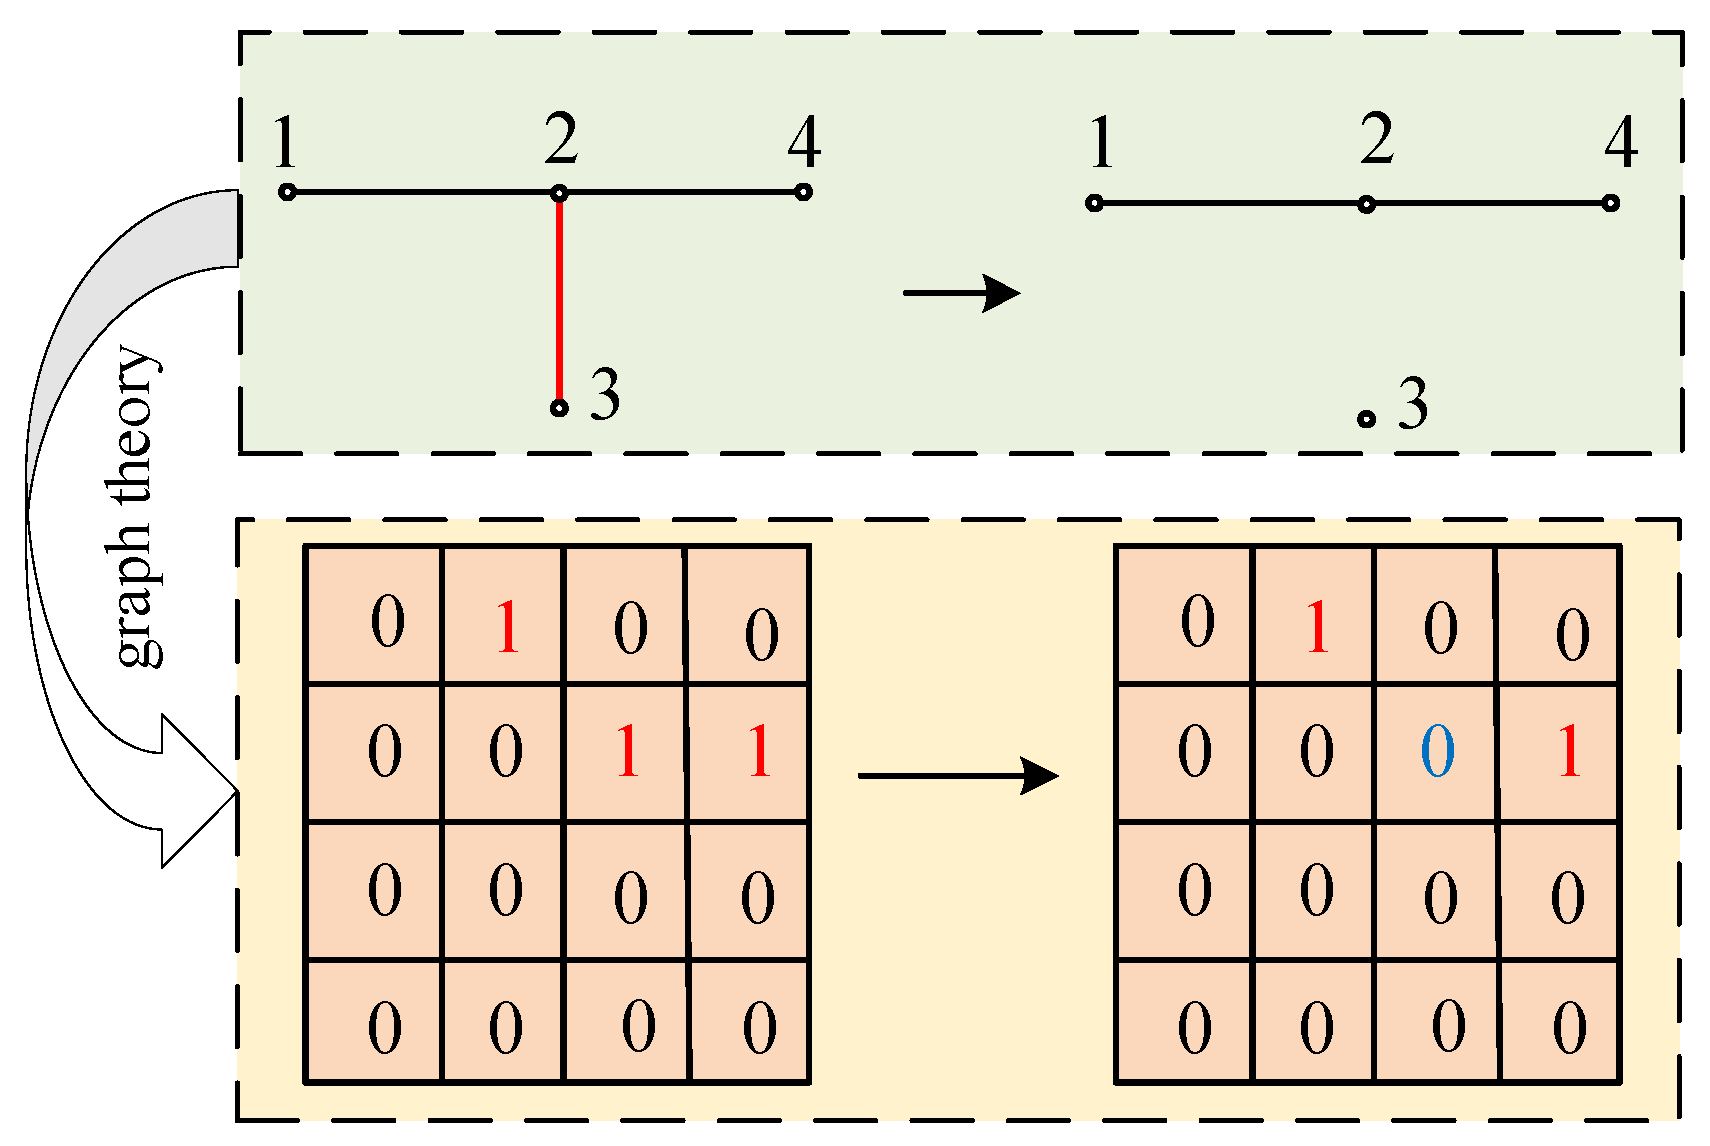
3.1. Encoding and Initialization

Considering that a distribution network cluster with high photovoltaic penetration constitutes a complex network topology, conventional optimization algorithms often struggle to ascertain the optimal solution directly. Consequently, an encoding method based on the power grid’s topological graph and an adjacency list has been developed for the generation of populations.
Let Aij be the weight of the network edge between nodes i and j in the power grid topology, where Aij = 1 indicates that nodes i and j are connected, and Aij = 0 indicates that nodes i and j are not connected. Thus, the connection pattern of the constructed matrix Aij can be transformed into a coding graph and an adjacency table.
In the design of the coding graph, the adjacency matrix is transformed into an upper triangular matrix for storage, leveraging its symmetry to reduce redundancy. Meanwhile, in the adjacency table design, each node is associated with a list that stores the indices of the neighboring nodes to which it is directly connected. To enhance clarity, Figure 2 illustrates an example of the design of the coding graph and the adjacency table, where each unit stores the coding graph and the adjacency table as a single individual, ultimately generating N populations.
The initialization of the encoded graph represents the random network connection state before the adjacency matrix is partitioned into clusters. Figure 3 illustrates the random initialization process of the encoded graph. Consider any i and j, where i ∈ [1, 2, 3, …, S] and j ∈ [1, 2, 3, …, S], with S denoting the total number of network nodes. The value of Aij is randomly assigned as either 0 or 1, indicating the absence or presence of a connection between nodes, respectively. This holds true if and only if the element at the i-th row and j-th column in adjacency matrix Aij is 1, signifying a direct link between nodes i and j.

3.2. mGA-PSO for Cluster Partitioning

3.2.1. Micro-GA Optimization Mechanism

To achieve optimal network cluster partitioning, this work adopts the survival-of-the-fittest principle simulated by the GA. Specifically, the top three-fourths of the population is selected based on individual fitness values, while the middle one-third of the population is duplicated into the next generation. The remaining individuals are retained to reconstruct a new population. This approach is defined as the micro-evolution genetic algorithm (mGA).

3.2.2. PSO Optimization Mechanism

To enhance the efficiency of the population in searching for the optimal solution, the search strategy of PSO is integrated into the mGA framework. In an S-dimensional objective search space, a population of N individuals is established, where each individual is characterized by two key attributes: position and velocity. The n-th individual in this population can be depicted as
X n = [ x n 1 , x n 2 , , x n S ]       n = 1 , 2 , , N ,
V n = [ v n 1 , v n 2 , , v n S ]       n = 1 , 2 , , N ,
where xns (s = 1, 2, …, S) denotes the index of individual n within the community, taking integer values ranging from 1 to S; and vns (s = 1, 2, …, S) signifies the adjustment factor for the community index of the node.
The individual maximum Pn and the community maximum G can be denoted as
P n = [ p n 1 , p n 2 , , p n S ]       n = 1 , 2 , , N ,
G = [ g 1 , g 2 , , g S ] ,
where pns (s = 1, 2, …, S) represents the community index of the node corresponding to the maximum fitness value achieved by individual n, while gs (s = 1, 2, …, S) represents the community index of the node associated with the global best fitness value in the current iteration.

3.2.3. Update Strategy of PSO Optimization Mechanism

Since PSO struggles with discrete optimization problems and is prone to local optima, this work adopts a novel iterative framework to guide population evolution. This enhancement aims to improve overall performance and adaptability and is structured into four key components.
(1)
Individual search update
The velocity update strategy from Binary PSO (BPSO) [22] is adopted, and the appropriate modification is applied as follows:
v n s t + 1 = f ω n t v n s t + c 1 × r 1 × ( 1 p n s t x n s t ) + c 2 × r 2 × ( 1 g n s t x n s t ) ,
where t represents the number of iterations; ω n t is the inertia weight; and c1 and c2 represent learning factors. The terms r1 and r2 are random values following a uniform distribution in [0,1], while ⊙ denotes the XNOR operation. The function f is defined as follows:
f ( x ) = 1         rand ( 0 , 1 ) <   s i g m o i d ( x ) 0         rand ( 0 , 1 ) s i g m o i d ( x ) ,
where rand(0,1) represents a random value with a mean of 0 and a variance of 1, and s i g m o i d is defined as
s i g m o i d ( x ) = 1 1 + e x .
To improve the optimization effectiveness of inertia weight on the particle swarm algorithm, this work changes the weight value to reduce the gap between the predicted value and the target solution. The inertia weight value is defined as
ω n t + 1 = ω n t + 2 × ρ × ( ω b e s t t ω n t ) ,
where ω b e s t t represents the current optimal target weight value, and ω b e s t t and x b e s t t have the same index; and ρ represents a random value uniformly distributed in [0,1].
Thus, the individual position update method is expressed as
x n s t + 1 = ( 1 v n s t + 1 ) x n s t + v n s t + 1 x n r t ,
where x n r t represents the community number of node r at the n-th iteration, with node r being directly connected to node s.
(2)
Modification factor during iteration
To maintain population diversity, a modification factor, βt, is introduced. This factor regulates the balance between individual exploration and exploitation and is defined as follows:
β n t + 1 = β n t ( 1 + τ g ( f n t + 1 f n t ) ) ,       n = 1 , 2 , , N ,
where β n t is the correction factor for individual x at time t; f n t represents the fitness value of the n-th individual at time t; τ represents the penalty factor; and g(x) is the action factor, which is defined as
g ( x ) = ( 1 + e σ x ) 1 1 ,
where σ is a random variable with a mean of 0 and a variance of 1. If σ > 0, the individual retains the same modification factor from the previous iteration for the next search; otherwise, a new modification factor is assigned.
From Equation (23), it can be observed that when an outstanding individual appears during the iteration, the modification factor decreases in the subsequent iteration. This mechanism can create more opportunities for executing the transfer operator rather than individual searches, thus helping to maintain population diversity and avoid local optima.
(3)
Individual transfer based on historical population information
Additionally, when an individual’s search update involves exploitation tasks, transferring individuals from the historical population will alter the current population, enhancing its exploration capability. To further reduce the risk of being trapped in local optima, the update speed of historical population information is defined as follows:
v n s t + 1 = f v n s t + κ 1 × ( x b e s t t v n s t ) + κ 2 × ( x b e s t t v o l d , n t )
where κ1 and κ2 are two standard normally distributed random variables used to enhance the ability to escape local optima. Additionally, v o l d , n t represents the update velocity of the n-th individual at time t. The position update during individual transfer follows Equation (22).
(4)
Individual feedback
To improve the optimization capability of the algorithm, a refined individual feedback mechanism has been developed, incorporating both immediate and localized feedback. This approach yields a more adaptive individual feedback velocity, defined as follows:
v n s t + 1 = f v n s t + κ 3 × S ( f n t f m t ) × ( v m s t v n s t ) + κ 4 × ( x o l d , n t v n s t )
where κ3 and κ4 are two random numbers following a normal distribution; m is a randomly selected integer between 1 and N; f m t is the fitness value of the m-th individual at time t; and S(·) denotes the tanh activation function. Similarly, the position update follows Equation (22).

3.2.4. Algorithm Flowchart

In summary, Figure 4 provides a flowchart of the proposed method. This framework integrates the optimal selection mechanism of mGA-PSO with the position and velocity dynamics of PSO. Additionally, by incorporating an adjustment factor, the approach facilitates the iterative optimization and evolutionary search of individuals within the population, ultimately converging to the optimal target value while ensuring comprehensive cluster partitioning performance.

4. Experiments and Analysis

To evaluate the performance of the proposed method, a series of simulation experiments were conducted comparing the standard GA, PSO, and GA-PSO [23] algorithms with the proposed mGA-PSO approach. All experiments were implemented in MATLAB 2021b with an INTEL CORE i7-9700F 3.00 GHz CPU.

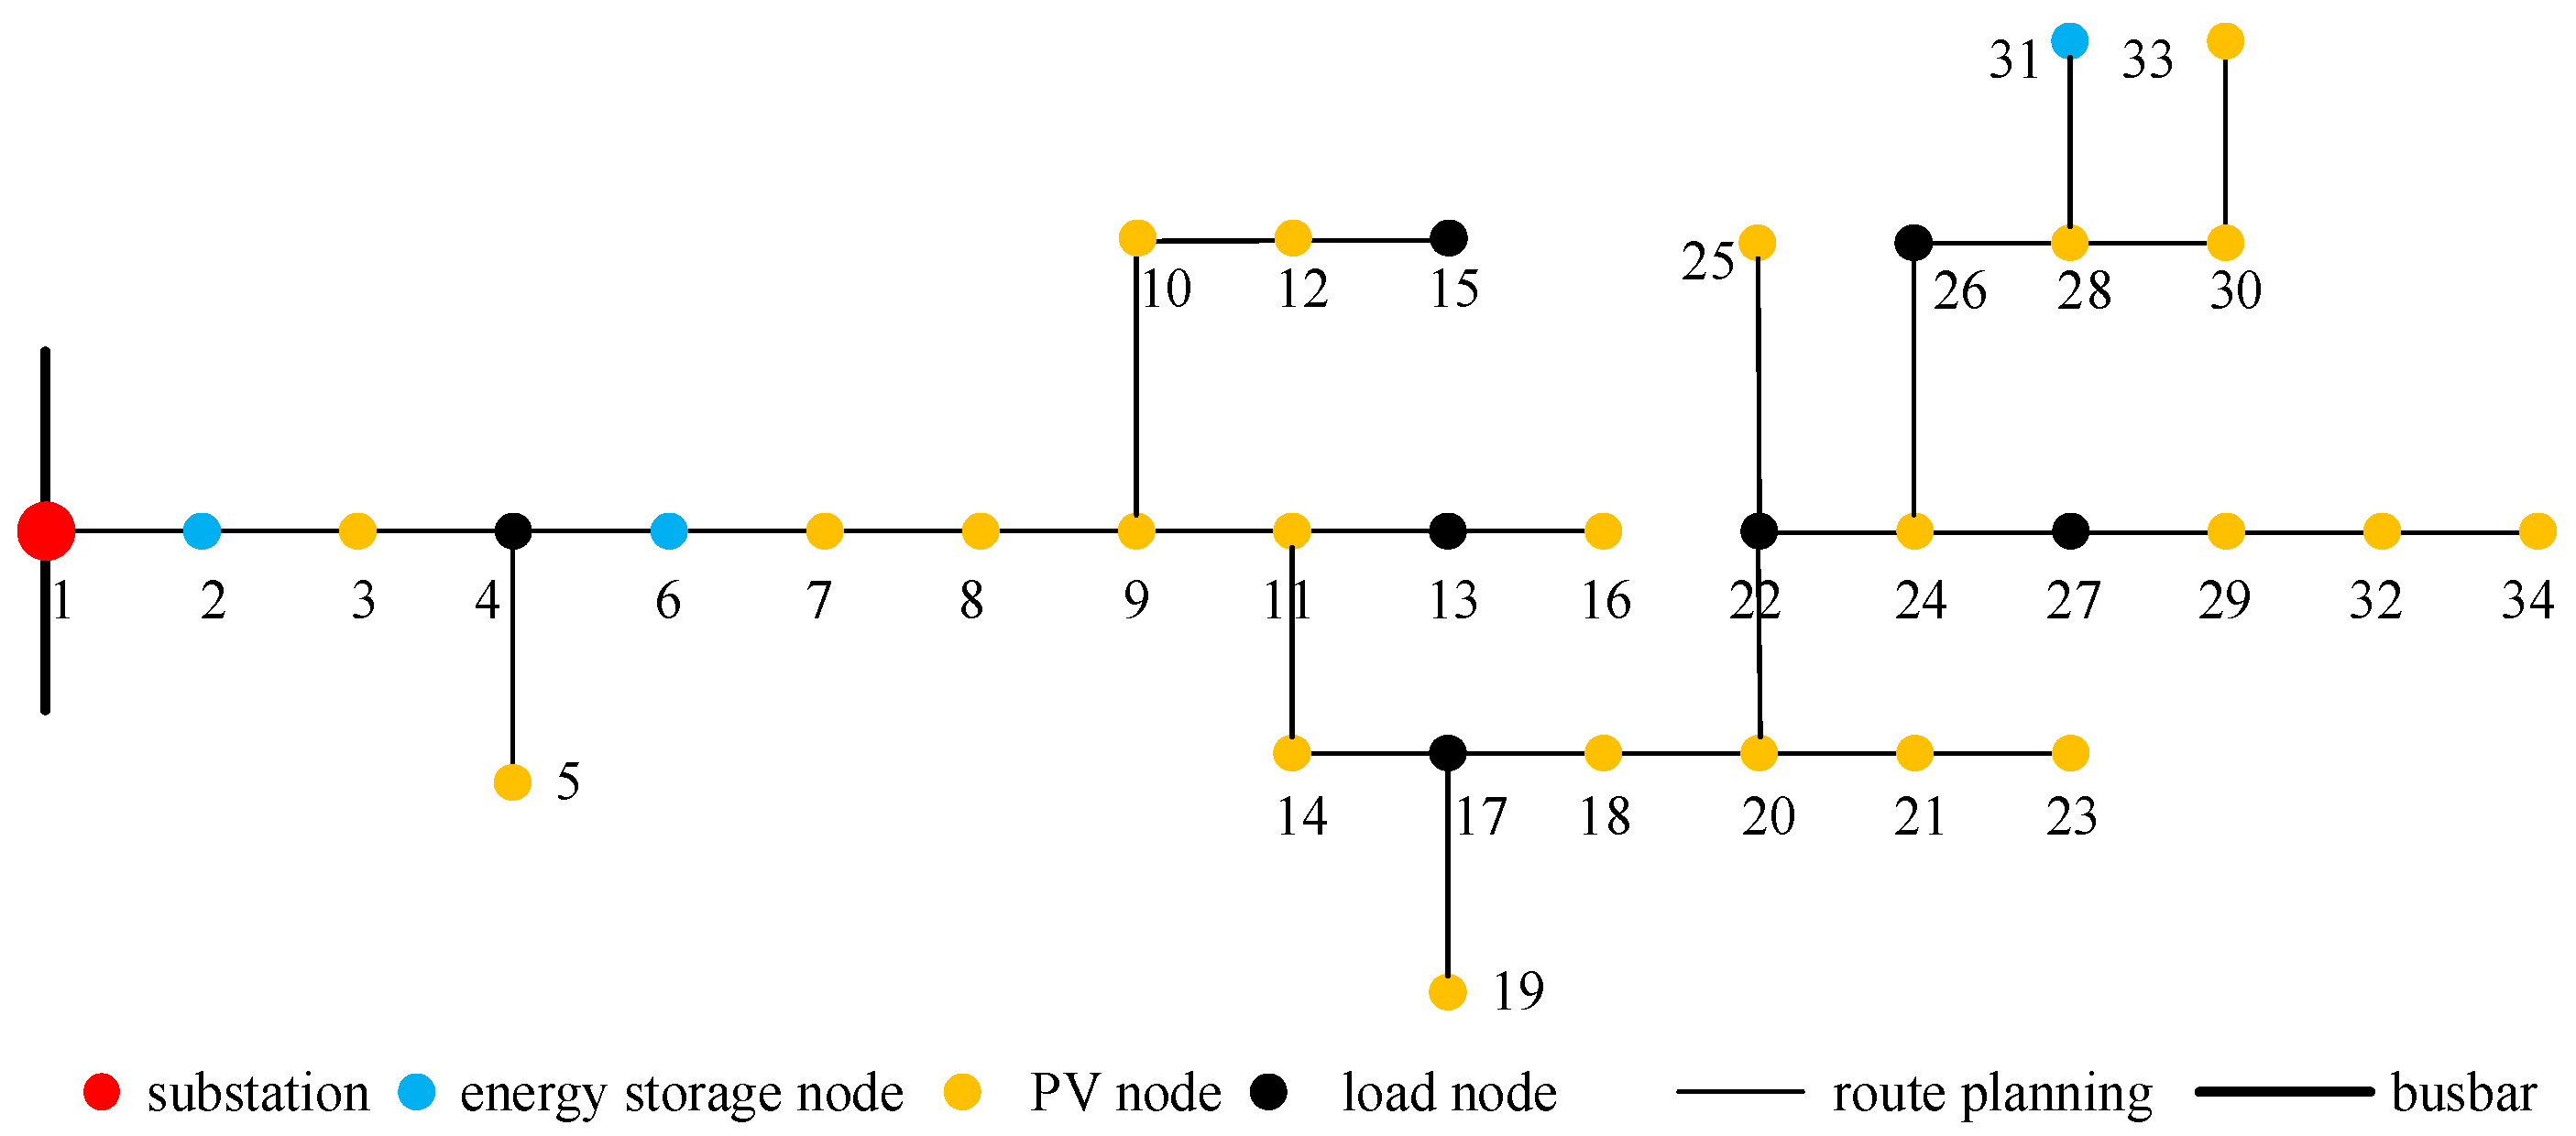
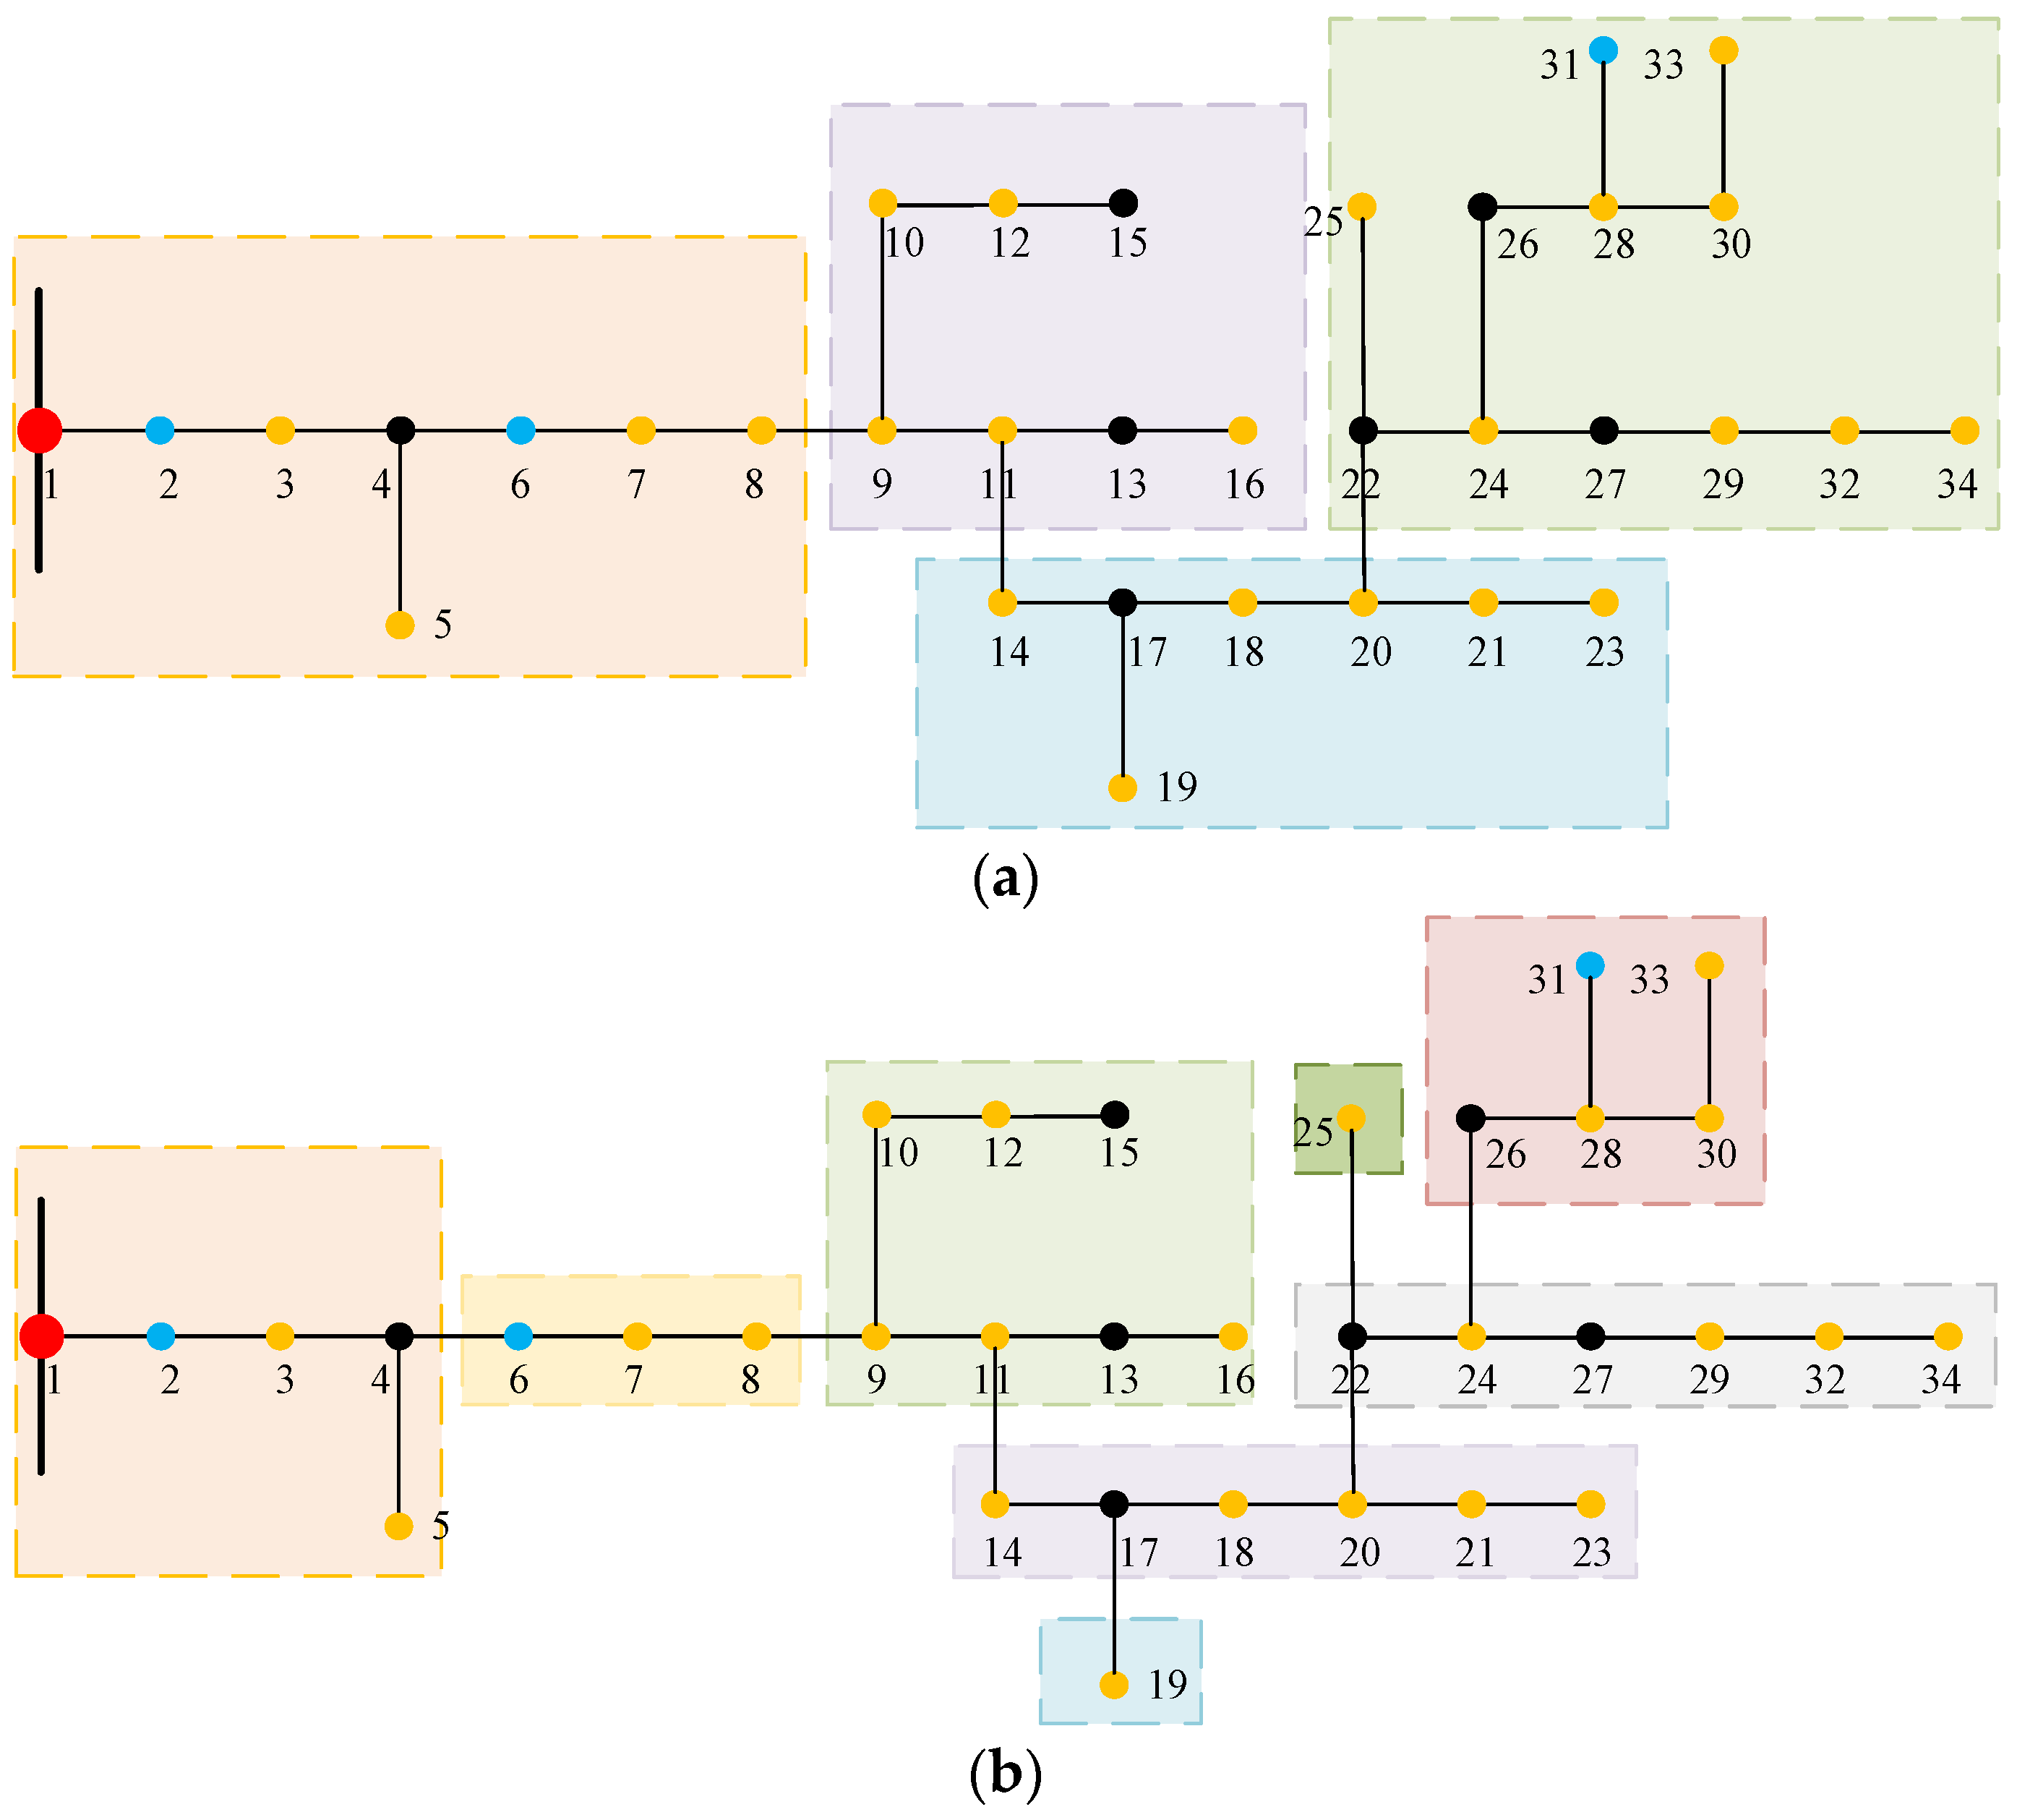
4.1. IEEE 34-Node Case Analysis

4.1.1. Distributed PV Network Design

Figure 5 illustrates the IEEE 34-bus network with distributed PV systems, which consists of 30 load buses and 23 PV buses. The total load of the network nodes is 2.87 + j4.64 MVA, operating at a base voltage of 11 kV and a system base capacity of 10 MVA. The cumulative installed capacity of the connected photovoltaic power sources reaches 5.1 MW. In the proposed method, the population size is set to N = 40, and the maximum number of iterations is set to tmax = 200.

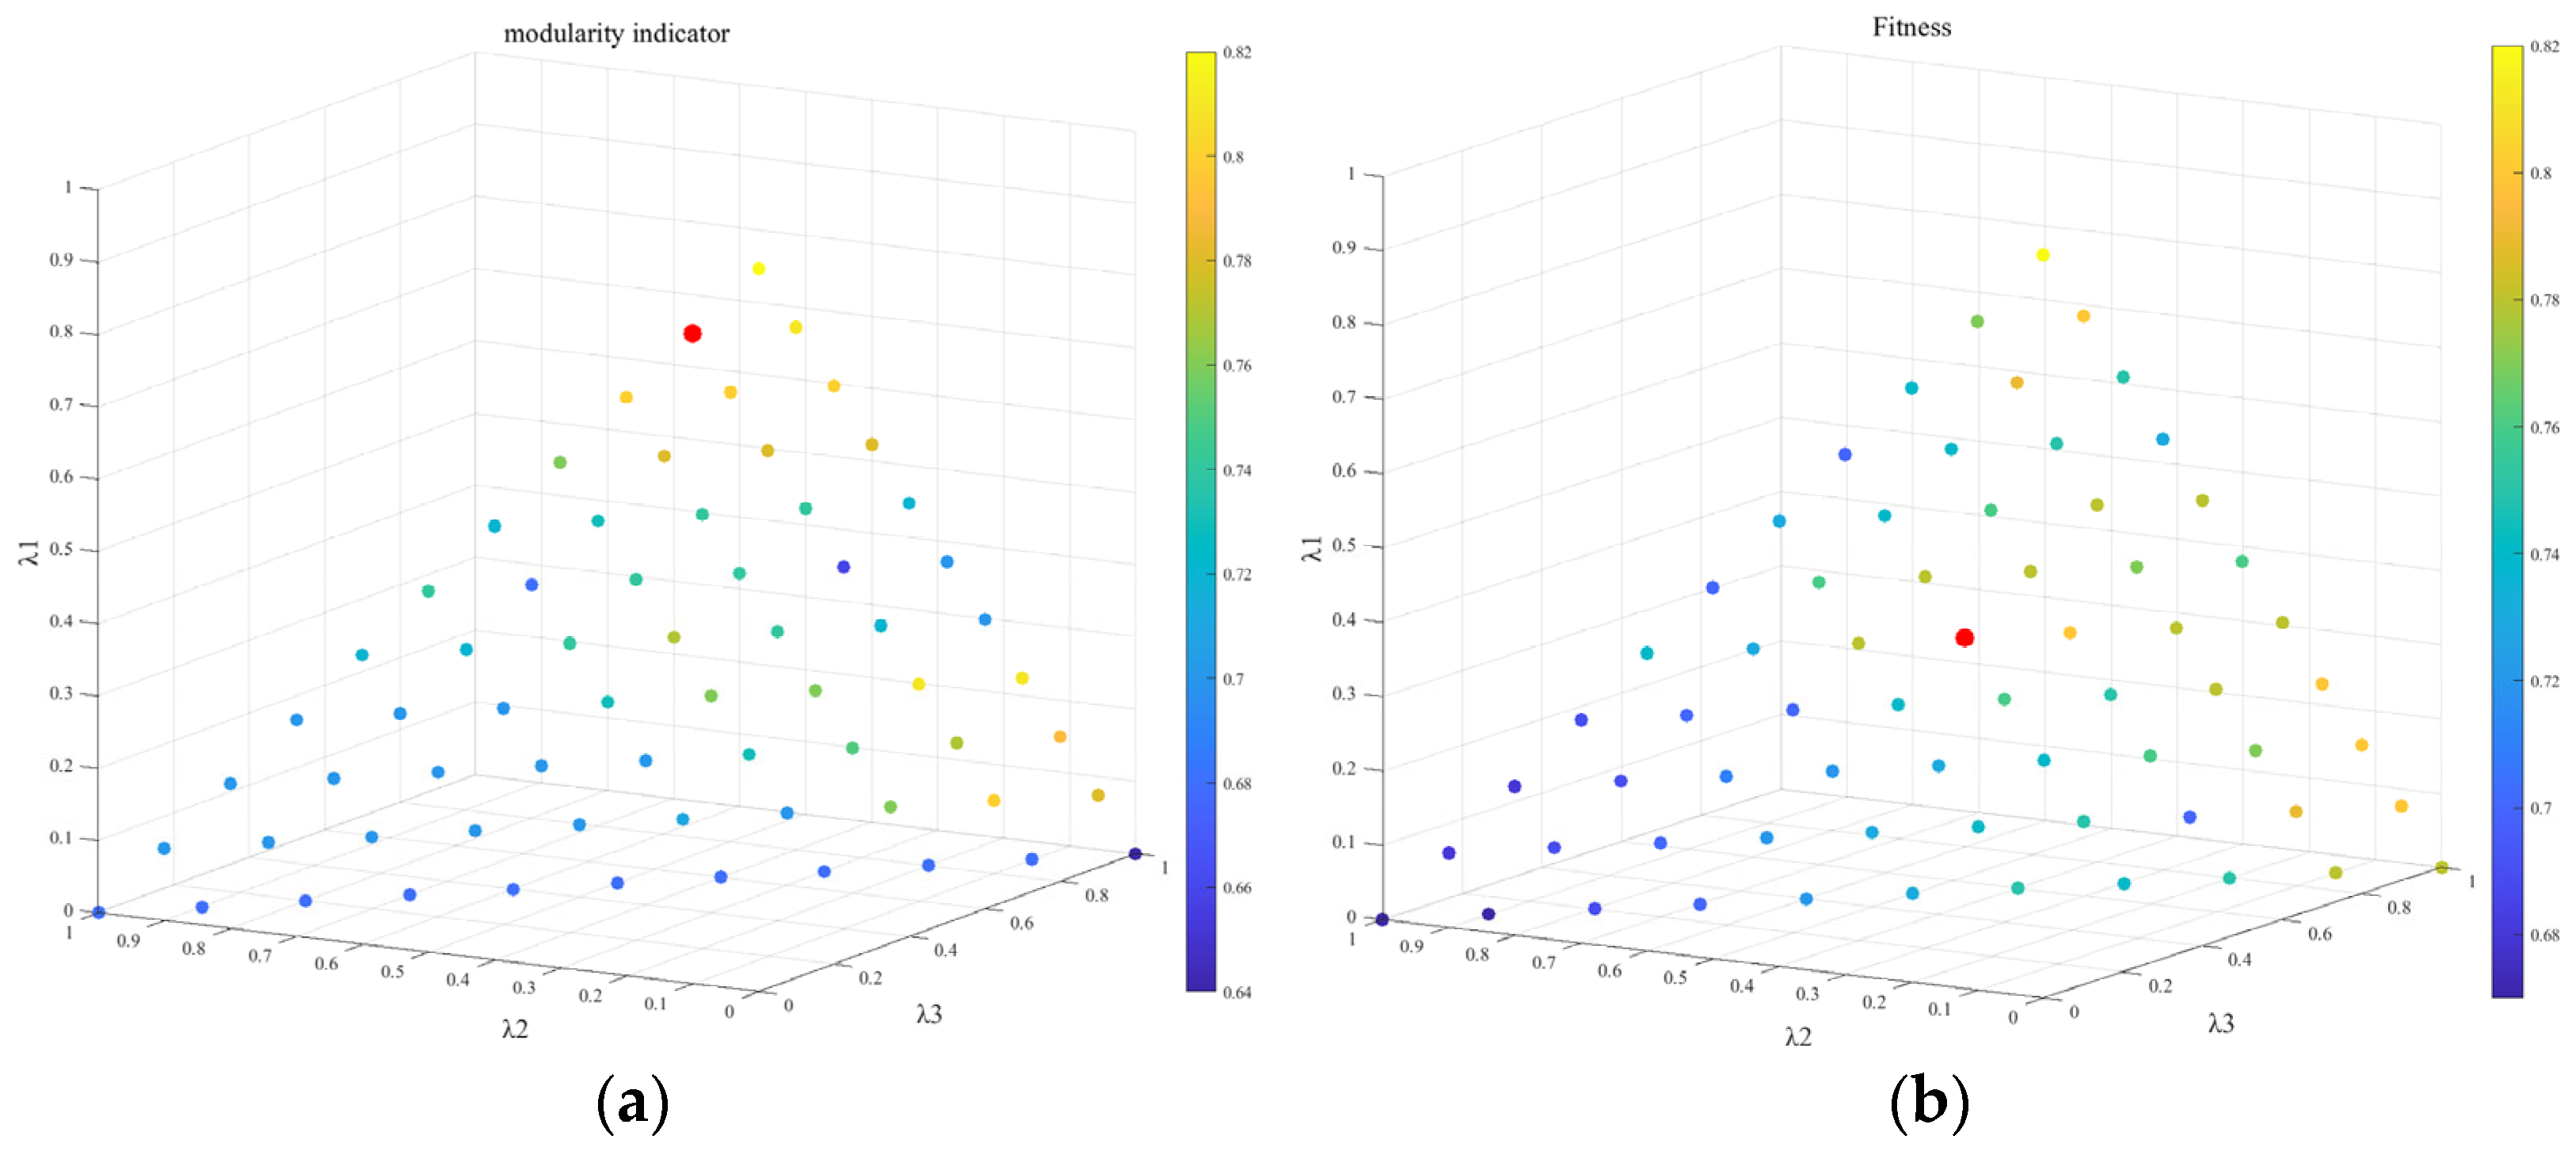
4.1.2. Analysis of the Impact of Index Weights on Cluster Partitioning

To examine the impact of the weight coefficients in Equation (13) on the optimality of clustering results, a range of weight values was assigned during the cluster partitioning process of the distribution network equipped with distributed PV systems. The subsequent changes in modularity and comprehensive performance indicators are presented in Figure 6.
The variables λ1, λ2, and λ3 are represented by the z, x, and y axes, respectively, with a coordinate step size of 0.1 while adhering to the constraint that λ1 + λ2 + λ3 = 1. A dataset of 72 outcomes is generated and visualized as a scatter plot within the coordinate system. The color bar at the right side of the plot corresponds to the weight allocation results, where darker colors indicate smaller modularity or fitness values, and lighter colors indicate larger values. Figure 6a,b depict the modularity and fitness results under different weight distributions, respectively. The red dots in the figures highlight the optimal modularity and fitness values achieved for the respective weight distributions.
Notably, Figure 6 reveals the experimental results for the single modularity index, power balance index, and node membership index. When λ1 = 1, both the modularity and comprehensive performance indices reach their maximum values. Nevertheless, this partitioning strategy overlooks the influence of active and reactive power on voltage levels and risks designating individual nodes as solitary clusters, leading to its disqualification. Among the remaining weight distributions, the modularity index reaches its maximum when λ1 = 0.9, but the corresponding fitness values are relatively lower, at 0.77 and 0.79, respectively. The fitness value reaches its maximum of 0.80 under the weight configuration of λ₁ = 0.4, λ₂ = 0.3, and λ₃ = 0.3, with a corresponding modularity value of 0.79. Ultimately, considering the weight distribution that maximizes fitness and reflects strong electrical coupling, the weights λ₁, λ₂, and λ₃ are set to 0.4, 0.3, and 0.3, respectively, as the comprehensive performance partitioning weights for subsequent analysis.

4.1.3. Analysis of the Indicator

To highlight the superiority of the comprehensive clustering partitioning indicators, the clustering modularity indicators from Reference [24] are taken for comparison. During computation, the mGA-PSO algorithm was employed under the same MATLAB 2021b configuration and the same IEEE 34-node test case. The power flow calculation was performed using the Matpower package, taking into account PV integration. The results are illustrated in Figure 7.
Figure 7 reveals that the index in this work partitions the IEEE 34-node network into four clusters, whereas the indicator from Reference [24] yields eight clusters, including the occurrence of isolated nodes being categorized as distinct communities (nodes 19 and 25). In contrast, the cluster size and count yielded by the comprehensive performance indicators in this work are more reasonable.

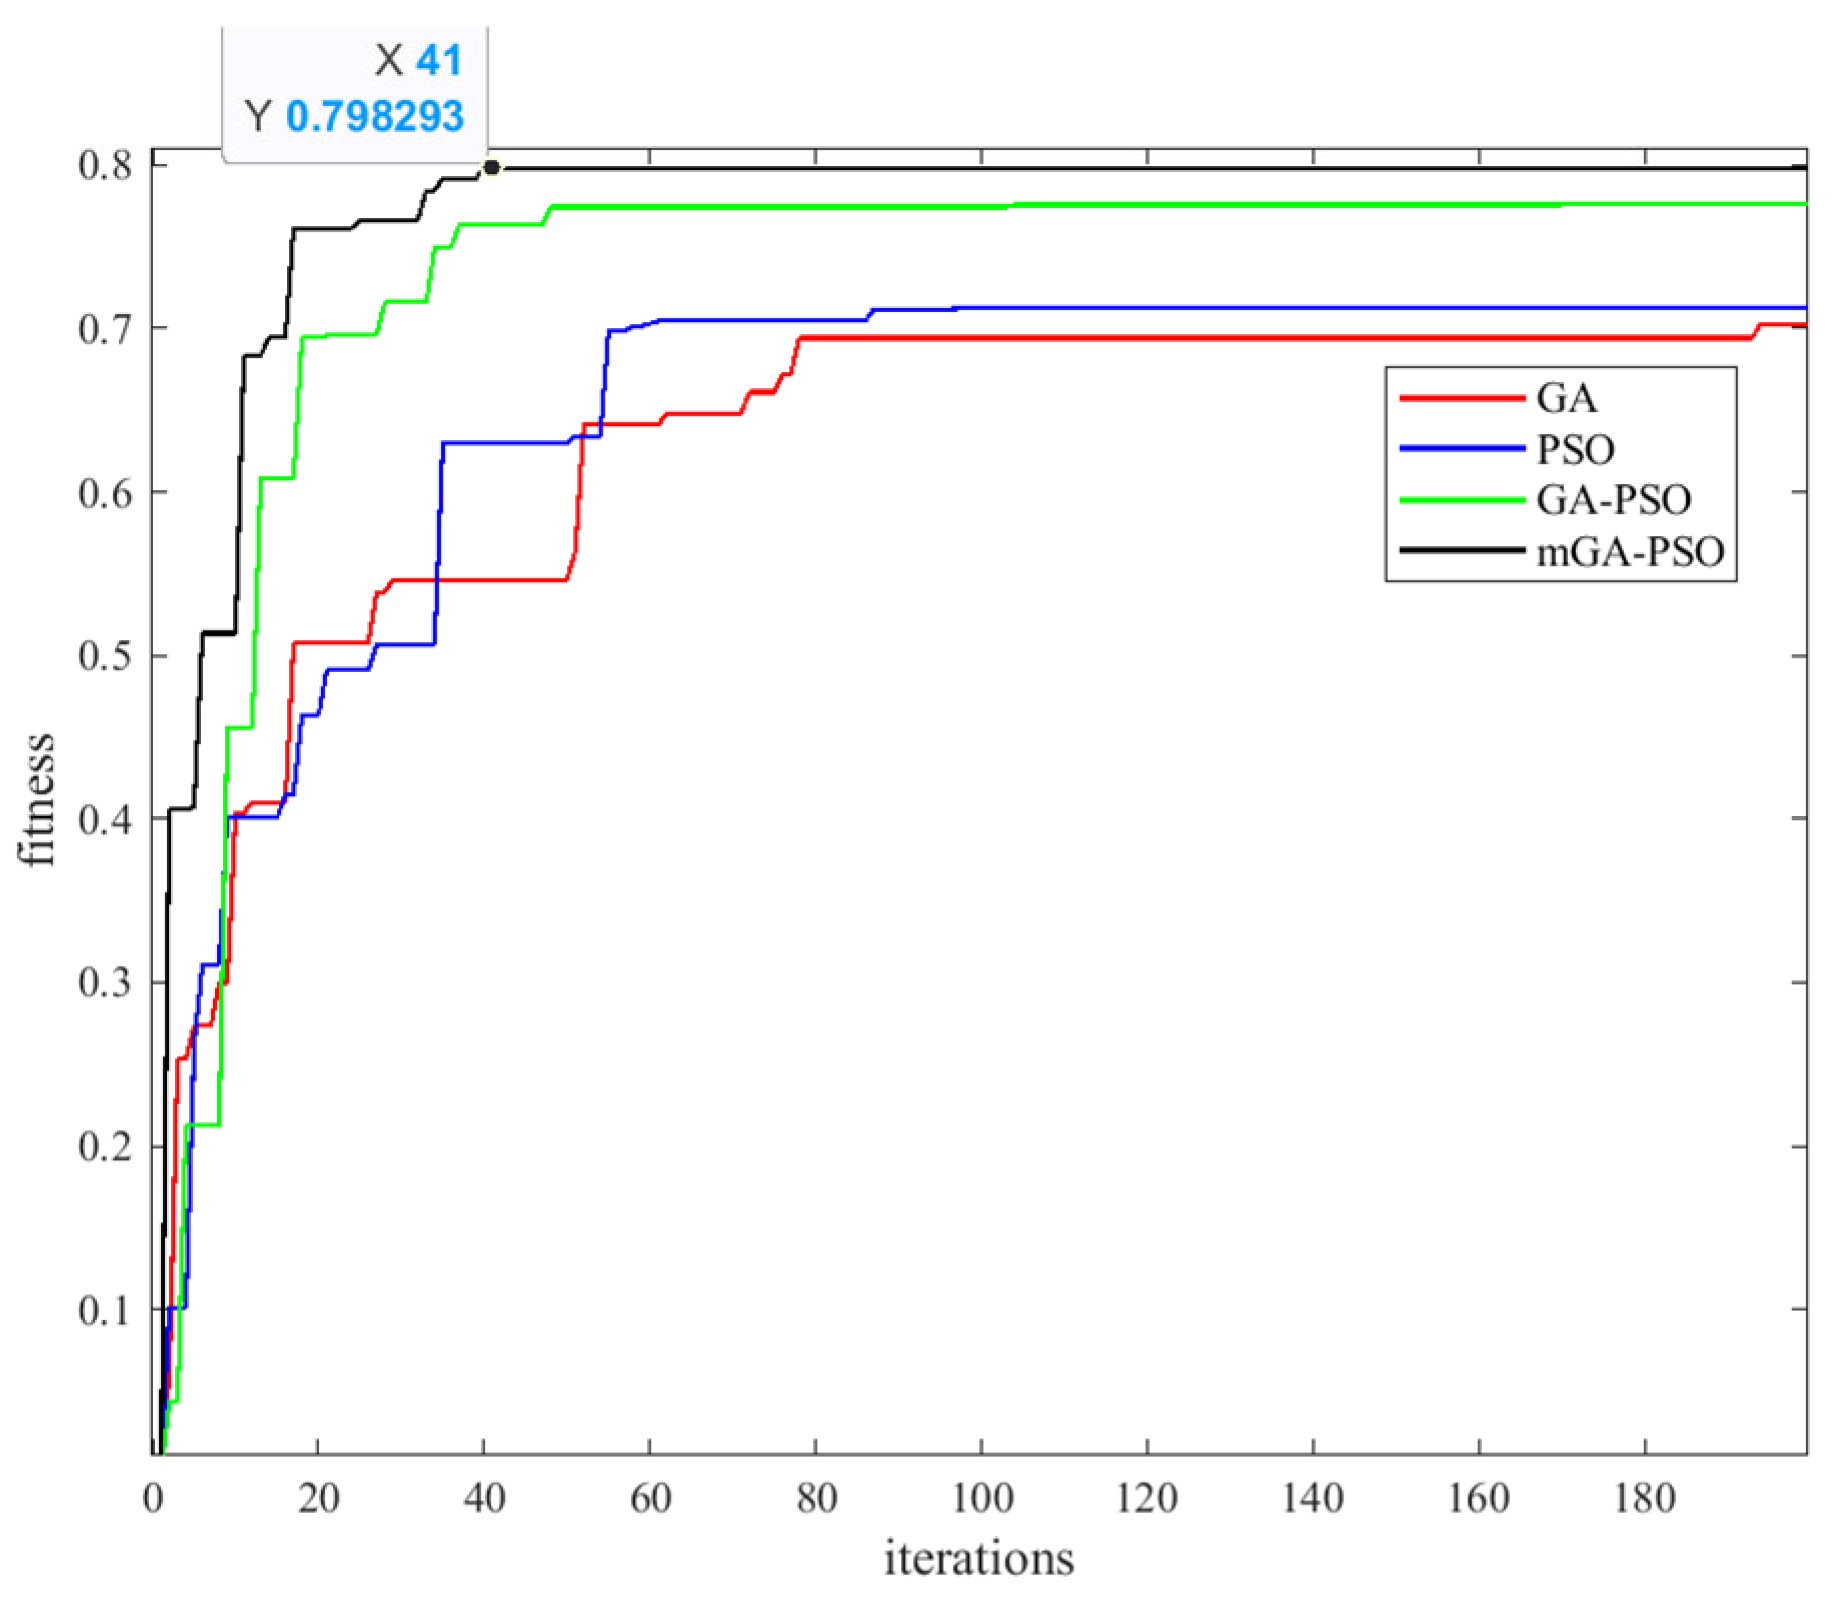
4.1.4. Algorithmic Analysis of 34-Node

To verify the optimization performance of the proposed method, it was compared with the classical GA, PSO, and GA-PSO algorithms using the same comprehensive performance index as the objective function. The results are shown in Figure 8 and Table 1.
Table 1 reports on the execution of each algorithm over 50 times, where the optimal fitness values differ among these methods. Across these 50 test iterations, our method has an advantage in terms of the percentage of optimal solutions, the average convergence generation, and the computation time, which are examined for each algorithm.
The experimental results indicate that although the proposed method is slower in solving speed compared to the PSO and GA-PSO algorithms, it achieves improvements of 16.96%, 10.48%, and 10.80% in the modularity index, power balance index, and node membership index, respectively, over the traditional GA algorithm. In comparison to the PSO algorithm, the proposed method achieves advancements of 8.56% in the modularity index, 14.33% in the power balance index, and 15.40% in the node membership index. The comprehensive performance index is enhanced by 14.66% over the traditional GA, 12.08% over the PSO, and 1.79% over the GA-PSO algorithms, respectively, underscoring the robust optimization capabilities of the mGA-PSO algorithm in tackling high-dimensional function optimization problems. Furthermore, the algorithm demonstrates swift convergence within the first 20 generations, effectively showcasing its efficiency.

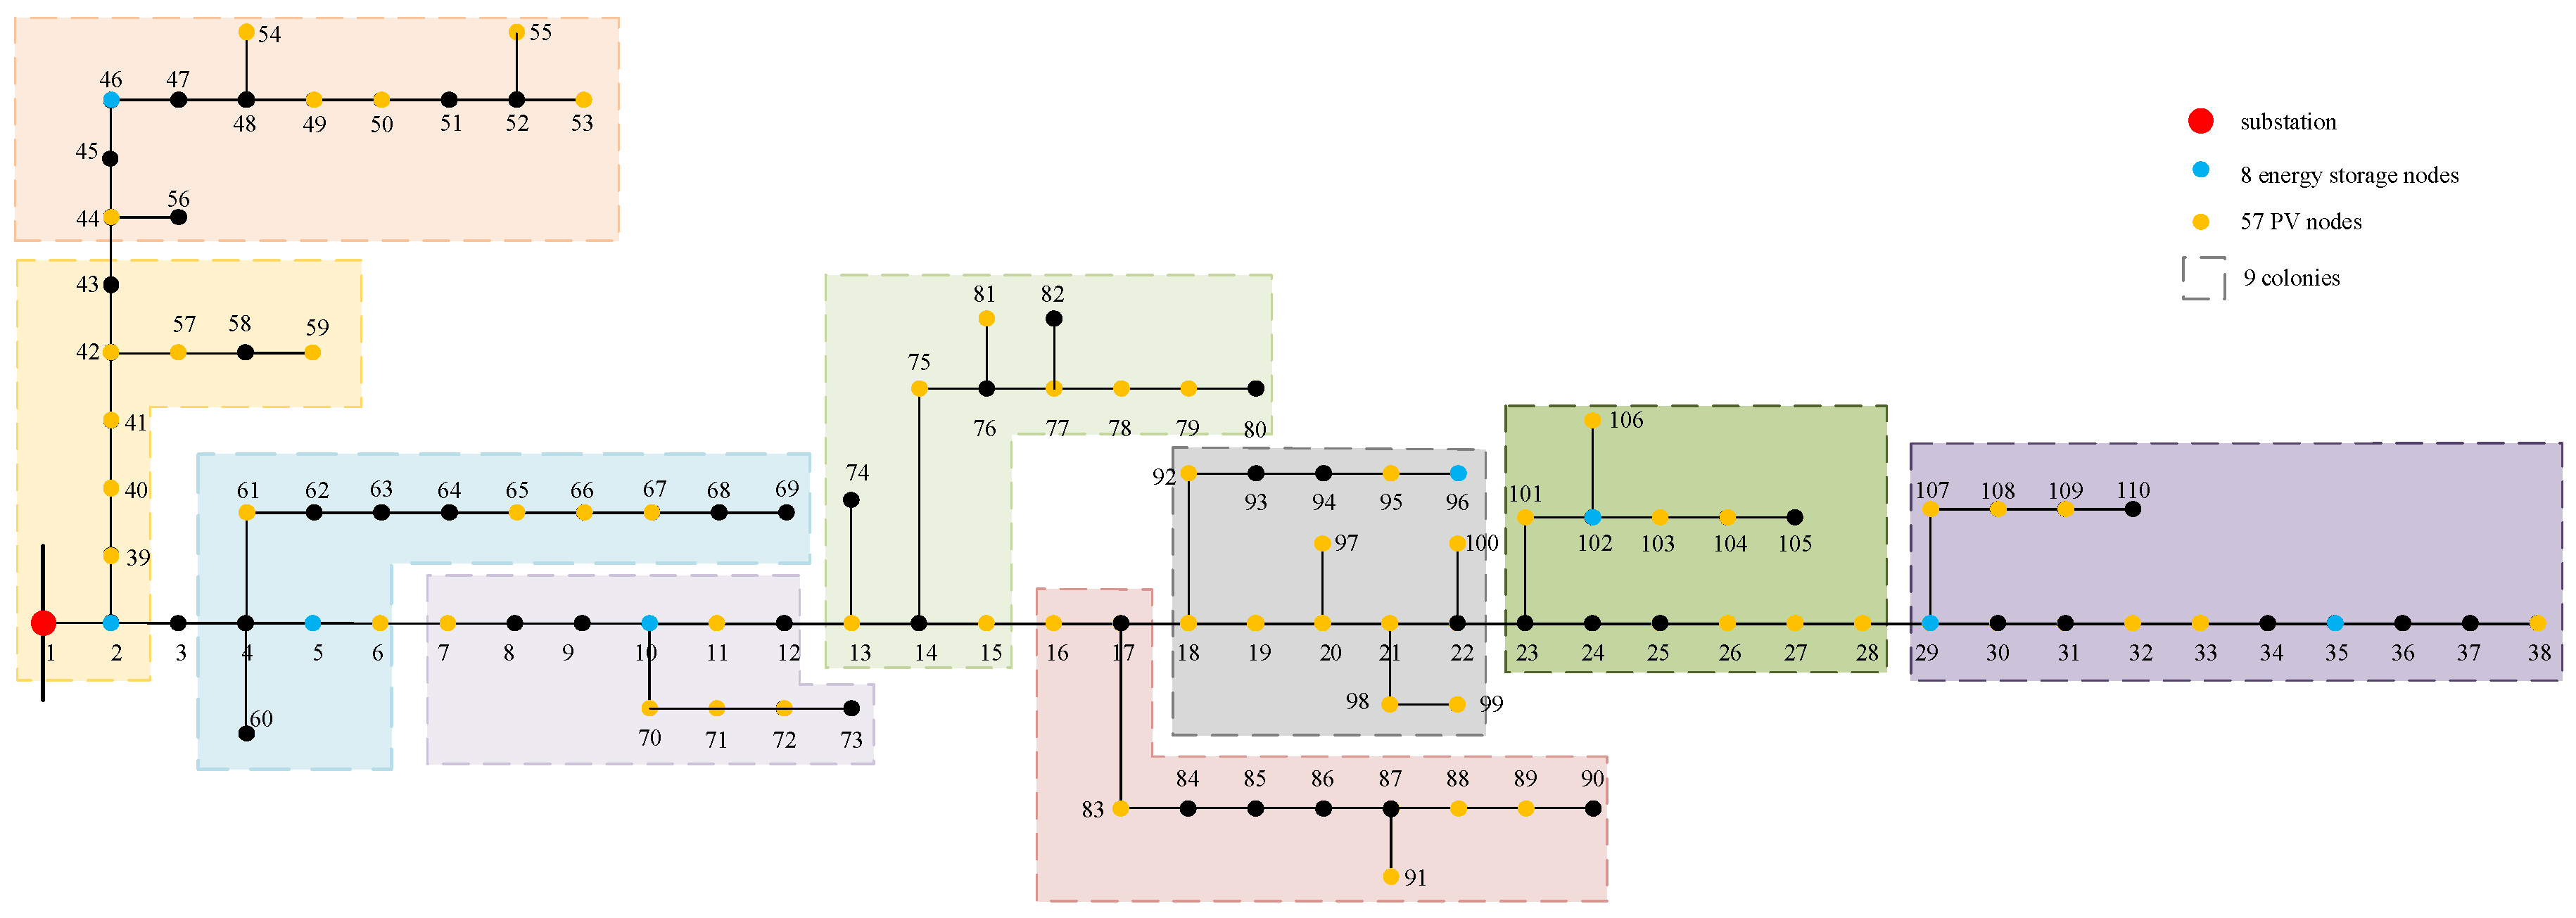
4.2. IEEE 110-Node Case Analysis

4.2.1. Distribution Network Design and Partition Results

The 10 kV feeder system consists of 110 nodes, as detailed in Reference [25], which includes 109 load nodes and 57 PV nodes. The system is configured with a total PV installation capacity of 1.45 MW and a total network load of (1642 + j981) kVA. For this scenario, all algorithms are parameterized with a particle count of N = 80 and a maximum iteration limit of tmax = 100. The objective function is defined based on the previously outlined weight distribution, and the ultimate cluster partitioning outcomes are presented in Figure 9.

4.2.2. Analysis of Algorithm Performance

Figure 10 shows the fitness curves of different methods. It can be observed that as the number of network topology nodes increases, the proposed algorithm can still quickly find the optimal solution. Additionally, the fitness value of the proposed algorithm is increased by 3.79% compared to GA-PSO, indicating that the overall improvement rate remains significant as the number of network nodes increases.
Furthermore, to explore the effectiveness of comprehensive performance indicators in large-scale cluster partitioning, the proposed cluster partitioning indicators were compared with the modularity indicator [24], as shown in Table 2.
From Table 2, it can be seen that although the number of clusters under the two metrics is 9 and 10, respectively, with little variation, the modularity index σm obtained by the clustering metric proposed in this paper increases by 2.5%, the power balance degree φ increases by 18.75%, and the comprehensive index f increases by 6.76%. This indicates that the power balance is significantly improved, which not only reduces the occurrence of independent node clusters but also ensures good reactive and active power supply capabilities, meeting the functional requirements of the distribution network.

5. Conclusions

To address the issues of clustering partitioning in distributed PV clusters, this work introduces an advanced partitioning algorithm based on the mGA-PSO (micro-genetic algorithm combined with particle swarm optimization) methodology. The algorithm constructs a fitness function that integrates the classical Girvan–Newman modularity, the complementary characteristics of active and reactive power, and node membership degree as a comprehensive performance indicator. Additionally, a novel population generation strategy is developed using grid topology graphs and adjacency tables, combining the selective advantages of micro-genetic algorithms with the “position” and “velocity” attributes inherent in particle swarm optimization. An enhanced learning-based adjustment factor is also incorporated to facilitate evolutionary optimization and iterative population search, thereby achieving optimal target values and comprehensive cluster partitioning metrics. Finally, the results demonstrate the method’s superior performance in cluster partitioning, highlighting significant improvements in convergence efficiency over traditional GA, PSO, and GA-PSO algorithms, as well as higher-quality partitioning solutions. In near-future work, research will focus on developing a coordinated control algorithm for clusters to enable the seamless integration of distributed PV into the power grid.

Author Contributions

Conceptualization, Z.L., L.X. and D.G.; Methodology, X.W. and D.Z.; Software, D.Z.; Validation, L.X.; Formal analysis, G.G.; Investigation, L.X.; Resources, Z.L. and G.G.; Data curation, Z.L.; Writing—original draft preparation, X.W.; Writing—review and editing, X.W. and D.Z.; Visualization, D.G.; Supervision, F.H.; Project administration, Z.L.; Funding acquisition, Z.L. All authors have read and agreed to the published version of the manuscript.

Funding

This research was funded by Southern Power Grid Network-level Science and Technology Project under grant number GDKJXM20222474.

Data Availability Statement

The original contributions presented in the study are included in the article; further inquiries can be directed to the corresponding author.

Conflicts of Interest

Author Zhu Liu was employed by China Southern Power Grid Research Technology Co., Ltd.; author Guowei Guo was employed by Guangdong Electric Power Co., Ltd. Foshan Power Supply Bureau; authors Dehuang Gong, Lingfeng Xuan, and Feiwu He were employed by Guangdong Electric Power Co., Ltd. Qingyuan Yingde Power Supply Bureau. The remaining authors declare that the research was conducted in the absence of any commercial or financial relationships that could be construed as potential conflicts of interest.

References

  1. Bai, M.; Yao, P.; Dong, H.; Fang, Z.; Jin, W.; Yang, X.; Liu, J.; Yu, D. Spatial-temporal characteristics analysis of solar irradiance forecast errors in Europe and North America. Energy 2024, 297, 131187. [Google Scholar] [CrossRef]
  2. Li, F.; Ding, J.; Zhou, C.; Yong, W.; Huang, Y.; Wang, J.; Xu, X. Key technologies of large-scale grid-connected operation of distributed photovoltaic under new-type power system. Power Syst. Technol. 2024, 48, 184–196. [Google Scholar]
  3. Zhang, Z.F.; Kang, C.Q. Challenges and prospects for constructing the new-type power system towards a carbon neutrality future. Proc. CSEE 2022, 42, 2806–2819. [Google Scholar]
  4. Fei, Z.; Yang, H.; Du, L.; Guerrero, J.M.; Meng, K.; Li, Z. Two-stage coordinated operation of a green multi-energy ship microgrid with underwater radiated noise by distributed stochastic approach. IEEE Trans. Smart Grid 2024, 16, 1062–1074. [Google Scholar] [CrossRef]
  5. Xu, X.; Gao, Y.; Wang, H.; Yan, Z.; Shahidehpour, M.; Tan, Z. Distributionally robust optimization of photovoltaic power with lifted linear decision rule for distribution system voltage regulation. IEEE Trans. Sustain. Energy 2023, 15, 758–772. [Google Scholar] [CrossRef]
  6. Sheng, W.; Wu, M.; Ji, Y.; Kou, L.; Pan, J.; Shi, H.; Niu, G.; Wang, Z.G. Key techniques and engineering practice of distributed renewable generation clusters integration. Proc. CSEE 2019, 39, 2175–2186. [Google Scholar]
  7. Peng, H.; Gu, J.; Hu, Y.; Song, B. Forecasting model of saturated load based on chaotic particle swarm and optimization-gaussian process regression. Autom. Electr. Power Syst. 2017, 41, 9–14. [Google Scholar]
  8. Liu, S.Y. Multi-objective model predictive control of grid-connected inverters in unbalanced grids. J. Electr. Eng. 2023, 18, 77–85. [Google Scholar]
  9. Li, B.T.; Sun, M.Y.; Chen, X.L.; Li, B.; Ji, X.; Xiao, F. Line parameter identification method for multi-ring medium-voltage distribution network based on phaseless measurement. Autom. Electr. Power Syst. 2023, 47, 22–30. [Google Scholar]
  10. Li, B.; Lei, C.; Fan, B.; Huang, Y.; Jia, W.; Ma, Y. Research on typical electricity consumption law based on daily load indicator and improved distributed k-means clustering. Electr. Meas. Instrum. 2023, 60, 104–111. [Google Scholar]
  11. Xie, Q.; Xu, H.L.; Wang, T.; Zhao, F.; Zhang, G.; Dang, J. Disconnector fault diagnosis method based on autonomous-cognition deep temporal clustering representation. J. Electr. Eng. 2024, 19, 281–289. [Google Scholar]
  12. Dong, M.; Liu, K.Z.; Zhao, Q.L.; Chen, L.; Yao, Y.; Zhao, X. Multi-objective optimal operation of integrated energy system based on improved particle swarm optimization algorithm. Electr. Drive 2024, 54, 41–47. [Google Scholar]
  13. Chai, Y.; Guo, L.; Wang, C. Network partition and voltage coordination control for distribution networks with high penetration of distributed PV units. IEEE Trans. Power Syst. 2018, 33, 3396–3407. [Google Scholar] [CrossRef]
  14. Ding, M.; Liu, X.; Bi, R.; Hu, D.; Ye, B.; Zhang, J. Method for cluster partition of high-penetration distributed generators based on comprehensive performance index. Autom. Electr. Power Syst. 2018, 42, 47–52. [Google Scholar]
  15. Yu, L.; Sun, Y.; Xu, R.; Li, K. Improved particle swarm optimization algorithm and its application in reactive power partitioning of power grid. Autom. Electr. Power Syst. 2017, 41, 89–95. [Google Scholar]
  16. Pan, M.Y.; Liu, N.; Lei, J.Y. Dynamic partition method for distributed energy cluster with combined heat and power unit. Autom. Electr. Power Syst. 2021, 45, 168–176. [Google Scholar]
  17. Gao, Y.Q.; Wang, W.; Yu, N.P. Consensus multi-agent reinforcement learning for volt-VAR control in power distribution networks. IEEE Trans. Smart Grid 2021, 12, 3594–3604. [Google Scholar] [CrossRef]
  18. Newman, M.E.J. Modularity and community structure in networks. Proc. Natl. Acad. Sci. USA 2006, 103, 8577–8582. [Google Scholar] [CrossRef]
  19. Cotilla-Sanchez, E.; Hines, P.D.; Barrows, C.; Blumsack, S.; Patel, M. Multi-attribute partitioning of power networks based on electrical distance. IEEE Trans. Power Syst. 2013, 28, 4979–4987. [Google Scholar] [CrossRef]
  20. Wang, J.L.; Zhang, Y.; Wang, C.M.; Sun, J.S. Power system reactive power/voltage assessment based on sensitivity analysis and optimal power flow. Power Syst. Technol. 2005, 29, 65–69. [Google Scholar]
  21. Xu, H.D.; Ding, Y.F.; Wang, R.S.; Geng, G.C.; Jiang, Q.Y.; Sun, F.F. Optimal allocation of shared energy storage based on transmission network zoning. Proc. CSEE 2024. Available online: http://kns.cnki.net/kcms/detail/11.2107.tm.20240624.1645.024.html (accessed on 10 January 2025).
  22. Kennedy, J.; Eberhart, R.C. A discrete binary version of the particle swarm algorithm. In Proceedings of the IEEE International Conference on Systems, Man, and Cybernetics, Orlando, FL, USA, 12–15 October 1997; pp. 4104–4108. [Google Scholar]
  23. Mesloub, S.; Mansour, A. Hybrid PSO and GA for global maximization. Int. J. Open Probl. Compt. Math 2009, 2, 597–608. [Google Scholar]
  24. Wang, L.; Zhang, F.; Kou, L.F.; Xu, Y.H.; Hou, X.G. Large-scale distributed PV cluster division based on fast unfolding clustering algorithm. Acta Energiae Solaris Sin. 2021, 42, 29–34. [Google Scholar]
  25. Chen, J.H.; Zhang, L.J.; Lu, D.; Guo, P.; Ren, J.; Li, J.; Li, Z. Cluster partition method of distributed power supply based on improved particle swarm optimization algorithm. J. Zhengzhou Univ. (Eng. Sci.) 2023, 44, 77–85. [Google Scholar]
Figure 1. Research framework and methodology overview.
Energies 18 01197 g001
Figure 2. Methods for generating coding map and adjacency table.
Energies 18 01197 g002
Figure 3. Initialization process.
Energies 18 01197 g003
Figure 4. The flowchart of the mGA-PSO algorithm.
Energies 18 01197 g004
Figure 5. IEEE 34-bus network with distributed PV systems.
Energies 18 01197 g005
Figure 6. Modularity index and fitness with different weights. (a) Modularity index under the influence of weights. (b) Fitness under the influence of weights.
Energies 18 01197 g006
Figure 7. Cluster partitioning results. (a) Clustering partitioning results obtained by our indicator. (b) Clustering partitioning results obtained by the indicator from [24].
Energies 18 01197 g007
Figure 8. IEEE 34-node fitness function variation curve.
Energies 18 01197 g008
Figure 9. Cluster partitioning results.
Energies 18 01197 g009
Figure 10. IEEE 110-node fitness function variation curve.
Energies 18 01197 g010
Table 1. Comparison results of algorithm performance.
AlgorithmGAPSOGA-PSOOurs
optimal fitness value0.6960.7120.7840.798
modularity index0.6720.7240.7730.786
power balance index0.6830.6840.7630.781
node membership index0.7410.7210.8210.832
percentage of optimal solutions %58687686
index of average convergence8162.54843.5
cost time/s>60102432
Table 2. Impact of indicator types on cluster partitioning.
IndicatorfσmφCluster Number
this paper’s clustering indicator0.790.830.769
modularity indicator0.740.740.6410
Disclaimer/Publisher’s Note: The statements, opinions and data contained in all publications are solely those of the individual author(s) and contributor(s) and not of MDPI and/or the editor(s). MDPI and/or the editor(s) disclaim responsibility for any injury to people or property resulting from any ideas, methods, instructions or products referred to in the content.

