1. Introduction
The increase in global warming up to 1.5 °C between 2030 and 2052 [
1] is expected to compromise territories, communities, and cities by intensifying heat waves and degrading air quality and water availability [
2]. The EU report, Energy Roadmap 2050, identifies six strategies to achieve an 80% reduction in annual greenhouse gas emissions by 2050 compared to 1990 levels [
3]. The global energy demand and emitted carbon dioxide are highly affected by buildings, which account for 40.0% of energy consumption and about 36.0% of emitted carbon dioxide in the EU [
4]. Thus, improving buildings’ energy efficiency is crucial to achieving the striving objective of carbon neutrality by 2050. Building energy consumptions display large differences between EU countries, ranging from 0.9 in Portugal to 2.5 toe/dwelling in Luxembourg, with an average value of 1.3 toe/dwelling in 2018 [
5]. Space heating is the prevailing end-use, with 66% of household consumption. Between 2000 and 2019, downward trends are observed for space heating and cooking (only 5% of the total) by 0.5 and 0.3%/year, respectively. Otherwise, household appliances (13% of the total) and water heating (14%) have shown an increase in consumption by 2.5 and 0.2%/year. The other consumptions are related to lighting and cooling (just about 2%).
Presently, about two-thirds of the heat demand for buildings is dominated by combustion heating systems that could be replaced with Heat Pumps (HPs), which could supply more than 4/5 of global space heating and domestic hot water (DHW) demand with relative CO
2 emissions of 0.2–0.3 times that concern the condensing gas boilers with the highest efficiency [
6]. Although the electrification of residential space heating using HPs is a potential strategy to reduce GHG emissions associated with natural gas combustion and fugitive methane emissions, a complete comparison has to take into account the on-site and off-site emissions related to natural gas and electricity production. Moreover, to provide a comprehensive representation for policy analysis, refrigerant losses from HPs have to be included in evaluating global emissions [
7]. Besides climate goals, energy security is an important driver for HP in the EU, with increasing policy consideration in 2022 [
8]. Currently, HPs meet less than half of what is necessary for the Net Zero Emissions Scenario (NZE), which foresees that about 600 million HPs should be installed, covering at least 20% of the global heating need in buildings by 2030. As HPs are increasingly recognized as an effective technology for the decarbonization of building heating, but their cost is higher than fossil fuel boilers, further public policy support and technical innovations are needed to make them more affordable [
8]. Many studies deal with forthcoming buildings [
9] and not with the retrofitting of existing building stock [
10], which is expected to represent the major amount of heat requests for many times to come [
11]. Reversible heat pumps, which can provide heating and cooling for buildings, make them a versatile and viable option to supply the space cooling demand. Air–source heat pumps are the most diffused typology, with a market segment of more than 60% in 2021 [
6]. Most investigated scenarios focused on the heating sector electrification and the large-scale employment of photovoltaic (PV) solar rooftop installations, which can be easily combined with HP [
12]. The integration of HP with a PV plant (PV–HP) allows the exploitation of clean electrical energy, produced by PV, to reduce the energy needs of buildings, managing to reduce costs by 50% and CO
2 emissions by up to 73% compared to a conventional system [
13]. However, this solution does not improve the performance of the HP, as it only allows for the reduction in energy costs by the electricity produced from PV. To increase the performance of the HP, solutions that couple heat pumps with solar thermal panels, the so-called Solar-Assisted Heat Pump (SAHP) [
14], allow for increasing the COP during the heating period from 3.12 to 3.91 [
15].
Recently, some scholars have analyzed the combination of photovoltaic thermal plant (PVT) and HP (PVT-HP), evidencing that PVT produces more energy than conventional solar plants using the same surface [
16] and allowing the exploitation of solar energy in multiple applications [
17]. Combining PVT systems with HP, known as PVT-SAHP, provides better performance than conventional SAHPs that use solar thermal collectors, which is 70% higher than the conventional air conditioning system [
18]. Although the heat recovered from PVT systems is slightly lower than that obtained from solar thermal panels, the simultaneous production of electricity allows for a significant reduction in the energy requirement for the heat pump [
19,
20,
21]. Overall, the PVT-HP system allows an increase in COP in heating between 4.55 and 13.25% compared to that of the ASHP [
20]. As a result, PVT-SAHP systems also demonstrate a higher seasonal performance factor of about 14% compared to other SAHP systems [
21]. Braun et al. [
22] have studied the arrangement of PVT collectors with HP, which operates as a trigeneration system in net-zero energy passive buildings. It was remarked that the PVT-HP combination allows higher self-consumption and lower energy production costs than conventional systems based on HP only. PVT-HP systems, if well-designed, could lead to an increase in overall energy-saving gains of up to 8% with respect to non-solar solutions [
23]. The performance of a PVT system integrated into the building envelope was investigated [
24]. It was evidenced that splitting the PVT on differently oriented façades allows reaching high self-consumption, avoiding the use of electrical storage, and overcoming a realized self-consumption rate of 68% against values between 52 and 57% for other exposures. The heat produced by PVT collectors can be utilized in combination with a ground-source heat pump for the regeneration of a horizontal ground heat exchanger [
25]. Another interesting application of PVT is its use to supply thermal energy to heat-driven chillers [
26]. Looking at the heat demand in many European cities according to some recent studies, including Heat Roadmap Europe [
27], identified district heating as one potential alternative for the implementation of future sustainable energy systems [
28]. A critical aspect of ramping up building electrification is the impact of HPs on the local low-voltage distribution networks [
29]. Barteczko-Hibbert [
30] developed an approach based on After Diversity Maximum Demand (ADMD), which focuses on the maximum demand detected for a group of residential customers using or not using HP over a one-year time. In the Customer-Led Network Revolution project [
31], it was detected that ADMD diminishes when the number of customers rises due to the increased multiplicity in consumption; the diversity variance becomes unimportant at around 100 customers [
32]. However, building electrification must consider the fundamental contribution that can be obtained from energy storage, which helps to improve the integration of renewable energy sources, increasing the security of the electricity grid [
33]. Storages allow the stocking of energy during periods of excess production and use it when energy generation is insufficient [
34], allowing for to reduction in the imbalance between supply and demand typical of renewable energy sources [
35]. The combination of air–source HP and TES for forcing building electrification has been discussed in the review presented in [
36], where upon analyzing 59 publications, an average performance increase of 27% was observed, compared to the HP system without storage. The research carried out by [
37] has evidenced that thermal energy storage, which can be classified as a power-to-heat solution, resulted in more profitability than the increase in electric vehicles (EVs) with regard to grid operation. HPs integrated with TES can also take advantage of differentiated electricity tariffs, as well as to provide ancillary services to the grid [
38].
Currently, few researchers have investigated the performance of energy systems equipped with PV plants, HP, and thermal and electrical storage (PV–HP–TES–EES) [
39,
40]. In [
40], the performances of two different control strategies were compared, the first based on the control of the setpoint temperature in the storage tank, regardless of the presence of solar radiation, while the second was specifically designed to maximize the use of renewable solar sources, which consisted of the accumulation of as much thermal energy as possible in periods where electrical production exceeded the requirement. In [
39], the performances of a PV–HP–TES–EES system were analyzed with the aim of optimizing the system performance and reducing the use of electrical storage as much as possible, ensuring self-consumption and self-sufficiency higher than 80.0%, and the simultaneous decrease in the energy exchanged with the grid [
39]. This research aims to extend the existing literature research on multi-generation energy systems, which are wholly focused on the use of conventional PV plants combined with Heat Pumps (PV–HP), while the studies on PVT combined with Heat Pumps and double storage are very limited (PVT–HP–TES–EES). The energy analysis of a PVT–HP–TES–EES has a specific peculiarity since the PVT solar collectors allow the contemporary production of thermal and electrical energy with a reciprocal effect on the relative efficiencies. So, to account for the effective electrical and thermal energy produced by the PVT plant and thus the energy fluxes exchanged with the two storages, TES and EES, or directly used to balance the building energy demand, a novel energy model and the relative logic of supervision has been developed in TRNSYS. Moreover, in comparison with the previous literature studies, the performances of the proposed multi-generation energy system were evaluated, taking into account the ability of the proposed energy system to reach a high rate of self-consumption and self-sufficiency, and in the meantime limit the power exchanged from/to the grid, introducing new indicators. To better highlight the benefit achieved using PVT instead of PV collectors, the performance of the other two energy systems based on PV modules combined with a Heat Pump without storage (PV–HP) and with both thermal and electrical storage (PV–HP–TES–EES) have been evaluated and compared to the proposed energy system.
This paper is organized as follows: after the introduction, the methodology followed in this study and the features of the energy system investigated are comprehensively illustrated. The third paragraph presents the case study to which the energy analyses are referred. The fourth paragraph reports the results of the energy analyses and the comparisons among the different energy systems. Finally, the conclusions of this study are discussed.
2. Materials and Methods
This study aims to evaluate the performance of an energy system constituted by a hybrid photovoltaic/thermal plant combined with an air–source HP, thermal, and electrical storage. Comparisons between the system configuration equipped with a PVT or PV, as well as with the baseline system without energy storage, have been developed. These last two system configurations have been already analyzed in our previous research [
39]. The use of a PVT plant, which contemporarily generates heat and power in the advanced energy system proposed, has the main advantage of allowing the direct or indirect via the TES, use of the thermal energy produced, without the need to generate heat through the HP, especially during the mid-seasons.
The effectiveness of the above-mentioned system configurations has been determined by evaluating the autonomy, auto-consumption, and the decrease in the energy fluctuations with the power grid assuming a residential building as a reference. The renewable power generated by the PV and PVT systems, the energy demands for heating and cooling, and the interactions with the electrical network have been determined through numerical simulations carried out by TRNSYS 17.2 software.
2.1. Energy System’s Configuration
The different energy system configurations, as well as the building energy needs, have been modeled through the TRNSYS software. The main difference in the advanced energy system presented in this study consists of the use of a PVT plant associated with HP, TES, and EES instead of the use of a PV plant [
39]. To consider the two energy vectors generated by PVT in comparison to the PV, as well as the direct use of the heat, a new set-up has been designed in the TRNSYS project. The simulated HVAC system consists of a radiant floor system powered by an air-cooled heat pump. The HP generator was modeled using type 1221, which consists of a two-stage HP, capable of tracking thermal performance in terms of coefficient of performance, thermal power supplied, and electrical power consumed as a function of operating temperatures, through interpolation of the provided parameters. Furthermore, an enhancement of type 1221 has been implemented in such a way as to model a four-stage heat pump, for each stage of the HP’s thermal power, so that it is possible to associate the correspondent electrical power.
The thermal loads for heating and cooling the building have been calculated by type 56, which allows the description of a building with multiple thermal zones with a homogenous temperature (e.g., rooms). This type uses thermos-physical data from walls and windows. Heat Gains from solar direct and diffuse radiation are calculated for each room depending on the window and thermal radiative properties.
The baseline energy system is constituted by the PV–HP combination without storage. The advancement of this energy system is the addition of thermal and electric storage (PV–HP–TES–EES). Finally, the effectiveness of the introduction of PVT panels instead of conventional PV panels, which allow the simultaneous production of electricity and heat, has been evaluated.
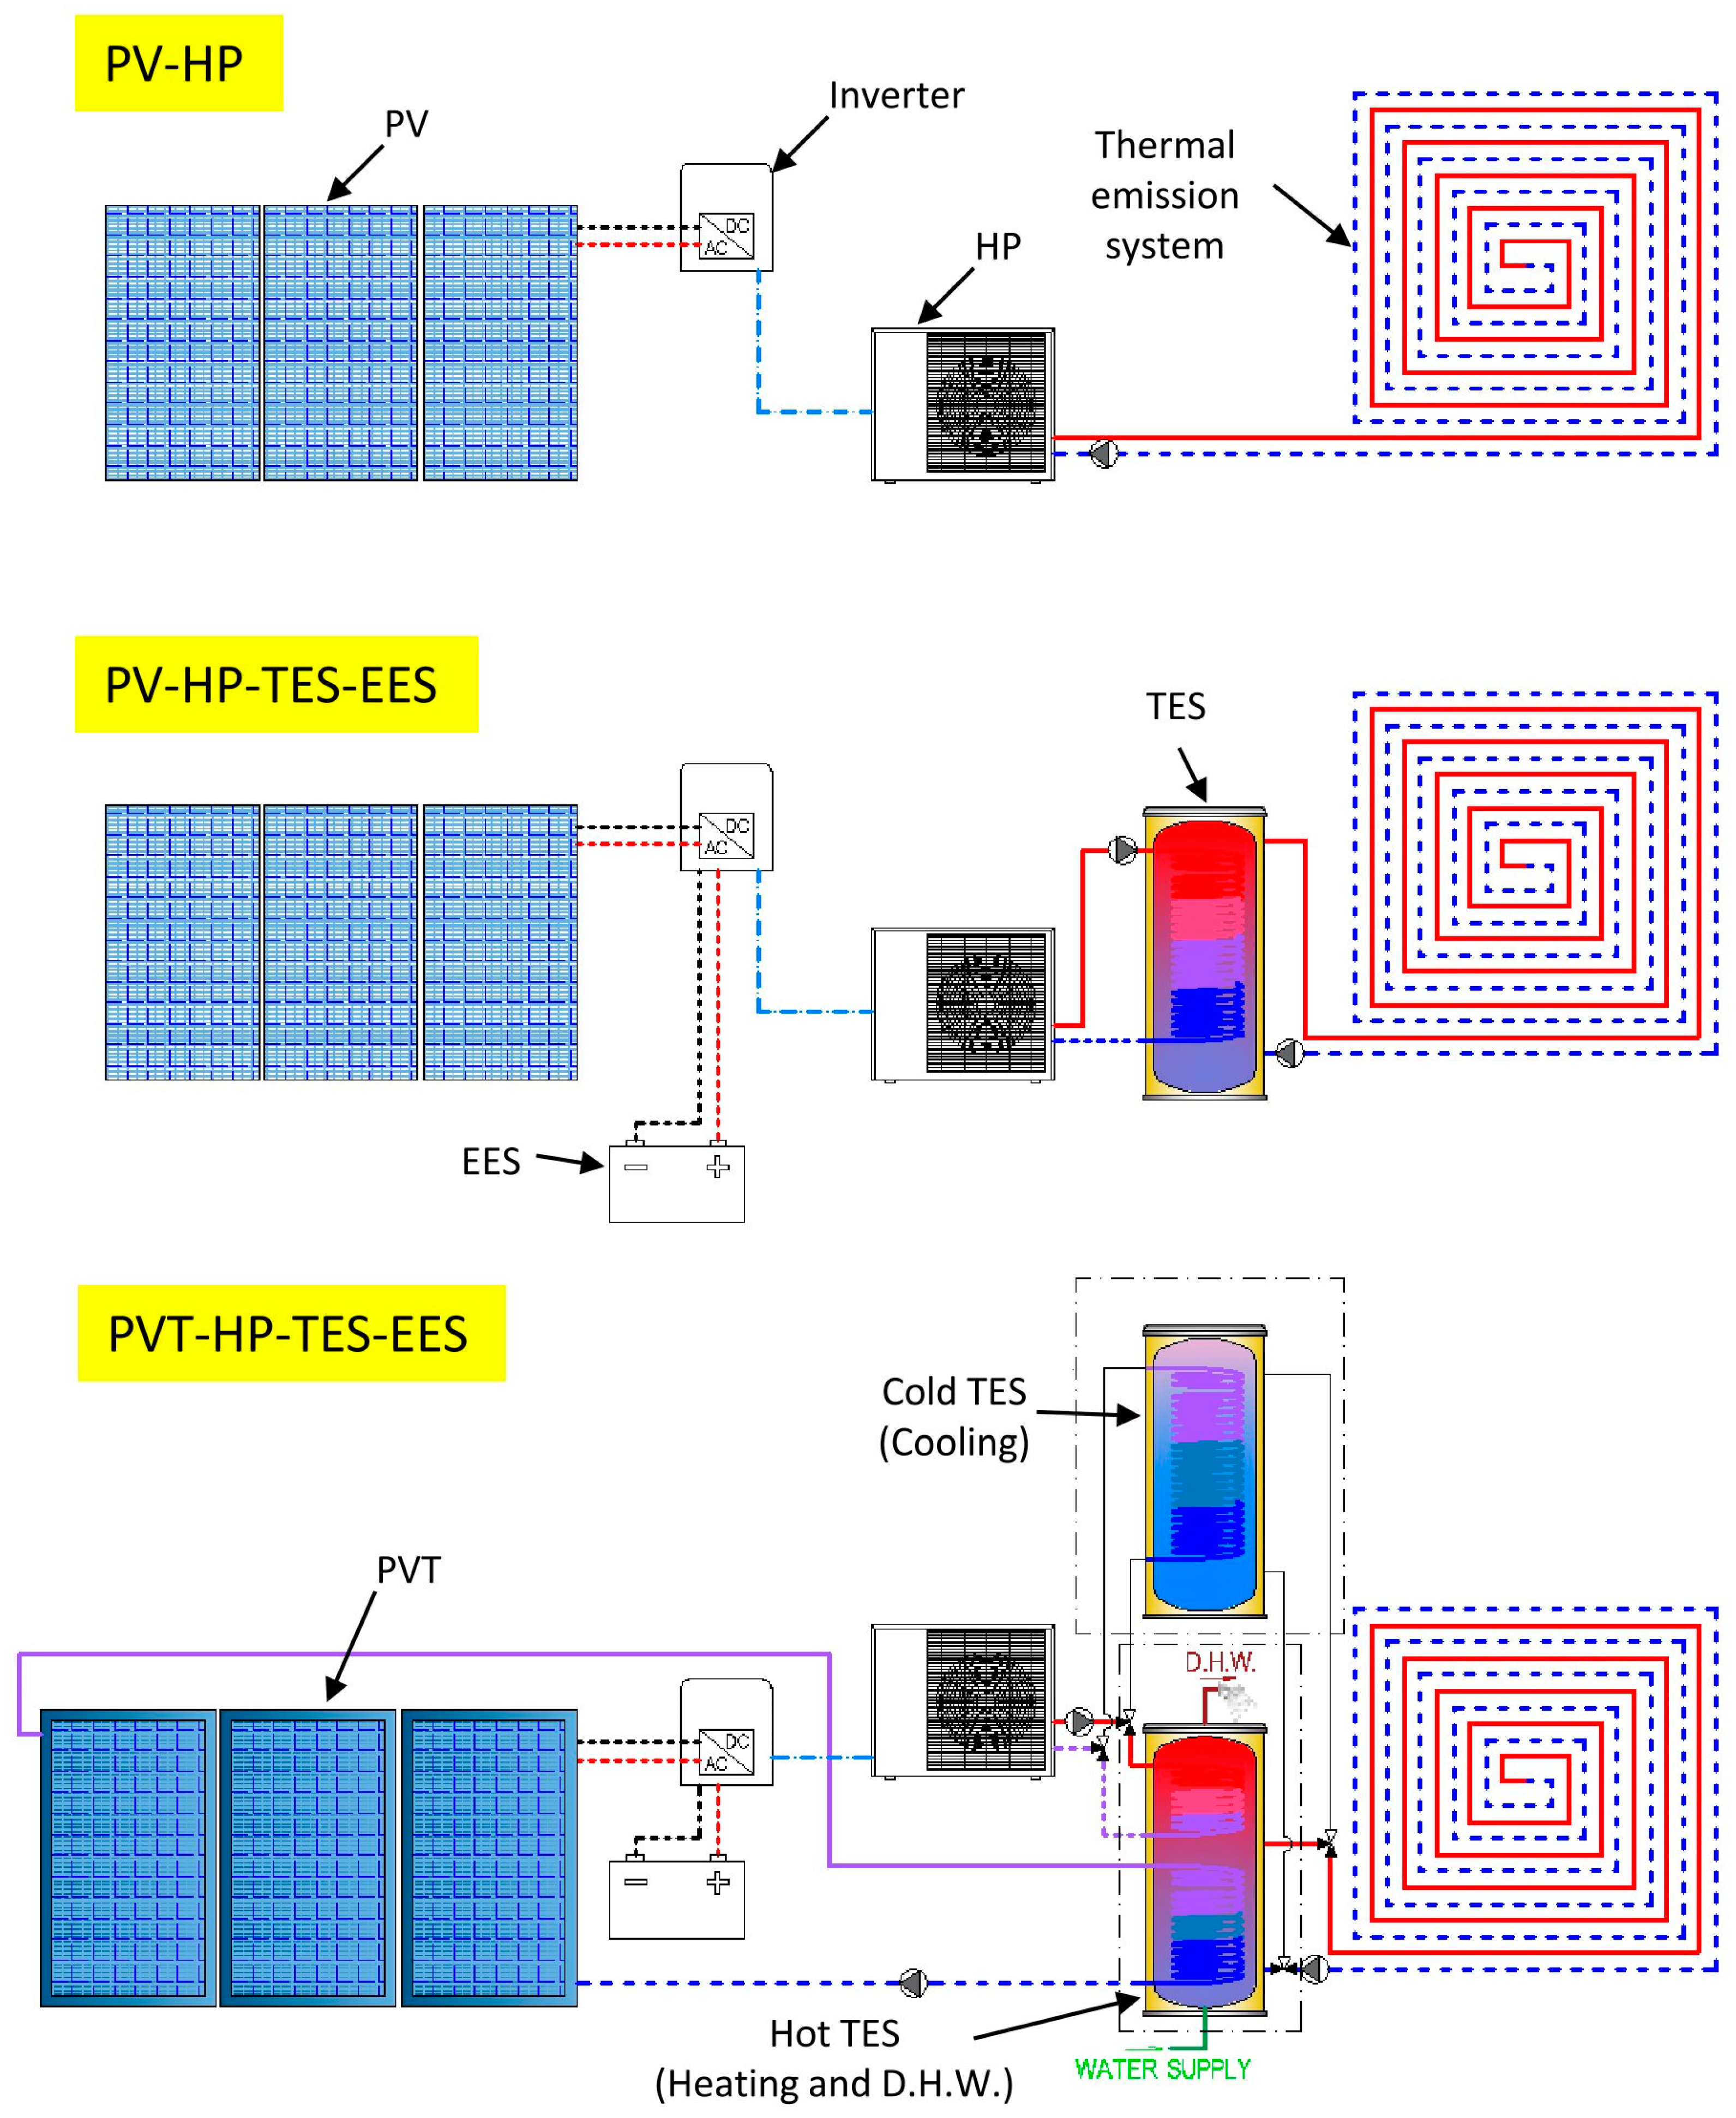
Figure 1 depicts the layouts of the investigated energy systems.
In the baseline configuration (PV–HP), the Heat Pump provides the energy for heating and cooling the building through the radiant floor. Domestic Hot Water (DHW) production is provided by an electric boiler. The PV plant allows the local production of an aliquot of the electrical needs for the building. In the configuration with the storage (PV–HP–TES–EES), once again, the Heat Pump provides the energy for heating and cooling the building through a radiant floor. DHW production is delivered through an electric boiler. Electrical storage (EES) allows the storage of electrical energy in case of a surplus of energy produced by the PV plant. The energy accumulated into the EES is exploited during hours of darkness, reducing the energy transferred from/to the grid. Thermal storage (TES) is used for storing thermal or cooling energy coming from the HP when the produced power exceeds the instantaneous demand and the EES has reached its maximum State of Charge (SoC). In this way, it is possible to obtain the availability of heating or cooling during the hours of darkness, diminishing the electrical energy exchanged from/to the grid.
In the configuration with the PVT and the storages (PVT–HP–TES–EES), the PV plant is replaced with a PVT plant, (i.e., a system that produces simultaneously thermal and electrical energy). The main difference with the other energy systems is the direct production of thermal energy that is stored in the TES and then utilizable for space heating and DHW production. When the heat produced by the PVT plant is not enough to satisfy the heating load, HP provides energy integration. Moreover, during the summer period, the TES is used for storing the cooling energy generated by the HP when the PV plant produces more electricity than the instantaneous demand, and there is a need to store thermal energy for DHW production. The TES is subdivided into two separate modules; one is used for storing thermal and the other for storing cooling energy. The EES operates following the same logic previously described.
The optimization of these energy systems must be managed in such a way as to maximize the self-consumptions of the renewable energy locally produced and achieve the highest self-sufficiency. This means that the energy management system must foresee the storage of thermal energy during periods of overproduction of electricity by the PV plant, with the state of charge of the EES as a constraint.
Considering that in the system configuration with PVT, the TES collects thermal energy both from the PVT and the HP, which have different enthalpy content, it is necessary to consider the consequence of thermal stratification. Thereby, the TES has been simulated through type 534, which allows the setting of the TES as constituted by five stratums of equal volume. The PVT plant transfers heat to the TES through a heat exchanger with the inlet in layer 3 and the outlet in layer 5, while the HP transfers thermal energy to the TES through a second heat exchanger with the inlet in layer 1 and the outlet in layer 3. The water from the network goes into the lowest layer (layer 5) and goes out from the uppermost layer (layer 1) to be used as DHW. The heating circuit uses a third heat exchanger, placed in the central part of the TES, with the outlet in layer 2 and the inlet in layer 4 (return from the heating circuit). Finally, the EES is modeled by types 47 and 48, which, respectively, simulate the battery and regulator/inverter.
2.2. Characterization of the Performance of the Investigated Energy Systems
The characterization of the effectiveness of the above-mentioned energy systems has to take into account not only their mere efficiency but also other meaningful factors, which have been evaluated through a set of Key Performances Indicators (KPIs), introduced in the following.
All KPIs have been calculated in a post-elaboration phase using the results obtained from the TRNSYS simulations.
2.2.1. Demand Coverage Factor (fel)
This parameter expresses the percentage of the energy generated by the PV plant,
Eel,PV, concerning the building’s electric load
Eel,load.
2.2.2. Percentage of Energy Traded to/from the Grid (fel,to grid/fel,from grid)
As the demand coverage factor does not differentiate the energy injected into the grid (
Eel. to grid) and that provided by the grid (
Eel. from grid), other KPIs have been defined to differencing the amount of energy imported and exported concerning the renewable energy produced (
Eel, PV) and the building’s electrical load (
Eel, load).
2.2.3. Self-Consumed Energy (RSC) and Self-Sufficiency (DSS)
RSC quantifies the percentage of the energy auto-consumed (
Eel, self-consumed) concerning the renewable energy produced, (
Eel, PV):
Dss quantifies the percentage of the energy auto-consumed (
Eel, self-consumed) concerning the building’s electrical load (
Eel, load):
2.2.4. Energy Exchange with the Grid (kexchange)
In order to minimize the use of the network, it is of interest to evaluate the ratio among the total energy exchange with the network and the energy needs of the building.
2.3. Economic Analysis
In addition to the comparison of KPIs, it is important to perform an economic comparison based on the possible economic return of the two proposed configurations compared to the baseline. The analysis is based on the comparison between the monetary savings achieved during the life cycle and the increase in costs necessary to realize the proposed plants compared to the baseline configuration, through the estimation of the net present value (NPV).
where
I0 indicates the investment to be supported,
Ry the annual monetary savings,
Rn the residual value, which will be considered equal to 0 EUR,
i the discount rate set at 3%, and
n the life cycle assumed to be 20 years.
The investment I0 to be sustained to modify the “baseline” configuration in the proposed configuration is assumed to be 1.00 EUR/l for the TES 1000 EUR/kWh for the EES and 400 EUR/kWp for the PVT plant.
The
Ry is calculated considering the difference in annual expenditure incurred for electricity (
Cel) between the baseline configuration and the proposed configuration using Equation (12).
with the annual expenditure incurred are the result of the difference between the cost of purchasing energy from the grid and the revenue obtained by selling electricity to the grid.
Prpurchase is set at 0.39 EUR/kWh, the result of the average of the tariffs detected in the last year by the Italian regulatory authority for energy, networks, and the environment (ARERA), considering both the free and protected market conditions [
41], while the
Prselleing of energy from photovoltaic systems is set at 0.0464 EUR/kWh [
42].
3. Case Study
The effectiveness of an energy system constituted by a PVT plant, a vapor compression HP, and thermal and electrical accumulation has been investigated through dynamic simulations considering the weather data of Catania [
43], which is characterized by 833 heating degree days and 1632 kWh/m
2 of annual horizontal solar radiation. The analyses were carried out using, as a reference, a two-story single-family building with a net floor area of 70.0 m
2 and a ratio of dispersing surface (S) over a heated/cooled volume (V) of 0.59. The glazed surfaces facing north and south have a Wall Window Ratio (WWR) of 0.036 and 0.143, while those facing east and west have a WWR of 0.076. The roof has two pitches with a tilt of 45°, one facing south of 28.4 m
2 and the other facing north of 58.8 m
2. The features of the building envelope were chosen according to those used in IEA SHC Task44 [
44]. The thermal physical properties of the walls, roof, and windows are shown in
Table 1.
The numerical analyses have been carried out for the heating (1 October to 30 April) and cooling season (1 June to 30 September), based on a set point temperature (i.e., a reference point for controlling the heating/cooling system in the building) of 20.0 °C and 26.0 °C, respectively.
The artificial lighting is activated when horizontal solar irradiation falls below 100 W/m
2, and the related consumption has been set to 2.5 W/m
2 of floor area. Energy gains of 75.0, sensible heat, and 55.0 W latent heat per person have been set. In agreement with the UNITS11300-2 Italian norm, the domestic hot water (DHW) is set to 200 L/day, with a standard daily profile (EN 15316:2007 [
45]). The daily electricity demand refers to common household appliances and the electric consumption due to the air conditioning [
46].
An electrically powered vapor compression heat pump with nominal power of 9.5 kW is used for the building heating and cooling. The coefficient of performance for the heating service, COPH, was set to 4.59, while for the cooling service, COPC was set to 3.79.
The pitched roof (tilt angle of 45°) facing south hosts a solar plant, constituted by a PV (baseline configuration) or PVT (advanced configuration) plant depending on the scenario evaluated, with a peak power of 4.8 kW. The PV plant consists of sixteen mono-crystalline (c-Si) PV panels with a module efficiency of 18.4% and power of 300 W at Standard Test Conditions (STCs). The PVT system consists of 19 unglazed WISC PVT collectors with a power of 250 W at STC and electrical efficiency of 15.4%, optical efficiency of 55.0%, and heat loss coefficient of 15.76 W/(Km
2). The reliance on the electrical efficiency by temperatures has been considered through the temperature coefficient (β), which is 0.40 and 0.44% for the PV and PVT modules, respectively. The energy model of the PVT collectors was previously validated [
24] using experimental observation carried out from the pilot PVT plant installed at the University of Catania [
47].
The TES and EES capacities are 1500 L and 5 kWh, respectively, which correspond to a ratio of about 1 kWh/kW per installed PV peak power and 150 L/kW of HP power. These capacities are following the analyses performed in the literature studies [
39].
The energy needs of the reference building have been determined as primary energy (
PE), considering thermal energy as primary energy, while electrical energy is converted into primary energy through the Primary Energy Factors (
ηpower), which assumes different values in each country as a function of the energetic mix and in this case (Italy) it is equal to 0.51 [
48].
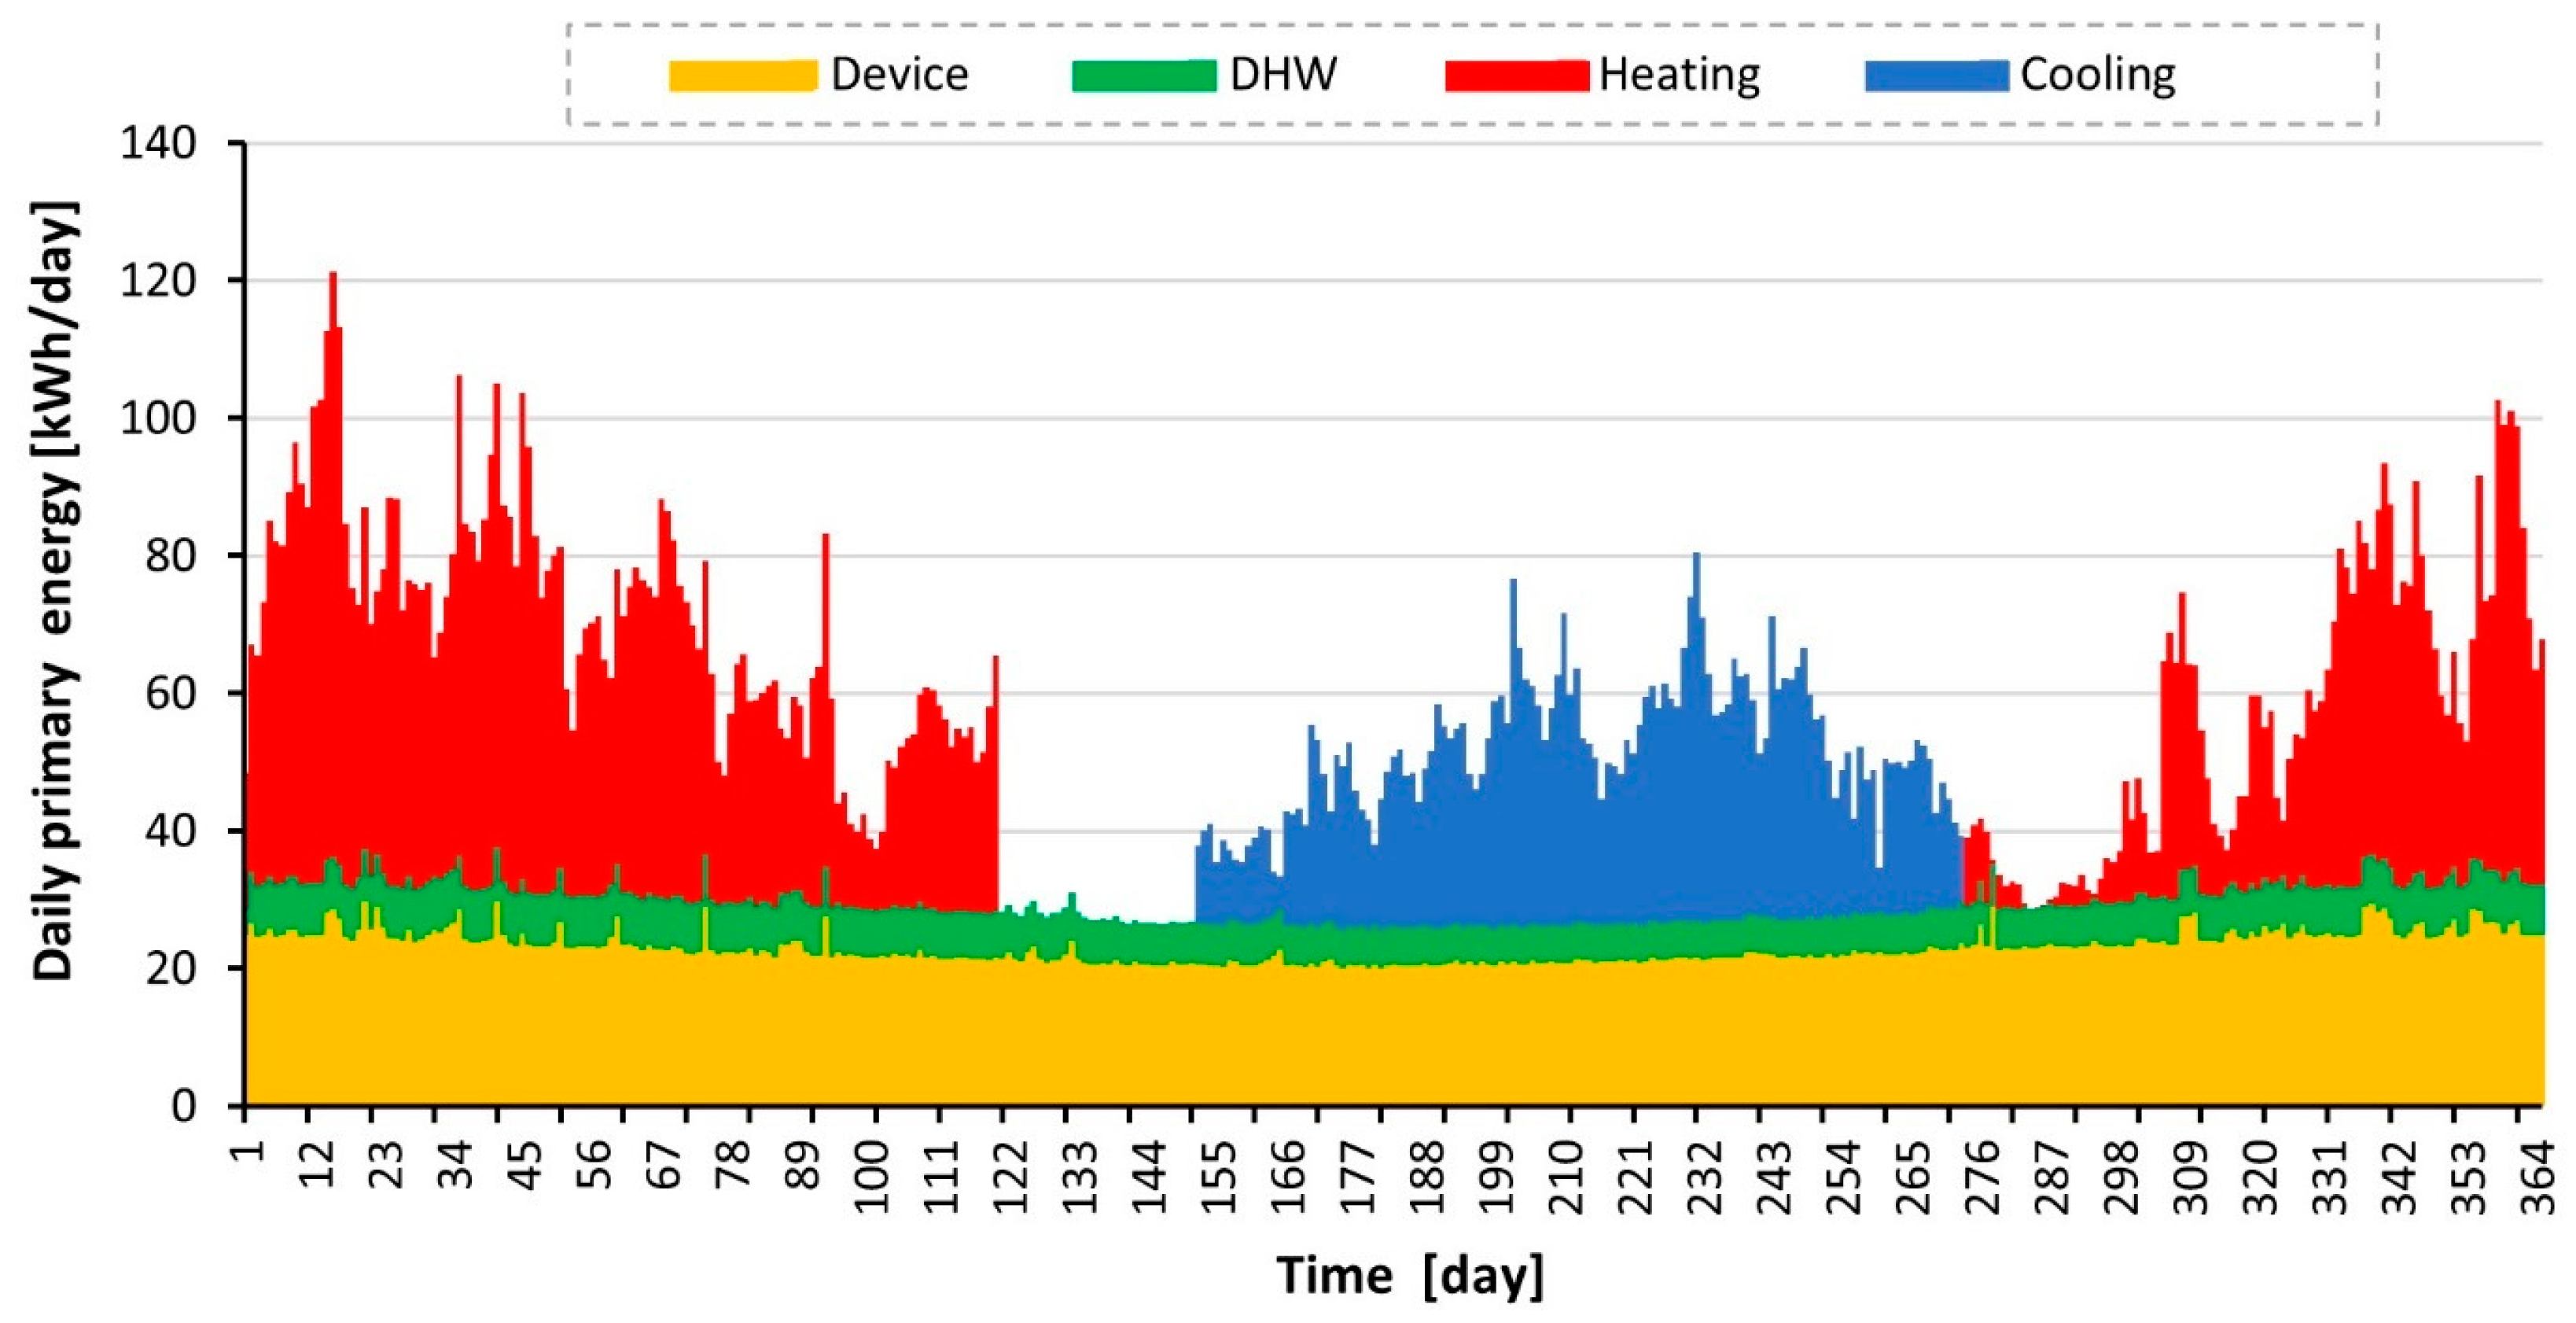
Figure 2 shows the daily
PE demand for households’ electrical devices (yellow area), DHW (green area), heating (red area), and cooling needs (blue area).
These results evidence a primary energy demand of 7012 kWh for building heating, 3066 kWh for cooling, and 2400 kWh for DHW production. The energy demand for electrical appliances is 4280 kWh, which, transformed into PE, corresponds to 8392 kWh. The maximum heating load is 7.5 kW for heating and 6.1 kW for cooling loads.
4. Results
This section presents the energy performance achievable by three different energy generation systems (EGS) analyzed. In the baseline configuration (PV–HP) the EGS is constituted by an electrical HP, which is used to heat and cool the building, and a PV plant with a peak power of 4.8 kWp. This baseline configuration is improved by adding thermal and electrical storage, so in this configuration, the EGS is labeled as PV–HP–TES–EES. Finally, the third configuration is characterized by using hybrid PVT collectors instead of PV modules, so in this configuration, the EGS is labeled as PVT–HP–TES–EES. For all the scenarios mentioned above, the electrical energy consumption of the EGSs has been calculated. It is important to note that domestic hot water (DHW) production is supplied through an electric boiler.
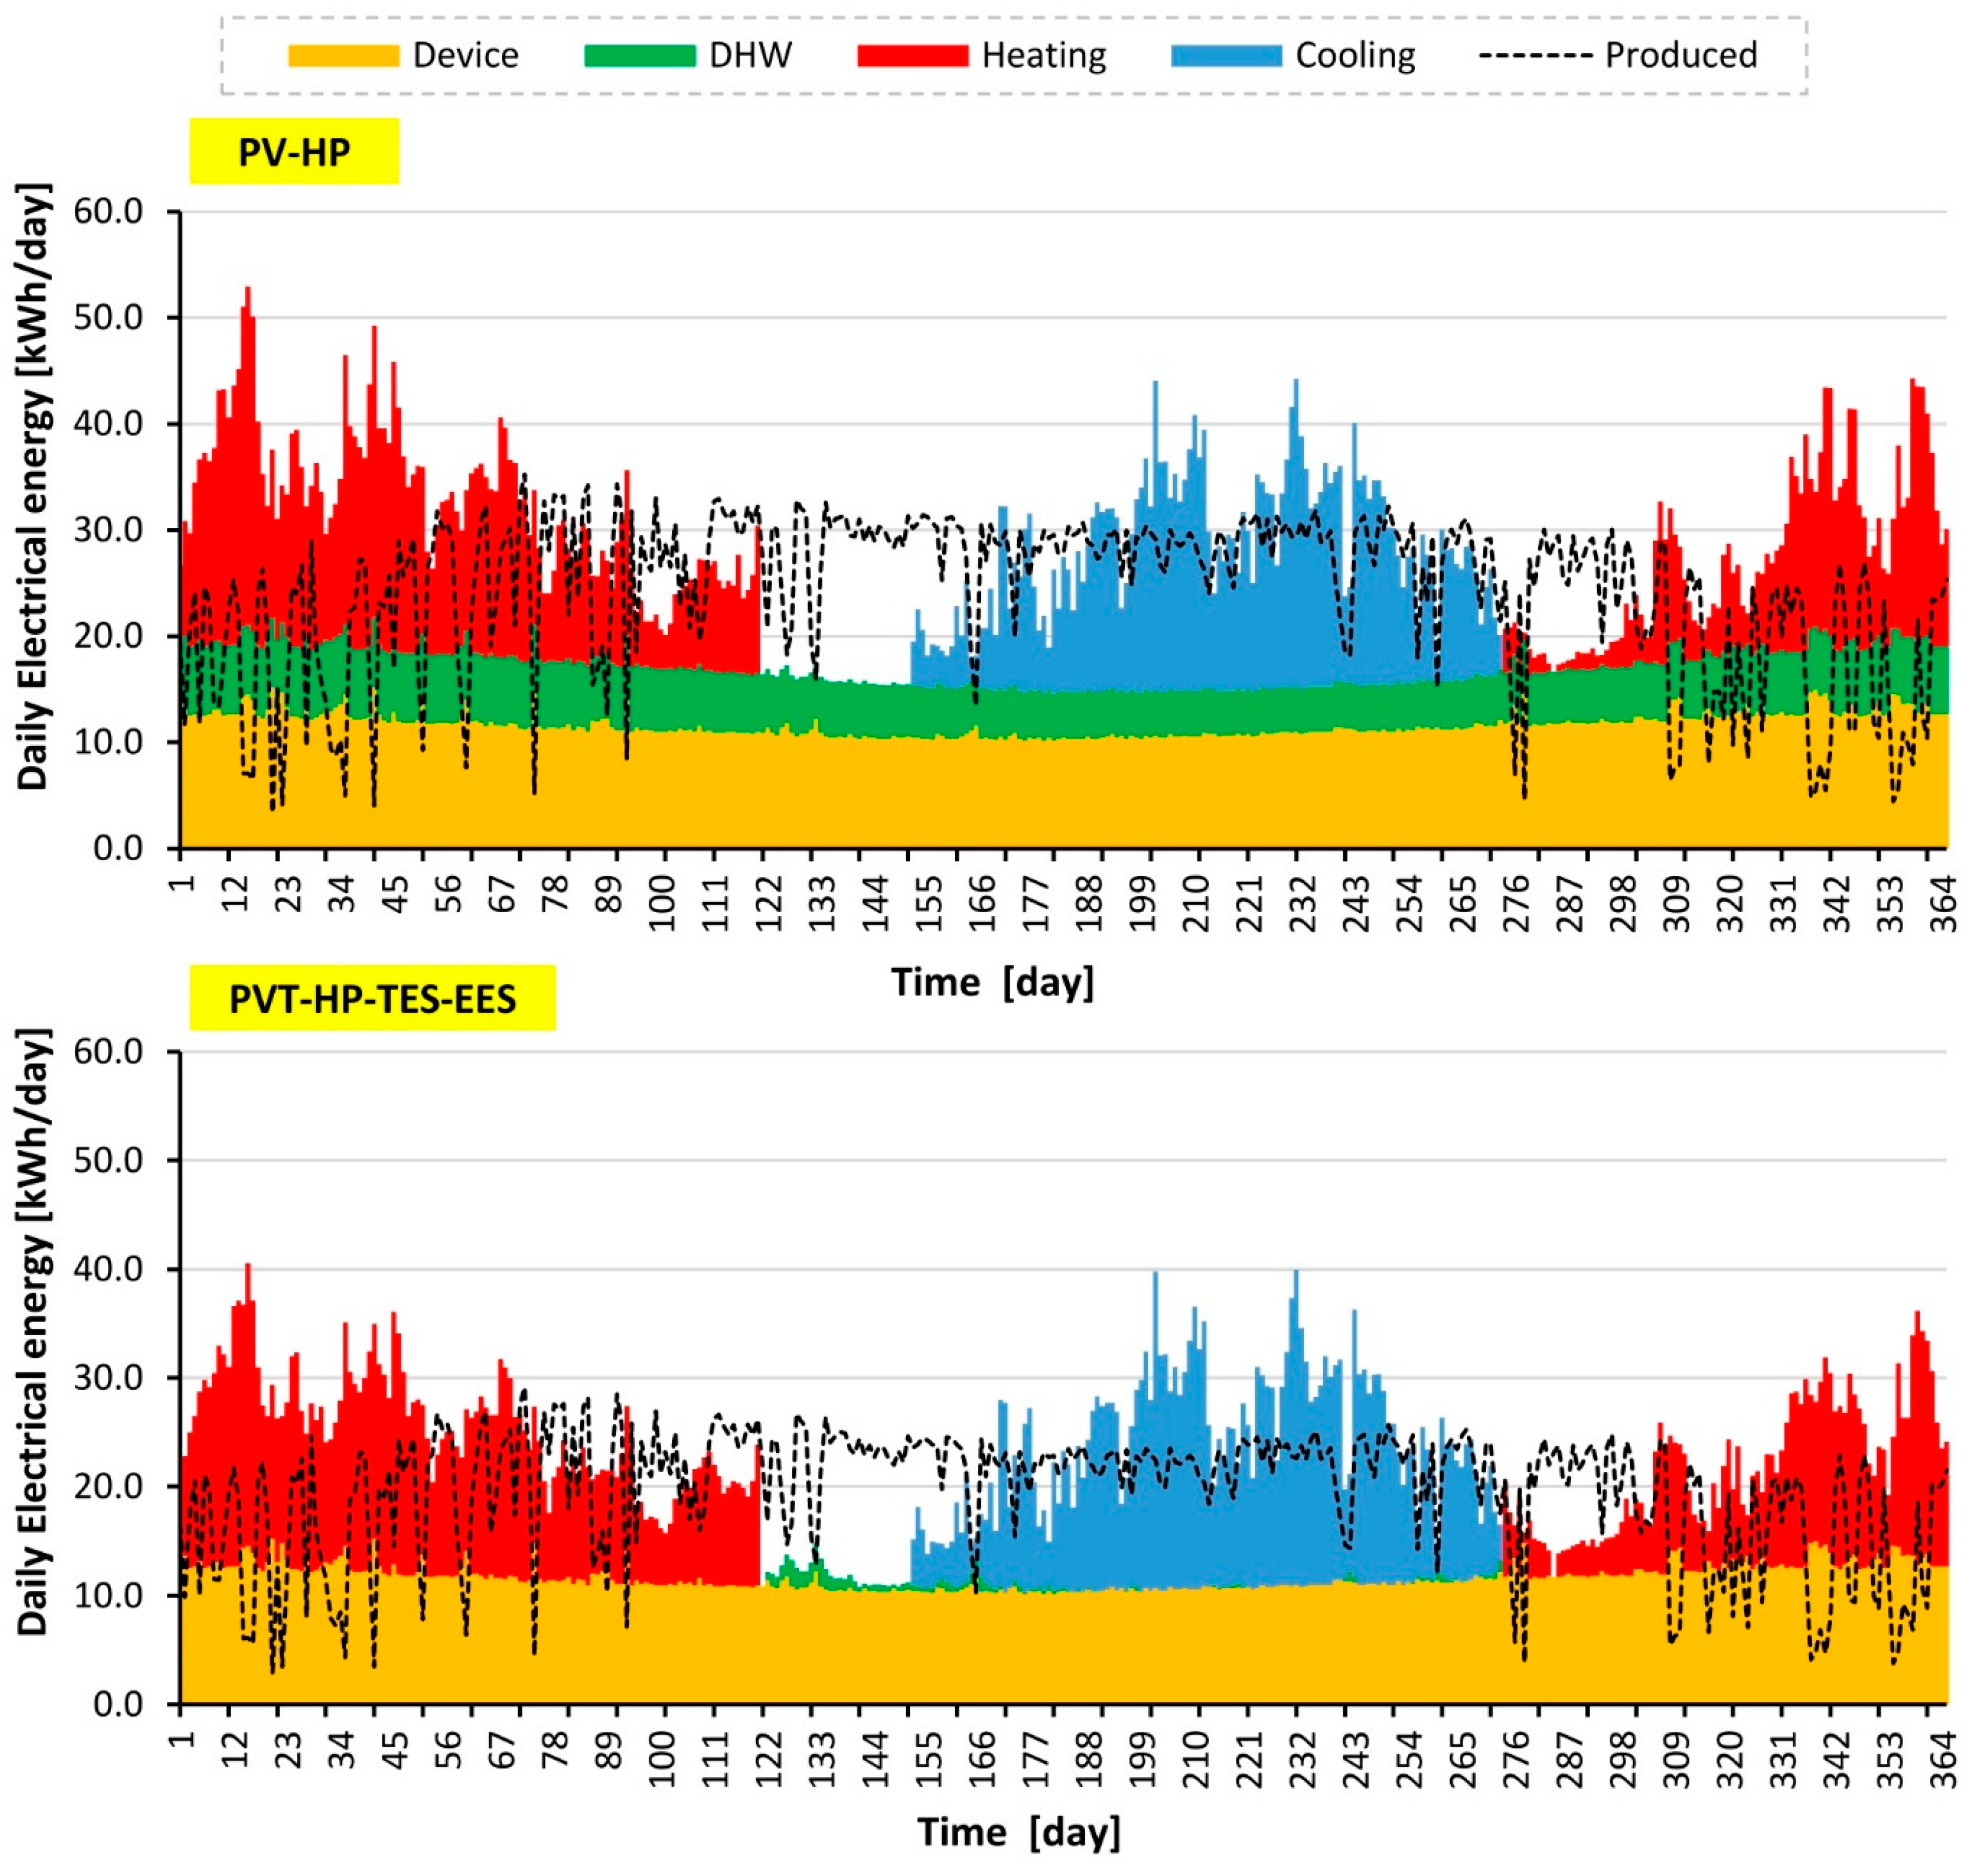
Figure 3 shows the daily electrical loads (kWh/day) distinguished for households’ electrical devices (yellow area), DHW productions (green area), heating (red area), and cooling (blue area). The black dotted line points out the renewable power from the PV or PVT plant. The baseline configuration (PV–HP) gives rise to an electrical load of 10,828 kWh/year (77.3 kWh/m
2) of which 2400 kWh is for DHW production (about 22%), 2437 kWh (about 22.5%) is for space heating, 1632 kWh (about 15.1%) is for space cooling, and 4359 kWh (40.4%) is for lighting and the others electrical devices. The PV plant generates 8855 kWh/year, almost guaranteeing the total building’s electrical load (
fel = 81.8%). The self-consumption (
RSC) and self-sufficiency (
DSS) achieved are 34.1 and 27.9%. The disappointing results stem from the significant gap between energy demand and renewable energy generation.
The configuration with the PV plant and the two storages achieves a modest decrease in the electrical load to 10,250 kWh/y, determined by a drop in the Heat Pump’s consumption. Indeed, the HP is also set on periods characterized by good weather, so the excess heat generated is stored in the TES. In this way, the HP can operate with high COP and thus reduce its energy consumption. The most interesting benefit is the meaningful improvement in RSC and DSS, which increased to 69.4 and 59.9%.
The configuration with the PVT plant and the two storages is characterized by a meaningful reduction in the electrical load to 7919 kWh/year, about 25%. This reduction results from the energy supplied by the PVT plant for space heating and domestic hot water production. The energy needs for space heating and DHW decrease to 2569 kWh/year, i.e., almost half of the energy consumption demanded under the two other energy system configurations. As a counterpoint, the electric efficiency of the PVT plant diminishes because of the higher PV cell temperatures during wintertime when the PVT collectors operate at a temperature of 40 °C. The electricity generated diminished to 7150 kWh/year, about 19.2%. This result demonstrates the fundamental importance of the correct evaluation of the efficiency of PVT collectors as a function of the operating temperatures. However, the loss in electrical production is thoroughly retrieved by the reduction in the electrical needs; indeed, the PVT configuration allows it to cover about 90.3% of the total electrical load, (fel). Moreover, this system configuration allows us to attain a huge improvement in the RSC to 96.2% and DSS to 86.9%, respectively.
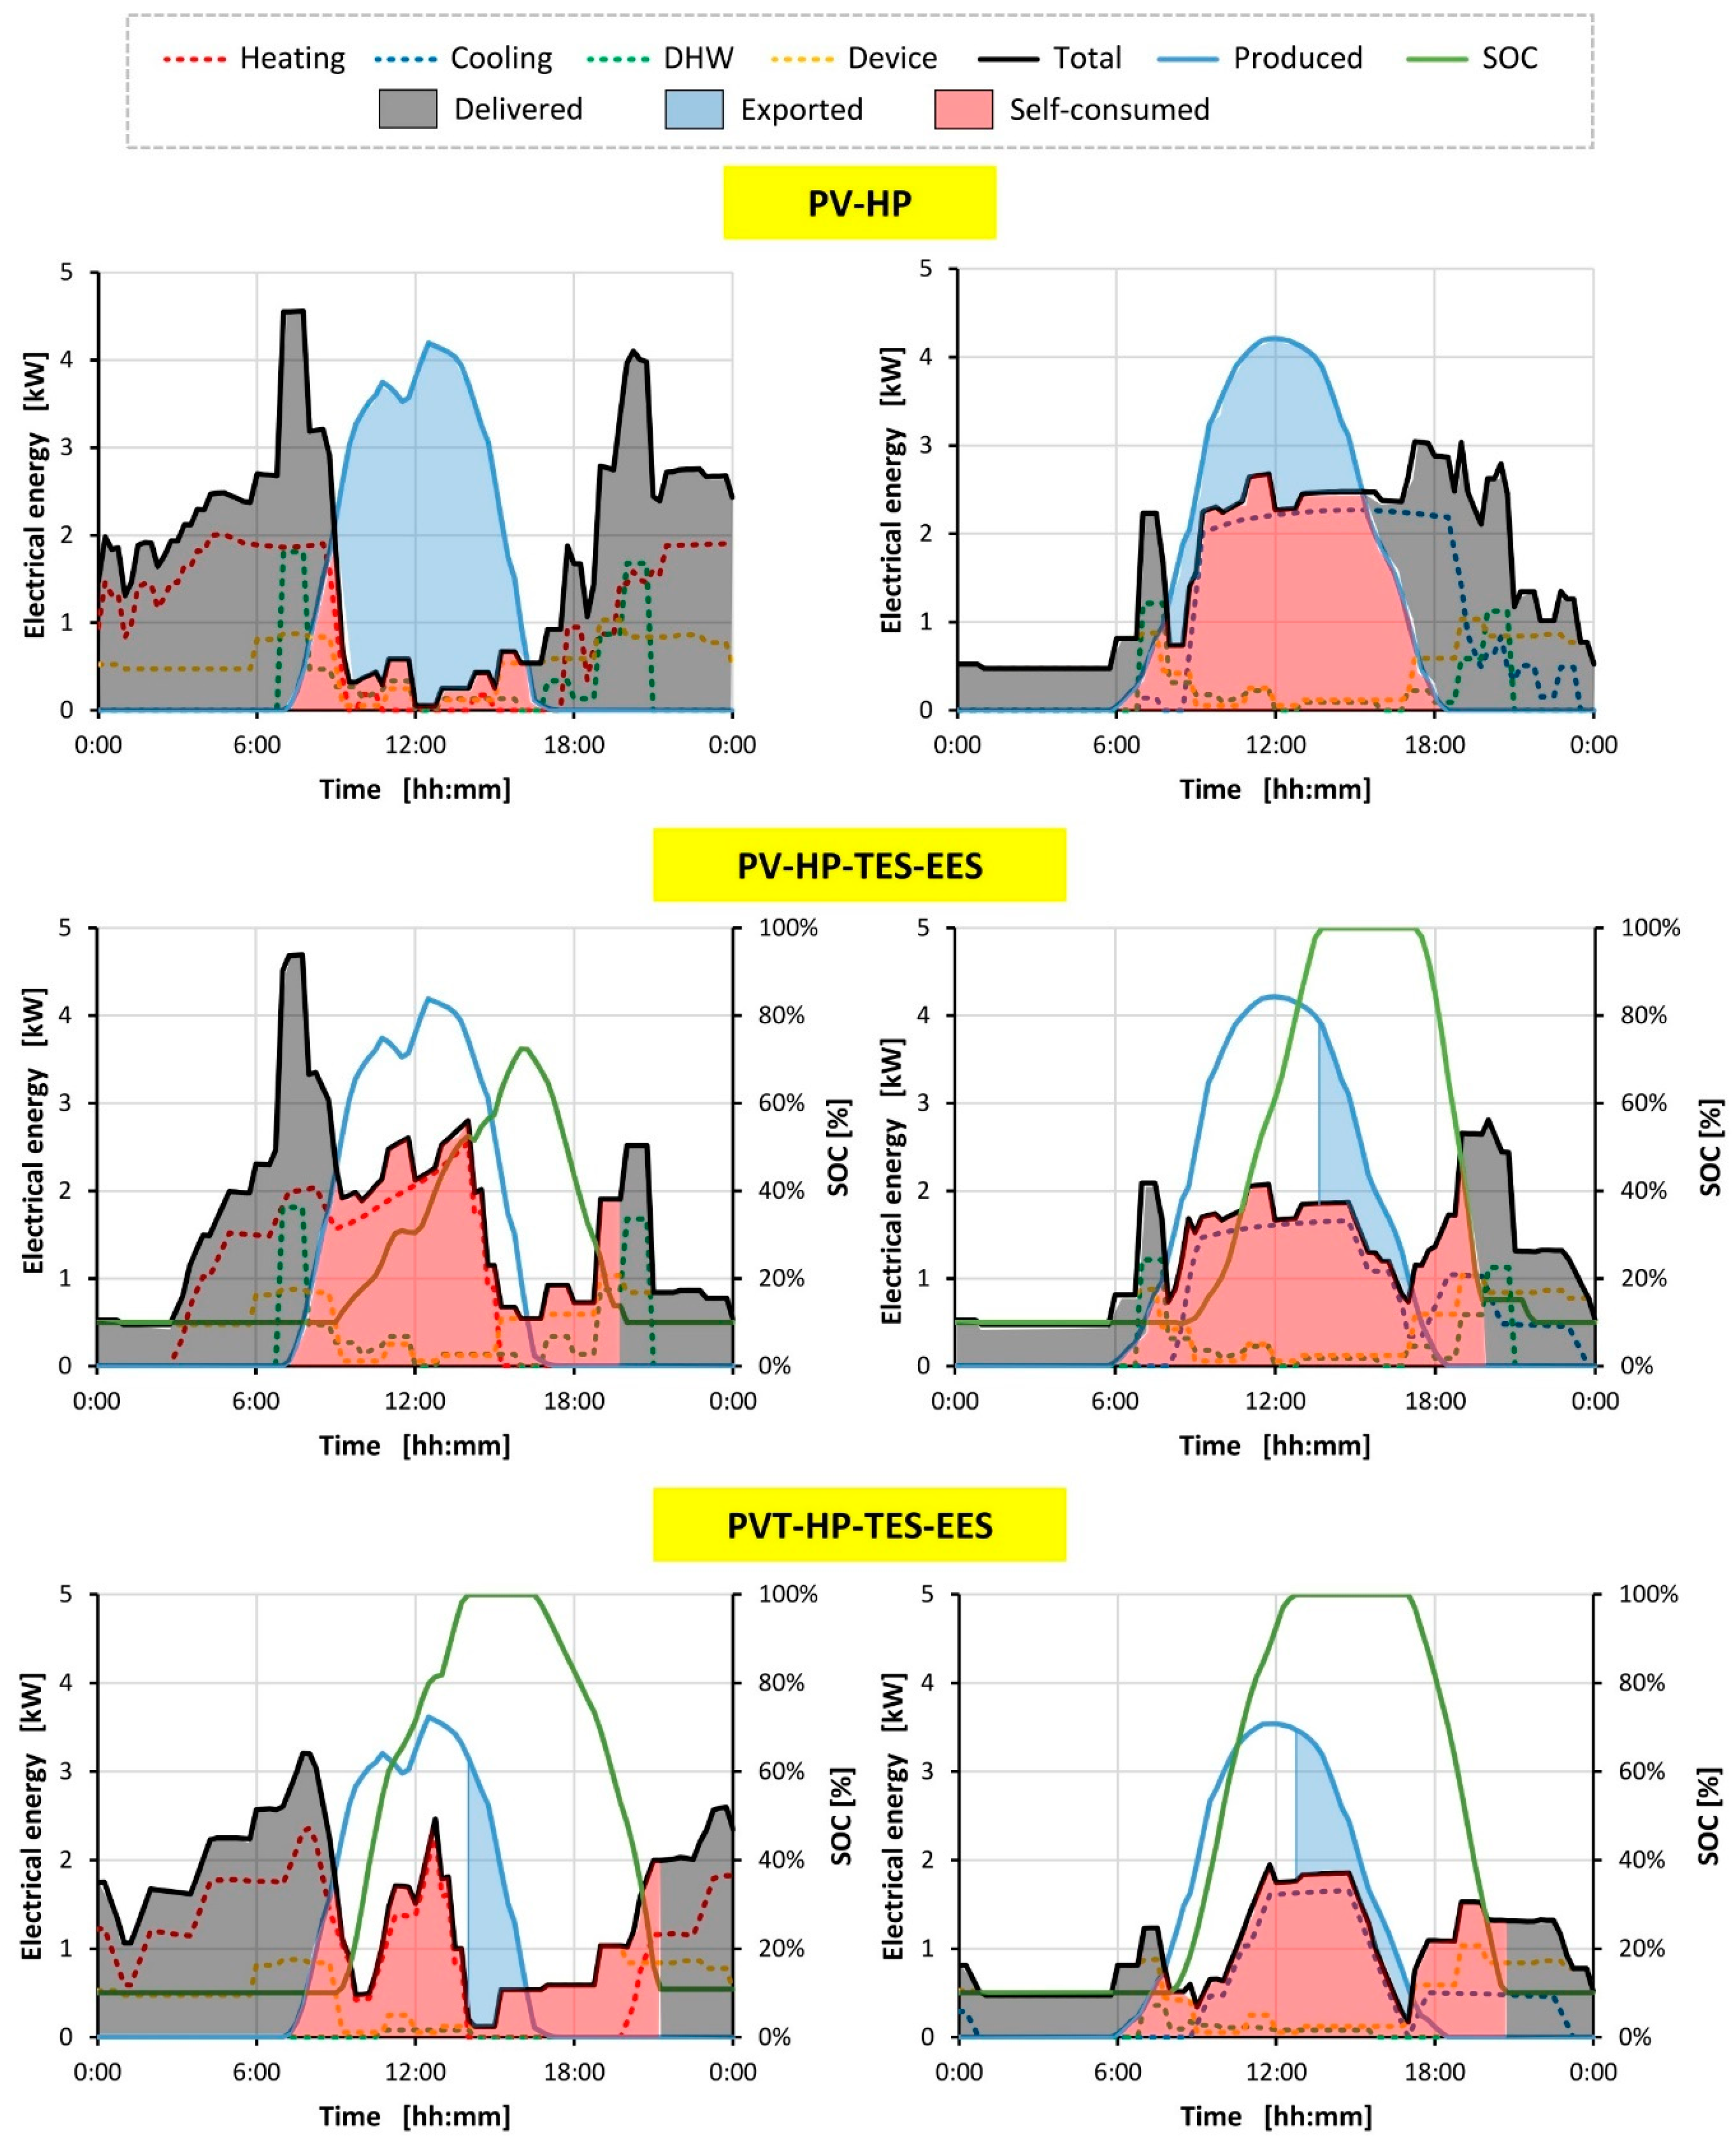
Further interesting considerations can be obtained from observing the daily variation in the energy demand. For two representative days of winter and summer days,
Figure 4 shows the heating (dotted red line), cooling (dotted blue line), DHW demand (dotted green line), the consumption of the electrical devices (dotted yellow line), and the total consumption (black line). In this figure, the photovoltaic energy produced (blue line), the energy self-consumed (red dashed lines), delivered, and taken into/from the grid (blue/black dashed lines), and the State of Charge (SoC) of the EES (green line) are also depicted.
For the baseline configuration, during the winter day, the energy fluxes are characterized by a strong mismatch between the energy needs and the power produced by the PV plant. Consequently, a very low self-consumption and a disproportionate electricity exchange, imported + exported, with the grid occur. During the summer day, the self-consumption increases as most of the cooling load occurs during the hours of daylight. However, a meaningful overproduction of electricity, as well as the need to draw electricity from the grid, occurs.
For the PV–HP–TES–EES, almost the whole self-consumption of the energy produced from the PV is achieved both during the winter and the summer days. Therefore, twofold advantages are accomplished: the decrease in the energy fluxes from/to the grid and the peak of demand in the late afternoon. These operating conditions contribute to maintaining the stability of the grid [
38].
The PVT–HP–TES–EES configuration achieved a significant reduction in the peaks of the electricity demand, diminishing from almost 5.0 kW required under the other system configurations to about 3.0 kW. Moreover, the evening peak is shifted after 11:00 p.m., safeguarding the stability of the grid in one of the most critical periods, i.e., around sunset hours. During the summer season, the electricity peaks disappear, with the maximum withdrawals of 1.5 kW. The limited electricity overproduction that occurs could be better managed by foreseeing its conversion into thermal energy through the Heat Pump. A further interesting application for this configuration is represented by the possibility of providing ancillary or demand response services. In
Table 2, the summary of the Key Performance Indicators determined for the examined energy system’s configuration is presented.
These results highlight that the system configuration with the two storages (TES+EES) has a total energy consumption less than the baseline configuration when the energy storages are introduced. This is obtained by applying a smart logic management of the system [
39], which consists of storing heat during periods of overproduction by the PV. This logic allows the exploitation of the highest COP of the HP, since usually, the overproduction happens close to midday when the external temperatures are the highest of the day. The system configurations with the storage increase the coverage factor (
fel) from 81.8 in the baseline to 86.4% with the PV plant and 90.3% with the PVT plant. It should be emphasized that the electricity overproduced does not have the same “quality” as the self-consumed energy; indeed, the price of the electrical energy delivered by the user is different from the price of the electricity drawn by the grid. Therefore, it is crucial to evaluate the net consumption from the grid (electricity withdrawn), given by the total electricity consumption minus the self-consumed energy, which is drastically reduced using the two storages and further reduced when a PVT plant is used.
The energy traded from/to the grid, expressed as a percentage of the total electrical load, is 72.1/53.9% in the case of the baseline configuration (PV–HP), which corresponds to a grid usage coefficient (kexchange) of 1.26. This result is very unsatisfactory; indeed, a building free of PV plant has a kexchange of 1.00 (i.e., all the electricity is imported from the grid). Although the baseline configuration (PV–HP) reduces grid electricity usage, it increases overall energy exchange due to surplus electricity not being consumed but fed back into the grid. The use of the storage in the configuration with the PV reduces the energy imported/exported to 43.4/16.4%, as well as the kexchange to 0.57, thus drastically limiting the energy flux with the grid. In the configuration with the storage and PVT plan, a further reduction in the energy imported/exported to 33.5/17.3% is obtained, with a kexchange of just 0.51. It has to be underlined that for this configuration, the grid usage coefficient has been calculated considering the energy needs of the baseline configuration.
Another important factor concerns the economic sustainability of the investment. In fact, the PV–HP–EES–TES configuration allows a Ry of 1119 EUR/y compared to the baseline configuration, while the PVT–HP–TES–EES configuration allows a monetary saving of 1449 EUR/y, thanks to the reduced amount of energy drawn from the grid.
With regard to the NPV on the entire useful life of the system (20 years) this is EUR 5895 and EUR 6127, respectively, for the PV–HP–TES–EES and PVT–HP–TES–EES, once again underlining the convenience of the proposed system, which depends above all on the high quantity of energy produced and self-consumed.
These results evidence the important contribution that the investigated multi-generation energy systems permit to effectively achieve the objective of decarbonized net-zero energy buildings using already available apparatuses that could be easily implemented in both new and existing buildings.
5. Conclusions
This study has evaluated the ability of multi-energy systems equipped with renewable energy plants to achieve a high rate of building energy self-consumption and self-sufficiency. In particular, three different configurations were investigated: the most simple is constituted by just a PV plant and a Heat Pump with no storage (PV–HP), the second is equipped with thermal and electrical storage (PV–HP–TES–EES), and the third uses a PVT instead of a PV plant (PVT–HP–TES–EES). To this aim, the energy needs for space heating, cooling, DHW production, lighting, and electrical appliances have been determined for a single-family building.
The PV–HP configuration has shown greater energy consumption (10,828 kWh/y) as well a greater mismatch between the energy demand and generation, as confirmed by the lowest self-consumption rate (RSC) of 34.1% and degree of self-sufficiency (DSS) of 27.9%.
The PV–HP–TES–EES slightly reduces the energy demand (10,828 kWh/y), while achieving a significant increase in RSC and DSS to 69.4 and 59.9%, respectively.
The configuration PVT–HP–TES–EES achieved better performance, reducing the electricity demand by about 25% compared to the other energy system configurations. Also, it attains impressive results for RSC and DSS of 96.2 and 86.9%, respectively. The increased self-consumption generates a strong reduction in the energy drawn from the grid, passing from 7810 kWh/y in the baseline configuration to 3623 kWh/y, i.e., a 53.6% decrease. A further advantage of the proposed plant consists of the reduction in withdrawal peaks from the grid, which are frequently harmful to the stability of the national electricity grid. Focusing on the daily energy fluxes, it has been seen that the use of PVT reduces peak demand by almost 2.0 kW and shifts the peak demand outside the periods when the electricity grid is most vulnerable. Finally, the grid usage coefficient (kexchange) is reduced from 1.26 to 0.57 for the configuration PV–HP–TES–EES, reaching the value of 0.51 for the PVT–HP–TES–EES configuration. Diminishing the exchange with the electrical network is another crucial aspect of the energy transition, as limits the need for refurbishment of the grid and the concerning investment.
Finally, the economics analysis showed that both configurations allow for annual economic savings between 1119 to 1449 EUR/y compared to the baseline configuration, which leads to a lifetime NPV of 5895 EUR and 6127 EUR, respectively, for the PV–HP–TES–EES and PVT–HP–TES–EES.
The results of this study have evidenced the central contribution of the investigated multi-generation energy systems to achieve the objective of decarbonized net-zero energy buildings as almost the entire energy demand is not only auto-produced but also self-consumed. It is worth underlying as good thermal insulation of the building envelope and the exploitation of passive heating and cooling strategies are fundamental for reducing the building energy demand as much as possible. Another interesting characteristic of the proposed energy system is its simplicity; indeed, all the components (i.e., heat pump, PVT solar collectors, electrical and thermal storage) are not prototypes but apparatuses available on the market, and they could be also easily installed in both new and existing buildings.
However, it is imperative to investigate the performance of the proposed system considering different climate conditions, within cold regions, to confirm the effectiveness of these energy systems in attaining the energy self-sufficiency of residential buildings.


