Article

Energy Benefits of PV-Integrated Dynamic Overhangs for Residential Buildings in Qatar

1
Civil, Environmental, and Architectural Engineering Department, University of Colorado, Boulder, CO 80309, USA
2
Department of Civil and Environmental Engineering, College of Engineering, Qatar University, Doha 2713, Qatar
3
Department of Electrical Engineering, College of Engineering, Qatar University, Doha 2713, Qatar
4
Department of Mechanical and Industrial Engineering, Qatar University, Doha 2713, Qatar
*
Author to whom correspondence should be addressed.
Energies 2025, 18(5), 1156; https://doi.org/10.3390/en18051156
Submission received: 22 January 2025 / Revised: 16 February 2025 / Accepted: 17 February 2025 / Published: 26 February 2025
(This article belongs to the Section G: Energy and Buildings)

Abstract

:
This paper summarizes the potential energy efficiency benefits of PV-integrated dynamic overhangs for housing units in Qatar. Specifically, the technology combines two energy benefits of shading effects of reducing air conditioning loads and generating on-site electricity generation. The analysis is performed for a prototypical dwelling unit in Doha, Qatar. Three adjustment frequencies for the positions of the PV-integrated dynamic overhangs are evaluated, including hourly, daily, and monthly. It is found that optimally operated PV-integrated overhangs can substantially reduce the annual electricity needs of the dwelling unit. For instance, southern-oriented PV-integrated dynamic overhangs can lower the annual net energy requirements for the dwelling unit by 69.7% relative to the case with no shading and by 32.2% relative to the case of deploying PV-integrated static overhangs. Higher energy use reductions can be achieved when the overhang depth and window size are increased and when more energy-efficient glazing types are installed.
Keywords:
overhang; dynamic; PV

1. Introduction

The building sector is responsible for a significant portion of the electricity consumed in Qatar [1]. Indeed, buildings account for 58% of the total electricity consumption in Qatar, double the contribution associated with the industry sector [1]. Residential buildings account for over 60% of the electricity consumed by the entire building sector in Qatar [2]. Due to the extremely hot climate of Qatar, air conditioning is the main electricity end-use for Qatari buildings. It is estimated that over 70% of the annual electricity consumed by a prototypical villa in Doha is associated with space cooling [2]. Therefore, any program with the aim to improve energy efficiency of the building sector in Qatar must prioritize measures that reduce thermal cooling loads. These measures can include traditional options, such as adding thermal insulation and installing energy-efficient air conditioners, but should also consider passive strategies that can often be more effective, as well as easier and cheaper to implement, especially for existing buildings. An effective passive strategy that reduces building cooling thermal load, especially in hot climates, is the installation of exterior shading devices. Indeed, windows are among the weakest thermal elements of the building envelope, as they are often the main sources of unwanted heat transmissions and solar heat gains that increase cooling thermal loads. It is estimated that 12% of the total primary energy used by the existing U.S. building stocks are attributed to windows [3].
To better control solar heat gains, shading systems can be deployed for fenestrated facades. Exterior shading devices are particularly more effective than interior shading systems to reduce solar heat gains through windows of buildings located in hot climates. However, when exterior shading systems are static, their benefits vary significantly with the season. Indeed, while static shades lower solar heat gains and therefore thermal cooling loads during the summer period, they often result in higher thermal heating needs during the winter period [4,5,6,7]. Thus, there is an increasing interest for the deployment of dynamic shading systems with optical properties that can be easily adjusted and modulated throughout the year [8,9,10,11,12]. The energy benefits of dynamic exterior shades are often challenging to estimate due to the difficulties in accurately modeling their effects. For instance, the available solar radiation levels were adjusted within the weather file to model the impacts of dynamic shading devices to estimate their potential impacts on the energy needs of an office building in New York City, NY [8]. This indirect modeling approach estimated that the deployment of dynamic shades can lower by 38% and 18% the annual energy demand of the office building for, respectively, hourly and monthly adjustments. Moreover, a modeling-based analysis of an adjustable shading louvered façade has estimated that up to 16% of the annual energy use can be reduced relative to the case of a no-overhang design for an office building located in a cold climate [9]. A shading system made up of adjustable louvers is found to reduce up to 34% the annual energy needs for an office space in a hot climate [10]. Dynamic shades consisting of rotating overhangs were found to reduce by 9.5% the annual heating and cooling energy requirements for a residential building in Chicago, IL [11].
The integration of PV systems with exterior shading devices has been evaluated in several case studies [12,13,14,15,16,17]. However, most of the reported analyses consider PV integration with static shading systems. For instance, integrating PV arrays into static overhangs for windows of an office space located in Hong Kong was found to maximize PV electricity generation when their tilt angle was set to 30° and to minimize the air conditioning energy demand when their tilt angle was 20° [17]. A rather limited number of studies have evaluated the energy performance of dynamic and movable PV-integrated shading devices. Reviews of smart PV-integrated shading devices have been summarized for cold climates [18] and for tropical climates [19], as well as for the Middle Eastern region [20]. The required control strategies for dynamic shading systems vary in complexity and depend highly on the desired objective functions and set constraints [21]. A wide range of designs for PV-integrated dynamic shading devices have been proposed and evaluated. In general, two major types of dynamic exterior shading systems are reported in the literature: louvered blinds [22,23,24,25,26,27] and overhangs [26,27,28]. Both types can support PV panels without compromising their shading capabilities. In particular, a movable vertical shade integrated with PV panels has been evaluated in Crete to assess its electricity generation as well as thermal and visual performance [22]. Similarly, PV has been integrated into a shading system consisting of several vertical and horizontal louvers that can be set at a specific set of discrete positions [23,24]. Based on a series of simulation analyses, it was found that these PV-integrated louvered shading systems could achieve significant energy savings and even achieve net-zero energy operation for a housing unit in Korea [25,26]. Similar findings are reported for PV-integrated dynamic overhangs when deployed to US low-rise housing units and high-rise residential apartment buildings [27,28,29].
No analyses have been reported on the energy benefits of PV-integrated dynamic shading devices for buildings in extremely hot climates, such that of Qatar and other Gulf Cooperation Council (GCC) countries. This paper addresses this gap to assess the energy performance of dynamic and static overhangs made up of PV panels when deployed to shade windows of residential buildings in Qatar. First, the general analysis methodology is outlined for evaluating the PV-integrated dynamic shades, including the description of the housing prototype and the modeling approach. Then, the specific operation and control strategies for the evaluated rotating overhangs incorporating PV arrays are discussed. Finally, the main findings of a set of parametric analyses are summarized, including the variations in the energy benefits of both static and dynamic overhangs deployed with and without PV panels under various design and operation conditions for housing units in Qatar.

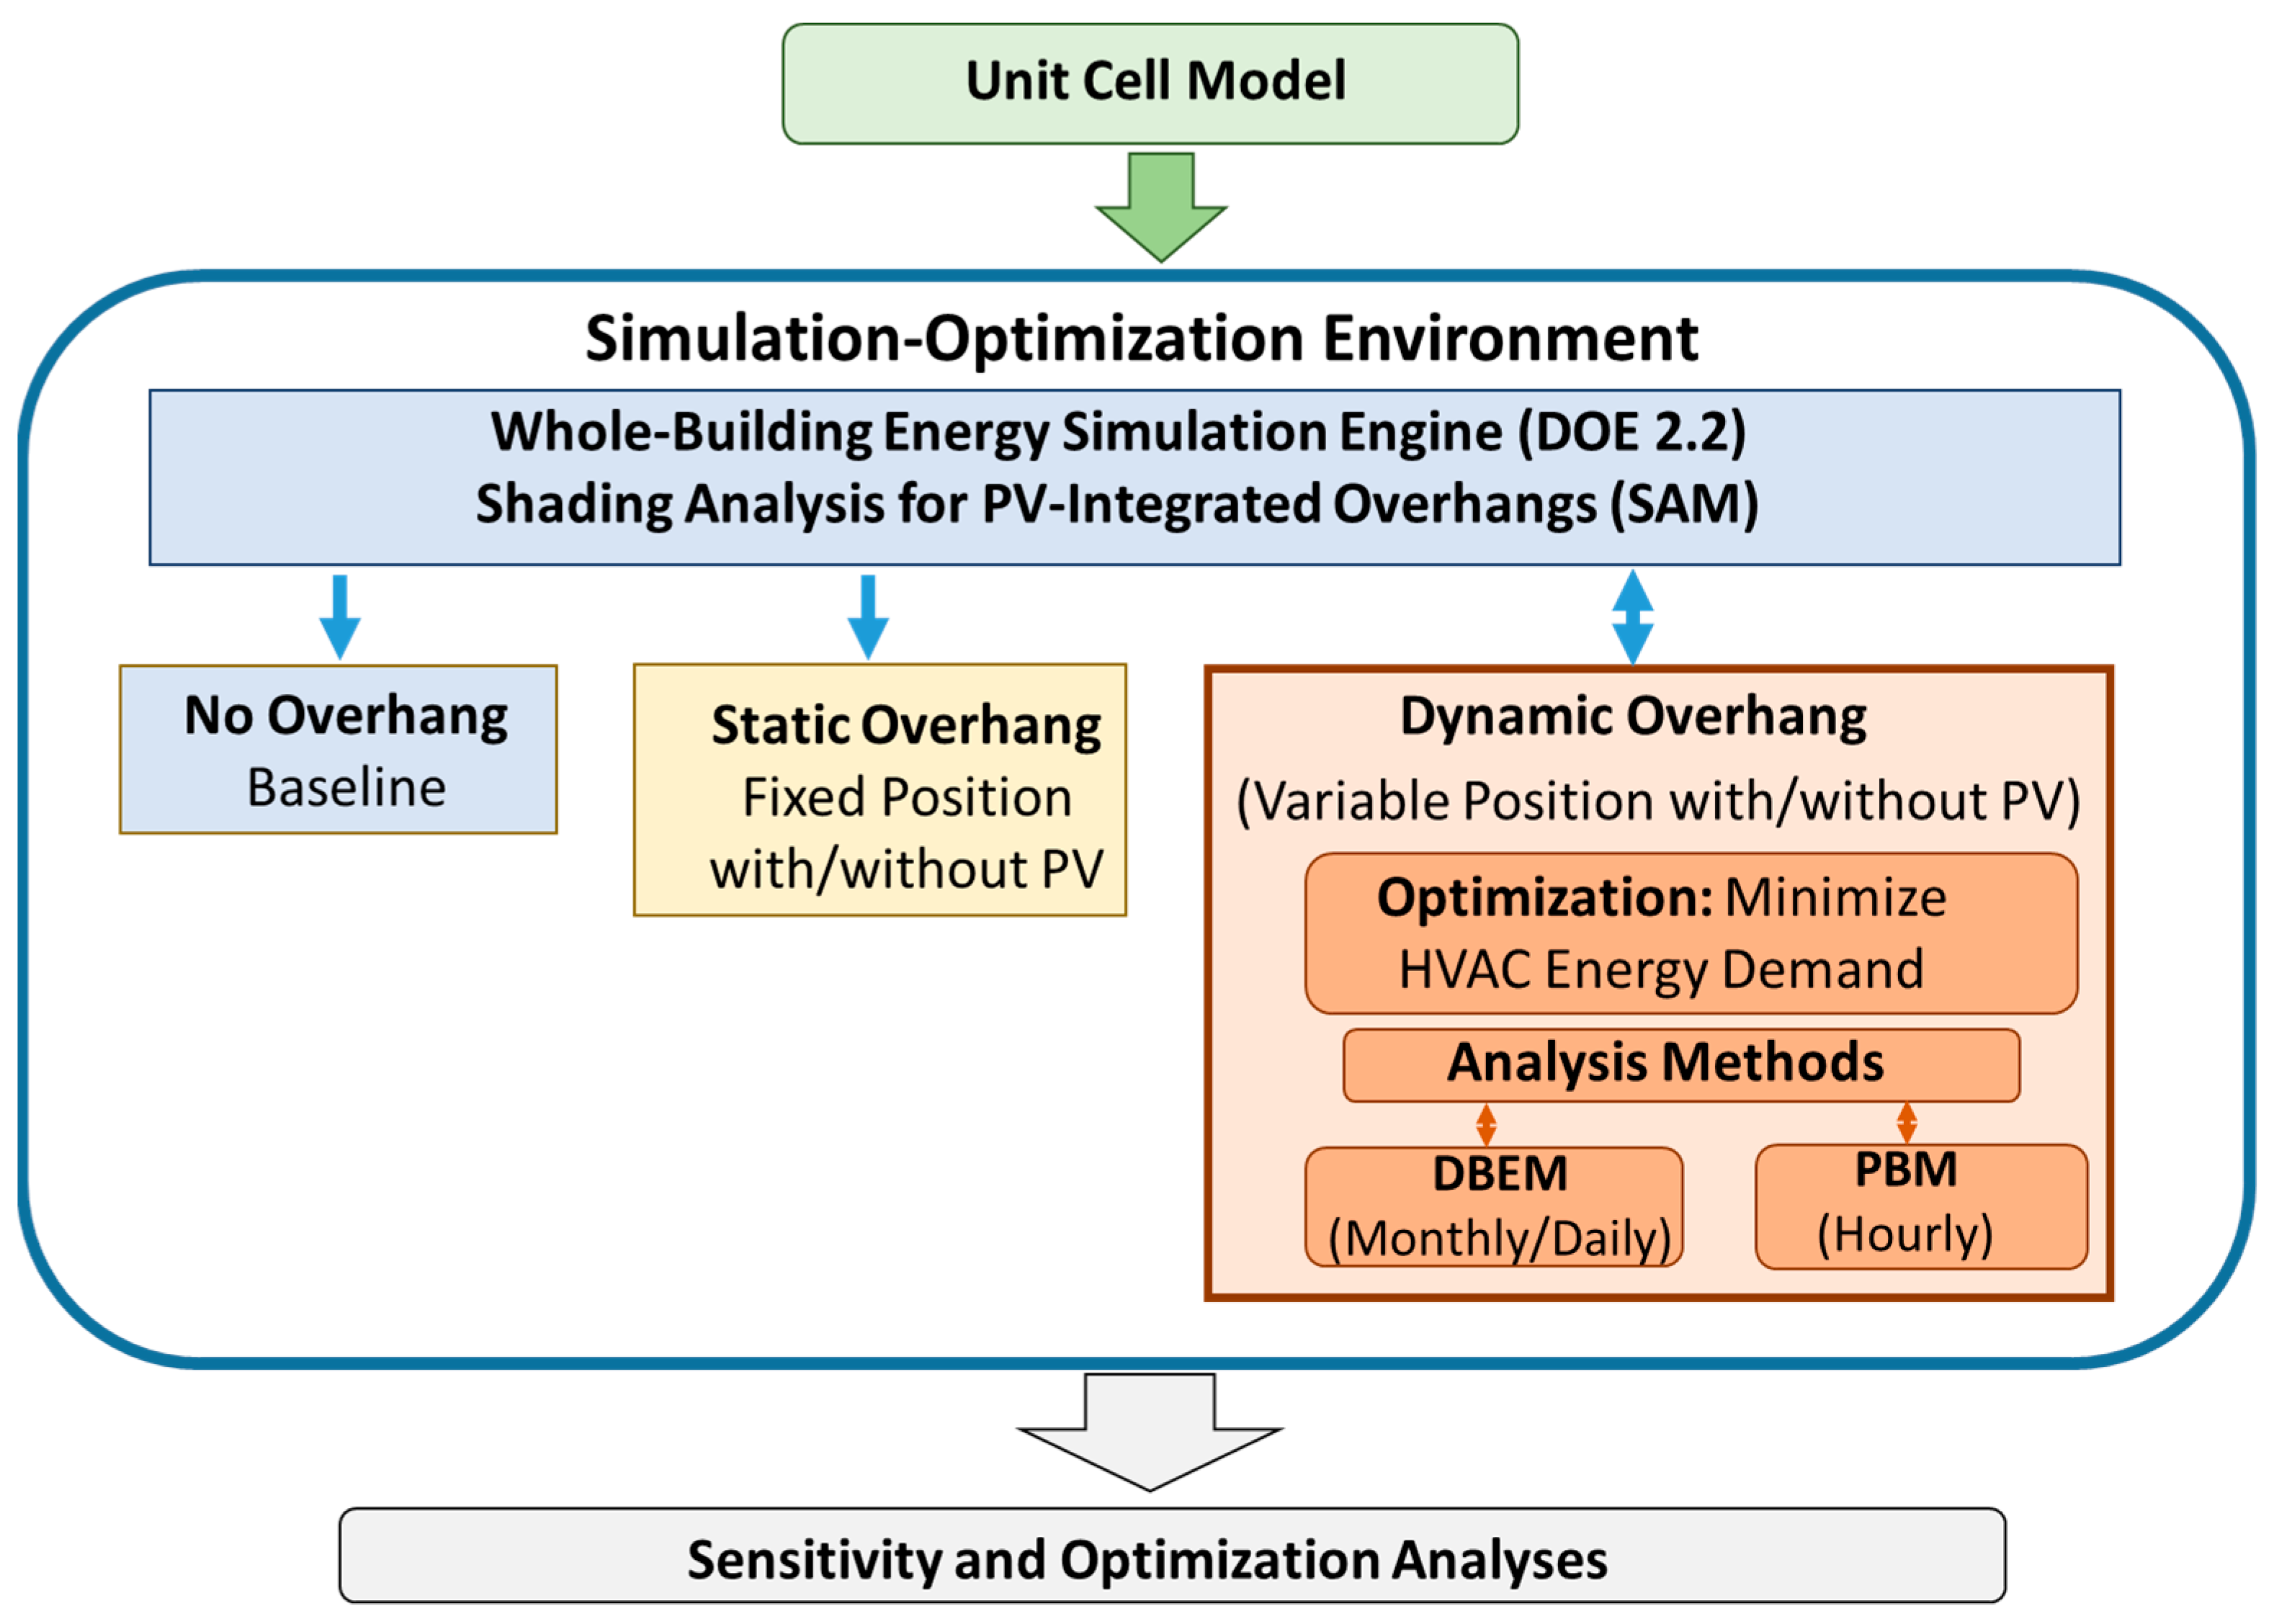
2. Analysis Approach

The general approach followed to complete the analysis presented in this paper is illustrated in Figure 1, including the modeling of the dwelling unit with the deployment of fixed and movable overhangs integrated with and without PV panels. The details for the energy model used for the housing unit, as well as the operation strategies of the PV-integrated dynamic overhangs, are described in the following sections.

2.1. Overview of Dynamic Shading Systems with PV Panels

The dynamic overhangs made up of PV arrays evaluated throughout the analyses presented in this paper are pictured in Figure 2, with their basic operation and position settings as depicted in Figure 3. As noted in Figure 3, the position of the dynamic overhangs is defined by its tilt angle, θ, which can vary between 0° and 180° [28]. Moreover, Figure 3 illustrates the depth of the overhang, d, that affects the size of the PV array that can be placed on the shading device. The electricity, generated by the PV panels, can meet directly the energy demand of the building or supply to the grid. While the PV panels could be bi-facial, only mono-facial systems are considered in the analysis carried out for this study.
For this study, the PV-integrated dynamic overhangs can be operated and controlled on an hourly, daily, or monthly basis, with the main objective to minimize the annual net energy demand of the housing unit [28,29]. To determine the impacts of the dynamic shading systems on both heating and cooling thermal loads of the housing unit, two modeling techniques are considered, including (i) the distinct building energy modeling (DBEM) method [27], and the (ii) parametric behavior maps (PBMs) technique [30]. The DBEM method, through overlapping discrete overhang positions, is suitable for modeling the effects of the overhangs due to monthly adjustments. On the other hand, the PBM technique is effective by using solar transmittance schedules to model the impacts of daily and hourly adjustments of the overhang position.

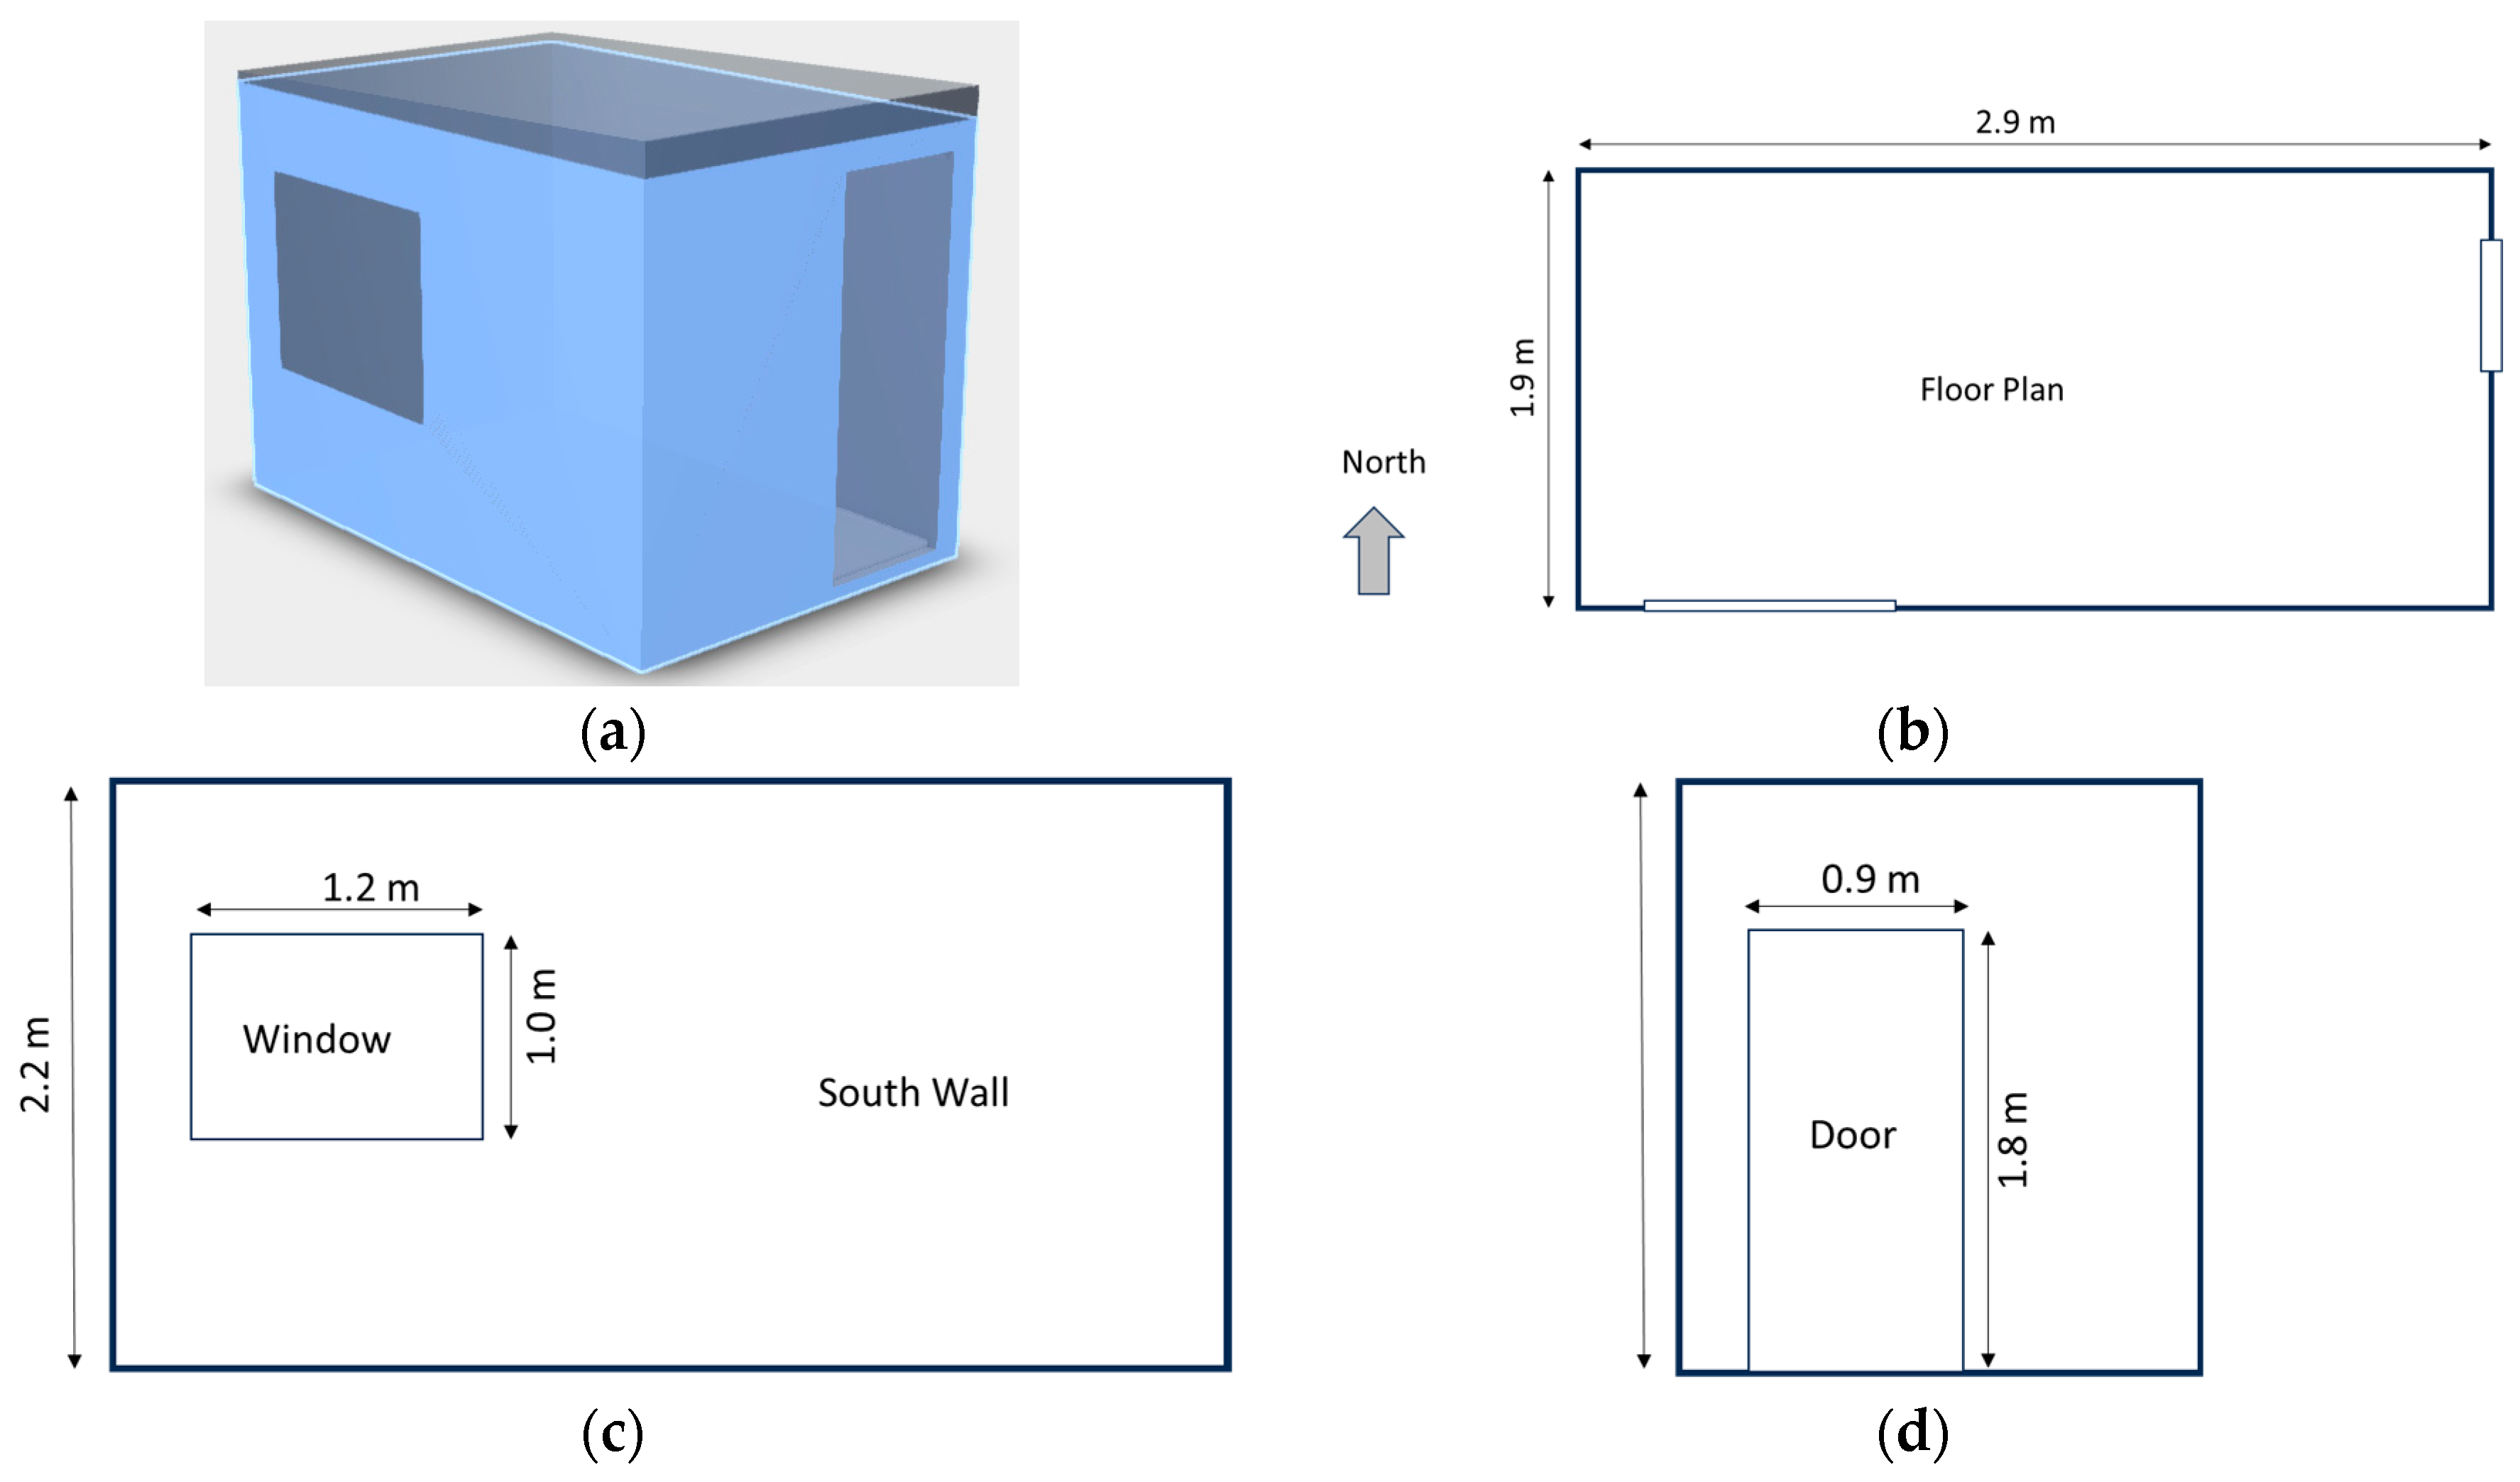
2.2. Description of Unit Cell

The main features for the unit cell considered throughout the analysis are summarized in Table 1. The unit cell is designed to be modular and to represent typical housing spaces in Qatar. Figure 4 provides the 3-D rendering as well as the floor plan and elevation views showing the dimensions of the energy model for the housing unit cell, showing the relative size and the specific placement of the window along one exterior wall.
Throughout this study, a well-documented whole building energy simulation engine, DOE2.2, is used to estimate hourly energy needs for the housing unit, including space heating and cooling loads and energy end-uses [31]. The predictions for the simulation engine have been validated by several studies, including the hourly energy consumption for housing units and the energy performance of shading devices [32,33,34]. Moreover, the predictions of the energy model developed for the housing unit will be validated as part of a follow-up work of this study when the unit prototype and measured data are available. For evaluating power generation yields from dynamic PV panels, the SAM analysis tool is applied due to its capabilities to consider the shading effects associated with any building’s architectural features [35].
Using typical weather data for Doha Qatar, Figure 5 illustrates the monthly and annual energy end-uses for the housing unit. As expected, most of the energy used by the dwelling is associated with the cooling needs to maintain the indoor temperature settings. Indeed, 85% of the annual electricity consumed by the housing unit is used by the air conditioning (AC) unit, with 8% used by the lighting fixtures and 5% needed for heating. The cooling energy demands increase significantly during the summer months compared to the winter season due to higher outdoor temperatures. It should be noted that cooling is required throughout the year to maintain the air temperature of 24 °C (75.2 °F) inside the housing unit.

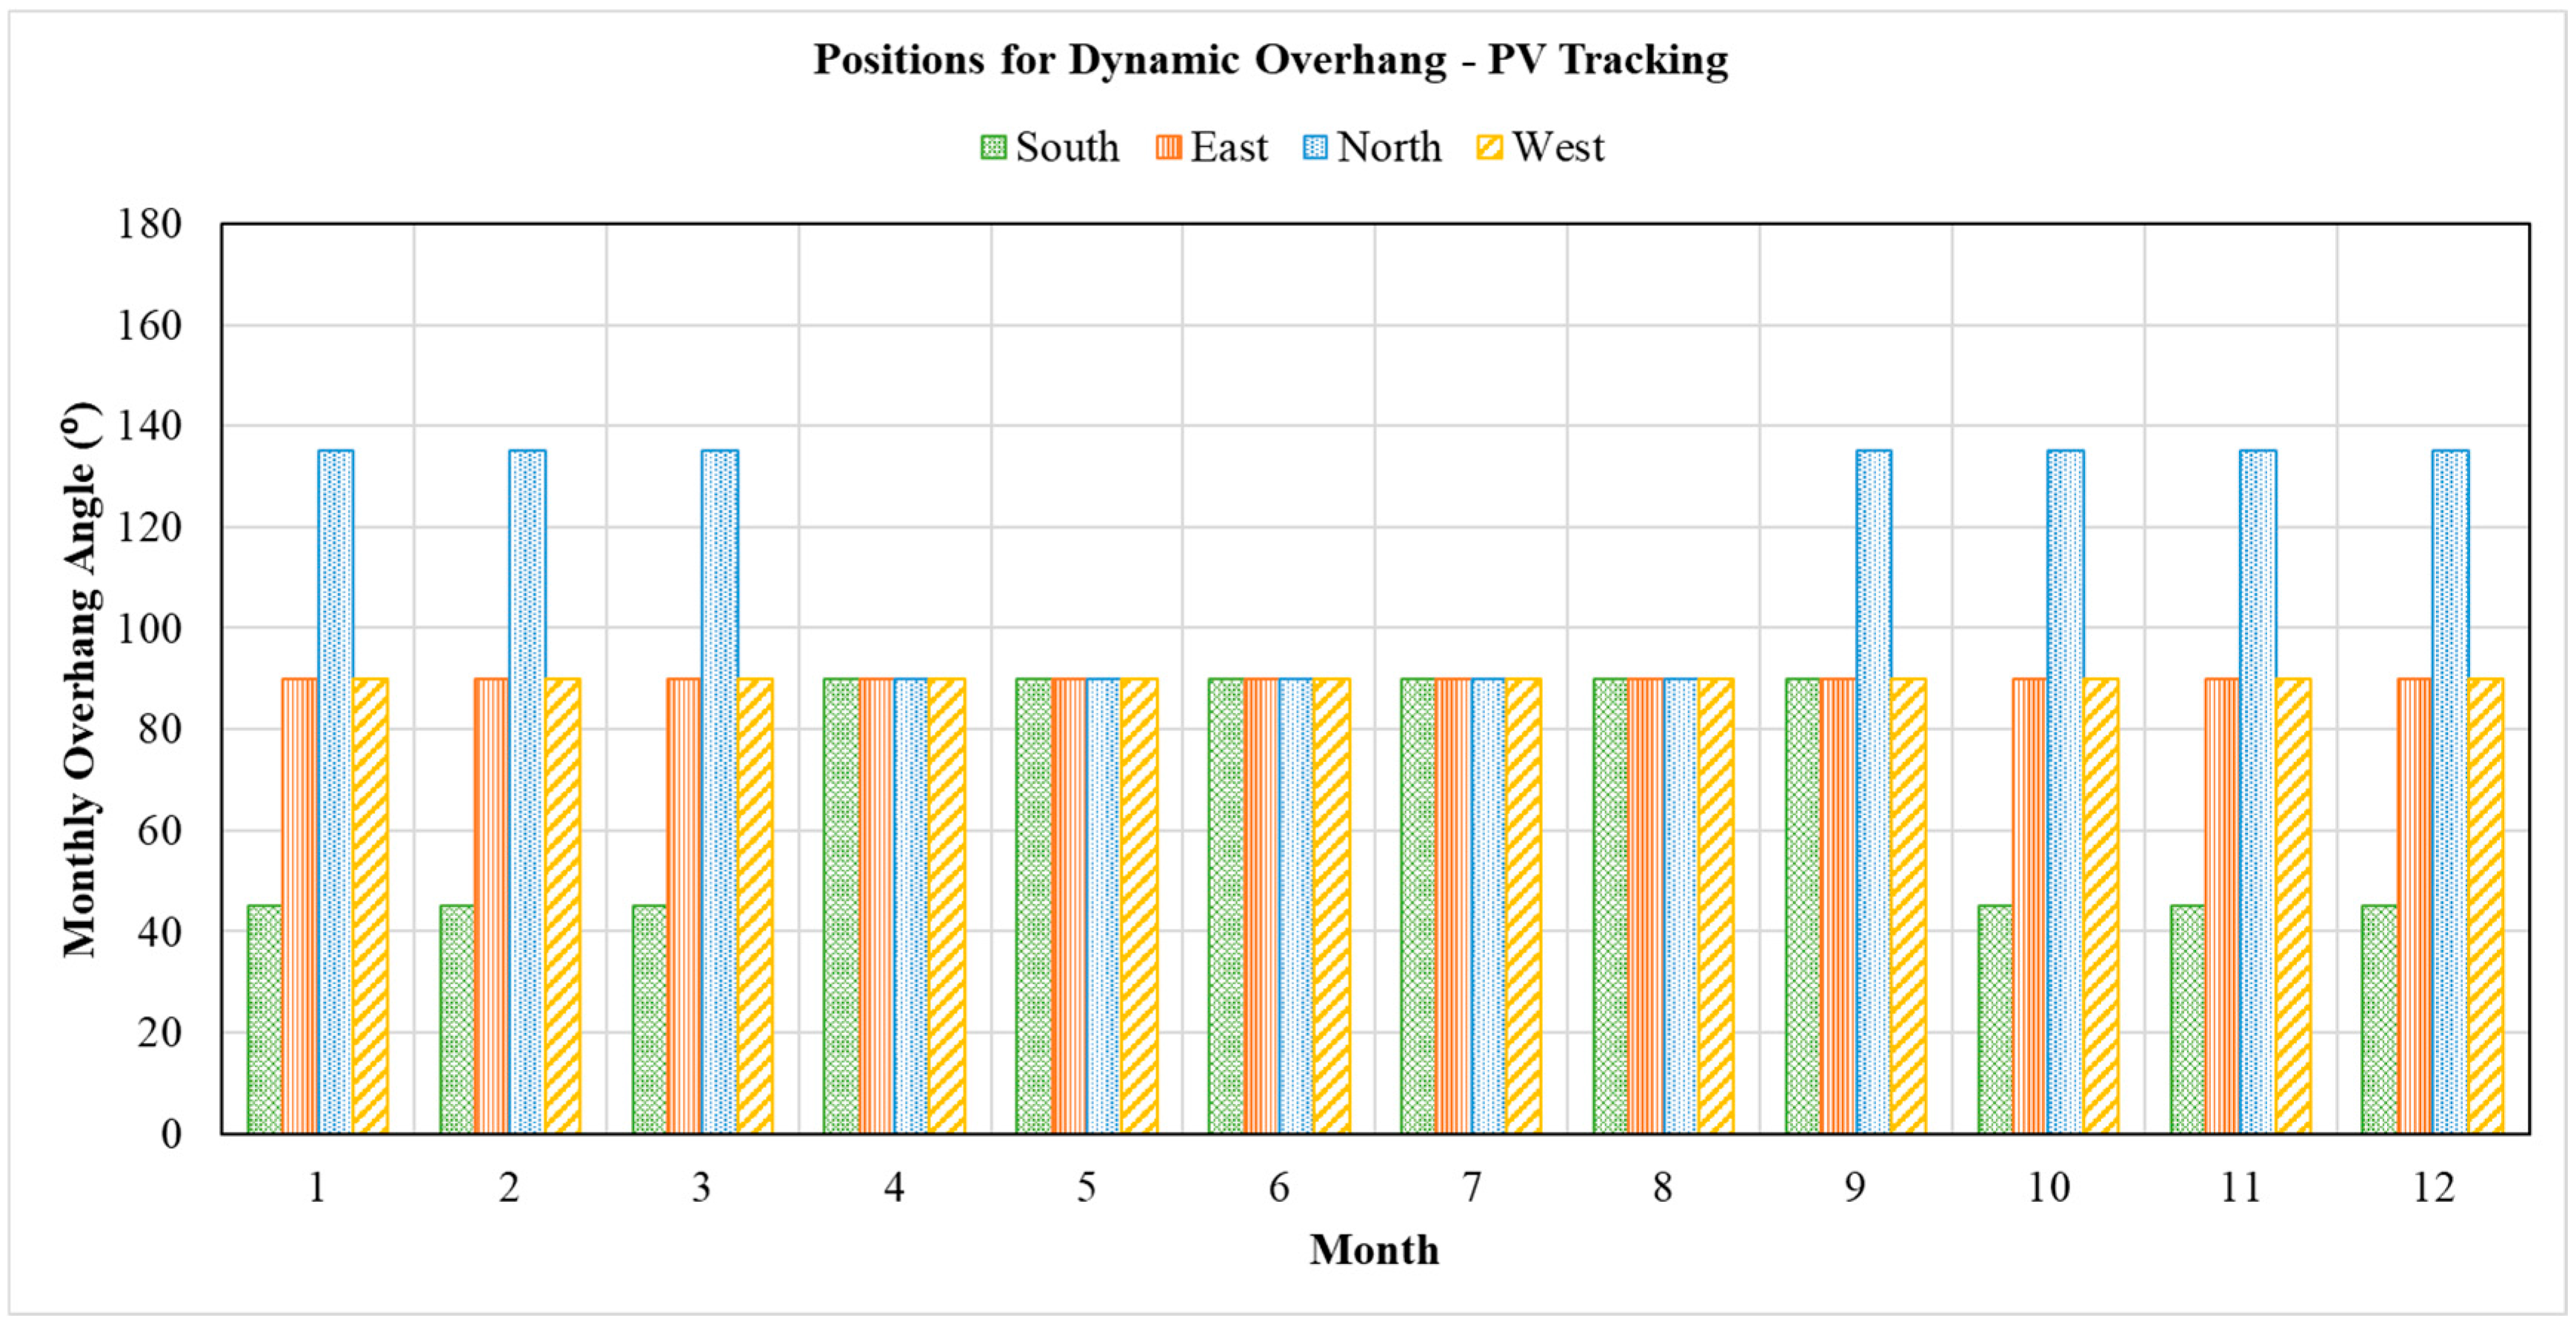
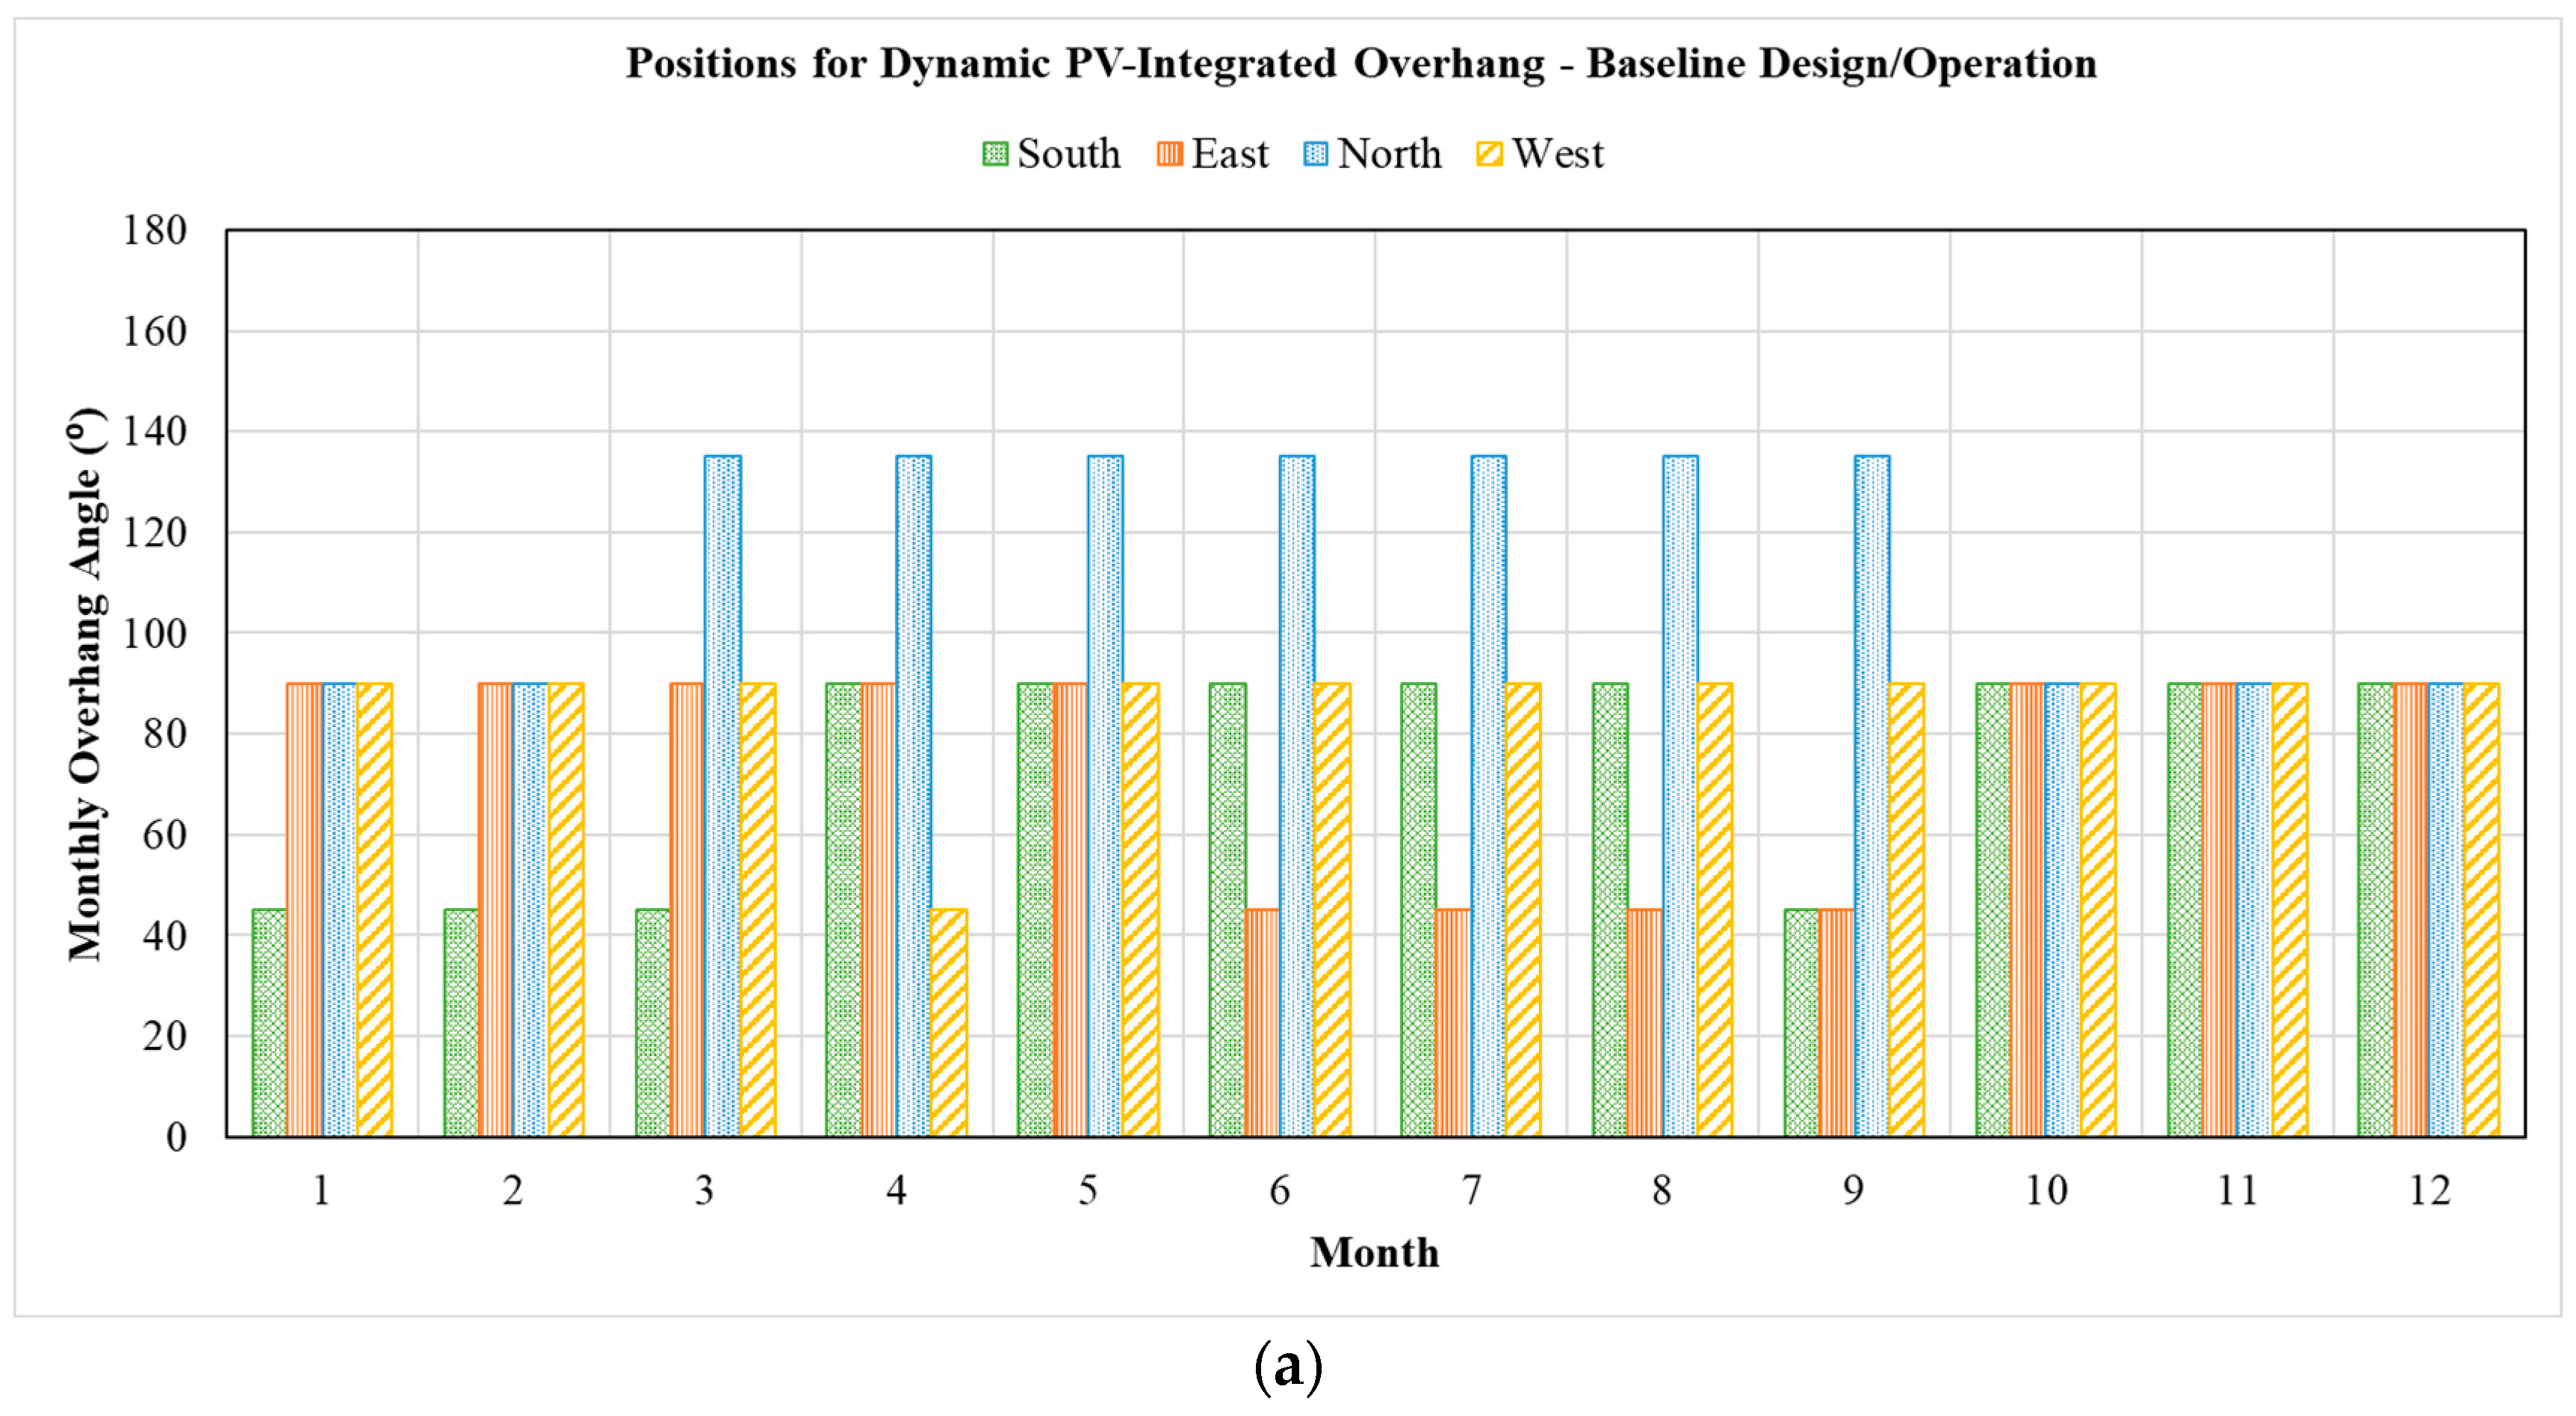
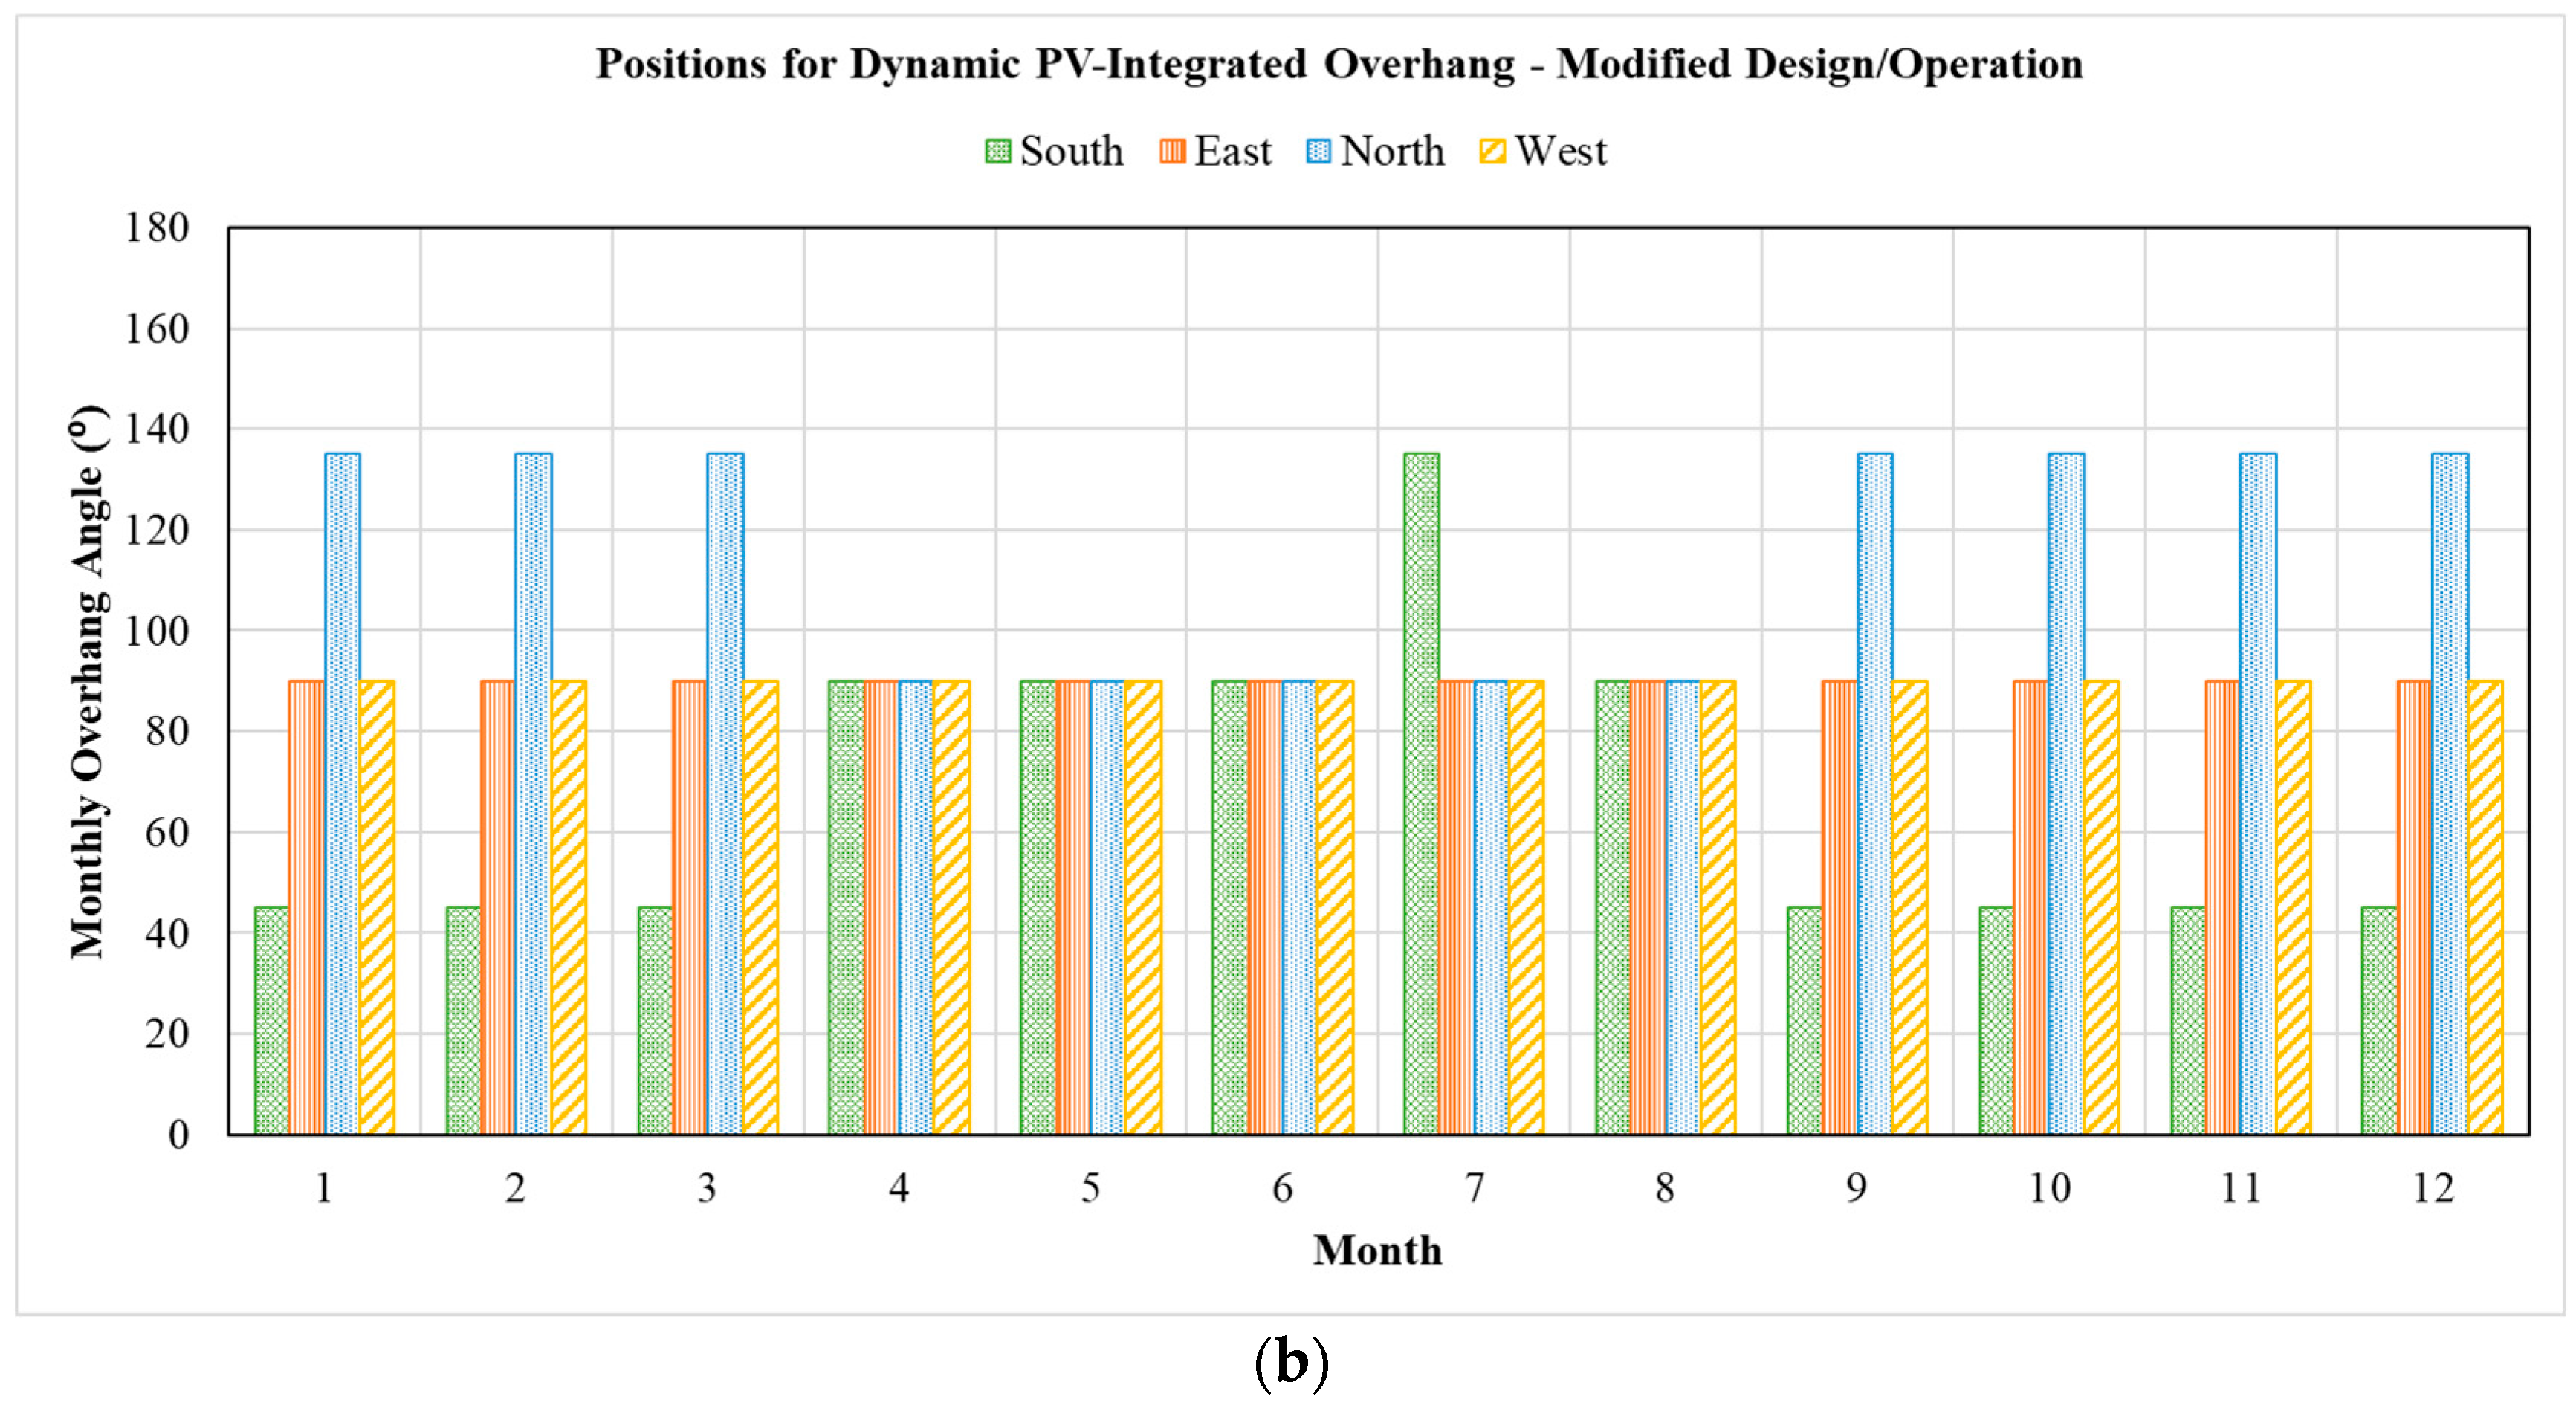
2.3. Design and Operation Strategies

The energy demand to maintain acceptable indoor conditions depends on several design and operation strategies. Table 2 considers the impact of adjusting both the heating set point from 20 °C to 23 °C and the window size by doubling its width so its window/wall ratio (WWR) is changed from 0.2 to 0.4 without any overhangs. Both strategies affect mostly heating end-use with the increase in heating setpoint having the highest impact. Indeed, doubling the window size has limited impact, with increases of 4% in annual heating end-use and 2% in annual total energy consumption. However, increasing the heating setpoint by 2 °C increases by 70% the heating end-use and by 4% the total energy use of the housing unit located in Doha, Qatar.
Figure 6 illustrates the monthly electricity consumption by the housing unit under different design and operating strategies. It is interesting to note that these strategies affect the energy demand mostly during the winter months, with the energy needs during the summer months remaining mostly unaffected. While this result is expected for the heating setpoint adjustment, the impact of window size during the summer is surprisingly small, most likely due to its small area compared to that of the total exposed surfaces (i.e., including the walls, roof, and door) of the housing unit, even when the WWR is set to 0.4.

3. Analysis Results Discussion

Throughout this section, both the solar shading and electricity generation benefits for overhangs, being static or dynamic when incorporating PV arrays, are estimated for two design/operation options of the housing unit, as well as for various window orientations. First, the solar shading benefits are evaluated when both static and dynamic overhangs are deployed to windows of the housing unit without any PV arrays. Then, the electricity generated by the PV panels integrated in the overhangs are determined for both static and dynamic shading options. Finally, the overall energy benefits of static and dynamic overhangs incorporating PV arrays are assessed to account for both their solar shading effects and electricity generation benefits on the annual energy demand of the housing unit located in Doha, Qatar.

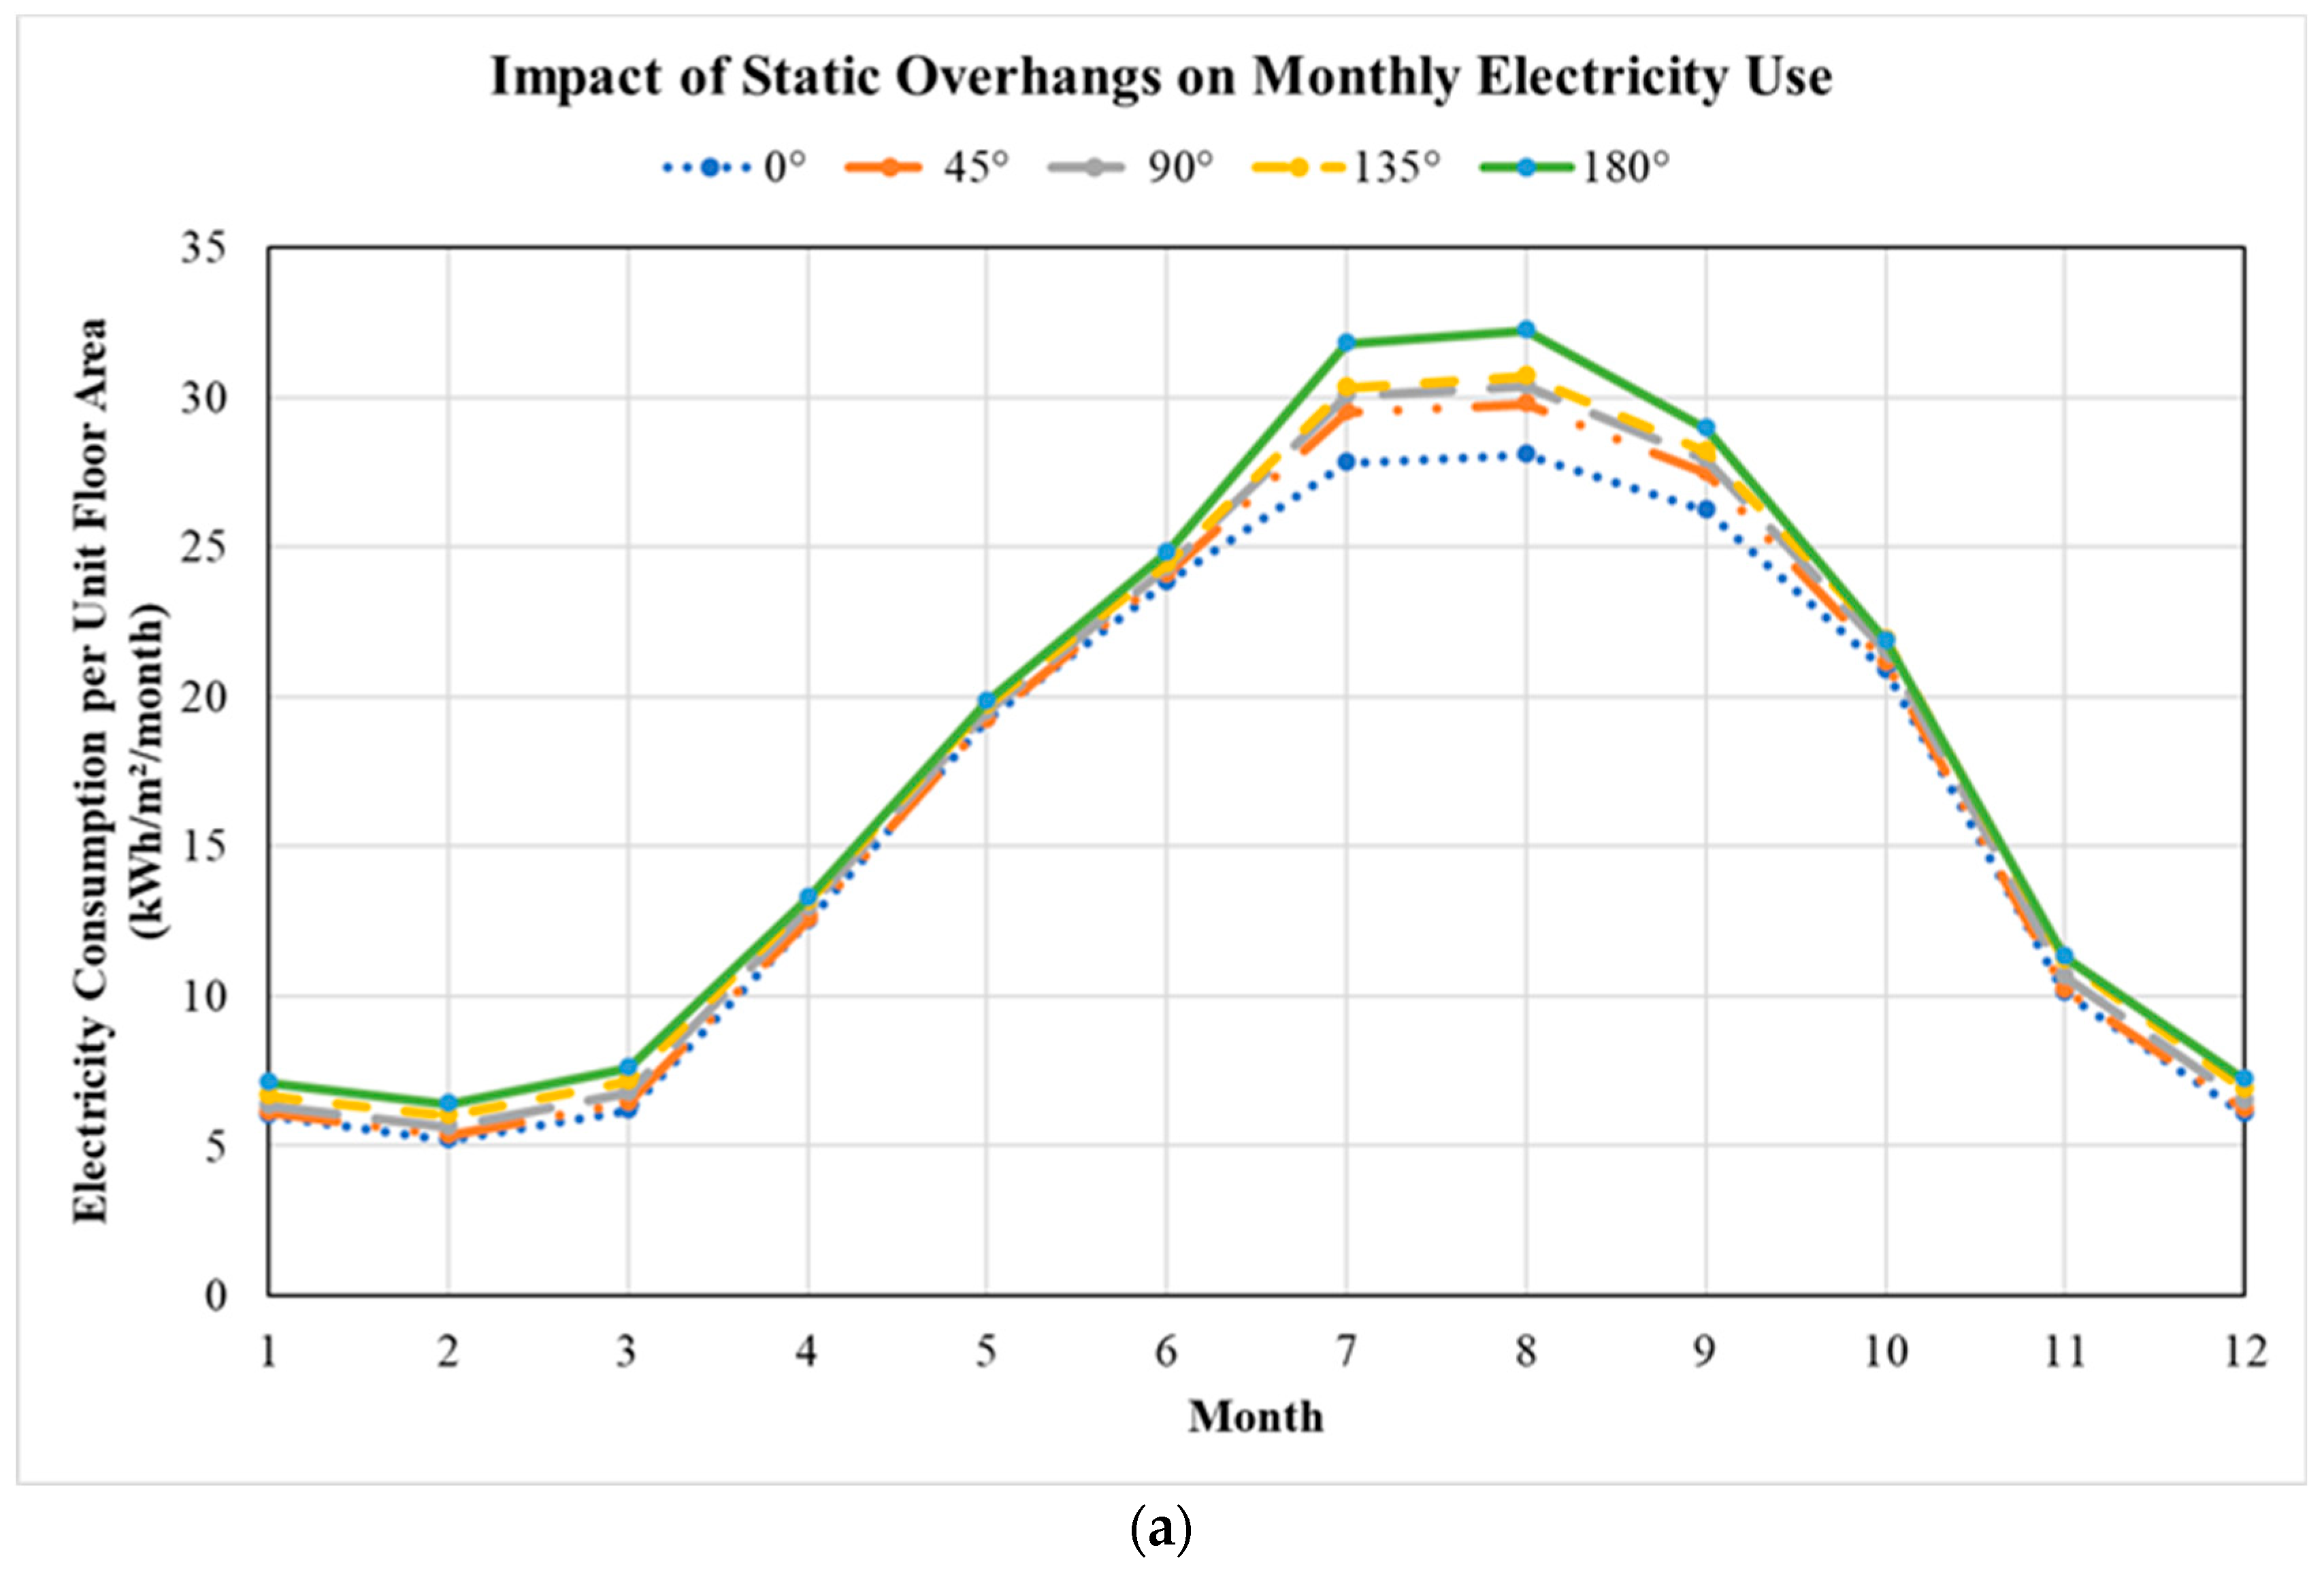
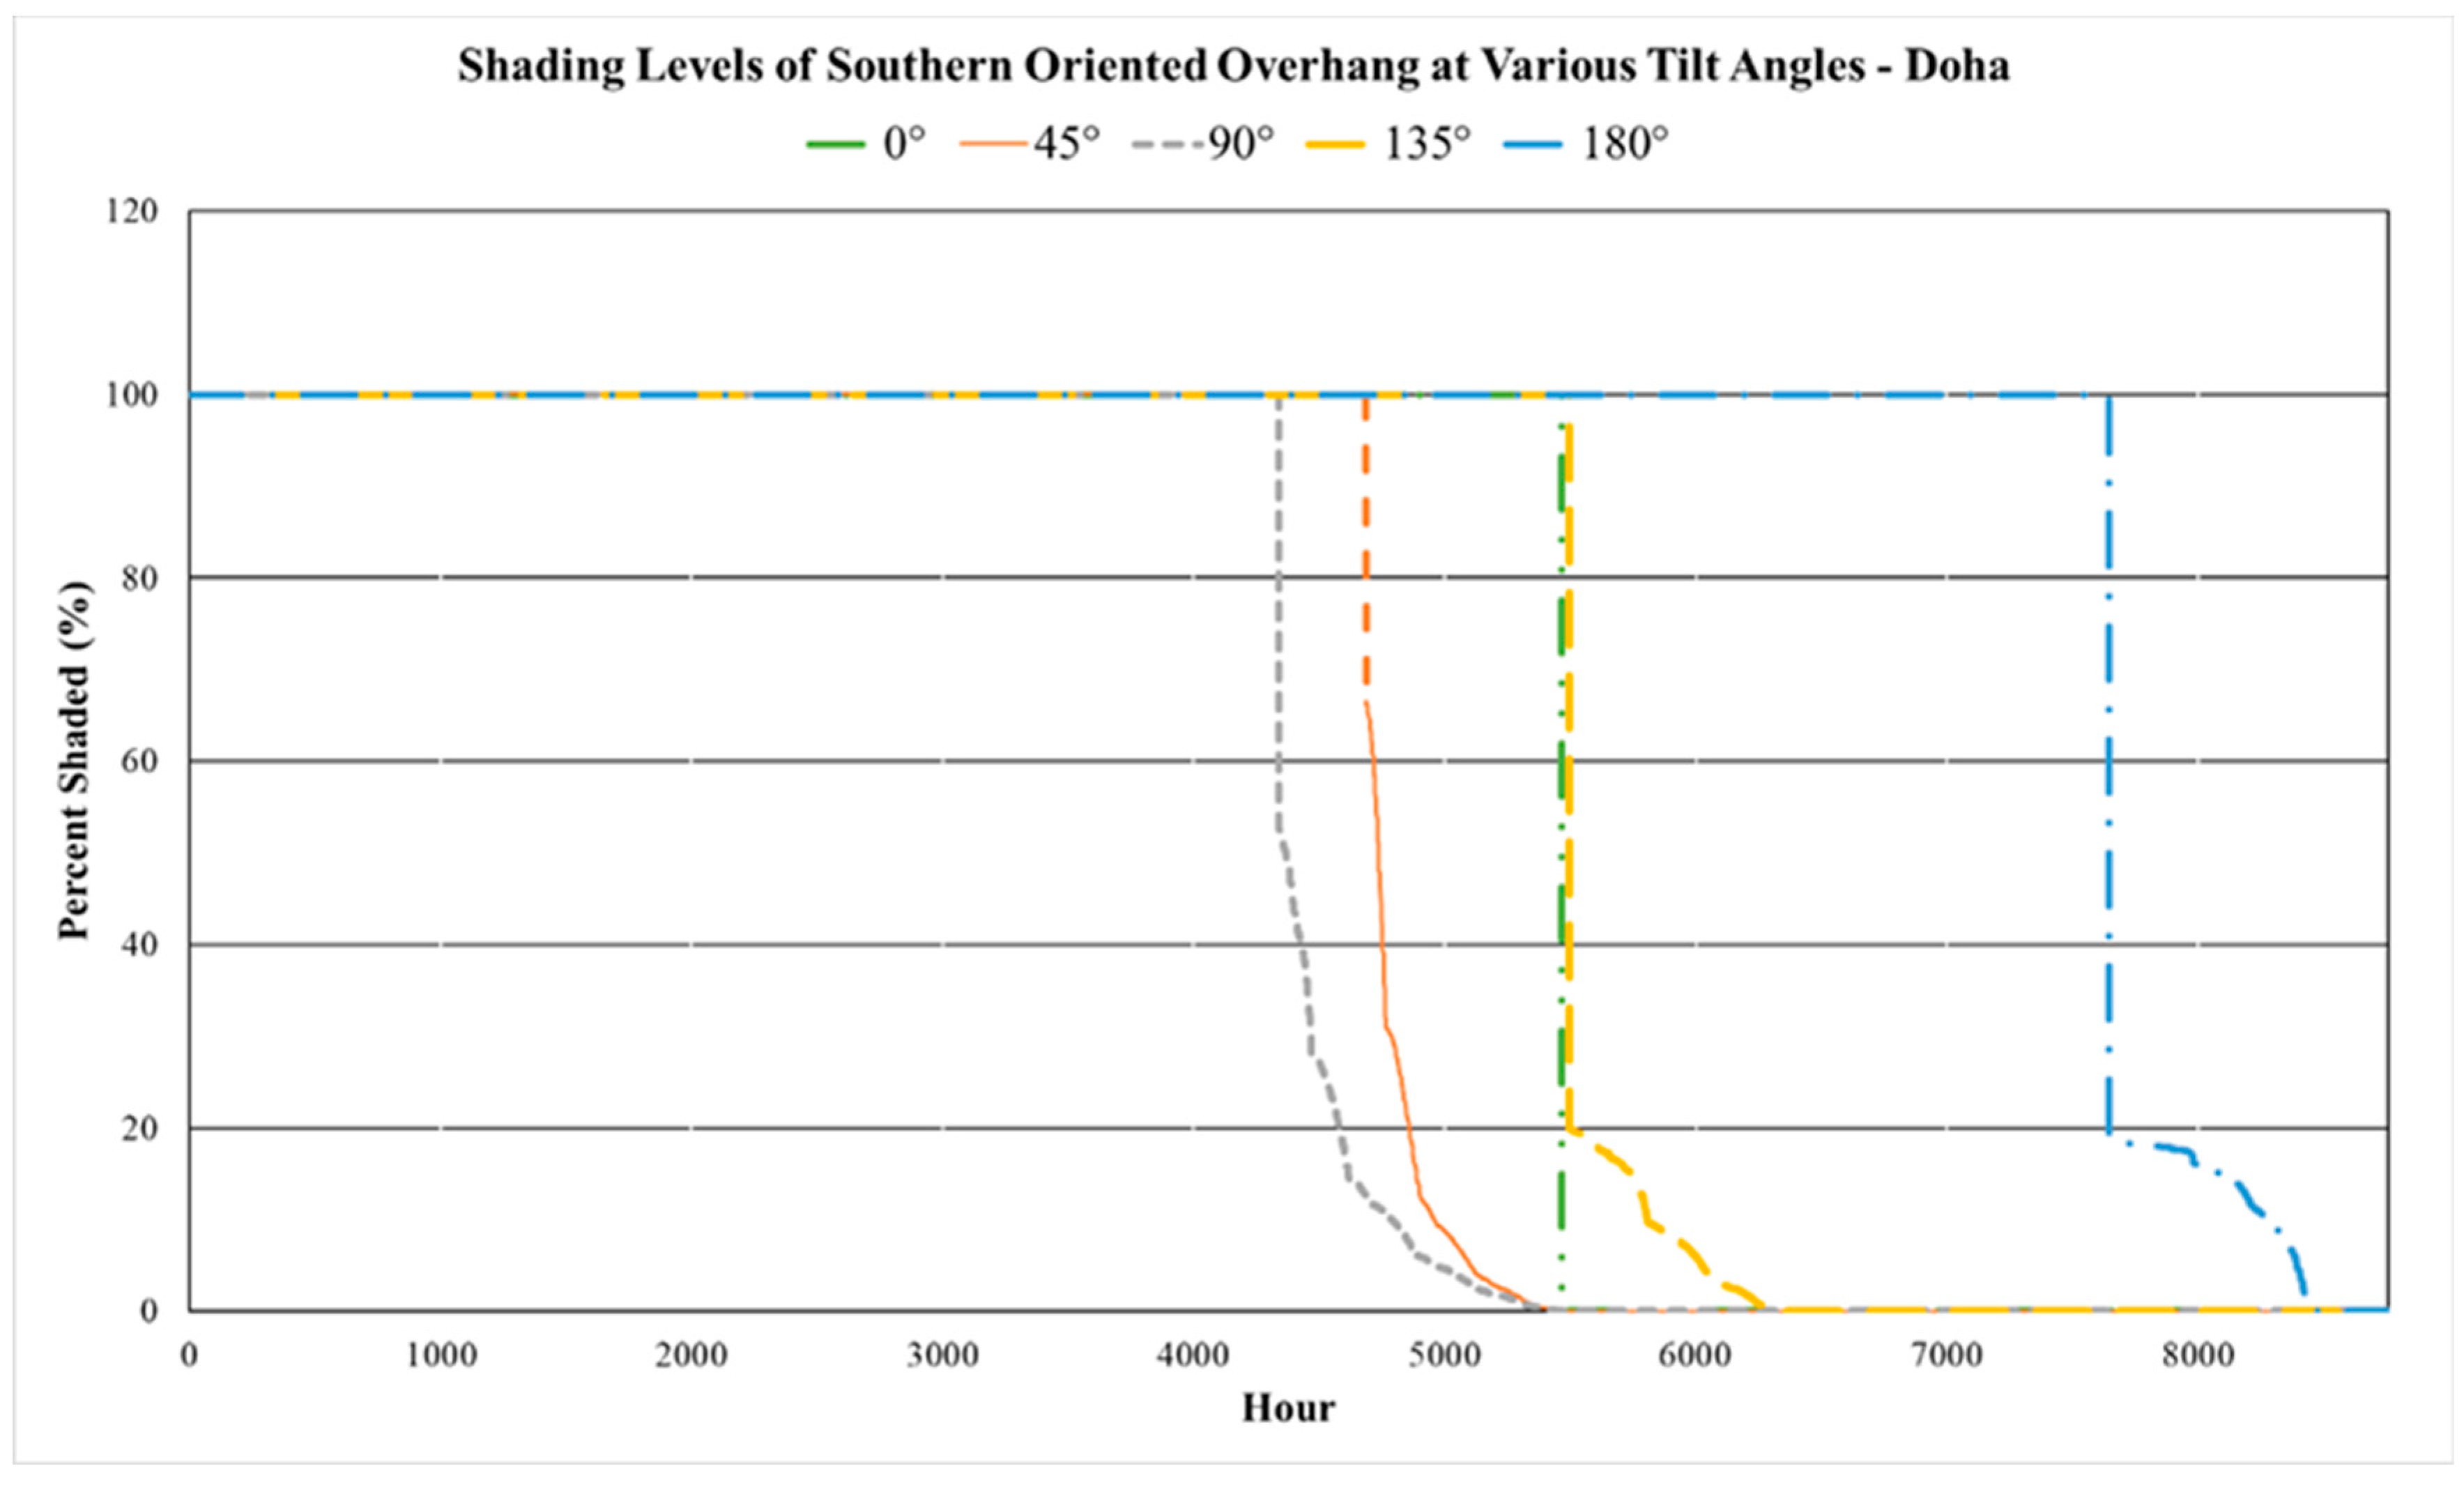
3.1. Shading Impacts of Overhangs

When static overhangs are deployed on the window of the dwelling, the monthly energy consumption of the unit is affected, as shown in Figure 7 for two design/operation scenarios. Specifically, Figure 7 shows the monthly electricity consumption normalized by the housing unit floor area for various static overhang tilt angles deployed on a southern-oriented window in (a) the reference case (i.e., Theat = 21 °C and WWR = 0.2) and (b) a case of higher heating setpoint temperature and larger window (i.e., Theat = 23 °C and WWR = 0.4). As indicated in Figure 7, the shading effects of the static overhang depend on its tilt angle, as well as the design/operation strategies for the housing unit. For the reference case, the overhang set to a position that blocks the window (i.e., tilt angle of θ = 0°) reduces the energy use of the housing unit consistently throughout the year, as depicted in Figure 7a, due to the dominance of the cooling energy end-use. However, for the case of adjusted design and operation strategies [i.e., Figure 7b], the best position of the static overhang to reduce the monthly energy use varies from θ = 135° from the months of April, May, and June to θ = 0° for the other months. For the case of higher heating setpoint temperature and large window size, the heating end-use becomes sufficiently substantial that allowing solar heat gains through the fenestration system only during the winter months would result in lower thermal heating needs without substantially increasing the thermal cooling requirements during the summer months. This difficult challenge to balance heating and cooling needs is achieved by adjusting the position of the shading device as outlined in Figure 7b. This result indicates that the use of a dynamic position for the overhang can be beneficial for certain design and operation conditions to minimize the overall energy needs of the housing unit throughout the year.
The optimal positions of the dynamic overhangs can be determined for both the design/operation cases considered in Figure 7 using different switching frequencies of the tilt angle. The dynamic overhangs can continuously adjust their position within a range of tilt angles, spanning from minimal to maximal values. For instance, a dynamic overhang with 0–180° range can adjust their tilt angle from 0° (i.e., blocked window) to 180° (i.e., unshaded window). Table 3 summarizes the annual energy savings associated with the deployment of dynamic overhangs compared to the case with no shading (i.e., no overhang) for three switching frequencies, including hourly, daily, and monthly. The optimal settings for the dynamic overhangs are determined for two design/operation strategies for the housing unit located in Doha, Qatar, with a southern-oriented window. The results of Table 3 indicate that dynamic overhangs with the full tilt angle range (i.e., 0–180°) and operated using hourly settings achieve the highest reduction in annual energy use relative to the case of unshaded windows (which is equivalent to the configuration of deploying a static overhang with a fixed tilt angle of 180°, as confirmed in Table 3, with no annual energy savings) for both design/operation options for the housing unit. Indeed, the deployment of a dynamic overhang with a 0–180° tilt angle range results in annual energy savings of 11.8% for the reference design/operation case (i.e., Theat = 21 °C and WWR = 0.2) and 15.4% for the modified design/operation case (i.e., Theat = 23 °C and WWR = 0.4). The best position for the static overhangs with the highest annual energy savings is 0° for both design/operation cases, achieving 9.6% for the reference option and 8.3% for the modified option. It should be noted that only hourly settings can lower the overall annual energy use of the dwelling unit equipped with dynamic overhangs for the reference design/operation case when compared to the static overhang set at its best position of tilt angle of 0°. For the modified design/operation case, all three switching frequencies lead to reduced annual energy needs for the dwelling unit compared to the configuration when a static overhang is deployed with a tilt angle of 0°, at least specific to the options of dynamic overhangs with wider position adjustment ranges (i.e., 0–180° and 0–135°).

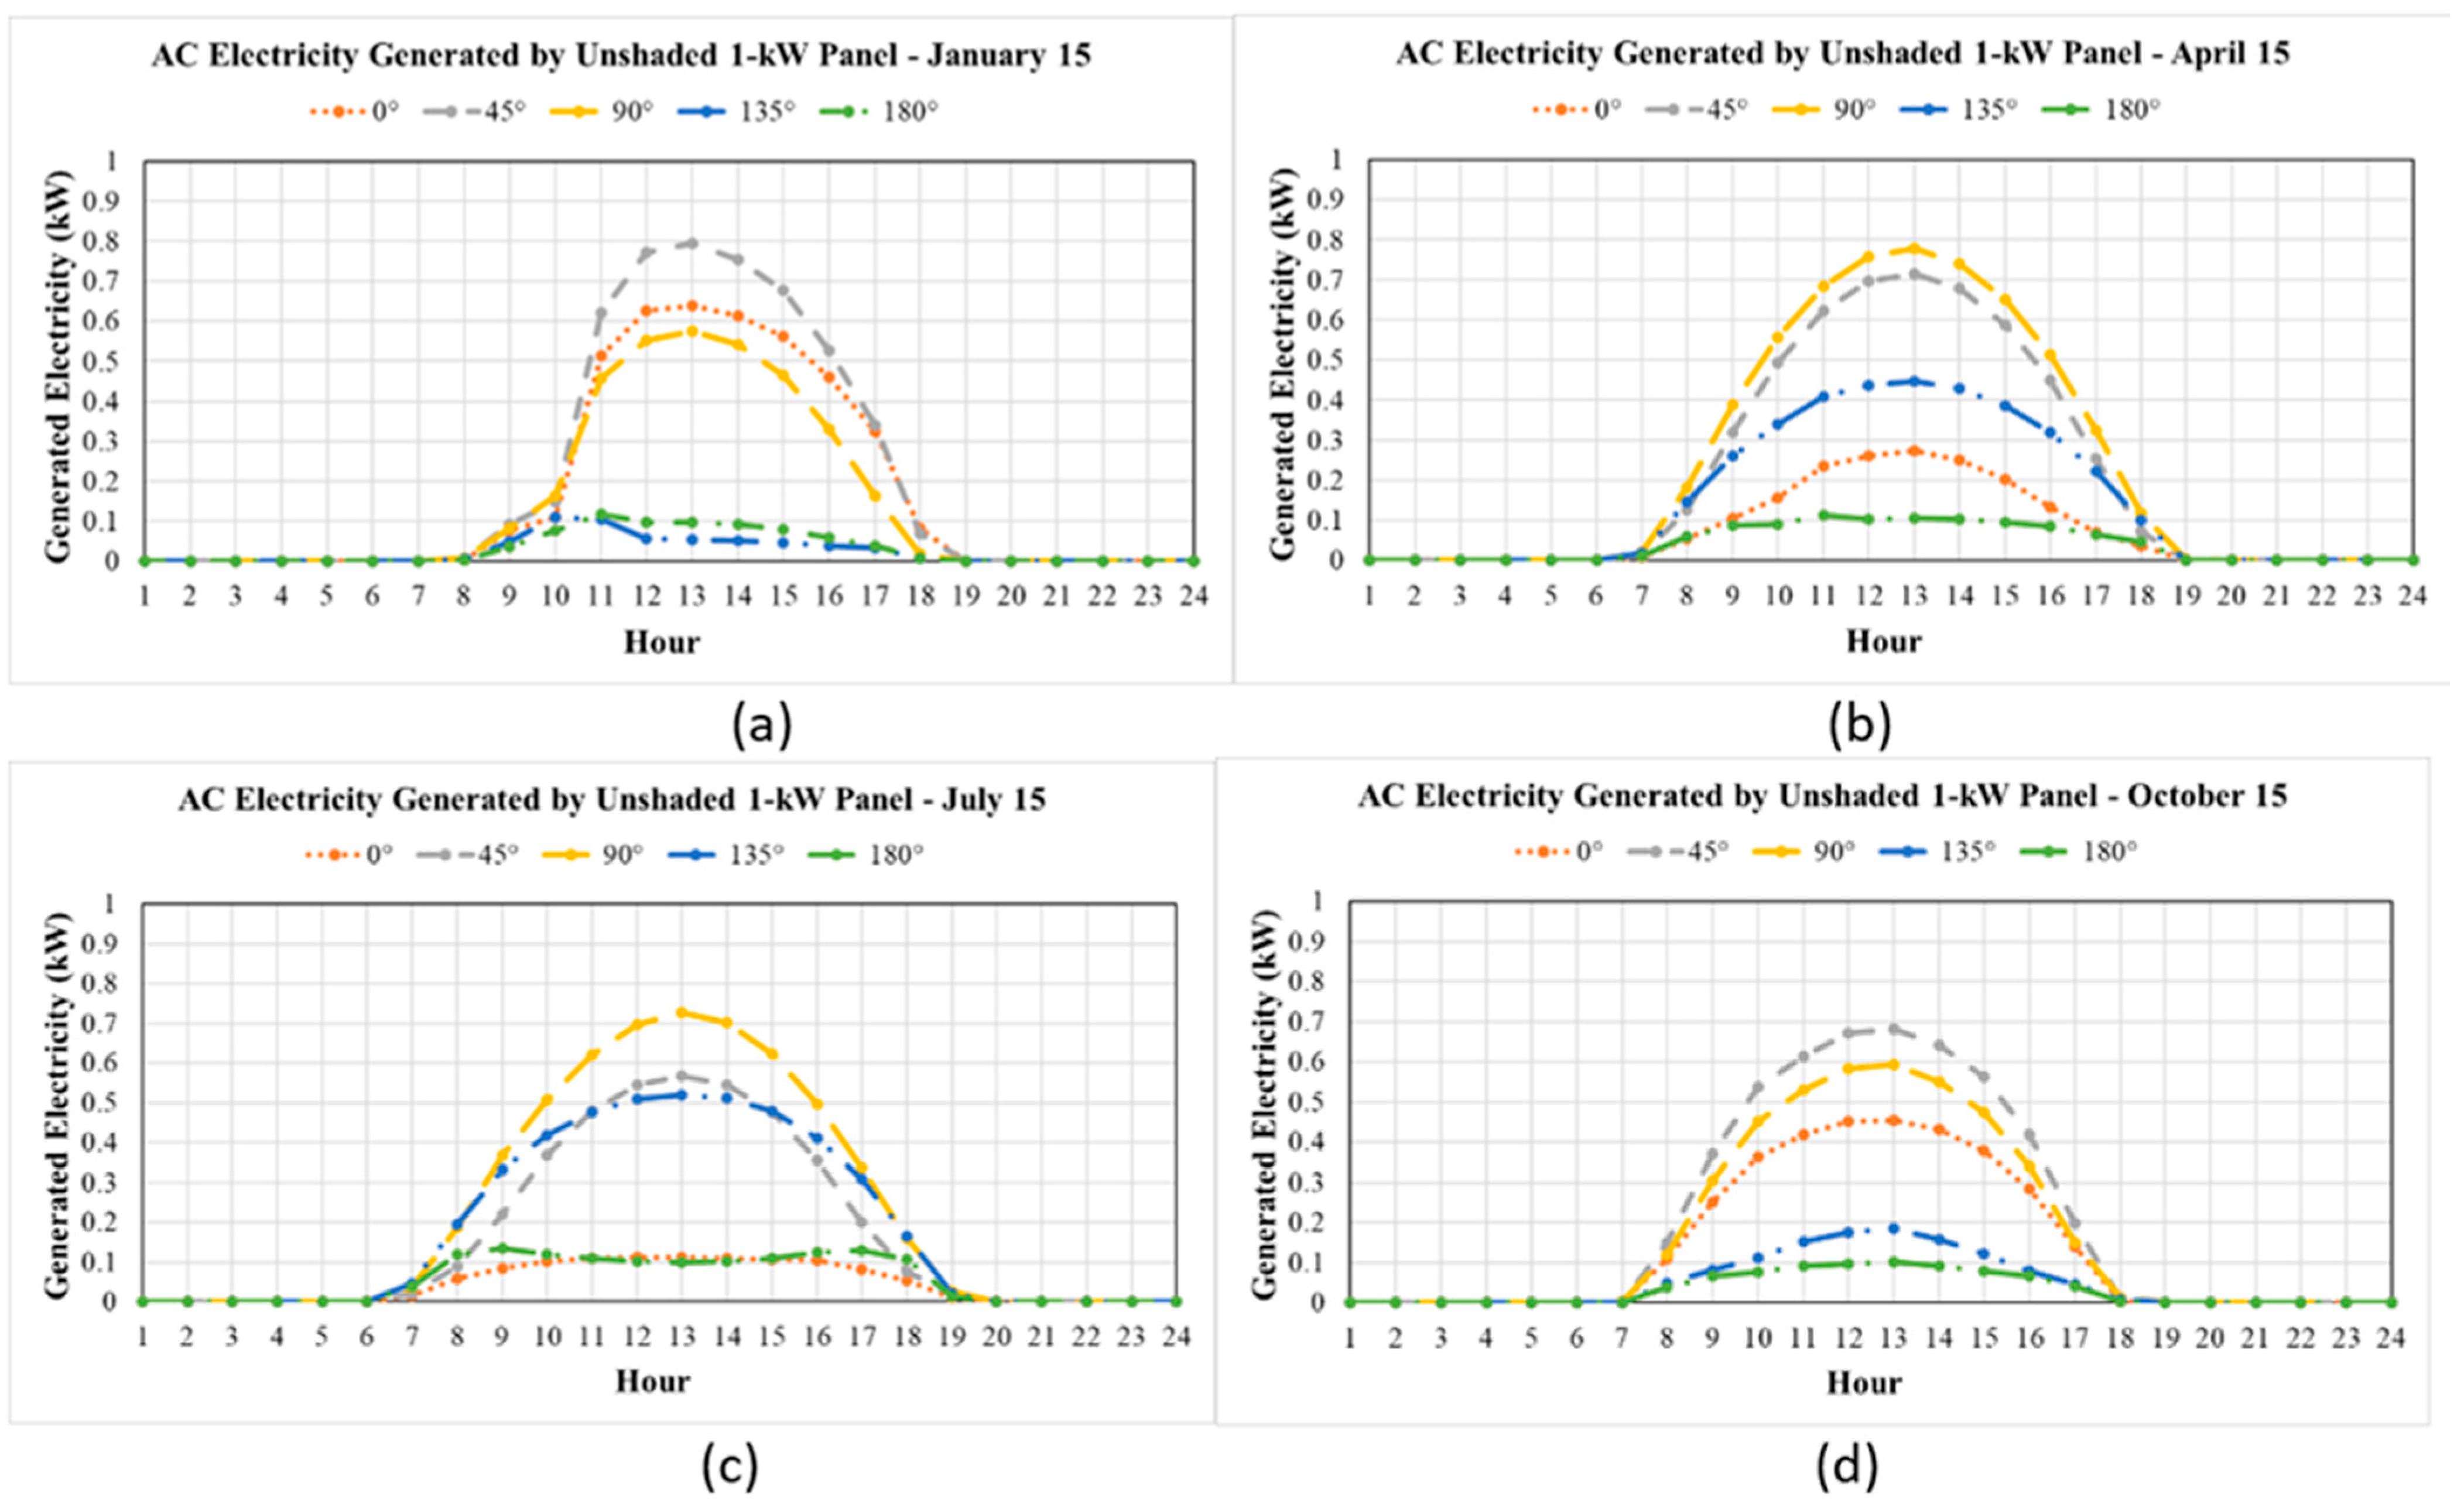
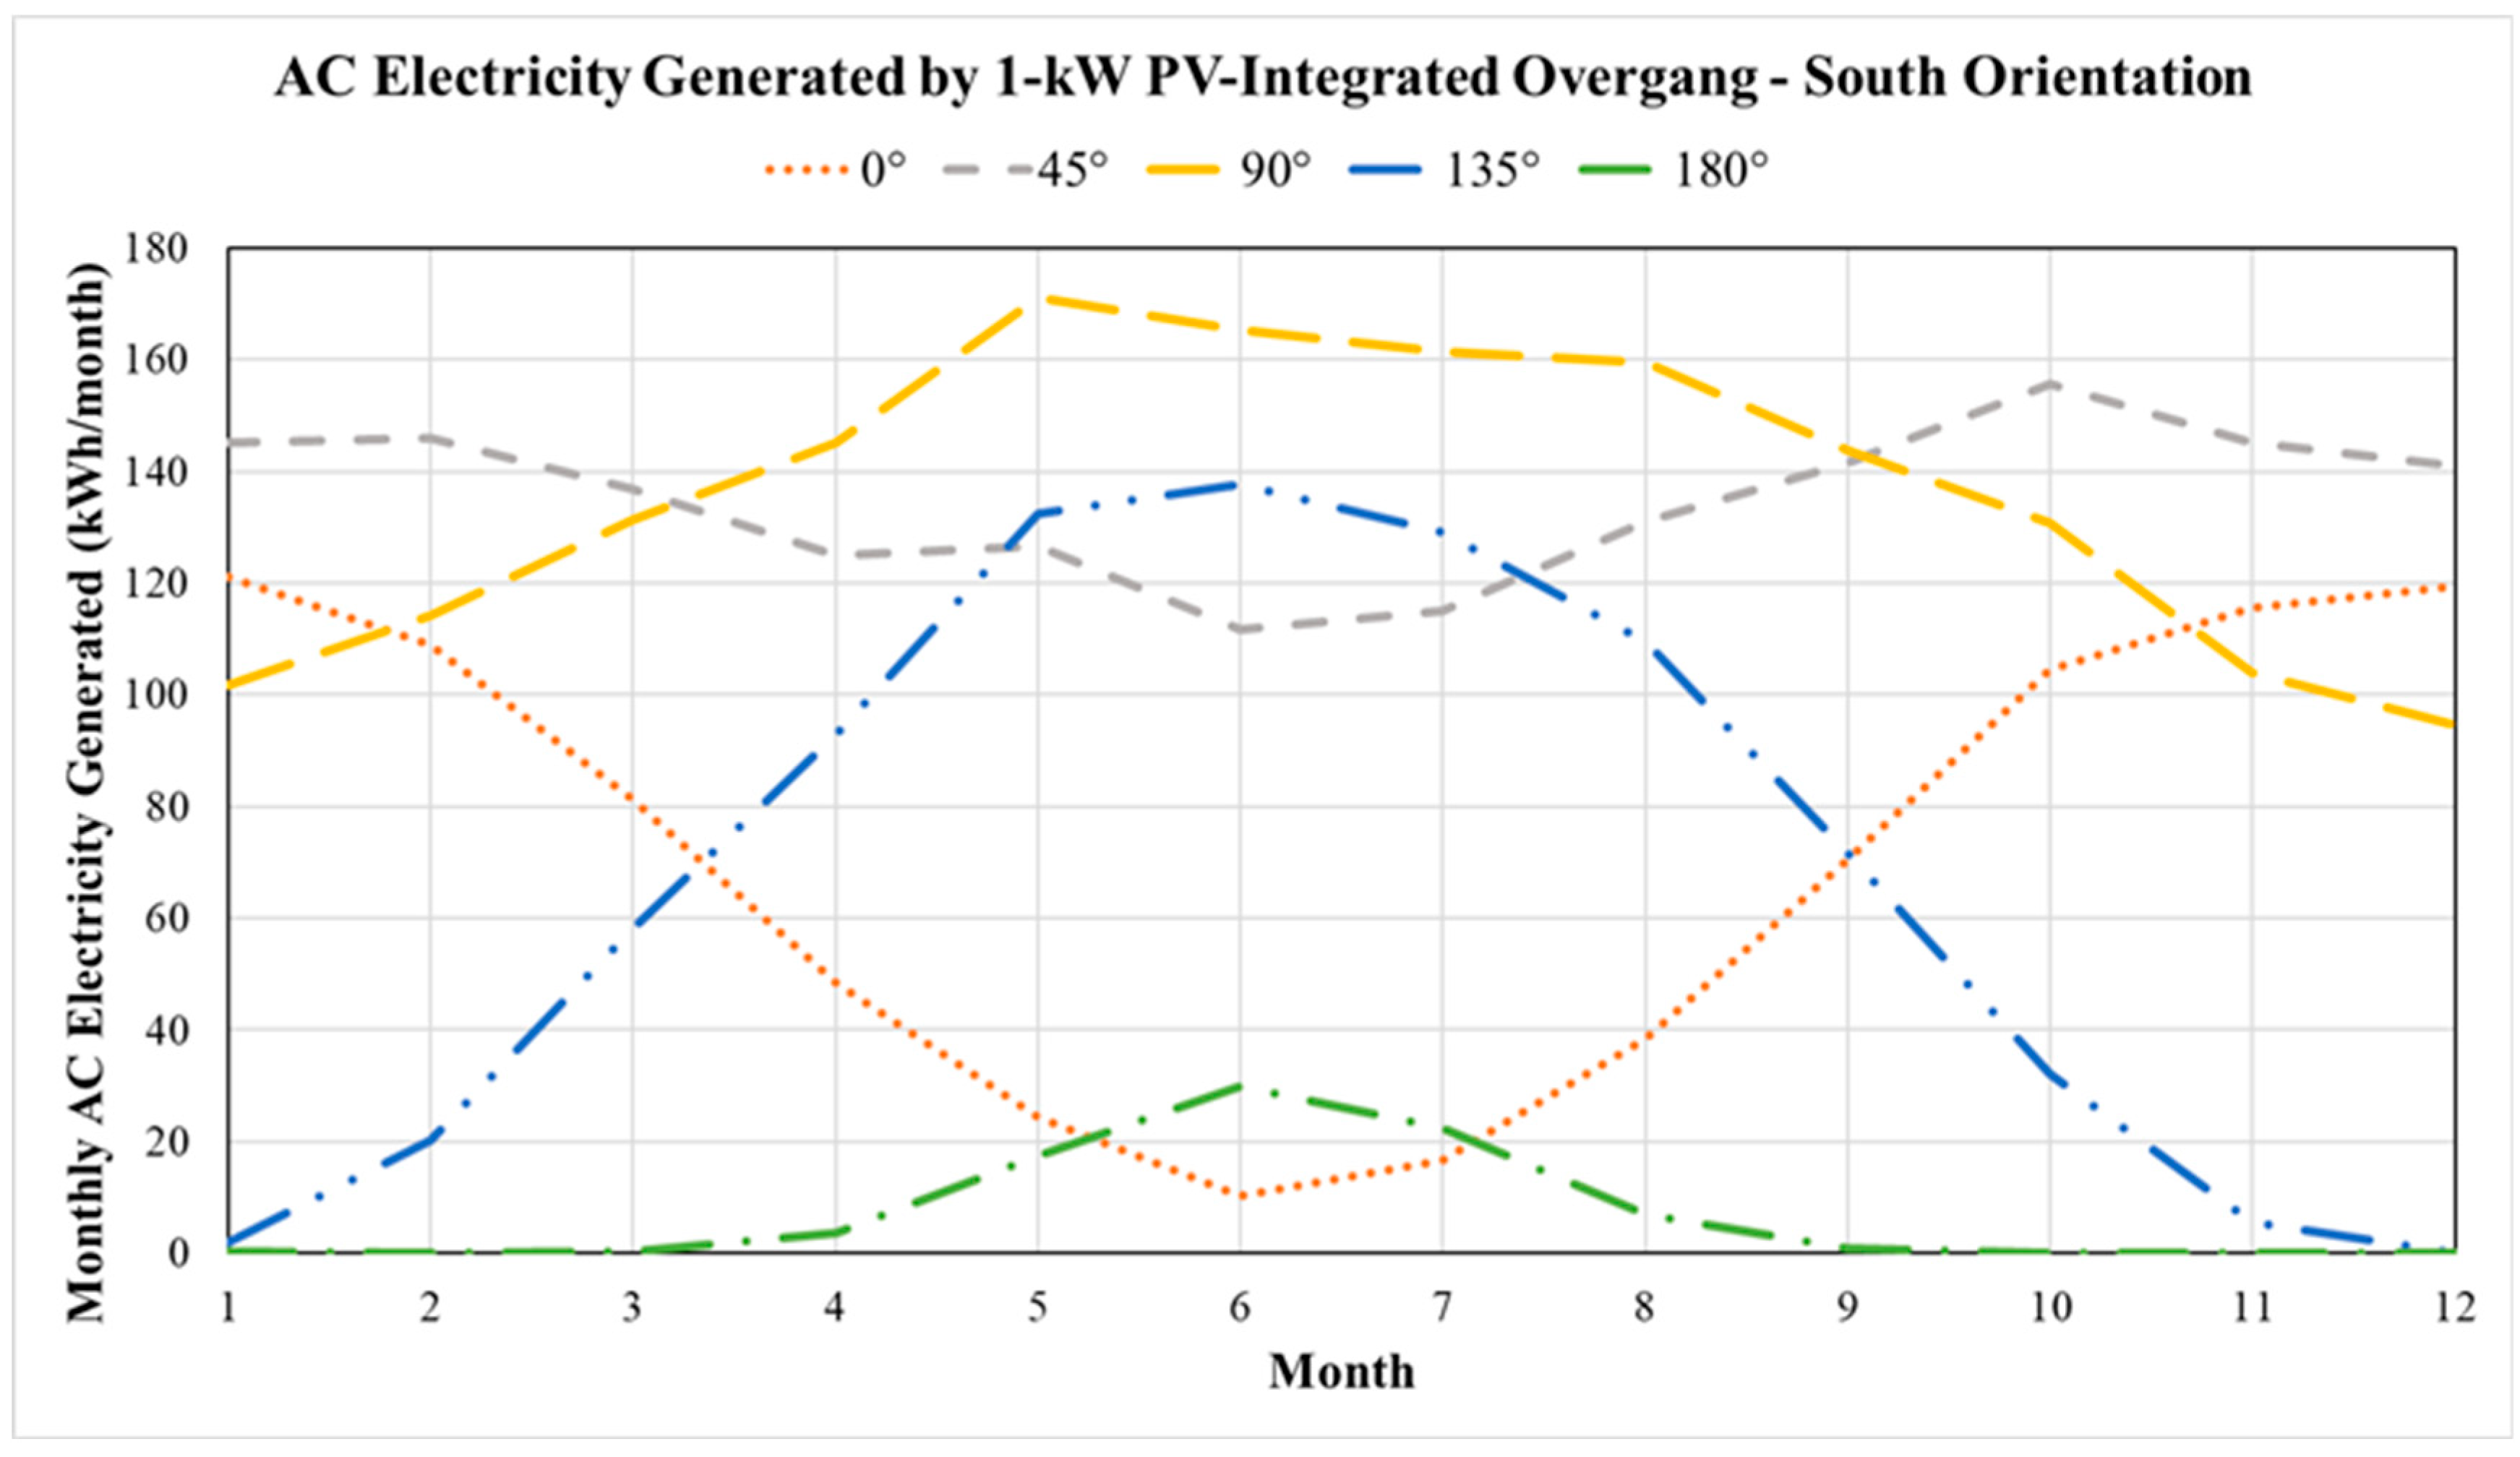
3.2. Electricity Generated from Dynamic PV Panels

The electricity generated by an unshaded PV panel depends on the panel tilt angle, as depicted in Figure 8, which shows four days representing different seasons in Doha, Qatar. As expected, the electricity generation of the PV panel depends on both the tilt angle and the time of year following the sun position. Thus, during the winter season (i.e., 15 January), the PV panel tilted at 45° provides the highest electricity yield throughout the day [Figure 8a]. As the sun position becomes higher during the summer season (i.e., 14 July), a horizontally placed PV panel with a tilt angle θ = 90° for the overhang maximizes the electricity generation [Figure 8c].
When incorporated with an overhang set above the window of the housing unit, as depicted in Figure 3, the PV panel will be subject throughout the year to shading effects from the housing unit walls. These shading effects also depend on the tilt angle of the overhang, as shown in Figure 9, which summarizes the hourly percentage shaded area of the PV-integrated overhang that is oriented south during the entire year for 5 tilt angles when the housing unit is in Doha, Qatar. As expected, the PV-integrated overhang is shaded for the longest period of the year when the tilt angle is set at 180° and for the shortest period when the title angle is 90°.
Therefore, the amount of electricity that can be generated by a 1-kW PV-integrated overhang depends on its tilt angle, as depicted in Figure 10, which shows four days representing different seasons in Doha, Qatar. The effects of shading are considered in the results depicted in Figure 10. These shading effects can be determined by comparing the electricity generated for an unshaded 1-kW PV panel outlined in Figure 8. This comparative analysis indicates that the shading from the housing unit envelope elements affects the yield of the PV panel integrated with the overhang, mostly for high tilt angles (i.e., 135° and 180°). During the summer (i.e., 15 July), the shading effects are minimal for all the tilt angles, as the sun is at its highest position during this period of the year.
Figure 11 illustrates the monthly electricity generated by 1-kW integrated PV panels titled at different angles and maintained fixed throughout the year and oriented south in Doha, Qatar. As shown in Figure 11, the best fixed angle for the overhang is 90° when the annual electricity yield from the PV-integrated overhang is maximized. However, the maximum electricity that can be generated during each month varies depending on the period of the year. Thus, there is a potential for optimizing the annual electricity yield from a south-oriented PV-integrated overhang by changing its tilt angle even on a monthly basis, as shown in Figure 10. The best monthly settings for dynamic PV panels are indicated in Figure 12 to maximize their annual electricity yield for four orientations.
However, the tilt angle settings can be adjusted on a shorter time scale to maximize the annual yield of the electricity produced by PV arrays that are placed on dynamic overhangs. Table 4 summarizes the annual electricity yields achieved by a 1-kW PV array placed on static and dynamic overhangs for four orientations and three adjustment frequencies (i.e., hourly, daily, and monthly) for the variable tilt angle. It should be noted that the power needed for a tracking motor is estimated to be 10 W per 1-kW PV panel and is included and accounted for when estimating the electricity generated by the dynamic PV panel listed in Table 4 [35]. The hourly settings consistently achieve the highest electricity yield for all orientations, especially for western- and eastern-oriented windows. For southern- and northern-oriented windows, however, there is no significant benefit of using hourly settings compared to the monthly settings of the tilt position for the dynamic PV panels. On the other hand, only hourly settings for dynamic PV panels that are oriented west or east result in a significantly higher electricity yield compared to the best position for the static PV panels (i.e., set at a fixed tilt angle of 90°). Indeed, both daily and monthly settings for the dynamic PV panels provide the same electricity yield as the static PV panels oriented west and south, as shown in Table 4.

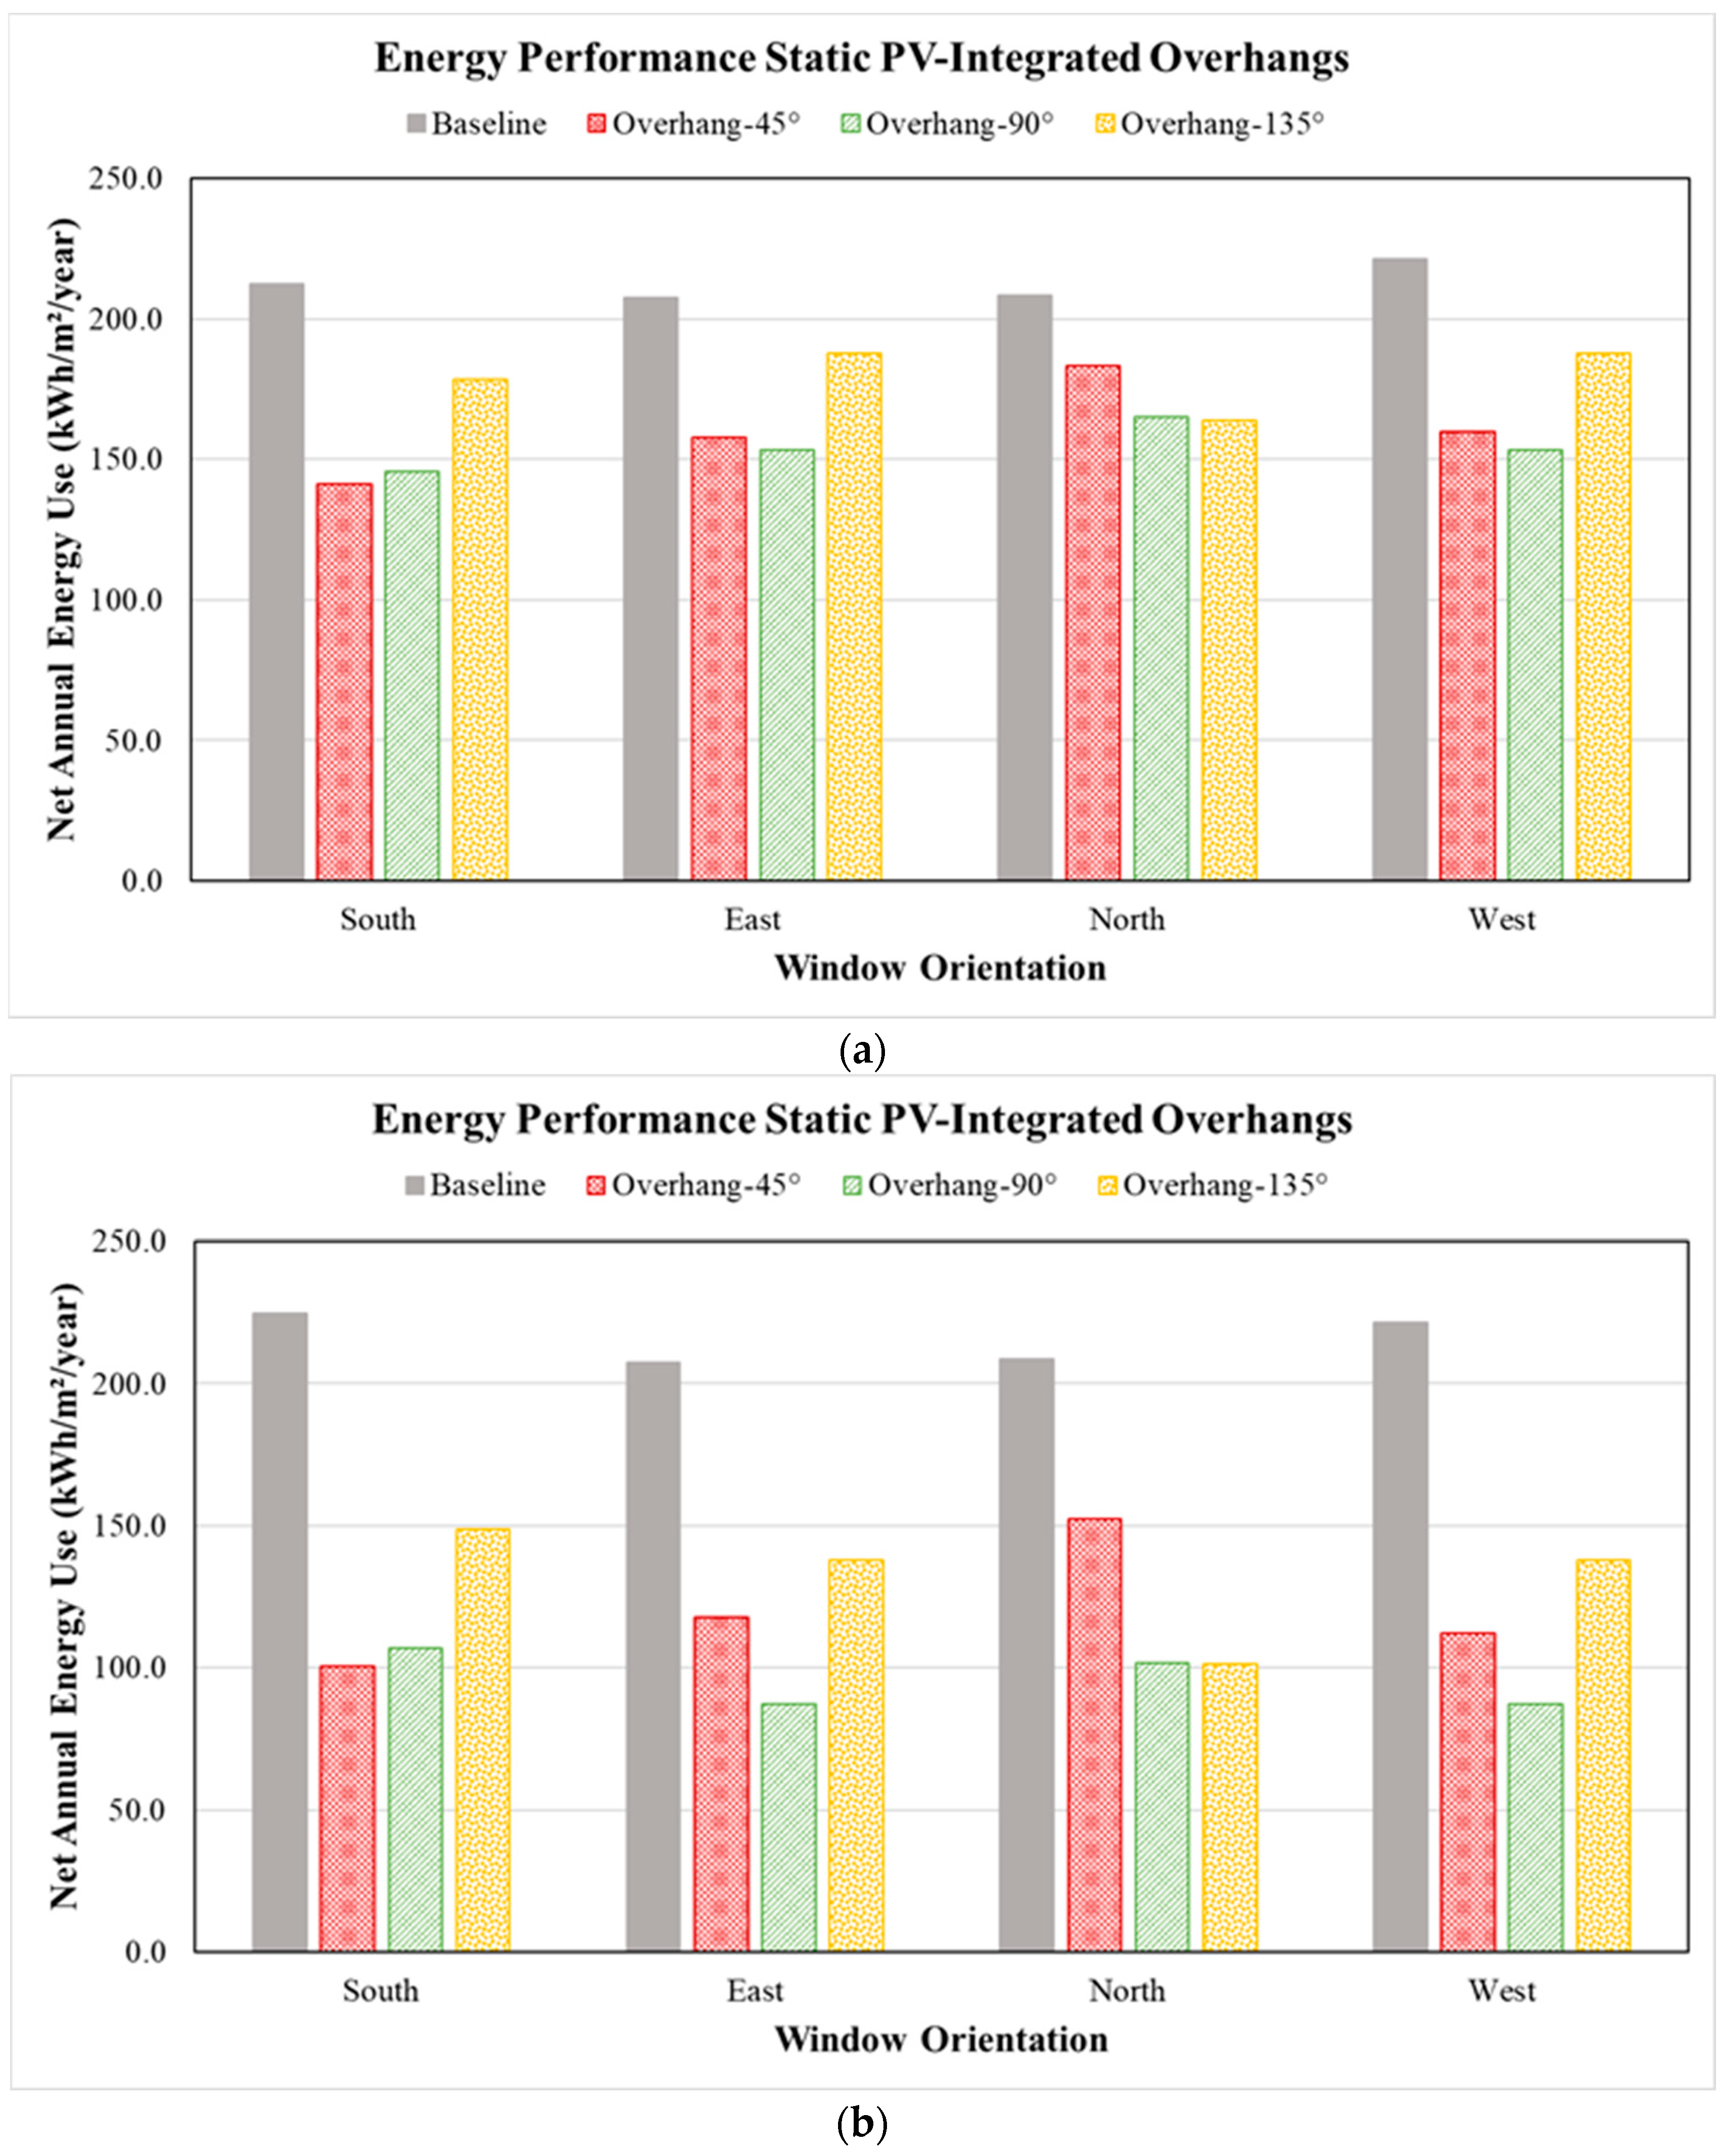
3.3. Energy Performance of PV-Integrated Overhangs

When the solar shading effects and electricity generation capabilities are considered, the full energy benefits of the static and dynamic overhangs incorporating PV arrays can be estimated. Figure 13 compares the annual energy demand per floor area of the housing unit for different static PV-integrated overhang positions with that for the baseline case with no overhang. Four orientations (south, east, north, and west) are considered for the housing unit window. As expected, the PV-integrated overhangs lower substantially the annual energy demand for the dwelling unit. It should be noted that the net metering arrangement is assumed in this analysis so that any excess electricity generated by the PV arrays is supplied to the grid. The tilt angles that minimize the annual energy demand for the dwelling unit equipped with static overhangs incorporating PV arrays depend highly on the window orientation. As noted for both design/operation cases, the optimal tilt angles for static overhangs with PV arrays are 45°, 135°, and 90° when the window is oriented south, north, and west or east, respectively. However, higher reductions are achieved by the overhangs for the modified design/operation case [i.e., Figure 13b] compared to the reference design/operation case [i.e., Figure 13a] due to higher electricity yield generated by larger PV arrays placed on the static shading devices.
The use of dynamic instead of static overhangs incorporating PV arrays can further lower the annual energy needs for the dwelling unit, as indicated in Table 5 for both design/operation cases and three switching frequencies (i.e., hourly, daily, and monthly). Indeed, the dynamic overhangs coupled with PV arrays adjusted using the full tilt angle range (i.e., 0–180°) and the hourly adjustment frequency provide the lowest net annual energy demand for the dwelling unit, particularly for the modified design/operation case with larger windows and thus larger PV arrays. For this dynamic overhang configuration, the annual energy demand for the dwelling unit with south-oriented windows is reduced by 40.9% and 69.7% relative to the unshaded unit option for, respectively, the reference and modified design/operation cases. However, when the dynamic overhangs are adjusted only monthly, their ability to reduce the annual energy needs for the dwelling unit is rather limited when compared to the static overhang configurations set at their optimal position, as noted in Table 6 for both design/operation cases. For instance, there is no benefit in using dynamic instead of static overhangs with PV arrays when monthly or even daily position adjustments are made especially for dwelling units with large windows (i.e., the modified design/operation case).
Figure 14 summarizes the optimal monthly settings for dynamic overhangs having PV arrays with the full tilt angle range of 0–180° specific to two design/operation options, including (a) the reference case (i.e., Theat = 21 °C and WWR = 0.2) and (b) a modified case (i.e., Theat = 23 °C and WWR = 0.4) where the tilt angle needs to be more frequently adjusted when the windows are facing south or north. Typically, dynamic overhangs with PV arrays are set between 45° and 90° for southern windows and between 90° and 135° for northern windows to minimize the annual energy needs of the dwelling unit. For east- and west-facing windows, the dynamic overhangs having PV arrays can be set at the same tilt angle of 90° throughout the year, so the annual energy needs are minimized for the modified design/operation case of the dwelling unit.

3.4. Comparative Analysis for Impact of PV-Integrated Overhangs

Table 6 summarizes the analysis results for the impacts of the deployment of static and dynamic overhangs with and without PV panels on the southern window specific to two design/operation cases for the housing unit in Doha Qatar. Specifically, the annual energy needs are compared to the reference cases with no shading devices. As noted in the summary results, the addition of overhangs always reduces the net energy use of the housing unit, with the highest reductions achieved for dynamic PV-integrated shading devices, especially those adjusted hourly. Indeed, static overhangs without integrating any PV arrays reduce the annual energy use of the housing unit by only 6.7% for the baseline case and 9.1% for the modified case. The addition of PV panels to static overhangs further lowers the energy needs for the housing unit to 33.4% for the baseline case and 55.3% for the modified case.

4. Sensitivity Analyses

This section investigates the energy performance of static and dynamic PV-integrated overhangs when their depth, as well as the window sizes and glazing types, are varied.

4.1. Effects of Depth for Overhangs

The depth of overhangs affects both the shading ability and the PV capacity for both static and dynamic shading devices. Figure 15 shows the variations with the overhang depth of the annual energy demand for the dwelling unit with a southern-facing window equipped with either static or dynamic overhangs with PV arrays. The static overhang is set to be tilted at 45° while the dynamic overhang is allowed to take any tilt angle between 0° and 180° using hourly adjustments. As expected, the reductions in net annual energy demand increase with the overhang depth for both static and dynamic overhangs due to a better shading effect and higher electricity yield. Moreover, the energy efficiency combined with the electricity generation of the dynamic shading systems becomes more substantial compared to their static counterparts as the overhang depth increases. For instance, when the depth of the overhangs is doubled from 0.6 m to 1.2 m, the dynamic shading systems with PV arrays decrease the annual net energy use for the dwelling unit compared to no shading option by 22.4% and 40.9%, respectively. For the same overhang depths (i.e., 0.6 m and 1.2 m), the static shading systems incorporating PV arrays lower the annual energy demand of the same dwelling unit without any shading by 19.0% and 33.4%, respectively.

4.2. Effects of Window/Wall Ratio

The window size affects the heat balance for the housing unit, as well as the width of the overhang and ultimately its shading effect and PV capacity. Figure 16 indicates the variation in annual energy use per floor area of the dwelling unit with the window size for both static and dynamic overhangs incorporating PV arrays. The static overhang is set at a fixed tilt angle of 45°, while the dynamic overhang can be adjusted hourly at any tilt angle between 0° and 180°. Figure 16 shows that the annual energy needs decrease with the window size (i.e., WWR) for both types of overhangs due to higher shading effects and PV electricity yields. Moreover, the dynamic shading systems outperform their static counterparts as the windows become larger. For instance, when WWR is doubled from 0.2 to 0.4, the dynamic shading systems reduce the annual net energy use for the dwelling unit without any shading device (and thus no PV arrays) by 32.3% and 67.3%, respectively. For the same window sizes, the static shading systems lower the annual energy demand of the unshaded dwelling unit by 23.7% and 50.5%, respectively.

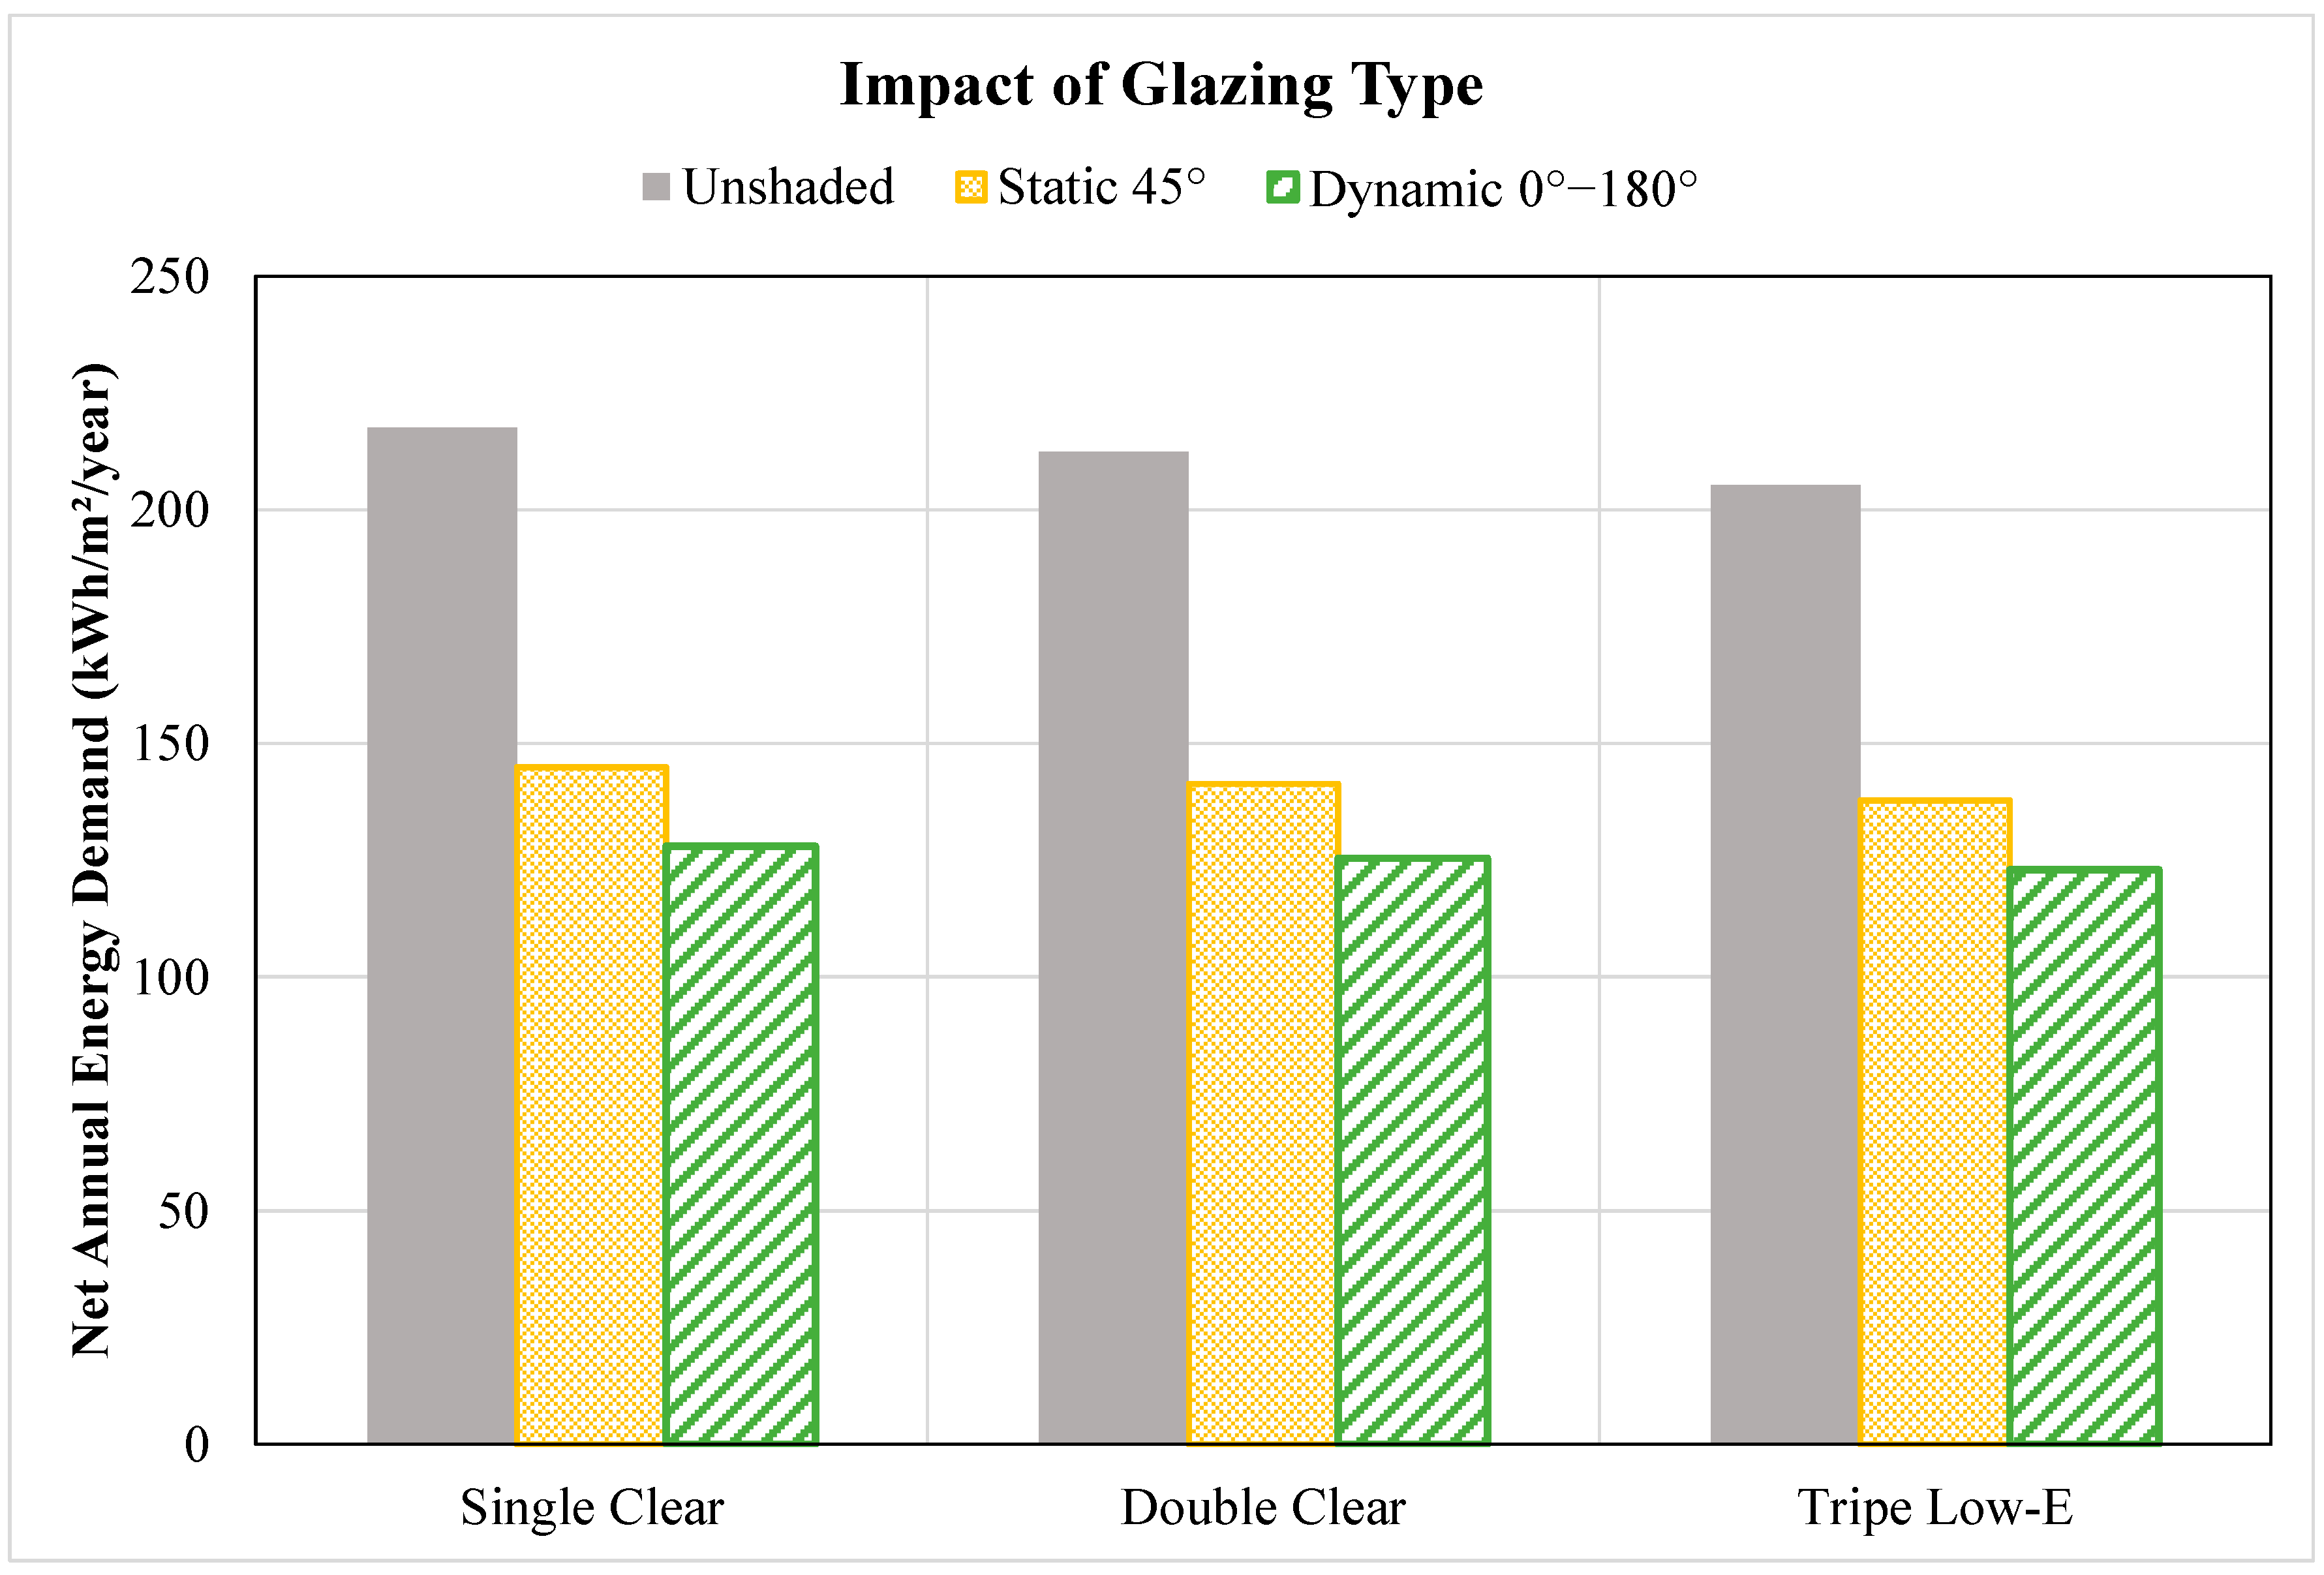
4.3. Effects of Glazing Type for Windows

The glazing type affects the thermal cooling loads for the dwelling unit without changing the shading performance or the amount of electricity produced by the PV arrays placed on either static or dynamic overhangs. Figure 17 outlines the variation of the annual energy use per floor area of the dwelling unit with south-facing windows for various glazing types. The analysis outlined in Figure 17 considers three options: (i) unshaded, (ii) static overhang with a fixed tilt angle of 45°, and (iii) dynamic overhang with hourly adjustable tilt angle between 0° and 180°. The results outlined in Figure 16 confirm that the annual energy need for the dwelling unit can be lowered more significantly using dynamic instead of static shading systems for all glazing types. The energy use reductions relative to the unshaded dwelling unit case are generally independent of the glazing type and are estimated to be 33% and 41% for static and dynamic shading systems, respectively. However, higher-performance windows (i.e., with double and triple pane glazing) lower the dwelling unit energy needs compared to those with single pane glazing for all deshading conditions and options. For instance, triple pane glazing lowers the energy use of an unshaded dwelling unit by 5.6% compared to cases with single pane glazing. This reduction becomes 4.9% and 3.9% when the static and dynamic overhangs, respectively, are deployed with PV arrays.

5. Summary and Conclusions

The results of the analysis outlined in this paper clearly indicate that the deployment of dynamic overhangs incorporating PV arrays can significantly reduce the annual energy demand for residential buildings in Qatar. The benefits of the dynamic shading systems involve both maximizing electricity yields from the PV arrays and minimizing the thermal cooling loads due to the shading effects of the overhangs. However, the benefits of dynamic overhangs with PV arrays depend on a wide range of factors, including:
The adjustment frequency of the dynamic overhang position: Indeed, the analysis shows that hourly settings provide higher reductions in annual energy demand for the dwelling units compared to daily and monthly settings. For the reference design/operation for the dwelling unit with southern-oriented windows with WWR = 0.2, the hourly adjustments for dynamic overhangs reduce the annual energy demand by 40.9% compared to the no-shading case. The daily and monthly adjustments result in reductions of 35.8% and 35.7%, respectively, relative to the dwelling units with no shading.
The size of the windows: The benefits of dynamic overhangs increase with the size of the windows due to larger PV arrays and higher shading effects. When the size of southern-facing windows is doubled from WWR = 0.2 to WWR = 0.4, the reductions in annual energy demand jump from 40.9% to 69.7% compared to the unshaded dwelling unit case when hourly position adjustments are considered for the dynamic overhangs.
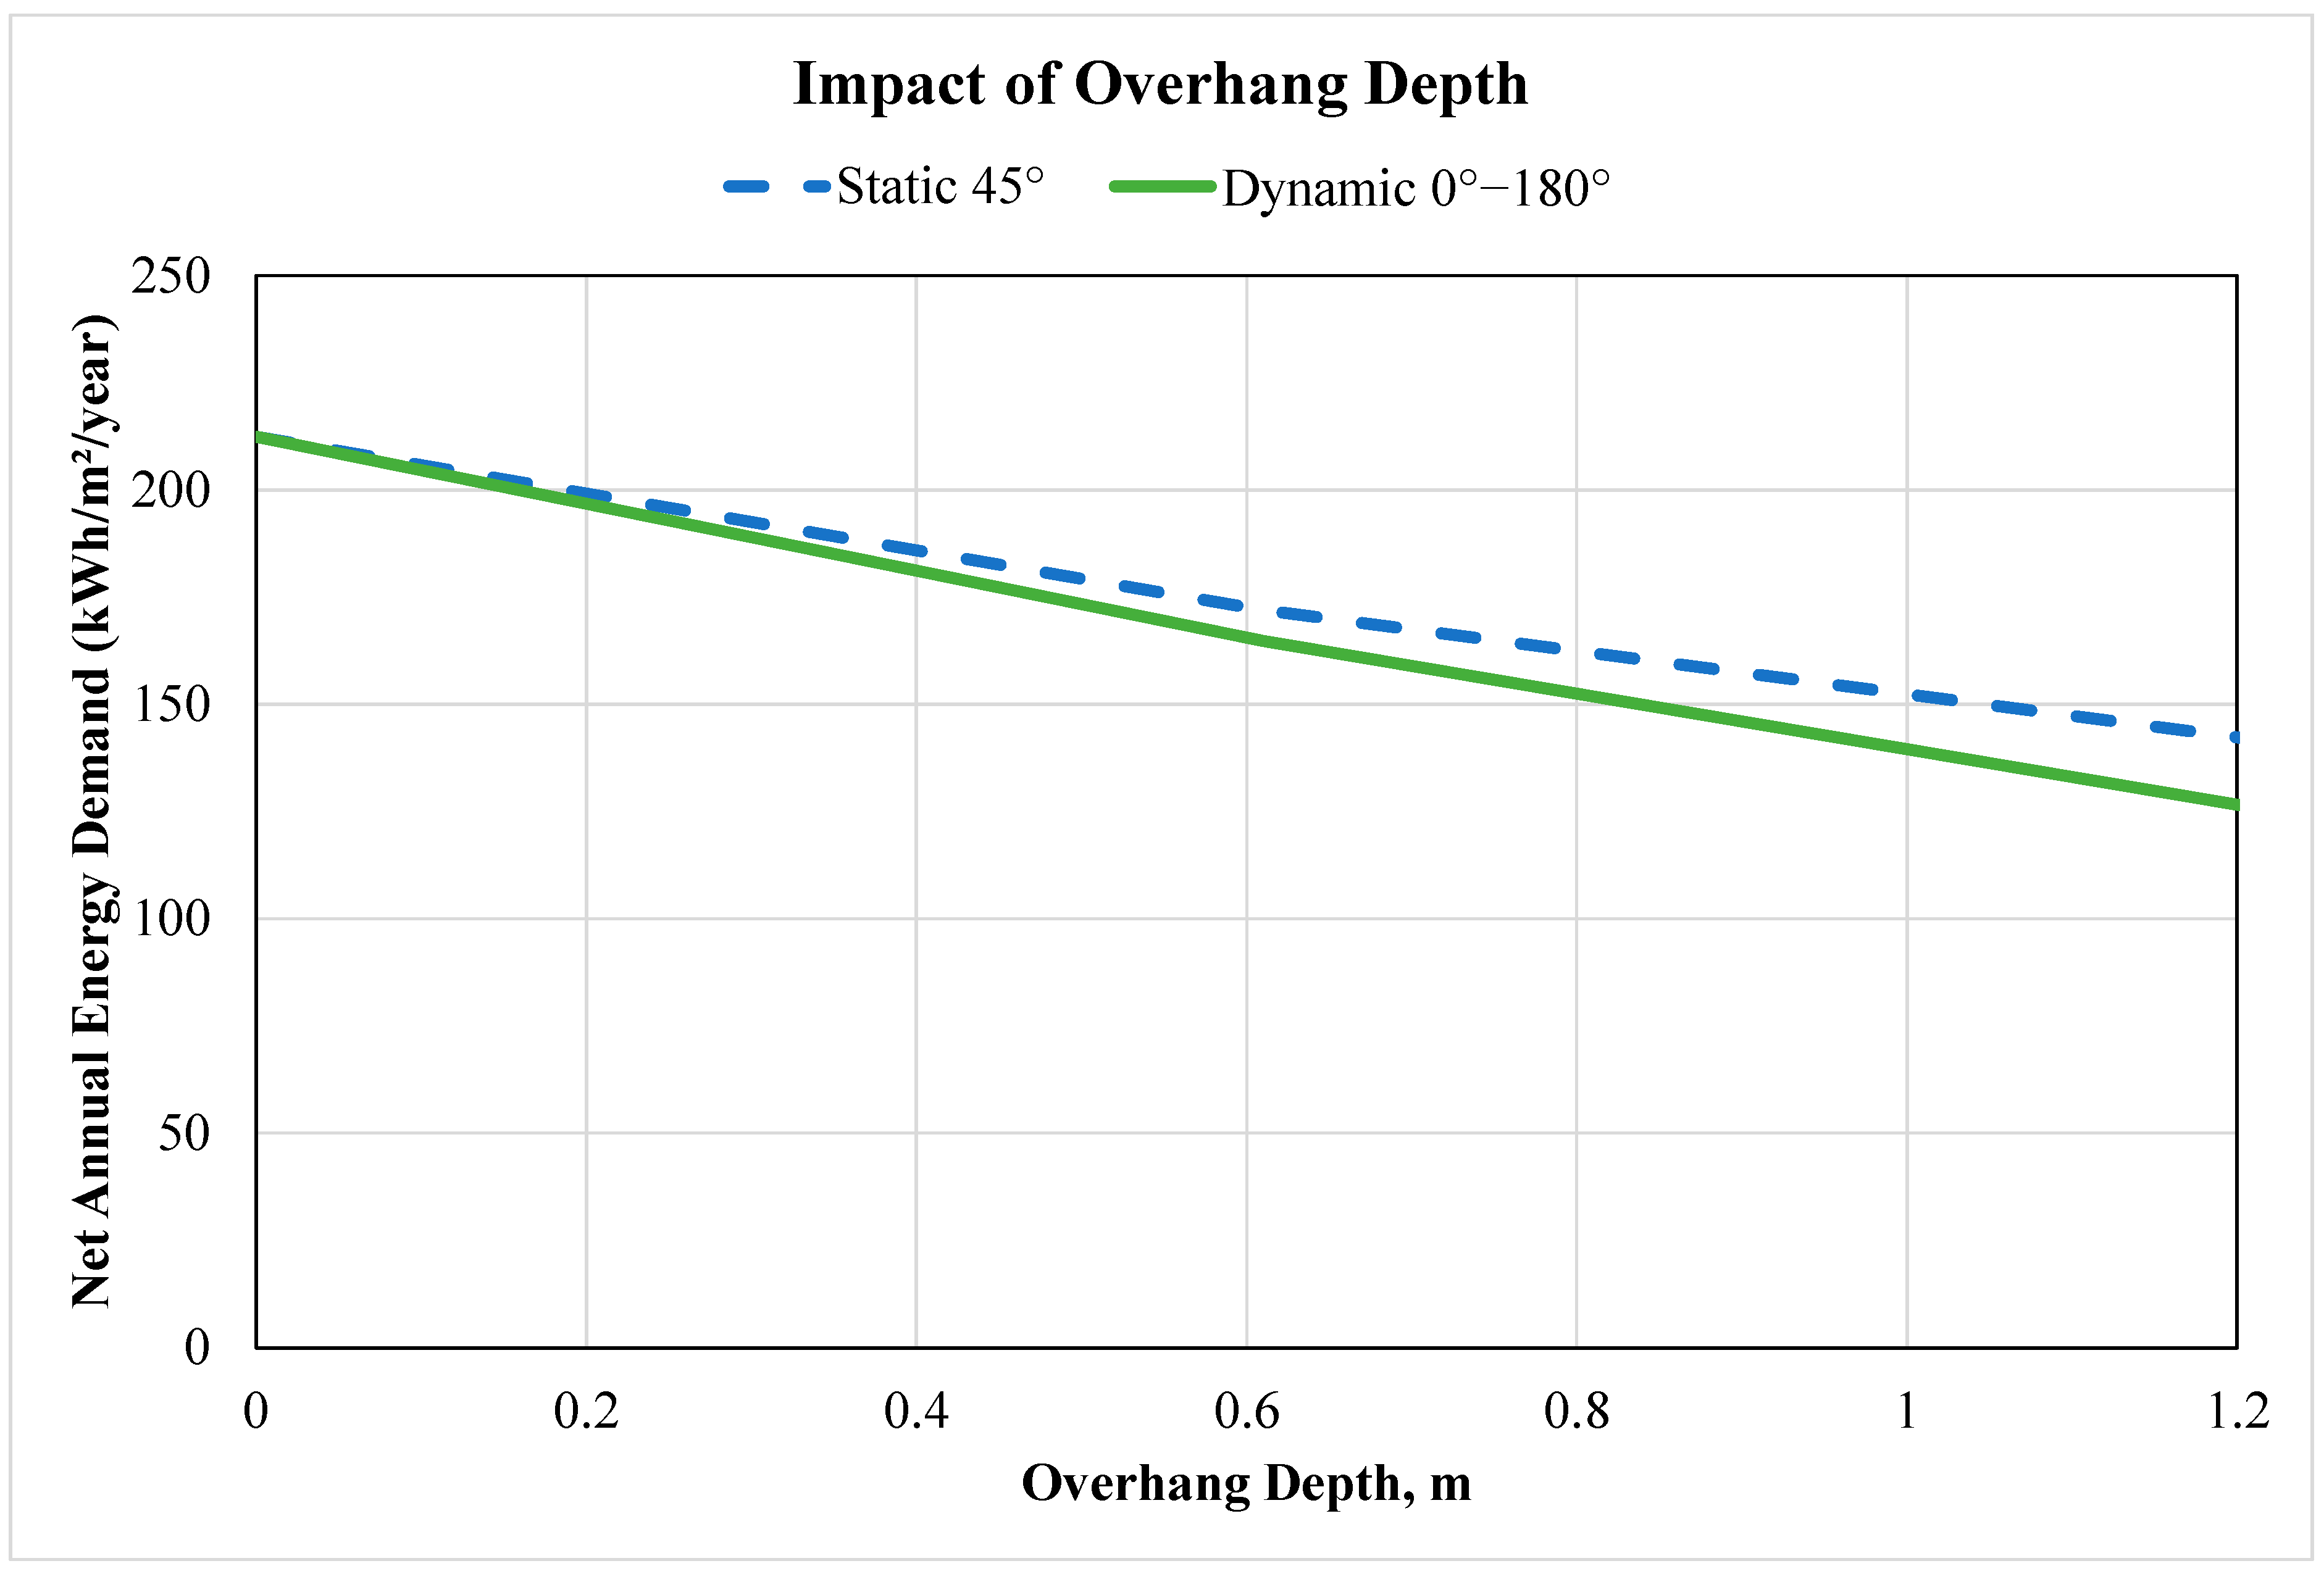
The depth of the overhangs: Higher depths for the dynamic overhangs result in larger PV arrays and higher shading capabilities and subsequently higher reductions in annual energy demands for the dwelling units. Specifically, when the overhang depth of southern-facing windows is doubled from 0.6 m to 1.2 m, the deployment of dynamic overhangs reduces the annual energy demand for the housing unit without any shading by 22.4% and 40.9%, respectively.
The orientation of the windows: The analysis indicates that the application of dynamic overhangs provides the highest annual energy reductions for the dwelling unit when the windows are oriented west. Indeed, the reductions of the annual energy demand for the dwelling unit due to the deployment of dynamic overhangs relative to the no shading case are estimated to be 75.5%, 71.9%, 69.7%, and 61.9% for windows facing west, east, south, and north, respectively.
In summary, the deployment of dynamic overhangs having PV arrays offers an effective solution for new and existing residential buildings in Qatar to enhance both the capacity of on-site electricity generation using renewable energy resources and the energy efficiency by using adaptive shading devices. The validation of the results presented in this paper should be part of a planned demonstration project to build, install, and operate dynamic overhang prototypes suitable for Qatari dwellings. In addition, a cost-benefit analysis should be conducted to assess the economic feasibility of both static and dynamic PV-integrated shading devices when deployed for residential buildings in Qatar. While the main findings of this study should be applicable to residential buildings located in other hot climates, including the countries of the Gulf Cooperation Council (GCC), specific evaluations for the energy and cost benefits of the PV-integrated dynamic overhangs should be carried out to accommodate the variations in building types and climatic conditions across other regions.

Author Contributions

Conceptualization, M.K., M.A.A., F.T. and M.R.P.; Methodology, M.K., M.A.A., F.T. and M.R.P.; Software, M.K.; Formal Analysis, M.K., M.A.A., F.T. and M.R.P.; Investigation, M.A.A., M.K., F.T. and M.R.P.; Resources, M.A.A., M.K., F.T. and M.R.P.; Data Curation, M.K., M.A.A., F.T. and M.R.P.; Writing—Original Draft Preparation, M.K.; Writing—Review & Editing, M.K., M.A.A., F.T. and M.R.P.; Visualization, M.K. and M.A.A.; Supervision, M.A.A.; Project Administration, M.A.A.; Funding Acquisition, M.A.A. All authors have read and agreed to the published version of the manuscript.

Funding

This research was funded by Qatar University under grant number QUCG-CENG-24-25-408.

Data Availability Statement

Dataset available on request from the authors.

Conflicts of Interest

The authors have no relevant financial or non-financial interests to disclose regarding this paper.

Abbreviations

The following abbreviations are used in this manuscript:
Abbreviations
ACAir Conditioning
COPCoefficient of Performance for Heating Mode Operation of a Heat Pump
DBEMDistinct Building Energy Model
EEREnergy Efficiency Ratio for Cooling Mode Operation of a Heat Pump [Btu/W]
HVACHeating, Ventilation, and Air Conditioning
PBMParametric Building Model
PVPhotovoltaic
R-valueThermal Resistance in IP Unit [hr·°F·ft2/Btu]
RSIThermal resistance in SI Unit [°C·m2/W]
SHGCSolar Heat Gain Coefficient
TheatHeating Temperature Setpoint [°C]
U-valueConductance value [W/°C·m2]
WWRWindow-to-Wall Ratio
Symbols
θOverhang Angle Position in Degrees (Refer to Figure 3)

References

  1. Krarti, M.; Ali, F.; Alaidroos, A.; Houchati, M. Macro-economic benefit analysis of large-scale building energy efficiency programs in Qatar. Int. J. Sustain. Built Environ. 2017, 6, 597–609. [Google Scholar] [CrossRef]
  2. UNSTAT, United Nations Statistics Division. International Standard Industrial Classification of All Economic Activities, Rev.3.1. 2016. Available online: https://unstats.un.org/unsd/classifications/Econ/Download/In%20Text/Isic31_English.pdf (accessed on 2 September 2024).
  3. EIA, US Energy Information Administration. Annual Energy Outlook 2018, Technical Report, Washington, DC, USA. Available online: https://www.eia.gov/outlooks/archive/aeo18/ (accessed on 29 August 2024).
  4. Kim, G.; Hong, S.L.; Tae, S.L.; Schaefer Laura, S.; Taidim Jeong, T. Comparative advantage of an exterior shading device in thermal performance for residential buildings. Energy Build. 2012, 46, 105–111. [Google Scholar] [CrossRef]
  5. Aldawoud, A. Conventional fixed shading devices in comparison to an electrochromic glazing system in hot, dry climate. Energy Build. 2013, 59, 104–110. [Google Scholar] [CrossRef]
  6. Cho, J.; Yoo, C.; Kim, Y. Viability of exterior shading devices for high-rise residential buildings: Case study for cooling energy-saving and economic feasibility analysis. Energy Build. 2014, 82, 771–785. [Google Scholar] [CrossRef]
  7. Hoffmann, S.; Lee, S.E.; McNeil, A.; Fernandes, L.; Dragan Vidanovic, D.; Thanachareonkit, A. Balancing daylight, glare, and energy-efficiency goals: An evaluation of exterior coplanar shading systems using complex fenestration modeling tools. Energy Build. 2016, 111, 279–298. [Google Scholar] [CrossRef]
  8. Vlachokostas, A.; Madamopoulos, N. Quantification of energy savings from dynamic solar radiation regulation strategies in office buildings. Energy Build. 2016, 122, 140–149. [Google Scholar] [CrossRef]
  9. Nielsen, M.V.; Svendsen, S.; Jensen, L.B. Quantifying the potential of automated dynamic solar shading in office buildings through integrated simulations of energy and daylight. Solar Energy 2011, 85, 757–768. [Google Scholar] [CrossRef]
  10. Hammad, F.; Abu-Hijleh, B. The energy savings potential of using dynamic external louvers in an office building. Energy Build. 2010, 42, 1888–1895. [Google Scholar] [CrossRef]
  11. Krarti, M. Evaluation of Energy Performance of Dynamic Overhang Systems for US Residential Buildings. Energy Build. 2021, 234, 110699. [Google Scholar] [CrossRef]
  12. Zhang, X.; Lau, S.K.; Lau, S.S.Y.; Zhao, Y. Photovoltaic integrated shading devices (PVSDs): A review. Sol. Energy 2018, 170, 947–968. [Google Scholar] [CrossRef]
  13. Jakica, N. State-of-the-art review of solar design tools and methods for assessing daylighting and solar potential for building-integrated photovoltaics. Renew. Sustain. Energy Rev. 2018, 81, 1296–1328. [Google Scholar] [CrossRef]
  14. Debbarma, M.; Sudhakar, K.; Baredar, P. Thermal modeling, exergy analysis, performance of BIPV and BIPVT: A Review. Renew. Sustain. Energy Rev. 2017, 73, 1276–1288. [Google Scholar] [CrossRef]
  15. Shukla, A.K.; Sudhakar, K.; Baredar, P. A comprehensive review on design of building integrated photovoltaic system. Energy Build. 2016, 128, 99–110. [Google Scholar] [CrossRef]
  16. Jeong, K.; Hong, T.; Koo, C.; Oh, J.; Lee, M.; Kim, J. A prototype design and development of the smart photovoltaic system blind considering the photovoltaic panel, tracking system, and monitoring system. Appl. Sci. 2017, 7, 1077. [Google Scholar] [CrossRef]
  17. Zhang, W.; Lu, L.; Peng, J. Evaluation of potential benefits of solar photovoltaic shadings in Hong Kong. Energy 2017, 137, 1152–1158. [Google Scholar] [CrossRef]
  18. Shum, C.; Zhong, L. A review of smart solar shading systems and their applications: Opportunities in cold climate zones. J. Build. Eng. 2023, 64, 105583. [Google Scholar] [CrossRef]
  19. Jhumka, H.; Yang, S.; Gorse, C.; Wilkinson, S.; Yang, R.; He, B.J.; Prasad, D.; Fiorito, F. Assessing heat transfer characteristics of building envelope deployed BIPV and resultant building energy consumption in a tropical climate. Energy Build. 2023, 298, 113540. [Google Scholar] [CrossRef]
  20. Sohani, A.; Cornaro, C.; Shahverdian, M.H.; Pierro, M.; Moser, D.; Nižetić, S.; Karimi, N.; Li, L.K.B.; Doranehgard, M.H. Building integrated photovoltaic/thermal technologies in Middle Eastern and North African countries: Current trends and future perspectives. Renew. Sustain. Energy Rev. 2023, 182, 113370. [Google Scholar] [CrossRef]
  21. Kirimtat, A.; Tasgetiren, M.F.; Brida, P.; Krejcar, O. Control of PV integrated shading devices in buildings: A review. Build. Environ. 2022, 214, 108961. [Google Scholar] [CrossRef]
  22. Saranti, A.; Tsoutsos, T.; Mandalaki, M. Sustainable Energy Planning. Des. Shading Devices Integr. Photovolt. Syst. Resid. Hous. Units. Procedia Eng. 2015, 123, 479–487. [Google Scholar]
  23. Basurto, C.; Kämpf, J.H.; Scartezzini, J.L. Annual Performance Assessment of Complex Fenestration Systems in Sunny Climates Using Advanced Computer Simulations. J. Daylighting 2015, 2, 32–43. [Google Scholar] [CrossRef]
  24. Hofer, J.; Groenewolt, A.; Jayathissa, P.; Nagy, Z.; Schlueter, A. Parametric analysis and systems design of dynamic photovoltaic shading modules. Energy Sci. Eng. 2015, 4, 134–152. [Google Scholar] [CrossRef]
  25. Koo, C.; Hong, T.; Jeong, K.; Ban, C.; Oh, J. Development of the smart photovoltaic system blind and its impact on net-zero energy solar buildings using technical-economic-political analyses. Energy 2017, 124, 382–396. [Google Scholar] [CrossRef]
  26. Kang, H.; Hong, T.; Lee, M. Technical performance analysis of the smart solar photovoltaic blinds based on the solar tracking methods considering the climate factors. Energy Build. 2019, 190, 34–48. [Google Scholar] [CrossRef]
  27. Krarti, M. Evaluation of PV integrated sliding-rotating overhangs for US apartment buildings. Appl. Energy 2021, 293, 116942. [Google Scholar] [CrossRef]
  28. Krarti, M. Impact of PV integrated rotating overhangs for US residential buildings. Renew. Energy 2021, 174, 835–849. [Google Scholar] [CrossRef]
  29. Krarti, M. Performance of PV integrated dynamic overhangs applied to US homes. Energy 2021, 230, 12084. [Google Scholar] [CrossRef]
  30. Kim, H.; Clayton, M.J. Parametric behavior maps: A method for evaluating the energy performance of climate-adaptive building envelopes. Energy Build. 2020, 219, 110020. [Google Scholar] [CrossRef]
  31. DOE-2. DOE-2 Engineers Manual. Lawrence Berkeley National Laboratory and Los Alamos National Laboratory, US Department of Energy, Washington, DC, USA. Available online: http://doe2.com/download/DOE-21E/DOE-2EngineersManualVersion2.1A.pdf (accessed on 2 August 2024).
  32. Meldem, R.; Winkelmann, F. Comparison of DOE-2 with temperature measurements in the Pala test houses. Energy Build. 1998, 27, 69–81. [Google Scholar] [CrossRef]
  33. Loutzenhiser, P.G.; Maxwell, G.M.; Manz, H. An empirical validation of the daylighting algorithms and associated interactions in building energy simulation programs using various shading devices and windows. Energy 2007, 32, 1855–1870. [Google Scholar] [CrossRef]
  34. Hassan, M.A.; Shebl, S.S.; Ibrahim, E.A. Modeling and validation of the thermal performance of an affordable, energy efficient, healthy dwelling unit. Build. Simul. 2011, 4, 255–262. [Google Scholar] [CrossRef]
  35. SAM. Solar Advisor Module. Analysis tool for Solar Distributed Generation Systems, National Renewable Energy Laboratory, Golden, CO. 2020. Available online: https://sam.nrel.gov/ (accessed on 12 August 2024).
Figure 1. General analytic approach used to evaluate the energy performance of both static and dynamic shading devices incorporating PV panels.
Energies 18 01156 g001
Figure 2. PV-integrated dynamic overhang with (a) rotation options of the PV panel and associated (b) views from inside.
Energies 18 01156 g002
Figure 3. Illustrations to define (a) position of the overhang using the tilt angle, θ, and to indicate (b) its basic operation components when deployed with PV panel as a shading device for a window.
Energies 18 01156 g003
Figure 4. (a) 3-D rendering, (b) floor plan, (c) south wall view, and (d) east wall view for the unit cell model used in this study.
Energies 18 01156 g004
Figure 5. Electricity end-uses in kWh for the unit cell based on (a) monthly and (b) annual analyses.
Energies 18 01156 g005
Figure 6. Monthly electricity per unit floor area of the unit housing cell without any overhangs under various design and operation conditions when located in Doha, Qatar.
Energies 18 01156 g006
Figure 7. Monthly electricity per unit floor area of the unit housing cell with static overhangs without any PV panels under various design and operation conditions when located in Doha, Qatar. (a) Reference design/operation case (i.e., Theat = 21 °C and WWR = 0.2). (b) Modified design/operation case (i.e., Theat = 23 °C and WWR = 0.4).
Energies 18 01156 g007aEnergies 18 01156 g007b
Figure 8. Hourly profiles of electricity output from an unshaded 1-kW PV array set at various tilt angles for four representative days, including (a) winter (15 January), (b) spring (15 April), (c) summer (15 July), and (d) fall (15 October), in Doha, Qatar.
Energies 18 01156 g008
Figure 9. Cumulative distributions for hourly percent shaded area of southern-oriented overhangs for various angles located in Doha, Qatar.
Energies 18 01156 g009
Figure 10. Hourly profiles of AC electricity generated by a 1-kW PV array incorporated in a static overhang set at various tilt angles for four representative days, including (a) winter (15 January), (b) spring (15 April), (c) summer (15 July), and (d) fall (15 October), in Doha, Qatar.
Energies 18 01156 g010
Figure 11. Monthly electricity produced by a 1-kW PV array incorporated in a static overhang set at various tilt angles in Doha, Qatar.
Energies 18 01156 g011
Figure 12. Optimal settings for monthly tilt angles that maximize electricity yield for 1-kW PV array placed on a dynamic overhang specific to four orientations in Doha, Qatar.
Energies 18 01156 g012
Figure 13. Annual energy use per floor area of the housing unit for various static PV-integrated overhangs for two design/operation cases. (a) Reference design/operation case (i.e., Theat = 21 °C and WWR = 0.2). (b) Modified design/operation case (i.e., Theat = 23 °C and WWR = 0.4).
Energies 18 01156 g013
Figure 14. Optimal monthly tilt angles for dynamic overhangs having PV arrays for two design/operation cases of the dwelling unit. (a) Reference design/operation case (i.e., Theat = 21 °C and WWR = 0.2). (b) Modified design/operation case (i.e., Theat = 23 °C and WWR = 0.4).
Energies 18 01156 g014aEnergies 18 01156 g014b
Figure 15. Net annual energy demand as a function of the overhang depth for static and dynamic PV integrated overhangs for the reference design/operation case (i.e., Theat = 21 °C and WWR = 0.2).
Energies 18 01156 g015
Figure 16. Net annual energy demand as a function of the window size for static and dynamic PV-integrated overhangs for the reference design/operation case (i.e., Theat = 21 °C and WWR = 0.2).
Energies 18 01156 g016
Figure 17. Net annual energy demand for various glazing types for southern-oriented windows with static and dynamic PV-integrated overhangs for the reference design/operation case (i.e., Theat = 21 °C and WWR = 0.2).
Energies 18 01156 g017
Table 1. Main characteristics of the housing unit cell model used for the study.
ParameterValueComments
Floor Dimensions2.9 m × 1.9 m = 5.5 m2Rectangular shape
Height from Floor to Ceiling2.15 m to 2.25 mVary, as the roof is sloped
Wall Construction Sandwiched panels made of thin 28 gauge aluminum layer, 5 cm white cork, 0.4 cm woodU-value = 0.23 W/m2K
Floor Construction Same sandwiched panels used for walls Floor is raised by 20 cm above the ground and exposed to outside air.
R-value
Roof ConstructionSame sandwiched panels but with cork thickness variable from 5 cm to 15 cmR-value = 3.22 m2K/W
Window Wal Ratio20% Window in one orientation
Size of window 1.20 m by 1.00 m
Window Glazing TypeClear Double PaneU-value = 3.23 W/m2K
SHGC = 0.76
Occupants2 peopleMaximum occupancy level
Lighting Power Density6 W/m2When all lighting fixtures are operating
Indoor Temperature Settings 21 °C for heating and 24 °C for coolingThermostat settings are pre-programmed
HVAC System and EfficiencyHeat Pump with COP of 2.60 for cooling and 2.59 for heating
Table 2. Impact of selected design and operation strategies on annual energy use for the housing unit expressed in kWh/m2/year.
End-UseReference Case
Theat = 21 °C and WWR = 0.2
Theat = 23 °C and WWR = 0.2Theat = 21 °C and WWR = 0.4
Cooling180.0180.2182.1
Heating11.219.011.6
Fans3.93.95.4
Lighting17.417.417.4
Total212.4220.4216.5
Table 3. Savings in annual energy use for a dwelling unit having a southern-oriented window shaded with overhangs for two design/operation cases compared to unshaded housing unit configuration. (a) Baseline (i.e., Theat = 21 °C and WWR = 0.2). (b) Higher heating setpoint temperature and large window (i.e., Theat = 23 °C and WWR = 0.4).
(a)
Switching
Frequency
Static Overhangs (Fixed Tilt Angle)Dynamic Overhangs (Range of Tilt Angles)
45°90°135°180°0–180°0–135°0–90°45–135°
Hourly9.6%6.7%4.7%2.9%0.0%11.8%11.3%11.1%7.2%
Daily9.9%9.9%9.6%6.7%
Monthly9.6%9.6%9.6%6.7%
(b)
Switching
Frequency
Static Overhangs (Fixed Tilt Angle)Dynamic Overhangs (Range of Tilt Angles)
45°90°135°180°0–180°0–135°0–90°45–135°
Hourly8.3%4.8%1.8%9.1%0.0%15.4%15.3%10.3%12.0%
Daily11.6%11.6%8.3%9.1%
Monthly10.3%10.3%8.3%4.8%
Table 4. Annual generated electricity from 1-kW PV panels for four orientations in Doha, Qatar.
OrientationSouthEastNorthWest
Type and Adjustment Frequency of PV PanelsPV-Generated Electricity (kWh/year)Increase Relative to StaticPV-Generated Electricity (kWh/year)Increase Relative to StaticPV-Generated Electricity (kWh/year)Increase Relative to StaticPV-Generated Electricity (kWh/year)Increase Relative to Static
Static16230.0%14250.0%15210.0%15770.0%
Dynamic-Hourly182812.6%190533.7%171512.8%197825.4%
Dynamic-Daily182112.2%14260.1%171112.5%15770.0%
Dynamic-Monthly181611.9%14250.0%170612.2%15770.0%
Table 5. Savings in annual energy needs for the dwelling unit when static and dynamic overhangs incorporating PV arrays are used for two design/operation cases. (a) Reference design/operation case (i.e., Theat = 21 °C and WWR = 0.2). (b) Modified design/operation case (i.e., Theat = 23 °C and WWR = 0.4).
(a)
Orientation Switching Frequency
(Dynamic Overhangs)
Optimal Static
Overhang
Dynamic Overhangs
0–180°0–135°0–90°45–90°90–135°
SouthHourly33.4%40.9%40.4%40.2%36.7%31.4%
Daily35.8%35.8%35.8%35.7%31.4%
Monthly35.7%35.7%35.7%35.7%31.4%
EastHourly24.0%37.5%37.4%33.7%32.0%24.0%
Daily26.1%26.1%26.0%25.9%24.0%
Monthly25.7%25.7%25.7%25.7%24.0%
NorthHourly21.3%28.5%28.5%24.4%20.8%21.3%
Daily24.5%24.5%21.3%20.8%21.3%
Monthly24.2%24.2%21.1%20.8%21.3%
WestHourly30.6%41.1%40.9%37.7%35.9%30.6%
Daily31.2%31.2%31.2%31.1%30.6%
Monthly30.9%30.9%30.9%30.9%30.6%
(b)
OrientationSwitching Frequency
(Dynamic Overhangs)
Optimal Static
Overhang
Dynamic Overhangs
0–180°0–135°0–90°45–90°90–135°
SouthHourly55.3%69.7%69.7%64.8%61.4%52.4%
Daily60.6%60.6%60.0%60.0%52.4%
Monthly60.3%60.3%59.9%59.9%52.4%
EastHourly51.1%71.9%71.8%62.9%61.4%51.1%
Daily51.3%51.3%51.3%51.3%51.1%
Monthly51.1%51.1%51.1%51.1%51.1%
NorthHourly51.4%61.9%61.9%54.3%51.2%51.4%
Daily58.4%58.4%51.2%51.2%51.4%
Monthly58.2%58.2%51.2%51.2%51.4%
WestHourly60.6%75.5%75.4%69.5%67.9%60.6%
Daily60.7%60.7%60.7%60.7%60.6%
Monthly60.6%60.6%60.6%60.6%60.6%
Table 6. Effects of static and dynamic overhangs with and without PV arrays deployed for southern windows on the annual energy needs of the housing unit with two design/operation cases.
Switching
Frequency for Dynamic Overhangs
Baseline Design/Operation Case (i.e., Theat = 21 °C and WWR = 0.2)
No-Overhang
(kWh/m2/year)
Reduction from an Overhang Deployment Relative to No-Overhang
Static with no PV
(θ = 45°)
Dynamic with no PV
(θ = 0–180°)
Static PV-Integrated
(θ = 45°)
Dynamic PV-Integrated
(θ = 0–180°)
Hourly212.46.7%11.8%33.4%40.9%
Daily9.9%35.8%
Monthly9.6%35.7%
Switching
Frequency for Dynamic Overhangs
Modified Design/Operation Case (i.e., Theat = 23 °C and WWR = 0.4)
No-Overhang
(kWh/m2/year)
Reduction from an overhang deployment relative to no-overhang
Static with no PV
(θ = 135°)
Dynamic with no PV
(θ = 0–180°)
Static PV-Integrated
(θ = 135°)
Dynamic PV-Integrated
(θ = 0–180°)
Hourly224.69.1%15.4%55.3%69.7%
Daily11.6%60.6%
Monthly10.3%60.3%
Disclaimer/Publisher’s Note: The statements, opinions and data contained in all publications are solely those of the individual author(s) and contributor(s) and not of MDPI and/or the editor(s). MDPI and/or the editor(s) disclaim responsibility for any injury to people or property resulting from any ideas, methods, instructions or products referred to in the content.

