Article

Study on the Vibration Characteristics of Wire Rope in Static Testing of Wind Turbine Blades

1
School of Mechanical Engineering, Shandong University of Technology, Zibo 255000, China
2
Offshore Wind Energy Department, Huaneng Clean Energy Research Institute, Beijing 102209, China
3
National Energy R&D Center of Offshore Wind Power Engineering and Operation, Beijing 102209, China
4
Renmin University of China, Beijing 100872, China
*
Author to whom correspondence should be addressed.
Energies 2025, 18(5), 1138; https://doi.org/10.3390/en18051138
Submission received: 25 December 2024 / Revised: 23 January 2025 / Accepted: 26 January 2025 / Published: 26 February 2025
(This article belongs to the Section A3: Wind, Wave and Tidal Energy)

Abstract

:
Significant vibrations of the traction wire rope can impact the efficiency and accuracy of static testing in wind turbine blade assessments. This study focuses on the vibration characteristics of the wire rope under static loading conditions. A simulation model for single-point static tests of wind turbine blades was developed using Adams software and validated through wire rope tension and longitudinal acceleration measurements during static tests on a full-scale 71.5-m blade. The validated model was used to analyze the effects of wire rope span and pulley position on vibration amplitude and tension in single-point loading scenarios. The results show that increasing the wire rope span and the distance between the pulley and blade fixture significantly amplifies vibration. Adjusting the span of the wire rope and the pulley position causes the primary vibration frequency to approach the natural frequency, leading to a substantial increase in vibration near the resonance frequency. To avoid resonance and reduce vibration, it is recommended to use two misaligned ground tracks, ensuring the wire rope span does not exceed 30 m and the distance between the pulley and blade fixture does not exceed 7 m. Specific resonance combinations of wire rope span and pulley position should be avoided to improve the precision and reliability of the testing system.

1. Introduction

The large-scale use of traditional fossil fuels has resulted in severe environmental pollution and drastic climate change. The replacement of traditional fossil fuels with clean, renewable energy has become a global consensus and an energy policy in most countries. Wind energy, one of the most important forms of clean renewable energy, has seen rapid development worldwide in recent years [1,2,3]. To date, wind energy has become an integral part of the energy mix in many countries [4,5]. The Global Wind Energy Council report indicates that in 2023, global wind power installations reached 117 GW, marking a 50% increase compared to the previous year. Of this, onshore wind power surpassed 100 GW for the first time, reaching 106 GW, a 54% growth; offshore wind power installations totaled 10.8 GW, the second-highest annual increase in history. Global cumulative wind power capacity exceeded 1 TW, reaching 1021 GW, a 13% year-on-year growth. China continued to lead the global market with 75 GW of new installations, accounting for nearly 65% of the global total, driving a record 106% growth in the Asia-Pacific region [6].
In order to further reduce the levelized cost of electricity from wind energy, wind turbines are being continually scaled up, leading to increasingly longer turbine blades. However, as the blades grow longer, the frequency of blade fractures during operation has also become more common [7,8,9]. Full-scale blade testing is an effective method and a necessary step for evaluating blade manufacturing quality, design performance, and structural reliability. Among these, static tests are the most direct way to verify whether the blade can withstand the design’s ultimate loads and its ultimate strength [10,11]. As the length of wind turbine blades increases, the number of loading points, the length of steel cables, and the test load also increase [12]. These changes make the blades more susceptible to the influence of steel cable vibrations during testing, thereby affecting test accuracy. As the primary load-transmitting medium, steel cables not only bear significant mechanical loads, but their vibration characteristics also become a key factor influencing test stability. The sources of steel cable vibrations include uneven load distribution, the inherent properties of the cables themselves, and external disturbances. Particularly in long-span steel cable systems, vibrations may cause uneven load transfer and, under certain conditions, induce system resonance, which further affects the blade’s stress state, reducing the accuracy and reliability of the test. Field tests have shown that steel cable vibrations not only lead to loading instability but also exacerbate test errors, especially under high load and large span conditions, where vibration amplitudes increase significantly and severely affect data collection accuracy. Therefore, conducting in-depth research and optimization of steel cable vibration characteristics and appropriately configuring the loading system is crucial for improving the precision and efficiency of static tests and ensuring the safety and performance of wind turbine blades [13,14].
Regarding the vibration characteristics of wire ropes, significant progress has been made in the dynamic vibrations of mining and friction hoisting systems. Wang et al. [15] studied the lateral response of a wire rope-guided hoisting system with a time-varying length, deriving the motion equation of the wire rope using Hamilton’s principle and establishing the equivalent mass and stiffness models for the guided wire rope. Kaczmarczyk [16] established a differential equation for the longitudinal vibration of a wound hoisting wire rope based on Hamilton’s principle and analyzed the transient resonance phenomenon in a vertical wire rope-catenary system under periodic external excitation. The length of the vertical wire rope changes over time, causing the natural frequency to vary slowly. When the natural frequency coincides with the excitation frequency, transient resonance occurs. Kaczmarczyk and Ostachowicz [17] investigated the transient vibration of wire ropes in deep-well hoisting systems, finding that transient resonance significantly amplifies the vibration amplitude at specific hoisting speeds and frequencies, thereby compromising the system’s dynamic stability and safety. Controlling hoisting speed and tension effectively mitigates this instability. Zhou et al. [18] proposed a dynamic analysis method for wire ropes based on the equivalent mechanical theory. This method efficiently and accurately simulates the dynamic response of the wire ropes under tensile, torsional, and bending deformations by establishing a mechanical behavior model for them. Guo et al. [19] studied the lateral vibration characteristics of wire ropes in hoisting systems, revealing that lateral vibrations reduce the actual contact area between the wire rope and the friction surface, thereby decreasing the stability of friction transmission. This effect is especially pronounced under high-speed and large-span operating conditions, where vibrations intensify the dynamic instability of the friction system, impacting the stability and safety of hoisting equipment. Guo et al. [20] further investigated the longitudinal dynamic characteristics, dividing the wire rope tension into dynamic and inertial tension zones. They found that hoisting speed, acceleration, and load significantly influence the longitudinal vibration and dynamic tension characteristics of wire ropes in friction hoisting systems. Increasing acceleration and load respectively narrow and expand the dynamic tension zone, while hoisting speed significantly amplifies vibration amplitude and frequency disturbances. Wu et al. [21] developed a mathematical model for the transverse vibration of a wire rope in a winch hoisting system. Their findings showed that as the vertical section of the wire rope shortened, vibration displacement decreased, and the transverse vibration frequency increased. Furthermore, Wu et al. [22] used the Galerkin discretization method to analyze the transverse vibration characteristics of the wire rope in a deep-well hoisting system. They concluded that the excitation frequency significantly influenced vibration displacement, while the load, acceleration, and wire rope mass density had minimal effects. Zhu et al. [23] used Adams software to establish a dynamic model for mining hoisting wire ropes, analyzing how the combination of drum winding misalignment and guide rail misalignment significantly exacerbates longitudinal vibration and instability in the wire rope. They designed a series of spring-damper vibration suppression devices capable of significantly reducing vibration amplitude and frequency by absorbing vibration and buffering tension changes. Yang et al. [24] pointed out that a significant increase in the length of the wire rope causes the natural frequency of the elevator wire rope to approach the natural frequency of the building, thereby increasing the risk of resonance. Zhang et al. [25] used Adams software to develop a coupled dynamic model for time-varying hoisting and balance wire ropes in a friction hoisting system. They simulated how transient resonance caused by pulley unevenness affects system vibrations. The study found that when the transient excitation frequency matches the natural frequency of the balance wire ropes, resonance amplifies bending deformation, increasing dynamic instability in deep-well hoisting systems.
Existing research primarily focuses on wire rope vibrations in mine hoisting and friction hoisting systems, especially lateral vibrations and transient resonance phenomena. However, these systems differ fundamentally from the static testing of wind turbine blades. In wind turbine blade static tests, wire ropes are subjected to larger loads, longer spans, and more complex environmental conditions, resulting in vibration characteristics that differ significantly from those in traditional hoisting systems. Current literature has not fully accounted for these unique factors, thus limiting its application in wind turbine blade testing. To address this gap, this paper simulates the wire rope vibrations in wind turbine blade static tests using Adams software, analyzes the impact of rope span and pulley position on vibration characteristics, and proposes optimization solutions to enhance test accuracy and efficiency.
To address the issue of reduced testing accuracy caused by wire rope vibrations in static tests of wind turbine blades, this study develops a simulation model of the wind turbine blade static loading test system using Adams software and validates the model’s accuracy and reliability through experimental verification. The paper systematically investigates the effects of key parameters, such as wire rope span and pulley position, on the vibration characteristics of the wire rope. It also explores how these vibrations influence load transfer uniformity and system resonance during the loading process, thereby affecting the accuracy and reliability of the test results. This study fills a gap in the existing literature and proposes an innovative application solution by optimizing the wire rope layout and improving the loading system, effectively addressing wire rope vibrations and enhancing testing accuracy and stability. These optimization strategies not only provide practical solutions for controlling wire rope vibrations but also significantly improve testing precision and stability, offering new technical support for the improvement of static test methods for wind turbine blades.

2. Methodology

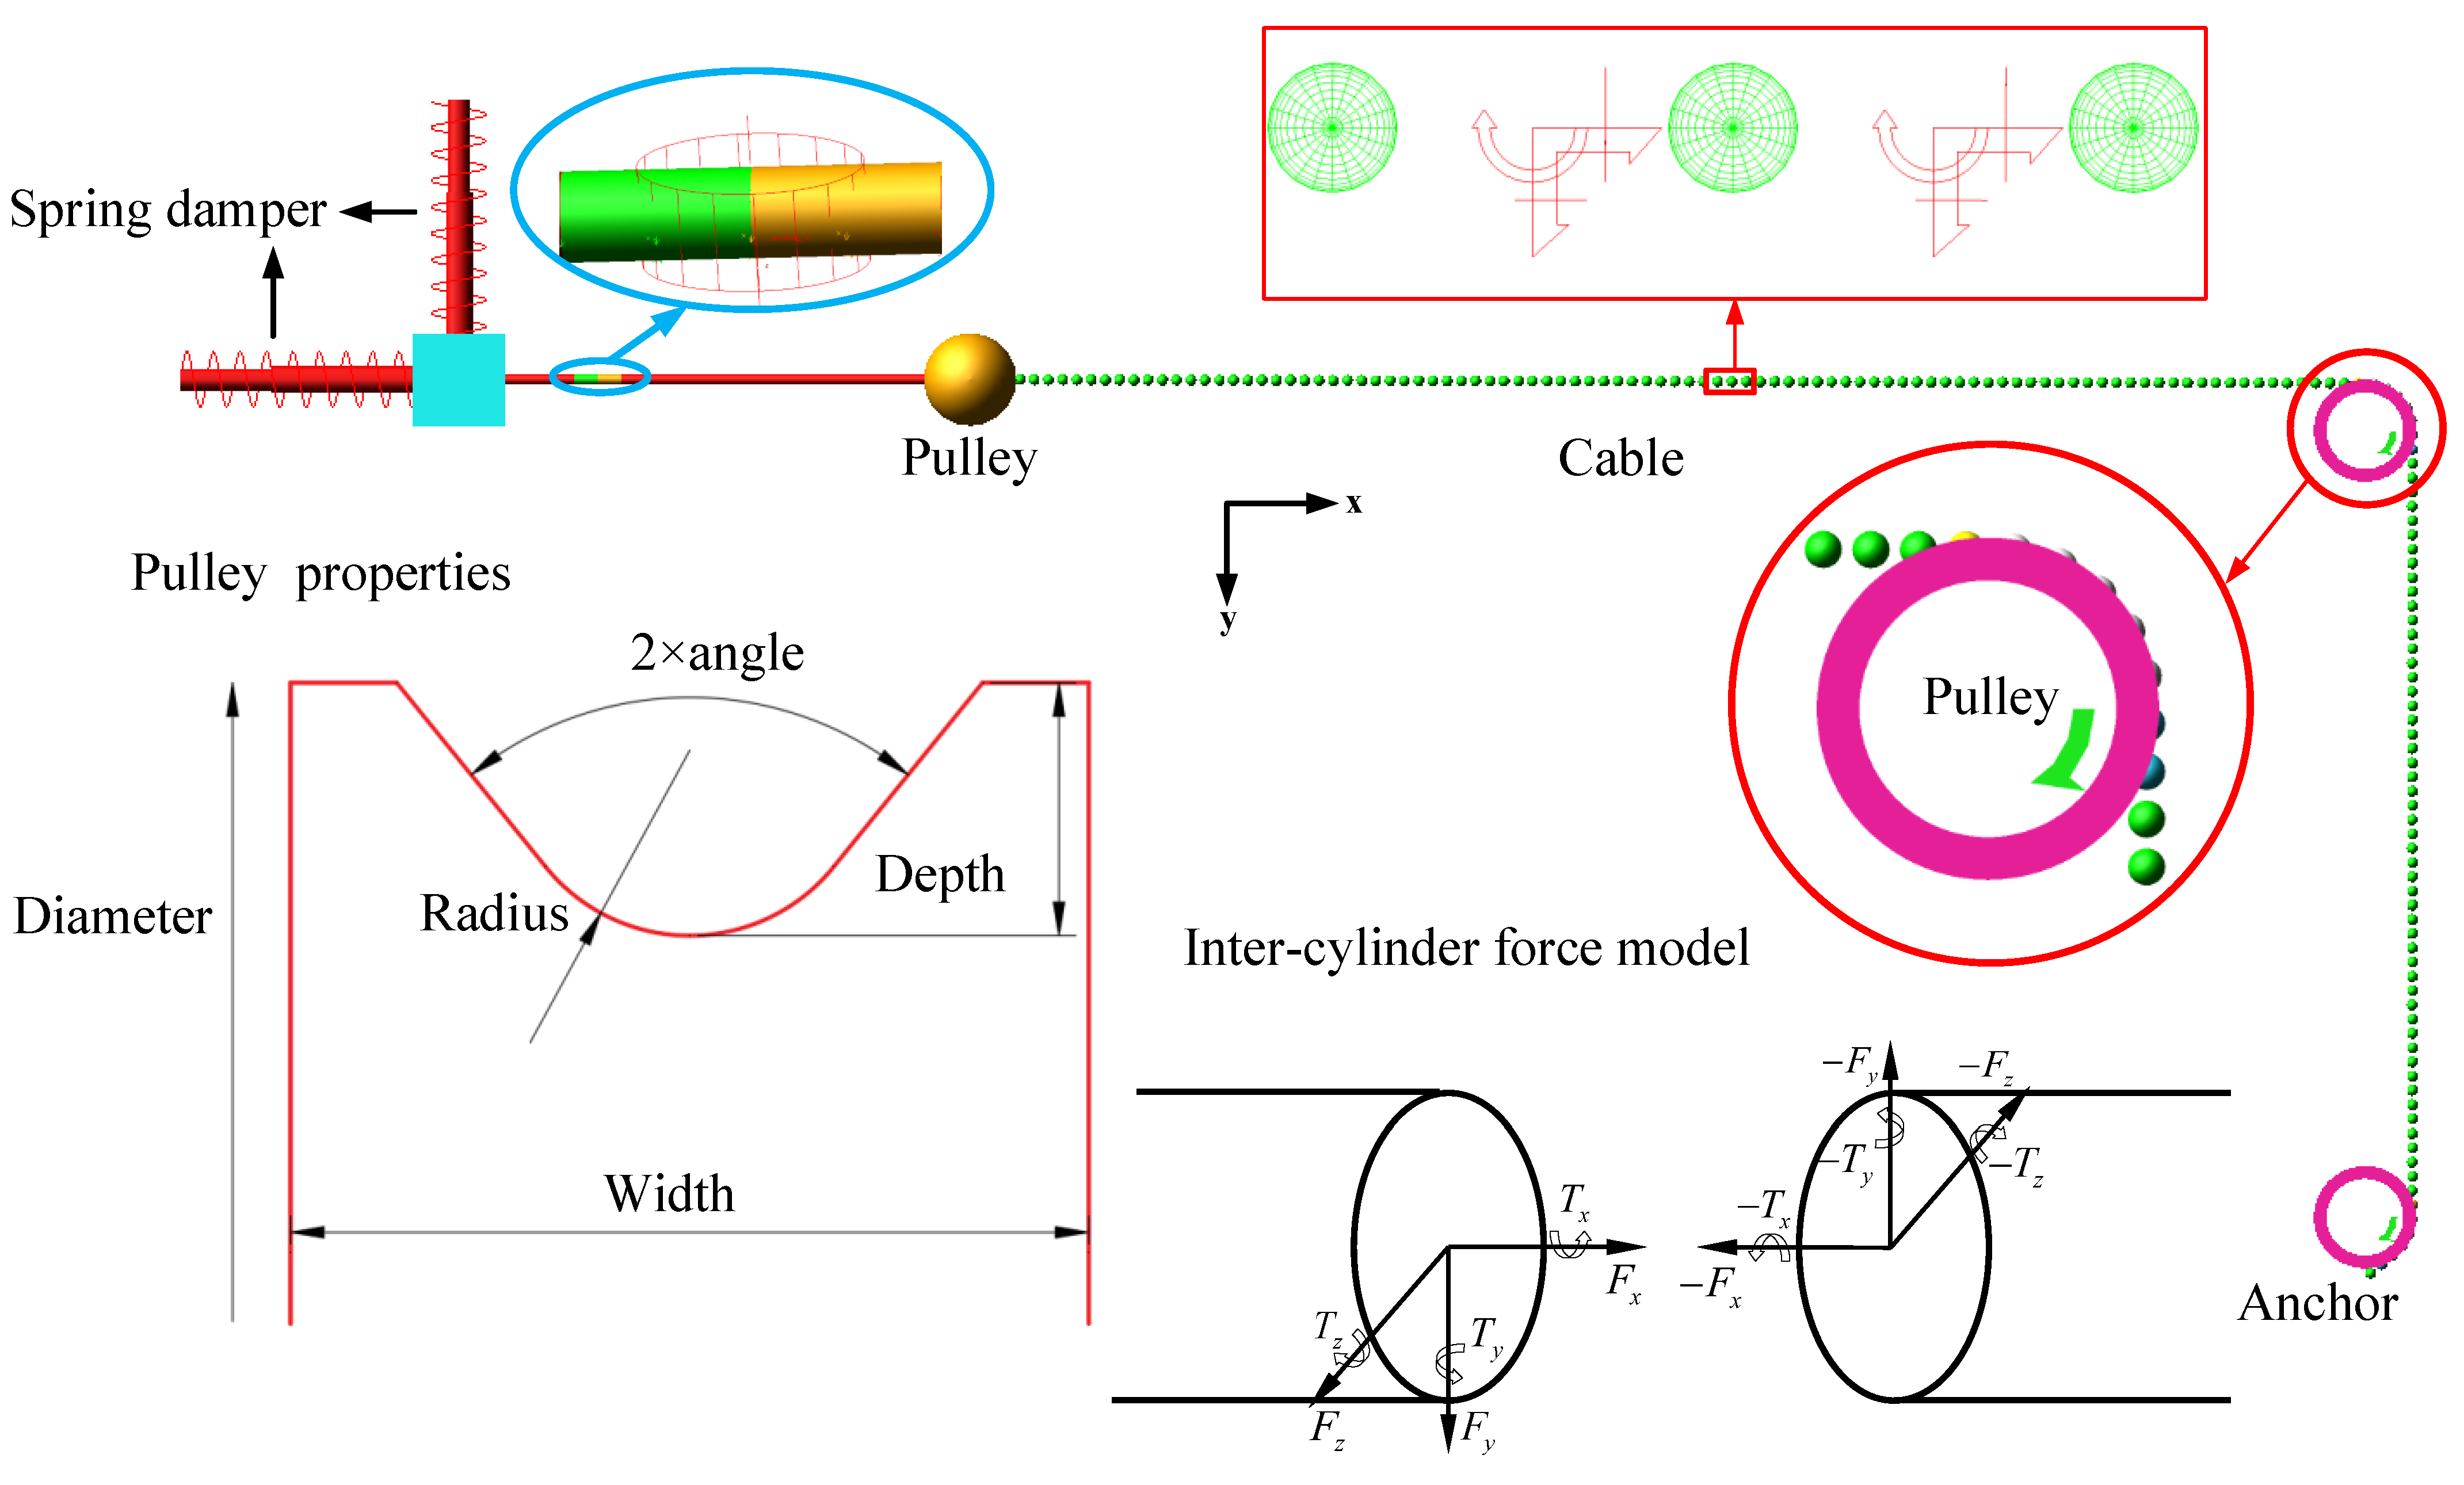
2.1. Numerical Model

In static tests of wind turbine blades, multiple sections are typically loaded simultaneously. To simplify the complex vibration responses resulting from the coupling effects between the blade structure and the loading points, this study focuses on a representative section for single points in loading numerical modeling. The blade structure is modeled as a spring-damper system, with an emphasis on the influence of wire rope span and pulley position on vibration amplitude. Compared to multi-point loading in blade static tests, single-point loading eliminates coupling interference, thereby clarifying the analysis of vibration characteristics. This simplification reduces model complexity while improving computational efficiency, providing a foundation for the subsequent development of multi-point loading models and more in-depth studies of vibration characteristics.
The wire rope model was developed using the Cable module in Adams. The wire rope was discretized into a series of spherical masses connected by beam elements between adjacent spheres to accurately replicate its dynamic characteristics. The model accounts for the mass, inertia, and damping properties of the wire rope, as well as the stiffness of the beam elements in the longitudinal, bending, and torsional directions, thereby comprehensively capturing the wire rope’s vibration and deformation characteristics. The beam elements serve as the medium for transmitting forces and torques between the discrete spheres. The interactions between the discrete markers are described by a set of constitutive equations, ensuring accurate dynamic behavior representation [26]. During the modeling process in the Cable module, the inclusion of pulleys is unavoidable. Since the pulley is connected solely to the blade fixture through the wire rope, an axial force model is employed to construct the portion of the loading system between the pulley and the blade fixture. By introducing a six-degree-of-freedom (DOF) elastic and damping axial force model, the mechanical response during the loading process can be accurately simulated. Nonlinear elastic and damping coefficients are defined for the translational and rotational degrees of freedom along the three axes, with anisotropic parameters and DOF coupling characteristics set accordingly.
Figure 1 shows the single-point pulley loading simulation model, which integrates the Cable module with the axial force modeling method. The model simulates the static loading process of wind turbine blades through components such as anchor points, winches, pulleys, and wire ropes. The parameters of the wire rope, such as elastic modulus and diameter, are listed in Table 1. A wire rope with a diameter of 24 mm is selected to ensure that its tensile strength and stiffness adequately meet the actual loading requirements. The pulley parameters include a depth of 30 mm, an angle of 0.01 rad, a radius of 12 mm, a diameter of 760 mm, and a width of 75 mm. The axial force modeling uses a cylindrical segment with a diameter of 24 mm and a length of 50 mm, matching the wire rope size and providing the necessary support and damping. A spring-damper system is employed to simulate the blade’s stiffness, while the moving pulley is modeled as a rigid sphere with a mass of 200 kg. The rotation speed of the winch is controlled to manage the winding and unwinding of the wire rope. The time step is set to 0.01 s, utilizing the GSTIFF integrator with an error tolerance of 0.001.
In ADAMS, the modeling of the steel wire rope is achieved by sequentially arranging multiple small cylindrical elements, which are connected by axial force to adjacent cylinders. The mechanical properties of these small cylindrical elements are simulated by setting stiffness and damping coefficients in the x, y, and z directions, thereby representing the tensile, shear, torsional, and bending behaviors of the wire rope. In the axial force model, the wire rope is treated as a six-degree-of-freedom spring-damper system, where the definitions of the stiffness matrix and damping matrix are provided in Equation (1):
F x F y F z T x T y T z = K 11 0 0 0 0 0 0 K 22 0 0 0 0 0 0 K 33 0 0 0 0 0 0 K 44 0 0 0 0 0 0 K 55 0 0 0 0 0 0 K 66 R x R y R z θ x θ y θ z   C 11 0 0 0 0 0 0 C 22 0 0 0 0 0 0 C 33 0 0 0 0 0 0 C 44 0 0 0 0 0 0 C 55 0 0 0 0 0 0 C 66 V x V y V z θ ˙ x θ ˙ y θ ˙ z + F x 0 F y 0 F z 0 T x 0 T y 0 T z 0 .
In the equation, F and T are the force and torque vectors, R and θ are the relative displacement and rotation angles, and V and ω are the velocities and angular velocity, respectively. K and C are the stiffness and damping coefficients, respectively, and the subscripts x , y , and z denote the X, Y, and Z directions. The subscripts x 0 ,   y 0 , and z 0 denote the initial values in the X, Y, and Z directions. The reaction force of the axial force is calculated as follows:
F i = F j ;
T i = T j δ F i .
According to Equations (1)–(3), the response of the steel wire rope to external forces is closely related to the relative position, angular displacement, velocity, and velocity gradient of the structure. By adjusting the stiffness and damping coefficients in the model, the deformation and vibration characteristics of the steel wire rope can be simulated, and its mechanical behavior can be accurately described. These mechanical equations provide a theoretical foundation for the dynamic analysis of the steel wire rope under different loading conditions. By calculating the stiffness and damping coefficients, the mechanical response of the steel wire rope in engineering applications can be predicted, thereby supporting engineering design and optimization.
The calculation formula for the sleeve stiffness coefficient is used to describe the mechanical response of the steel wire rope in different directions, taking into account its geometric characteristics and material properties. These stiffness coefficients enable the simulation of the wire rope’s extension, shear, torsion, and bending behaviors, ensuring the accuracy of the simulation results, as shown in Equation (4) [27]:
K 11 = E A L ; K 22 = K 33 = G A L ; K 44 = G π d 4 32 L ; K 55 = K 66 = E I L = E π d 4 64 L .
In the equation, K 11 is the tensile stiffness coefficient; K 22 and K 33 are the shear stiffness coefficients; K 44 is the torsional stiffness coefficient; K 55 and K 66 are the bending stiffness coefficients; E is the elastic modulus of the wire rope; G is the shear modulus of the wire rope; A , d , and L are the cross-sectional area, diameter, and length of each segment of the wire rope, respectively; and I is the moment of inertia of the wire rope’s cross-section relative to the center, where I = ( π d 4 ) / 64 .

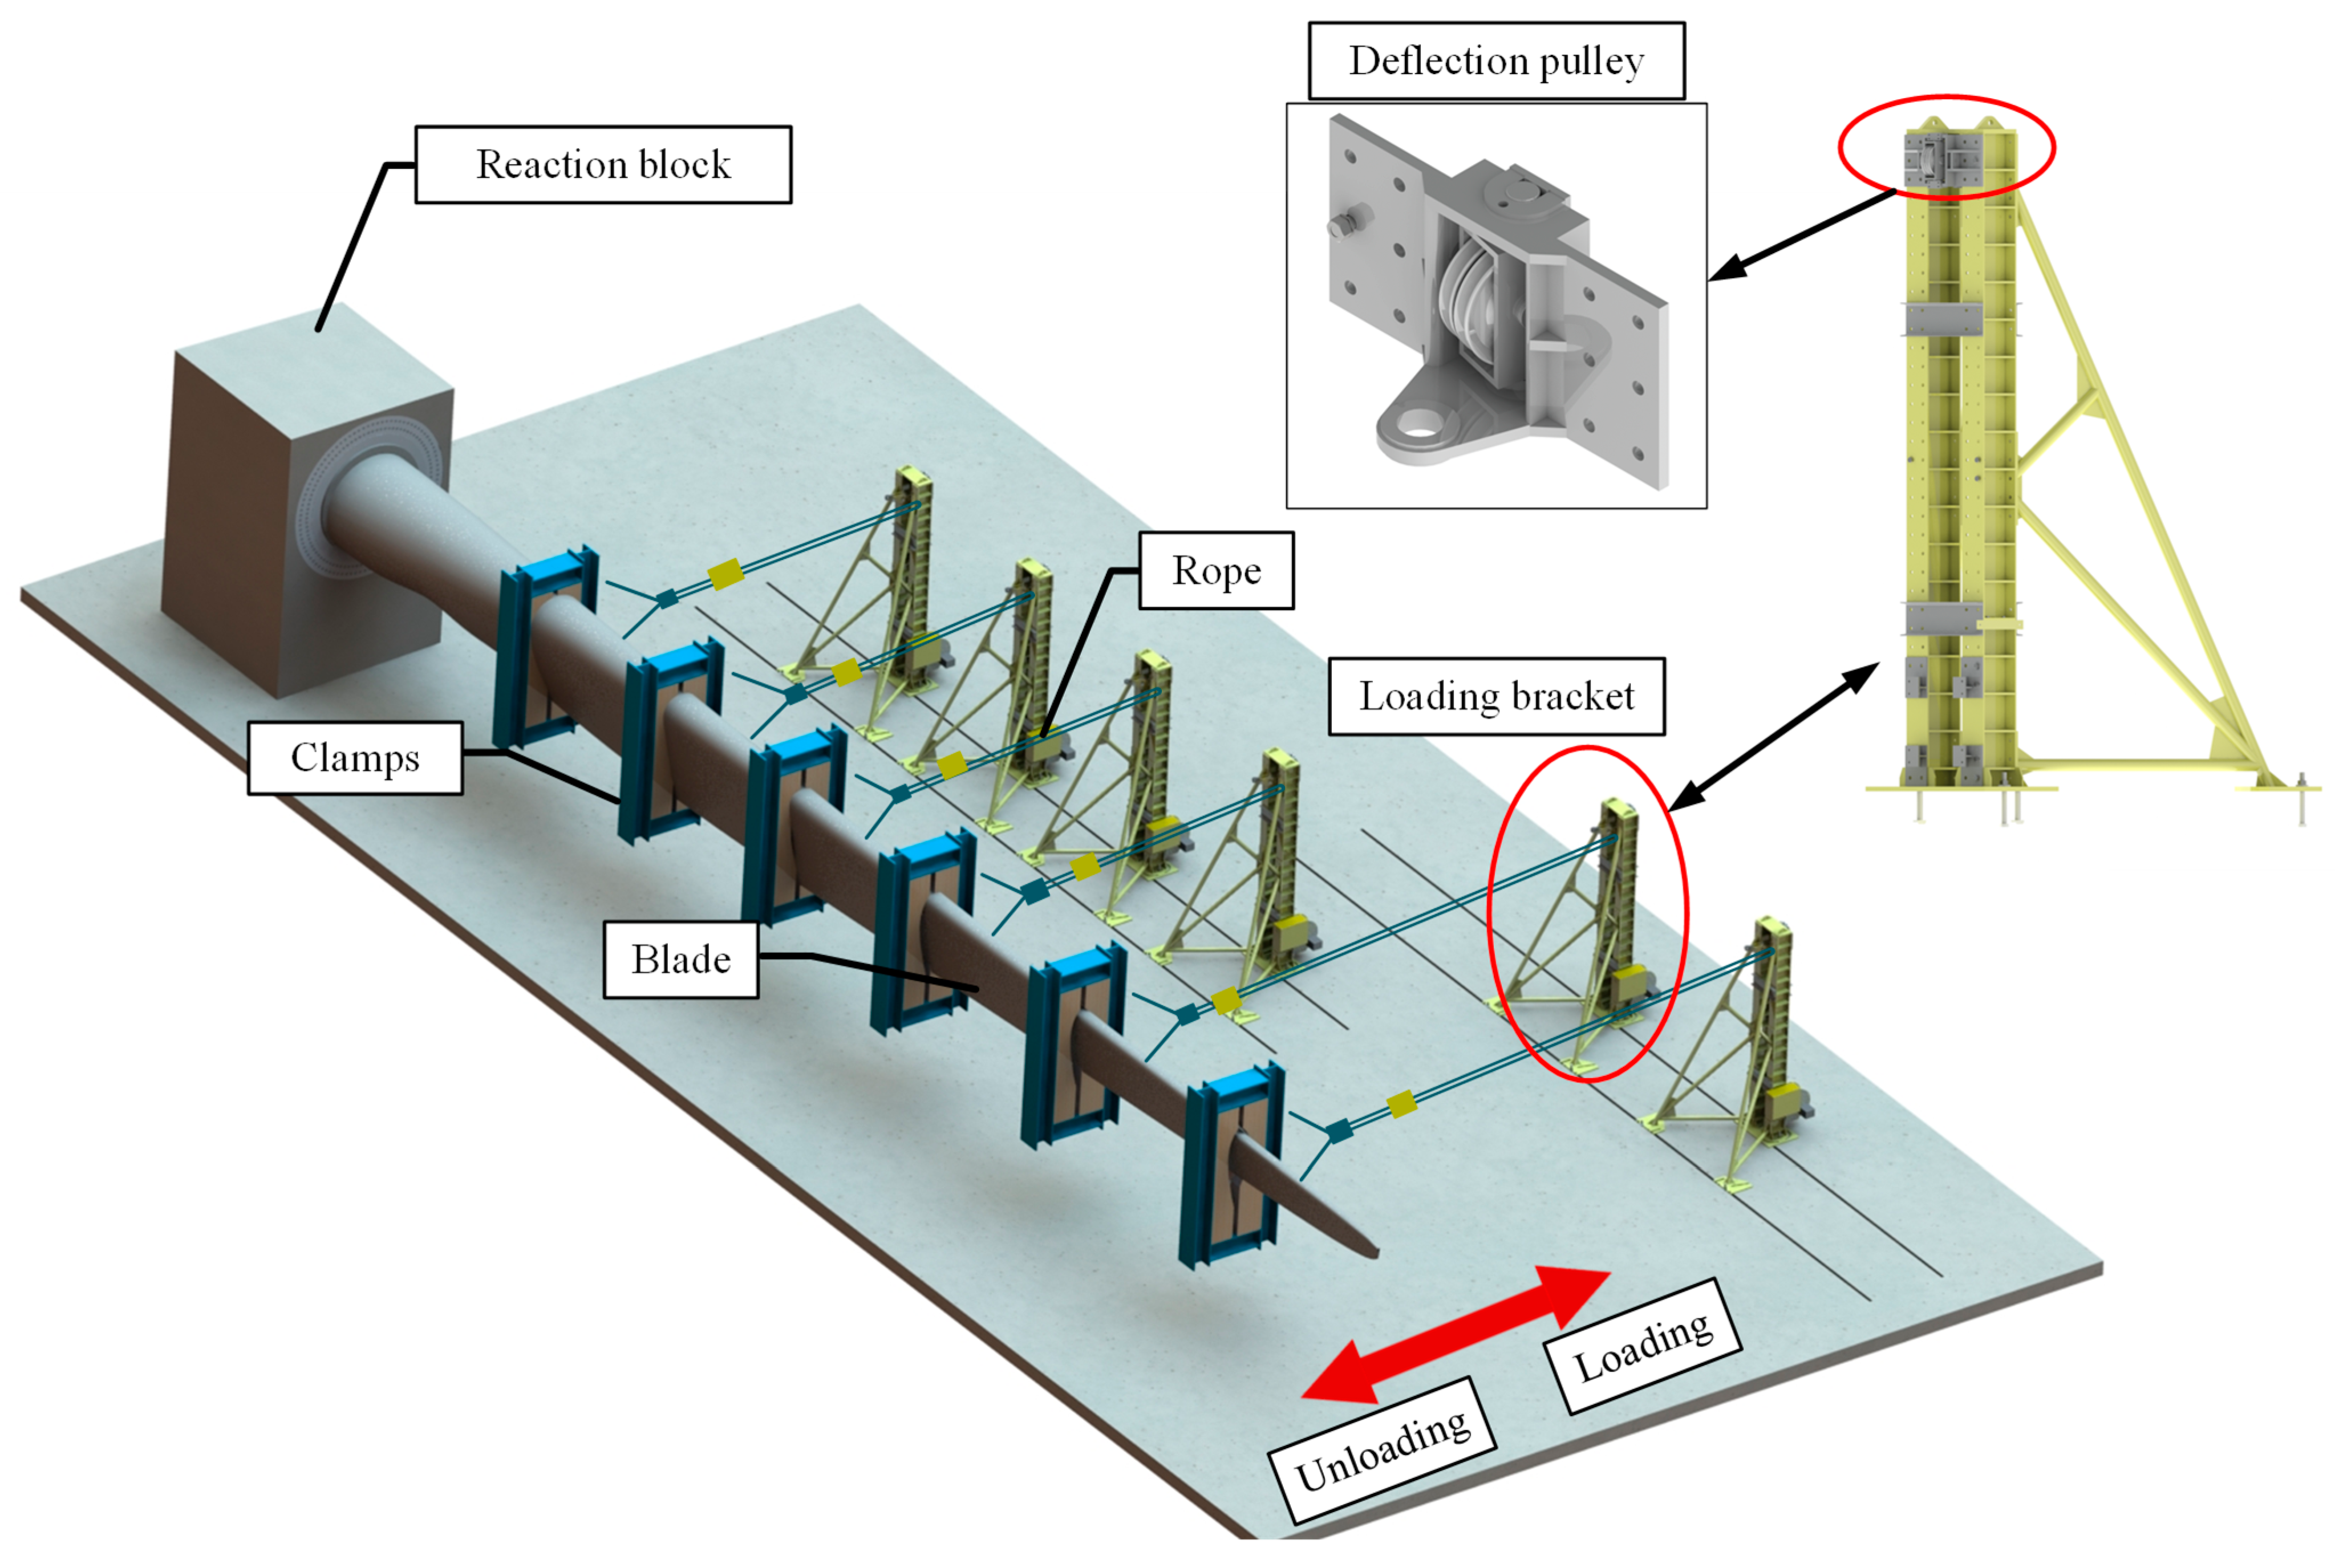
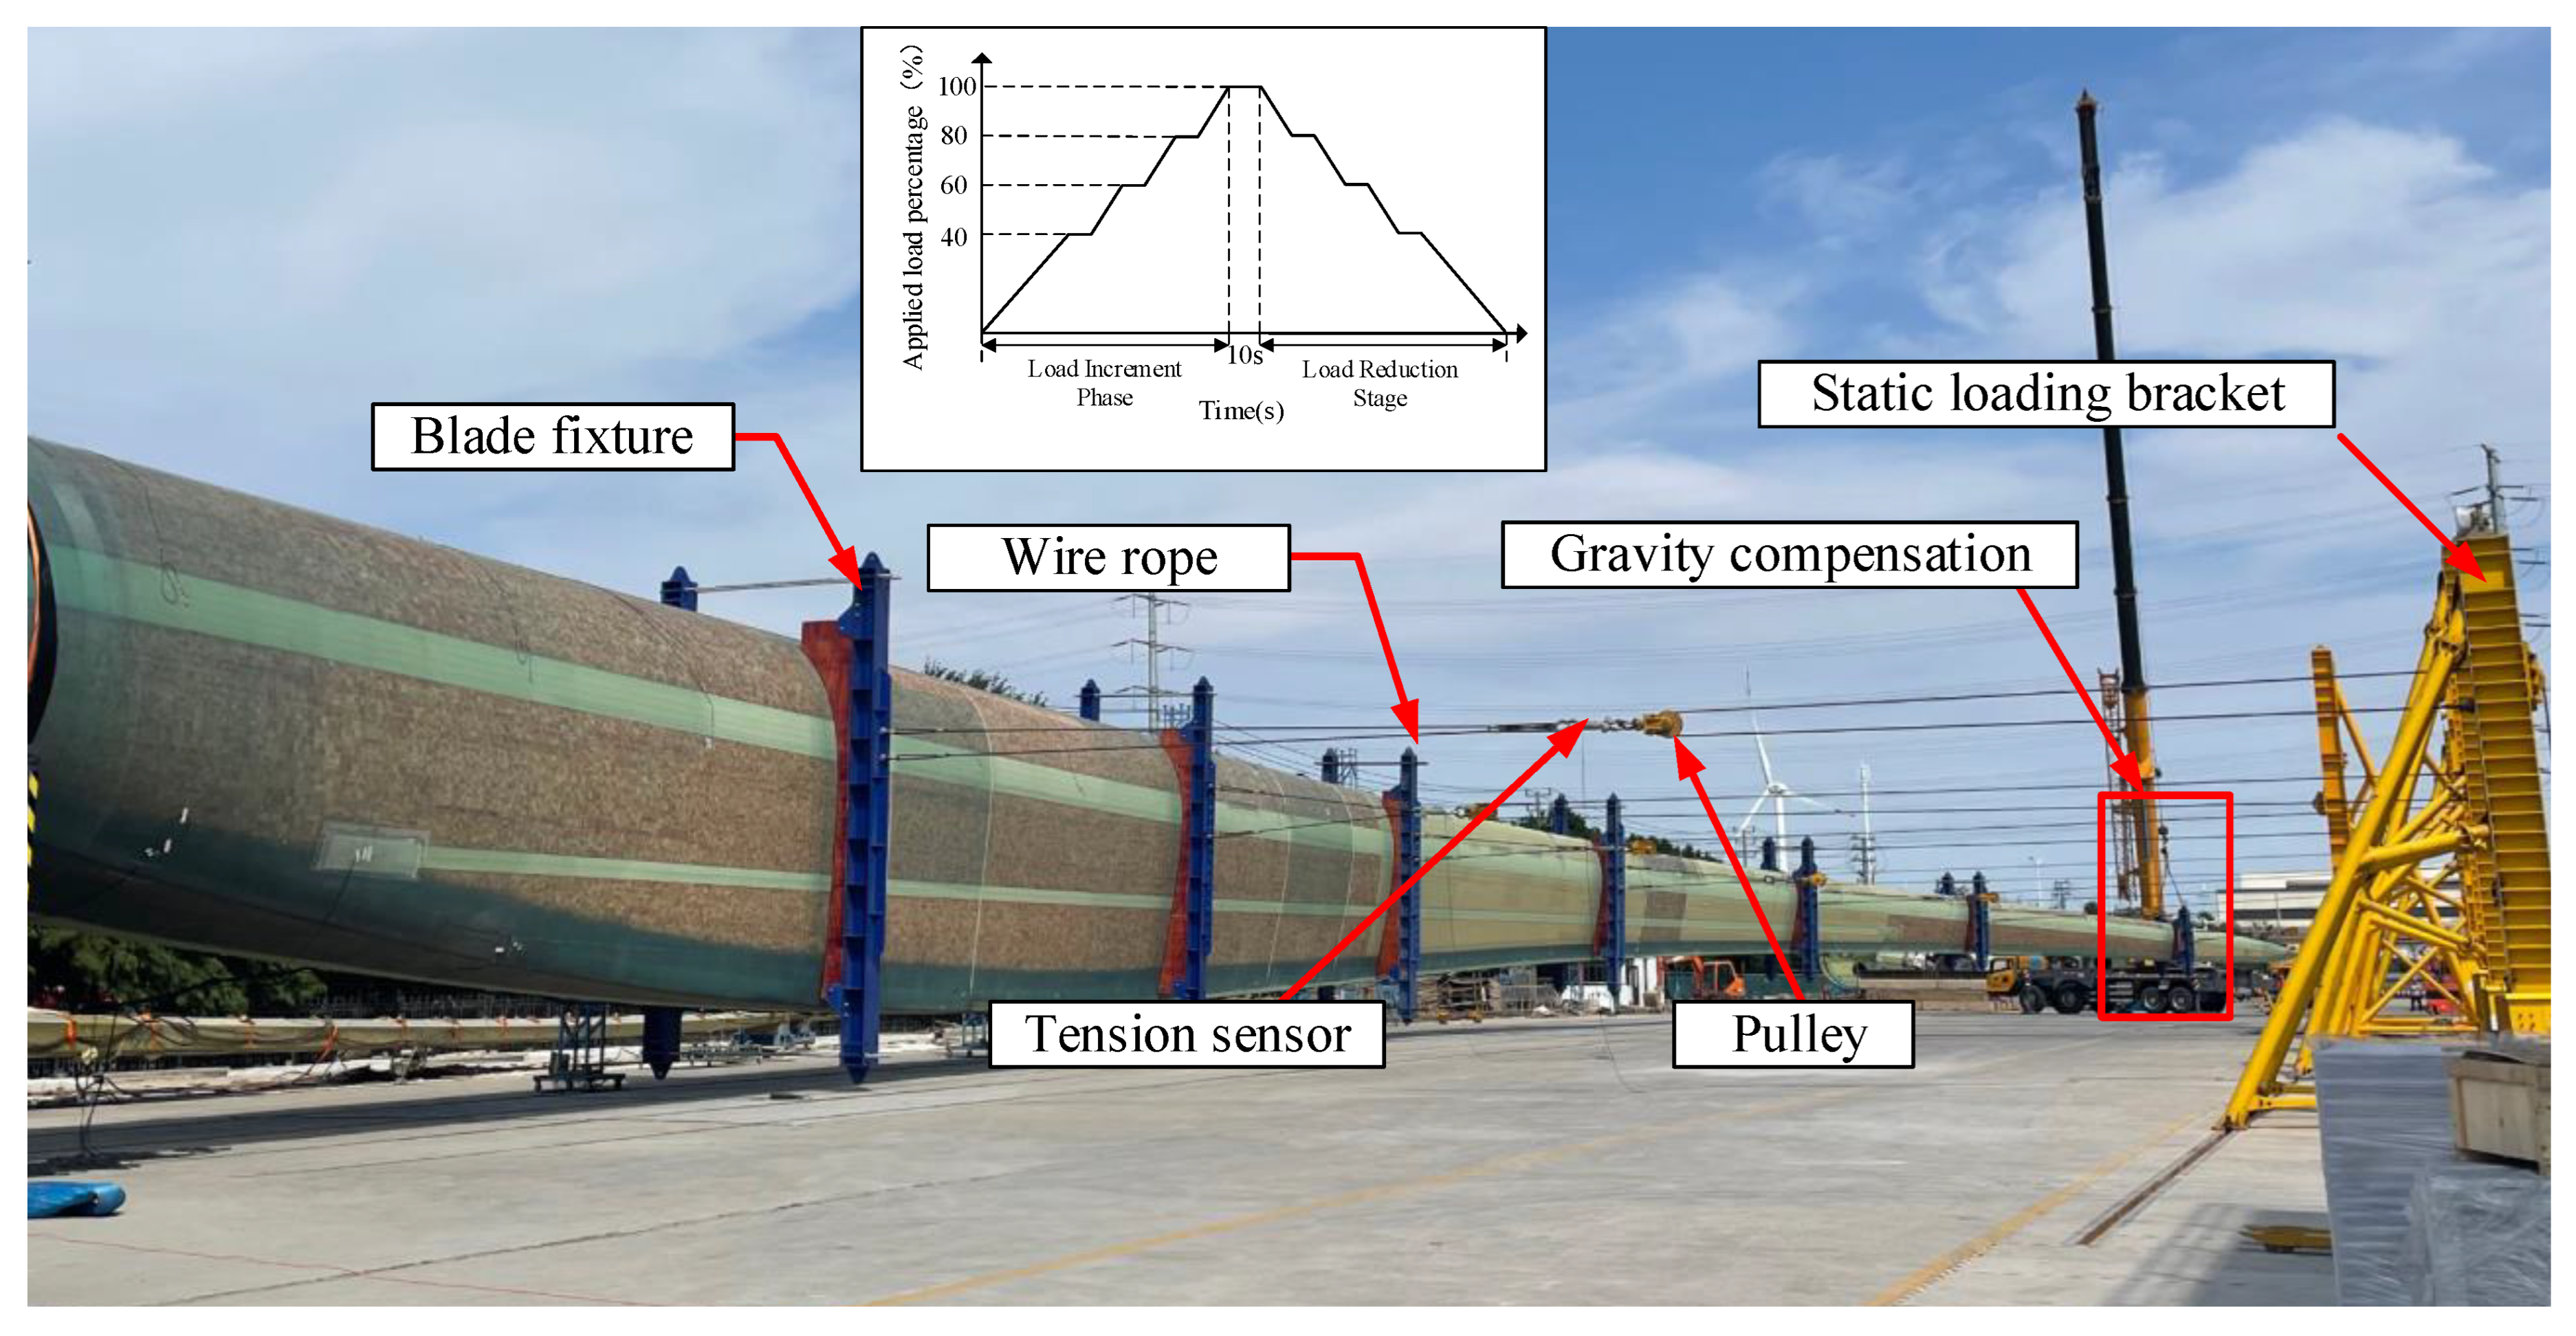
2.2. Experimental Setup

The static loading test setup for wind turbine blades is shown in Figure 2. It consists of a vertical platform to secure the blade and several loading units. Each loading unit includes a loading frame, directional pulleys, movable pulleys, a servo winch, wire ropes, and a tension sensor, which together form the blade static loading system [12]. During the loading process, the servo motor drives the winch to pull the wire rope, which is fixed at one end of the winch and wrapped several times around it. After extending vertically, the wire rope changes direction through the pulleys to a horizontal position and is then connected to the blade fixture. The lateral loading frame distributes the force evenly to the blade via the pulley system, thus applying a localized sectional load to the blade.
Figure 3 presents the schematic of the static loading test process for wind turbine blades. The loading process adheres to the IEC 61400-23 certification standard [28] and adopts a staged, incremental loading method. The experimental blade measures 71.5 m in length and has a rated power of 5 MW. A representative loading point is selected at 55.2 m from the blade root to capture key force and deformation characteristics. The variation in wire rope tension and the acceleration response of the moving pulley during the loading process are analyzed. A total applied load of 60 kN is utilized for the single-point static loading test, using a 24 mm diameter wire rope as the load transmission medium. The applied load begins at 0% of the total load, incrementally increasing to 40%, 60%, 80%, and 100%, then is unloaded in reverse order. When the applied load reaches the target load, it is maintained for a minimum of 10 s. Various combinations of wire rope spans and moving pulley positions are employed in the test, and real-time data on wire rope tension and moving pulley acceleration are collected using accelerometers and load sensors. The single-point loading scheme for the blade is presented in Table 2.

3. Results and Discussions

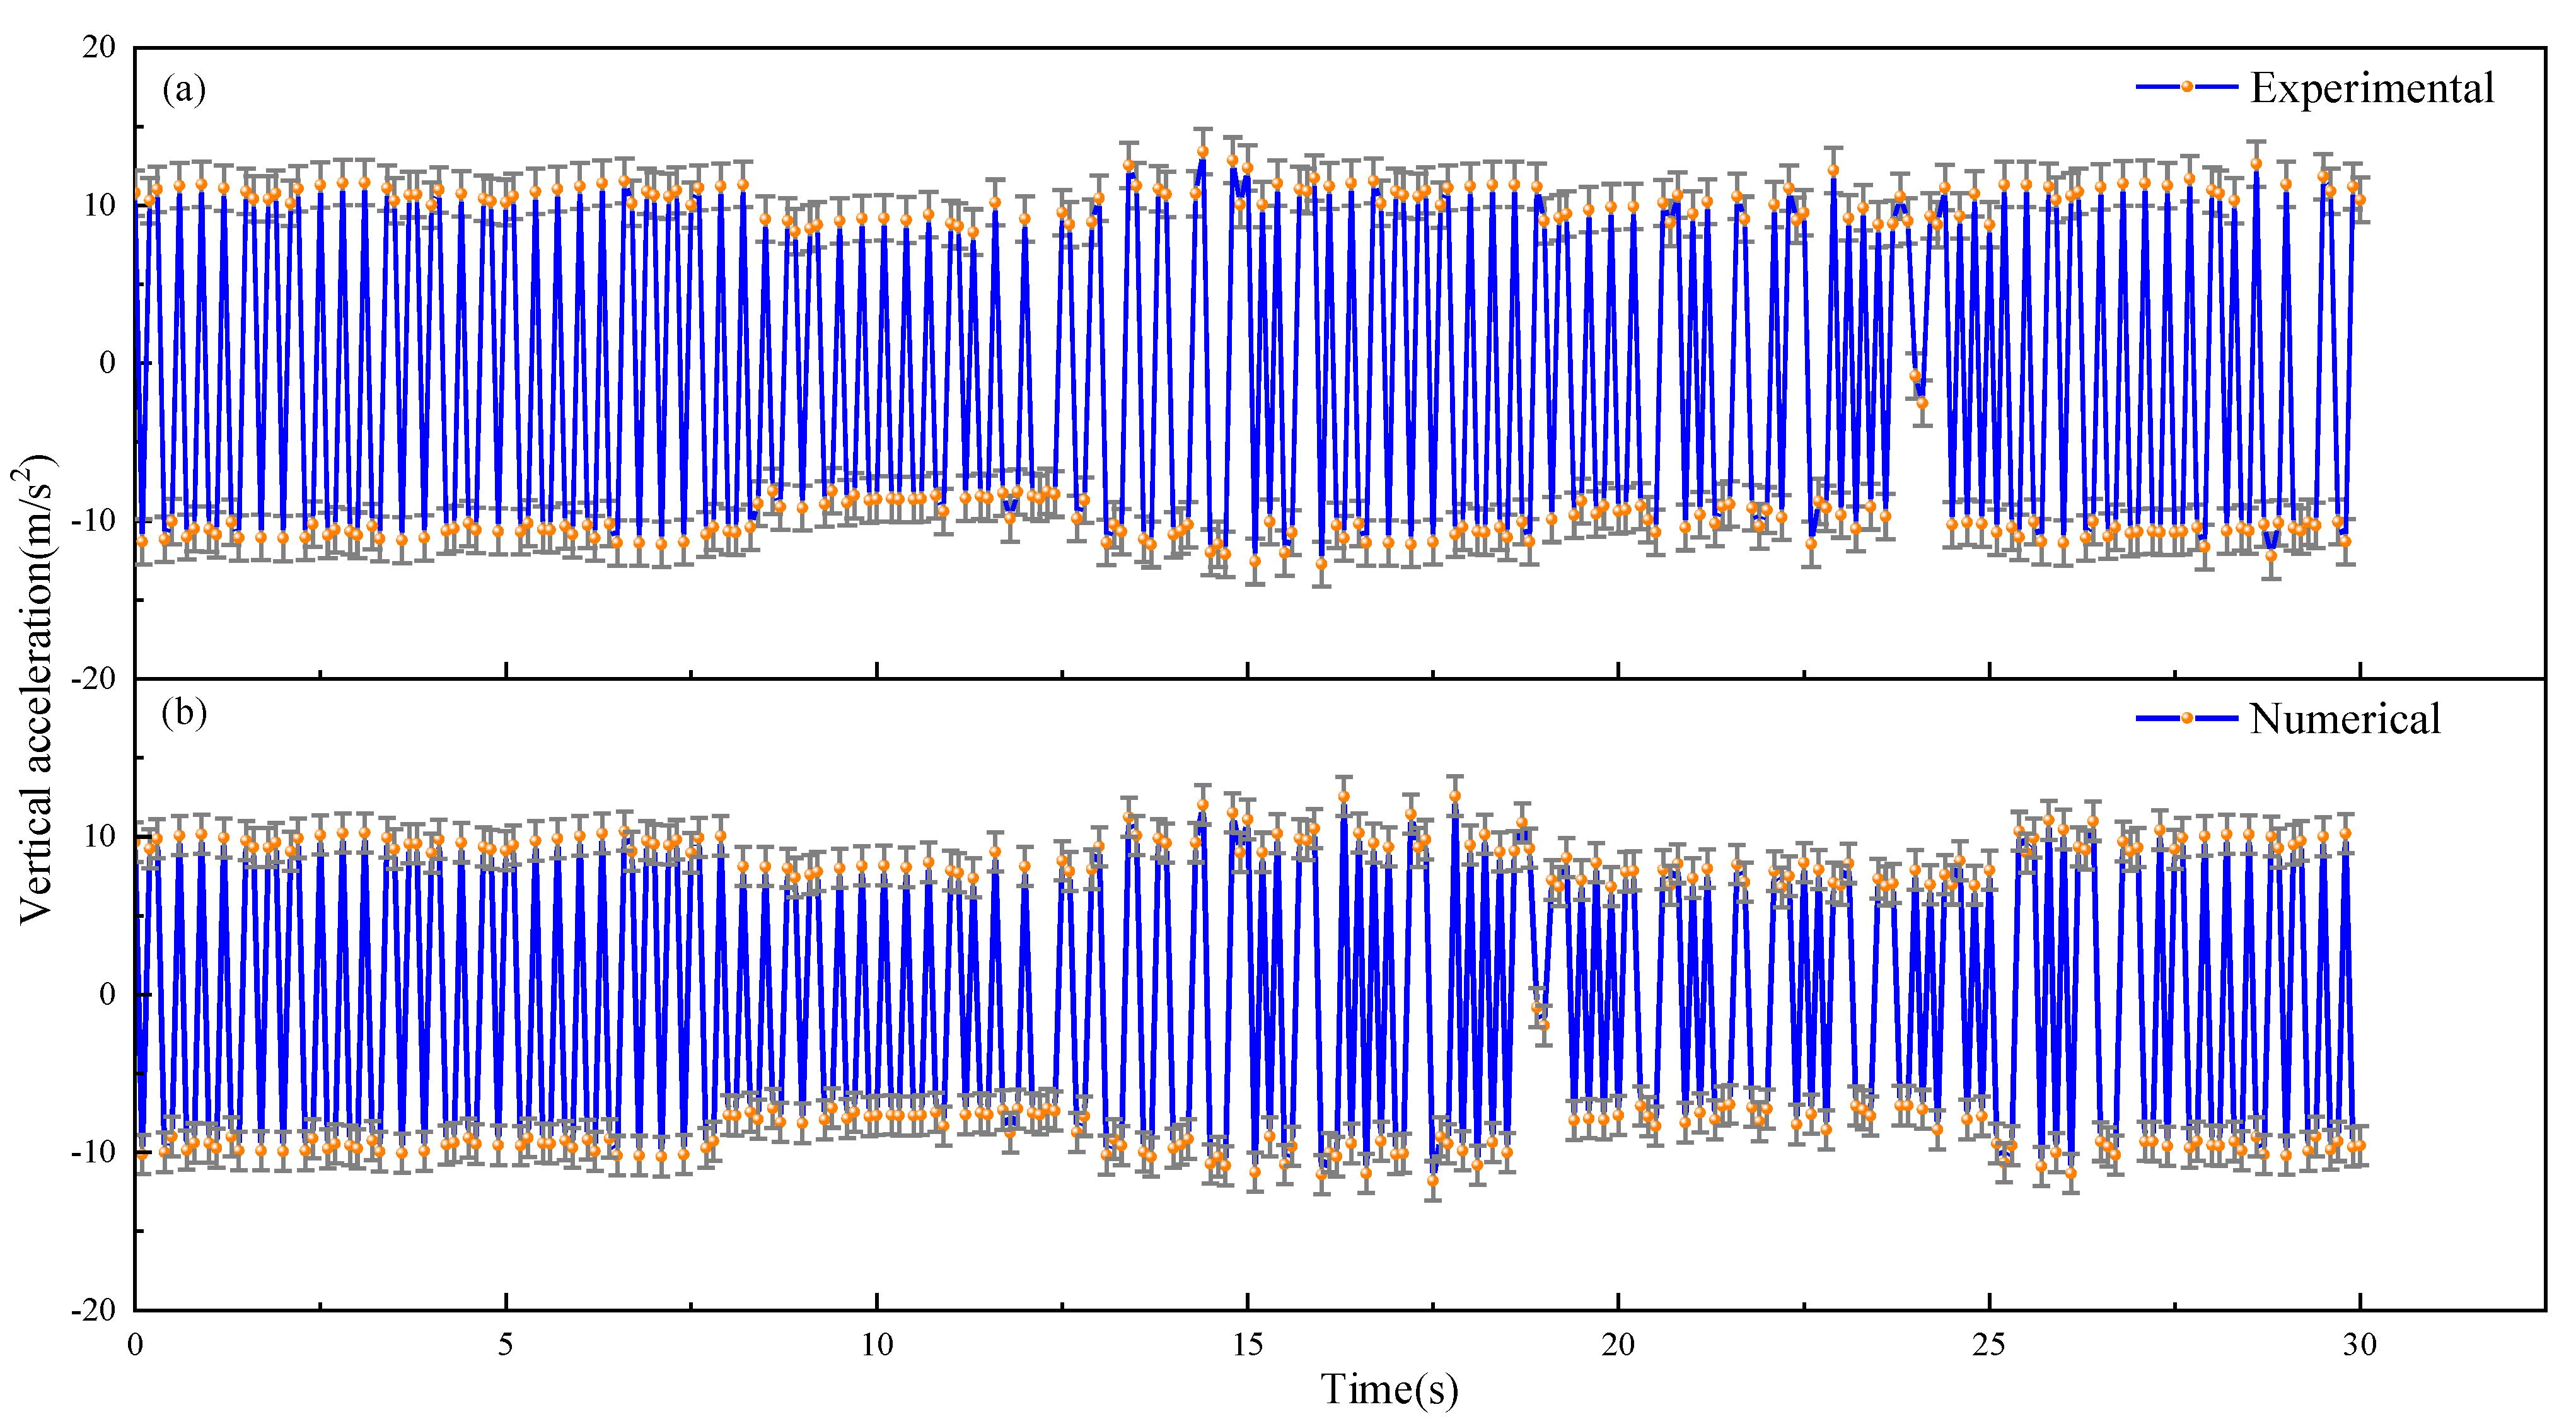
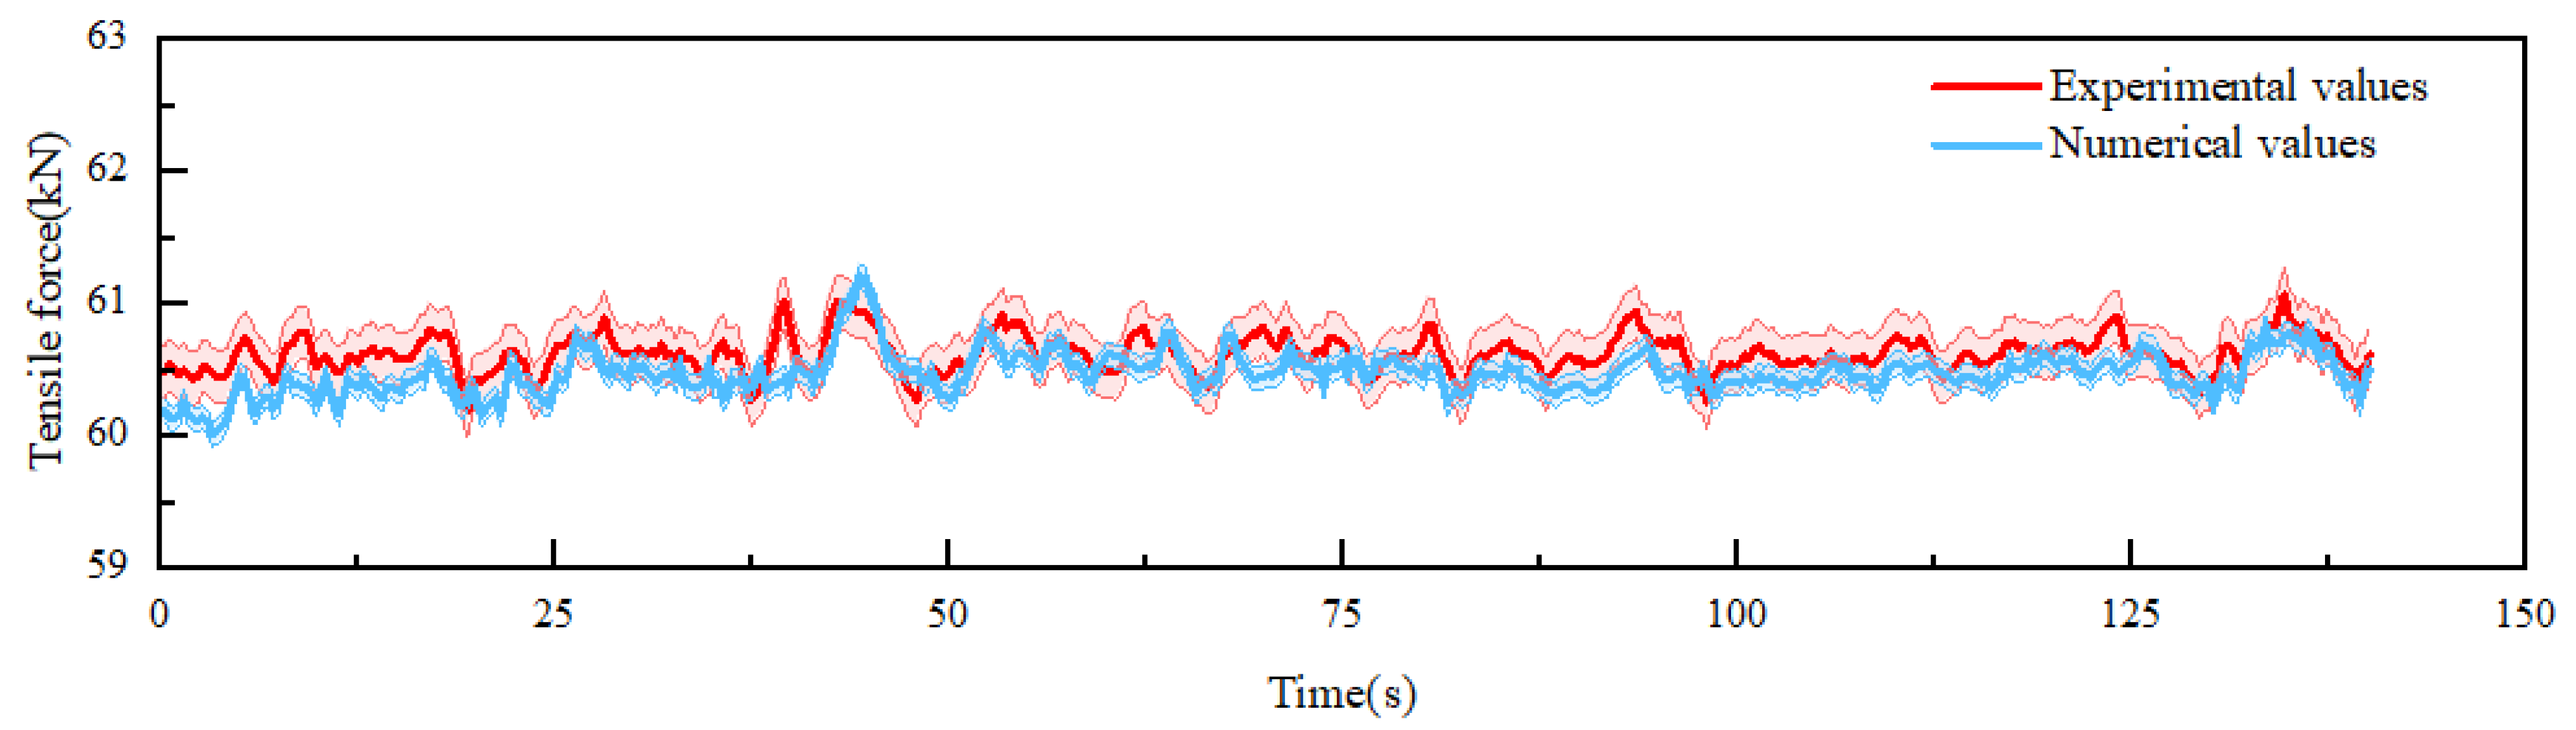
3.1. Numerical Model Validation

Figure 4 illustrates the acceleration curves obtained from both the simulation and the experimental tests under single-point loading conditions. A comparison of the time-varying trends indicates that the acceleration amplitude and periodicity from both the simulation and experiment are in good agreement. The average acceleration obtained from the experimental test is 11.2 m/s2, while that from the simulation is 10.9 m/s2, resulting in a deviation of 2.68%. In terms of standard deviation, the experimental value is 11.3 m/s2, and that of the simulation is 10.5 m/s2, resulting in a deviation of 7.08%. These discrepancies are primarily attributed to the nonlinear response of the blade material, uneven load distribution, and external wind speed variations affecting the test results. The nonlinear behavior of the material and uneven load distribution lead to inaccuracies in blade deformation and stress, while wind speed fluctuations may affect the stability of the test. These factors are often simplified or ignored in the simulation model, resulting in discrepancies between the experimental and simulated results.
Figure 5 presents the tension variation curves of the wire rope obtained from both experimental and simulation tests under single-point loading conditions. From the figure, it can be observed that the tension variation trends over time are generally consistent under both conditions. As shown in Table 3, the average tension in the experimental results is 60.6 kN, while that from the simulation is 60.4 kN, resulting in a deviation of 0.33%. For the standard deviation of tension, the experimental value is 0.14 kN, while that from the simulation is 0.15 kN, resulting in a deviation of 7.14%. Through comparative analysis of the wire rope tension and acceleration values and their variation patterns, the high simulation accuracy of this model is verified. This indicates that the model can be used for further research in subsequent studies.

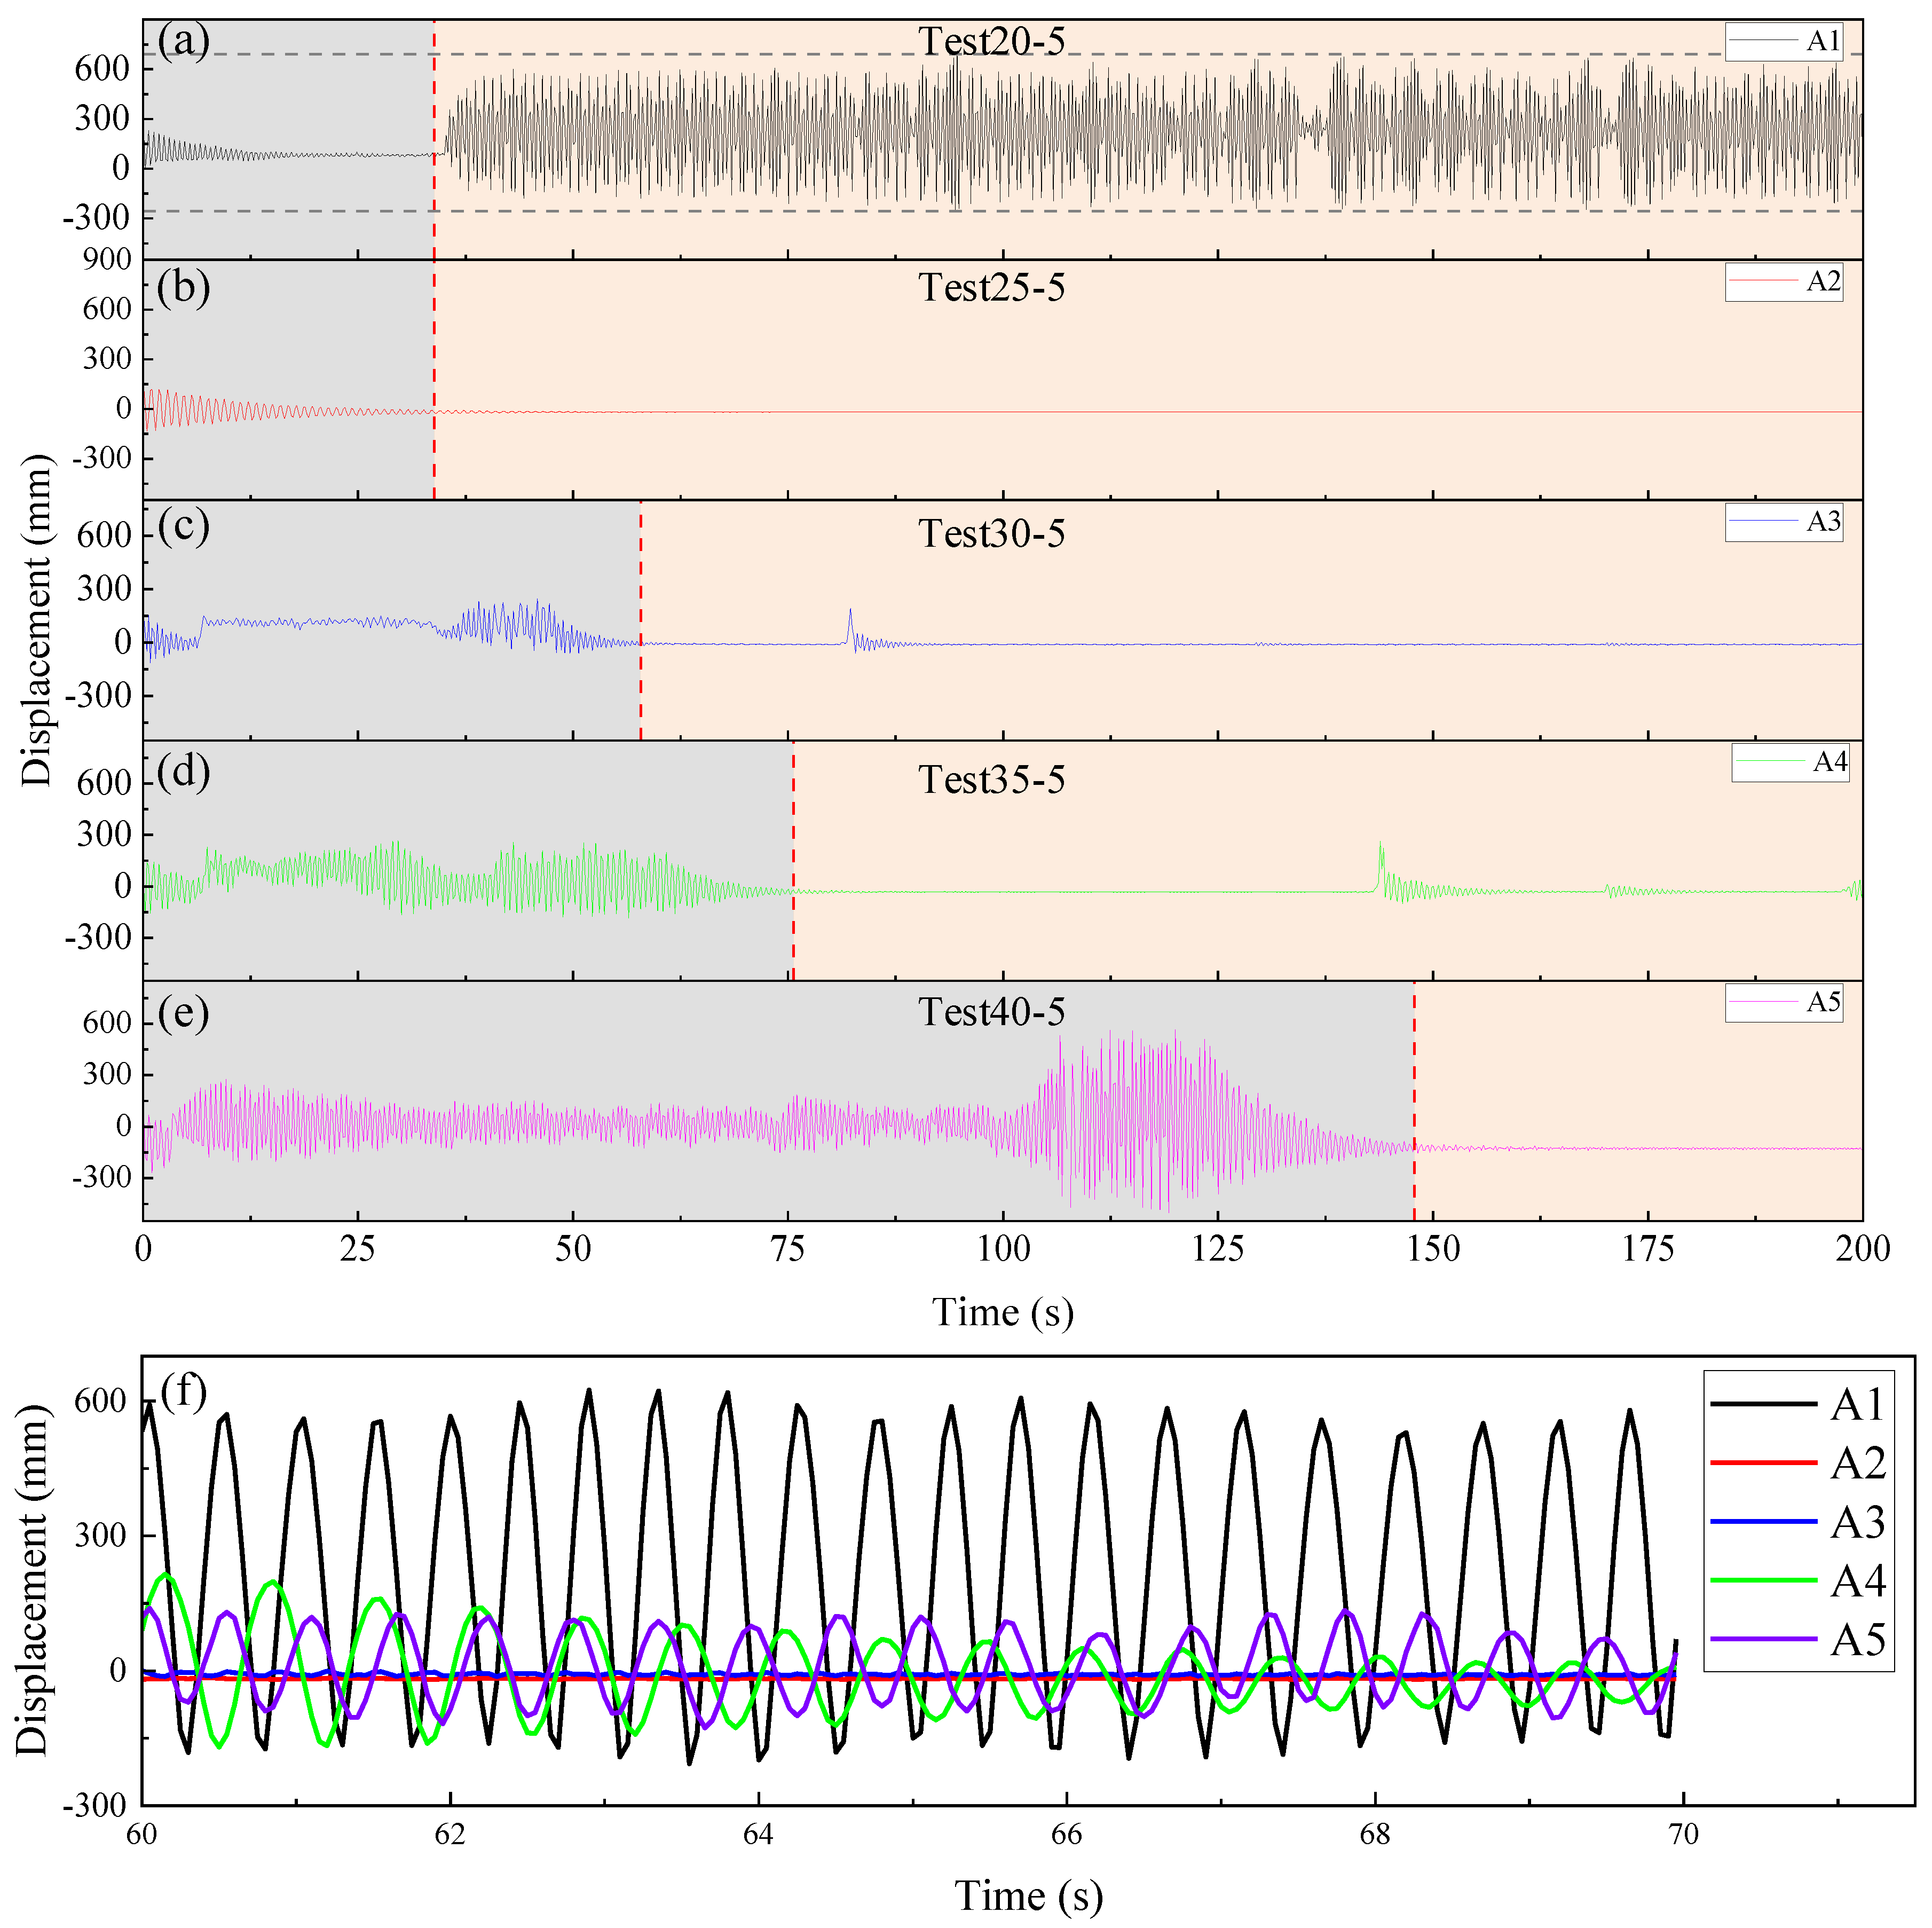
3.2. Influence of Wire Rope Span on Dynamic Vibration Characteristics

Figure 6a–e illustrates the longitudinal vibration curves of the wire rope under different span lengths. The wire rope span lengths are 20 m, 25 m, 30 m, 35 m, and 40 m, with the pulley-to-blade fixture distance set to 5 m. As shown in Figure 6a, under Condition A1, the displacement amplitude gradually decreases from 0 to 37.5 s, but then the amplitude increases significantly, exhibiting high-frequency and intense vibrations. The amplitude consistently remains within the ±600 mm range without noticeable attenuation, indicating that the wire rope has entered a resonant state. Resonance typically leads to a decrease in system stability, especially when the amplitude does not attenuate, as the vibration energy is not effectively absorbed or suppressed, thus affecting the overall stability of the system. In contrast, under Condition A2, the wire rope’s vibration amplitude reaches ±145 mm initially, but it rapidly attenuates and stabilizes after 25 s, with the vibration being quickly suppressed and the system maintaining a stable state. This is due to the strong stiffness of the wire rope and the damping effect of the system, which causes the vibration to attenuate rapidly. Figure 6c presents Condition A3, where the amplitude fluctuates, initially decreasing before increasing within the 0–57 s interval, and then gradually approaches zero after 58 s. Although the wire rope experiences a displacement jump at 80 s. The wire rope experiences a displacement jump at 80 s but quickly returns to a stable state, indicating that the system has some ability to suppress vibrations. The vibration trends of Conditions A4 and A5 are similar to A3, but as the wire rope span increases, the amplitude gradually increases, showing a stronger vibration response. Additionally, the vibration duration also continues to lengthen, as shown in Figure 6d,e.
Figure 6f is an enlarged view of the local details of the vibration within the time range of 60–70 s, corresponding to Conditions A1 to A5 as shown in Figure 6a–e. The vibration amplitude in condition A1 is the largest, with a peak value of 830.8 mm. Furthermore, both the vibration frequency and amplitude exhibit no significant attenuation, indicating a high-amplitude resonance characteristic. In contrast, the amplitudes of the other Conditions (A2 to A5) are smaller and gradually decrease over time, especially for Conditions A2 and A3, where the amplitude approaches zero, suggesting that the wire rope tends to stabilize. From Figure 6, it can be concluded that the resonance phenomenon observed in condition A1 is due to a specific combination of the wire rope span and pulley position, leading to a significant increase in the amplitude. As the wire rope span increases, the amplitude tends to rise. This is primarily due to the enhanced flexibility of the wire rope, which results in a reduction in its bending stiffness. Under external excitations such as wind loads, a longer wire rope with higher flexibility produces a larger amplitude response. Additionally, in a high-flexibility state, the wire rope is more susceptible to the amplification of local vibrations, and its vibration-damping capacity is further weakened under low-frequency excitations, thereby amplifying the vibration amplitude.

3.3. Influence of Pulley Position on Dynamic Vibration Characteristics

Figure 7 illustrates the influence of the pulley position on the tension of the wire rope. As shown in Figure 7, it can be observed that under Condition B1, the wire rope’s tension fluctuation is minimal, with an amplitude of ±40 N, indicating excellent stability. In contrast, Condition B2 exhibits a significant increase in tension fluctuation amplitude, reaching ±25,000 N. Figure 7 reveals that the tension fluctuation amplitude is maximized under this condition, with the vibration showing strong periodicity and symmetrical fluctuation patterns, indicating no significant directional deviation in the vibration process. This pronounced fluctuation is primarily due to resonance when the external excitation frequency approaches the natural frequency of the wire rope, thereby significantly amplifying the vibration amplitude. The tension fluctuation of the wire rope in Condition B3 is within a ±2000 N range, which indicates a relatively stable state. The adjustment of the pulley position in this condition effectively prevents resonance, and the stiffness and vibration characteristics of the wire rope remain within an optimal range. The tension fluctuation amplitude in Condition B4 is intermediate between that of B3 and B5, with the pulley positioned further away from the blade fixture, resulting in increased flexibility of the wire rope and a slight increase in vibration intensity. In Condition B5, the tension fluctuation amplitude increases significantly to ±20,000 N, with the vibration amplitude approaching that of B2, exhibiting notable tension fluctuation and instability.
As shown in Figure 7, altering the pulley position affects the wire rope’s tension distribution and stiffness, thereby modifying the system’s vibration characteristics and dynamic stability, which in turn impacts its overall mechanical performance and operational state. When the pulley is closer to the blade fixture, the wire rope’s tension distribution becomes more uniform, system stiffness increases, and stable vibration characteristics with reduced tension fluctuations are observed. However, as the pulley moves further away from the blade fixture, system stiffness decreases, the wire rope becomes more flexible, and tension distribution becomes uneven, resulting in significantly increased tension fluctuations.

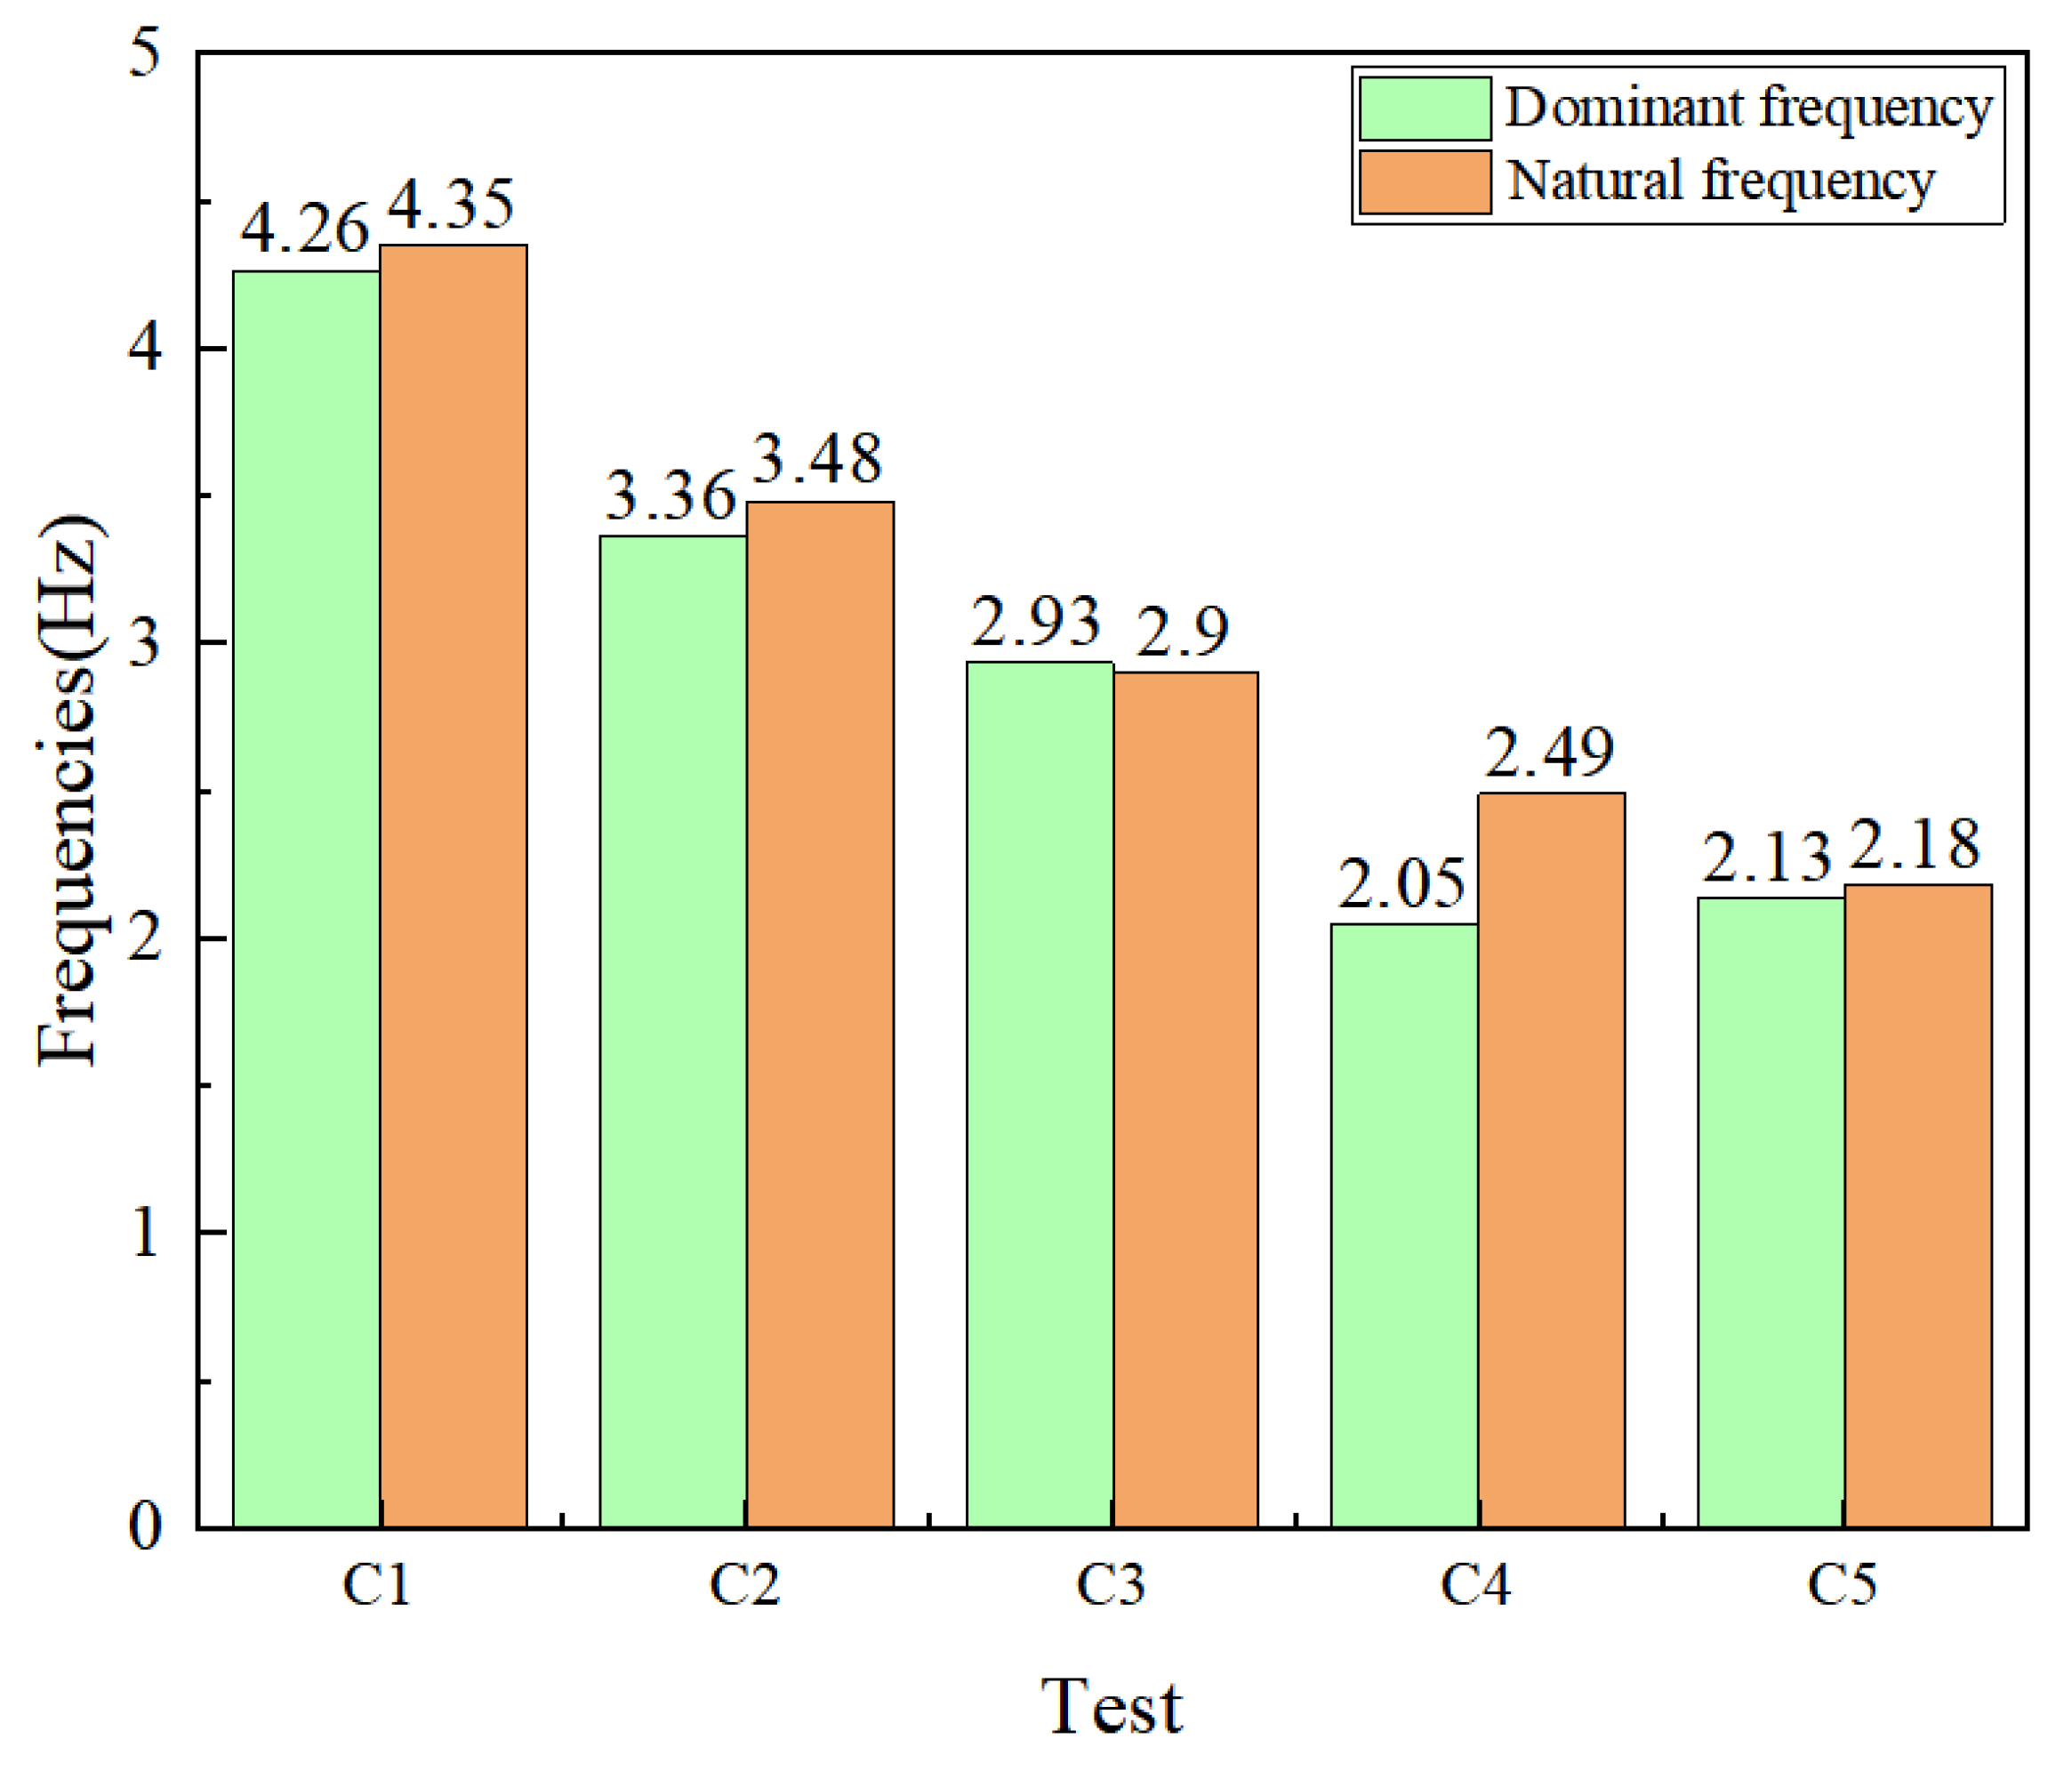
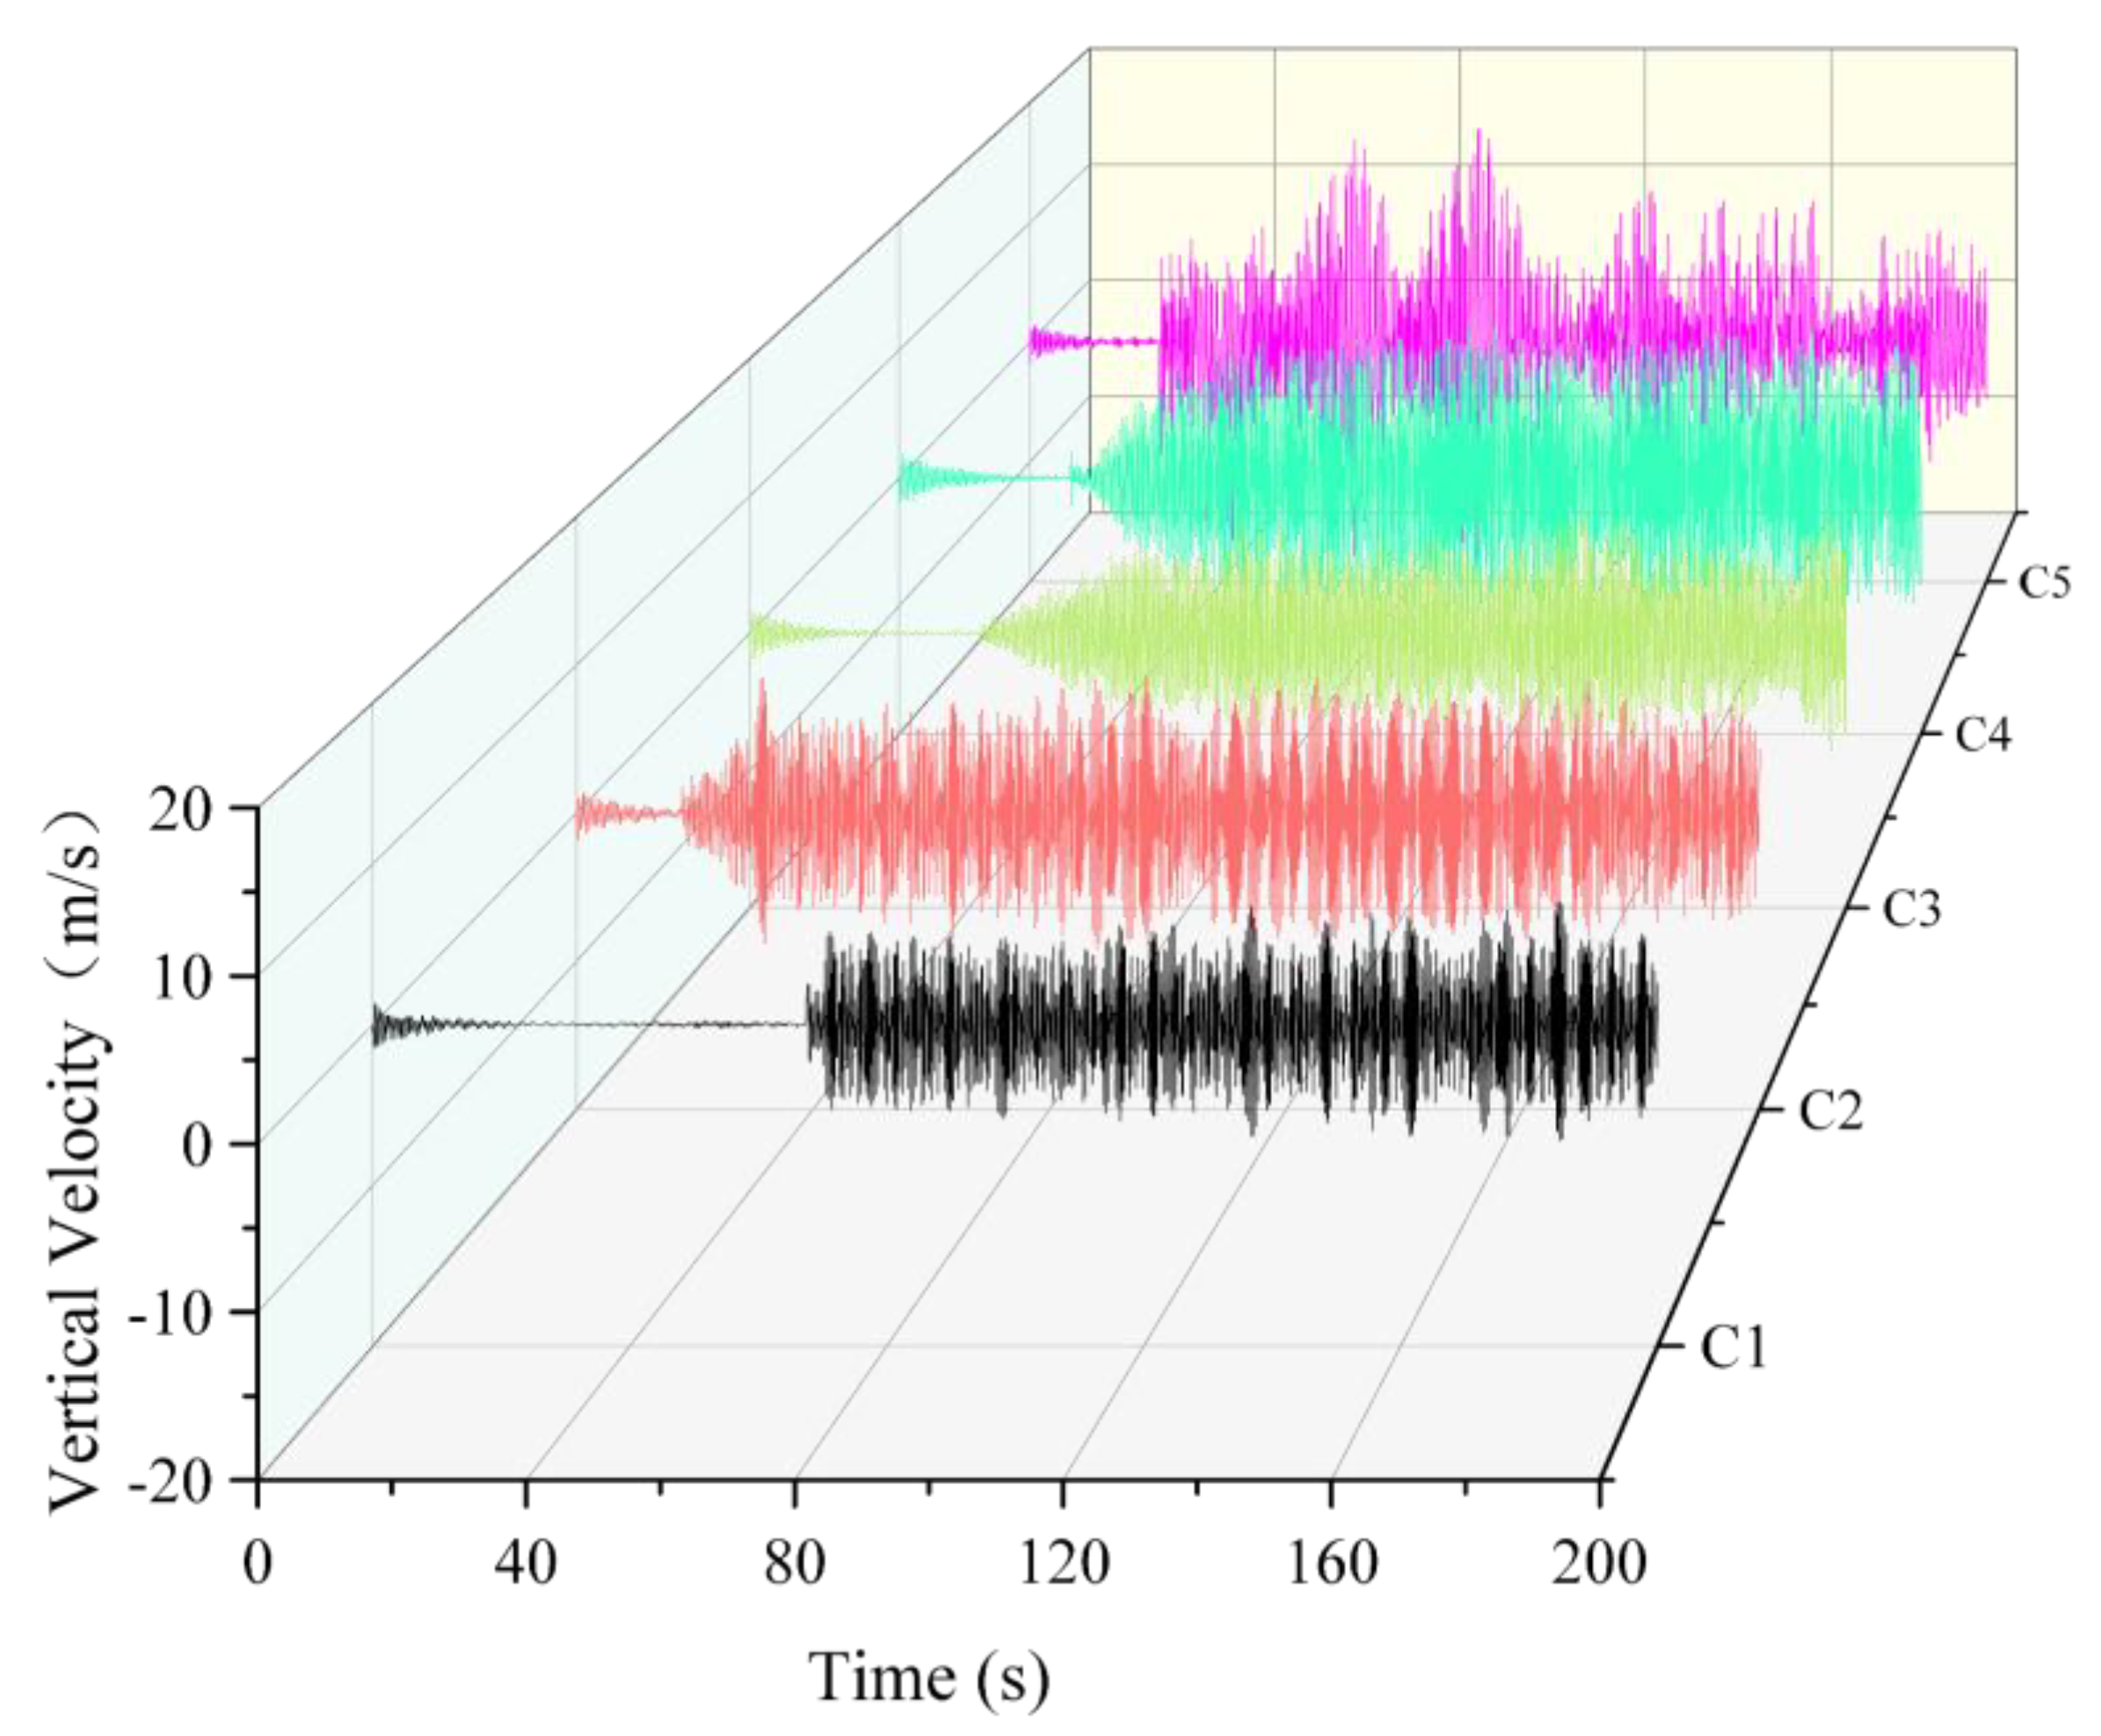
3.4. Influence of Wire Rope Span and Pulley Position on Resonance Characteristics

The natural frequency of longitudinal vibration of the wire rope in wind turbine blade static tests is given by the following formula [29]:
f n = 1 2 L T μ .
In this equation, f n denotes the natural frequency, L is the length of the wire rope, T is the tension applied to the wire rope (with T = 60 kN ), and μ is the linear density, defined as the mass per unit length of the wire rope, u = 1 . 98 kg / m .
Figure 8 illustrates the fundamental vibration frequency and natural frequency of the wire rope under different operating conditions. As the span increased from 20 m (C1) to 40 m (C5), and the distance between the pulley and the blade fixture increased from 5 m to 9 m, the natural frequency decreased from 4.35 Hz to 2.18 Hz, and the fundamental vibration frequency decreased from 4.26 Hz to 2.13 Hz. Both natural frequency and fundamental vibration frequency exhibited a downward trend. The primary reason for this frequency reduction was that increasing the span and moving the pulley further from the blade fixture significantly reduced the system’s stiffness, resulting in greater flexibility and consequently lower natural and fundamental vibration frequencies. Among the five test conditions, the difference between fundamental vibration frequency and natural frequency remained small (ranging from 0.05 Hz to 0.09 Hz), making the system more susceptible to resonance, thereby amplifying vibration amplitude and diminishing dynamic stability.
Figure 9 presents the time-history curves of the wire rope’s longitudinal velocity under various operating conditions. As demonstrated in Figure 9, the vibration amplitude of the wire rope steadily rose over time, leading to resonance in every operating condition. The timing of resonance and its associated amplitude followed a regular pattern based on changes in system stiffness and pulley position: when stiffness was higher, resonance occurred later and amplitude remained smaller; as stiffness decreased, resonance occurred earlier, and amplitude increased. Resonance occurs at 75 s with a minimal amplitude of ±3.29 m/s due to high system stiffness in Condition C1. In Condition C2, resonance occurs earlier at 25 s, with the amplitude increasing to ±6.8 m/s. In Condition C3, resonance is observed at 45 s, accompanied by an amplitude of ±7.5 m/s. Resonance is reached at 28 s with an amplitude escalating to ±10.8 m/s in Condition C4. Condition C5, characterized by the lowest system stiffness, undergoes resonance at 50 s, resulting in the largest amplitude, exceeding ±11.5 m/s.
The analysis indicates that increasing the span of the traction wire rope, coupled with further displacement of the pulley position, results in a decrease in system stiffness, thereby causing a gradual reduction in the natural frequency. This reduction facilitates a closer alignment between the natural frequency and the fundamental vibration frequency, leading to an increased vibration amplitude and reduced dynamic stability of the traction wire rope. To mitigate the risk of resonance, it is essential to optimize both the span and the loading position to ensure substantial detuning between the natural frequency and the fundamental vibration frequency, thereby maintaining the stability of the single-point loading system.

4. Conclusions

This study developed a single-point static loading simulation model for wind turbine blades, with a blade length of 71.5 m and the loading point positioned 55.2 m from the blade root. The effects of wire rope span, pulley position, and the interaction between these two parameters on the vibration characteristics of the wire rope during single-point loading were analyzed. The primary findings are as follows:
  • An increase in the wire rope span from 20 m to 40 m resulted in a corresponding rise in the vibration amplitude of the wire rope. Specifically, within the 30–40 m span range, the displacement amplitude increased from 54.5 mm to 155.4 mm, and the duration of vibrations was significantly prolonged. To optimize static loading tests of wind turbine blades and minimize vibration interference, we recommend employing a two-offset ground track design. This approach ensures that the lateral span of the wire rope remains below 30 m while still satisfying deformation requirements at both the blade root and tip. Such a design effectively mitigates vibrations and resonance effects caused by excessive span, thereby enhancing the accuracy and reliability of the test results.
  • Increasing the distance between the pulley and the blade clamp from 5 m to 9 m led to a significant rise in the vibration intensity of the wire rope. With the exception of the resonance test group (B2), the range of tension fluctuations expanded from 7.4 N to 6393.7 N. To effectively control vibrations, it is recommended that the pulley be positioned no more than 7 m away from the blade clamp. By placing the pulley closer to the blade clamp, the vibration amplitude can be significantly reduced, and vibration duration shortened, facilitating faster dissipation of vibration energy in the wire rope. This approach enhances vibration suppression, improving the overall stability of the system.
  • The vibration characteristics of the wire rope were affected by the combined influence of span and pulley position. As the span increased and the pulley was positioned further from the blade clamp, system stiffness markedly decreased, resulting in the natural frequency gradually approaching the fundamental vibration frequency. This enhanced frequency alignment significantly increased vibration amplitude, prolonged vibration duration, and heightened the probability of resonance. To avoid resonance, the pulley position and wire rope span should be adjusted in static loading tests to ensure that both are kept away from the resonance frequency range, thereby effectively reducing vibration amplitude and enhancing system stability.
This study presents a comprehensive analysis of the vibration characteristics of wire ropes under single-point static loading conditions. However, this study is constrained by its reliance on idealized loading scenarios, which fail to capture the complexities of real-world conditions. Future research should investigate the impact of guide pulley angles on wire rope vibrations, as these angles alter the force distribution within the rope, thereby influencing its vibrational behavior. Additionally, key control parameters in loading tests—such as loading steps, duration, and hold times—may significantly affect the dynamic response of the wire rope. Optimizing these parameters could mitigate vibrational instability and improve system stability. Finally, to better replicate real-world conditions, future studies should incorporate multi-point loading simulations to accurately model load distribution observed in field experiments and investigate the interactions between multiple loading points.

Author Contributions

Y.Z. (Yingjie Zhang) contributed to conceptualization, methodology, software, validation, writing—original draft preparation, writing—acquisition, writing—review and editing, and visualization; Z.Q. contributed to conceptualization, methodology, supervision, and writing—review and editing; Y.Z. (Yuhuan Zhang) contributed to conceptualization, methodology, software, validation, writing—review and editing, visualization, supervision; J.L. contributed to resources and writing—review and editing; L.Z. contributed to resources, formal analysis, and supervision; P.Y. contributed to resources and investigation. All authors have read and agreed to the published version of the manuscript.

Funding

This research was supported by the National Natural Science Foundation of China (Grant Number: 52075305) and China Huaneng Group Science and Technology Project (No. HNKJ24-H16).

Data Availability Statement

The original contributions presented in this study are included in the article. Further inquiries can be directed to the corresponding author.

Acknowledgments

We wish to express our sincere thanks to Dongfang Electric Wind Power Co., Ltd. for their invaluable support in this research. Furthermore, we are deeply appreciative of the anonymous reviewers for their insightful and constructive feedback, which greatly enhanced the quality of this manuscript.

Conflicts of Interest

Author Zhiwen Oin was employed by the company of Huaneng Clean Energy Research Institute. The remaining authors declare that the research was conducted in the absence of any commercial or financial relationships that could be construed as a potential conflict of interest.

References

  1. Sadorsky, P. Wind energy for sustainable development: Driving factors and future outlook. J. Clean. Prod. 2021, 289, 125779. [Google Scholar] [CrossRef]
  2. Ju, S.-H.; Huang, Y.-C.; Huang, Y.-Y. Study of optimal large-scale offshore wind turbines. Renew. Energy 2020, 154, 161–174. [Google Scholar] [CrossRef]
  3. Jung, C.; Sander, L.; Schindler, D.J.E.C. Future global offshore wind energy under climate change and advanced wind turbine technology. Energy Convers. Manag. 2024, 321, 119075. [Google Scholar] [CrossRef]
  4. Boadu, S.; Otoo, E. A comprehensive review on wind energy in Africa: Challenges, benefits and recommendations. Renew. Sustain. Energy Rev. 2024, 191, 114035. [Google Scholar] [CrossRef]
  5. Zhang, S.; Wei, J.; Chen, X.; Zhao, Y. China in global wind power development: Role, status and impact. Renew. Sustain. Energy Rev. 2020, 127, 109881. [Google Scholar] [CrossRef]
  6. GWEC. Global Wind Report 2024; GWEC: London, UK, 2024. [Google Scholar]
  7. McKenna, R.; Leye, P.O.v.d.; Fichtner, W. Key challenges and prospects for large wind turbines. Renew. Sustain. Energy Rev. 2016, 53, 1212–1221. [Google Scholar] [CrossRef]
  8. de Falani, S.Y.A.; González, M.O.A.; Barreto, F.M.; de Toledo, J.C.; Torkomian, A.L.V. Trends in the technological development of wind energy generation. Int. J. Technol. Manag. Sustain. Dev. 2020, 19, 43–68. [Google Scholar] [CrossRef]
  9. Hu, Y.; Dai, J.; Liu, D. Research Status and Development Trend on Large Scale Wind Turbine Blades. J. Mech. Eng. 2013, 49, 140. [Google Scholar] [CrossRef]
  10. Lee, H.G.; Park, J. Static test until structural collapse after fatigue testing of a full-scale wind turbine blade. Compos. Struct. 2016, 136, 251–257. [Google Scholar] [CrossRef]
  11. Jensen, F.M.; Falzon, B.G.; Ankersen, J.; Stang, H. Structural testing and numerical simulation of a 34m composite wind turbine blade. Compos. Struct. 2006, 76, 52–61. [Google Scholar] [CrossRef]
  12. Fagan, E.M.; Flanagan, M.; Leen, S.B.; Flanagan, T.; Doyle, A.; Goggins, J. Physical experimental static testing and structural design optimisation for a composite wind turbine blade. Compos. Struct. 2017, 164, 90–103. [Google Scholar] [CrossRef]
  13. Yang, B.; Sun, D. Testing, inspecting and monitoring technologies for wind turbine blades: A survey. Renew. Sustain. Energy Rev. 2013, 22, 515–526. [Google Scholar] [CrossRef]
  14. Zhou, H.F.; Dou, H.Y.; Qin, L.Z.; Chen, Y.; Ni, Y.Q.; Ko, J.M. A review of full-scale structural testing of wind turbine blades. Renew. Sustain. Energy Rev. 2014, 33, 177–187. [Google Scholar] [CrossRef]
  15. Wang, J.; Cao, G.; Zhu, Z.; Wang, Y.; Peng, W. Lateral response of cable-guided hoisting system with time-varying length: Theoretical model and dynamics simulation verification. Proc. Inst. Mech. Eng. Part C J. Mech. Eng. Sci. 2015, 229, 2908–2920. [Google Scholar] [CrossRef]
  16. Kaczmarczyk, S. The passage through resonance in a catenary–vertical cable hoisting system with slowly varying length. J. Sound Vib. 1997, 208, 243–269. [Google Scholar] [CrossRef]
  17. Kaczmarczyk, S.; Ostachowicz, W. Transient vibration phenomena in deep mine hoisting cables. Part 1: Mathematical model. J. Sound Vib. 2003, 262, 219–244. [Google Scholar] [CrossRef]
  18. Zhou, B.; Hu, Y.; Zhu, H. Dynamic simulation and experimental investigation of the double-rope winding hoister based on an equivalent mechanical model of wire ropes. Structures 2024, 69, 107237. [Google Scholar] [CrossRef]
  19. Guo, Y.; Zhang, D.; Yang, X.; Feng, C.; Ge, S. Experimental research on effect of wire rope transverse vibration on friction transmission stability in a friction hoisting system. Tribol. Int. 2017, 115, 233–245. [Google Scholar] [CrossRef]
  20. Guo, Y.; Zhang, D.; Chen, K.; Feng, C.; Ge, S. Longitudinal dynamic characteristics of steel wire rope in a friction hoisting system and its coupling effect with friction transmission. Tribol. Int. 2018, 119, 731–743. [Google Scholar] [CrossRef]
  21. Wu, S.; He, P.; Gong, X. Analysis of transverse vibration of wire rope in flexible hoisting system. J. Vibroeng. 2021, 23, 283–297. [Google Scholar] [CrossRef]
  22. Wu, S.; He, P.; Gong, X. Transverse vibration analysis of wire rope in deep mining hoisting system. J. Vibroeng. 2021, 23, 1079–1094. [Google Scholar] [CrossRef]
  23. Zhu, Y.; Xu, T.; Ma, C.; Yao, J. Experimental study on longitudinal vibration of mine hosting rope subjected to disturbance excitations by ADAMS. Adv. Mech. Eng. 2022, 14, 16878132221076818. [Google Scholar] [CrossRef]
  24. Yang, D.-H.; Kim, K.-Y.; Kwak, M.K.; Lee, S. Dynamic modeling and experiments on the coupled vibrations of building and elevator ropes. J. Sound Vib. 2017, 390, 164–191. [Google Scholar] [CrossRef]
  25. Zhang, N.; Cao, G.; Zhu, Z.; Wang, K.; Yan, L. Nonlinear dynamics of time-varying curvature balance rope coupled with time-varying length hoisting rope in friction hoisting system. J. Sound Vib. 2023, 567, 117910. [Google Scholar] [CrossRef]
  26. Ma, C.; Yao, J.; Xiao, X.; Di, X.; Jiang, Y. Vibration Analysis of Winding Hoisting System based on ADAMS/Cable. J. Phys. Conf. Ser. 2021, 1750, 012033. [Google Scholar] [CrossRef]
  27. Wang, L. Modeling and Analysis of Steel Wire Rope Based on ADAMS Macro Command. Int. Core J. Eng. 2019, 5, 26–29. [Google Scholar] [CrossRef]
  28. IEC 61400-23; Wind Turbine Generator Systems-Part 23: Full-Scale Structural Testing of Rotor Blades. International Electrotechnical Commission: Geneva, Switzerland, 2012.
  29. Wang, N.; Cao, G.; Yan, L.; Wang, L. Modelling and passive control of flexible guiding hoisting system with time-varying length. Math. Comput. Model. Dyn. Syst. 2020, 26, 1699121. [Google Scholar] [CrossRef]
Figure 1. Numerical model of the single-point pulley loading.
Energies 18 01138 g001
Figure 2. Schematic of the static loading test setup for wind turbine blades.
Energies 18 01138 g002
Figure 3. Schematic of the static loading test process for wind turbine blades.
Energies 18 01138 g003
Figure 4. Acceleration curve with a single loading point: (a) experimental and (b) numerical.
Energies 18 01138 g004
Figure 5. The tension curve of rope with a single loading point.
Energies 18 01138 g005
Figure 6. Longitudinal vibration curves of the rope: (ae) different span conditions and (f) magnified view of the local vibration curves.
Energies 18 01138 g006
Figure 7. Tension fluctuation comparison of rope under different pulley positions (ac).
Energies 18 01138 g007
Figure 8. Dominant and natural frequencies.
Energies 18 01138 g008
Figure 9. Vertical velocity curves of rope resonance under different testing conditions.
Energies 18 01138 g009
Table 1. Parameters of the simulation model.
ComponentParameterValue
Wire ropeDiameter (mm)24
Density (kg/mm3)1.83 × 10−5
Young’s modulus (N/mm2)1.2 × 105
Damping coefficient0.01
Mesh density0.08
Contact with pulleyContact stiffness (N·mm)10,000
Maximal damping ratio0.1
Friction coefficient0.2
Table 2. Blade single-point loading scheme.
Test GroupExperiment IDWire Rope Span (m)Pulley Position (m)
Span variationA1205
A2255
A3305
A4355
A5405
Pulley position variationB1255
B2256
B3257
B4258
B5259
Resonance testingC1205
C2256
C3307
C4358
C5409
Table 3. Experimental and numerical values of acceleration and tension with error analysis.
ParameterExperimentalSimulationPercentage of Error (%)
Average acceleration (m/s2)11.210.92.68%
Standard deviation of acceleration (m/s2)11.310.57.08%
Average tension (kN)60.660.40.33%
Standard deviation of tension (kN)0.140.157.14%
Disclaimer/Publisher’s Note: The statements, opinions and data contained in all publications are solely those of the individual author(s) and contributor(s) and not of MDPI and/or the editor(s). MDPI and/or the editor(s) disclaim responsibility for any injury to people or property resulting from any ideas, methods, instructions or products referred to in the content.

