Article

Diagnostics of Inter-Turn Short Circuit Fault in Dry-Type Air-Core Reactor Based on Lissajous Graph and Lightweight Network Model

by
Binglong Xiang
1,
Xiaojing Dang
2,
Junlin Zhu
3,
Lian Chen
1,
Chao Tang
1 and
Zhongyong Zhao
1,4,*
1
College of Engineering and Technology, Southwest University, Chongqing 400716, China
2
Shenzhen Power Supply Co., Ltd., Shenzhen 518000, China
3
Electric Power Research Institute, China Southern Power Grid, Guangzhou 510663, China
4
Yibin Academy, Southwest University, Chongqing 644000, China
*
Author to whom correspondence should be addressed.
Energies 2025, 18(5), 1132; https://doi.org/10.3390/en18051132
Submission received: 10 January 2025 / Revised: 13 February 2025 / Accepted: 24 February 2025 / Published: 25 February 2025
(This article belongs to the Special Issue Electrical Equipment State Measurement and Intelligent Calculation)

Abstract

:
Dry-type air-core reactors (DARs) often have inter-turn short circuit (ITSC) faults. However, traditional fault detection methods for DARs generally demonstrate poor timeliness and low sensitivity, and few methods combine intelligent algorithms for objective and accurate diagnosis. Therefore, a novel online diagnosis method for ITSC faults was proposed. First, the “field-circuit” coupling 2D model of reactors was established to simulate the impact of ITSC faults on the characteristics of various state parameters; accordingly, the Lissajous graph was introduced to characterize the short circuit fault. Then, the variation law of the Lissajous graph under different inter-turn fault layers, turns, and degrees was explored to verify the feasibilities of the proposed method. Finally, to achieve rapid diagnosis and fulfill the requirements of edge computing, a lightweight network model named MobileNetV3-Small was used and combined as a classifier to achieve accurate diagnosis of ITSC faults. The results robustly validate that the Lissajous graphical method can significantly reflect ITSC faults through observing the variation in the graph and feature parameters. Furthermore, the MobileNetV3-Small model achieves a diagnostic accuracy of up to 95.91%, which can further enhance the diagnostic accuracy of the ITSC fault degree.

1. Introduction

The dry-type air-core reactor (DAR) is one of the most crucial examples of power equipment in the power system, and it has the advantages of low loss, stable structure, and convenient maintenance. It plays a vital role in compensating for reactive power, filtering out high-order harmonics, and limiting the short circuit current [1,2]. Due to their frequent outdoor operation, DARs are susceptible to factors such as environmental temperature, humidity, etc., which can cause partial temperature rises and even combustion, thereby causing an outage of the reactor and threatening the stability of the power system [3,4]. Research has shown that about 70% of the fault types in DARs are caused by inter-turn short circuits (ITSCs) [5]. Therefore, accurate diagnostics of ITSC faults in DARs are significant.
Traditional ITSC fault detection methods, such as frequency response analysis and impedance measurement, are normally offline tests, which can be destructive, insensitive, and timeless [6,7]. Thus, many scholars have conducted extensive research on the online detection of ITSC faults and have achieved significant results. Reference [8] proposed an acoustic-based evaluation technique for insulation defects in DARs, simulated discharge models under different insulation conditions, and analyzed their sound characteristics, providing a reference for the operation status detection technology of DARs. Reference [9] proposed a new time-domain computational electromagnetic modeling method and presented a numerical approach to estimate transient current and simulate transient fault information, achieving fault monitoring of reactors within seconds. In addition, the vibration method was also introduced and reference [10] combined simulation to study the relationship between electrodynamic force and vibration velocity under different operating states, revealing the variations in vibration characteristics under ITSC faults in reactors. Refs. [6,11] studied the vibration distribution characteristics of ITSC faults in reactors under different frequency excitations. The second-order center difference method was used to process vibration data for fault localization. However, most of the above online methods have low sensitivity in detecting faults in the early stages and are challenging to implement with high equipment costs; above all, extra sensors are normally needed and installed on reactors themselves, which could reduce the reliability of the reactor’ s operation. To address the constraints of overdependence on expert experience and theoretical knowledge in problem identification, many researchers have integrated deep learning methodologies into fault diagnosis [12,13,14,15]. Reference [16] proposed an autonomous recognition framework based on a reinforced adversarial open set algorithm, achieving the effective identification of compound faults using the label information of a single fault sample. Wang et al. [17,18] used a multi-label domain adversarial reinforcement learning framework and a domain reinforcement feature adaptation method based on correlation alignment, achieving cross-domain compound fault diagnosis for bearings. Nonetheless, investigations into the utilization of artificial intelligence algorithms for ITSC fault diagnostics of DAR are rather limited and remain in their nascent phases.
To avoid installing additional sensors and improve the operation reliability of DAR, the signals from the reactor itself need to be sufficiently used. This study initially examined the influence of slight ITSC faults on several electrical characteristics of DAR. Accordingly, a novel online technique utilizing the impedance characteristics of DAR has been introduced, termed the Lissajous characteristic graph method. Additionally, to enhance fault degree diagnosis, a deep learning model was integrated with a characteristic graph to facilitate intelligent diagnosis. This study’s principal contributions are as follows:
(1)
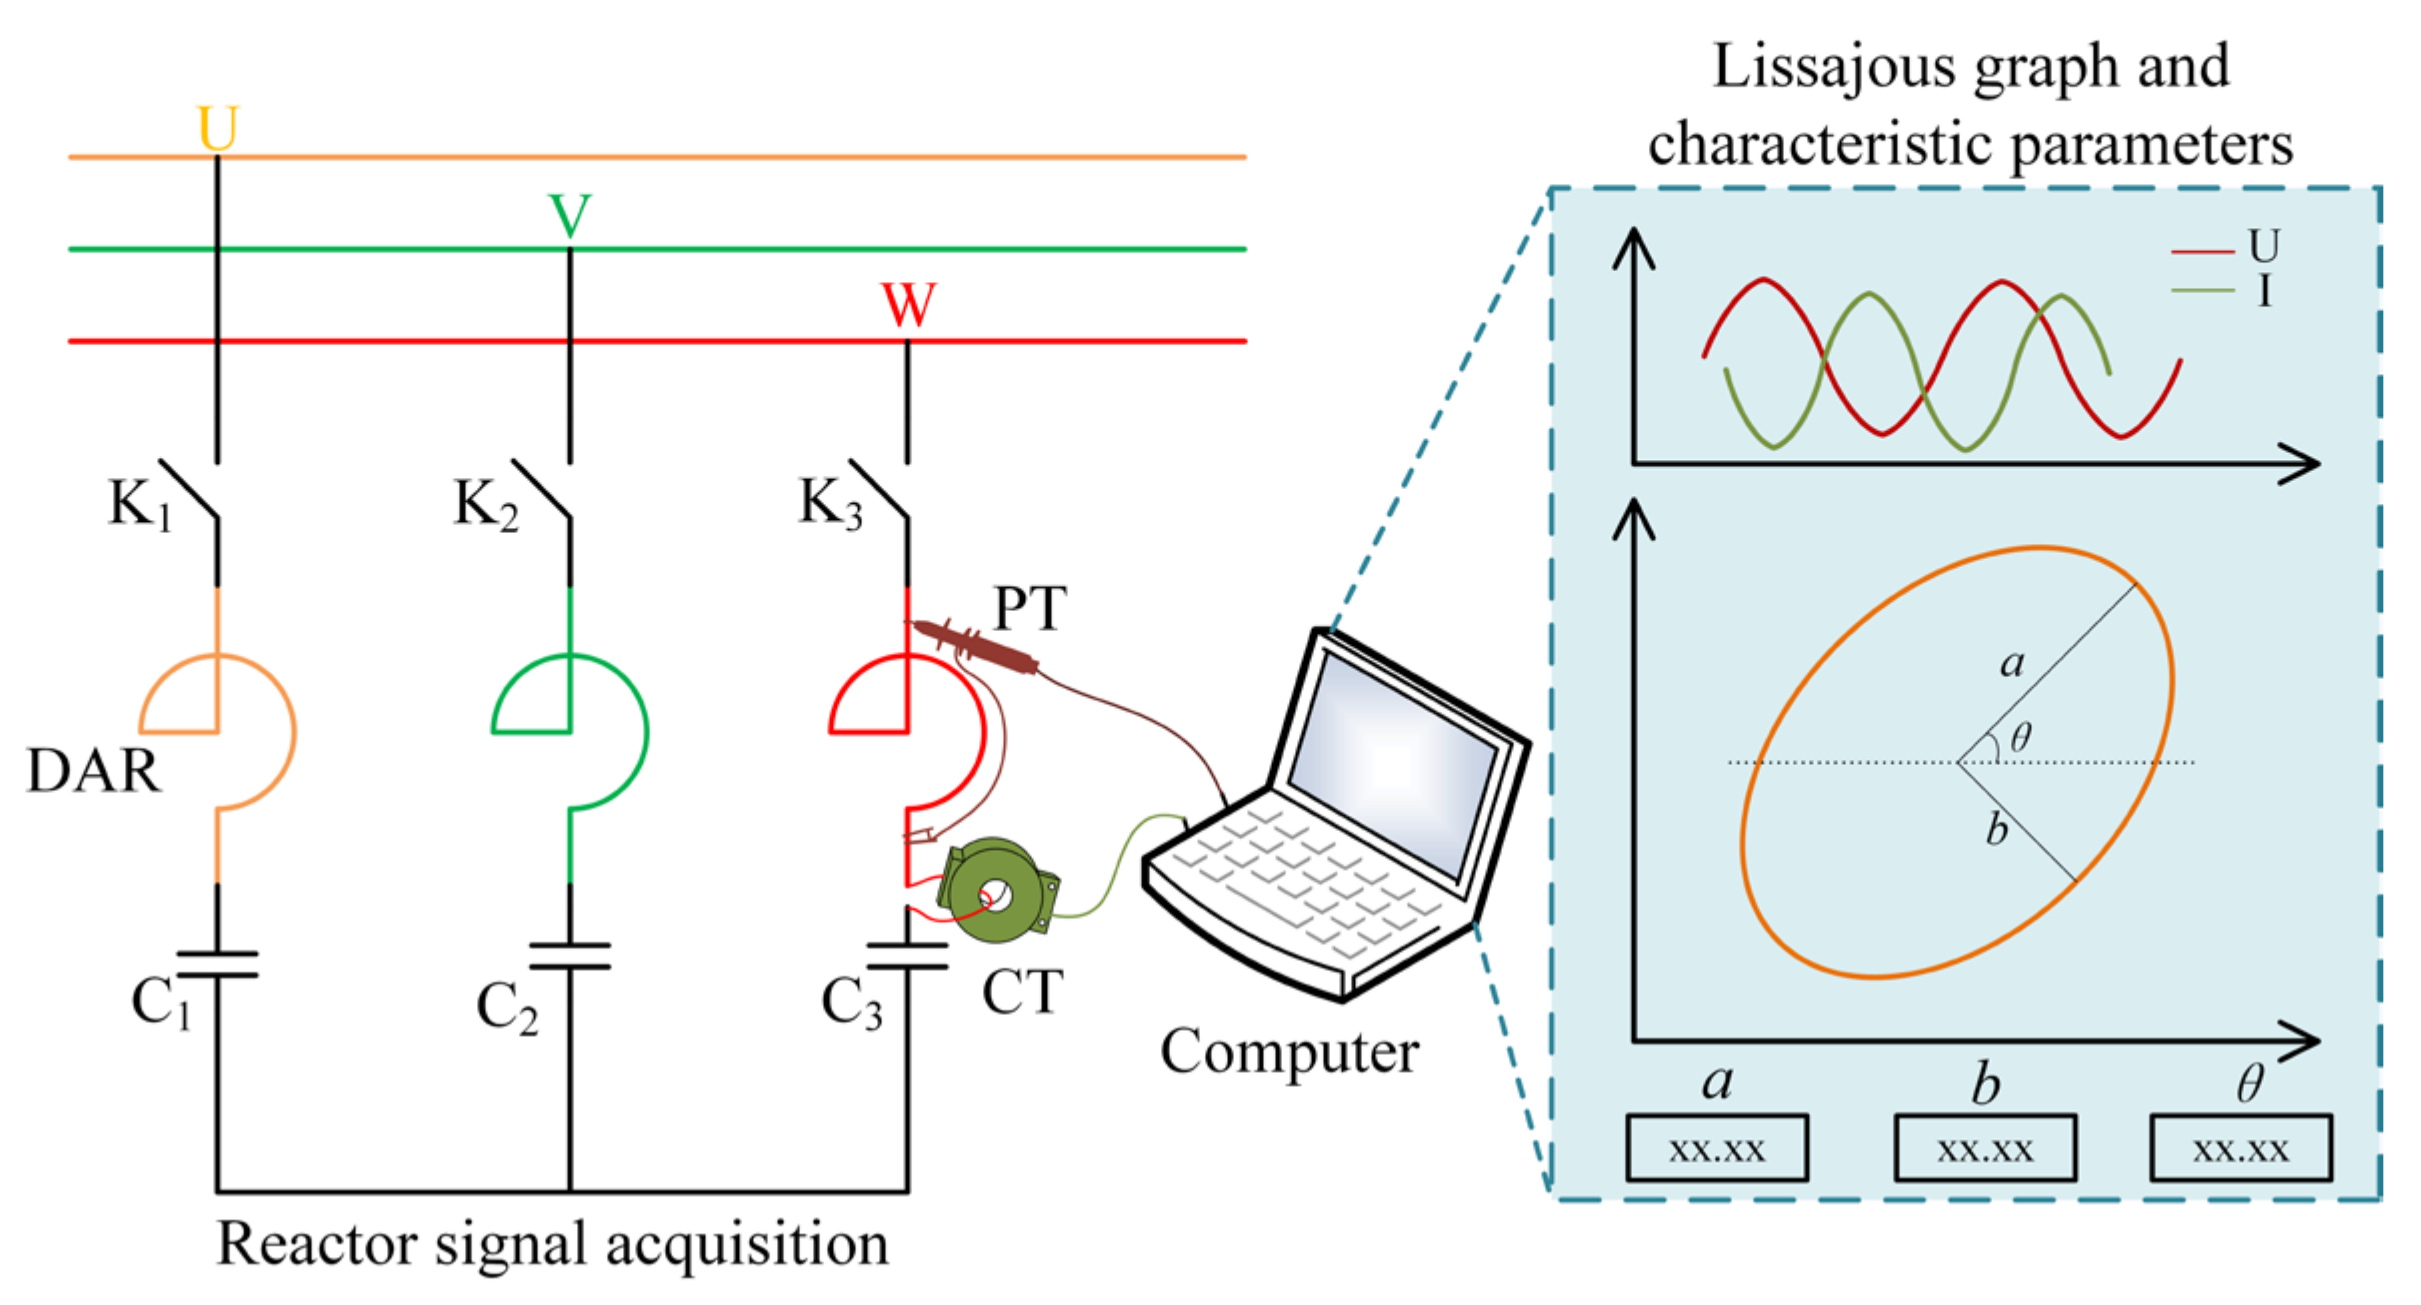
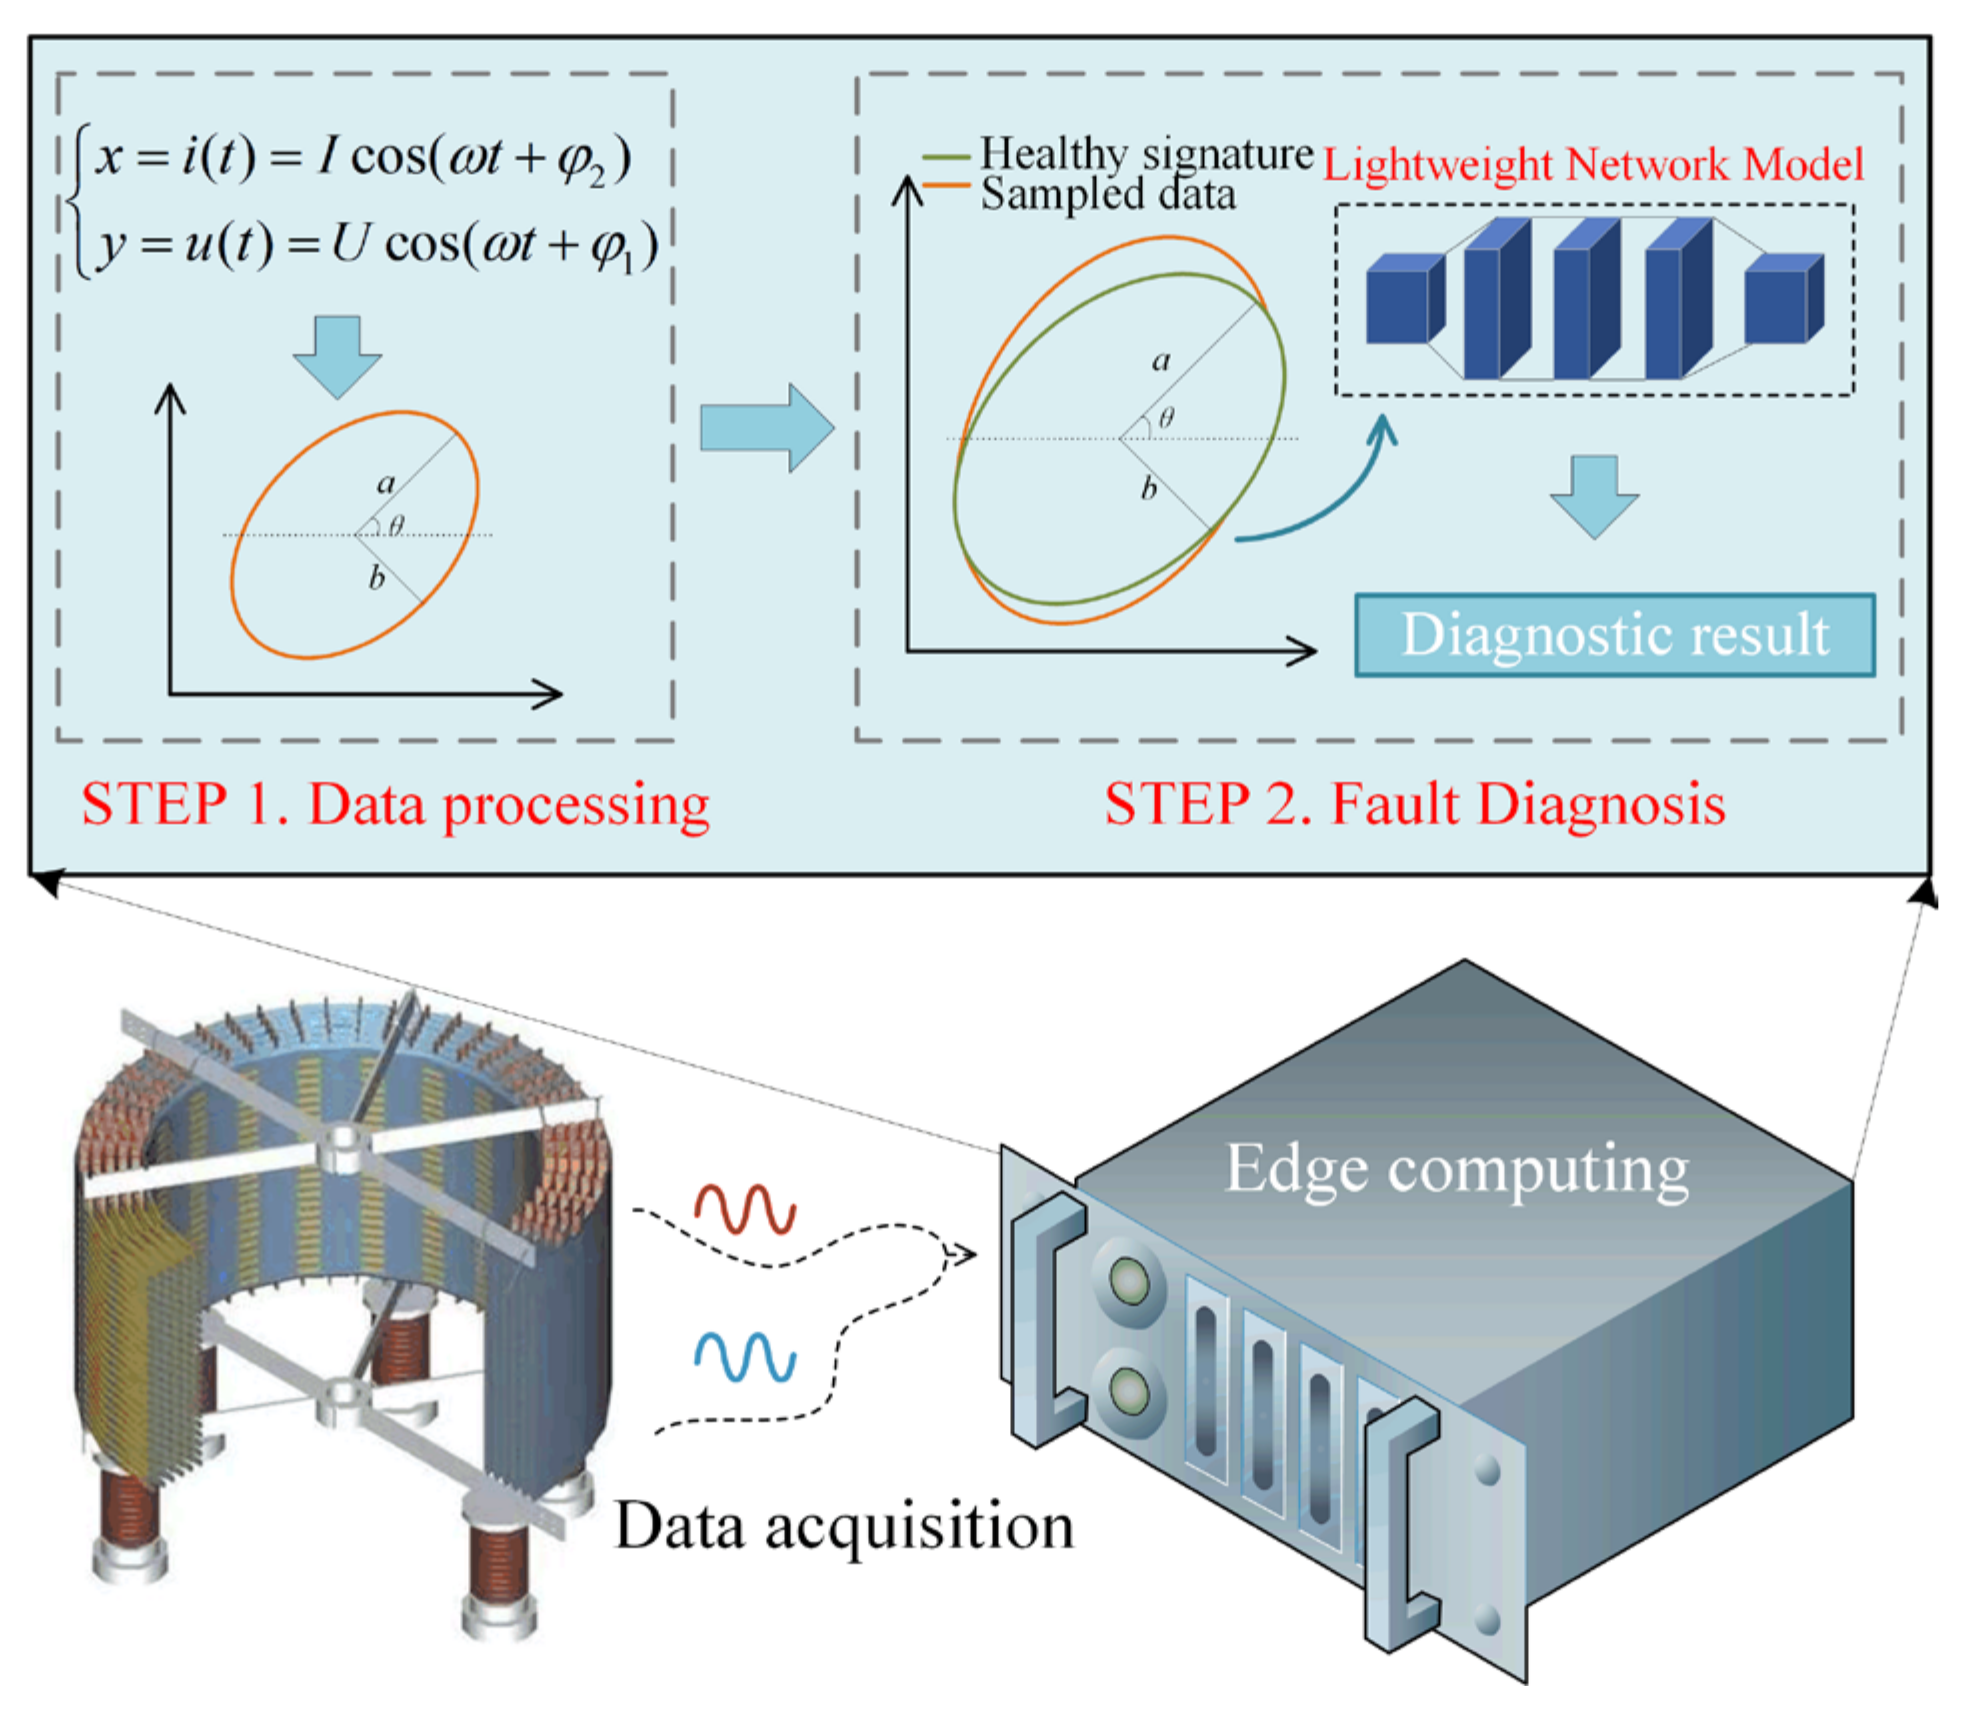
For the first time, the Lissajous graph is introduced to characterize and detect turn-to-turn short circuit faults of DARs, which only uses existing potential transformers (PTs) and current transformers (CTs) to measure signals of reactors and does not need extra sensors. It is simple and reliable in online situations.
(2)
Moreover, a lightweight network MobileNetV3-Small model is used as a new classifier to further diagnose the fault severity of ITSC, which is accurate, intelligent, and can reduce the personnel’s misjudgment. In addition, lightweight network models can better adapt to engineering applications.
In this study, we first established a two-dimensional finite element model of “field-circuit” coupling to investigate the changes in common state parameters during a minor inter-turn short circuit fault in reactors. Subsequently, the online Lissajous characteristic graph method was studied and we simulated and tested various inter-turn short circuit fault scenarios to validate the feasibility of the proposed method. Ultimately, we validated the performance of predicting inter-turn short circuit fault extents using a lightweight network MobileNetV3-Small model.
The rest of this study is organized as follows: Section 2 establishes a “field-circuit” coupling simulation model of the reactor. Section 3 introduces the online Lissajous graphic method. Section 4 analyzes the feasibility of the proposed method. Section 5 discusses the results of the fault diagnosis based on the deep learning model. Section 6 presents the conclusions.

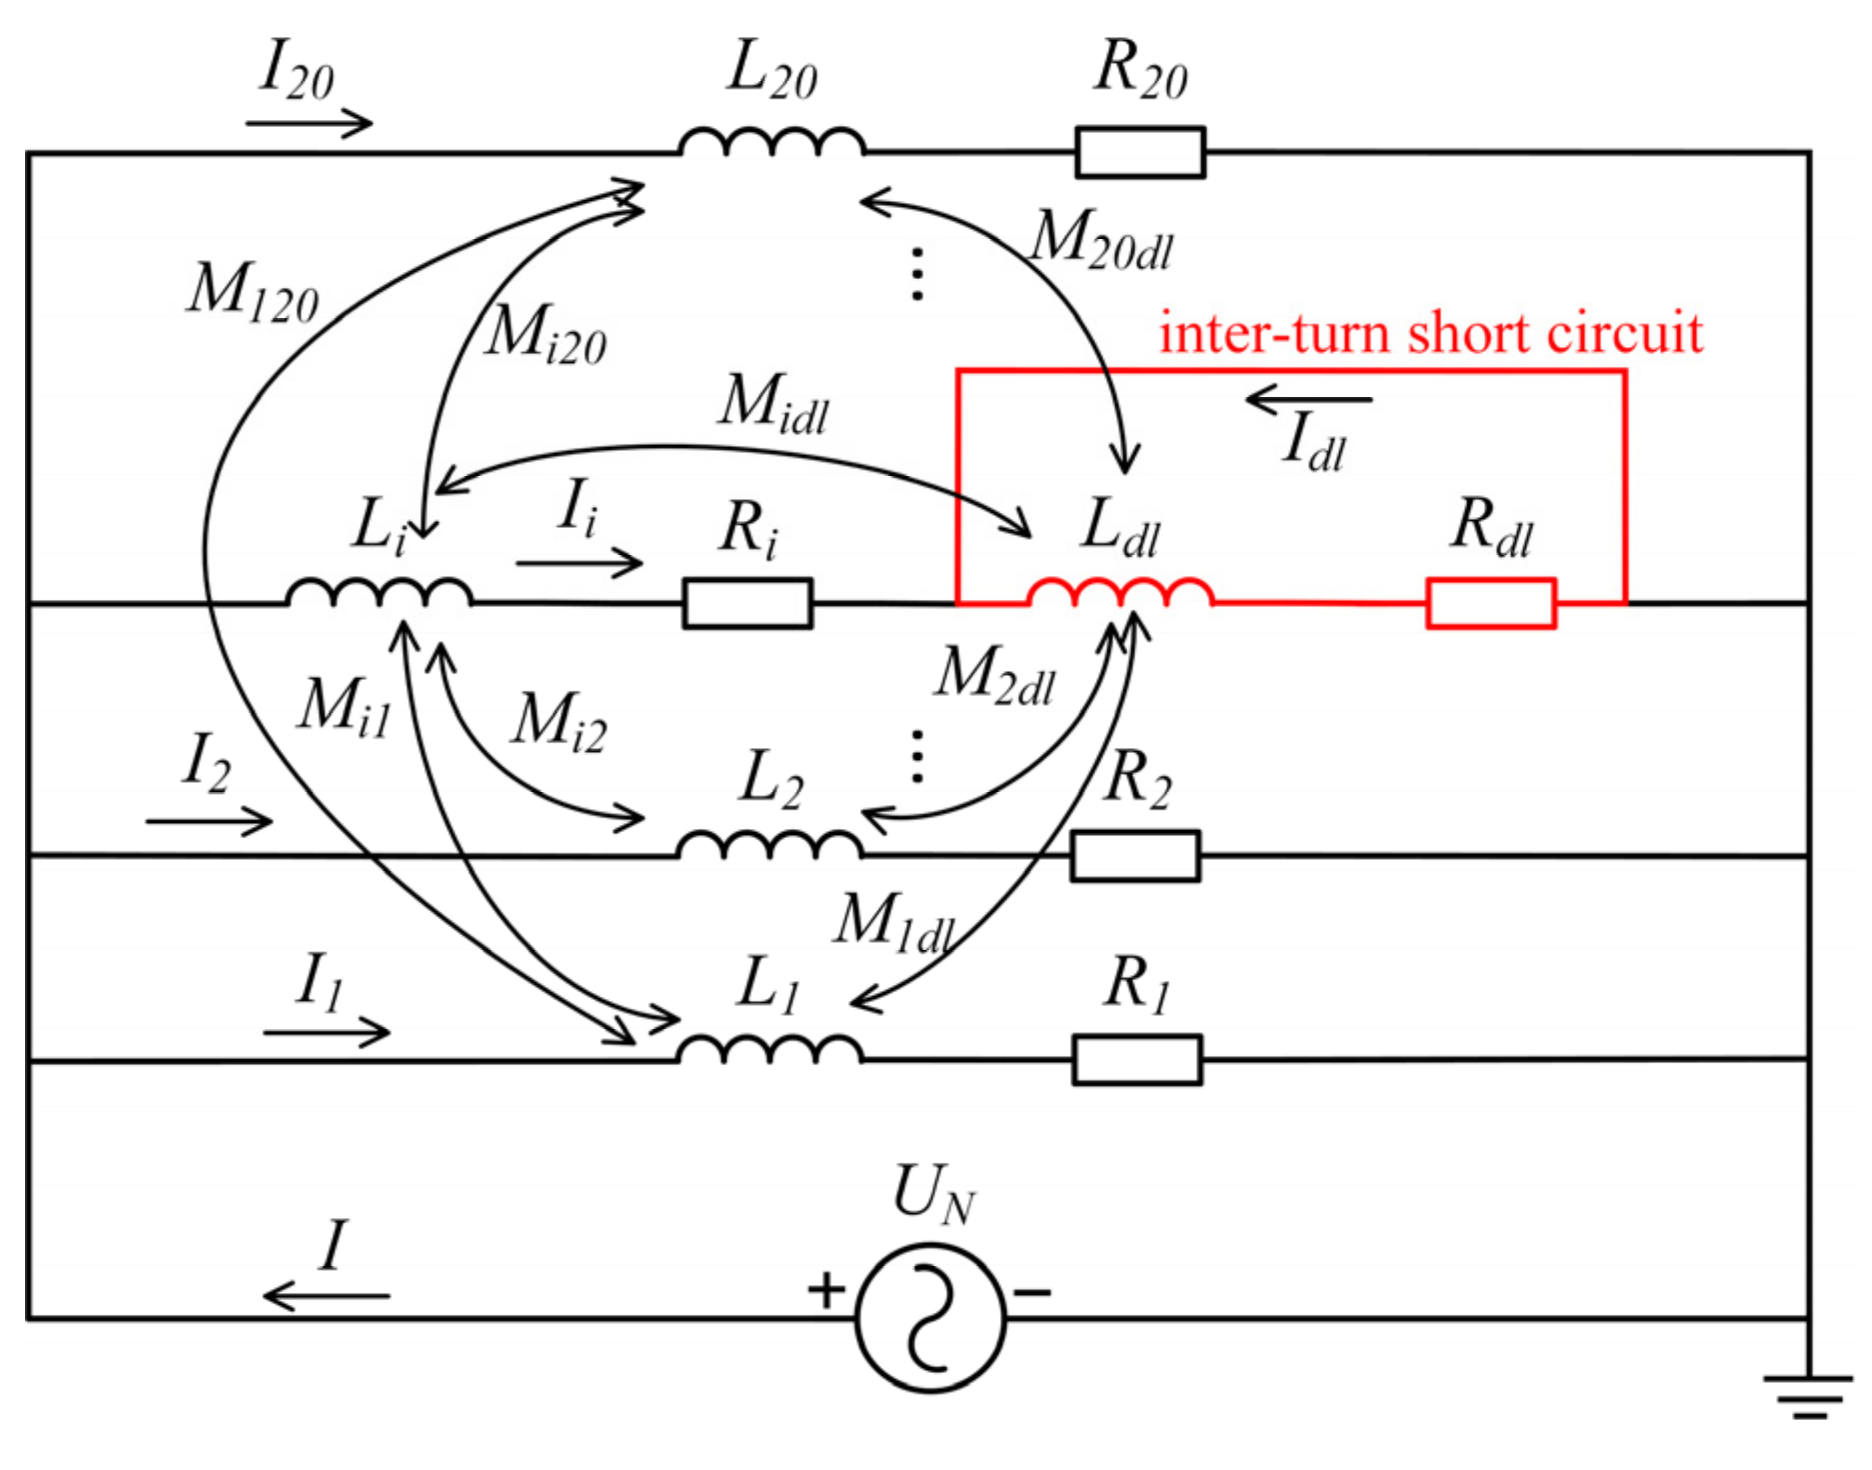
2. “Field-Circuit” Coupling Model for ITSC Fault in DAR

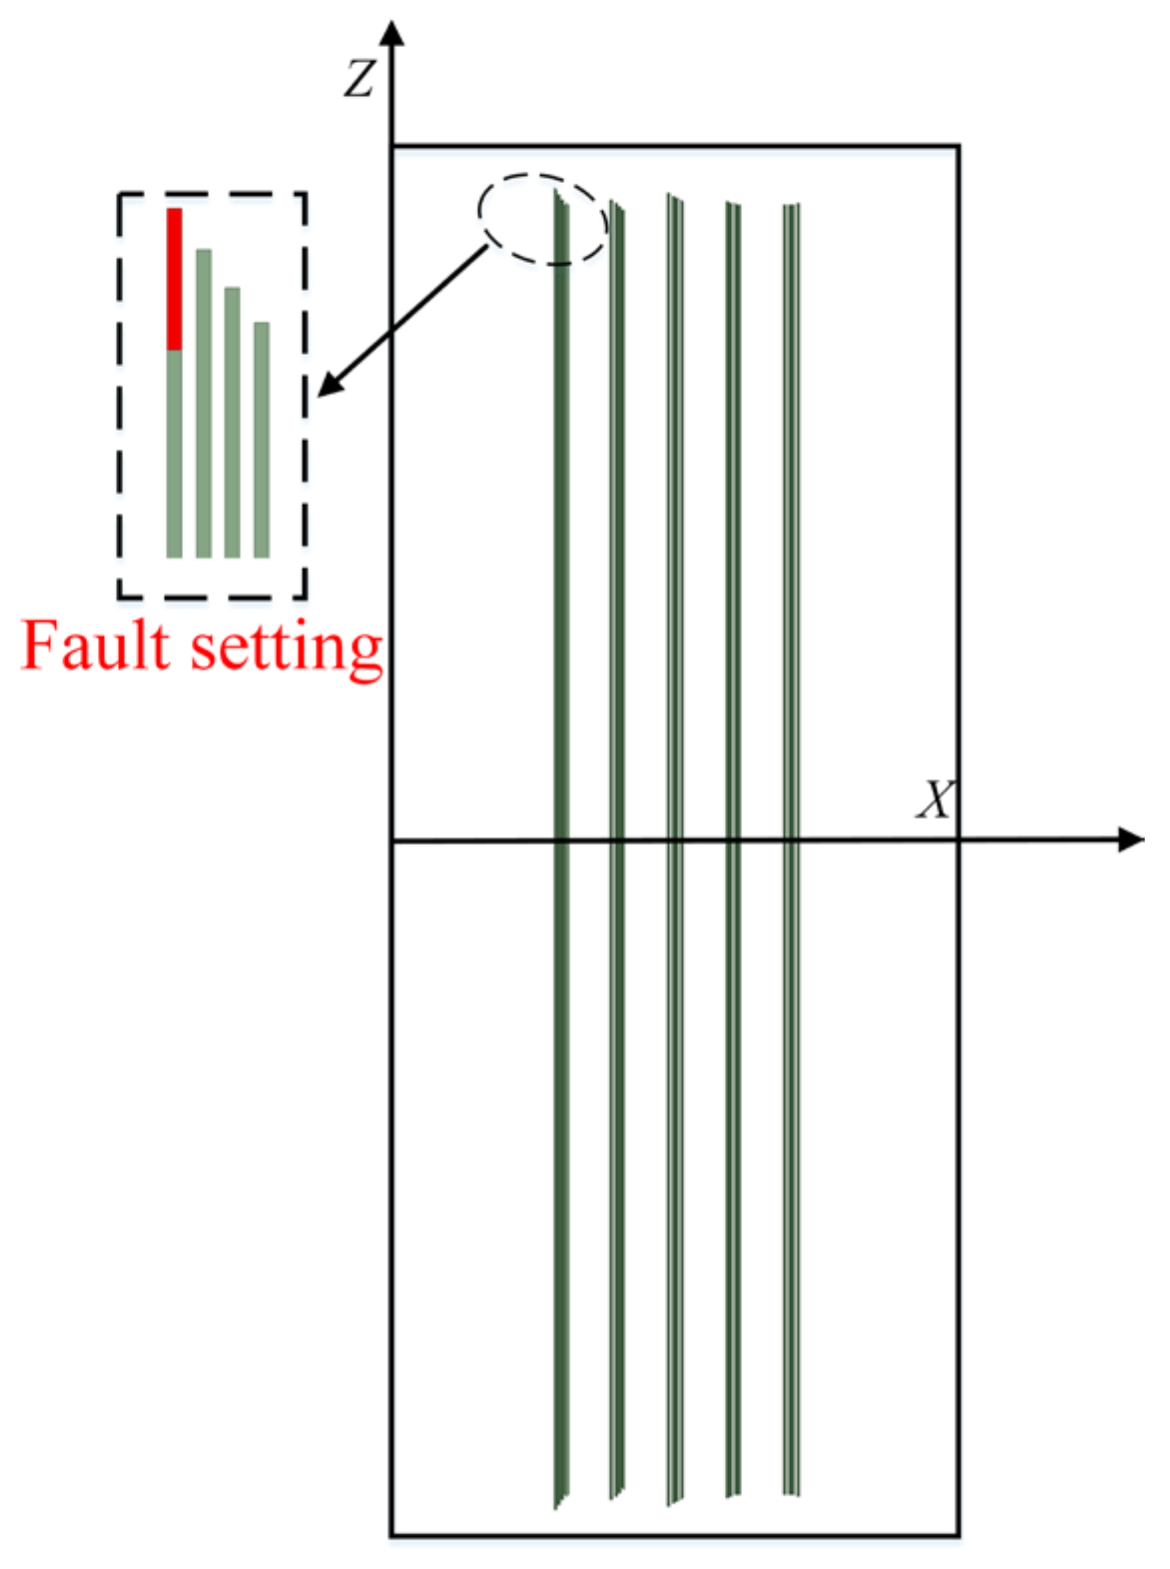
2.1. Two-Dimensional Simulation Model and Fault Setting

To study the impact of inter-turn SC fault on state parameters and construct the database for diagnostic method, this article establishes a two-dimensional finite element simulation model of a single-phase DAR based on ANSYS MAXWELL 2021 R1. The DAR is a 35 kV reactor, with capacity of 2000 kV·A, and a total of twenty layers of coils that are divided into five encapsulations [19]. The main technical parameters are shown in Table 1. The “field-circuit” coupling model was established, specifying the number of turns for each coil layer, including both healthy and faulty coils. The external circuit was established in accordance with the equivalent circuit structure to apply excitation to the model for transient field simulation, thereby replicating the dynamic process of ITSC faults in DARs. The two-dimensional model is shown in Figure 1.
In Figure 1, 1 layer of coil is selected for simulating ITSC faults along the radial direction, namely the 1st, 5th, 9th, 13th, and 20th layer, denoted as Layer 1, Layer 5, Layer 9, Layer 13, and Layer 20. The positions of the fault layer in the reactor are shown in Figure 2. Considering the structural symmetry of DAR, this article divides the reactor into upper and lower parts along the axial height H and only sets faults in the upper area. The degree of fault d is defined as the ratio of the height Hs to the total height Hi in that layer.
d = H s H i × 100 %
where Hs represents the height of the inter-turn short circuit section, and Hi represents the total height of the i-th layer coil.
By coupling the geometric model with the external circuit, ITSC faults of each layer are set in the external circuit. The circuit model is shown in Figure 3. UN represents the terminal rated voltage of the DAR; L1, L2, …, Li, …, L20 are the self-inductance of layers under normal conditions; R1, R2, …, Ri, … R20 are the resistance values of layers under normal conditions; Ldl and Rdl represent the inductance and resistance of sections that have experienced ITSC faults, respectively; Mndl is the mutual inductance between the faulty layer and the other normal layers; Min is the mutual inductance between the normal layers.

2.2. Model Validation

Before simulating the short circuit faults in the DAR model, this research employed comparisons between analytical calculations and finite element calculations to validate the model’s accuracy. The inductance and current of each layer, derived via finite element analysis, are compared with those acquired from analytical computation, as seen in Figure 4.
In Figure 4, the self-inductance and current of each layer have an error of less than 3% compared to the analytical calculation results, and the data accuracy meets the requirements for simulating ITSC faults, verifying the accuracy of the simulation model.

3. Introduction of Online Lissajous Graphic Method Based on Variation in State Parameters

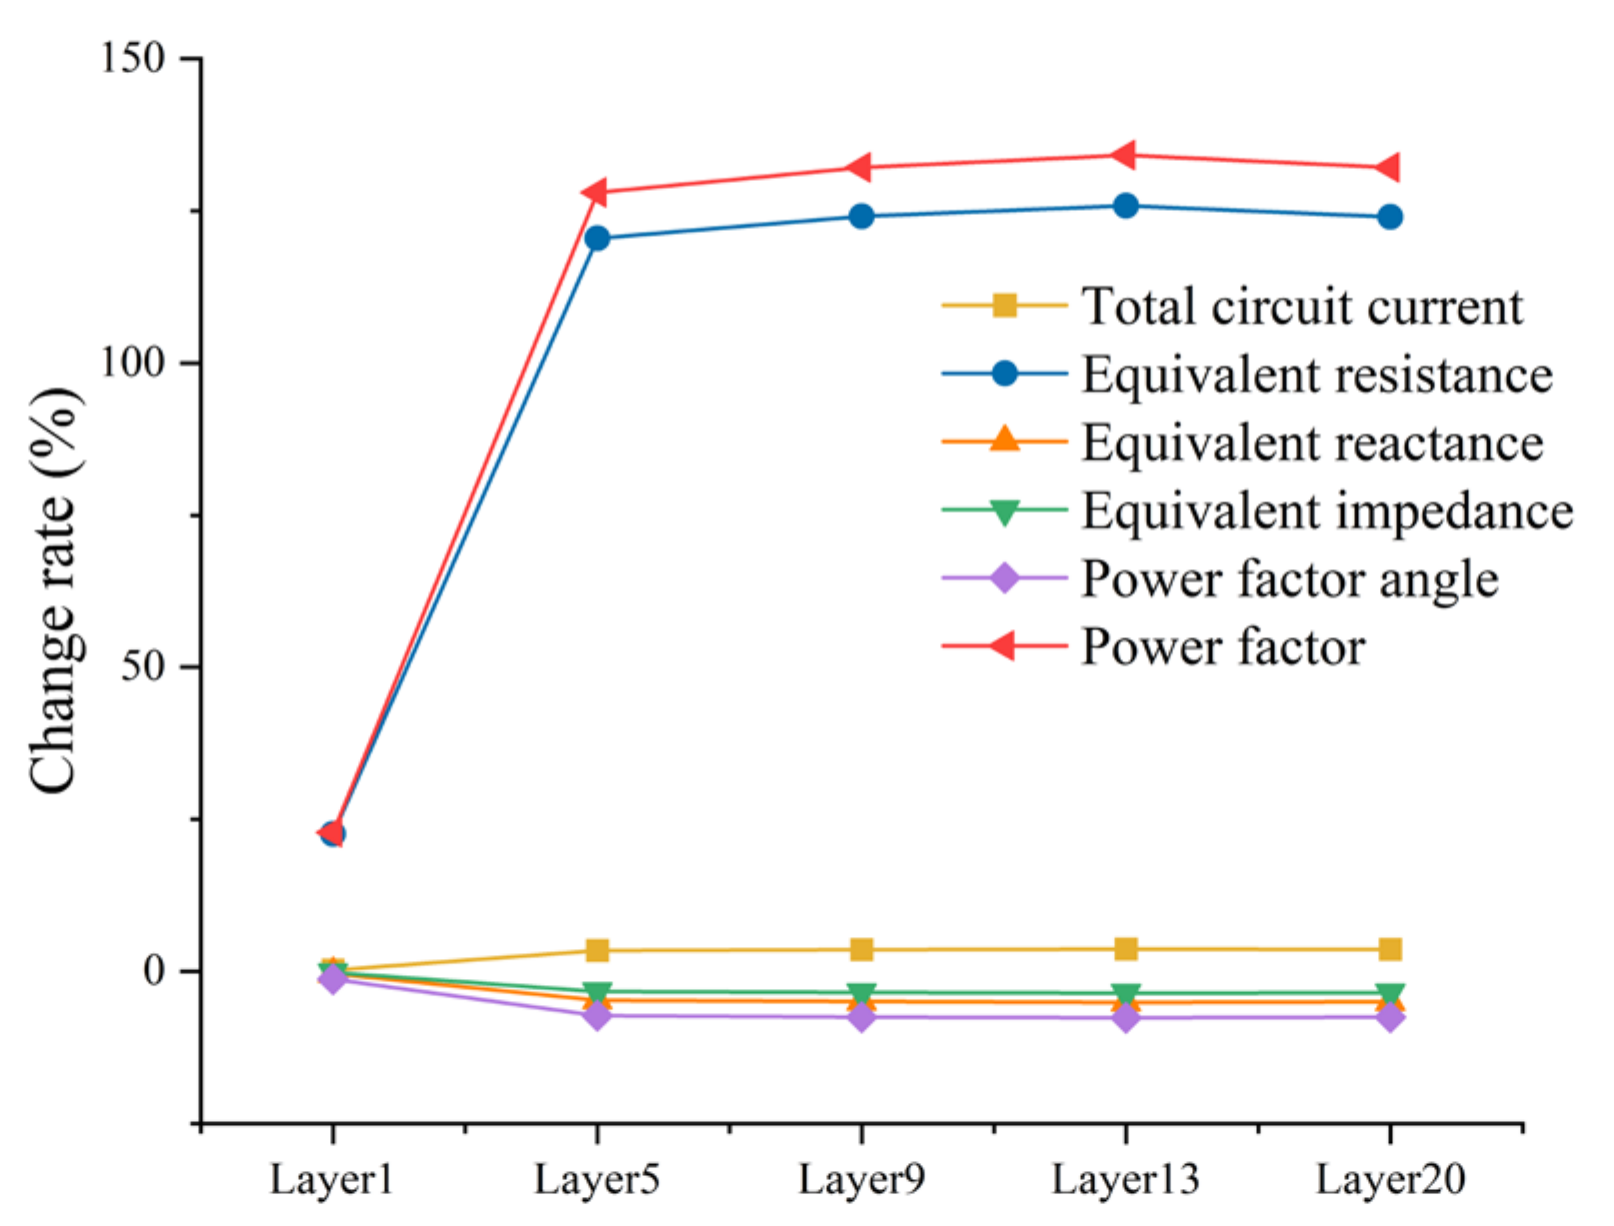
3.1. Impact of ITSC in DAR on Common State Parameters

In order to investigate the sensitivity of different state parameters for the detection of ITSC, a single-turn short circuit fault was simulated on Layer 1, Layer 5, Layer 9, Layer 13, and Layer 20 to explore the relationship between the ITSC and different state parameters. Firstly, a simulation analysis is conducted on a healthy DAR to calculate the circuit current, equivalent resistance, equivalent reactance, impedance, power factor angle, power factor, and magnetic induction intensity, and the above values are taken as reference values. Then, the values of the above state parameters under a single-turn short circuit fault are calculated and compared with the reference values to analyze the variations in state parameters.
The calculation formula for the total terminal current of the reactor is shown in Equation (2).
I = i = 1 n I i
where Ii is the current of each layers, and n is the number of layers of the coil.
The formula for calculating the equivalent impedance of the reactor is shown in Equation (3).
Z = U I = R + j X L
where U is the terminal voltage applied to the reactor, I is the total current of the reactor, R is the equivalent resistance, and XL is the equivalent reactance.
The calculation formulas of power factor angle and power factor are shown in Equations (4) and (5).
α = arctan X L R
δ = cos α
where α is the power factor angle; δ is the power factor.
Under single-turn short circuit faults occurring in different layers of the reactor, the variations in each state parameter compared to the reference value are shown in Figure 5 and Figure 6.
In Figure 5 and Figure 6, when an ITSC fault occurs in the DAR, the rates of change in various state parameters exhibit an initial increase followed by a subsequent decrease along the radial direction. Power factor, equivalent resistance, and magnetic induction intensity exhibit a positive increase trend. The increase in short circuit current in the defective part distorts the surrounding magnetic field, leading to a substantial variation in magnetic induction intensity, ranging from 101.18% to 168.82%. The equivalent resistance and power factor exhibit variations during a short circuit fault, ranging from 22.58% to 125.86% and 22.84% to 134.17%, respectively. The primary circuit current, equivalent reactance, and power factor angle exhibit a negative growth trend, with the rate of change fluctuating within 10%.
Despite the considerable variation in magnetic induction intensity during single-turn short circuit faults, measuring the magnetic field necessitates a high-precision sensor, which is costly, and the measurement is prone to interference from other spatial signals within the substation. For comparable resistance and power factors, while additional sensors may be unnecessary, their values need parameter identification or calculation, which can be significantly affected by external variables such as noise and harmonics, resulting in imprecision. The phase information of terminal signals is frequently overlooked. Therefore, it is essential to identify a novel online detection approach. It may be advantageous to completely integrate the two state characteristics, specifically resistance and power factors, as their variations are substantial.

3.2. Introduction of Online Lissajous Graphical Method

In this study, the online Lissajous graphical method is proposed. The Lissajous graphical method is primarily used for detecting winding deformation faults in transformers, which analyzes the variation patterns and characteristic parameters of a Lissajous graph as the basis for fault diagnosis [20]. Since DARs are also a type of winding-based power equipment, the method could have good generalizability. Therefore, for the first time, this study introduces the online Lissajous graph method to detect ITSC faults in DARs.
As a type of reactor that does not use an iron core and relies on air as a medium, DARs have weak coupling between the phases, and the mutual influence of currents is relatively small. Therefore, the proposed method for detecting turn-to-turn short circuits in DARs can be applied to both single-phase and three-phase reactors. The implementation process of this method is shown in Figure 7. The voltage and current signals of one-phase DARs are collected through PT and CT, and further pre-processed. The Lissajous graph is then plotted, and the characteristic parameters of graph are calculated.
Figure 3 and Equation (2) show that the current I in the reactor’s electrical circuit includes all the coils’ state information. Under ideal operating conditions, the voltage and current at the reactor port can be represented by a sine function, as shown in Equation (6).
x = i ( t ) = I cos ( ω t + φ 2 ) y = u ( t ) = U cos ( ω t + φ 1 )
where u(t) and i(t) are the voltage and current at the reactor port, respectively; φ1 and φ2 are the initial voltage and current phase, respectively; ω is the angular frequency; t is time.
The state parameter equation is obtained by jointly eliminating the time parameter t with x and y, as shown in Equation (7).
i 2 I 2 + u 2 U 2 2 u i U I cos φ 2 φ 1 = sin 2 ( φ 2 φ 1 )
when the values of φ2φ1 are between 0 and π, Equation (7) represents an ellipse in the Cartesian coordinate system. At the same time, the reactor is an inductive device, and there is always a phase difference between the terminal voltage and current. Therefore, the plotted graph is elliptical, known as the Lissajous graph [21]. In addition, the long axis a, short axis b, and inclination angle θ of the Lissajous ellipse graph are selected as characteristic parameters, as shown in Equations (8)–(10), to analyze the fault state of coil.
a = U 2 I 2 I 2 + 2 U I cos ( φ 1 φ 2 ) tan θ + U 2 tan θ     = R cos α 2 I 2 1 + 2 R cos α cos ( arg R cos α ) tan θ + R cos α 2 tan θ
b = U 2 I 2 U 2 + 2 U I cos ( φ 1 φ 2 ) tan θ + I 2 tan θ     = R cos α 2 I 2 R cos α 2 + 2 R cos α cos ( arg R cos α ) tan θ + tan θ
tan 2 θ = 2 U I cos ( φ 1 φ 2 ) U 2 I 2                     = 2 R cos α cos ( arg R cos α ) R cos α 2 1
From Equations (8)–(10), it can be observed that three Lissajous graphical characteristic parameters can be derived from equivalent resistance R and power factor cosα. As mentioned in Section 4.1, variations in R and cosα are significant when short circuit faults happen; thus, the variations in the Lissajous graph and its characteristic parameters can also be significant, which is beneficial for winding fault diagnosis. In addition, in the Lissajous graphical method, the ellipse graphics are the basis for fault diagnosis, which can more intuitively and clearly reflect the changes in the reactor’s operating state. In addition, due to graphical comparison, the Lissajous graphical method can be better combined with artificial intelligent (AI) algorithms to identify minor short circuit faults, which is something that traditional parameter comparison methods do not possess.

4. Feasibility Analysis of Online Lissajous Graphic Method

4.1. Simulation Validation

In this section, the changes in the Lissajous diagram and characteristic parameters of DAR are studied when the layers experienced varying degrees of turn-to-turn short circuit faults. This study defines minor, moderate, and severe faults as 0 to 5%, 5% to 20%, and 20% to 100%, respectively [19], according to the definition of fault degree in Equation (1). In this section, three fault degrees of 1.38%, 15.50%, and 31.01% are taken as typical representatives to study two situations that have different degrees of faults in the same layer of winding, and the same degree of faults in the different layers of winding. The results are shown in Figure 8 and Figure 9.
When the reactor experiences varying degrees of ITSC faults, the variations in Lissajous graphics and their characteristic parameters are more prominent. The specific changes are as follows:
(1)
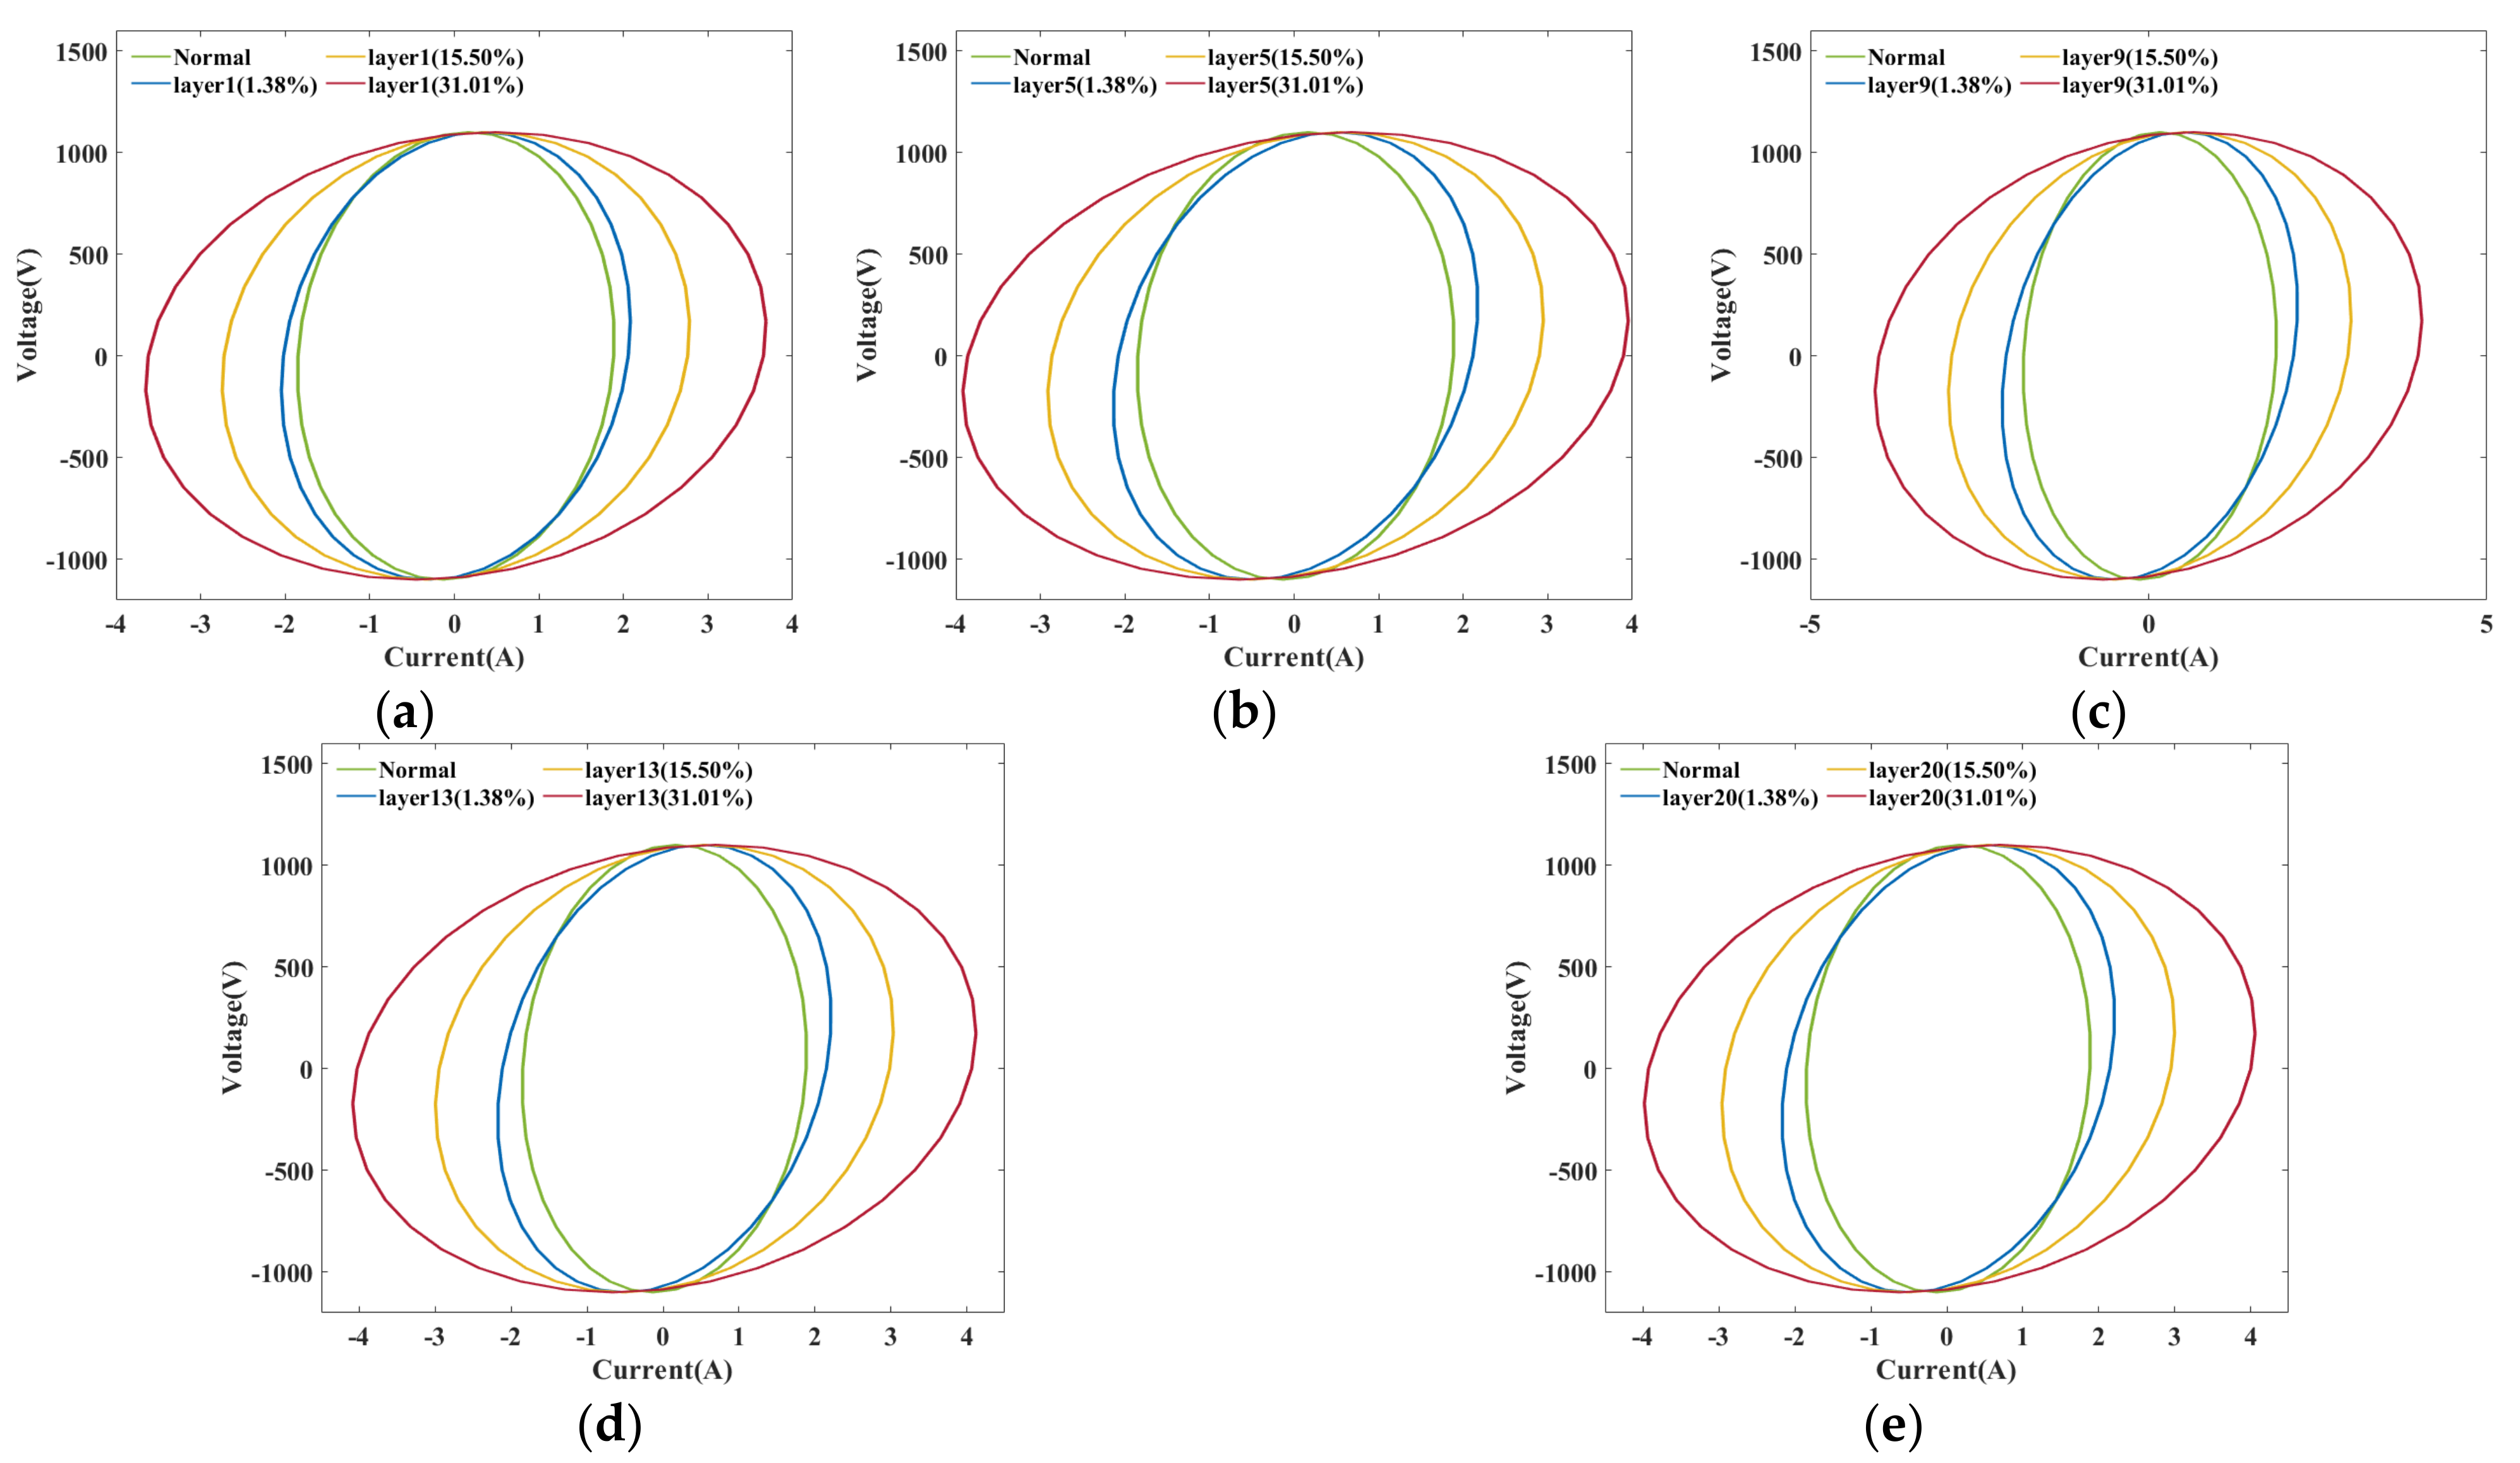
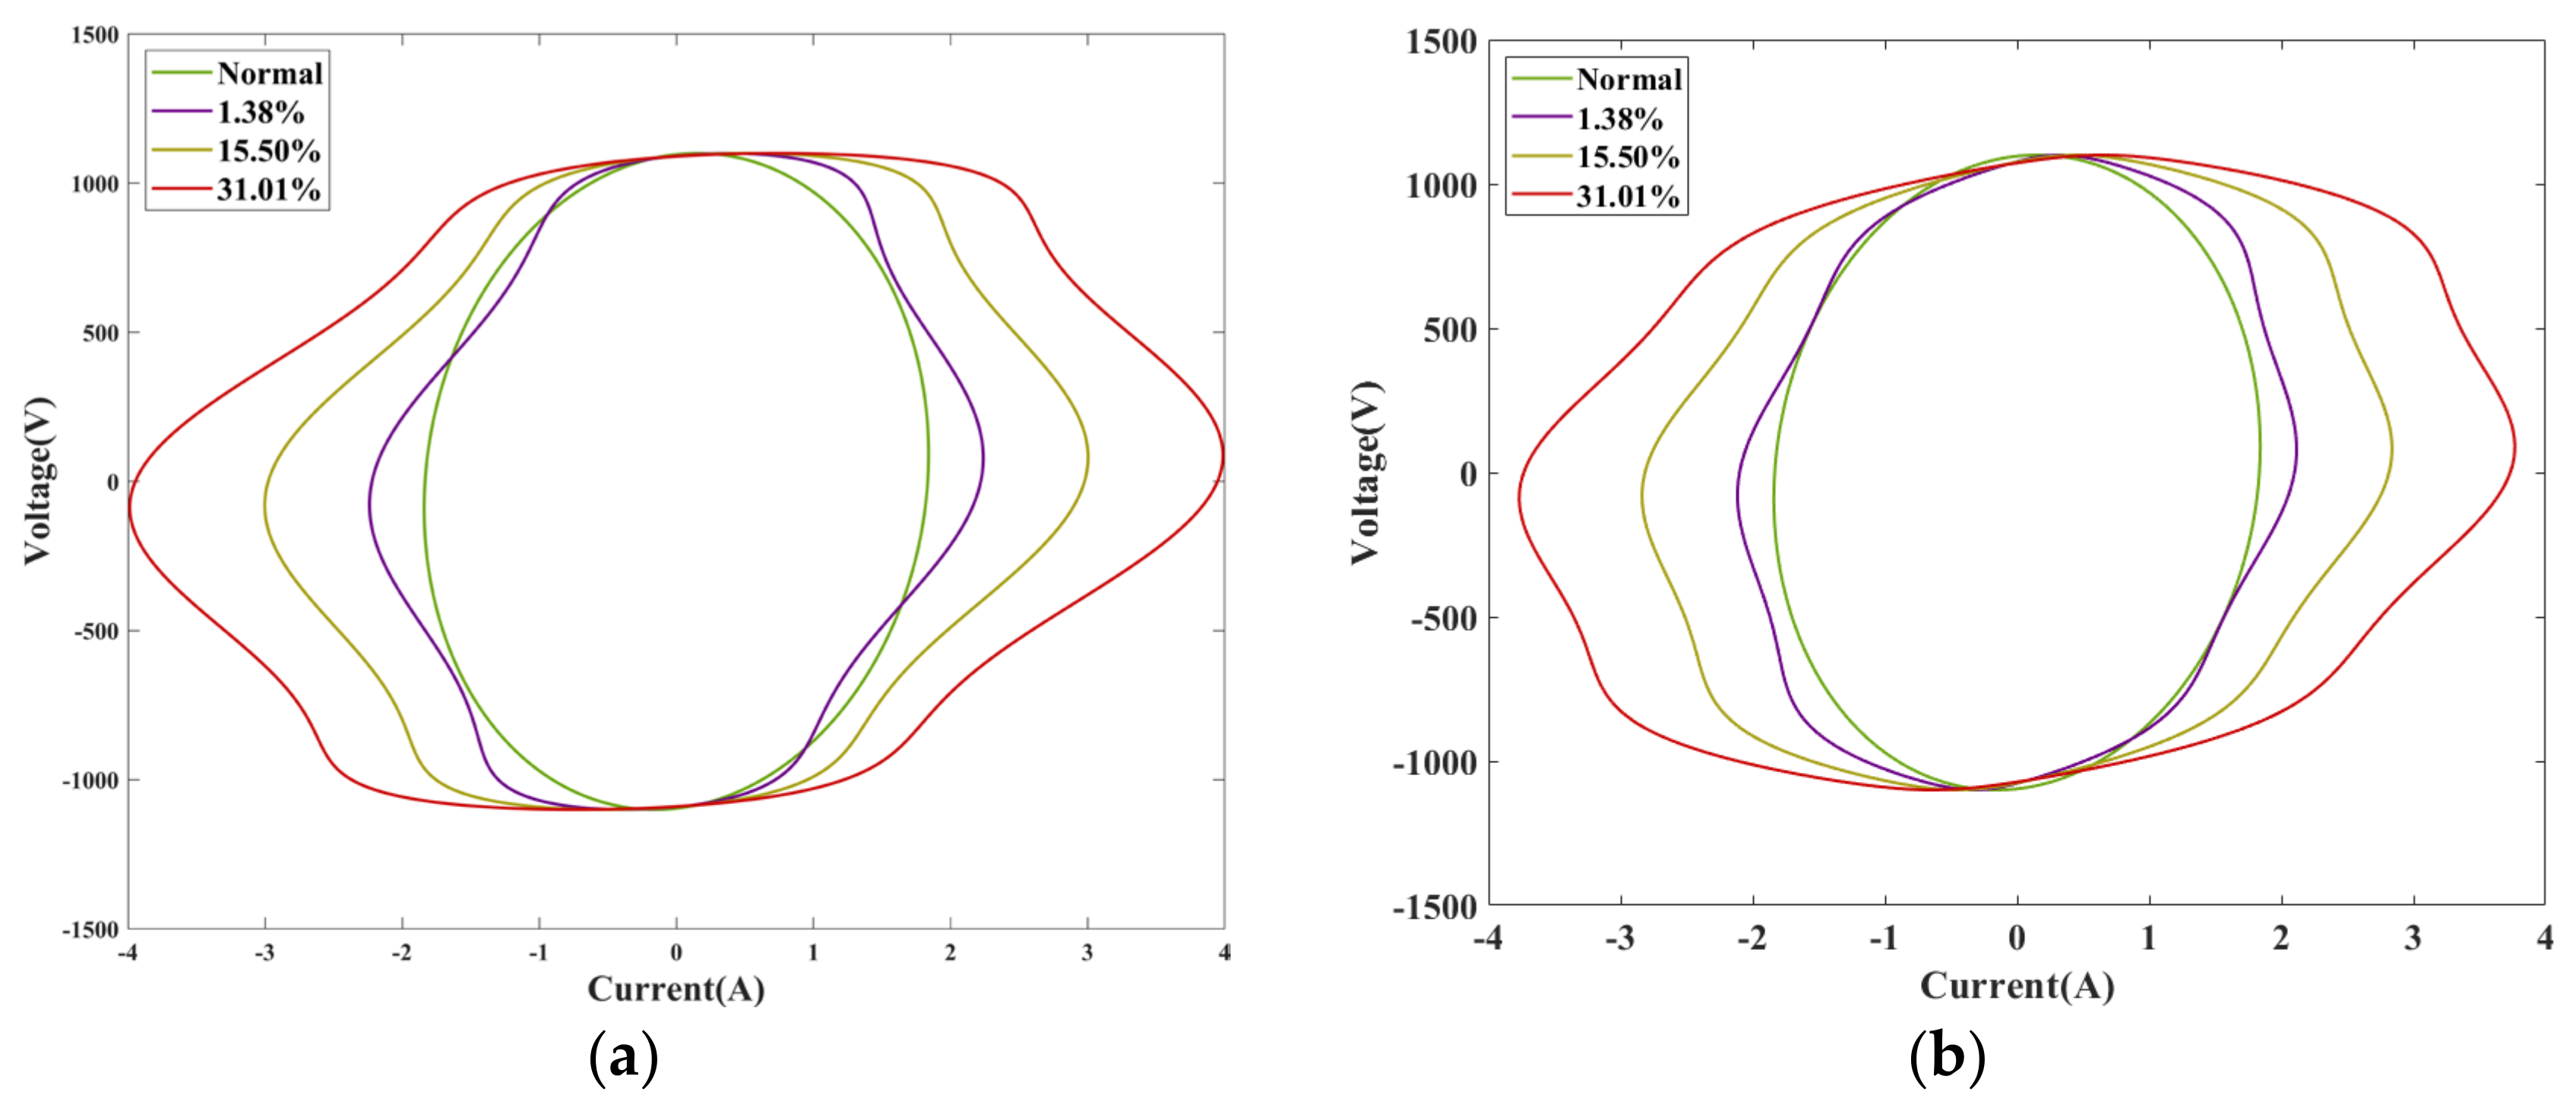
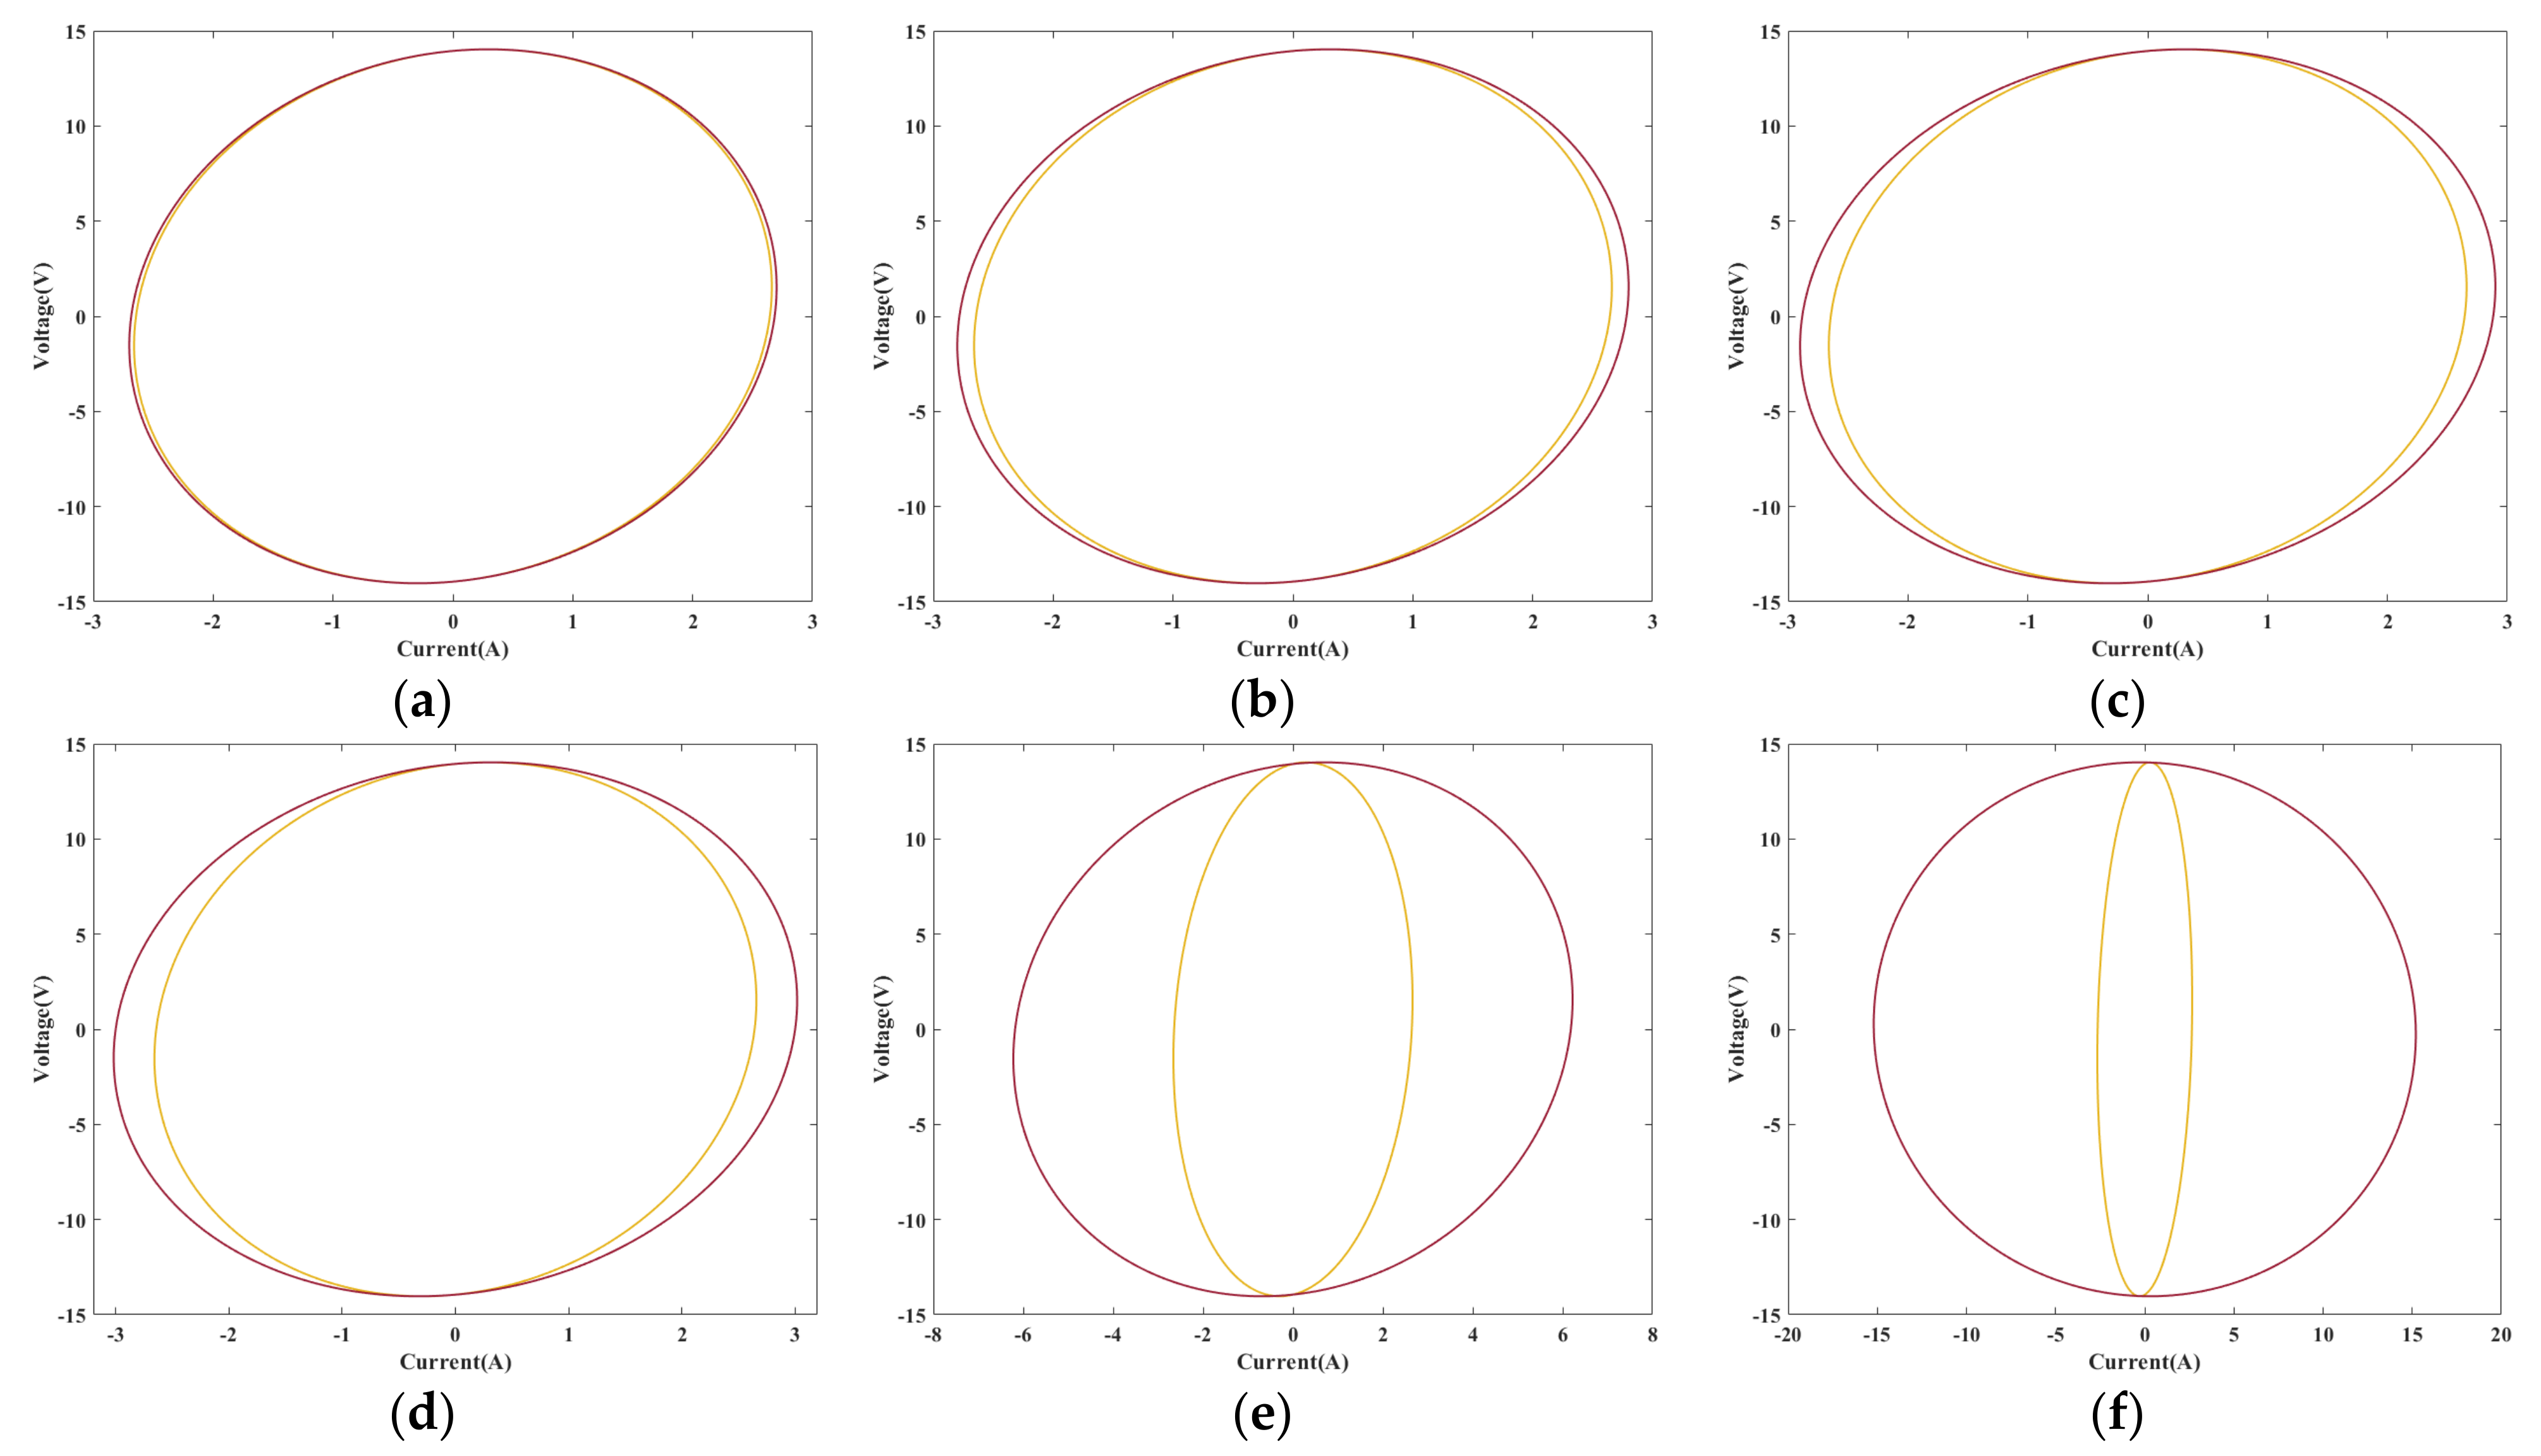
When an ITSC fault occurs in any layer, as seen in Figure 8, the alteration of the Lissajous graph is strongly correlated with the severity of the ITSC fault. When the fault degree is slight, the graph exhibits noticeable rotational alterations. As the degree of fault escalates, both the area and inclination of the Lissajous graph will markedly expand.
(2)
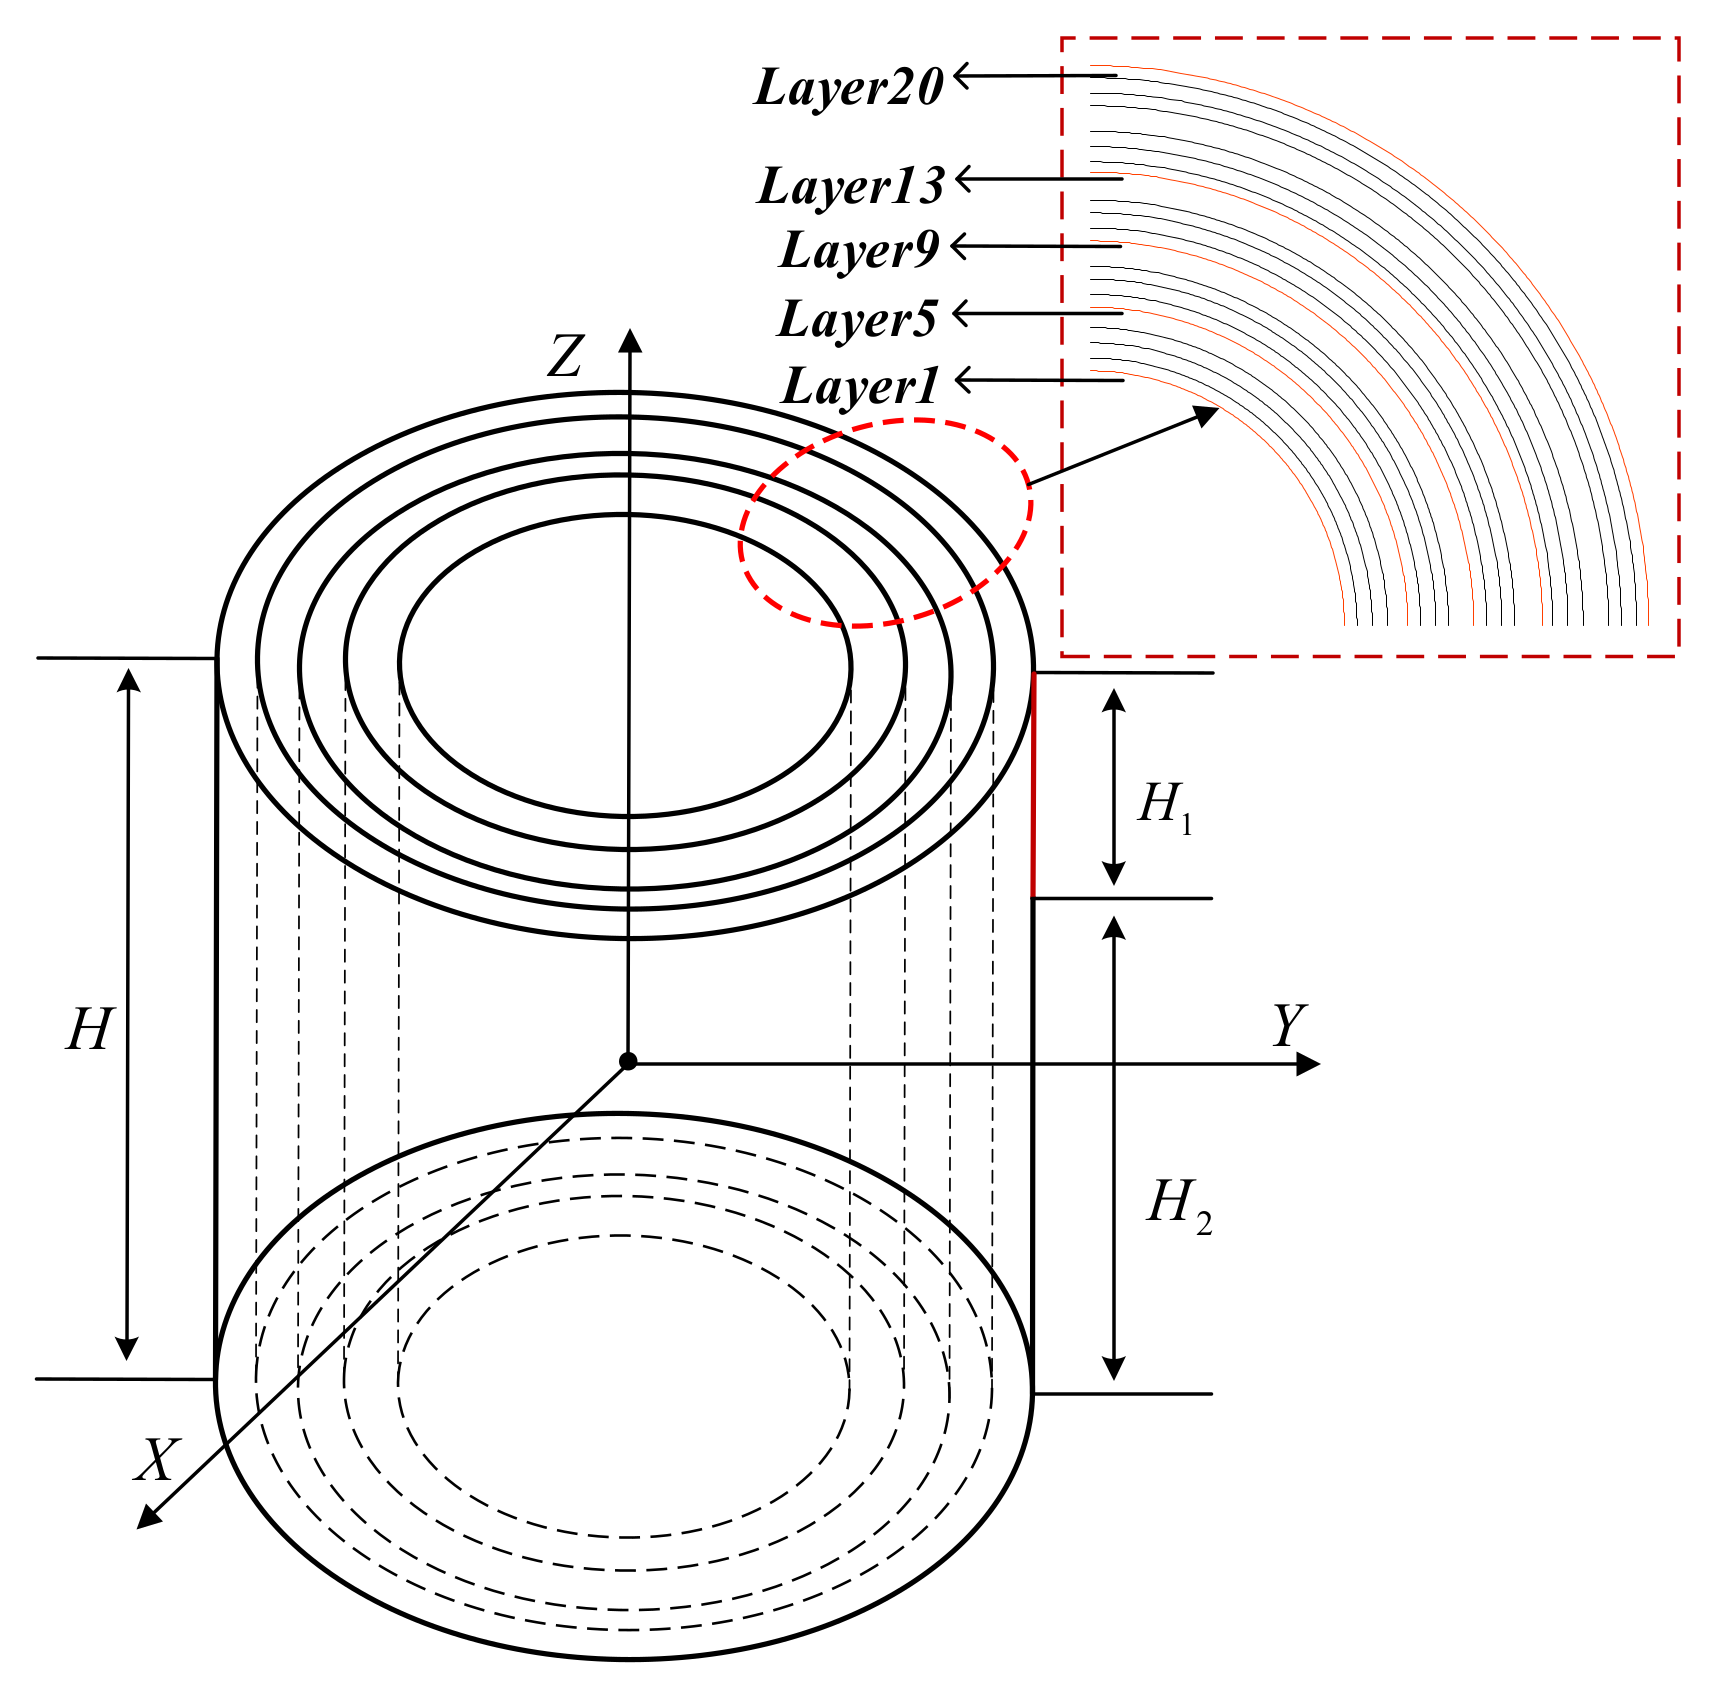
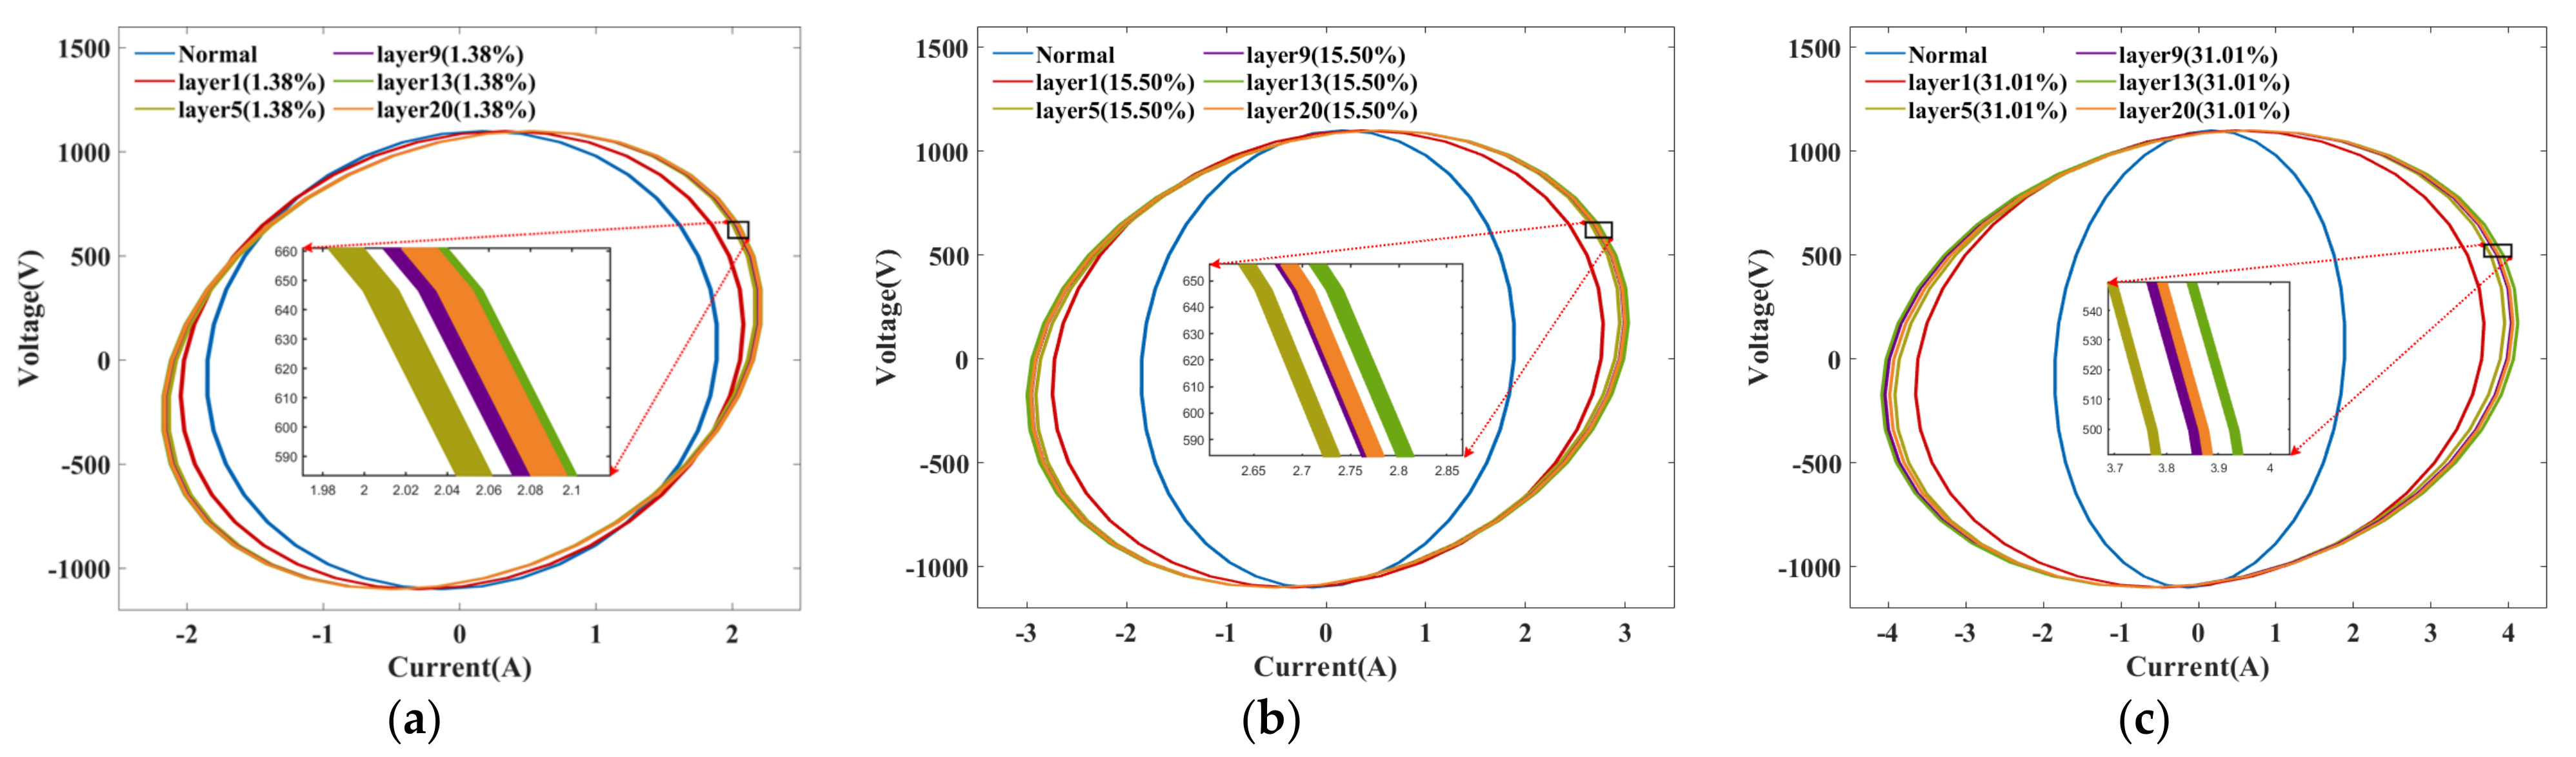
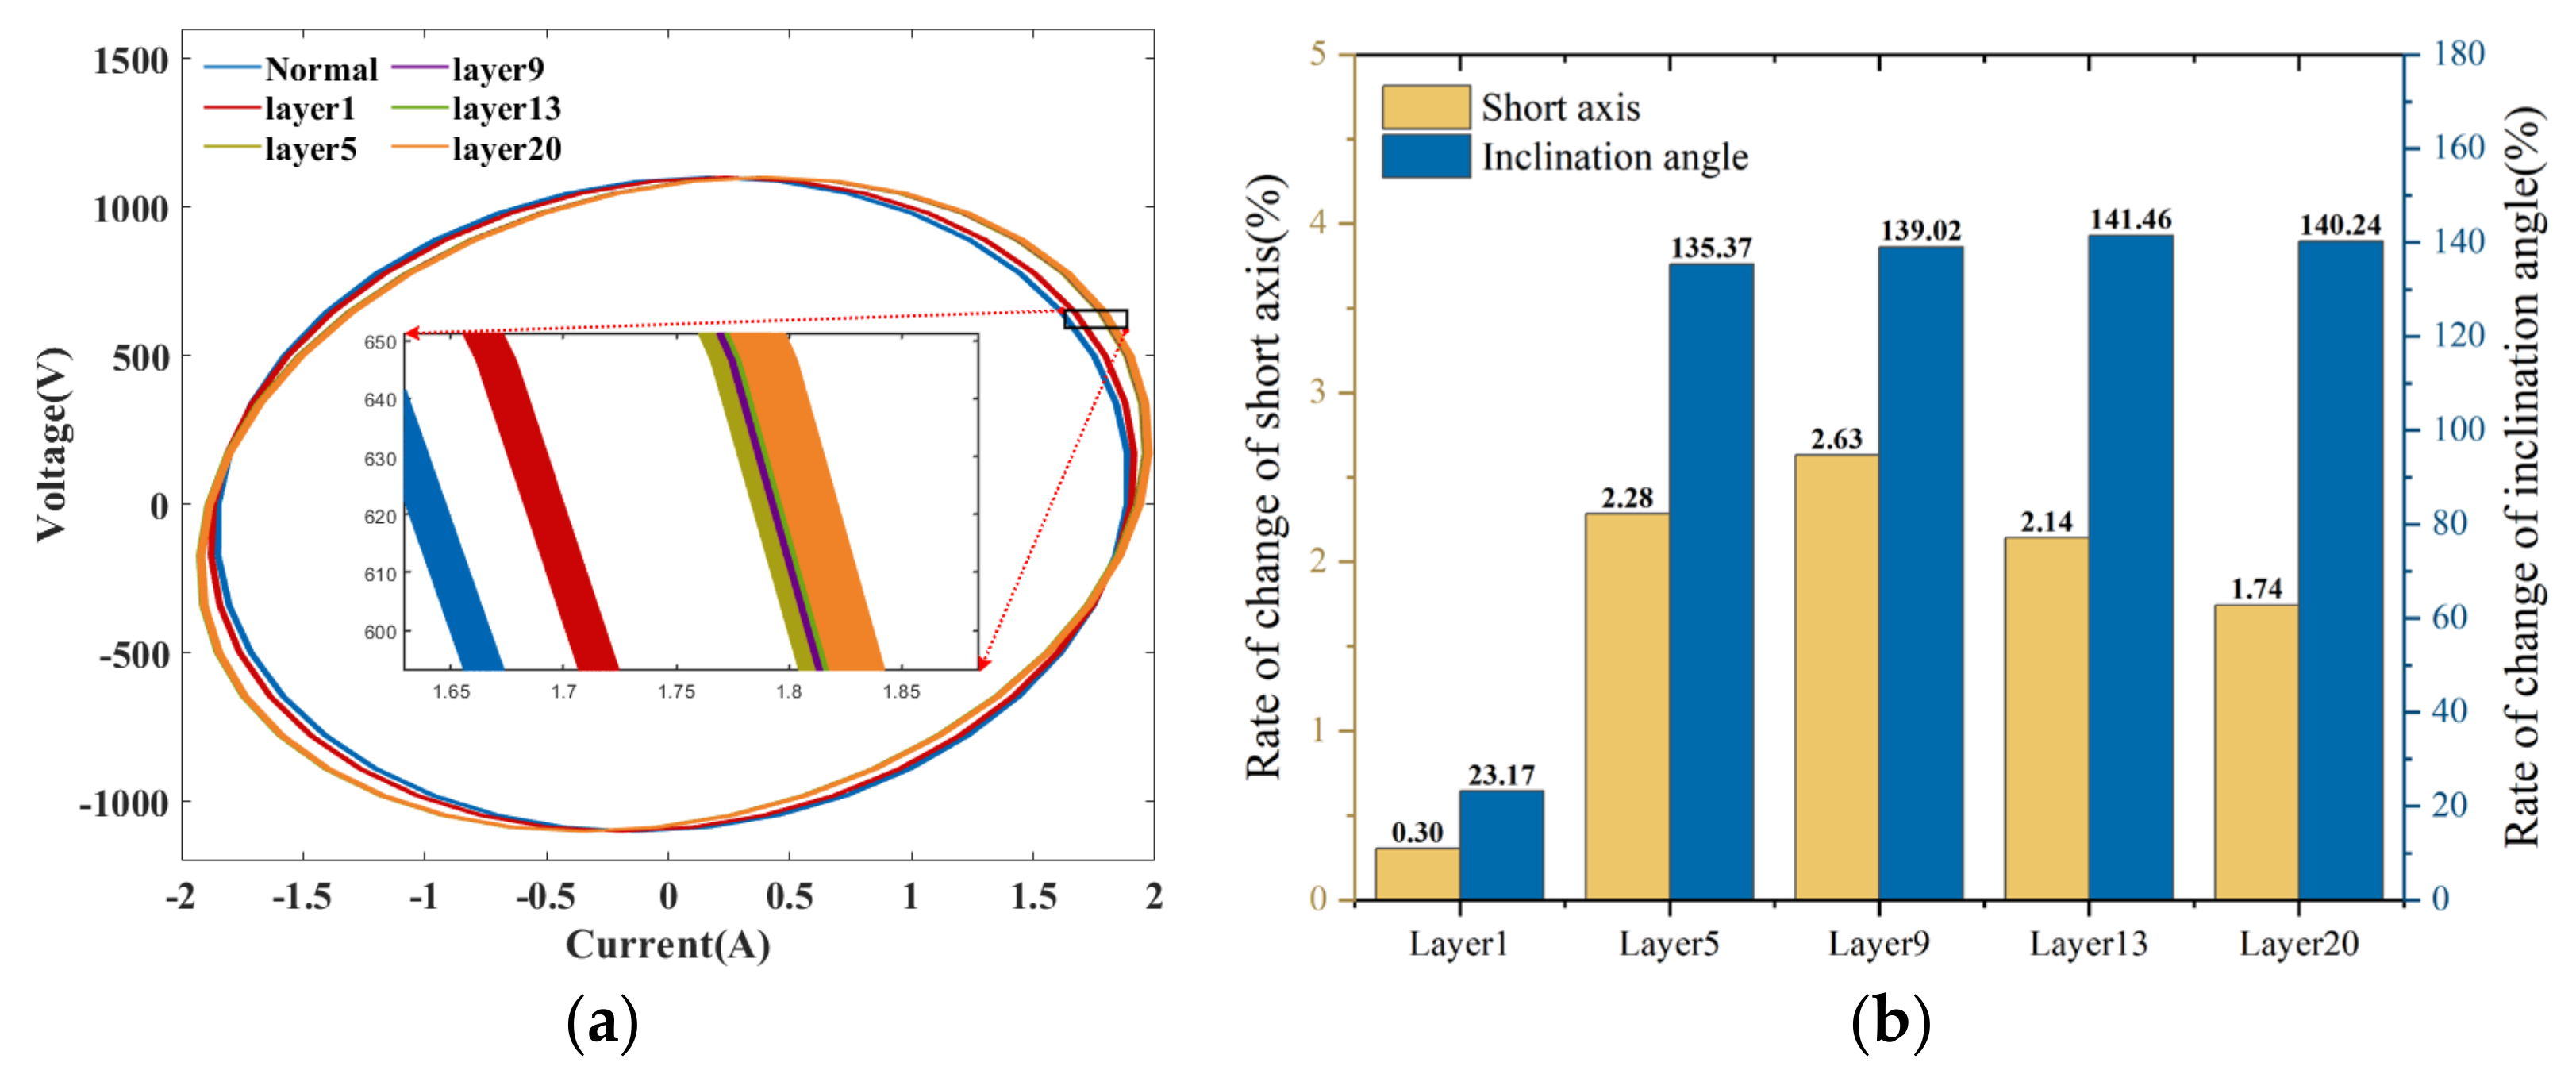
In Figure 9, it can be observed that when the same degree of fault occurs in different layers, the closer the fault location is to the middle layer of the reactor, the more significant the change in Lissajous graphic is. In contrast, the change in fault pattern at both end layers is slightly weaker. Among them, the closer the fault occurs to the interior, the smaller the rate of change is. The reason is that after a short circuit fault occurs in the middle, the variations in mutual inductances between the fault layer and other normal layers are more significant compared to those that occur at Layer 1 or Layer 20.
(3)
The characteristics are greatly influenced by the degree of the fault, regardless of whether a short circuit fault of varying degrees occurs on the same layer or a fault of identical degree occurs on different layers. Table 2 shows that when fault severity escalates, both the short axis b and the inclination angle θ exhibit an upward trend, progressively increasing radially from the interior outward, with a minor reduction observed in the outermost layer. The augmentation in the variation in the inclination angle θ is the most significant, with the rate of change escalating from 114.63% to 475.61%, followed by the short axis, which exhibits a rate of change between 9.39% and 118.52%.
Therefore, the above conclusions indicate that it is feasible to use Lissajous graphs to characterize the differences between normal and fault states, and the variation in characteristic parameters further verifies the accuracy of this method. In addition, by observing the changes in the Lissajous characteristic parameters, it is also possible to diagnose the ITSC fault of the reactor based on Lissajous graphs.

4.2. Sensitivity Verification

To validate the capability of the Lissajous graphic method to characterize minor short circuit faults in reactors, a single-turn short circuit fault is applied to the reactor in the simulation model, and the variation characteristics of the Lissajous graph are analyzed.
The single-turn short circuit fault was simulated on different layers of a DAR, the Lissajous graph was plotted and characteristic parameters were calculated, as shown in Figure 8. It can be seen from Figure 10b that the inclination angle θ changes the most significantly, with a rate of change of 23.17% to 141.46%. The short axis b does not change significantly under a single-turn fault, with a rate of change of 5%. Figure 10a shows that even when a single-turn short circuit fault occurs, there is an obvious change in the Lissajous graph between normal and faulty conditions. It demonstrates that the Lissajous graph is capable of characterizing minor short circuit faults.

4.3. Harmonic and Noise Influence

A large number of nonlinear loads exist in terminal equipment and transmission and distribution devices in the power system, which generate non-sinusoidal currents during normal operation. This current not only contains the fundamental frequency component but also superimposes multiple higher-order harmonic components, significantly affecting the power quality of the system [22]. To investigate whether harmonic factors interfere with the Lissajous graph, in this study, based on the simulation model, we selected the health state as the healthy signature and we compared the ITSC faults of the first-layer coil at three severity levels: 1.38%, 15.50%, and 31.01%. By introducing 10% fifth harmonics and 4% seventh harmonics into the input signal, different harmonic disturbances are simulated, as shown in Figure 11.
The variation characteristics of Lissajous graphs under the fifth and seventh harmonic interference was analyzed. In addition, DAR is also vulnerable to electromagnetic noise, environmental noise and other noise factors. In the field of communication and signal processing, Gaussian white noise is a commonly used theoretical model, which is usually used to describe random interference. It can widely simulate the characteristics of actual noise sources. Based on this, this study takes the Gaussian white noise as an example, introduces the random Gaussian white noise with a standard deviation of 0.1 at the power side of the model, superimposes it with the fundamental signal, and compares the normal state with the first layer of coil with the occurrence of 1.38%, 15.50% and 31.01%. The results are shown in Figure 12.
Figure 11 shows that the overall appearance of the Lissajous graph is petal-shaped after the introduction of harmonics, and the graph under the influence of harmonics is significantly different from the normal state, and the higher the harmonic number, the more curved arcs in the characteristic graph. However, for the detection angle of the ITSC fault, the variation law of the distorted characteristic graph is still consistent with the analysis conclusion in Section 4.1, and it does not affect the judgment of ITSC faults. In Figure 12, the variation trend of the Lissajous graph under the influence of noise also exhibits the same trend as in the normal state, but the characteristic graph under noise exhibits more ripples. When a small ITSC fault happens, it may result in the inability to distinguish between the fault graph and the healthy signature, leading to a fault misjudgment. Therefore, in order to be closer to the power frequency working condition, waveform correction can be performed after actual signal acquisition. This can be extracted by fast Fourier transform (FFT) using the acquired signal, extracting the amplitude and phase information, and reconstructing the power frequency signal according to Equation (6), thereby restoring the power frequency signal. This method helps to preserve the differences between the Lissajous graph in normal and fault states, ensuring accurate and effective fault diagnosis.

4.4. Experiment Validation

This article used a small reactor modeled KXL-20A to build an experimental platform. The tests are performed using a three-phase programmable variable frequency power supply modeled LABCK-AC13-3KVA, as shown in Figure 13. As shown in Figure 14, the ITSC fault of the reactor was artificially simulated on the outermost layer of the reactor; for DARs with large rated currents, current-limiting resistors can be added to the short circuit ring to mitigate short circuit current damage to the reactor and the simulation of ITSC faults. The terminal voltage and current of the reactor were collected at different fault degrees, the Lissajous graphs were plotted, and their characteristic parameters were calculated.
Figure 15 and Table 3 show the changes in the Lissajous graph and characteristic parameters of the experimental reactor, which exhibit a similar pattern to those of simulation results. The ITSC mainly changes the short axis and inclination angle of the Lissajous graph. The changes in the Lissajous graph and characteristic parameters once again verify the feasibility and effectiveness of the method proposed in this study.

5. Diagnosis of Short-Circuit Fault in DAR Based on Lightweight Network Model

Most traditional methods of identifying short-circuit faults in DARs rely heavily on expert experience or simple threshold-based diagnosis, which are easy to cause misjudgment or omission. An AI-based diagnosis method offers an alternative that serves the same objective, which is often more accurate and robust. However, as so far, few studies have utilized AI to analyze Lissajous graphs. In addition, the existing AI-based fault diagnosis method of DAR belongs to cloud computing or central computing and the methods acquire status information through various sensors, which is transmitted to a backend service system for data analysis. The control decisions are then sent to the actuators of reactor terminals for execution [23]. However, these processes suffer from poor timeliness, slow response, and high resource consumption.
Recently, some researchers have proposed using edge computing to achieve local data acquisition and online diagnosis to address the above shortcomings. Therefore, in order to facilitate large-scale and rapid responses for fault diagnosis of DAR in the future, this paper firstly uses a lightweight network model to process the Lissajous graph, in which the model is used to train Lissajous image samples of a DAR under various fault levels, resulting in a fault diagnosis model that enables accurate identification of ITSC fault. This lays the foundation for deploying deep learning on edge computing platforms, achieving rapid diagnosis with millisecond-level response times, as shown in Figure 16. Section 4.1 shows that different fault degrees have significant change characteristics relative to normal conditions, while the change characteristics of the fault location of the DAR show a slightly symmetrical tendency at both ends due to the DAR’s special axisymmetric structure. Therefore, this article selects the fault degree as the diagnostic feature.

5.1. MobilenetV3-Small Model

MobileNet is a lightweight deep convolutional neural network commonly used for real-time image recognition and classification tasks on mobile devices and embedded devices due to its low parameter count, latency, and real-time solid performance.
The MobileNet series is divided into three versions. MobileNetV3 inherits the depthwise separable convolution of MobileNetV1 and the linear bottleneck residual structure of MobileNetV2 while optimizing the global network architecture through the Platform-Ware Neural Architecture Search (NAS) and making local adjustments through the NetAdapt algorithm. This not only improves the accuracy of image classification but also significantly enhances the efficiency and performance of the model [24,25].
MobileNetV3 has core advantages that distinguish it from the previous two generations of networks. Firstly, the squeeze and excitation (SE) attention mechanism is introduced in the Bneck module, as shown in Figure 17, which can effectively enhance the weight of essential features and suppress irrelevant features during the training process [26]. Secondly, the activation function has been updated by replacing the Swish activation function in the Bneck module with the h-Swish activation function and replacing the sigmoid activation function with the h-sigmoid function, thereby improving the nonlinear expression ability and computational efficiency of the model [27].
The MobileNetV3 model is divided into two types: large and small. This study focuses on small sample datasets with four levels of reactors; thus, MobileNetV3 Small is selected. The network architecture is shown in Table 4, where NL represents the use of nonlinear activation functions, HS is h-swift, RE represents the use of Relu activation functions, normalized batch normalization (NBN) represents the inapplicable BN layer, and s represents the convolution kernel movement step size. The fault diagnosis categories in this study are normal, slight, moderate, and severe, so k is taken as 4.

5.2. Dataset and Pre-Processing

This experiment used simulated Lissajous graphical data in Section 4. The extent of ITSC faults was set as three fault levels in each layer of DAR: slight, moderate, and severe. The model was trained to identify the differences between normal and faulty Lissajous graphs. To improve the generalization ability of the model, prevent overfitting, enhance the robustness of the model, enable it to better learn the changing characteristics of data and improve fault recognition ability, we carried out data augmentation on the original dataset, using methods such as random rotation, adding Gaussian noise, and adjusting graphic brightness. The partial image pre-processing results are shown in Figure 18.
After data expansion, the dataset contains a total of 3404 images, which are divided into training and testing sets in a 7:3 ratio. The quantity of each category is shown in Table 5.

5.3. Model Performance Evaluation

After multiple performance optimizations, the Stochastic Gradient Descent (SGD) was ultimately chosen as the optimizer, with a learning rate set to 0.01 and momentum set to 0.9, the batch size was set to 32, the maximum iteration times was set to 200, and training stopped when the maximum iteration times was reached. To comprehensively evaluate the accuracy of the MobileNetV3 Small model in identifying the degree of ITSC faults in DAR, this study selected deep-learning network models such as MobileVIT-Attention, ShufflenetV2, Vision-Transformer-Small (ViT-Small), and Swin-Transformer-Small (Swin-Small) for comparison. The comparison results of recognition accuracy, parameter count, and floating point operations (FLOPs) of each model on the test set are shown in Table 6.
In Table 6 and Figure 19, after 130 iterations, MobileNetV3-Small, MobileVIT-attention and shufflenetV2 tend to converge. After 150 iterations, ViT-Small and Swin-Small tend to converge. Among them, the test accuracy of Swin-Small is slightly higher than that of MobileNetV3-Small, which is 0.2% higher. Nonetheless, with similar accuracy, the MobileNetV3-Small model has 0.88 M parameters, while Swin-Small has 49.937 M parameters, which is 57 times that of MobileNetV3-Small. In comparing FLOP indicators, the MobileNetV3 Small model is significantly better than the other four models, indicating that in a low complexity framework, the MobileNetV3 Small model has fast computation speed and achieves optimal recognition accuracy.
To further verify the performance of the MobileNetV3 Small model in identifying the degree of reactor faults, the diagnostic results of different network models on the test set were statistically analyzed, as shown in Table 7. MobileNetV3-Small and Swin-Small have similar recognition precision in four types of faults, and MobileNetV3-Small has the highest precision of 95.12% in the recognition of moderate faults. Compared with other models except Swin-Small, MobileNetV3-Small has higher recognition precision, recall rate and weighted score (F1-score), achieving good diagnostic results for the degree of reactor faults. Overall, MobileNetV3-Small is more suitable for deployment on edge computing platforms to achieve efficient, rapid and accurate fault diagnosis.
In order to further verify the diagnostic accuracy of the model, six types of ITSC faults are set on the experimental reactor, including 0.56% (slight), 2.86% (slight), 3.75% (slight), 5.42% (moderate), 18.75% (moderate), and 43.00% (severe), as shown in Figure 20. Subsequently, we constructed a Lissajous graph and used the trained model for diagnosis. The diagnostic results are presented in Table 8.
In Table 8, it can be observed that the proposed MobileNetV3-Small model can accurately diagnose the majority of the ITSC fault degree. Nonetheless, for fault degrees near the boundary between classifications, such as the 5.24% fault degree shown in Figure 20, which marginally surpasses the threshold for slight faults, the area variation of the Lissajous graph closely resembles that of slight faults with larger degrees, resulting in diagnostic errors. This will be a critical issue to address in future model performance optimization.

6. Conclusions

In this paper, a method for the online detection of ITSC faults of DAR based on a Lissajous graph and MobileNetV3-Small was proposed, which facilities valuable and accurate fault diagnosis for the operation and maintenance of DAR. The following conclusions were derived:
(1)
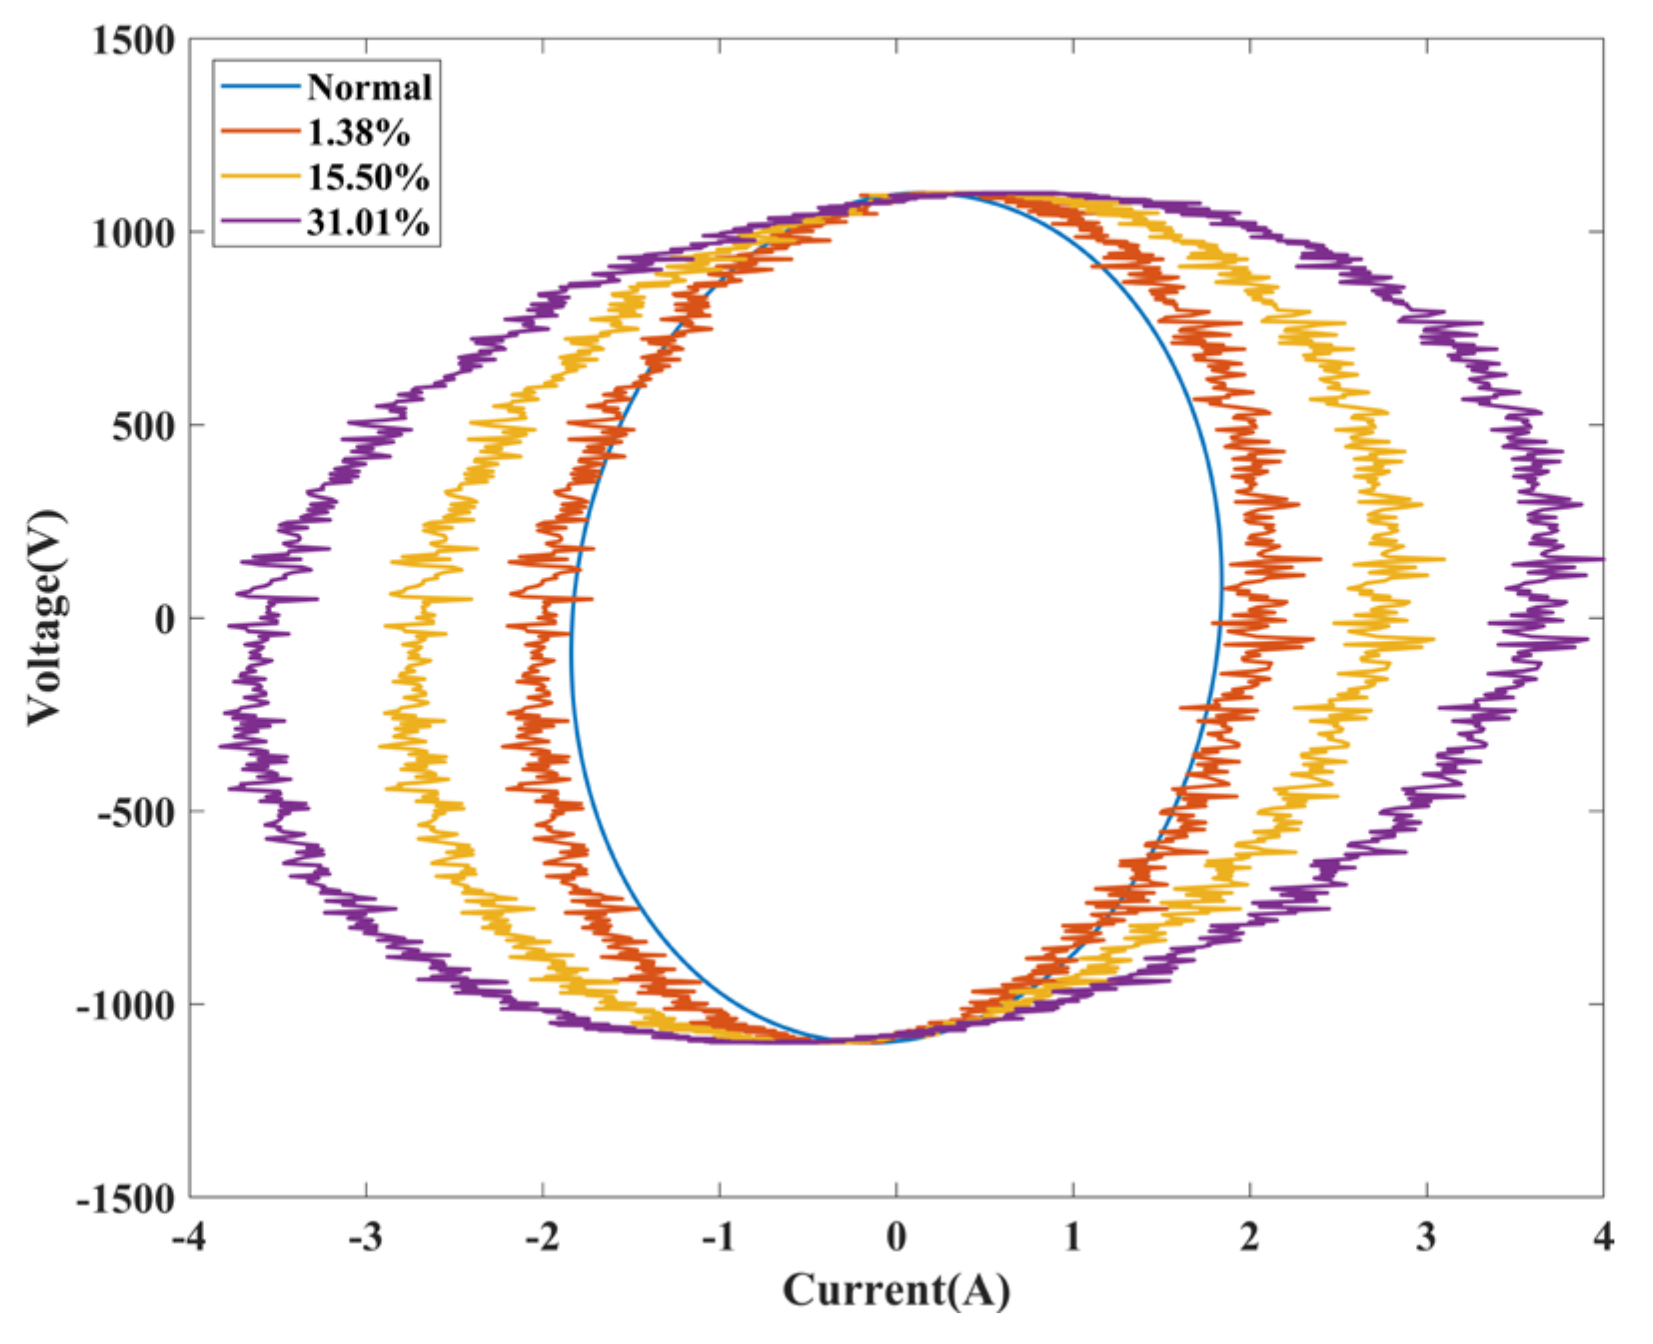
The Lissajous graphs are demonstrated to efficiently characterize the winding status of the DAR. The Lissajous graphs change with the degree of short circuit faults, and the more severe the ITSC, the larger the pattern area will significantly increase and rotate clockwise.
(2)
In the characteristic parameters of Lissajous graphs, the short axis b and inclination angle θ change significantly with the degree of fault. Simulation and experimental verification results show that the change rate of inclination angle θ is particularly significant, with variation ranging from 114.63% to 475.61% in simulation cases and variation ranging from 9.78% to 444.80% in experiment cases.
(3)
Using the lightweight network model MobileNetV3 Small can significantly improve the ability to diagnose ITSC faults, with a fault diagnosis accuracy of 95.91% and a model parameter of 0.88 M. It also has a faster computation speed and better performance than those of other algorithms, which has the potential to achieve reliable monitoring and identification in the early stages of faults.
However, the proposed method only considers the change in Lissajous graphs under complete ITSC faults, and neglects the influence of strong electromagnetic interference and long-term aging of the reactor on the method, which limits its ability to provide accurate diagnosis results in a complex environment. In the future, we will carry out studies on the change in Lissajous graphs during the insulation degradation process of DARs, while fully considering the environmental factors that may influence the method. We aim to diversify the fault samples and significantly improve the diagnostic model’s sensitivity under complex conditions. Such improvements are expected to enhance the comprehensive diagnosis capability of the model and lay the foundation for the development of mobile fault diagnosis devices in the future, holding significant importance for the intelligent monitoring of equipment operational status in power systems.

Author Contributions

Conceptualization, B.X.; Methodology, B.X.; Investigation, X.D., J.Z. and L.C.; Resources, Z.Z. and C.T.; Data curation, B.X.; Writing—original draft, B.X.; Writing—review and editing, B.X. and Z.Z. All authors have read and agreed to the published version of the manuscript.

Funding

This work was supported in part by the Supported by Sichuan Science and Technology Program, 2023NSFSC0829, and in part by the Fundamental Research Funds for the Central Universities, under SWU-KT22027.

Data Availability Statement

The original contributions presented in the study are included in the article and further inquiries can be directed to the corresponding authors.

Conflicts of Interest

Author Xiaojing Dang was employed by the company Shenzhen Power Supply Co., Ltd. Author Junlin Zhu was employed by the company Electric Power Research Institute of China Southern Power Grid The remaining authors declare that the research was conducted in the absence of any commercial or financial relationships that could be construed as a potential conflict of interest.

References

  1. Wu, J.; Zhen, W.; Chang, Z.W.; Zhang, M.; Peng, Y.M.; Liu, Y.; Huang, Q. A Detection Method for Slight Inter-Turn Short-Circuit Fault in Dry-Type Air-Core Shunt Reactors. Energies 2024, 17, 1709. [Google Scholar] [CrossRef]
  2. Hou, Y.M.; Qi, L.; Zhang, X.Y.; Han, S.Y.; Zhang, S.; Cui, X. Analytic calculation of external magnetic field of high voltage toroid-type air-core reactors. IEEE Trans. Power Del. 2023, 38, 3398–3405. [Google Scholar] [CrossRef]
  3. Yuan, F.T.; Yuan, Z.; Chen, L.X.; Wang, Y.; Liu, J.X.; He, J.J.; Pan, Y. Thermal and Electromagnetic Combined Optimization Design of Dry Type Air Core Reactor. Energies 2017, 10, 1989. [Google Scholar] [CrossRef]
  4. Wang, Y.; Chen, X.Y.; Pan, Z.H.; Lu, H.L.; Wen, X.S.; Jiang, Z.P.; Chen, B.; Chen, T.T. Theoretical and Experimental Evaluation of the Temperature Distribution in a Dry Type Air Core Smoothing Reactor of HVDC Station. Energies 2017, 10, 623. [Google Scholar] [CrossRef]
  5. Wu, J.; Chang, Z.W.; Zhang, H.J.; Zhang, M.; Peng, Y.M.; Liao, J.; Huang, Q. Thermal Simulation and Analysis of Dry-Type Air-Core Reactors Based on Multi-Physics Coupling. Energies 2023, 16, 7456. [Google Scholar] [CrossRef]
  6. Jin, S.; E, Y.Y.; Zhu, L.; Li, C.; Yang, Y.C.; Wu, Z.W. Research on the diagnosis method of inter-turn short-circuit faults of dry-type air-core reactor winding based on frequency response analysis. AIP Adv. 2024, 14, 065015. [Google Scholar] [CrossRef]
  7. Chen, Y.H.; Xie, Y.Z.; Li, K.J.; Zhou, Y.; Gao, C.; Zhang, D.Z. Impedance Determination for High Voltage Air-Core Reactor Over Wide Frequency Range Based on Impulse Injection Technique. IEEE Trans. Power Del. 2020, 35, 1909–1917. [Google Scholar] [CrossRef]
  8. Zhou, X.; Tian, T.; Li, X.G.; Chen, K.; Luo, Y.; He, N.H.; Liu, W.F.; Ma, Y.L.; Bai, J.; Zhang, X.X.; et al. Study on insulation defect discharge features of dry-type reactor based on audible acoustic. AIP Adv. 2022, 12, 025210. [Google Scholar] [CrossRef]
  9. Zadehgol, A.; Lei, H.T.; Johnson, B.K. A Methodology for Remote Sensing Inter-Turn Fault Events in Power System Air-Core Reactors, via Simulation of Magneto Quasi-Static Fields in 2D FDTD. IEEE Access 2020, 8, 175727–175740. [Google Scholar] [CrossRef]
  10. Xiao, Y.; Cao, J.A.; Xiong, X.; Zhu, L.Y.; Ji, S.C. Research on Vibration Measurement Method and Analysis of Air-core Reactor. In Proceedings of the 2020 IEEE International Conference on High Voltage Engineering and Application (ICHVE), Beijing, China, 6–10 September 2020; pp. 6–10. [Google Scholar] [CrossRef]
  11. Zhu, L.Y.; Du, Y.M.; Lu, G.; Zhuang, Z.; Ji, S.C. Vibration Distribution Detection Method for Turn-to-Turn Short-Circuit Fault of Dry-Type Air-Core Filter Reactors. IEEE Trans. Power Del. 2022, 37, 4474–4476. [Google Scholar] [CrossRef]
  12. Chen, Y.; Zhao, Z.Y.; Yu, Y.Q.; Wang, W.; Tang, C. Understanding IFRA for Detecting Synchronous Machine Winding Short Circuit Faults Based on Image Classification and Smooth Grad-CAM++. IEEE Sens. J. 2023, 23, 2422–2432. [Google Scholar] [CrossRef]
  13. Hechifa, A.; Labiod, C.; Lakehal, A.; Nanfak, A.; Mansour, D.A. A Novel Graphical Method for Interpretating Dissolved Gases and Fault Diagnosis in Power Transformer Based on Dynamique Axes in Circular Form. IEEE Trans. Power Del. 2024, 39, 3186–3198. [Google Scholar] [CrossRef]
  14. Amaral, T.G.; Pires, V.F.; Foito, D.; Cordeiro, A.; Rocha, J.; Chaves, M. A Fault Detection and Diagnosis Method Based on the Currents Entropy Indexes for the SRM Drive with a Fault Tolerant Multilevel Converter. IEEE Trans. Ind. Appl. 2024, 60, 520–531. [Google Scholar] [CrossRef]
  15. Zhang, L.H.; Song, J.C.; Wang, X.X.; Lu, J.F.; Lu, S.L. High-Resistance Connection Fault Diagnosis of SRM Based on Multisensor Calibrated Transformer with Shifted Windows. IEEE Sens. J. 2023, 23, 30971–30983. [Google Scholar] [CrossRef]
  16. Wang, Z.S.; Xuan, J.P.; Shi, T.L. An autonomous recognition framework based on reinforced adversarial open set algorithm for compound fault of mechanical equipment. Mech. Syst. Signal Process. 2024, 219, 111596. [Google Scholar] [CrossRef]
  17. Wang, Z.S.; Xuan, J.P.; Shi, T.L. Domain reinforcement feature adaptation methodology with correlation alignment for compound fault diagnosis of rolling bearing. Expert Syst. Appl. 2025, 262, 125594. [Google Scholar] [CrossRef]
  18. Wang, Z.S.; Xuan, J.P.; Shi, T.L.; Li, Y.F. Multi-label domain adversarial reinforcement learning for unsupervised compound fault recognition. Reliab. Eng. Syst. Saf. 2025, 254, 110638. [Google Scholar] [CrossRef]
  19. Song, H.; Zou, L.; Zhang, X.Q.; Zhang, L.; Zhao, T. Inter-Turn Short-Circuit Detection of Dry-Type Air-Core Reactor Based on Spatial Magnetic Field Distribution. Trans. China Electrotech. Soc. 2019, 34, 105–117. [Google Scholar] [CrossRef]
  20. Yao, C.G.; Zhao, Z.Y.; Mi, Y.; Li, C.X.; Liao, Y.F.; Qian, G.C. Improved Online Monitoring Method for Transformer Winding Deformations Based on the Lissajous Graphical Analysis of Voltage and Current. IEEE Trans. Power Del. 2015, 30, 1965–1973. [Google Scholar] [CrossRef]
  21. Li, C.X.; Zhu, T.Y.; Yao, C.G.; Xia, Q.; Mi, Y.; Zhao, Z.Y. Online Diagnosis Method for Transformer Winding Deformation Based on Characteristic of Figure Constructed by Voltage and Current. High Volt. Eng. 2018, 44, 3532–3539. [Google Scholar] [CrossRef]
  22. Masoum, A.S.; Hashemnia, N.; Abu-Siada, A.; Masoum, M.A.S.; Islam, S.M. Online Transformer Internal Fault Detection Based on Instantaneous Voltage and Current Measurements Considering Impact of Harmonics. IEEE Trans. Power Del. 2017, 32, 587–598. [Google Scholar] [CrossRef]
  23. Zhou, J.; Cen, B.W.; Cai, Z.X.; Chen, Y.J.; Sun, Y.Y.; Xue, H.L. Workload Modeling for Microservice-Based Edge Computing in Power Internet of Things. IEEE Access 2021, 9, 76205–76212. [Google Scholar] [CrossRef]
  24. Tan, M.X.; Chen, B.; Pang, R.M.; Vasudevan, V.; Sandler, M.; Howard, A.; Le, Q.V. Mnasnet: Platform-aware neural architecture search for mobile. In Proceedings of the 2019 IEEE/CVF Conference on Computer Vision and Pattern Recognition (CVPR), Long Beach, CA, USA, 15–20 June 2019; pp. 2820–2828. [Google Scholar] [CrossRef]
  25. Yang, T.J.; Howard, A.; Chen, B.; Zhang, X.; Go, A.; Sandler, M.; Sze, V.; Adam, H. Netadapt: Platform-aware neural network adaptation for mobile applications. In Proceedings of the European Conference on Computer Vision (ECCV), Munich, Germany, 8–14 September 2018; pp. 285–300. [Google Scholar] [CrossRef]
  26. Hu, J.; Shen, L.; Sun, G. Squeeze-and-excitation networks. In Proceedings of the IEEE Conference on Computer Vision and Pattern Recognition, Salt Lake City, UT, USA, 18–22 June 2018; pp. 7132–7141. [Google Scholar] [CrossRef]
  27. Howard, A.; Sandler, M.; Chu, G.; Chen, L.C.; Chen, B.; Tan, M.X.; Wang, W.J.; Zhu, Y.K.; Pang, R.M.; Vasudevan, V.; et al. Searching for mobilenetv3. In Proceedings of the 2019 IEEE/CVF International Conference on Computer Vision (ICCV), Seoul, Republic of Korea, 27 October–2 November 2019; pp. 1314–1324. [Google Scholar] [CrossRef]
Figure 1. Two-dimensional model of reactor.
Energies 18 01132 g001
Figure 2. Schematic diagram of ITSC fault setting for reactor.
Energies 18 01132 g002
Figure 3. External circuit setting of reactor.
Energies 18 01132 g003
Figure 4. Verification of finite element method and analytical method: (a) current verification; (b) inductance verification.
Energies 18 01132 g004
Figure 5. Change rate of different electrical parameters.
Energies 18 01132 g005
Figure 6. Change rate of magnetic induction intensity.
Energies 18 01132 g006
Figure 7. Flowchart of online Lissajous graphical method.
Energies 18 01132 g007
Figure 8. Short circuit faults of different degrees that happen on the same layer: (a) Layer 1; (b) Layer 5; (c) Layer 9; (d) Layer 13; (e) Layer 20.
Energies 18 01132 g008
Figure 9. Short circuit faults of the same degrees that happen on different layers: (a) 1.38%; (b) 15.50%; (c) 31.01%.
Energies 18 01132 g009
Figure 10. The variation in Lissajous graphs during a single-turn short circuit fault: (a) comparison of Lissajous graphs under normal and single-turn short circuit fault; (b) change rate of Lissajous characteristic parameter.
Energies 18 01132 g010
Figure 11. Lissajous graph under the influence of harmonic: (a) fifth harmonic; (b) seventh harmonic.
Energies 18 01132 g011
Figure 12. Lissajous graph under the influence of noise.
Energies 18 01132 g012
Figure 13. Platform of experiment validation.
Energies 18 01132 g013
Figure 14. Turn-to-turn short-circuit fault experiments on outermost part of reactor.
Energies 18 01132 g014
Figure 15. Results of different turn-to-turn short-circuit fault experiments.
Energies 18 01132 g015
Figure 16. Application of edge computing on DAR.
Energies 18 01132 g016
Figure 17. SE attention mechanism module.
Energies 18 01132 g017
Figure 18. Typical result of Lissajous graphics using data enhancement.
Energies 18 01132 g018
Figure 19. Accuracy of test set versus epochs.
Energies 18 01132 g019
Figure 20. Lissajous graph of different degrees of experimental reactor: (a) 0.56% (slight); (b) 2.86% (slight); (c) 3.75% (slight); (d) 5.42% (moderate); (e) 18.75% (moderate); (f) 43.00% (severe).
Energies 18 01132 g020
Table 1. Main technical parameters of single-phase DAR.
ParameterValueParameterValue
System Voltage/kV35Number of coils20
Rated capacity/kV·A2000Number of encapsulations5
Rated current/A57.14Inner Diameter/mm2006.5
Frequency/Hz50Outer Diameter/mm2345.3
Table 2. Variations in characteristic parameters of Lissajous graphics in simulation validation.
LayerDegree (%)Short Axis b (%)Inclination Angle θ (%)
Normal
(0.00%)
1.840 (0.00%)0.0082° (0.00%)
Layer 1Slight
(1.38%)
2.013 (9.39%)0.0176° (114.63%)
Moderate
(15.50%)
2.715 (47.57%)0.0244° (197.56%)
Severe
(31.01%)
3.611 (96.27%)0.0350° (326.83%)
Layer 5Slight
(1.38%)
2.071 (12.56%)0.0273° (232.97%)
Moderate
(15.50%)
2.856 (55.21%)0.0345° (320.73%)
Severe
(31.01%)
3.851 (109.32%)0.0463° (464.63%)
Layer 9Slight
(1.38%)
2.099 (14.06%)0.0281° (242.68%)
Moderate
(15.50%)
2.902 (57.73%)0.0348° (324.39%)
Severe
(31.01%)
3.980 (116.28%)0.0465° (467.07%)
Layer 13Slight
(1.38%)
2.108 (14.58%)0.0286° (248.78%)
Moderate
(15.50%)
2.941 (59.87%)0.0352° (329.27%)
Severe
(31.01%)
4.021 (118.52%)0.0472° (475.61%)
Layer 20Slight
(1.38%)
2.102 (14.26%)0.0283° (245.12%)
Moderate
(15.50%)
2.906 (57.93%)0.0345° (320.73%)
Severe
(31.01%)
3.920 (113.03%)0.0463° (464.63%)
Table 3. Variations in characteristic parameters of Lissajous graphics in experiment validation.
Degree (%)Long Axis a (%)Short Axis b (%)Inclination Angle θ (%)
Normal (0.00%)14.0331 (0.00%)2.6435 (0.00%)1.2357 (0.00%)
Slight (3.75%)14.0338 (0.005%)2.8815 (9.00%)1.3566 (9.78%)
Moderate (18.75%)14.0510 (0.13%)6.1724 (133.49%)3.5065 (183.77%)
Severe (43.00%)15.2159 (8.43%)14.0128 (430.09%)6.7321 (444.80%)
Table 4. MobileNetV3-Small network architecture.
InputOperatorExp SizeOut SizeSENLs
224 × 224 × 3Conv2d, 3 × 3-16-HS2
112 × 112 × 16bneck, 3 × 31616RE2
56 × 56 × 16bneck, 3 × 37224-RE2
28 × 28 × 24bneck, 3 × 38824-RE1
28 × 28 × 24bneck, 5 × 59640HS2
14 × 14 × 40bneck, 5 × 524040HS1
14 × 14 × 40bneck, 5 × 512048HS1
14 × 14 × 48bneck, 5 × 514448HS1
14 × 14 × 48bneck, 5 × 528896HS2
7 × 7 × 96bneck, 5 × 557696HS1
7 × 7 × 96conv2d, 1 × 1-576HS1
7 × 7 × 576pool, 7 × 7----1
1 × 1 × 576conv2d, 1 × 1, NBN-1024-HS1
1 × 1 × 1024conv2d, 1 × 1, NBN-k--1
Table 5. Enhanced image dataset.
Fault DegreeTrain DataTest DataTotal Data
Normal554238792
Slight fault568244812
Moderate fault588252840
Severe fault672288960
Table 6. Performance comparison results of different network models.
Fault DegreeTest Accuracy/%Parameters/MFLOPs
MobileNetV3-Small95.91%0.880 M3.41 × 107
MobileVIT-Attention95.50%1.013 M2.73 × 108
ShufflenetV294.38%11.824 M1.14 × 109
ViT-Small84.44%21.416 M4.59 × 109
Swin-Small96.11%49.937 M8.71 × 109
Table 7. Diagnostic result of reactor’s fault degree.
Fault DegreeAlgorithm ModelPrecision (%)Recall (%)F1-Score (%)
NormalMobileNetV3100.00%100.00%100.00%
ShuffeNetV2100%99.16%99.58%
MobileVIT-Attention100%100%100%
ViT-Small100%99.01%99.50%
Swin-Small100%100%100%
Slight faultMobileNetV396.30%95.07%95.68%
ShuffeNetV295.26%94.85%95.05%
MobileVIT-Attention95.99%94.97%95.48%
ViT-Small85.47%84.03%84.74%
Swin-Small96.69%96.23%96.46%
Moderate faultMobileNetV395.12%95.91%95.51%
ShuffeNetV294.90%95.08%94.99%
MobileVIT-Attention95.09%94.80%94.94%
ViT-Small77.46%82.13%79.73%
Swin-Small93.56%93.07%93.31%
Severe faultMobileNetV395.96%96.30%96.13%
ShuffeNetV295.78%96.08%95.93%
MobileVIT-Attention94.96%95.99%95.47%
ViT-Small74.03%72.15%73.08%
Swin-Small96.03%96.15%96.09%
Table 8. Diagnostic result of experimental reactor.
Fault DegreeFault TypeDiagnostic Results
0.56%SlightSlight
2.86%SlightSlight
3.75%SlightSlight
5.42%ModerateSlight×
18.75%ModerateModerate
43.00%SevereSevere
The √ indicates that the diagnosis is correct, and × indicates that the diagnosis is wrong.
Disclaimer/Publisher’s Note: The statements, opinions and data contained in all publications are solely those of the individual author(s) and contributor(s) and not of MDPI and/or the editor(s). MDPI and/or the editor(s) disclaim responsibility for any injury to people or property resulting from any ideas, methods, instructions or products referred to in the content.

