Article

Characteristics of Coal-Bearing Shale Reservoirs and Gas Content Features in the Carboniferous–Permian System of the Qinshui Basin, Shanxi Province, China

1
Key Laboratory of Coalbed Methane Resource & Reservoir Formation Process, Ministry of Education, China University of Mining & Technology, Xuzhou 221008, China
2
Jiangsu Key Laboratory of Coal-Based Greenhouse Gas Control and Utilization, China University of Mining & Technology, Xuzhou 221008, China
3
School of Resources and Earth Science, China University of Mining & Technology, Xuzhou 221116, China
*
Author to whom correspondence should be addressed.
Energies 2025, 18(5), 1120; https://doi.org/10.3390/en18051120
Submission received: 1 February 2025 / Revised: 22 February 2025 / Accepted: 23 February 2025 / Published: 25 February 2025
(This article belongs to the Section H: Geo-Energy)

Abstract

:
The evaluation of reservoir properties and gas-bearing characteristics is critical for assessing shale gas accumulation. This study aimed to improve the precision of characterizing the properties and gas-bearing features of the Carboniferous and Permian shale reservoirs within the Qinshui Basin, Shanxi Province, China. It specifically focuses on the shale from the Late Carboniferous to Early Permian Shanxi and Taiyuan formations at Well Z1, located in the mid-eastern region of the basin. A comprehensive suite of analytical techniques, including organic geochemical analysis, scanning electron microscopy (SEM), X-ray diffraction (XRD), high-pressure mercury intrusion, low-temperature nitrogen adsorption, isothermal adsorption experiments, and gas content measurements, was used to systematically evaluate the reservoir properties and gas-bearing characteristics of the Carboniferous–Permian shale in Well Z1. The findings reveal the following. (1) The organic matter in the Shanxi and Taiyuan formations of Well Z1 is predominantly Type III humic kerogen, exhibiting high maturity and abundance. Specifically, 67.40% of the samples have TOC > 1.00%, classifying them as medium- to high-quality source rocks. The vitrinite reflectance (Ro) ranges from 1.99% to 2.55%, and Tmax varies from 322.01 °C to 542.01 °C, indicating a high to over-mature stage. (2) The mineral composition of the shale is dominated by kaolinite, illite, and quartz, with a moderate brittleness index. The average clay mineral content is 52.12%, while quartz averages 45.53%, and the brittleness index averages 42.34. (3) The pore types in the shale are predominantly macropores, with varying peak intervals among different samples. (4) The surface area and specific pore volume of macropores show positive relationships with TOC, Tmax, kaolinite, and the amount of desorbed gas, while they are negatively correlated with quartz. In contrast, mesopores exhibit positive correlations with TOC and illite. (5) Desorbed gas content exhibits a positive correlation with porosity, Ro, and illite. These insights enhance the comprehension of the reservoir’s properties, the characteristics of gas presence, and the determinant factors for the Carboniferous–Permian shale located in the Qinshui Basin, providing a robust practical procedure for the exploration and extraction of coal-measure shale gas resources within this area.

1. Introduction

As a crucial unconventional natural gas resource, shale gas has emerged as a central topic in both the exploration and development of oil and gas resources and scientific research. To a certain degree, the commercial harnessing of shale gas in North America has transformed the worldwide energy landscape [1,2]. On the basis of experience from the exploration and development of shale gas in North America [3,4], extensive prior research on marine shale formations in southern China concluded that marine shale layers exhibit relatively stable thickness and comparatively uniform reservoir characteristics [5]. The development practices of marine shale gas have been widespread, and its evaluation is relatively straightforward. Previous studies have established a comprehensive system for assessing shale gas resources [6,7]. In contrast to the geological features of marine shale gas, transitional facies shale (coal-measure shale) exhibits significant variability in organic carbon content, substantial vertical lithological changes, thin individual shale layers, and generally unstable depositional environments [8,9,10,11,12]. These factors result in limited regional stability and continuity, posing numerous challenges and difficulties in its exploration and development [13].
The Qinshui Basin is one of China’s most significant coal-bearing basins, characterized by extensive coal-measure shale reservoirs within the Carboniferous and Permian strata [14]. Previous investigations have highlighted substantial exploration potential in the Yushe–Wuxiang block and the central-eastern regions of the Qinshui Coalfield [15,16,17]. However, current shale gas exploration and development efforts in China are predominantly concentrated in the marine shales of the southern Sichuan Basin and its adjacent areas. For instance, Wang et al. [18] conducted a comprehensive study on the Permian marine shales in the northeastern Sichuan Basin, while Nie et al. [19] explored the mechanisms of shale gas enrichment in the Wufeng–Longmaxi formations of the same basin. In contrast, research on coal-measure transitional (marine–terrestrial) shales has progressed more slowly and has received relatively limited attention [20].
To date, most studies in the Qinshui Basin have primarily focused on coal reservoirs. For instance, Yang et al. [21] investigated the reservoir properties of the No. 15 coal seam in the northeastern Qinshui Basin, Li et al. [22] analyzed the gas-bearing characteristics of coal reservoirs in the Sijiazhuang block, and Li et al. [23] examined the gas content of the No. 3 coal in the Yushe–Wuxiang block. Although some researchers have explored the characteristics and gas-bearing properties of coal-measure shale reservoirs [10,24,25], a comprehensive and systematic theoretical framework for coal-measure shales in the Qinshui Basin remains underdeveloped. A more refined understanding of shale reservoir characteristics is essential to advance this field. This study focused on the Carboniferous-Permian Shanxi and Taiyuan formations in the Qinshui Basin. Core samples from Well Z1, located in the central-eastern region of the basin, were collected and subjected to a series of advanced analytical techniques, including organic geochemical analysis, scanning electron microscopy (SEM), whole-rock and clay mineral X-ray diffraction (XRD), and high-pressure mercury intrusion. These methods were employed to systematically evaluate the organic geochemical properties, reservoir characteristics, and gas-bearing potential of the shale reservoirs. The findings of this study aimed to provide a robust theoretical foundation for the exploration and development of coal-measure shale gas resources in the Qinshui Basin.

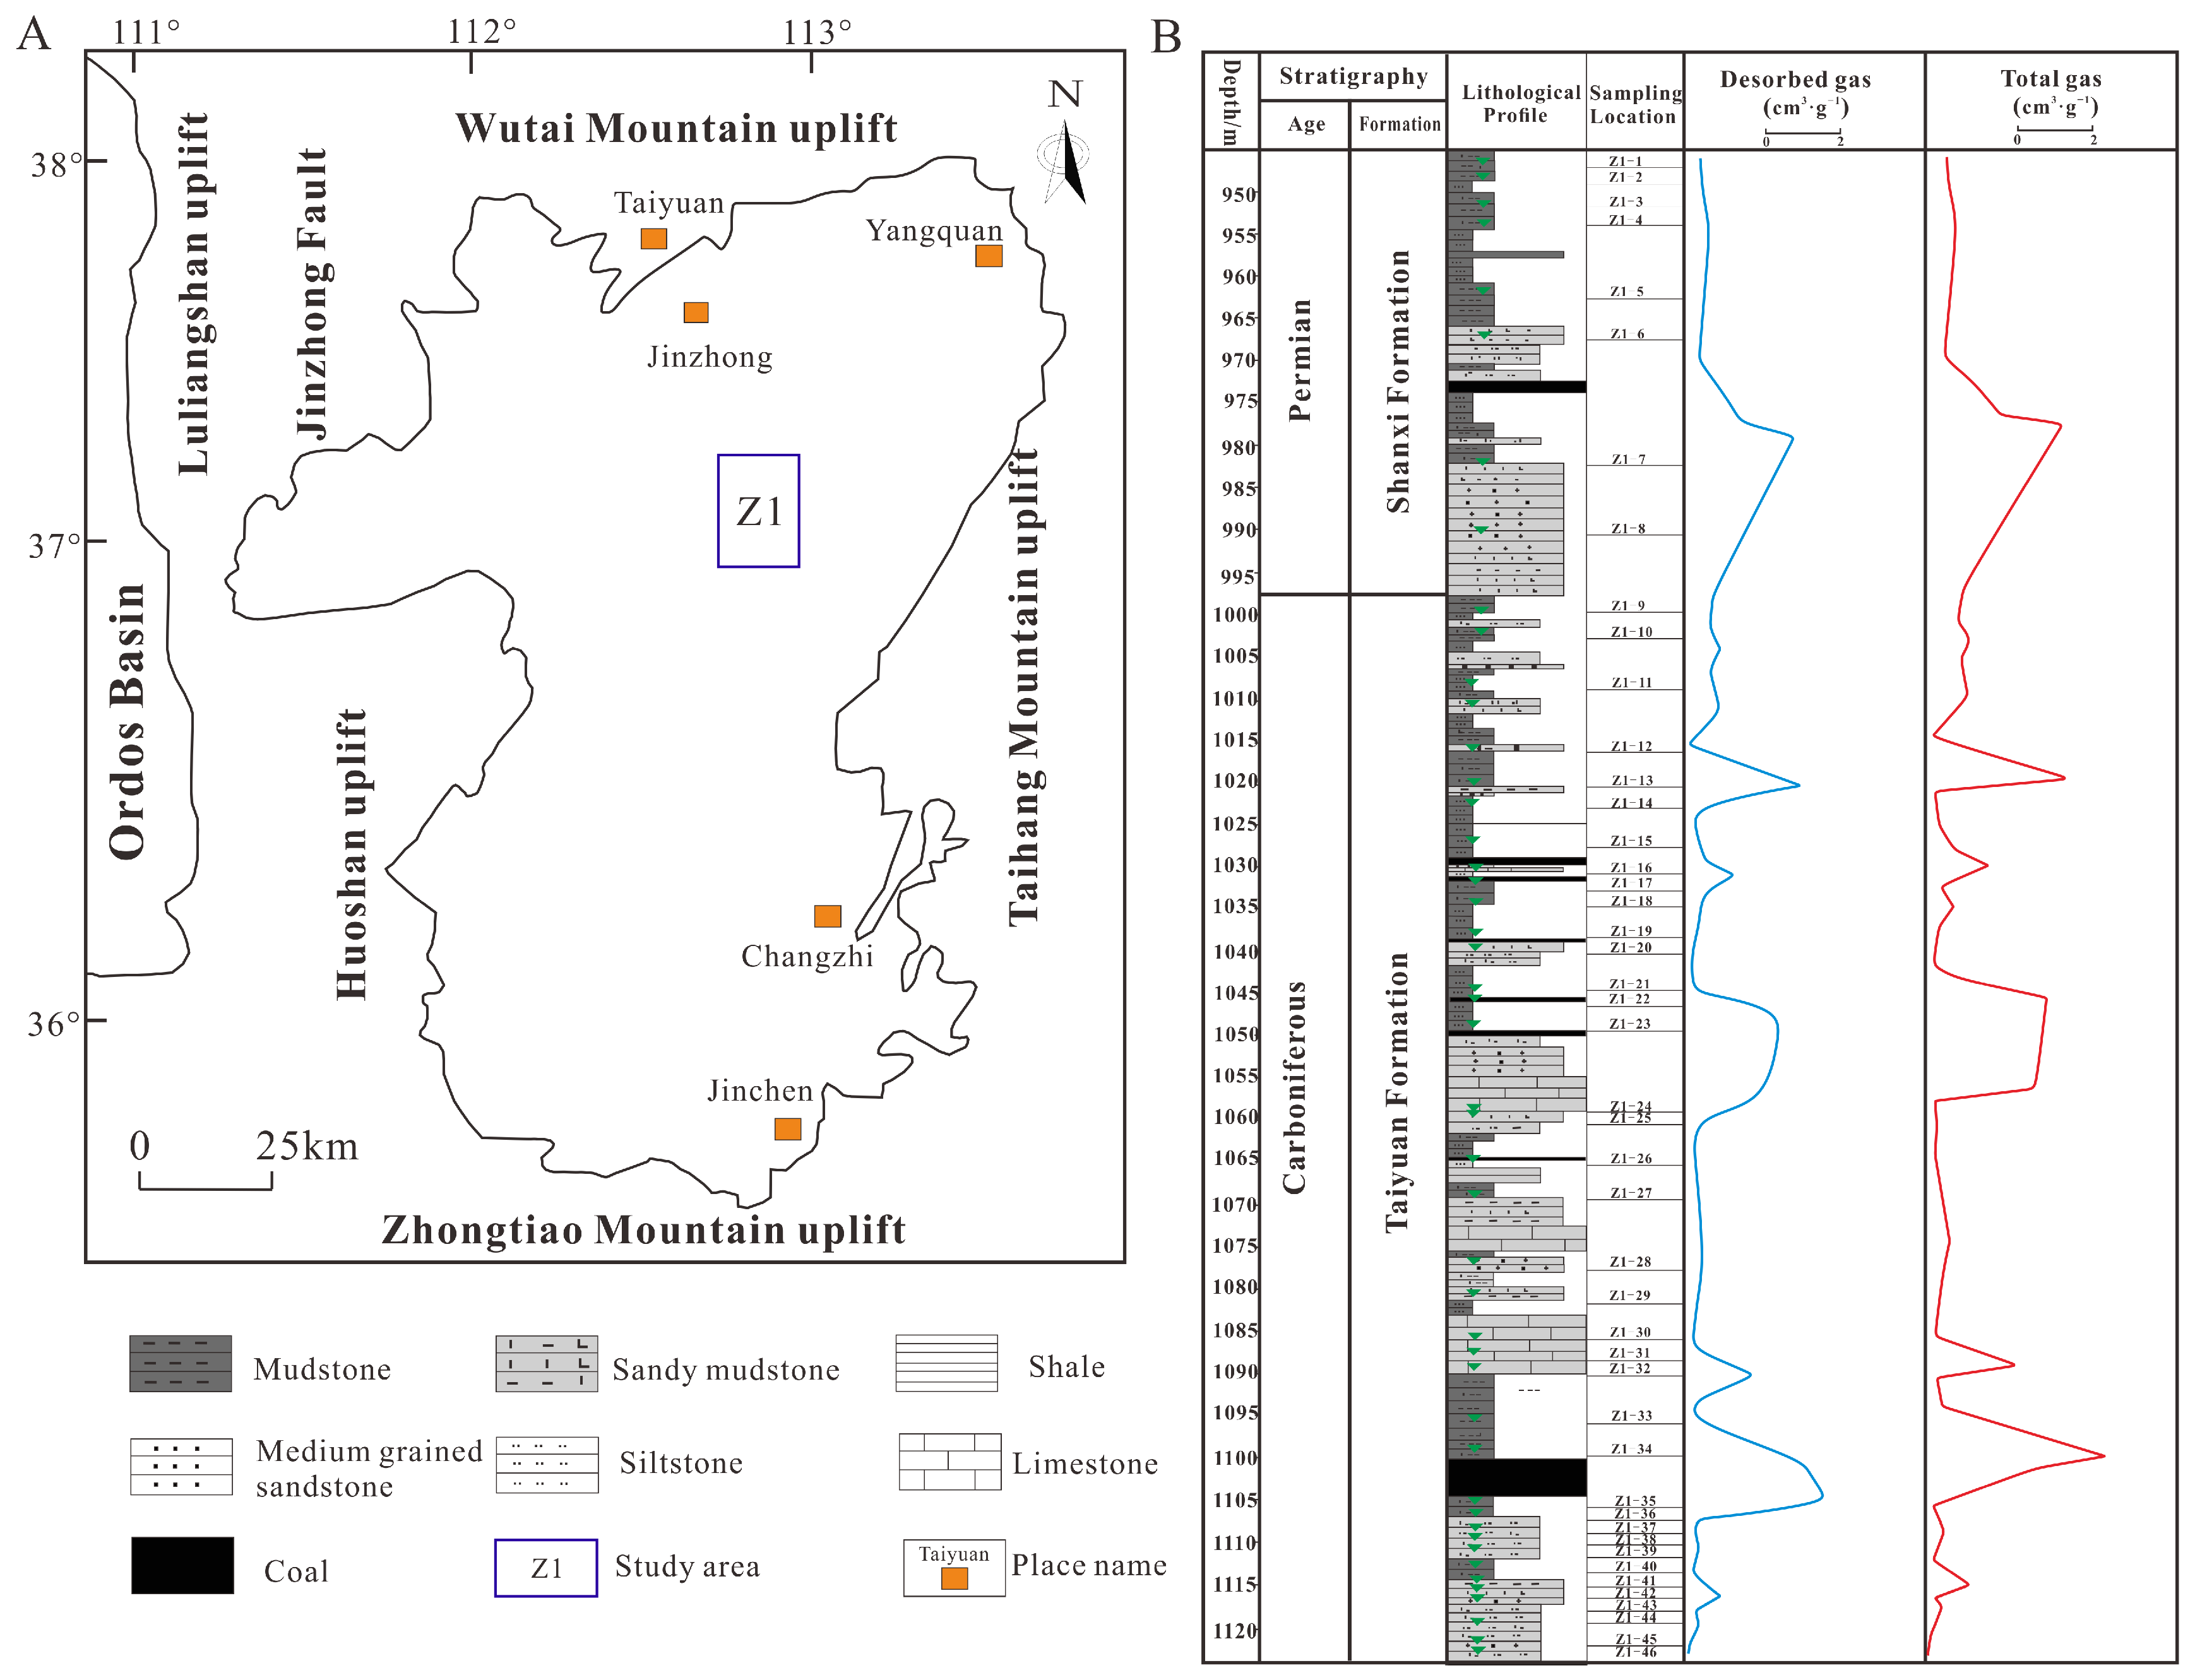
2. Geological Background

The Qinshui Basin is located in the southeastern part of Shanxi Province, bounded by the Zhongtiao Mountain uplift to the south and the Wutai Mountain uplift to the north [26]. It is a NE–NNE-trending composite synclinal basin situated between the Taihang and Lüliang uplift zones [27]. Four significant tectonic events have affected the basin: these include the Hercynian, Indosinian, Yanshanian, and Himalayan orogenies [28]. Among these, the Yanshanian movement had the most significant impact on the basin’s structural evolution. The basin developed a set of marine–terrestrial transitional sedimentary strata dominated by clastic rocks interbedded with carbonate rocks and coal seams, which laid the foundation for the formation and accumulation of coal-measure unconventional natural gas [29,30]. The study area, Well Z1, is situated on the central-eastern margin of the Qinshui Basin within the fold belt of the edge. The structural framework of this area is relatively simple, with few faults developed (Figure 1A).
During the Carboniferous–Permian period, the basin extensively developed coal-measure shale strata in a marine–terrestrial transitional environment. The coal-measure shales are primarily distributed in the Shanxi and Taiyuan formations (Figure 1B). The Taiyuan formation comprises a tidal delta, barrier island, and carbonate rock sedimentary system, with a thickness ranging from 91.80 to 195.10 m and an average thickness of 125.10 m. It is composed of fine sandstone, siltstone, mud shale, sandy mudstone, limestone, and coal seams. The mud shale’s thickness ranges from 46.36 to 121.70 m, with an average of 79.36 m. The Shanxi formation consists of a fluvial-dominated delta sedimentary sequence, with a thickness ranging from 19.29 to 85.30 m and an average thickness of 53.39 m. It is composed of fine sandstone, sandy mudstone, mudstone, siltstone, and coal seams. The mud shale’s thickness in this formation ranges from 12.04 to 81.90 m, with an average of 35.95 m [13,31].

3. Samples and Methods

3.1. Sample Collection

In this study, Well Z1 in the Yushe–Wuxiang block of the Qinshui Basin was selected as the sampling well. A total of 46 core samples including interval of 178.23 m were collected, with the samples numbered in an orderly fashion from the newer strata at the top to the older strata at the bottom (Figure 1B), labeled as Z1-1 to Z1-46. The lithology is predominantly mudstone, sandy mudstone, and siltstone. The samples exhibited porosities ranging from 7.66% to 19.27%, with an average of 13.15%, and permeabilities between 0.03 and 0.38 × 10⁻³ mD, with a mean permeability of 0.22 × 10⁻³ mD.

3.2. Experimental Methods

3.2.1. Organic Geochemical Analysis

The total organic carbon (TOC) analysis was conducted following the standard GB/T 19145-2022 [32], utilizing the CS-800 carbon–sulfur analyzer. Initially, the samples were thoroughly immersed in dilute hydrochloric acid at room temperature to eliminate the inorganic carbon components within the sample walls. Subsequently, the residual samples were placed in crucibles and subjected to a drying process at 120 °C for 4 h. Finally, the samples were combusted completely in an induction furnace, and the CO2 produced was collected. The TOC content of the samples was determined based on the CO2 concentration in the exhaust gas.
Rock-Eval pyrolysis testing was performed according to the standard GB/T 18602-2012 [33], with the OG-2000V Rock-Eval pyrolysis analyzer, Shandong Jinpu Analytical Instrument, Shandong, China. Prior to testing, the samples were ground to 100 mesh and dried at 60 °C for 12 h. The samples were then placed in the pyrolysis analyzer and gradually heated to 600 °C. The hydrogen flame ionization detector was used to measure the S0 (initial sulfur content), S1 (free hydrocarbon content), S2 (potential hydrocarbon content), and Tmax values during the pyrolysis process under a carrier gas flow.
Kerogen type and vitrinite reflectance analyses were carried out according to the standards SY/T 5125-2014 [34] and SY/T 5124-2012 [35], respectively, using a Leica DM4500p microscope, Leica Microsystems GmbH, Wetzlar, Germany. Before analysis, the samples were prepared into thin sections and polished. The microscope was employed to observe the morphology and distribution of kerogen in the samples, and the vitrinite reflectance was measured simultaneously.

3.2.2. Petrological Characteristics Testing

The X-ray diffraction (XRD) experiments for whole rock and clay minerals were conducted following the standard SY/T 5163-2018 [36], using a Rigaku SmartLab instrument, Rigaku Corporation, Tokyo, Japan. Prior to testing, the samples were ground to 200 mesh and dried at 105 °C for 24 h. The samples were prepared in powder form and placed in the instrument for analysis. During the experiment, the X-ray diffraction patterns of the samples were recorded, and the mineral composition and content of both whole rock and clay minerals were analyzed.
The SEM-EDX experiments were performed according to the standards SY/T 5162-2021 [37] and SY/T 6189-2018 [38], using a Carl Zeiss EVO MA15 environmental scanning electron microscope equipped (Carl Zeiss, Oberkochen, Germany) with an Oxford SDD Inca X-Max20 energy dispersive X-ray spectrometer (Oxford Instruments, Oxford, UK). Before testing, the samples were cut into small pieces, polished, and coated with a thin layer of gold. The samples were then placed in the microscope, where an electron beam was used to scan the sample’s surface. Simultaneously, energy dispersive X-ray spectroscopy was conducted to record the microscopic morphology and elemental distribution of the samples.

3.2.3. Pore Characterization Testing

A high-pressure mercury intrusion test was conducted using a Quantachrome Poremaster33GT instrument (Boynton Beach, FL, USA.) according to the standard GB/T 21650.1-2008 [39] at a temperature of 30 °C. Prior to testing, coal column samples were dried at 75 °C for 48 h. During the experiment, the instrument continuously injected mercury into the samples, recording parameters such as capillary pressure, mercury intrusion efficiency, and average pore throat radius. To minimize the risk of deformation of the coal samples under high pressure, which could distort the data, this study primarily employed high-pressure mercury intrusion to characterize the pore size distribution in the range of 50 to 10,000 nm. The samples were prepared as 1 cm3 cubes and dried at 70–80 °C for approximately 12 h. The maximum pressure for mercury intrusion was set at 227 MPa.
The low-temperature nitrogen adsorption test was performed using an Autosorb-1 surface area and pore size analyzer manufactured by Quantachrome, Boynton Beach, FL, USA. Prior to the experiment, samples underwent ultrasonic cleaning in deionized water to remove surface impurities, followed by low-temperature drying pre-treatment. The samples were then ground to a mesh size of 20 to 50 and subjected to vacuum degassing at 150 °C for 4 h (achieving a vacuum of 266.66 Pa) to eliminate residual gas impurities. Subsequently, the samples were placed in a Dewar flask containing liquid nitrogen and connected to the analytical system. Isothermal physical adsorption–desorption measurements were conducted at −196.15 °C, with pore size measurements ranging from 2 to 50 nm and relative pressure (p/p0) spanning from 0.001 to 0.998. The adsorption and desorption isotherm data were recorded, and the average pore size was calculated using the Density Functional Theory (DFT) model, while the specific surface area was determined through multipoint model linear regression.

3.2.4. Isothermal Adsorption Experiment

A methane isothermal adsorption experiment was conducted using a Micromeritics HPVA II high-pressure volumetric analyzer (Micromeritics Instrument Corporation, Norcross, GA, USA), following the standard GB/T 19560-2008 [40] at a temperature of 30 °C. Prior to testing, the samples were crushed to a powder size of 60 to 80 mesh and dried at 250 °C for 24 h to remove moisture. After accurately weighing the samples, they were placed in the adsorption chamber, where helium gas was introduced into both the reference and adsorption chambers to assess their airtightness. Under precise control of the pressure regulation system, methane adsorption and desorption experiments were performed, recording parameters such as time, temperature, and pressure throughout the process.

3.2.5. Gas Content Testing

Gas content measurements were conducted according to the standard GB/T 19559-2021 [41], utilizing the HT-WB12 thermostatic water bath desorption chamber and desorption tank. During the testing procedure, the valve of the desorption tank was opened to allow desorbed gas to flow into a graduated measuring cylinder. The liquid level in the measuring cylinder was adjusted, and a conical flask was held to align its water surface with that of the measuring cylinder for accurate reading. The readings of the water levels before and after desorption were recorded to calculate the gas volume. The valve of the desorption tank was then closed. Concurrently, the ambient temperature and atmospheric pressure were noted. Measurements were taken at specified time intervals, continuing until the average daily desorption volume over seven consecutive days did not exceed 10 cm3, thereby concluding the desorption assessment.

4. Results and Discussion

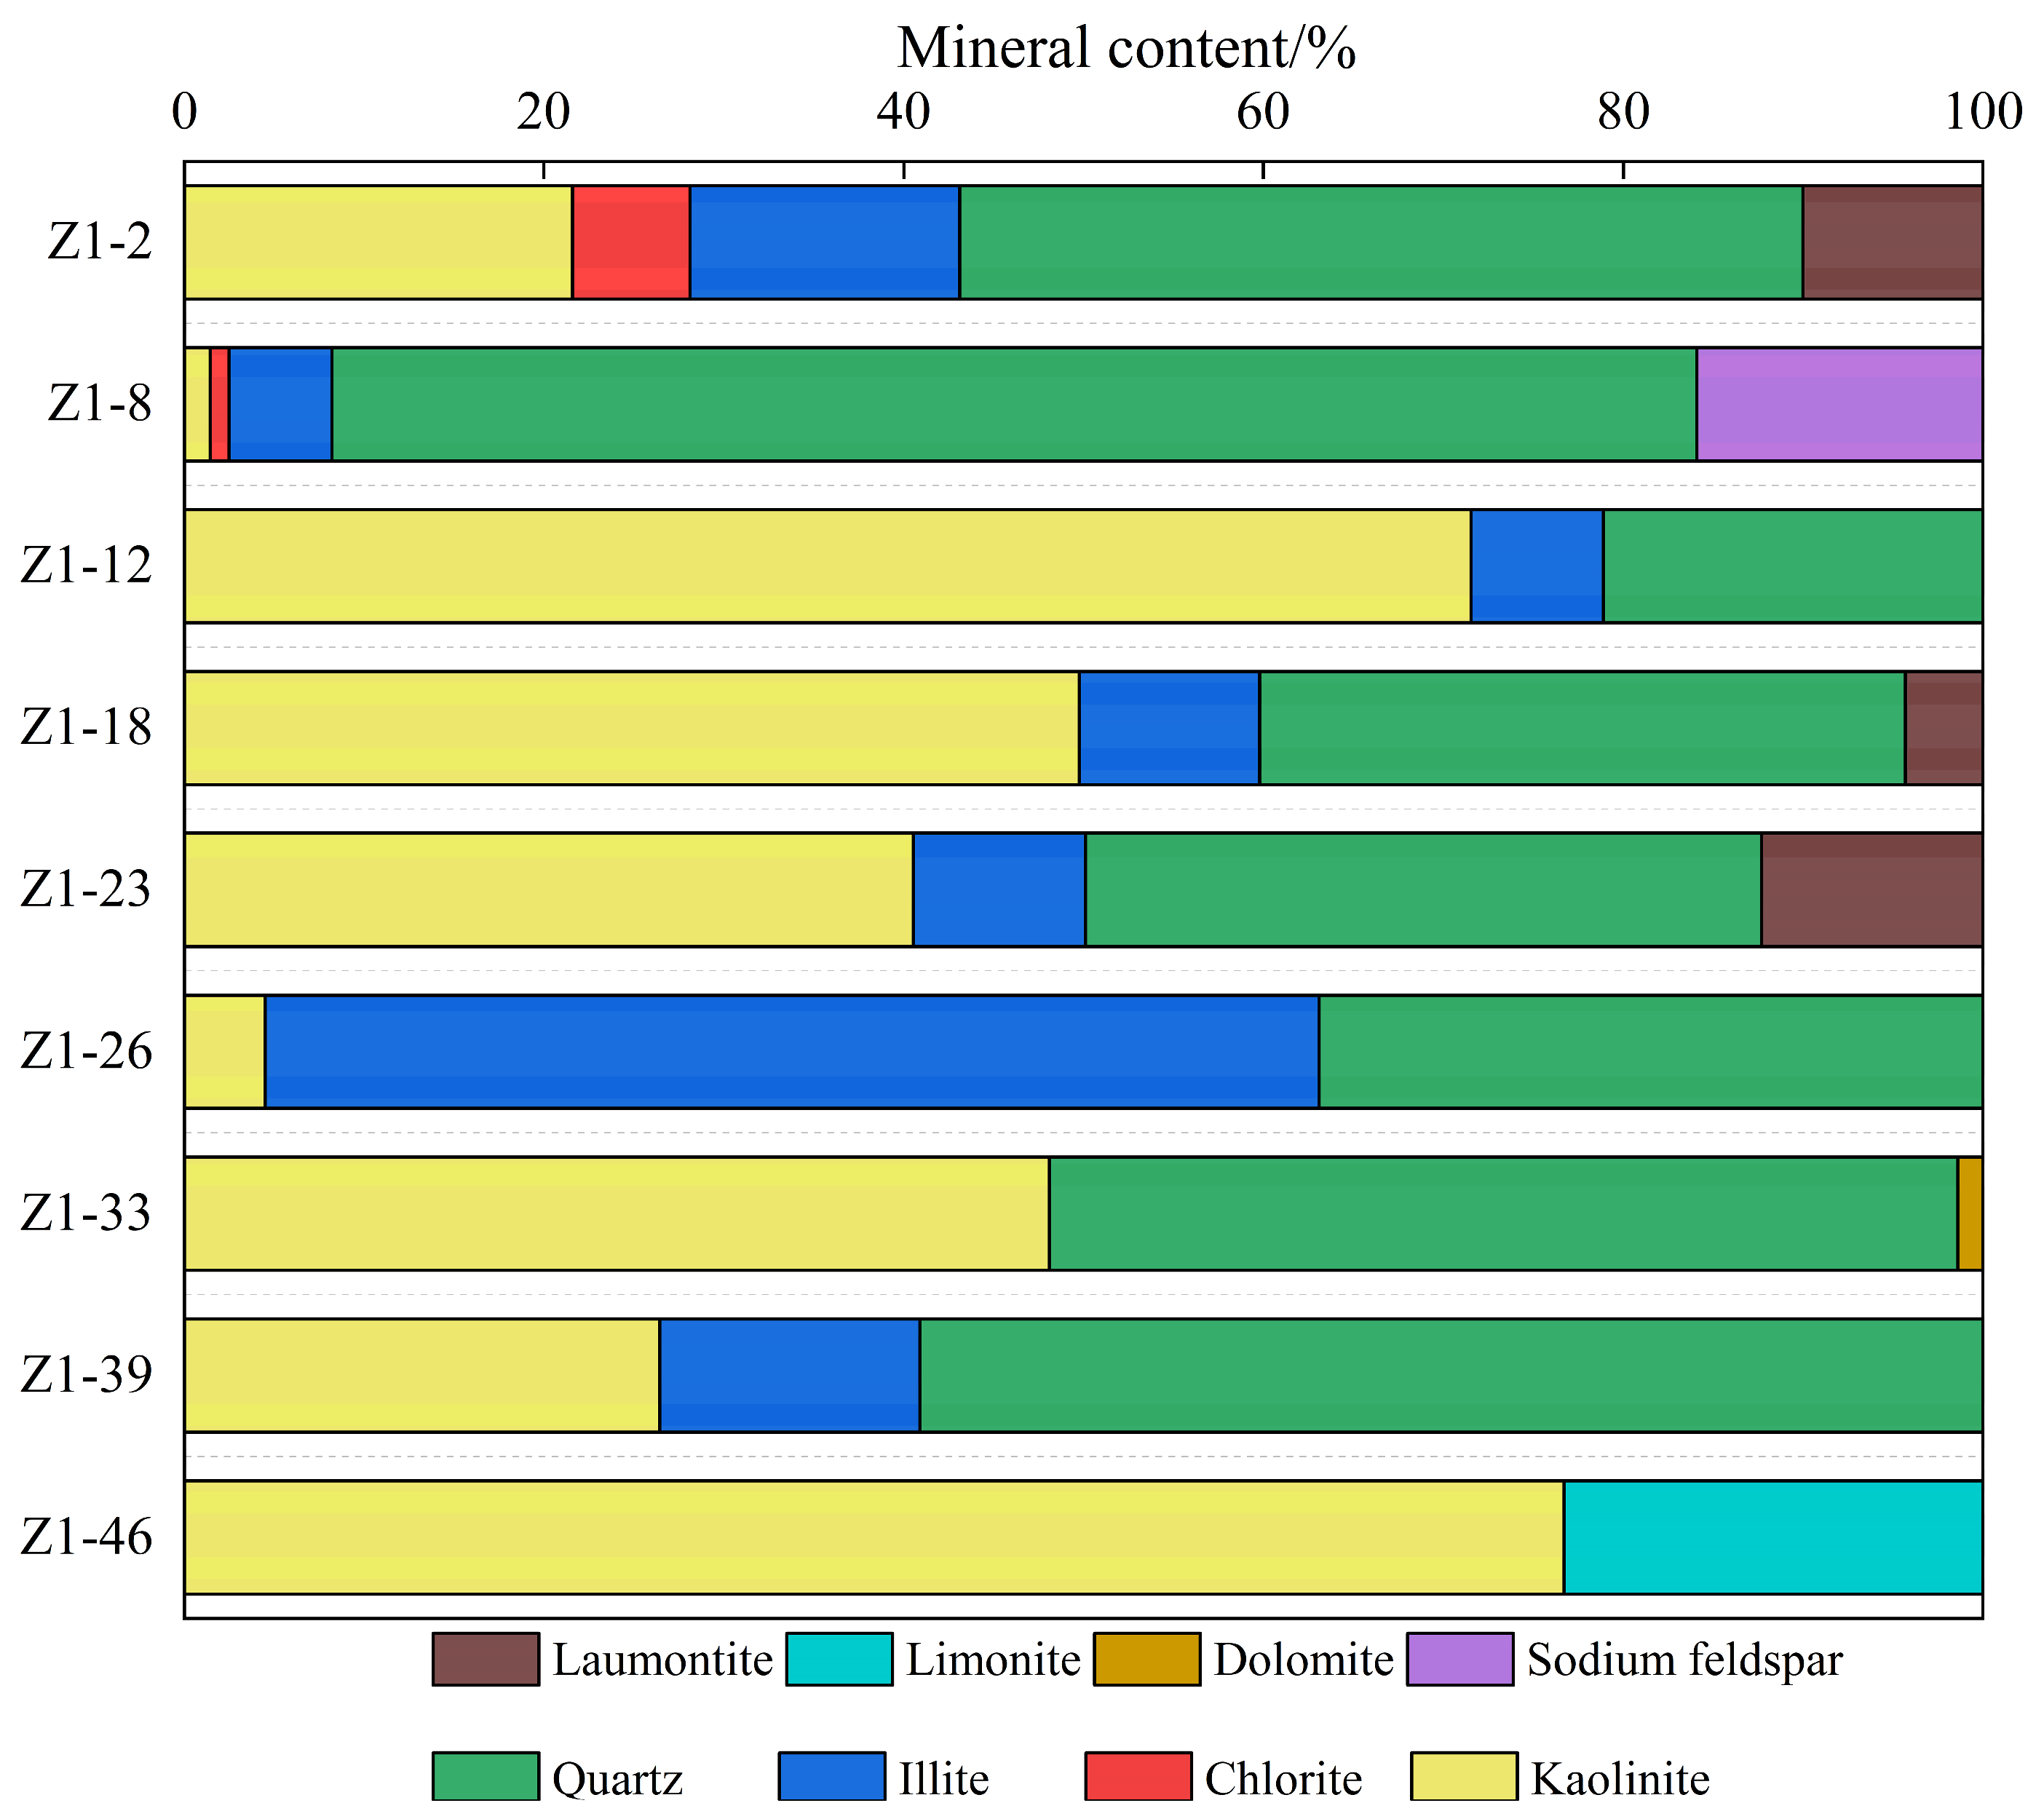
4.1. Characteristics of Mineral Composition

Nine samples from Well Z1 were analyzed using X-ray diffraction; the results are detailed in Table 1. The shale gas reservoirs in the study area are primarily composed of brittle minerals and clay minerals, with some samples predominantly featuring clay minerals. The main brittle minerals identified include quartz, zeolite, and siderite, with volumetric fractions ranging from 21.11% to 91.82%.
The shales of the Shanxi and Taiyuan formations from Well Z1 are largely composed of quartz and clay minerals, followed by siderite and zeolite, while dolomite content remains relatively low (Figure 2). The total clay mineral content varies from 8.19% to 78.89%, with an average of 52.12%. The quartz content ranges from 21.11% to 75.92%, with an average of 45.53%. Some samples contain zeolite, exhibiting volumetric fractions between 4.32% and 12.31%, with an average of 8.91%. Only the Z1-46 sample contains siderite, with a volumetric fraction of 23.33%.
The mineral brittleness index of the samples was calculated using the formula as follows [42]
B M 2 = X quartz + X dolomite + X calcite + X feidspar + X pyrite × 100
where X quartz denotes the mass fraction of quartz in the sample, %; X dolomite denotes the mass fraction of dolomite in the sample, %; X calcite denotes the mass fraction of calcite in the sample, %; X feidspar denotes the mass fraction of feldspar in the sample, %; X pyrite denotes the mass fraction of pyrite in the sample, %; and B M 2 represents the brittleness index of the shale, which is a dimensionless quantity.
The brittleness index for the shale reservoirs ranges from 21.11 to 91.82, with an average of 42.34, indicating moderate mineral brittleness. Generally, stronger rock brittleness facilitates the formation of complex fracture networks [43]. Rickman et al. [44] suggest that reservoirs with a brittleness index greater than 40 tend to forming a fracture network with multiple fractures.

4.2. Organic Geochemical Characteristics

4.2.1. Type of Organic Matter

The type of organic matter is a fundamental parameter for assessing the hydrocarbon potential of source rocks, as it reflects the material sources of kerogen within the rocks. Typically, the kerogen type is analyzed using the kerogen type index (TI). The TI serves as a quantitative indicator that allows for the rapid and accurate classification of kerogen types: a TI greater than 80 corresponds to Type I kerogen, TI values between 40 and 80 indicate Type II1 kerogen, TI values between 0 and 40 are indicative of Type II2 kerogen, and a TI less than 0 signifies Type III kerogen [45]. Five samples were analyzed to characterize the kerogen types in Well Z1. The organic matter type indices (TI) for the Shanxi formation and the Taiyuan formation ranged from −88 to −73, both of which are below zero, categorizing them as Type III kerogen (Table 2). This finding is consistent with previous studies on the organic matter types of mud shales in the Taiyuan formation within the Qinshui Basin, suggesting favorable conditions for shale gas formation [31,46].

4.2.2. Abundance of Organic Matter

The abundance of organic matter is a crucial criterion for evaluating hydrocarbon source rocks, with total organic carbon (TOC) content serving as a widely used indicator. Liu et al. [46] classified shales with a TOC greater than 1% in transitional marine–terrestrial facies as potential shale gas reservoirs. Similarly, Cui et al. [47] regarded samples with TOC exceeding 1% as good source rocks and those with TOC greater than 2% as high-quality source rocks. In Well Z1, TOC was analyzed in 46 samples. The TOC content ranged from 0.38% to 16.22%, with an average of 1.97%; selected results are presented in Table 3. Notably, samples with a TOC less than 1% constituted 32.60%, those with a TOC between 1.00% and 2.00% accounted for 41.30%, and those with a TOC greater than 2.00% comprised 26.10%. Overall, these results indicate the presence of well-developed and high-quality source rocks, possessing significant hydrocarbon generation potential [48].

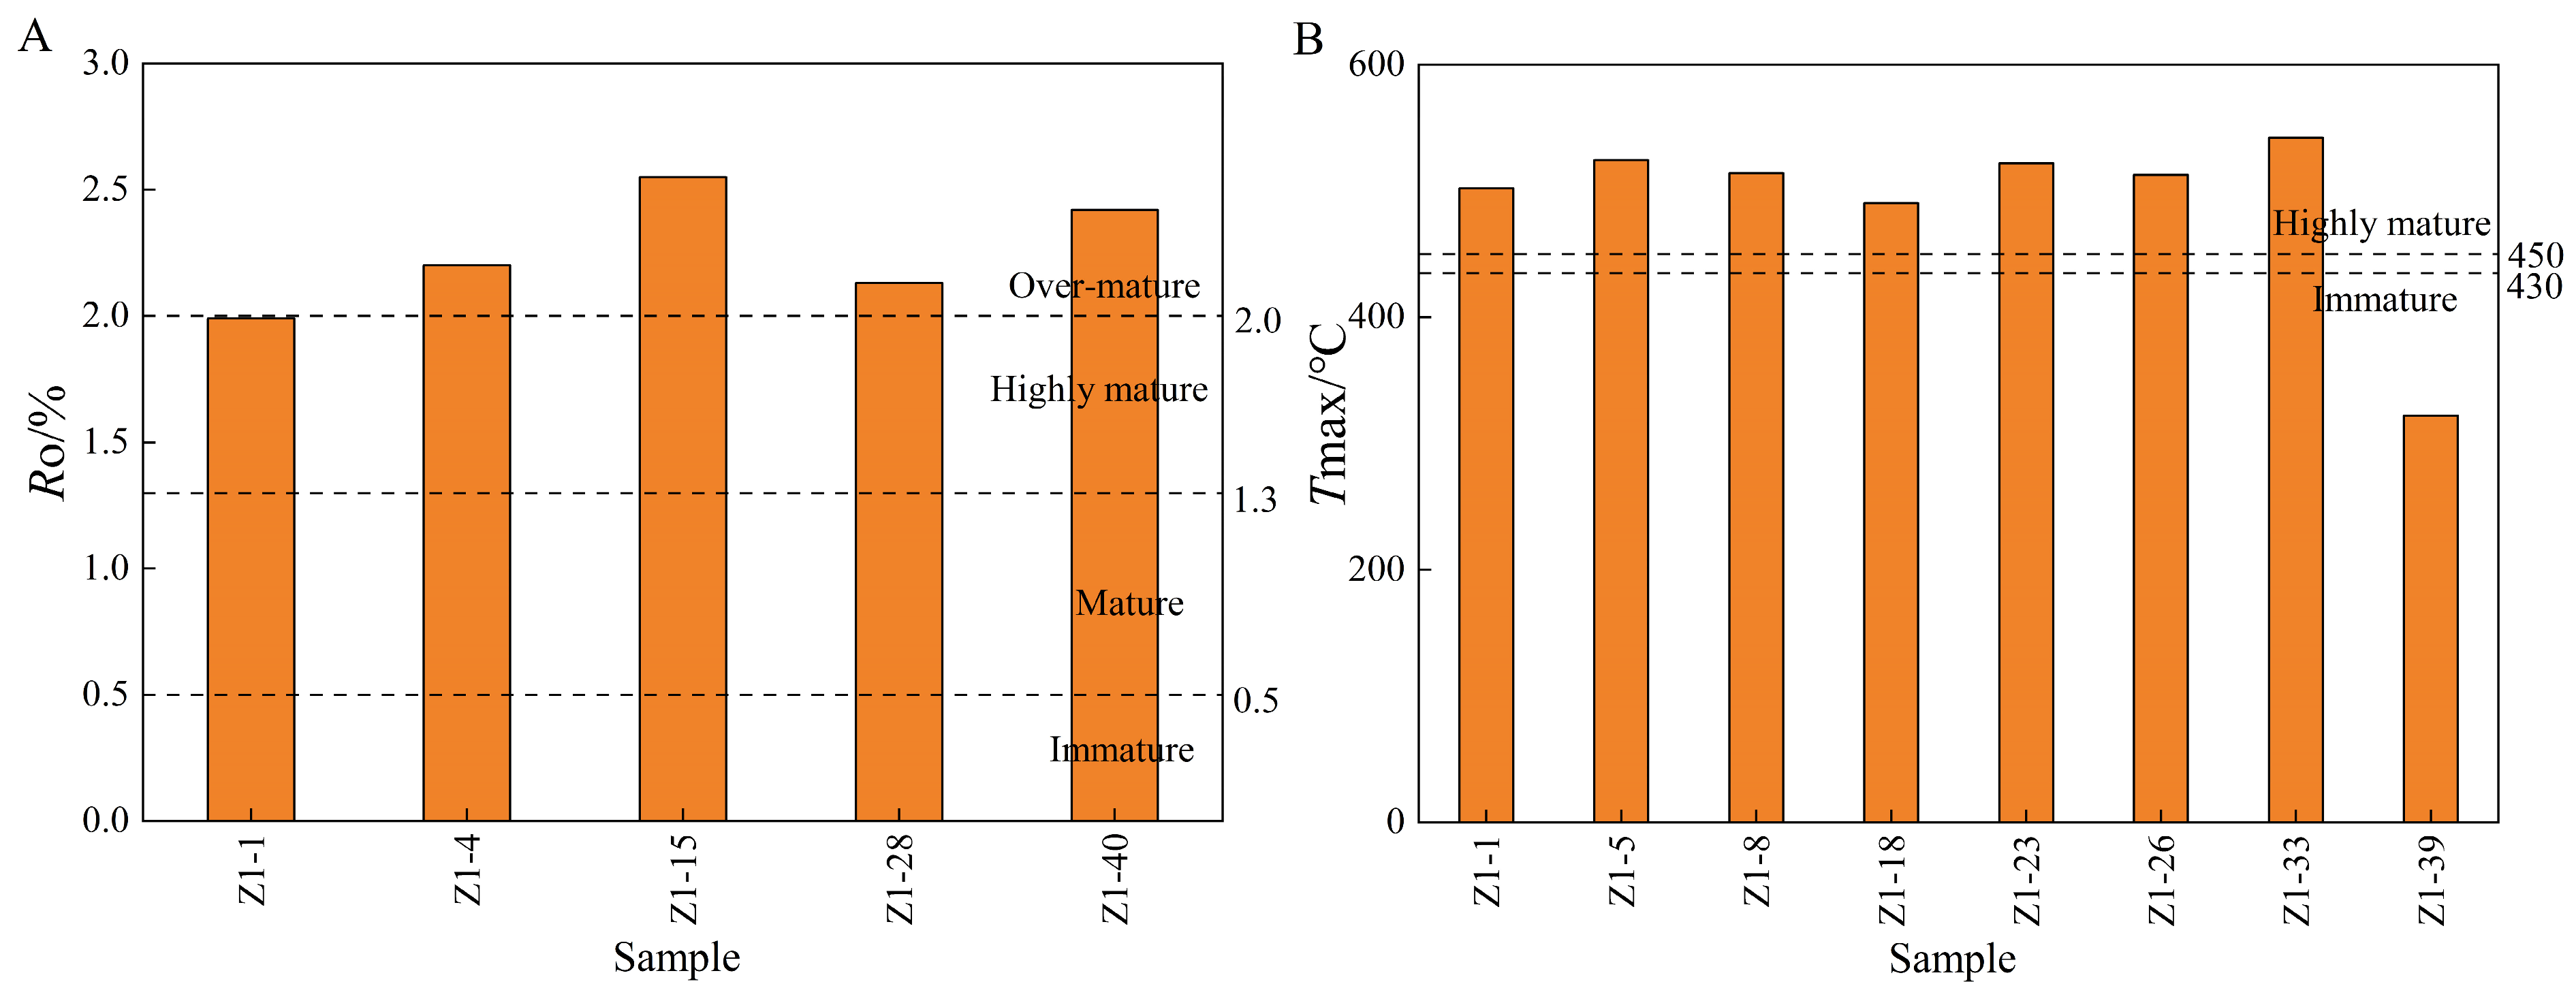
4.2.3. Organic Matter Maturity

The maturity of organic matter is a crucial parameter for characterizing its thermal evolution, serving as an indicator of whether the organic matter has entered the gas generation window. Currently, most researchers utilize vitrinite reflectance (Ro) and the pyrolysis peak temperature (Tmax) to assess the extent of the thermal evolution of organic matter. Vitrinite reflectance analyses were obtained from five samples in Well Z1. Experimental results indicate that the Ro values range from 1.99% to 2.55% (Figure 3A), with an average of 2.26% (Table 2). Rock-Eval pyrolysis analyses were conducted on eight rock samples from Well Z1, with the results detailed in Table 3. The experimental results indicate that Tmax values range from 322.01 °C to 542.01 °C, with an average of 491.23 °C (Figure 3B). Consequently, the shales of both the Shanxi and Taiyuan formations in Well Z1 have reached the high to over-mature stage [43], predominantly generating dry gas during pyrolysis. These findings establish a foundation for the accumulation of shale gas reservoirs.

4.3. Pore Structure Characteristics

4.3.1. Micropore Features

Scanning electron microscopy (SEM) provides insights into the development of various pore types and enables the semi-quantitative assessment of pore parameters within shale. Nine samples from Well Z1 were analyzed using SEM. In this study, the identified pores are classified based on the Loucks classification [50], categorizing them into four types: organic matter pores, intraparticle pores, interparticle pores, and microfractures.
Organic matter pores: These are primarily isolated, nanometer-scale elliptical pores and strip-shaped micropores (Figure 4A,B). Some strip-shaped pores are filled with clay minerals, indicating that organic matter not only contributes to a significant amount of nanometer-scale storage space but also provides certain pathways for fluid flow. Furthermore, organic matter pores are susceptible to later diagenetic effects, which can result in stretching and deformation.
Intraparticle pores: These predominantly consist of elliptical nanometer-scale voids, including pores formed by the dissolution of brittle minerals (Figure 4C) and mold pores created by pyrite (Figure 4D). Intraparticle pores generally develop independently with limited connectivity. Their formation is influenced by tectonic activity and hydrogeological conditions during later diagenesis, closely related to processes such as mineral dissolution, leaching, and recrystallization.
Interparticle pores: These pores are often found at the contact points between mineral particles and are primarily of primary origin. They exhibit a diverse morphology and a broad range of pore sizes, encompassing both micro- and nanometer-scale pores (Figure 4E,F). Their development is concentrated in specific areas, including interparticle pores of clay minerals, stacked clay mineral pores, and interparticle pores of pyrite, which display no obvious arrangement but exhibit good connectivity. The formation of these pores is linked to compaction, cementation, and elemental migration during diagenesis.
Microfractures: As the primary pathways for gas flow and storage spaces for free gas within shale reservoirs, the degree of microfracture development directly impacts gas retention and subsequent extraction. Sub-microscopic microfractures are widely present, mainly as endogenous microfractures within organic matter (Figure 4G), interlayer microfractures of clay minerals (Figure 4H), and endogenous microfractures in brittle minerals (Figure 4I). These fractures typically take on an elongated shape, extending either laterally or vertically, and exhibit a degree of orientation influenced by later diagenetic tectonic activity.

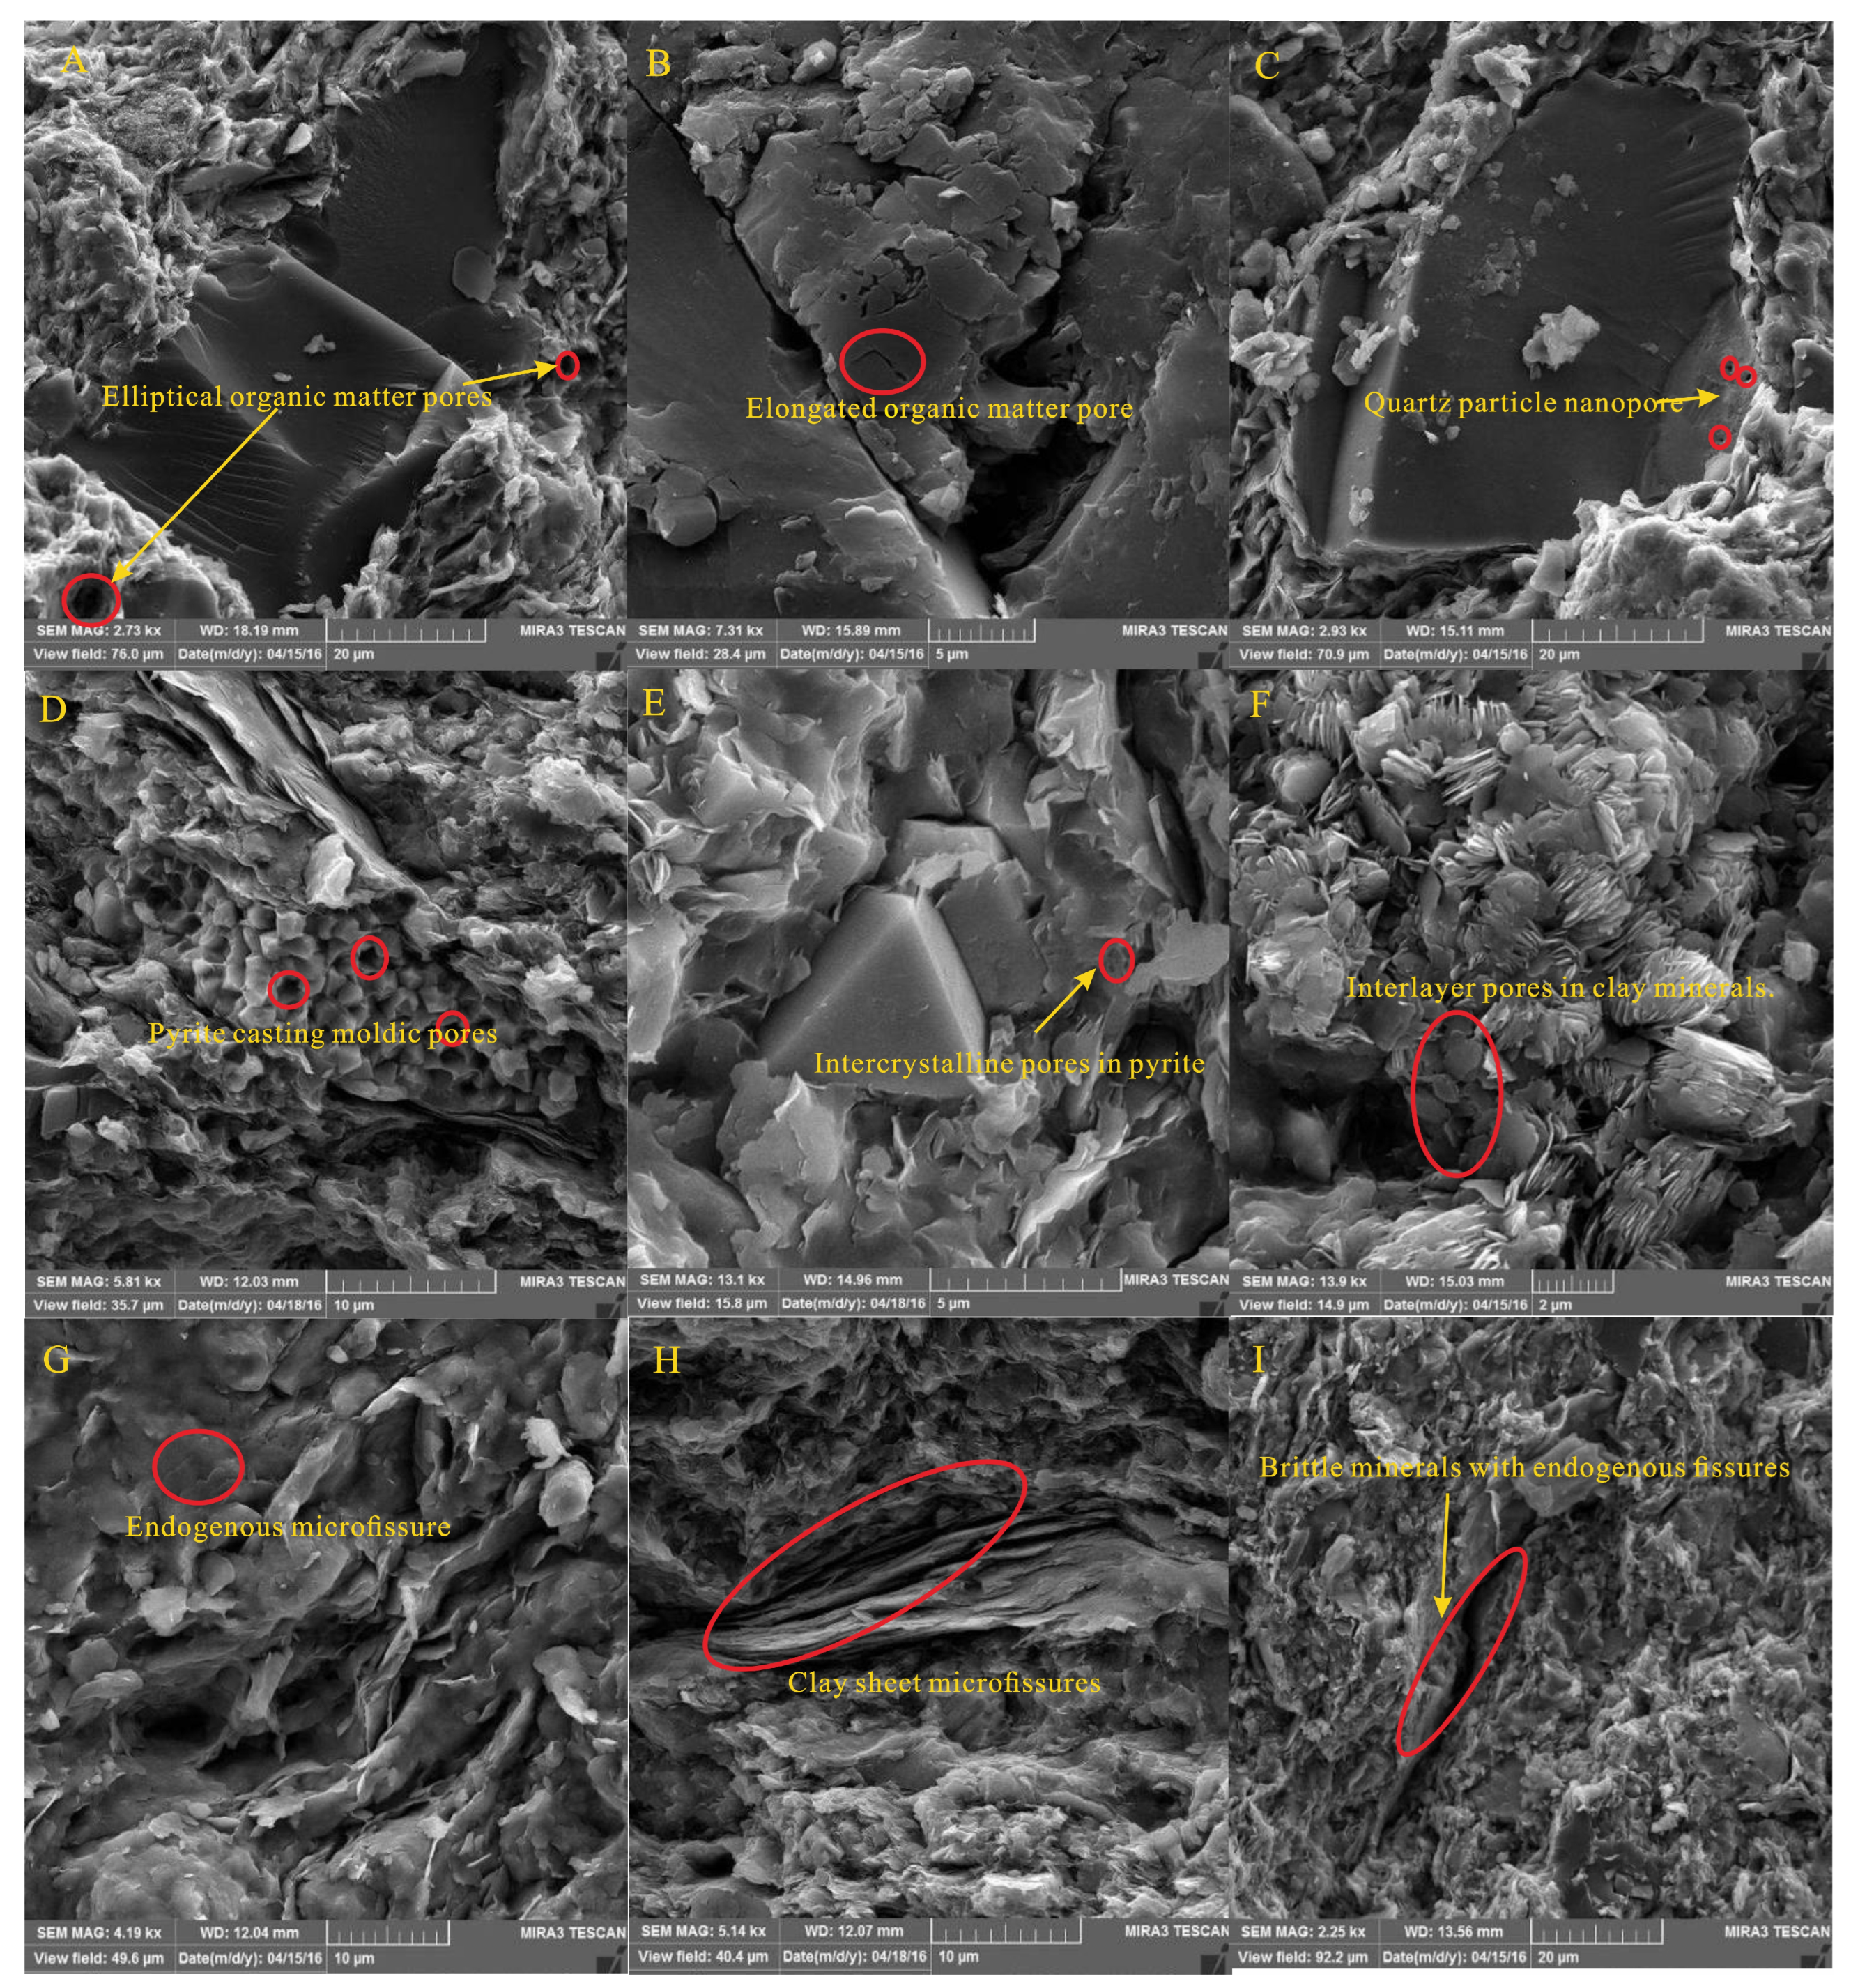
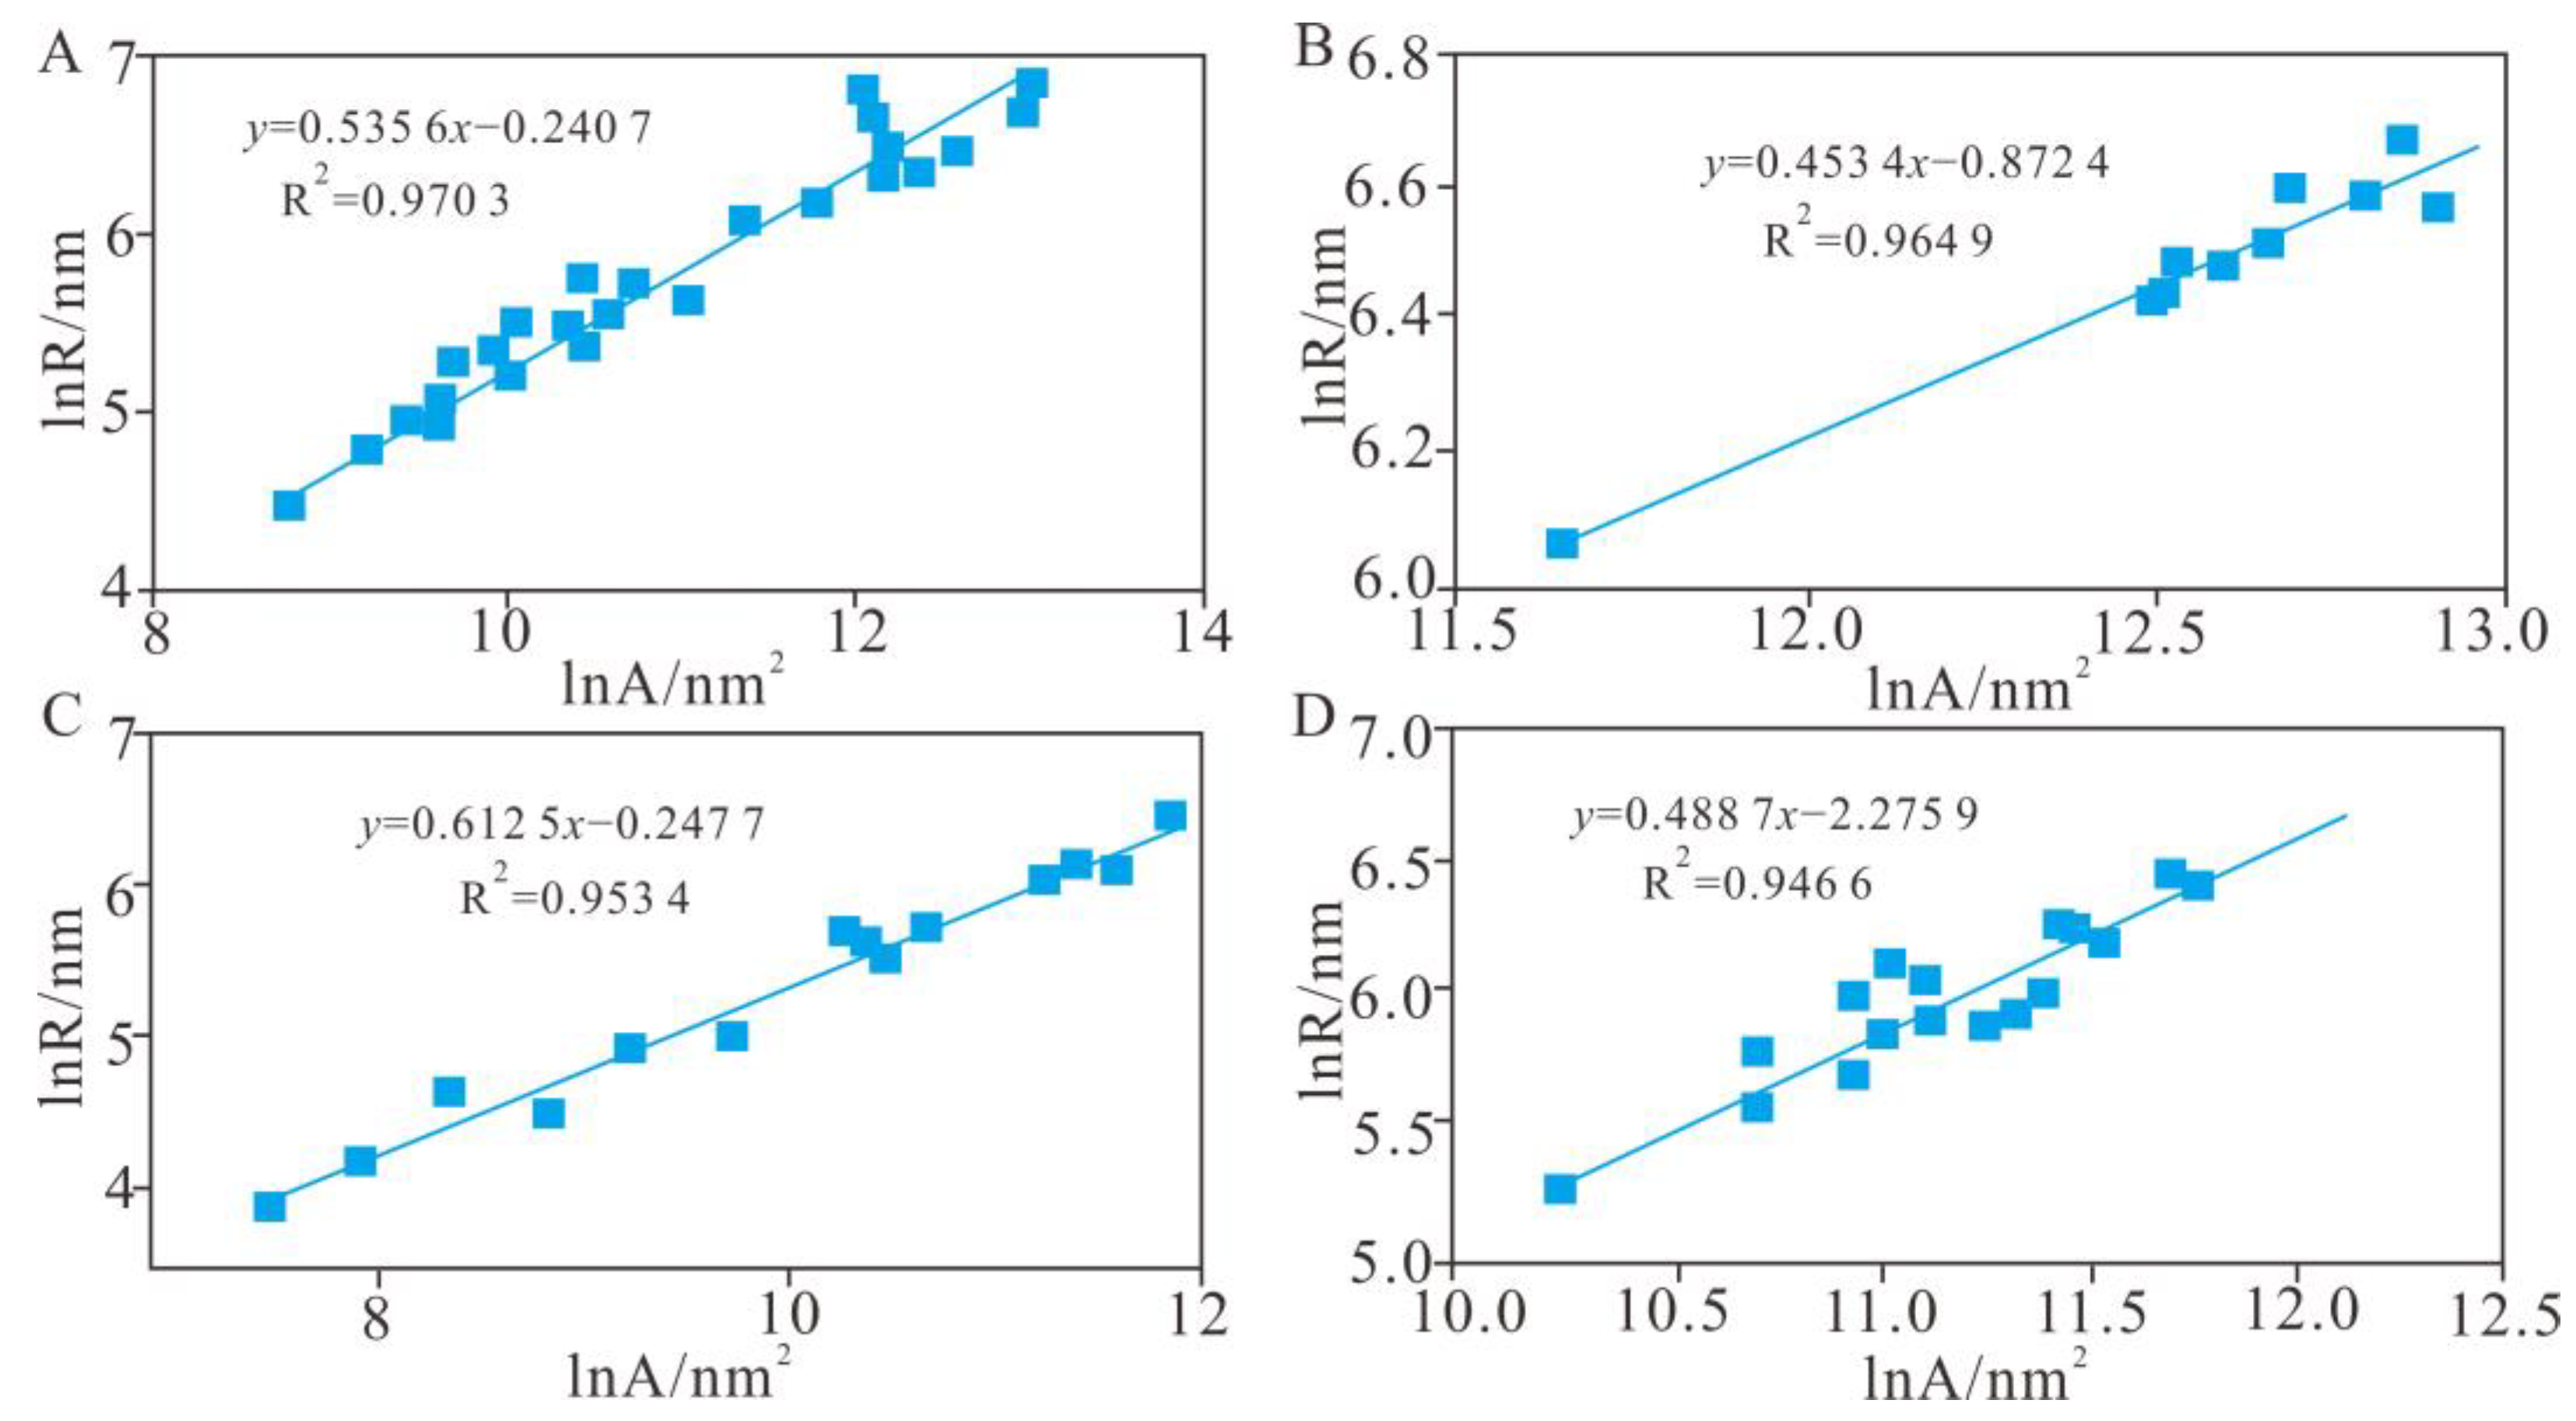
4.3.2. Pore Morphology Analysis

The geometric fractal theory proposed by Mandelbrot [51] transcends dimensional constraints and is employed to describe the self-similarity of objects or the similarity between local and global structures. The fundamental principle posits that if A is a bounded set in an n-dimensional Euclidean space and can be represented as Nr non-overlapping subsets of itself, then A exhibits self-similarity. The fractal dimension D of A is expressed by the following equation
D = log ( N r ) log ( 1 / r )
where r is the scale factor in the coordinate direction, and Nr denotes the non-overlapping subsets of the bounded set A. Extensive previous studies have demonstrated that the complexity of pore structures in shale samples can be represented by the ratio of pore surface area (A) to the major axis (R), formulated as [52]
lnR = β 2 lnA + C
where C is a constant, and β /2 represents the slope of the linear fit of lnA versus lnR. The fractal dimension of the pore morphology derived from the two-dimensional images of the samples can be expressed as D = 3 − β /2. According to fractal theory, the fractal dimension (D) of a geometric polytope in n-dimensional space must satisfy the condition: n − 1 < D < n + 1. Consequently, it follows that the fractal dimension of the three-dimensional pores within shale samples should adhere to the constraints 2 < D < 3 [53].
Figure 5 demonstrates a pronounced linear relationship between lnA and lnR, indicating that the pore and fracture morphology of the shale reservoirs exhibits significant fractal characteristics. The calculated fractal dimensions of the pore and fracture morphology in the shale reservoirs are summarized in Table 4, with values ranging from 2.39 to 2.55. According to Yao et al. [54], a fractal dimension (D) closer to 3.0 suggests a rougher pore surface, while a value approaching 2.0 indicates a smoother pore surface. In this study, the fractal dimension (D) of the mud shale samples is close to 2.0, likely due to the prevalence of larger and medium-sized pores, which often exhibit elliptical shapes with relatively smooth edges.

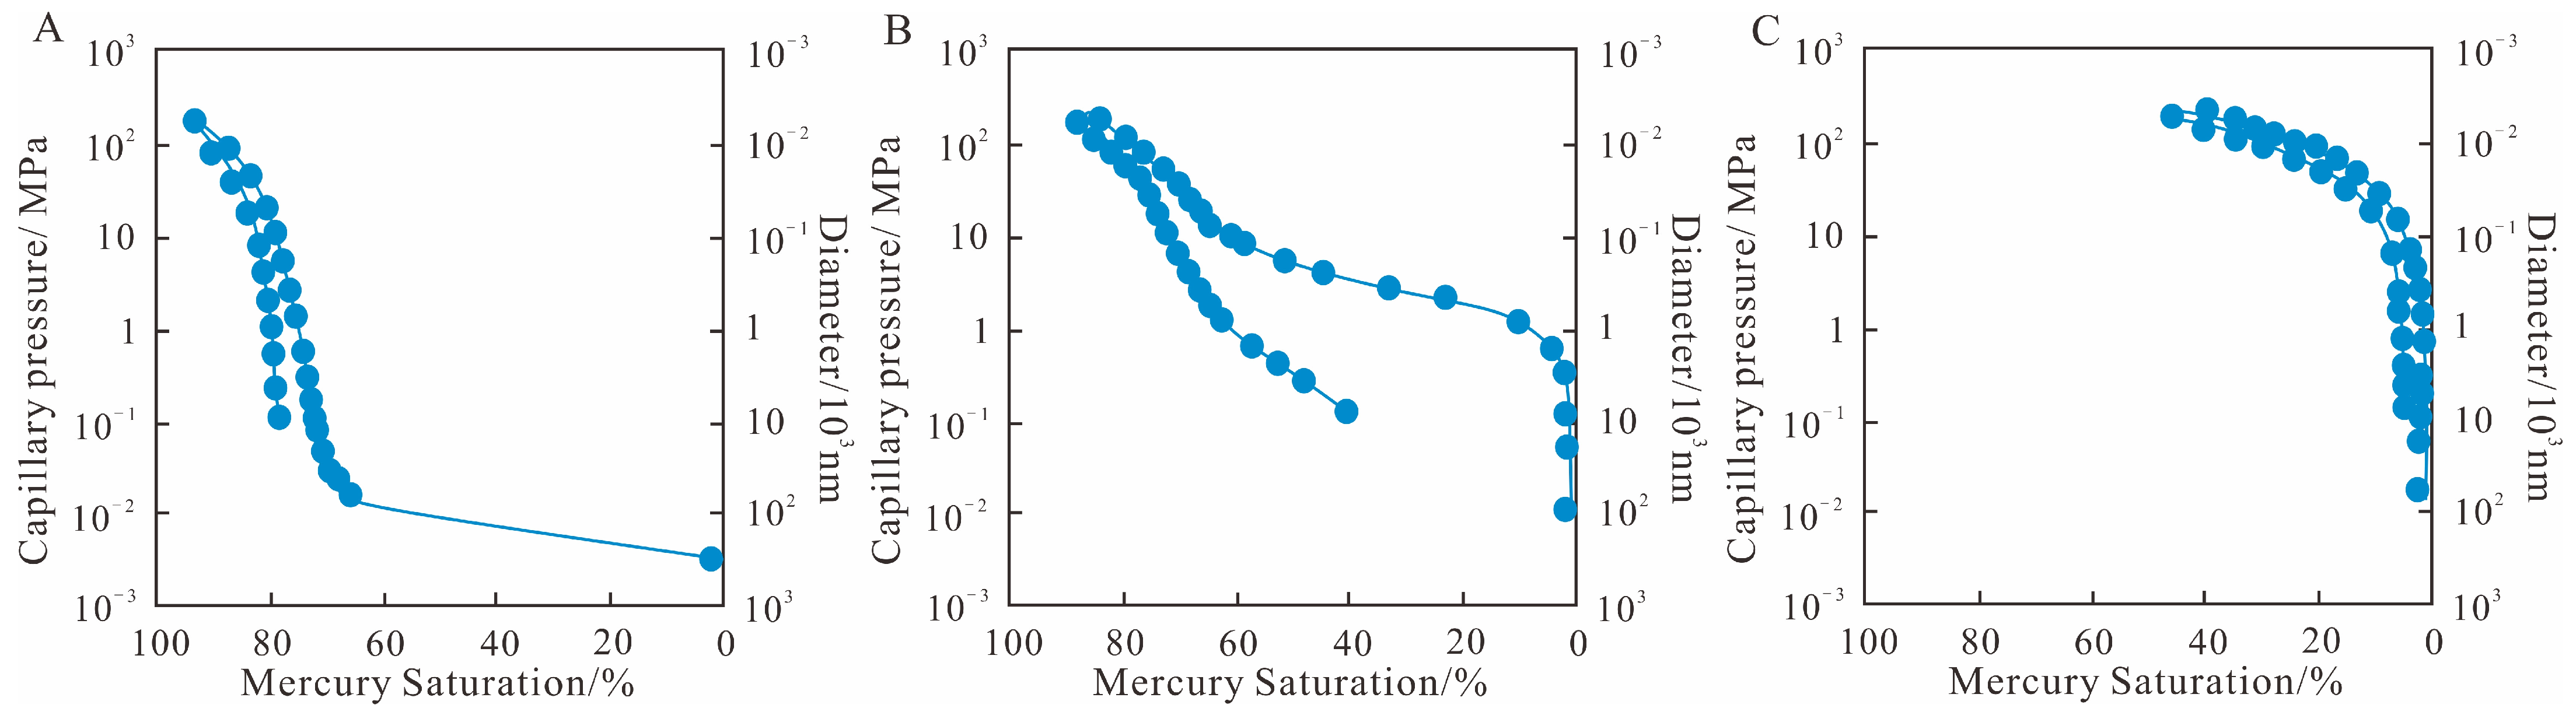
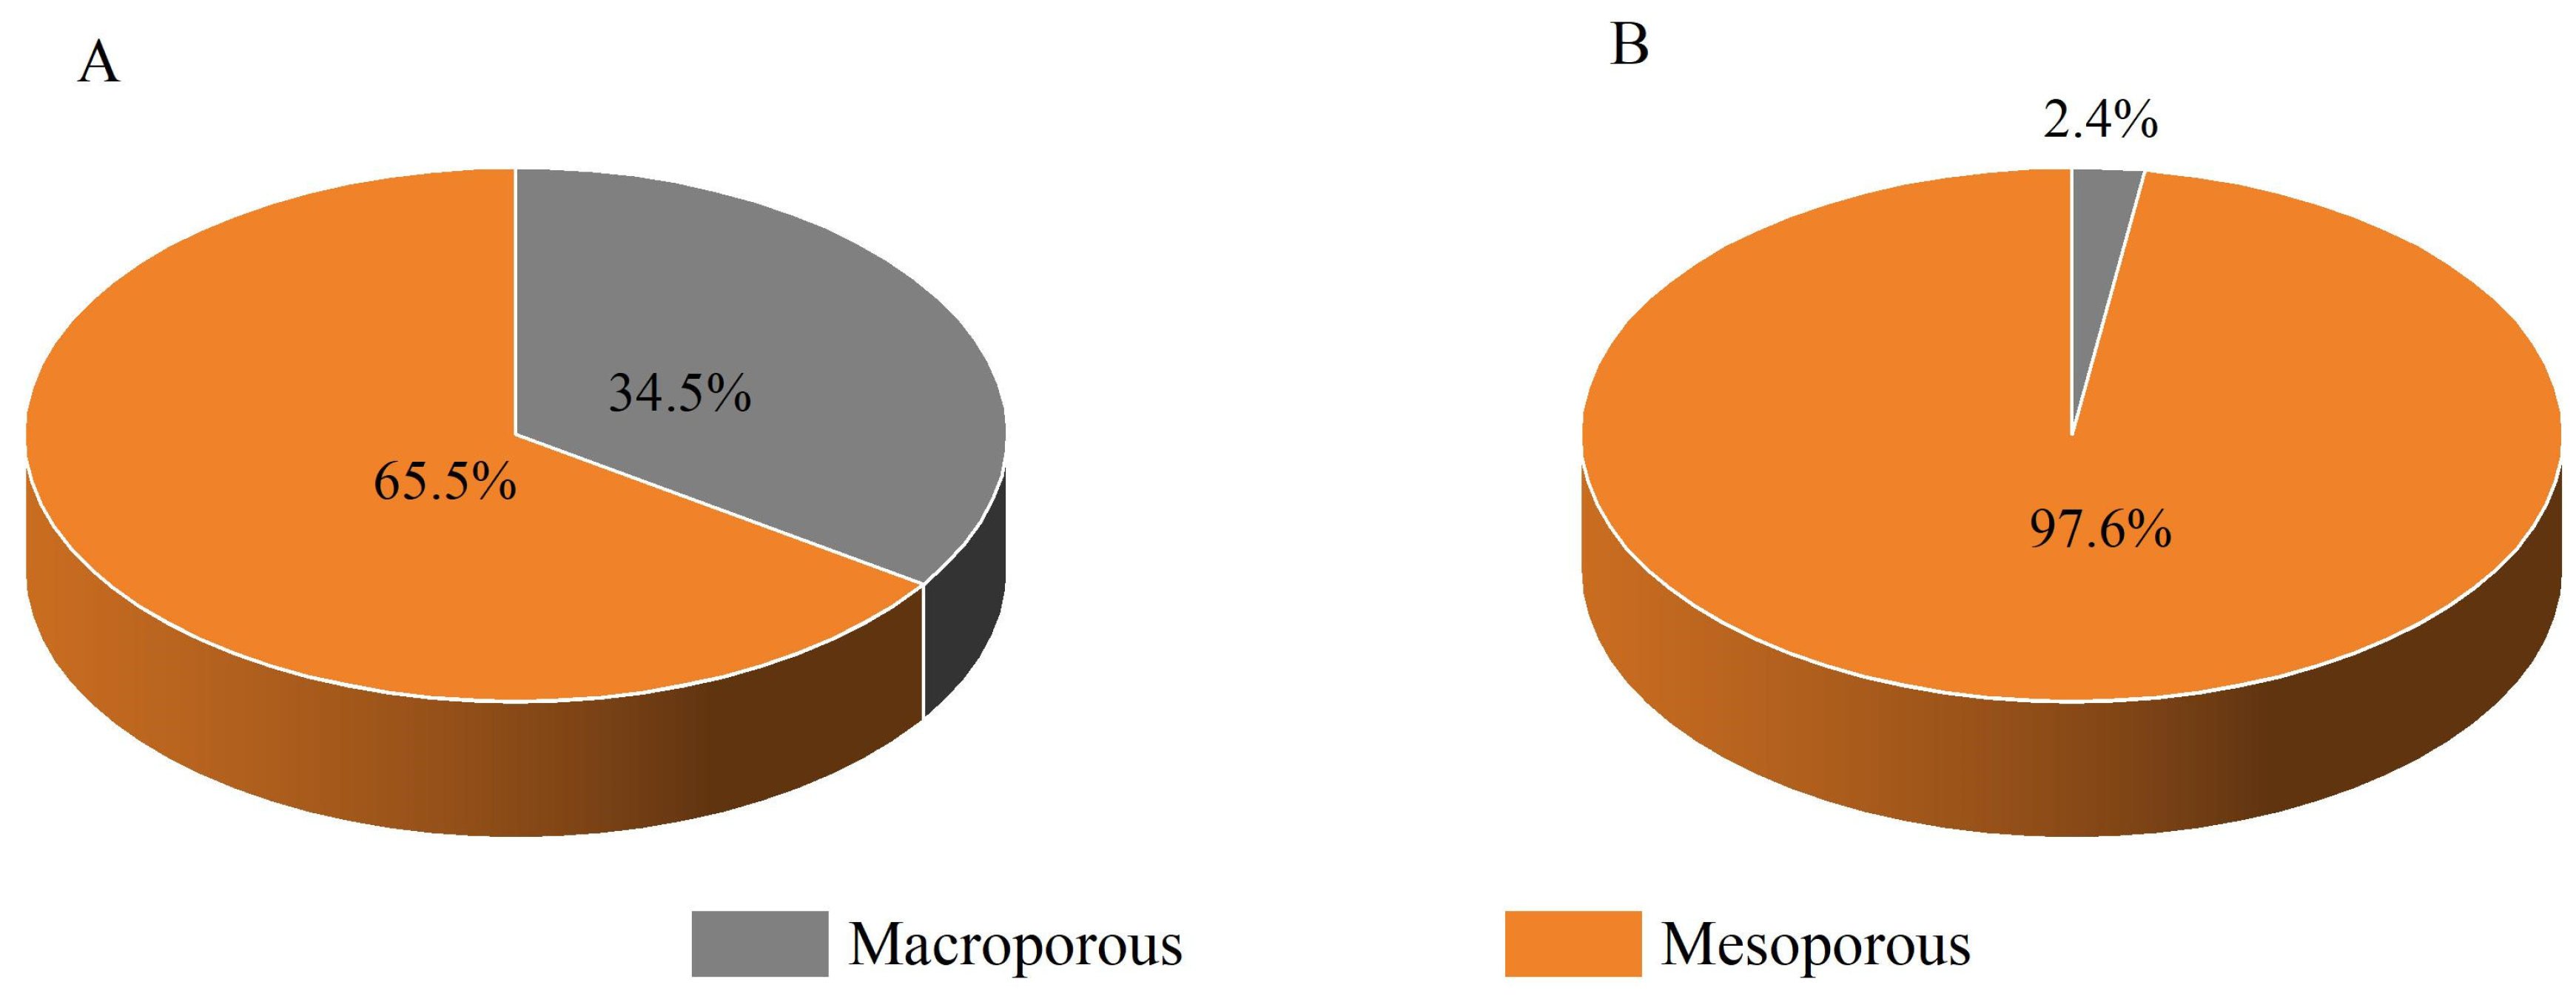
4.3.3. Quantitative Characterization of Pore Structure

(i) High-pressure mercury intrusion test
Six samples from Well Z1 were subjected to high-pressure mercury intrusion tests. The data reveal that the pore diameter of shale from Well Z1 ranges from 57.73 to 6.66 × 10³ nm, with an average of 1.33 × 10³ nm. The specific surface area varies between 0.02 × 10⁻¹ and 1.746 m2/g, with a mean value of 0.60 m2/g. The specific pore volume ranges from 0.25 × 10⁻² to 1.37 × 10⁻¹ cm3/g, with an average of 0.21 cm3/g.
The capillary pressure curves derived from the high-pressure mercury intrusion analyses (Figure 6) allow for the classification of coal samples into three distinct pore structure categories [55]. The first category, represented by sample Z1-27, exhibits a “parallel” capillary pressure profile (Figure 6A). The hysteresis loop in the mercury intrusion–extrusion curves is minimal, with a drainage pressure below 0.01 MPa and a cumulative mercury saturation of over 90%. When the capillary pressure is below 0.01 MPa, the curve resembles a nearly horizontal segment, with the mercury uptake increasing sharply and reaching a saturation of 60%; between 0.01 and 0.10 MPa, the uptake rate decreases slightly while remaining positive; and from 0.10 to 10.00 MPa, the curve exhibits a steep, nearly vertical segment, indicating minimal additional mercury uptake. At pressures exceeding 10.00 MPa, the steepness of the curve diminishes, allowing for another rapid increase in mercury uptake. Analysis suggests that this sample type has well-developed macropores yet exhibits generally low mercury withdrawal efficiency and poor pore connectivity.
The second category, represented by sample Z1-2, displays a “segregated” capillary pressure curve (Figure 6B), characterized by a distinct two-segment profile with significant separation between the intrusion and extrusion curves, and a drainage pressure of approximately 0.01 MPa. In the range of 0.01 to 1.00 MPa, the curve is steep with minimal mercury uptake, indicating poor development of macropores greater than 1000 nm. Between 1.00 and 10.00 MPa, the curve becomes relatively flat as the mercury uptake increases rapidly; however, pressures exceeding 10.00 MPa see a steepening curve again, with a slower rate of uptake, suggesting the optimal development of macropores between 100 nm and 1000 nm.
The third category, represented by sample Z1-22, is characterized by an “erect” capillary pressure curve (Figure 6C), displaying a profile that starkly contrasts with the first category, featuring high drainage pressures approaching 10.00 MPa. Below 10.00 MPa, the mercury intrusion curve appears nearly vertical; between 10.00 and 50.00 MPa, the uptake gradually increases. However, above 50.00 MPa, the uptake accelerates rapidly, yet the overall maximum mercury saturation is relatively low at only 45%, indicating that this type predominantly features mesopore development with minimal macropore formation.
(ii) Low-temperature nitrogen adsorption test
Low-temperature nitrogen adsorption experiments measured pore diameters ranging from 0.35 to 50.00 nm. Six samples from Well Z1 were employed in the low-temperature nitrogen adsorption experiments. The data indicate that the specific surface area of shale samples within the study area varies between 1.82 and 18.33 m2/g, with an average of 9.61 m2/g. The pore volume spans from 0.86 × 10⁻² to 0.30 × 10⁻¹ cm3/g, with a mean value of 0.20 × 10⁻¹ cm3/g. Mesopores exhibit diameters ranging from 6.43 to 18.86 nm, with an average of 9.88 nm (Table 5).
According to the classification system defined by the International Union of Pure and Applied Chemistry (IUPAC), pores are differentiated into three categories on the basis of their diameters: macropores, which are greater than 50 nm; mesopores, ranging from 2 to 50 nm; and micropores, which are less than 2 nm [56]. Figure 7 provides a clear representation of the contributions of different pore sizes to the total pore volume and specific surface area. Notably, the contribution of mesopores to the total pore volume surpasses that of macropores, accounting for 65.50% and 34.50%, respectively. Furthermore, the specific surface area is predominantly derived from mesopores, with a contribution rate as high as 97.60%, while macropores contribute negligibly (Figure 7). Thus, the contribution rates of pore volume and specific surface area are summarized as follows: mesopores > macropores.

4.4. Gas Adsorption Characteristics

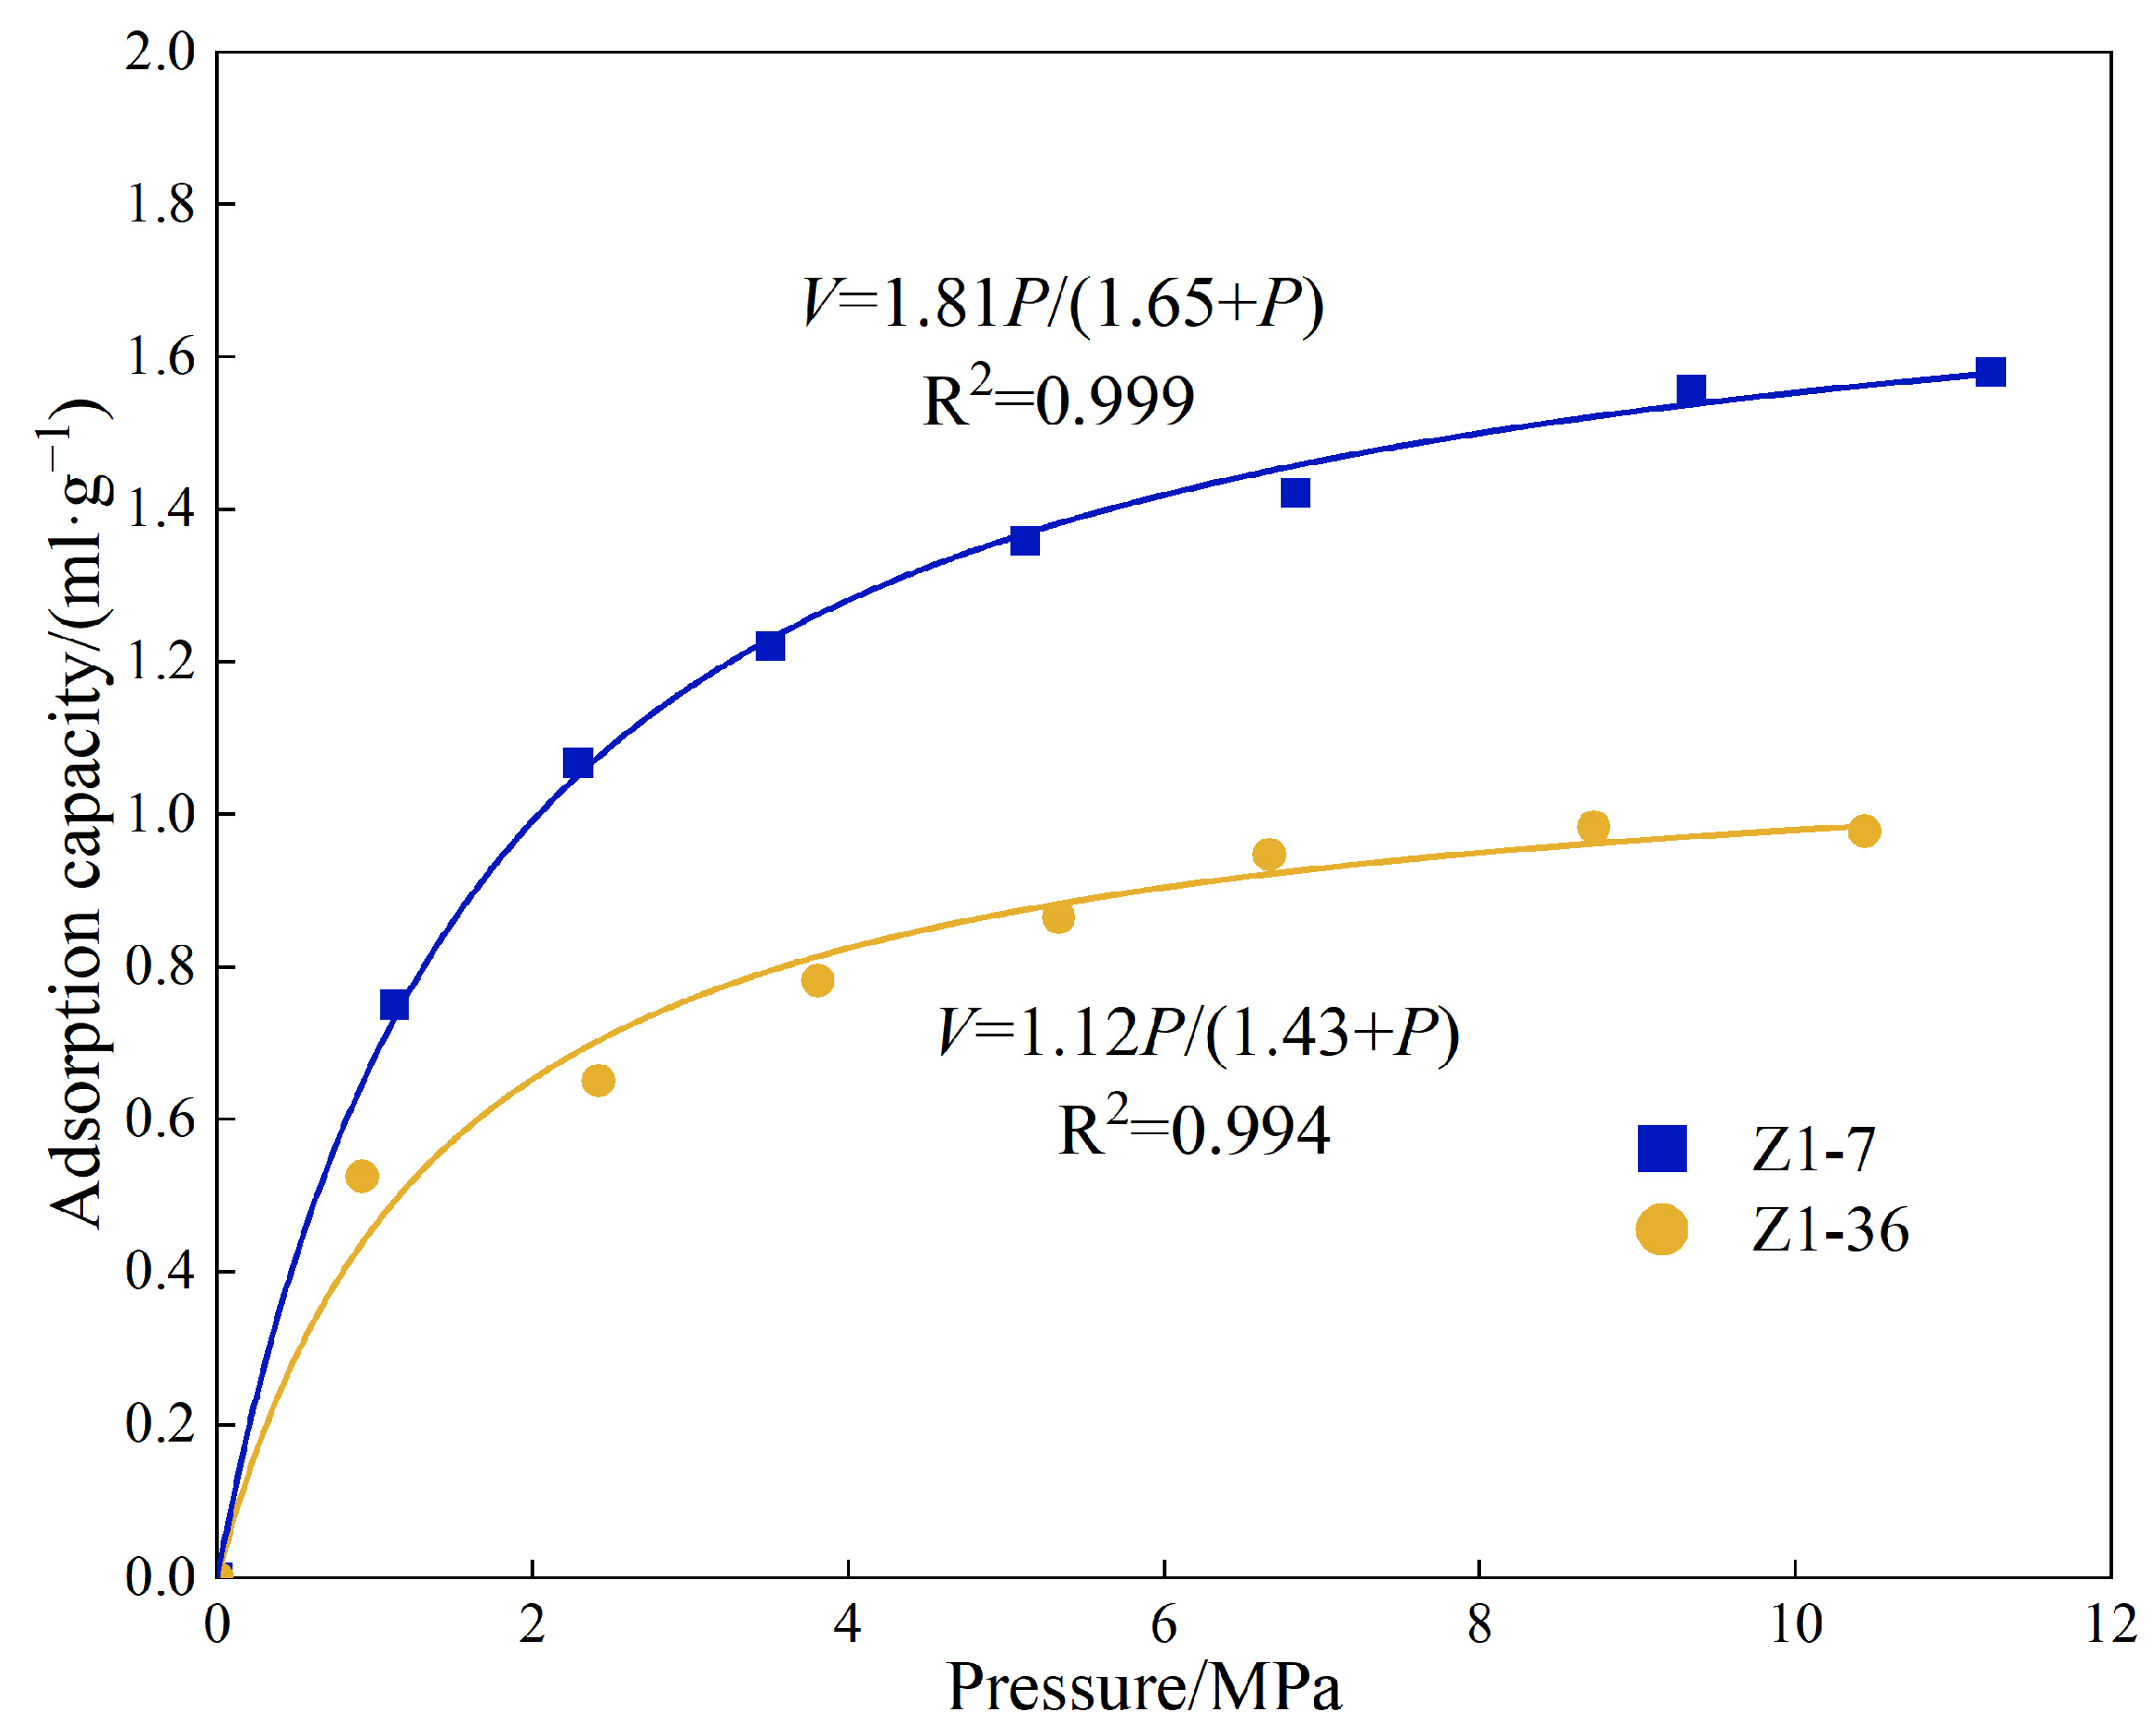
4.4.1. Isothermal Adsorption Characteristics

The gas adsorption capacity of shale reservoirs is a critical determinant of their storage potential. In this study, we conducted isothermal adsorption experiments on shale samples from the Shanxi formation (Z1-7) and the Taiyuan formation (Z1-36). The adsorbed gas quantities measured during the isothermal experiments reflect the excess adsorption capacity, excluding the volume occupied by the methane adsorbed phase. Therefore, the following formula is required for correction [57]
m e x = m a b s 1 ρ g ρ a
where m e x is the excess adsorption capacity, mmol/g; m a b s denotes the absolute adsorption capacity, mmol/g; ρ g indicates the density of gaseous CH4, g/cm3; and ρ a refers to the density of the adsorbed phase of CH4, which is taken as 0.423 g/cm3 in this study [58].
Figure 8 presents the isothermal adsorption curves after correcting the adsorption data, which were fitted to the Langmuir isothermal adsorption equation as follows
V = VLP/(P + PL)
where V is the adsorbed gas content, cm3/g; VL is the Langmuir volume, cm3/g; P is the pressure, MPa; and PL is the Langmuir pressure, MPa. VL reflects the maximum adsorption capacity of the shale samples, which is primarily dependent on the characteristics and properties of the samples, rather than being directly influenced by temperature and pressure. PL corresponds to the pressure at which the adsorbed gas content reaches half of the Langmuir volume.
The fitting results indicate that the Langmuir volume (VL) for sample Z1-7 is 1.81 cm3/g, and the Langmuir pressure (PL) is 1.65 MPa. For sample Z1-36, the VL is 1.12 cm3/g, with a PL of 1.43 MPa (Figure 8). The correlation coefficients suggest that the Langmuir model provides an excellent fit for the isothermal adsorption data. As illustrated in Figure 8, the adsorption quantities for both the Shanxi and Taiyuan samples increase gradually with rising pressure, followed by a deceleration in the rate of increase, eventually reaching saturation at a certain pressure where the adsorption levels off.

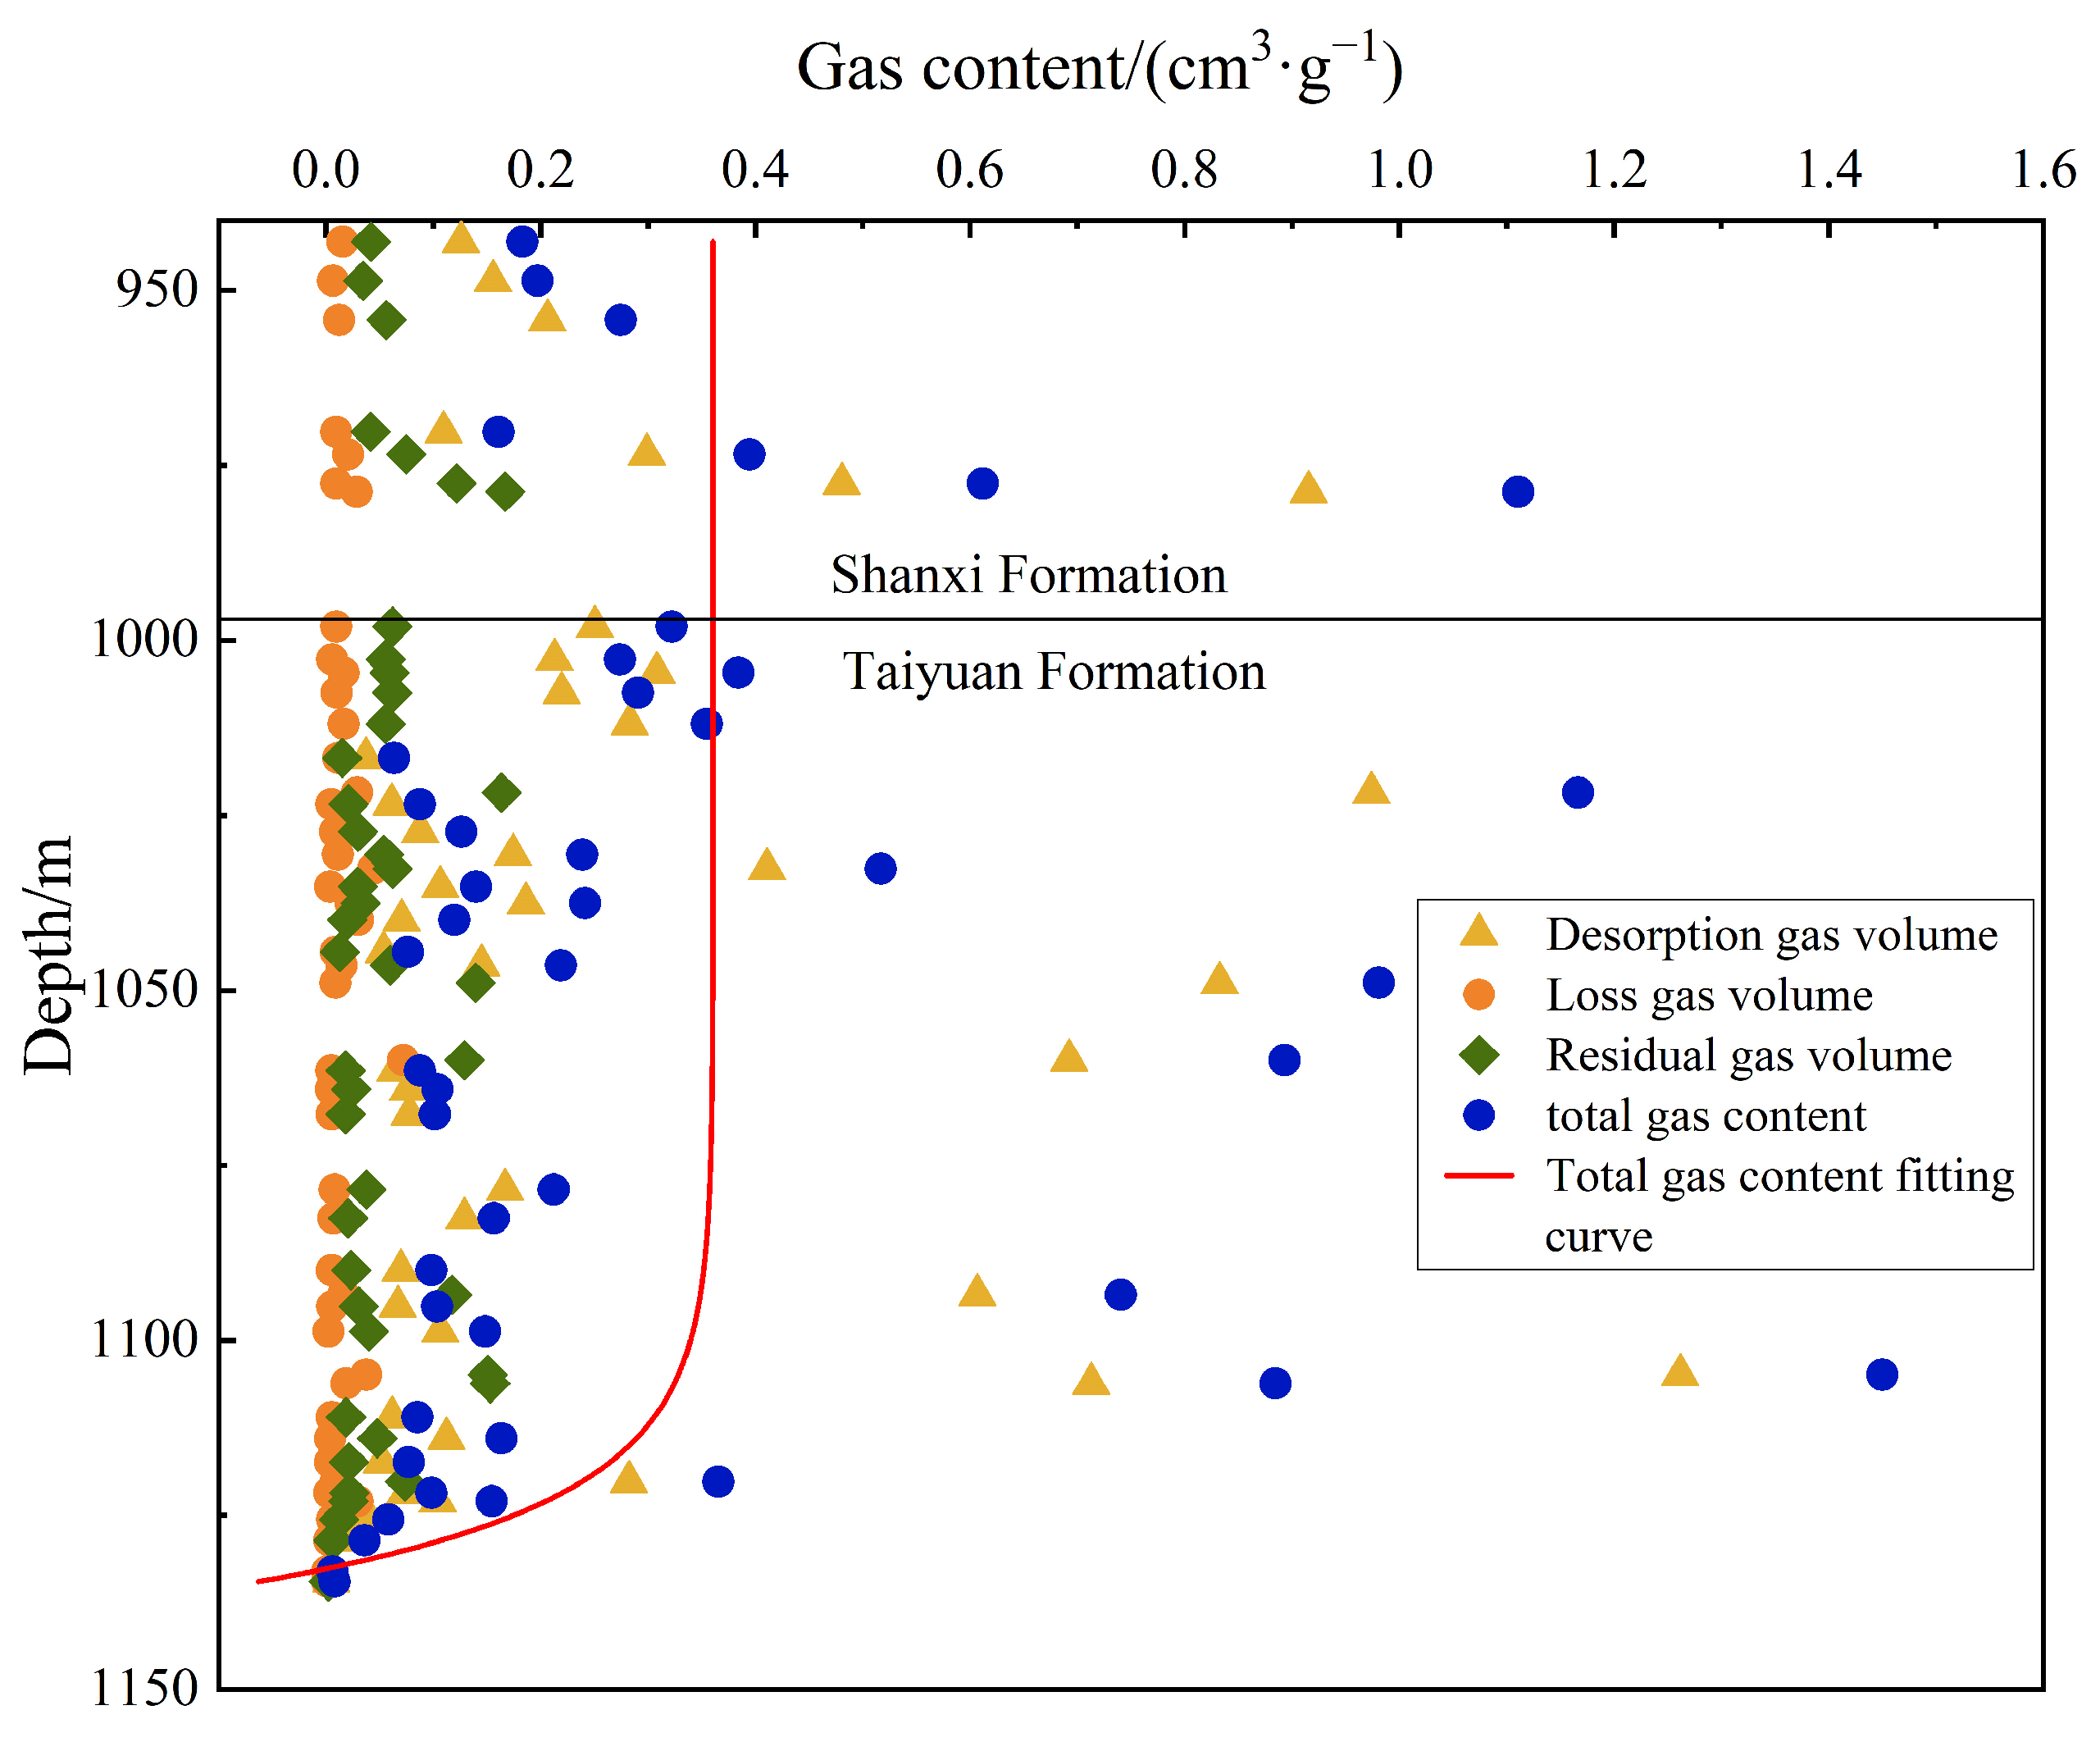
4.4.2. Measured Gas Content

The gas content tests conducted on 46 shale samples from Well Z1 revealed an average desorbed gas volume of 0.25 cm3/g, an average loss gas volume of 0.01 cm3/g, and an average residual gas volume of 0.05 cm3/g, resulting in a total average gas volume of 0.32 cm3/g. In terms of vertical distribution, the total gas volume of the Shanxi formation samples from Well Z1 (average 0.41 cm3/g) is significantly higher than that of the Taiyuan formation samples (average 0.30 cm3/g). Overall, the total gas content in the shale exhibits limited vertical variability across the studied stratigraphic column, with a pronounced reduction observed at the critical depth threshold of approximately 1100 m below the surface (Figure 9).

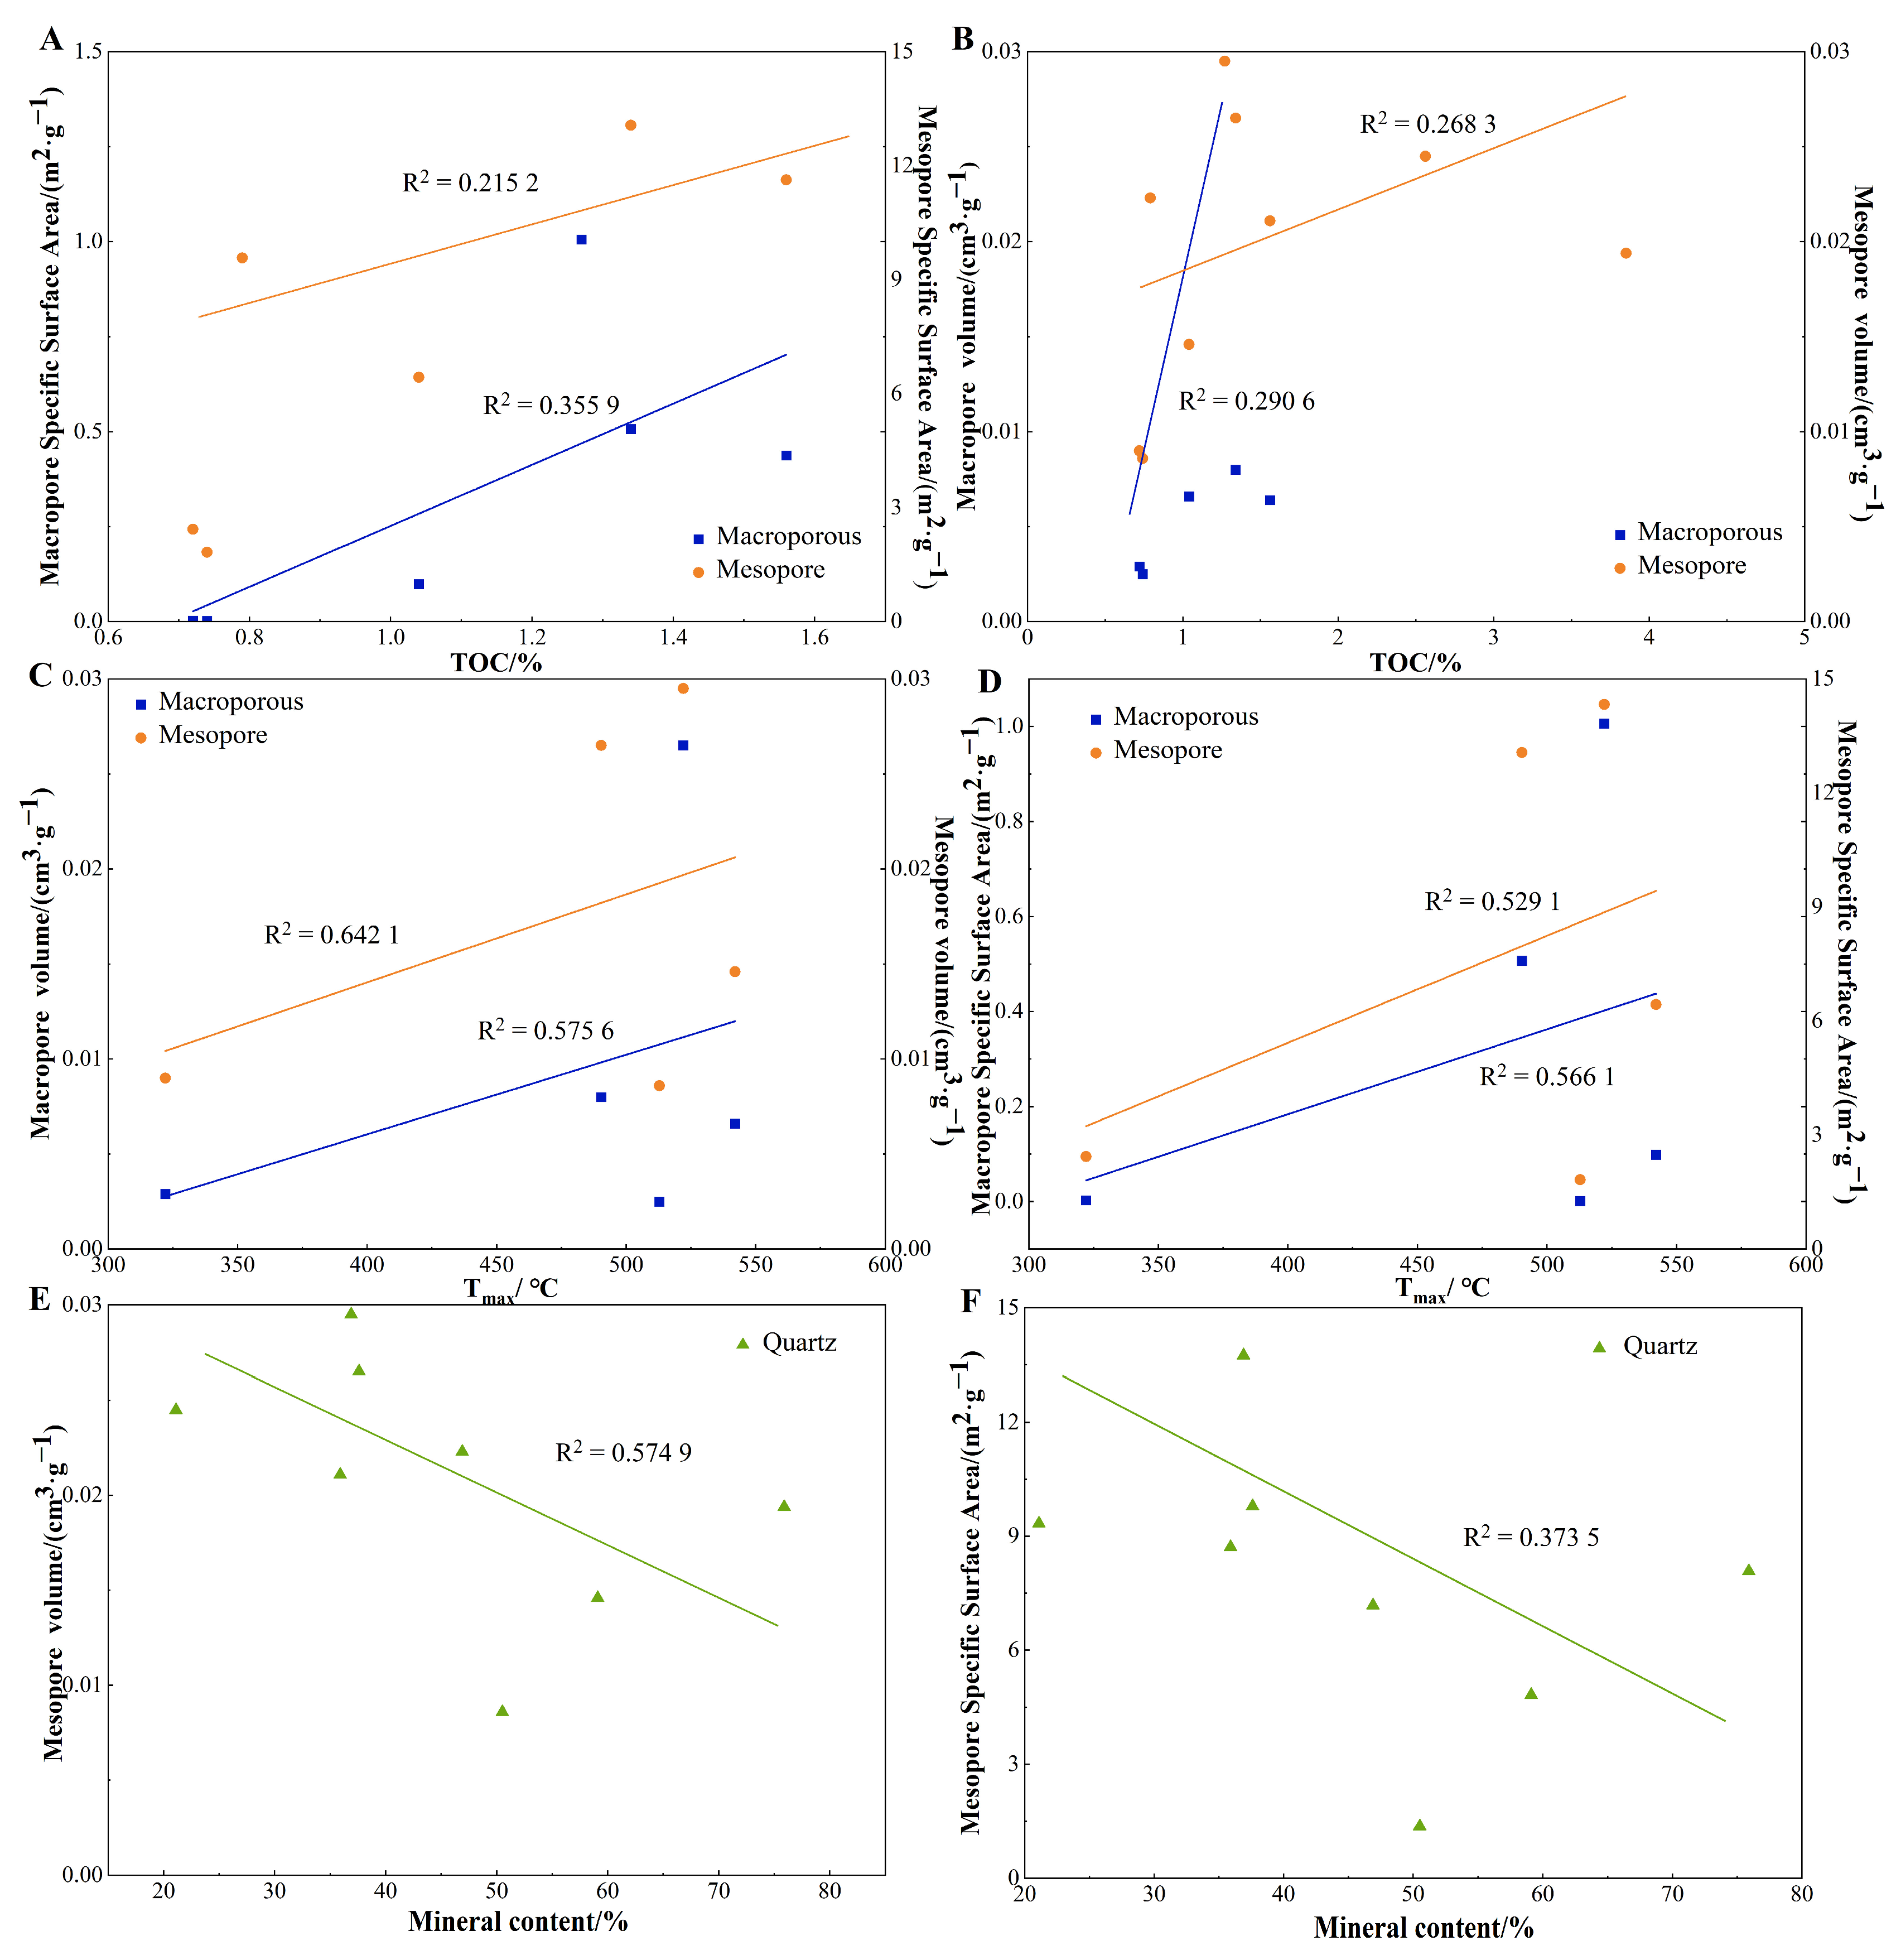
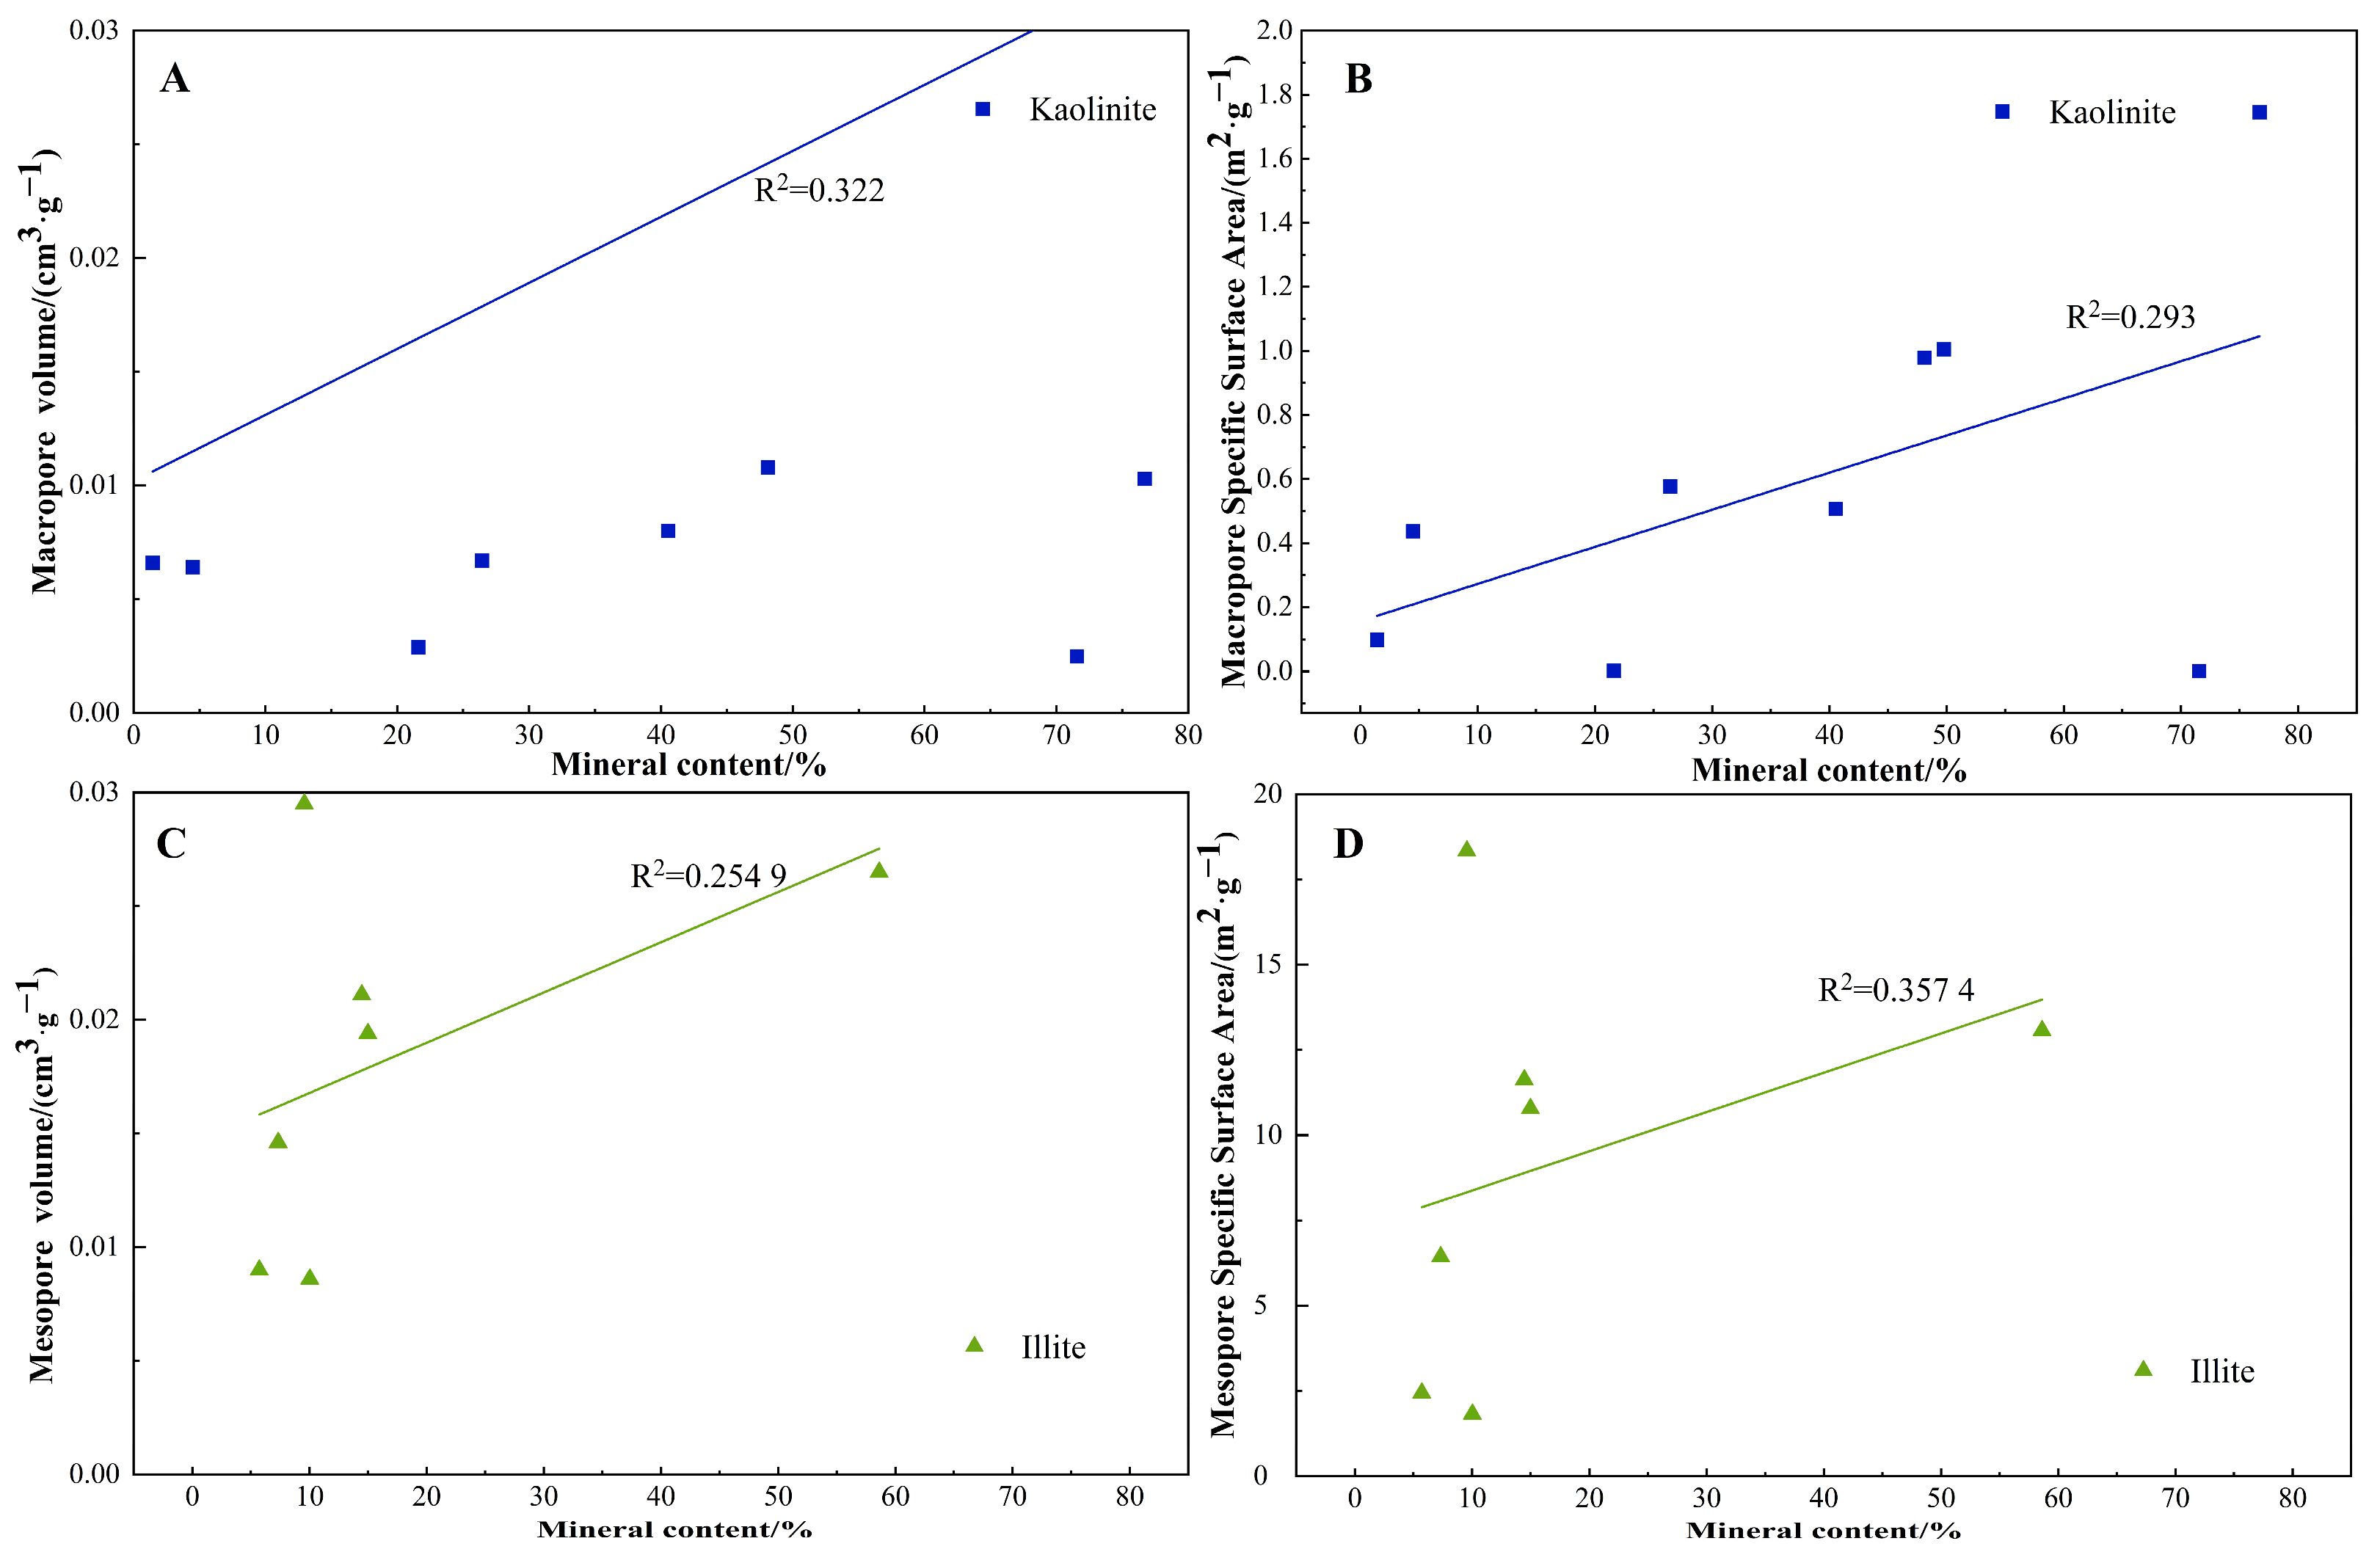
4.5. Factors Influencing the Reservoir’s Pore Structure

As previously discussed, shale predominantly comprises organic matter, clay minerals (such as kaolinite and illite), and quartz, and its pore characteristics are influenced by these compositional components. By integrating the parameters obtained from the high-pressure mercury intrusion and low-temperature nitrogen adsorption tests, we analyzed the correlation between the mineral composition of the shale from Well Z1 and the macropore and mesopore characteristics. The results indicate that the specific surface area and pore volume of both macropores and mesopores show a positive correlation with TOC (Figure 10A,B) and Tmax (Figure 10C,D). In contrast, the specific surface area and pore volume of mesopores exhibit a negative correlation with quartz content (Figure 10E,F), likely due to the occlusion of certain intragranular quartz pores by clay minerals or other detrital materials (Figure 10).
Table 1 indicates that the samples from Well Z1 are primarily composed of kaolinite and illite. Correlation analysis between macropores’ specific pore volume and specific surface area reveals a positive correlation with kaolinite (Figure 11A,B). This can be attributed to the layered silicate structure of kaolinite, where each structural unit layer consists of a layer of silica tetrahedra and a layer of aluminum octahedra, linked by hydrogen bonds. This architecture provides kaolinite with substantial interlayer porosity and microfractures between particles, thereby enriching the pore space within the shale and enhancing both the macropores’ specific pore volume and specific surface area [59]. Additionally, research by Liu et al. [60] indicates that the presence of illite can facilitate the development of micropores and mesopores in shale, establishing a positive correlation between illite content and mesopores’ volume and specific surface area (Figure 11C,D).

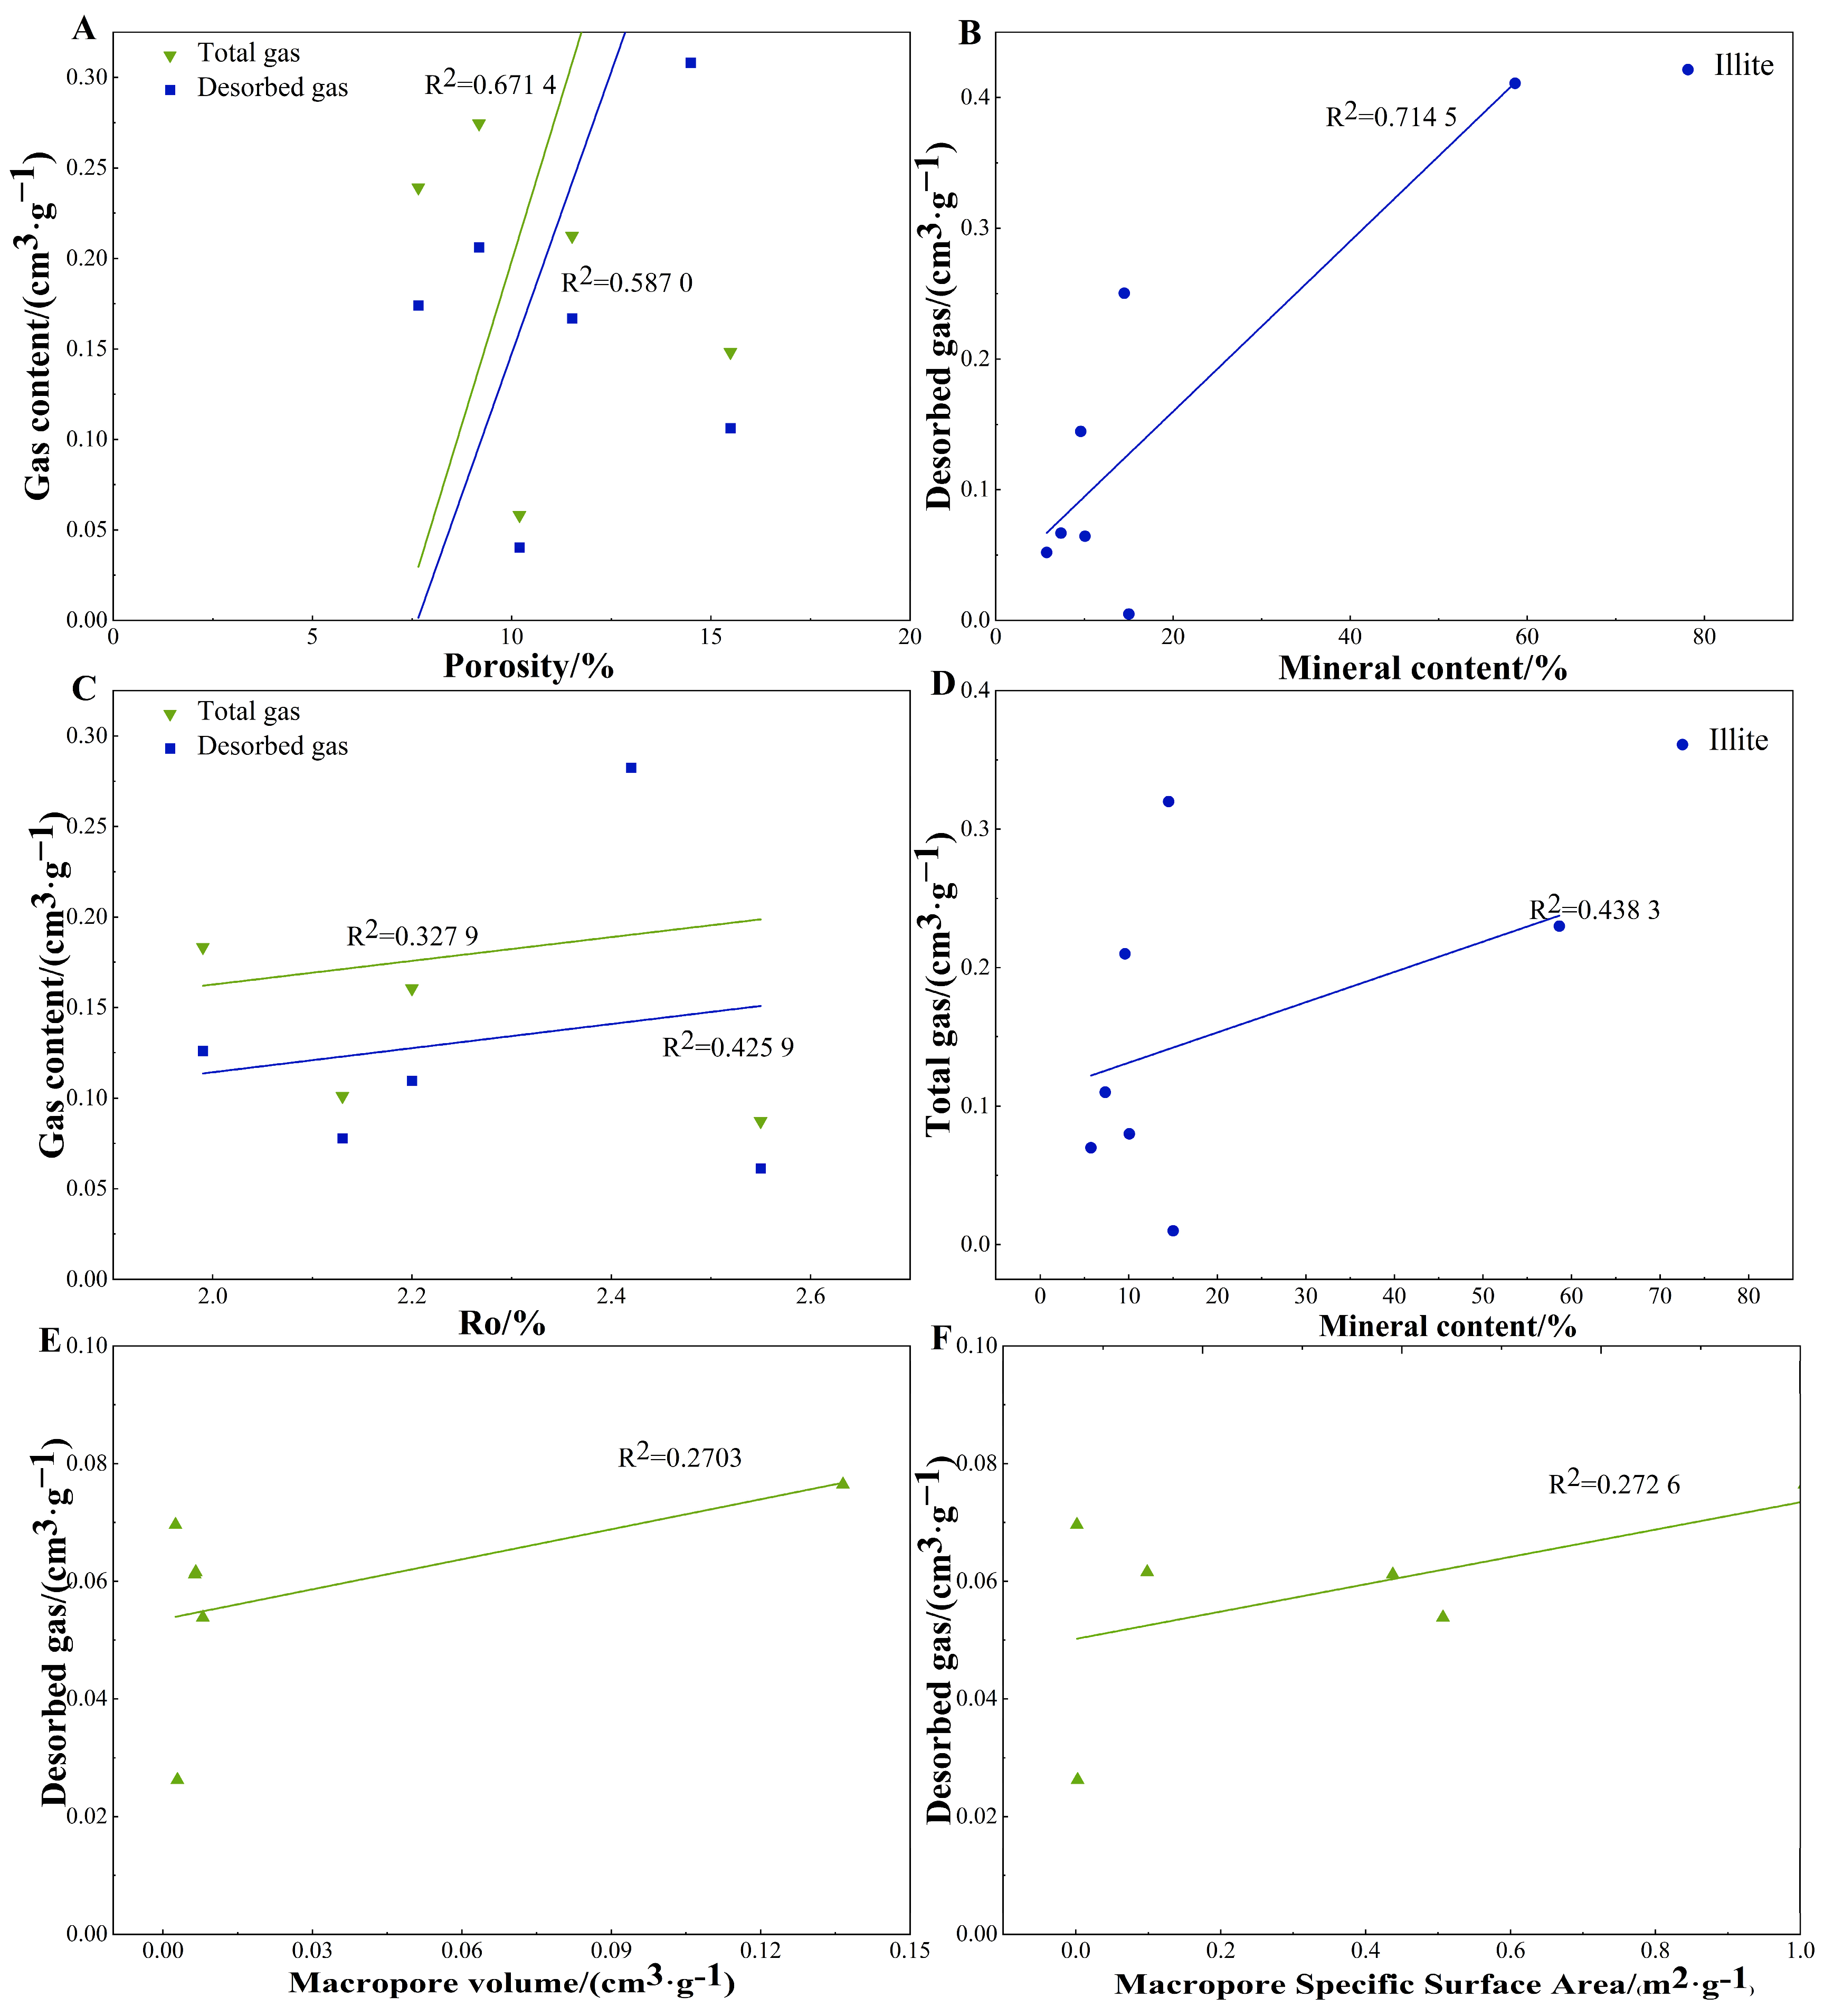
4.6. Factors Influencing Gas Content in Shale Reservoirs

The magnitude of gas content within a reservoir is a critical factor determining the feasibility of shale gas extraction. The various components constituting the shale (such as organic matter, quartz, and clay minerals) significantly influence the efficient extraction of shale gas. Through a correlation analysis between the primary constituents of the shale reservoir and the total gas content, as well as the desorbed gas volumes, we found that porosity exhibits a positive correlation with both desorbed gas and total gas volumes. This correlation can be attributed to the larger pore space associated with higher porosity, which accommodates a greater volume of free gas, thereby increasing the total gas content. Furthermore, an increase in porosity not only facilitates the storage of free gas but also provides additional space for the desorption of adsorbed gas. Consequently, enhanced porosity promotes the conversion of adsorbed gas into free gas, thereby increasing the desorbed gas volume [61]. Furthermore, the maturity of organic matter—represented by vitrinite reflectance (Ro)—also shows a positive correlation with both desorbed and total gas volumes, indicating the substantial role of organic thermal maturity in evaluating the gas content in shale reservoirs [62] (Figure 12A,C).
As mentioned earlier, the positive correlation between illite and mesopores’ volume and specific surface area arises from its ability to promote the development of micropores and mesopores within the shale. These pore structures provide additional space for gas adsorption and storage, thereby enhancing the gas-bearing capacity of the shale. Consequently, the desorbed gas and total gas volumes are positively correlated with illite content (Figure 12B,D). However, overall, there is a negligible correlation between total gas content and clay minerals (Figure 12D).
The desorbed gas in the samples shows a positive correlation with the specific pore volume and specific surface area of macropores, while its correlation with mesopores’ volume and specific surface area is relatively weak (Figure 12E,F). This observation is attributable to the fact that the gas within the shale primarily exists as free gas and adsorbed gas. The larger specific pore volume and surface area of macropores facilitate the storage of free gas, while adsorbed gas predominantly resides in micropores. As the specific surface area and pore volume of macropores increase, the amount of adsorbed gas also rises, leading to an overall increase in desorbed gas volumes.

5. Conclusions

In this study, the authors comprehensively examined the geochemical characteristics and pore structure of the shale from Well Z1, located in the mid-eastern Qinshui Basin, Shanxi Province, China. The focus was on the composition of organic matter and mineral phases, as well as the implications for gas content. The findings highlight the high organic richness and maturity of the shale, along with detailed correlations among total organic carbon (TOC), mineralogy, and pore structure parameters. The conclusions are as follows.
(1) The organic matter types in the Shanxi and Taiyuan formations from Well Z1 are classified as humic Type III. The organic matter richness is relatively high, with 67.40% of the samples exhibiting a TOC content greater than 1.00%, categorizing them as medium- to high-quality source rocks. The maturity of the organic matter is also elevated, with vitrinite reflectance (Ro) ranging from 1.99% to 2.55%, and Tmax values between 322.01 °C and 542.01 °C, indicating a stage of high maturity to over-maturity.
(2) The mineral composition of the shale is predominantly composed of kaolinite, illite, and quartz, with an average clay mineral content of 52.12% and an average quartz content of 45.53%. The brittleness index is moderate, with an average value of 42.34.
(3) Parameters derived via high-pressure mercury intrusion and low-temperature nitrogen adsorption reveal three primary pore types within the samples, each exhibiting varying degrees of connectivity. The peak ranges of different samples differ, with the majority of peaks falling within the macropore category; the contributions of pore volume and specific surface area are ranked as mesopores > macropores.
(4) Overall, the pore volume and specific surface area of the samples correlate positively with TOC and Tmax, while demonstrating a negative correlation with quartz content. Additionally, the specific pore volume and specific surface area of macropores show a positive correlation with kaolinite, while mesopore specific pore volume and specific surface area correlate positively with illite.
(5) The porosity exhibits a strong positive correlation with desorbed gas and total gas volume. Furthermore, desorbed gas correlates positively with Ro, the specific pore volume, and specific surface area of macropores. Illite content also shows a certain degree of positive correlation with the desorbed gas volume and total gas content in the samples.

Author Contributions

Writing—original draft and visualization, S.X.; conceptualization and methodology, M.W.; writing—reviewing and editing, J.G. and W.L.; investigation, X.Z. and W.Z.; data curation, W.Z. and Y.Z.; funding acquisition, M.W. All authors have read and agreed to the published version of the manuscript.

Funding

This research was supported by the National Key R&D Program of China (grant number 2023YFE0120500), the Postdoctoral Fellowship Program of CPSF (grant number GZC20233002), the National Natural Science Foundation of China (grant number 42402177, 42202190, 42302194) and the Fundamental Research Funds for the Central Universities (grant number 2024QN11069).

Data Availability Statement

The original contributions presented in this study are included in the article. Further inquiries can be directed to the corresponding authors.

Conflicts of Interest

The authors declare no conflicts of interest.

References

  1. Hill, R.J.; Jarvie, D.M.; Zumberge, J.; Henry, M.; Pollastro, R.M. Oil and gas geochemistry and petroleum systems of the Fort Worth Basin. AAPG Bull. 2007, 91, 445–473. [Google Scholar] [CrossRef]
  2. Ross, D.J.K.; Bustin, R.M. Erratum: Shale gas potential of the Lower Jurassic Gordondale Member, northeastern British Columbia, Canada. Bull. Can. Pet. Geol. 2007, 55, 51–75. [Google Scholar] [CrossRef]
  3. Zhao, J.; Fang, C.; Zhang, J.; Wang, L.; Zhang, X. Evaluation of China shale gas from the exploration and development of North America shale gas. J. Xi’an Shiyou Univ. (Nat. Sci. Ed.) 2011, 26, 1–7+110+117. [Google Scholar]
  4. Zhang, Y.L.; Li, D.H.; Guo, D.X. A review of fracturing technologies for shale gas reservoirs. Unconv. Oil Gas 2015, 2, 7. [Google Scholar]
  5. Ma, Y.Z.; Wang, M.; Li, J.M.; Zhao, J.G.; Jia, T.F.; Zhu, J.Q. Reservoir characteristics and gas-bearing properties of Upper Paleozoic coal-measure shale in Qinshui Basin. Nat. Gas Geosci. 2022, 33, 441–450. [Google Scholar]
  6. Zhang, J.C.; Tao, J.; Li, Z.; Wang, X.W.; Li, X.Q.; Jiang, S.L.; Wang, D.S.; Zhao, X.X. Prospects and exploration potential of deep shale gas resources in China. Nat. Gas Ind. 2021, 41, 14. [Google Scholar]
  7. Zou, C.N.; Zhao, Q.; Cong, L.Z.; Wang, H.Y.; Shi, Z.S.; Wu, J.; Pan, S.Q. Progress, potential, and prospects of shale gas development in China. Nat. Gas Ind. 2021, 41, 1–14. [Google Scholar]
  8. Dong, D.Z.; Qiu, Z.; Zhang, L.F.; Li, S.X.; Zhang, Q.; Li, X.T.; Zhang, S.R.; Liu, H.L.; Wang, Y.M. Advances in sedimentology of marine-continental transitional shale gas strata and new shale gas discoveries. Acta Sedimentol. Sin. 2021, 39, 29–45. [Google Scholar] [CrossRef]
  9. Guo, S.B.; Wang, Z.L.; Ma, X. Exploration prospects of Permian marine-continental transitional shale gas in key regions of China. Pet. Geol. Exp. 2021, 43, 377–385+414. [Google Scholar]
  10. Li, Y.Y.; Li, X.Q.; Zhang, X.Q.; Xiao, X.M.; Yu, Z.F.; Wang, B.Y. Reservoir characteristics of Upper Paleozoic coal-measure shale in Yangquan Block, Qinshui Basin. Coal Geol. Explor. 2021, 49, 142–151. [Google Scholar]
  11. Cai, G.Y.; Jiang, Y.Q.; Li, X.T.; Sun, S.S.; Fu, Y.H.; Gu, Y.F.; Wang, Z.L.; Ji, C.H. Differences in reservoir characteristics between marine-continental transitional and marine organic-rich shales. Acta Sedimentol. Sin. 2022, 40, 1030–1042. [Google Scholar] [CrossRef]
  12. Chen, Y.; Lin, W.; Chen, Y.; Guo, W.; Du, B.; Li, M.; Zhang, J. Depositional Model and Controlling Factors of High-Quality Shales of the Wufeng and Longmaxi Formations in Western Chongqing, Sichuan Basin, China. ACS Omega 2024, 9, 16411–16419. [Google Scholar] [CrossRef]
  13. Shen, Y.Y.; Wang, K.F.; Tang, S.H.; Zhang, S.H.; Xi, Z.D.; Yang, X.D. Geological modeling and “sweet spot” prediction of Permian coal-measure shale reservoirs in Yushe-Wuxiang Block, Qinshui Basin. Lithol. Reserv. 2024, 36, 98–108. [Google Scholar]
  14. Jia, T.F.; Wang, M.; Zhao, J.G. Characteristics and hydrocarbon generation potential of Carboniferous-Permian coal-measure shale gas reservoirs in Qinshui Basin: A case study of Well Y1 in Linfen City, Shanxi Province. Sci. Technol. Eng. 2020, 20, 2169–2178. [Google Scholar]
  15. Zhang, J.Q.; Li, X.Q.; Zhang, B.X.; Zhang, X.Q.; Yang, J.W.; Yu, Z.F. Pore characteristics and structure of Upper Paleozoic coal-measure shale gas reservoirs in Wuxiang Block, Qinshui Basin. Geoscience 2022, 36, 1551–1562. [Google Scholar] [CrossRef]
  16. Ma, Y.Z.; Wang, M.; Ma, R.Y.; Dai, X.G.; Xie, W.D.; Li, J.M. Microscopic characteristics and influencing factors of marine-continental transitional coal-measure shale gas reservoirs: A case study of Well Y2 in central-eastern Qinshui Basin. J. Henan Polytech. Univ. (Nat. Sci.) 2023, 42, 80–92. [Google Scholar] [CrossRef]
  17. Zhao, X.; Liu, J.G.; Zhang, S.K.; Ding, L.; Yin, Y.L.; Sun, J.; Jiang, Z. Reservoir characteristics and exploration recommendations for coal-measure mud shale in Wuxiang area, Qinshui Basin: A case study of Well ZK-42 in Shanxi. Coal Geol. China 2023, 35, 29–36. [Google Scholar]
  18. Wang, W.; Liu, Z.J.; Wei, F.B.; Li, F. Characteristics and controlling factors of Permian Dalong Formation shale reservoirs in northeastern Sichuan Basin. Oil Gas Geol. 2024, 45, 1355–1367. [Google Scholar]
  19. Nie, H.K.; Zhang, J.C.; Jin, Z.J.; Liu, Q.Y.; Li, S.J.; Dang, W.; Li, P.; Bian, R.K.; Sun, C.X.; Zhang, K.; et al. On the enrichment mechanism of marine shale gas: A case study of the Wufeng-Longmaxi Formations in Sichuan Basin. Acta Geol. Sin. 2024, 98, 975–991. [Google Scholar] [CrossRef]
  20. Zhong, Q.; Fu, X.H.; Zhang, M.; Zhang, Q.H.; Cheng, W.P. Evaluation of shale gas development potential in Carboniferous-Permian coal measures of Qinshui Coalfield. Nat. Gas Geosci. 2020, 31, 110–121. [Google Scholar]
  21. Yang, C.Y.; Hao, C.S.; Tian, Q.L.; Ji, C.J.; Shao, X.H.; Chang, H.Z. Study on physical properties of No.15 coal reservoir in northeastern Qinshui Coalfield. Coal Eng. 2019, 51, 11–17. [Google Scholar]
  22. Li, G.F.; Zhang, W.; Li, M.; Pan, J.N.; Liu, L.L.; Chen, Z.Y.; Zhang, Y.C.; Bai, Y. Gas-bearing properties and productivity controls of coal reservoirs in Sijiazhuang Block, Qinshui Basin. Coal Geol. Explor. 2022, 50, 146–155. [Google Scholar]
  23. Li, W.; Shen, J.; Li, C.; Wen, R.D.; Su, Y.F. Occurrence conditions and development sweet spot prediction of deep coalbed methane in Yushe-Wuxiang Block, Qinshui Basin. Pet. Geol. Oilfield Dev. Daqing 2023, 42, 9–19. [Google Scholar] [CrossRef]
  24. Ma, R.Y.; Zhang, J.; Wang, M.; Ma, W.P.; Zhao, J.G. Microscopic pore characteristics and gas-bearing properties of marine-continental transitional shale reservoirs in Qinshui Basin. J. Henan Polytech. Univ. (Nat. Sci.) 2021, 40, 66–77. [Google Scholar] [CrossRef]
  25. Zhang, X.Q. Characteristics of Upper Paleozoic Coal-Measure Shale Reservoirs and Shale Gas Occurrence Mechanism in Qinshui Basin. Ph.D. Thesis, China University of Mining and Technology, Beijing, China, 2023. [Google Scholar]
  26. Fang, H.; Sang, S.; Liu, S.; Liu, H.; Xu, H.; Huang, Y. Determination of representative elementary volume of digital coal based on fractal theory with X-ray CT data and its application in fractal permeability predication model. Front. Earth Sci. 2022, 16, 657–670. [Google Scholar] [CrossRef]
  27. Jiang, S.; Xu, Z.; Feng, Y.; Zhang, J.; Cai, D.; Chen, L.; Wu, Y.; Zhou, D.; Bao, S.; Long, S. Geologic characteristics of hydrocarbon-bearing marine, transitional and lacustrine shales in China. J. Asian Earth Sci. 2016, 115, 404–418. [Google Scholar] [CrossRef]
  28. Lin, Z.; Liu, K.; Wei, Y. Tectonic Evolution Characteristics of Carboniferous-Permian Coal Measures in the Central-Northern Qinshui Basin. Coal Geol. Explor. 2020, 48, 85–91. [Google Scholar]
  29. Zhang, M.T.; Fu, W.; Jiang, B.R.; Gao, W.; Deng, E.D. Reservoir characteristics and exploration potential evaluation of Upper Permian Longtan Formation coal-measure shale gas in northern Guizhou Coalfield. Coal Sci. Technol. 2022, 50, 133–139. [Google Scholar] [CrossRef]
  30. Xie, W.; Gan, H.; Chen, C.; Vandeginste, V.; Chen, S.; Wang, M.; Wang, J.; Yu, Z. A model for superimposed coalbed methane, shale gas and tight sandstone reservoirs, Taiyuan Formation, Yushe-Wuxiang Block, eastern Qinshui Basin. Sci. Rep. 2022, 12, 11455. [Google Scholar] [CrossRef]
  31. Zhao, K.D.; Fu, X.H.; Zhang, M.; Cheng, W.P.; Qu, L.Z. Organic geochemical characteristics and hydrocarbon generation potential evaluation of coal-measure mud shale. Coal Sci. Technol. 2019, 47, 182–188. [Google Scholar] [CrossRef]
  32. GB/T 19145-2022; Determination for Total Organic Carbon in Sedimentary Rock. Standardization Administration of China: Beijing, China, 2022.
  33. GB/T 18602-2012; Rock Pyrolysis Analysis. Standardization Administration of China: Beijing, China, 2012.
  34. SY/T 5125-2014; Method for Identification and Classification of Kerogen Macerals Using Transmitted Light and Fluorescence Microscopy. National Energy Administration of China: Beijing, China, 1996.
  35. SY/T 5124-2012; Method for Determining Vitrinite Reflectance in Sedimentary Rocks. National Energy Administration of China: Beijing, China, 1995.
  36. SY/T 5163-2018; Methods for X-ray Diffraction Analysis of Clay Minerals and Common Non-Clay Minerals in Sedimentary Rocks. National Energy Administration of China: Beijing, China, 2010.
  37. SY/T 5162-2021; Analytical Method for Rock Samples Using Scanning Electron Microscopy. National Energy Administration of China: Beijing, China, 1997.
  38. SY/T 6189-2018; Energy Spectrum Quantitative Analysis Method for Rock and Mineral. National Energy Administration of China: Beijing, China, 1996.
  39. GB/T 21650.1-2008; Pore Size Distribution and Porosity of Solid Materials by Mercury Porosimetry and Gas Adsorption—Part 1: Mercury Porosimetry. Standardization Administration of China: Beijing, China, 2008.
  40. GB/T 19560-2008; Experimental Method of High-Pressure Isothermal Adsorption to Coal. Standardization Administration of China: Beijing, China, 2008.
  41. GB/T 19559-2021; Method of Determining Coalbed Methane Content. Standardization Administration of China: Beijing, China, 2021.
  42. Chen, J.; Xiao, X.M. Mineral Composition and Brittleness Analysis of Three Sets of Organic-Rich Shale in the South China Paleozoic. J. China Coal Soc. 2013, 38, 822–826. [Google Scholar] [CrossRef]
  43. Shi, C.; Lin, B.T. Research on fracture propagation laws and influencing factors in shale reservoirs. Pet. Sci. Bull. 2021, 6, 92–113. [Google Scholar]
  44. Rickman, R.; Mullen, M.; Petre, E.; Grieser, B.; Kundert, D. A Practical Use of Shale Petrophysics for Stimulation Design Optimization: All Shale Plays Are Not Clones of the Barnett Shale. In Proceedings of the SPE Annual Technical Conference and Exhibition, Denver, CO, USA, 21–24 September 2008. [Google Scholar] [CrossRef]
  45. Yao, J.T.; Zhou, D.; Liu, R.H.; Liu, S.B. Geochemical characteristics and sedimentary environment of Middle-Lower Jurassic source rocks in the right bank of Amu Darya. Geol. Sci. 2024, 59, 352–364. [Google Scholar]
  46. Liu, J.N.; Zhu, Y.M.; Liu, Y.; Tang, X. Study on reservoir characteristics of marine-continental transitional shale: A case study of Qinshui Basin. Coal Geol. Explor. 2015, 43, 23–28. [Google Scholar]
  47. Cui, B.F.; Kong, L.H.; Chen, J.; Zhang, D.Y.; Liang, H.; Li, S.K.; Guo, W. Characteristics and hydrocarbon generation potential analysis of Carboniferous Shiqiantan Formation source rocks in Shiqiantan Sag, eastern Junggar Basin. Northwestern Geol. 2024, 57, 34–45. [Google Scholar]
  48. Yang, S.; Horsfield, B. Critical review of the uncertainty of Tmax in revealing the thermal maturity of organic matter in sedimentary rocks—ScienceDirect. Int. J. Coal Geol. 2020, 225, 103500. [Google Scholar] [CrossRef]
  49. Cao, T.-T.; Deng, M.; Xiao, J.-Y.; Liu, H.; Pan, A.-Y.; Cao, Q.-G. Reservoir characteristics and gas occurrence mechanisms in marine-continental transitional shale: Insights from comparison with marine shale reservoirs. Nat. Gas Geosci. 2023, 34, 122–139. [Google Scholar]
  50. Loucks, R.G.; Reed, R.M.; Ruppel, S.C.; Hammes, U. Spectrum of pore types and networks in mudrocks and a descriptive classification for matrix-related mudrock pores. AAPG Bull. 2012, 96, 1071–1098. [Google Scholar] [CrossRef]
  51. Mandelbrot, B.B. Stochastic models for the Earth’s relief, the shape and the fractal dimension of the coastlines, and the number-area rule for islands. Proc. Natl. Acad. Sci. USA 1975, 72, 3825–3828. [Google Scholar] [CrossRef] [PubMed]
  52. Pan, J.; Wang, K.; Hou, Q.; Niu, Q.; Wang, H.; Ji, Z. Micro-pores and fractures of coals analysed by field emission scanning electron microscopy and fractal theory. Fuel 2016, 164, 277–285. [Google Scholar] [CrossRef]
  53. Wancai, N.; Tingshan, Z.; Mingwei, W.; Wen, W.U.; Xiucheng, T. Fractal Characteristics and Interfering Factors of Microscopic Pores in Marine-Continental Transitional Coal Shale: A case study of the Taiyuan Formation in the northern Qinshui Basin. Acta Sedimentol. Sin. 2024, 42, 1047. [Google Scholar] [CrossRef]
  54. Yao, Y.B.; Liu, D.M. Fine Quantitative Characterization and Comprehensive Evaluation Model of Coal Reservoirs; Science Press: Beijing, China, 2013. [Google Scholar]
  55. Tang, S.-L.; Tang, D.-Z.; Yang, J.-S.; Deng, Z.; Li, S.; Chen, S.-D.; Feng, P.; Huang, C.; Li, Z.-W. Pore structure characteristics and gas storage potential of deep coal reservoirs in Daning-Jixian Block, Ordos Basin. Acta Pet. Sin. 2023, 44, 1854–1866+1902. [Google Scholar]
  56. IUPAC. Physical chemistry division commission on colloid and surface chemistry, subcommittee on characterization of porous solids: Recommendations for the characterization of porous solids (Technical Report). Pure Appl. Chem. 1994, 66, 1739–1758. [Google Scholar] [CrossRef]
  57. Dai, X.; Wei, C.; Wang, M.; Ma, R.; Song, Y.; Zhang, J.; Wang, X.; Shi, X.; Vandeginste, V. Interaction mechanism of supercritical CO2 with shales and a new quantitative storage capacity evaluation method. Energy. 2023, 264, 126424. [Google Scholar] [CrossRef]
  58. Zhou, J.P.; Fan, M.L.; Xian, X.F.; Yang, K.; Lu, Z.H. Shale gas adsorption correction and influencing factors of adsorption capacity. Coal Sci. Technol. 2022, 50, 154–162. [Google Scholar] [CrossRef]
  59. Zhang, Y.Y.; Fang, X.H.; Zeng, F.G. Molecular simulation of methane adsorption in kaolinite slits. Multipurp. Util. Miner. Resour. 2019, 40, 130–134+113. [Google Scholar]
  60. Liu, Z.H. Study on Characteristics of Clay Minerals in Shale Reservoirs and Their Influence on Porosity. Master’s Thesis, China University of Mining and Technology, Xuzhou, China, 2018. [Google Scholar]
  61. Li, Y.; Gao, S.; Wu, P.; Xu, L.-F.; Ma, L.-T.; Hu, W.-Q.; Yang, J.-H. Evaluation and correction of prediction models for free gas content in deep coalbed methane reservoirs: A case study of deep coal seams in the eastern margin of Ordos Basin. Acta Pet. Sin. 2023, 44, 1892–1902. [Google Scholar]
  62. Dong, D.Z.; Wang, Y.M.; Huang, X.N.; Zhang, C.C.; Guan, Q.Z.; Huang, J.L.; Wang, S.F.; Li, X.J. Geological characteristics, resource assessment methods and key parameters of shale gas in China. Nat. Gas Geosci. 2016, 27, 1583–1601. [Google Scholar]
Figure 1. Study area’s location and core histograms of the sampling sites. (A) Location map of the study area. (B) Comprehensive stratigraphic columnar diagram.
Energies 18 01120 g001
Figure 2. Well Z1’s shale mineral composition of the Taiyuan and Shanxi formations.
Energies 18 01120 g002
Figure 3. Distribution of Ro and Tmax in Well Z1 [49]. (A) Distribution of Ro. (B) Distribution of Tmax.
Energies 18 01120 g003
Figure 4. Characterization of shale reservoir pore structures in Well Z1. (A) Elliptical organic matter pores. (B) Elongated organic matter pores. (C) Intraparticle pores in quartz. (D) Pyrite moldic pores. (E) Intercrystalline pores in pyrite. (F) Interlayer pores in clay minerals. (G) Endogenous microfractures within organic matter. (H) Interlayer microfractures in clay minerals. (I) Endogenous microfractures in brittle minerals.
Energies 18 01120 g004
Figure 5. Double logarithm curve of the pore length axis and area of different pore types in SEM images of the shales. (A) Quartz intragranular pores. (B) Pyrite casting moldic pores. (C) Intergranular pores of clay minerals. (D) Detrital organic matter pores.
Energies 18 01120 g005
Figure 6. Capillary pressure curves of Well Z1. (A) Z1-27. (B) Z1-2. (C) Z1-22.
Energies 18 01120 g006
Figure 7. Contribution rate of pore structure parameters with different pore sizes. (A) Pore volume contribution. (B) Specific surface area contribution.
Energies 18 01120 g007
Figure 8. Isothermal adsorption curves.
Energies 18 01120 g008
Figure 9. Vertical variation of gas content in Well Z1.
Energies 18 01120 g009
Figure 10. Relationships between different parameters and macropores and mesopores in the shale of Well Z1. (A) Specific surface area of macropores and mesopores versus TOC content. (B) Pore volume of macropores and mesopores versus TOC content. (C) Pore volume of macropores and mesopores versus Tmax. (D) Specific surface area of macropores and mesopores versus Tmax. (E) Mesopore volume versus mineral composition. (F) Mesopore specific surface area versus mineral composition.
Energies 18 01120 g010
Figure 11. Relationships between clay mineral and pore volume and specific surface area. (A) Correlation between macropore volume and kaolinite. (B) Correlation between macropore specific surface area and kaolinite. (C) Correlation between mesopore volume and illite. (D) Correlation between mesopore specific surface area and illite.
Energies 18 01120 g011
Figure 12. Effect of different components of shale on gas content. (A) Correlation between gas content and porosity. (B) Correlation between desorbed Gas and illite content. (C) Correlation between gas content and Ro. (D) Correlation between total gas content and illite. (E) Correlation between desorbed gas content and macropore volume. (F) Correlation between desorbed gas content and macropore specific surface area.
Energies 18 01120 g012
Table 1. Mineral composition test distribution.
Sample IDLithologyClay Mineral Content (%)Whole Rock Composition (%)
KaoliniteChloriteIlliteTotal ClayQuartzSodium FeldsparDolomiteLimoniteLaumontite
Z1-2Sandy mudstone50.1015.1234.8343.0946.89\\\10.02
Z1-8Sandy mudstone17.5312.6669.818.1975.9215.9\\\
Z1-12Mudstone90.72\9.3278.8921.11\\\\
Z1-18Mudstone83.21\16.8259.8135.87\\\4.32
Z1-23Mudstone80.93\19.0750.1137.58\\\12.31
Z1-26Mudstone7.10\92.8663.0936.91\\\\
Z1-33Mudstone100.00\\48.0750.52\1.41\\
Z1-39Sandstone64.62\35.4140.8859.12\\\\
Z1-46Sandy mudstone100.00\\76.67\\\23.33-
Table 2. Analysis of kerogen types and vitrinite reflectance.
Sample IDTIRo (%)Kerogen Types
Z1-1−751.99III
Z1-4−882.2III
Z1-15−832.55III
Z1-28−732.13III
Z1-40−792.42III
Table 3. Rock-Eval pyrolysis parameters and TOC analysis.
Sample StratigraphySample IDLithologyS1 + S2 (mg/g)Tmax (°C)TOC (%)
Shanxi formationZ1-1Mudstone0.65502.031.43
Z1-5Mudstone0.68524.501.75
Z1-8Sandy mudstone0.31514.090.45
Taiyuan formationZ1-18Mudstone3.61490.3416.22
Z1-23Sandy mudstone0.22522.010.96
Z1-26Mudstone1.1512.843.03
Z1-33Sandy mudstone0.29542.011.42
Z1-39Sandy mudstone0.14322.010.47
Table 4. Pore parameters and fractal dimensions extracted from the SEM images.
Pore TypeAverage Pore Area
(nm2)
Average Pore Major Axis
(nm)
Average Pore Diameter
(nm)
DDetermination Coefficient (R2)
Quartz intragranular pore58,473.37248.17192.452.460.97
Pyrite casting moldic pole287,288.23679.15588.632.550.96
Intergranular pores of clay minerals83.72325.72266.672.390.95
Detrital organic matter pores43,442.58297.16356.582.510.95
Table 5. Pore structure parameters of shale samples.
SamplePore Volume (cm3/g)Specific Surface Area
(m2/g)
MacroporousMesoporousTotalMacroporousMesoporousTotal
Z1-180.64 × 10−20.02 0.28 × 10⁻¹ 0.44 11.63 12.06
Z1-230.80 × 10−20.27 × 10−1 0.35 × 10⁻¹ 0.51 13.07 13.57
Z1-260.140.03 0.17 1.00 18.33 19.34
Z1-330.25 × 10−20.86 × 10−2 0.01 0.15 × 10⁻² 1.82 1.83
Z1-390.66 × 10−20.15 × 10−10.02 0.99 × 10⁻¹ 6.43 6.53
Z1-460.29 × 10−20.90 × 10−2 0.12 × 10⁻¹ 0.26 × 10⁻² 2.44 2.44
Disclaimer/Publisher’s Note: The statements, opinions and data contained in all publications are solely those of the individual author(s) and contributor(s) and not of MDPI and/or the editor(s). MDPI and/or the editor(s) disclaim responsibility for any injury to people or property resulting from any ideas, methods, instructions or products referred to in the content.

