1. Introduction
To achieve the strategic goal of “peaking carbon dioxide emissions by 2030 and achieving carbon neutrality by 2060”, China is committed to building a power system dominated by renewable energy sources [
1]. As a result, an increasing number of power electronic-interfaced renewable energy sources will be integrated into the grid. However, this transition significantly reduces system inertia and alters the system’s transient frequency characteristics during power disturbances. Consequently, control and protection mechanisms, such as under-frequency load shedding, may be triggered during power imbalances, posing significant challenges to the safe and stable operation of the power system [
2,
3,
4].
To address the issue of declining inertia in renewable-energy-dominated power systems, virtual synchronous generator (VSG) technology has been adopted for renewable energy sources [
5,
6,
7]. Renewable energy systems, such as wind power and photovoltaics, equipped with VSG controllers, can emulate the power frequency regulation characteristics of synchronous generators (SGs). This emulation enhances the equivalent inertia of the system, thereby improving transient frequency stability and promoting the safe and reliable operation of the power grid [
8].
Developing a mathematical model of the VSG is a prerequisite for analyzing its transient frequency characteristics [
9,
10,
11]. This modeling effort provides a foundation for understanding the transient behavior of VSGs, informs the optimization of their control strategies, and supports efforts to maintain system frequency stability during disturbances.
Numerous studies have focused on VSG modeling. For instance, an energy function model was proposed in [
12] to analyze the influence of control parameters on VSG large-signal stability, in which the energy function models of the grid-forming and grid-following controlled converters are established and compared in detail, coming to the conclusion that the grid-following converter will lose stability by exhibiting a varying damping coefficient transient. An electromechanical model was introduced in [
13] to address dynamic analysis issues, while a unified power coupling dynamic model was developed in [
14] to facilitate quantitative analysis of VSG power-coupling characteristics. Additionally, [
15] reviewed VSG modeling methods based on synchronous machine models of varying orders. Small-signal models [
16,
17,
18,
19,
20], linearized models [
21], and unified state–space models [
22] have also been established to examine the stability and dynamic characteristics of VSGs under different operational modes. It is found that the impedance of VSGs can be capacitive below the fundamental frequency, and instability can be avoided if the capacitive characteristics of VSGs are weakened by reshaping their GSC impedance or by enhancing the dc-link dynamics. Despite these advancements, limited attention has been paid to transient frequency modeling of VSGs. The existing models, such as energy function, electromechanical, power-coupling dynamic, small-signal, linearized, and state–space models, are inadequate for analyzing transient frequency characteristics.
To address this gap, this paper establishes a transient frequency mathematical model for VSGs based on their control strategies. The model incorporates the inertial response, primary frequency regulation, and secondary frequency regulation of VSGs, with distinct mathematical expressions derived for different operational stages. A MATLAB/Simulink simulation (version R2021b) model is also developed to validate the accuracy of the proposed transient frequency model. Furthermore, the effects of key parameters, including the VSG inertia constant, primary frequency regulation coefficient, and secondary frequency regulation coefficient, on transient frequency are analyzed. This analysis provides insights into VSG transient frequency characteristics and guides the parameter optimization design for VSGs under various conditions.
The existing literature primarily focuses on small-signal models, linearized models, and state–space models of VSGs. This paper proposes a transient frequency mathematical model that comprehensively considers the inertial response, primary frequency regulation, and secondary frequency regulation of VSGs. Compared to the existing models, our model provides a more thorough analysis of the transient frequency characteristics of VSGs across different operational stages and offers new theoretical insights for optimizing VSG control strategies.
The rest of this paper is organized as follows:
Section 2 introduces the typical transient frequency response of renewable-energy-dominated power systems.
Section 3 presents the development of the transient frequency mathematical model of VSGs.
Section 4 validates the proposed model through simulations, while
Section 5 analyzes the transient frequency characteristics of VSGs. Finally, conclusions are drawn in
Section 6.
2. Power System Dominated by Renewable Energy
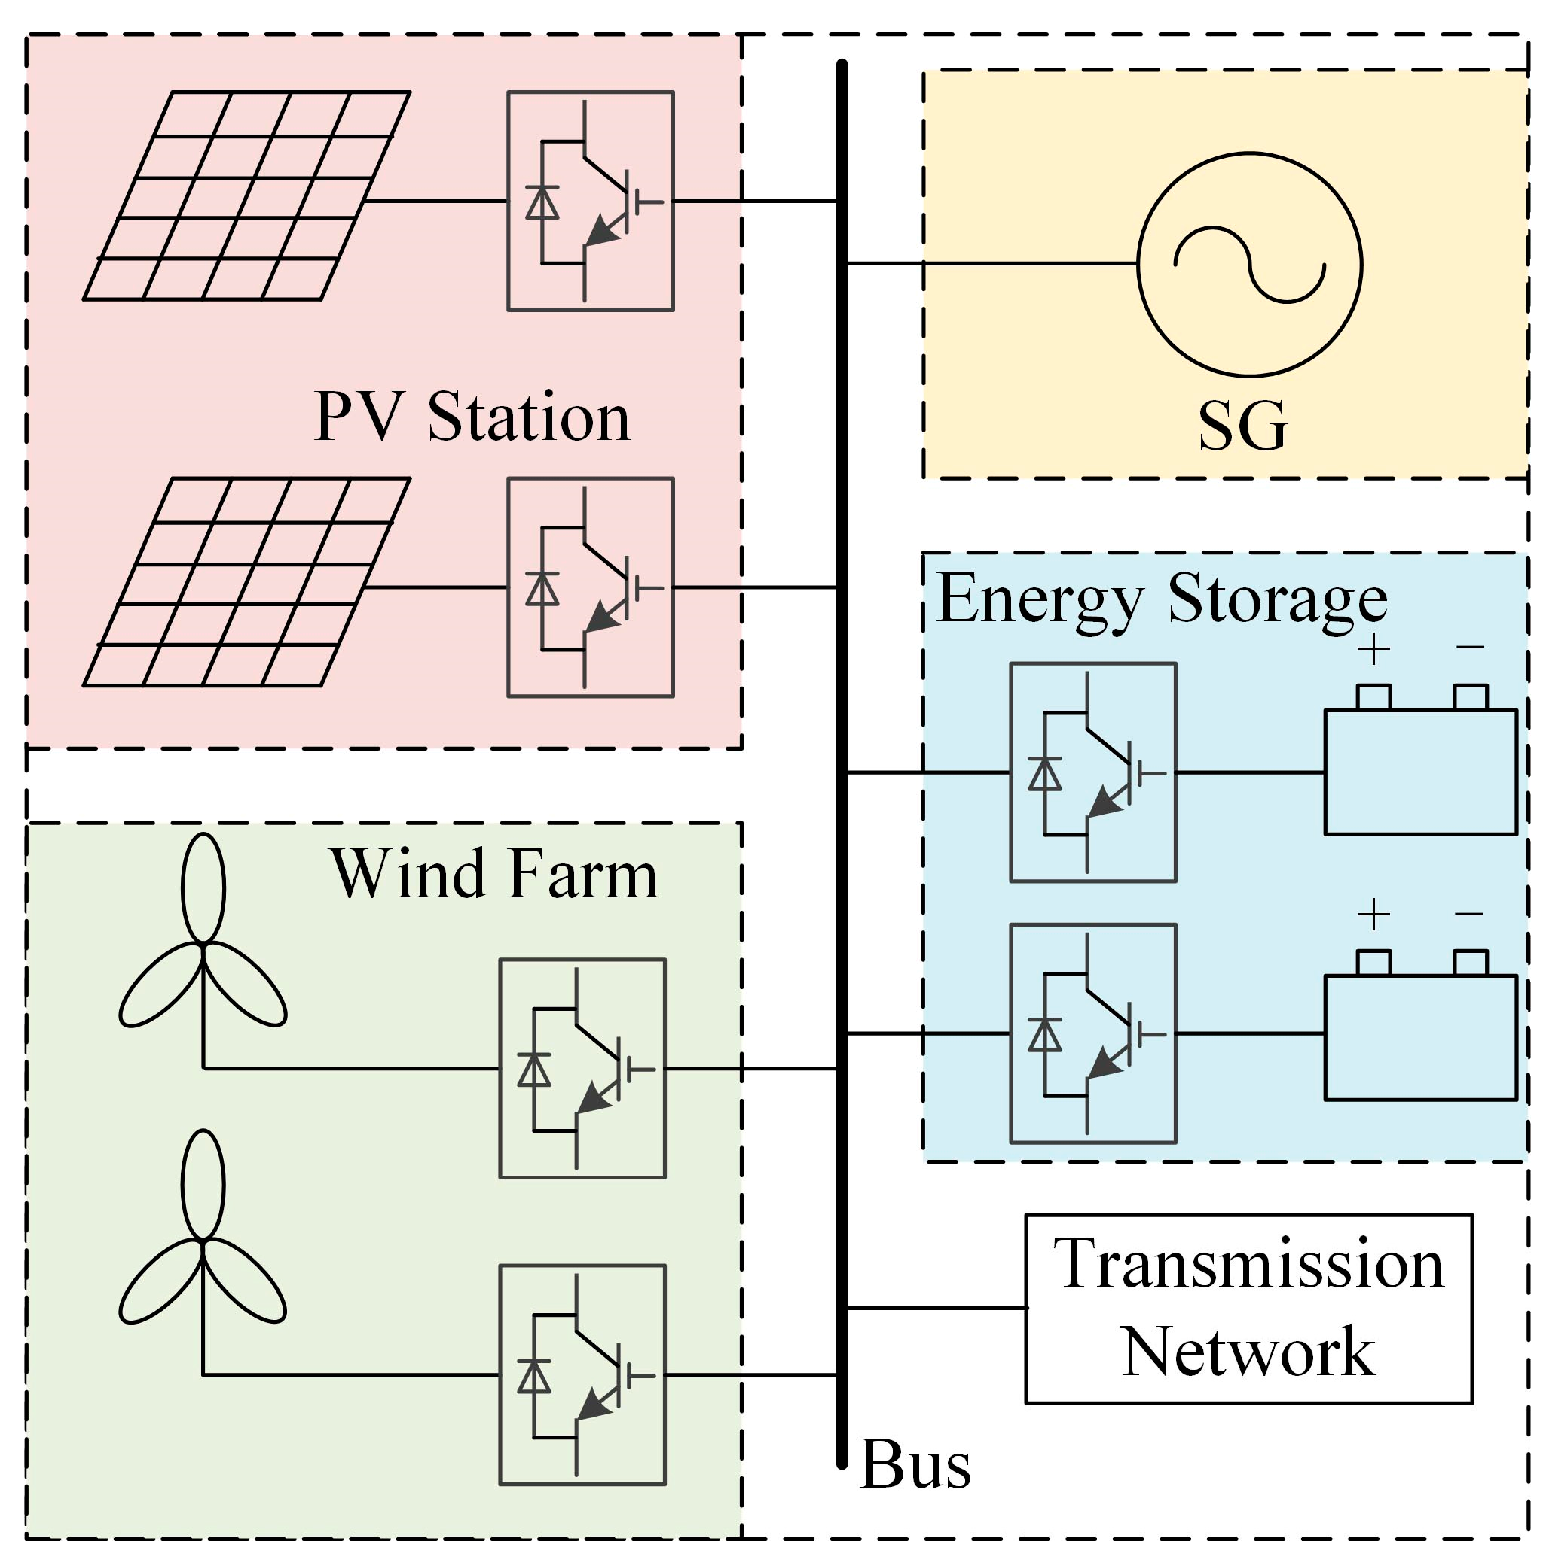
The schematic diagram of a renewable-energy-dominated power system is shown in
Figure 1. It can be seen from the figure that the renewable-energy-dominated power system is mainly composed of a photovoltaic (PV) station, wind farm, synchronous generator (SG), energy storage and transmission networks. In addition, renewable energies, such as a PV station and a wind farm, account for a relatively high proportion and play a major role in supplying electricity in the power system [
15,
16,
17].
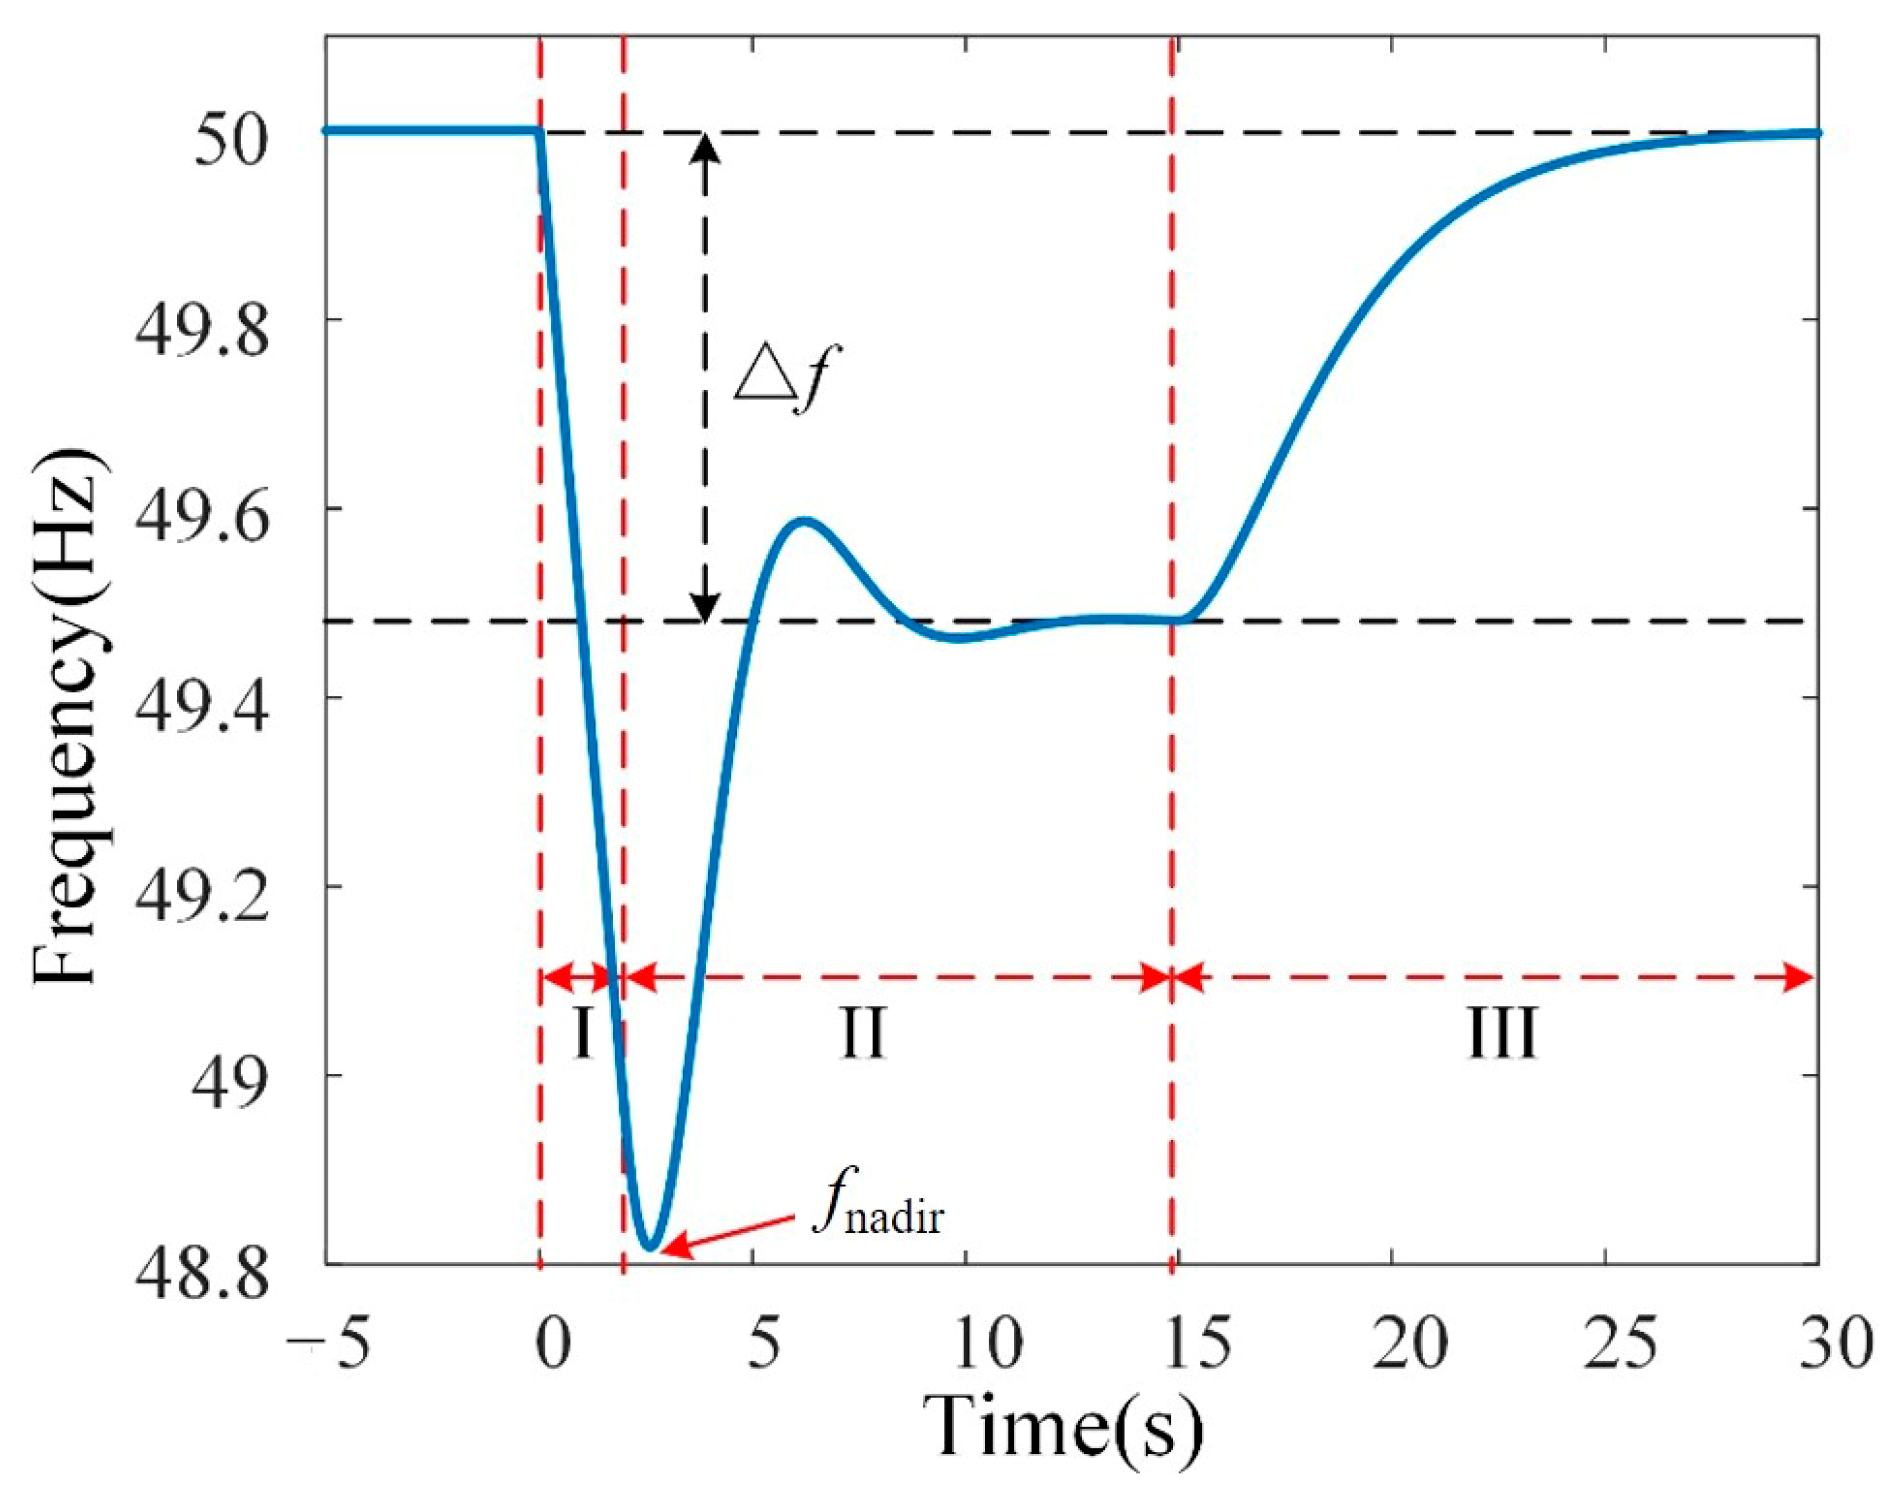
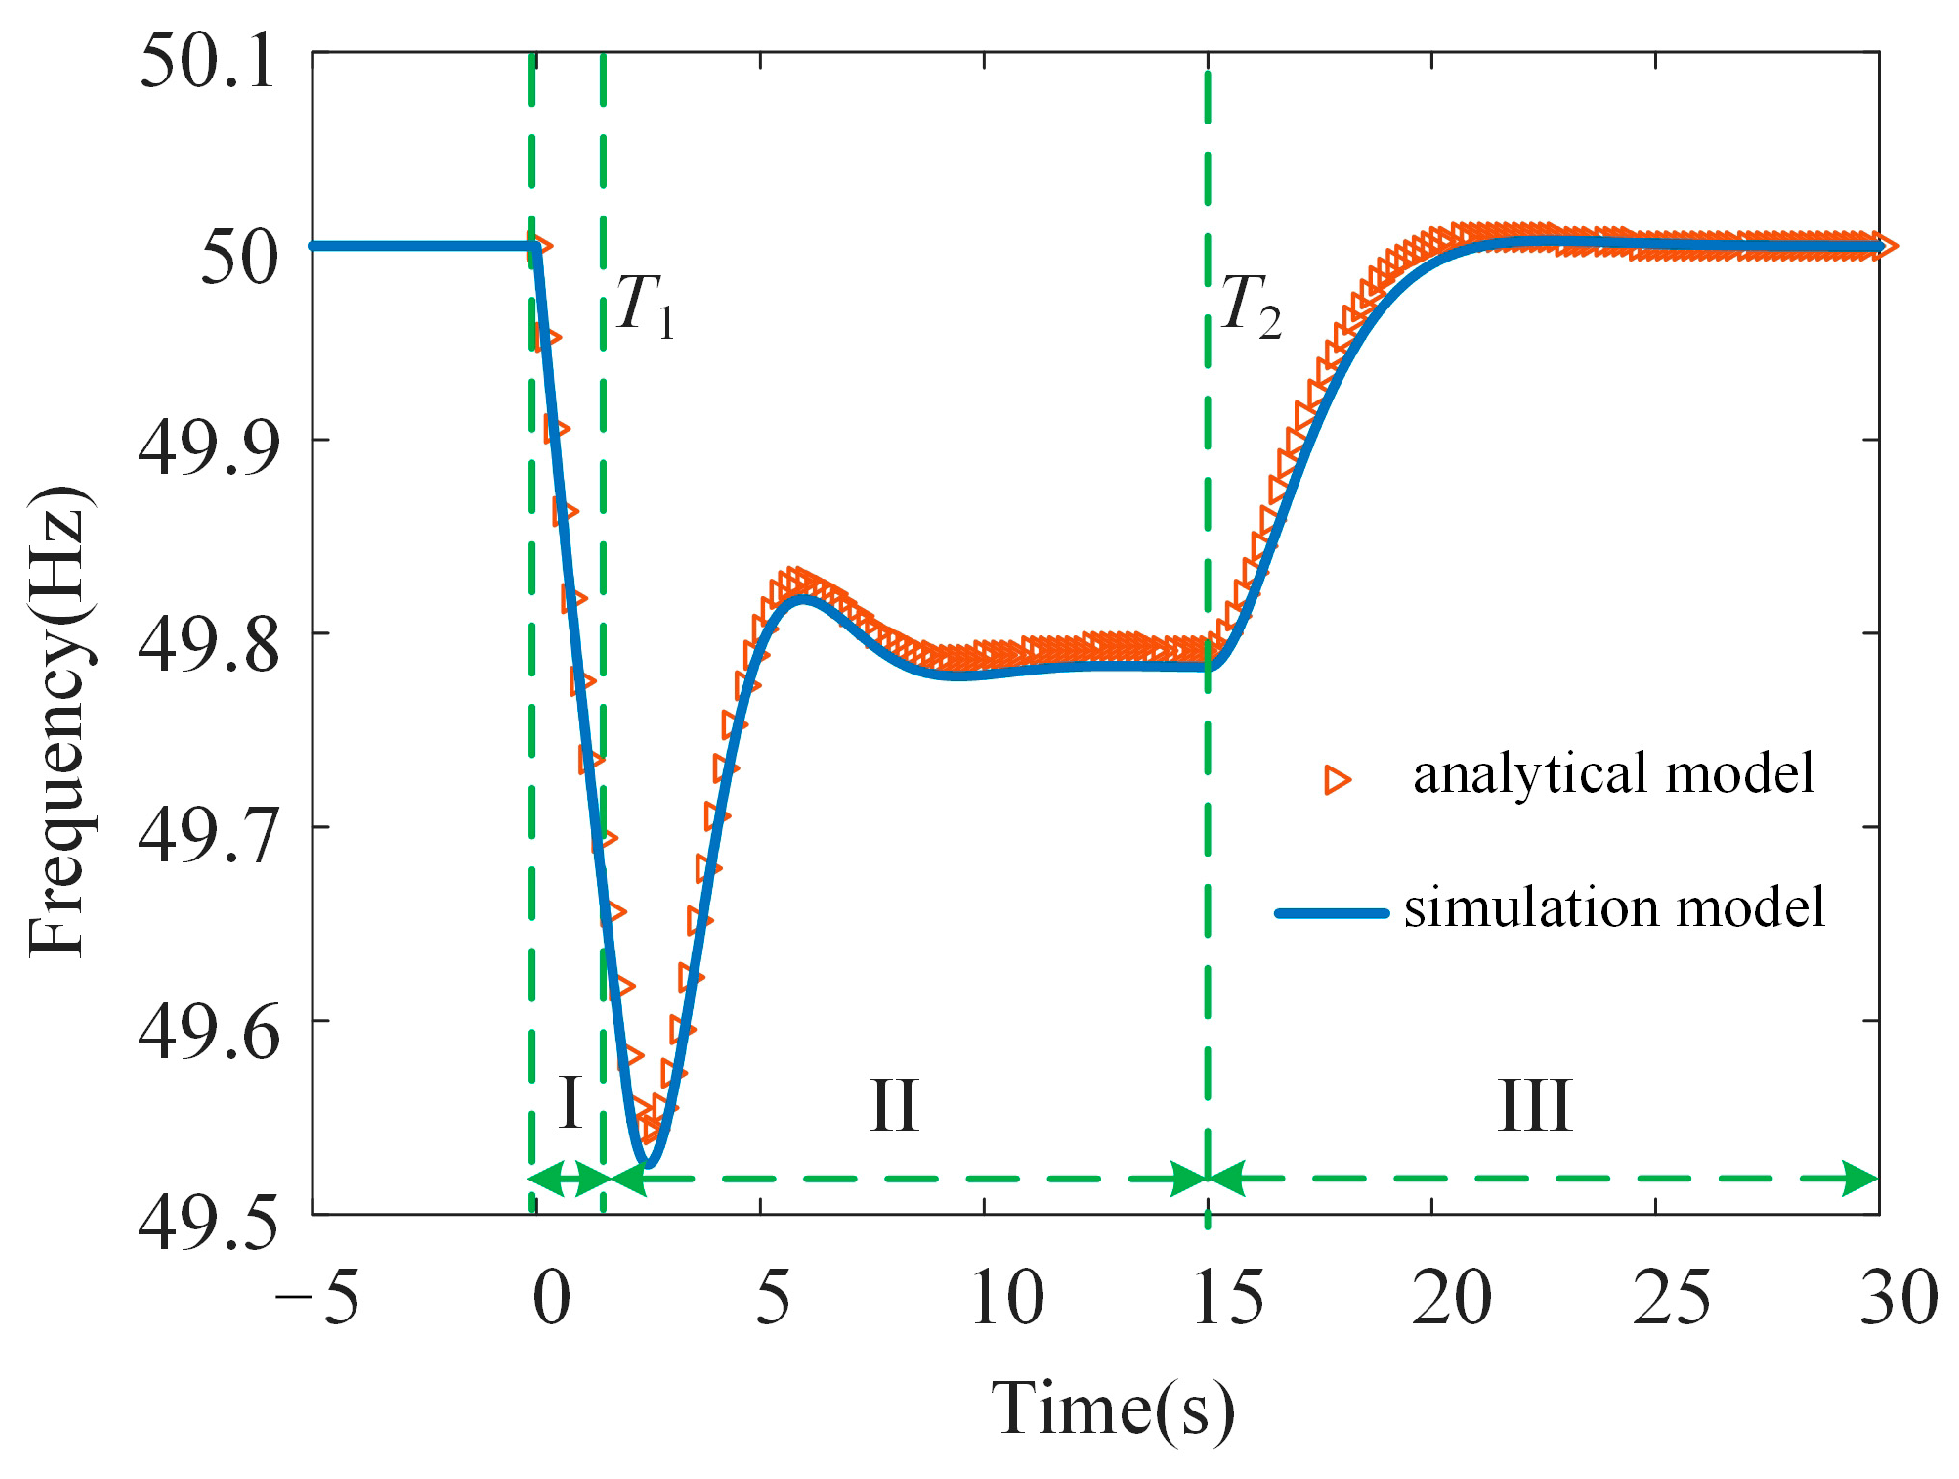
Under the condition of power disturbances, such as generator disconnection, the frequency will fluctuate in the renewable-energy-dominated power system, and its typical curve is shown in
Figure 2. In the figure, stage I refers to the inertial response, stage II refers to the primary frequency regulation, and stage III refers to the secondary frequency regulation. It can be seen from the figure that in the stage of inertial response, the system’s frequency quickly deviates from its rated value; and in the stage of primary frequency regulation, the system’s frequency reaches its extreme point, i.e.,
fnadir, and then recovers to a certain frequency value, causing a steady-state error ∆
f; in the stage of secondary frequency regulation, the system’s frequency is restored to its rated value, i.e., 50 Hz.
Stage I: inertial response. When the active power is unbalanced in the system, the system’s frequency adjustment mainly depends on the rotational kinetic energy of SGs, the rotational kinetic energy of asynchronous machines, the energy provided by the virtual inertia of renewable energy, and the inertia of energy storage device. In the stage of inertial response, various devices of the power system automatically release or absorb their own energy in response to power imbalance, preventing the rate of change of frequency (RoCoF) varying too fast.
Stage II: primary frequency regulation. Thermal power plant (hydropower plant) changes its mechanical power, and renewable energy equipped with inertial control changes its output electromagnetic power by detecting frequency deviation, reducing the power imbalance in the power system, and promoting the frequency to return to the vicinity of the frequency rated value.
Stage III: secondary frequency regulation. Primary frequency regulation is differential regulation, which cannot eliminate the steady-state error. For this reason, it is necessary to make specific generators in service participate in secondary frequency regulation. These generators change the output active power by detecting the frequency integration to further restore the system’s frequency to its rated value, ensuring the stability of the power system.
3. Transient Frequency Modeling of Virtual Synchronous Generator
In order to improve the anti-interference ability of a renewable-energy-dominated power system and enhance its transient frequency stability, VSG can be adopted for wind power and photovoltaic power. By simulating the mechanical motion equation of the synchronous generator, VSG enables wind power and photovoltaic power to mimic the frequency regulation characteristics of a synchronous generator, which can enhance the inertial support for the system and maintain the transient stability of the system frequency.
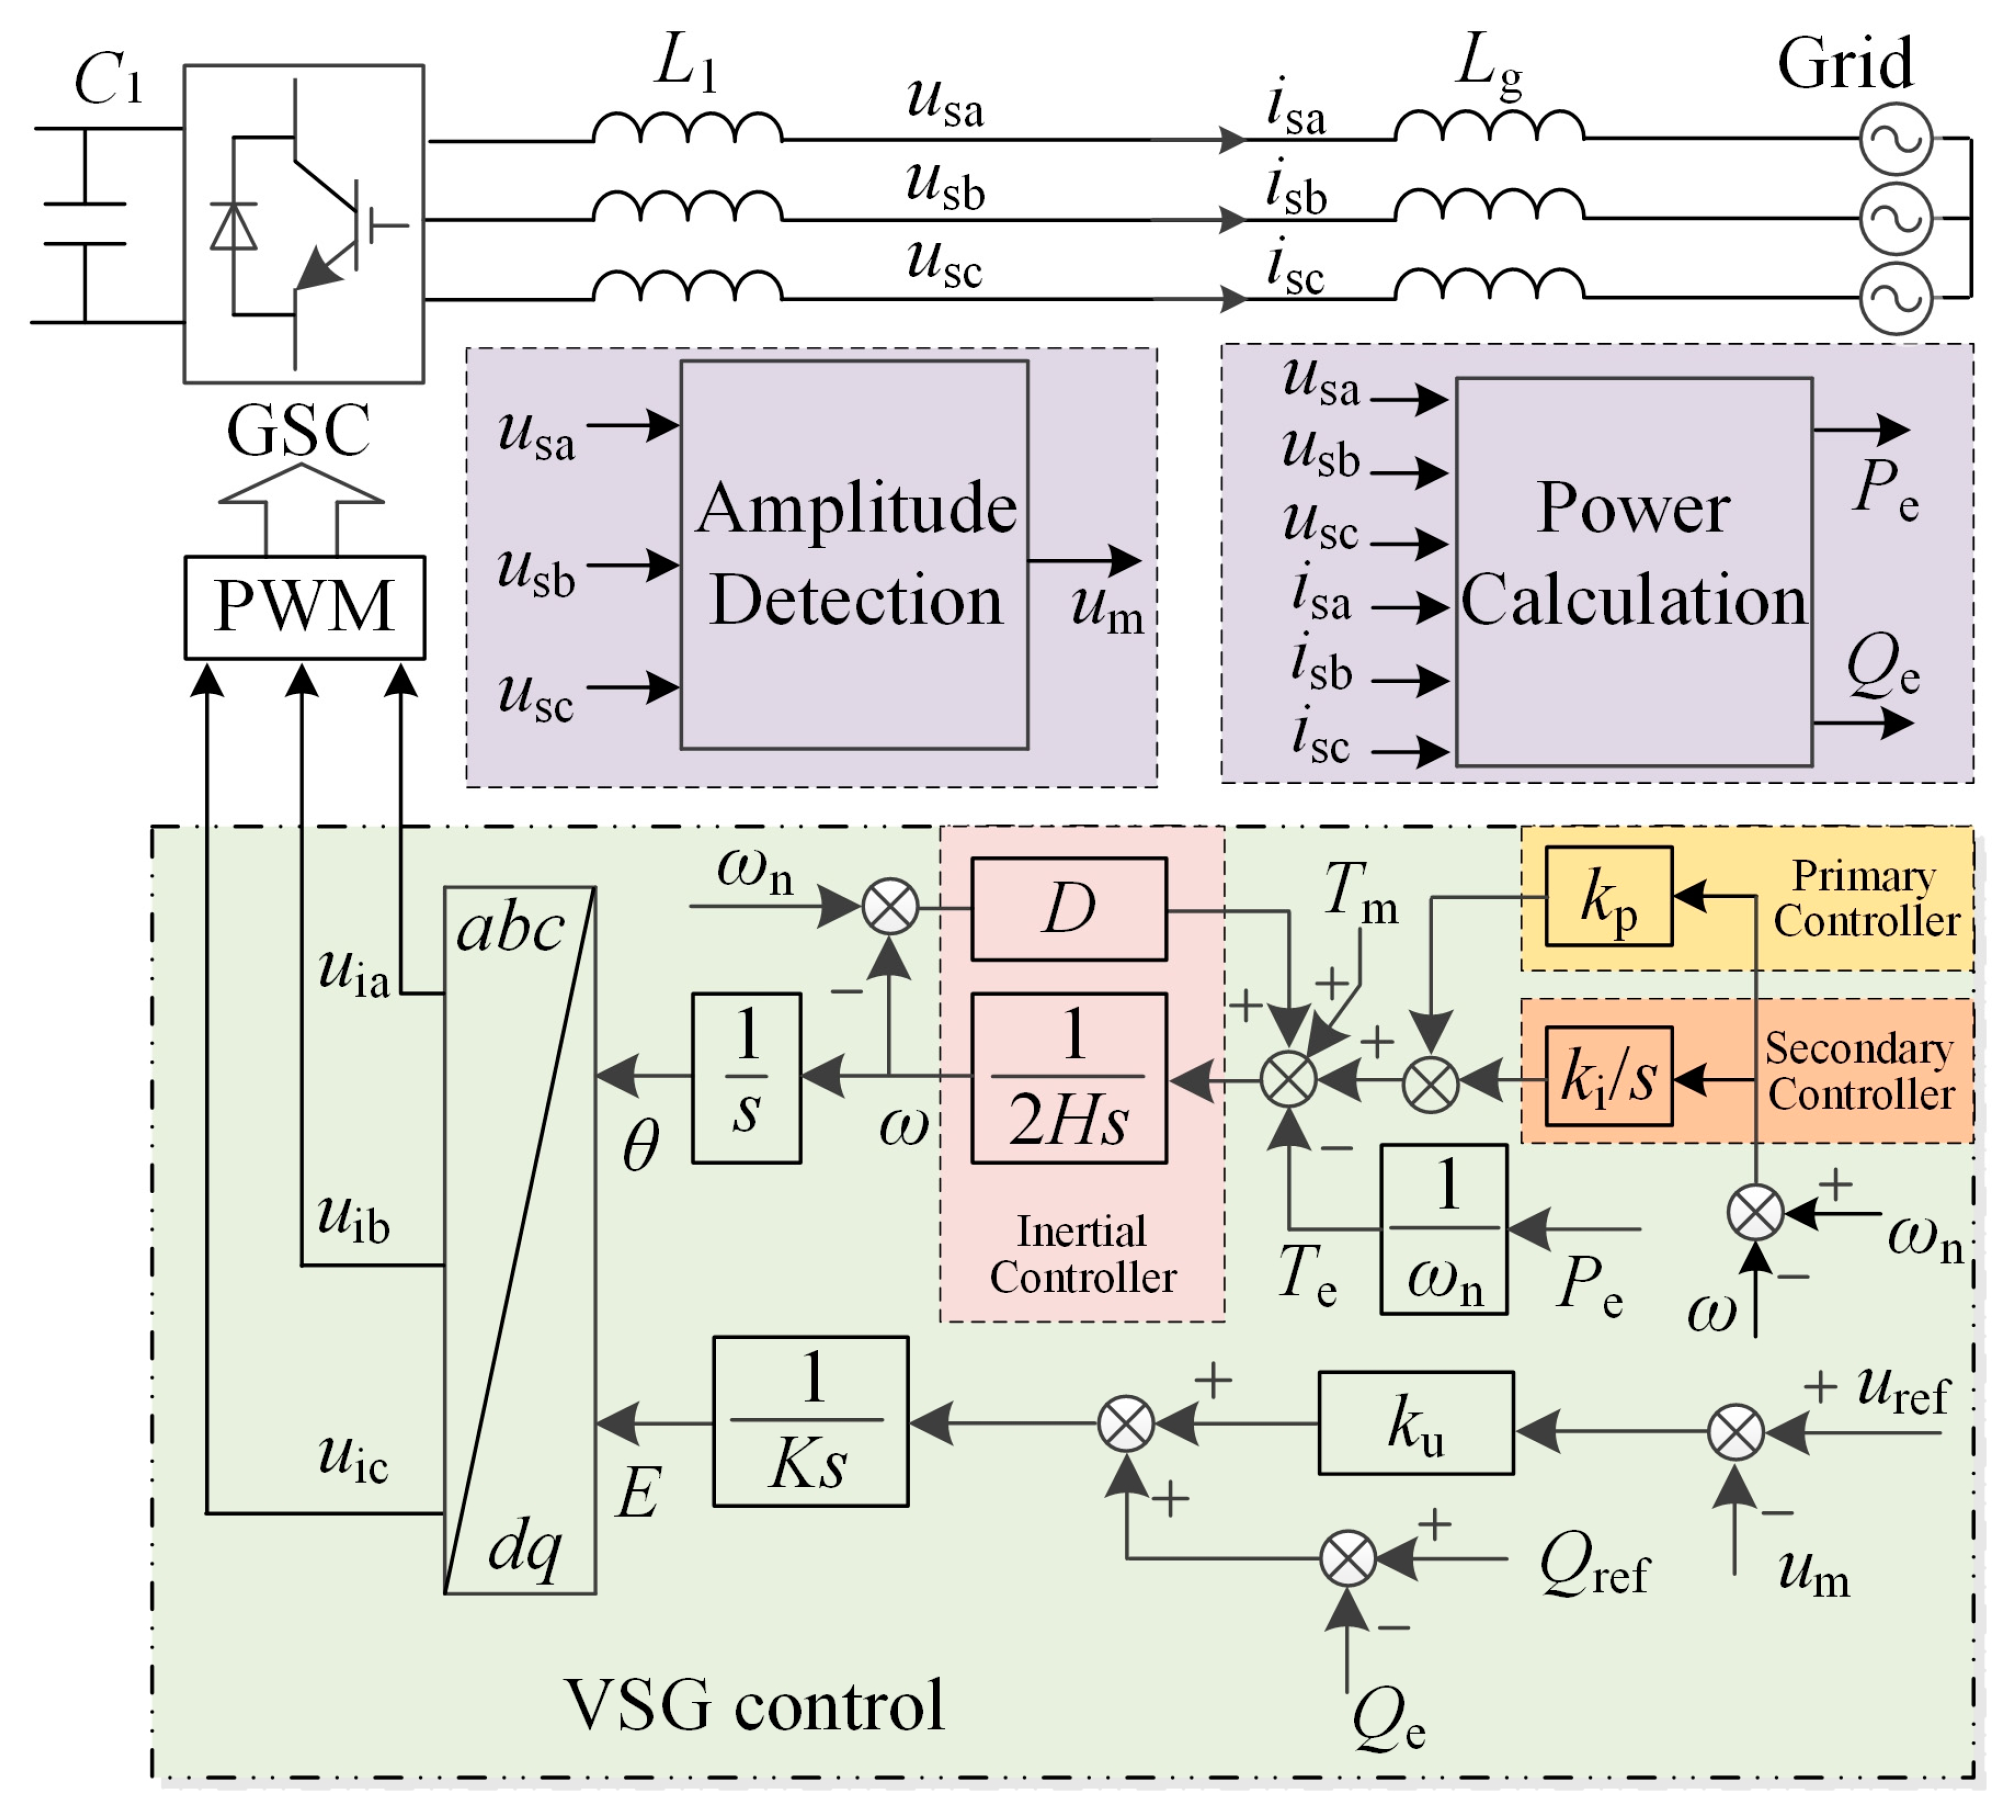
A typical control block diagram of VSG is shown in
Figure 3. In the figure, the inertial controller can be triggered immediately once the power disturbance occurs, while both the primary controller and the secondary controller are put into operation tens of seconds after the power disturbance occurs. The primary controller is responsible for the primary frequency regulation of VSG, and the secondary controller is responsible for the secondary frequency regulation of VSG.
usa,
usb, and
usc are the three-phase voltages of VSG in the point of common coupling (PCC), um is the three-phase voltage amplitude of VSG in the PCC, and
uref is the command value of three-phase voltage amplitude.
isa,
isb, and
isc are the three-phase currents of VSG in the PCC,
L1 is the filter inductance of VSG,
Lg is the grid equivalent inductance,
Pe and
Qe are the output active power and reactive power of VSG in the PCC, respectively, and
Qref is the reactive power command value of VSG.
H is the inertia constant of VSG,
Tm is the input torque of VSG,
Te is the output electromagnetic torque of VSG,
D is the damping coefficient of VSG,
ω is the angular frequency of VSG,
θ is the phase angle of VSG, and
ku is the voltage droop coefficient of VSG.
K is the integral coefficient of reactive power-voltage control loop in VSG, and
E is the internal voltage of VSG.
kp is the primary frequency regulation coefficient, and
ki is the secondary frequency regulation coefficient [
18,
19,
20,
21].
Given that both the primary controller and the secondary controller are not triggered immediately after the power disturbance occurs, according to the control block diagram shown in
Figure 3, the mathematical relationship between torque and angular frequency in the stage of inertial response can be expressed as follows:
When the power system is in steady-state operation, the output electromagnetic torque of SVG is equal to its input torque, that is:
When the power system encounters power disturbances, such as load shedding and generator tripping, the input torque and electromagnetic torque of VSG will be out of balance, and the system will not be able to maintain the original stable operation state, causing the system frequency to deviate from its rated value.
When the power disturbance occurs, the electromagnetic torque of VSG changes abruptly, and the input torque cannot instantaneously respond to the change in electromagnetic torque; in other words, the input torque of VSG remains unchanged. Therefore, VSG will enter into the stage of inertial response. In addition, other devices, such as synchronous generator, asynchronous machine, etc., will also participate in the inertial response to support the system to resist the rapid change in system frequency, maintaining the system frequency stable.
3.1. Inertial Response
In the stage of inertial response, the electromagnetic torque of VSG changes abruptly, and its input torque remains un-changed; when the power disturbance occurs, it is assumed that the electromagnetic torque of VSG abruptly changes to
k times as compared with its input torque, that is:
Substituting Equation (3) into Equation (1), the equation of VSG in the stage of inertial response can be expressed as follows:
According to Equation (4), the time domain expression of angular frequency in the stage of inertial response can be solved as follows:
where
ωn is the rated angular frequency of VSG.
Therefore, the RoCoF in the stage of inertial response can be obtained as follows:
It can be seen from Equations (5) and (6) that in the stage of inertial response, the frequency will deviate from its rated value, and the RoCoF depends on the inertia constant H, damping coefficient D, etc.
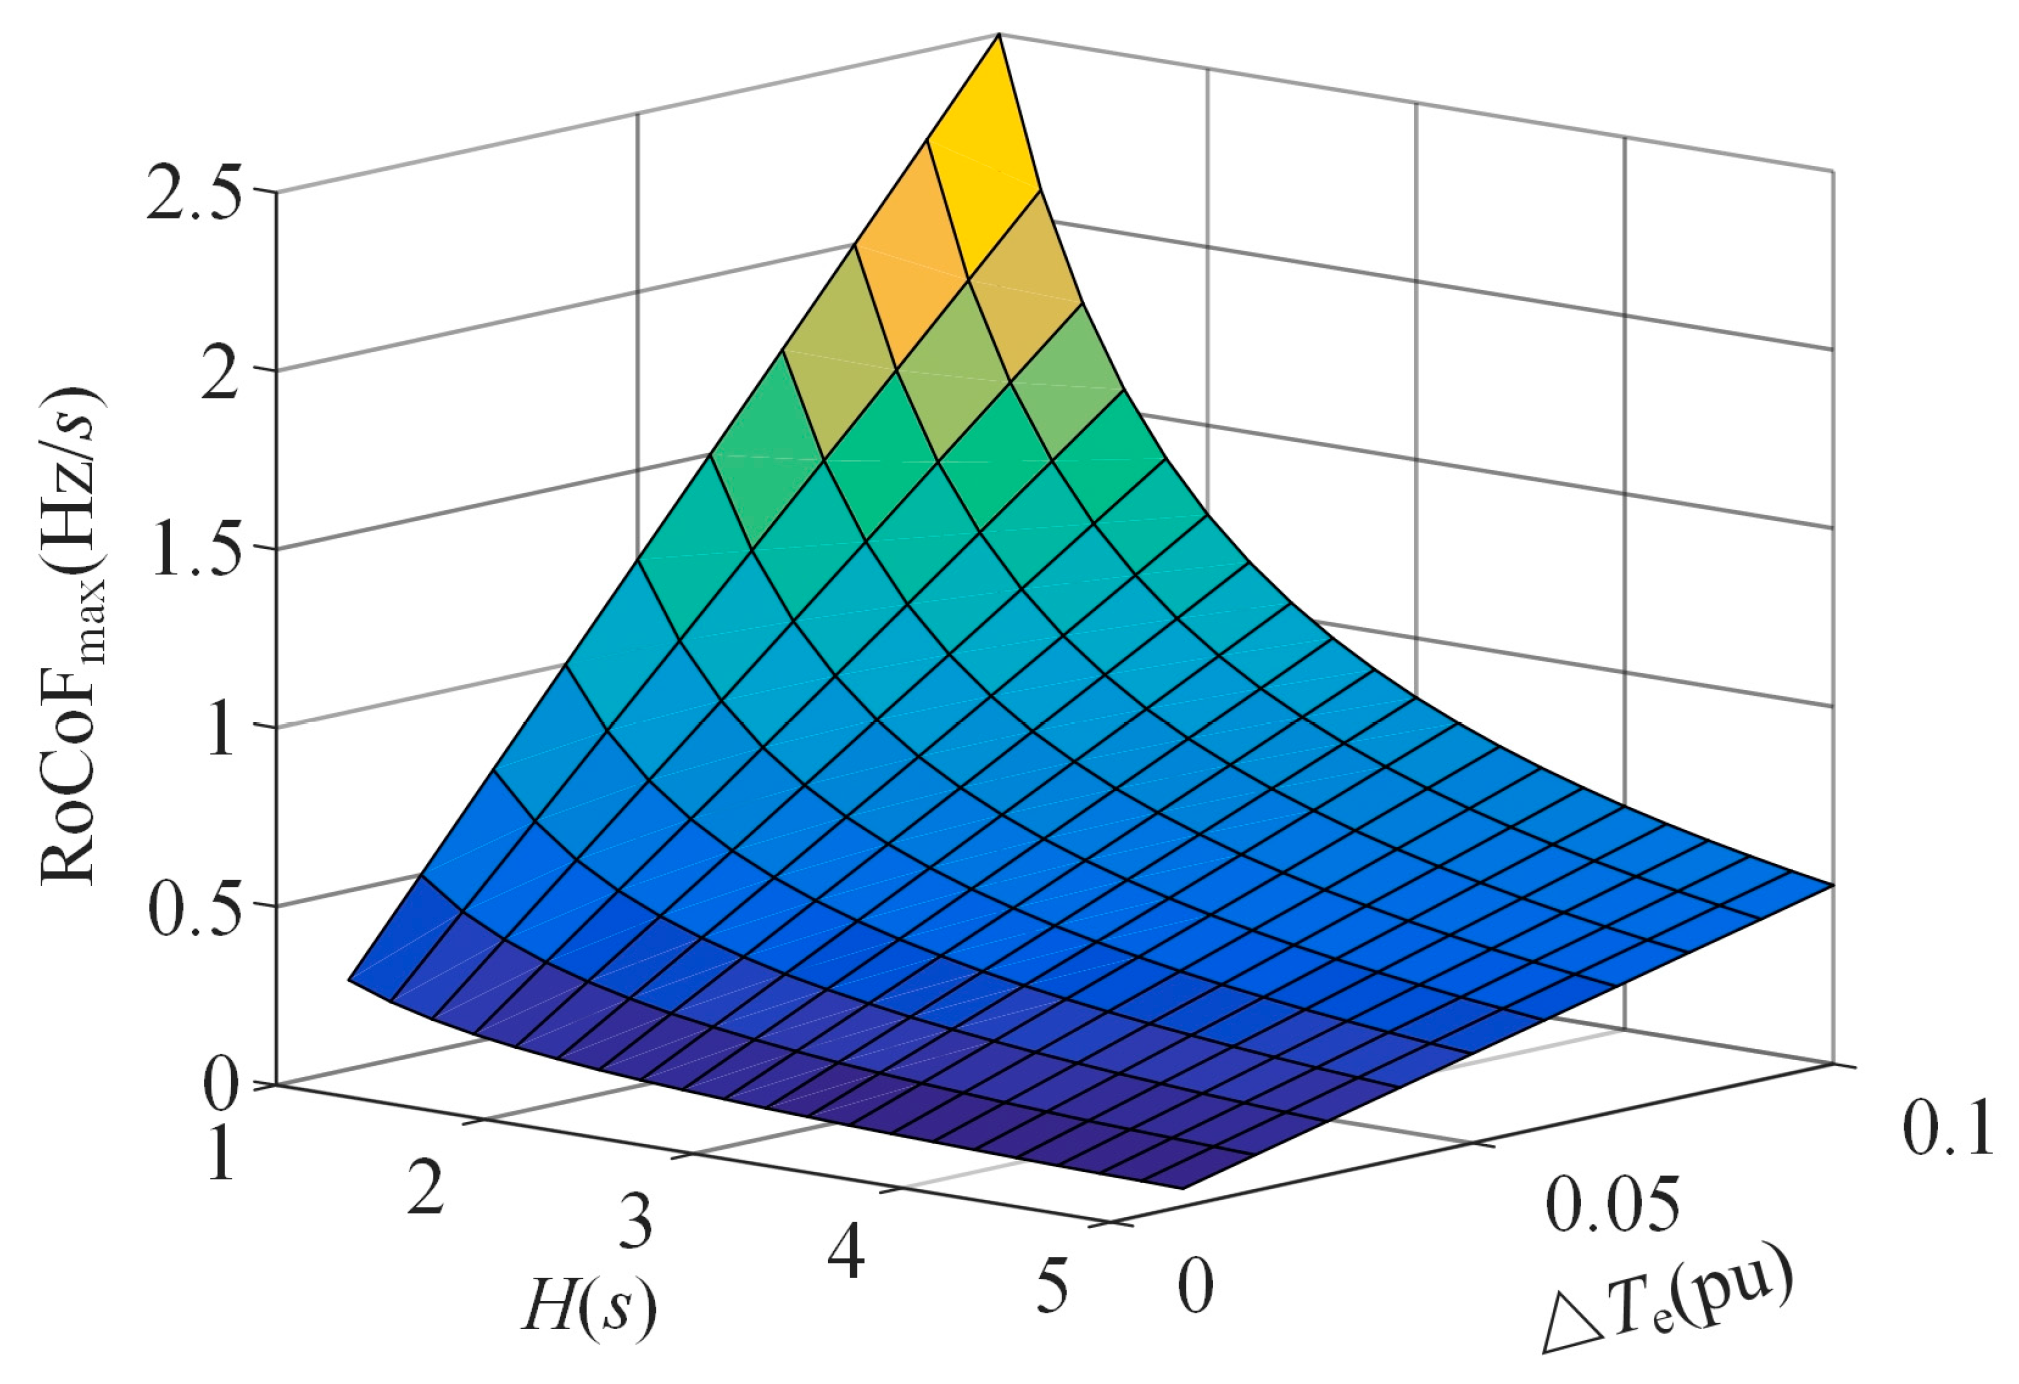
The maximum RoCoF is:
where ∆
Te is the variation in electromagnetic torque.
The relationship between the maximum RoCoF and inertia constant, and the variation in electromagnetic torque is shown in
Figure 4. It can be seen from the figure that as the inertia constant decreases and the variation in electromagnetic torque increases, the maximum RoCoF of VSG increases, which is not conducive to the frequency stability of the system.
3.2. Primary Frequency Regulation
VSG can participate in primary frequency regulation. Considering the primary frequency regulation control of VSG, the equation of VSG in the stage of primary frequency regulation can be obtained as follows:
where ∆
T1 is the variation in input torque of VSG participating in primary frequency regulation.
According to the control block diagram shown in
Figure 3, the variation in input torque of VSG in the stage of primary frequency regulation is:
In order to avoid the adverse impact of extra input torque on VSG in the stage of primary frequency regulation, a first-order filter is introduced to control the input torque.
Considering the effect of first-order filter, the
s-domain expression of variation in input torque in the stage of primary frequency regulation can be written as follows:
where
ω(s) is the s-domain expression of angular frequency of SVG, and
T is the time constant of first-order filter.
The Laplace transformation is performed on Equation (8), and (10) is substituted into (8), and the
s-domain expression of VSG angular frequency in the stage of primary frequency regulation can be solved as follows:
where
T1 is the start time of primary frequency regulation, and
ω(
T1) is the initial value of VSG angular frequency in the stage of primary frequency regulation.
The initial value of VSG angular frequency in the stage of primary frequency regulation is equal to the final value of that in the stage of inertial response; so, according to Equation (5), the initial value of VSG angular frequency in the stage of primary frequency regulation can be written as follows:
The inverse Laplace transformation is performed on Equation (11); thus, the time domain expression can be expressed as follows:
The expressions of parameters
k1,
k2 and
k3 are shown in
Appendix A.
It can be seen from Equation (13) that after the completion of primary frequency regulation, the deviation between the steady-state value of VSG angular frequency and its rated value can be obtained as follows:
It can be seen from Equation (14) that after the completion of primary frequency regulation, there is a steady-state error in the system frequency. Therefore, secondary frequency regulation must be started to restore the frequency to its rated value, eliminating the steady-state error.
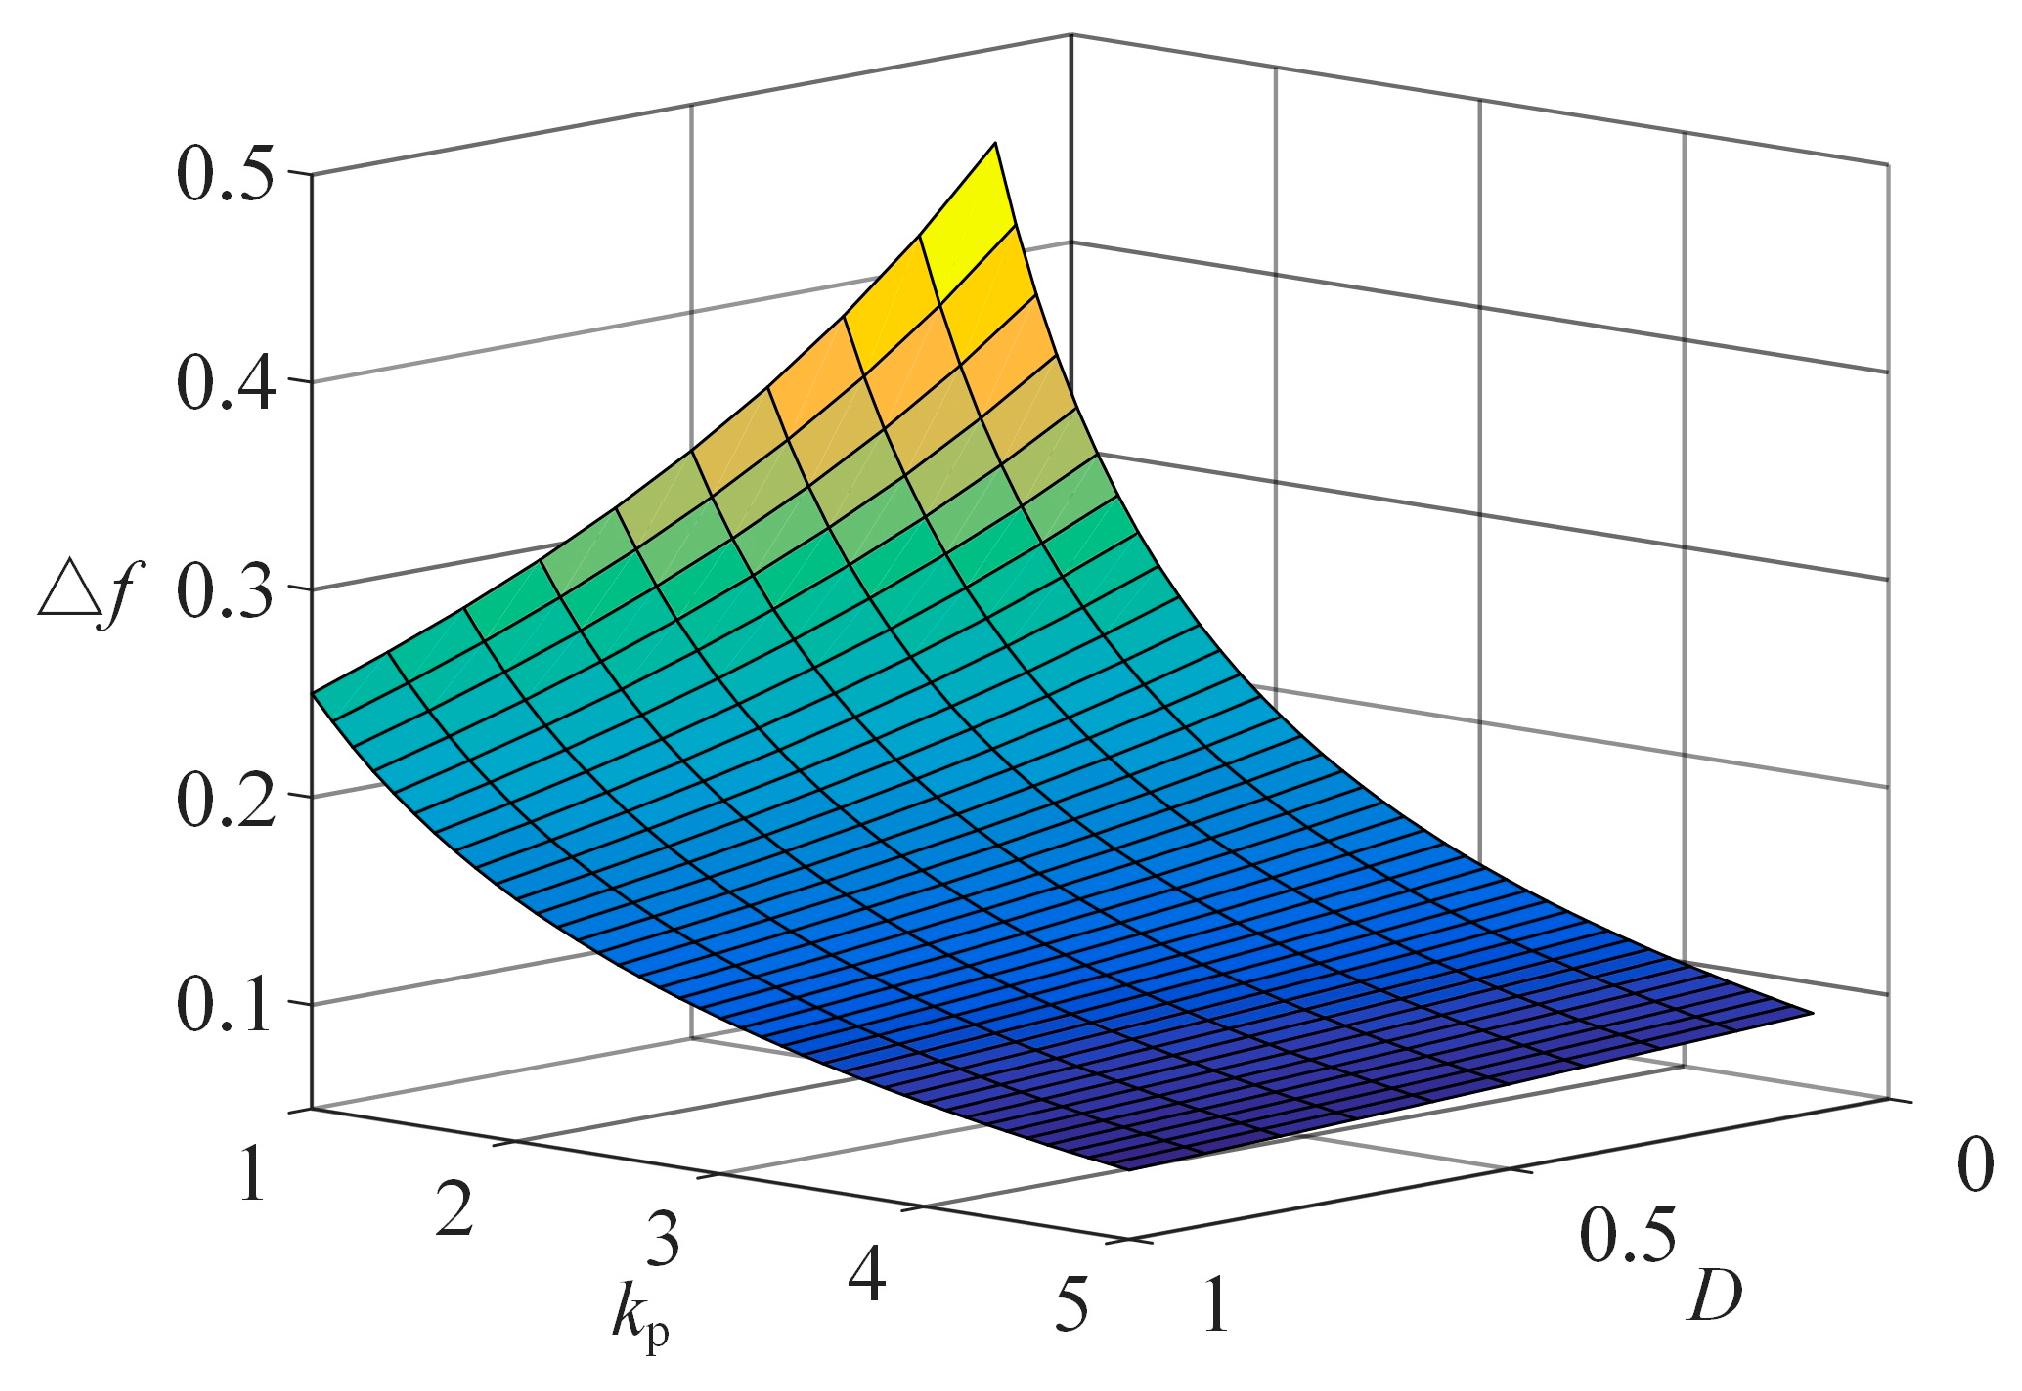
The relationship between the steady-state error of VSG’s primary frequency regulation’s damping coefficient and primary frequency regulation coefficient is shown in
Figure 5. It can be seen from the figure that as the damping coefficient and the primary frequency regulation coefficient decreases, the steady-state error of VSG primary frequency regulation increases, which is not conducive to the frequency stability of the power system.
3.3. Secondary Frequency Regulation
Considering the secondary frequency regulation control of VSG, the equation of VSG in the stage of secondary frequency regulation can be obtained as follows:
where ∆
T2 is the variation in VSG input torque participating in the secondary frequency regulation. According to the control block diagram shown in
Figure 3, the variation in VSG input torque in the stage of secondary frequency regulation can be expressed as follows:
Substituting Equations (9) and (16) into Equation (15), the time domain expression of VSG angular frequency in the stage of secondary frequency regulation can be obtained as follows:
The expressions of parameters
a1 and
a2 are:
The expressions of parameters
k4 and
k5 are:
where
T2 is the start time of secondary frequency regulation,
ω(
T2) is the initial value of VSG angular frequency in the stage of secondary frequency regulation, and
ω’(
T2) is the first derivative of the initial value of VSG angular frequency in the stage of secondary frequency regulation. The initial value of VSG angular frequency in the stage of secondary frequency regulation is equal to the final value of that in the stage of primary frequency regulation; so, according to Equation (13), the initial value of VSG angular frequency in the stage of secondary frequency regulation is:
Taking the first derivative of (13), we can obtain:
According to Equation (21), it can be seen that the initial value of the first derivative of VSG angular frequency in the secondary frequency regulation stage can be obtained as shown in Equation (22).
3.4. Transient Frequency Response
According to the above analysis, it is clear that the analytical expression of VSG transient angular frequency is shown in Equation (23) in the stage of inertial response, primary frequency regulation and secondary frequency regulation.
It can be seen from Equation (23) that after the electromagnetic torque of VSG changes, the transient angular frequency response of VSG is a piecewise function, and the moment of sudden change in electromagnetic torque is recorded as time 0. At this time, the VSG is in the stage of inertial response, the start time of its primary frequency regulation is recorded as T1, and the start time of secondary frequency regulation is recorded as T2.
On the other hand, in the stage of inertial response, the VSG angular frequency transient response is mainly related to the VSG damping coefficient and the inertia constant; in the stage of primary frequency regulation, VSG angular frequency transient response is mainly related to the VSG damping coefficient, inertia constant, and primary frequency regulation coefficient; and in the stage of secondary frequency regulation, the VSG angular frequency transient response is mainly related to the VSG damping coefficient, inertia constant, and the secondary frequency regulation coefficient.
5. Frequency Characteristic Analysis
In order to analyze the impact of various control parameters on the transient frequency characteristics of VSGs, a detailed examination was conducted, with the results shown in
Figure 7,
Figure 8,
Figure 9,
Figure 10 and
Figure 11. These figures compare the transient frequency response of VSGs to that of renewable energy systems employing vector control (VC) strategies. As a result of such a comparison, across all scenarios, the VSG demonstrates superior transient frequency performance regardless of parameter variations. Specifically, during the inertial response stage, the rate of change of frequency (RoCoF) for the VSG is notably smaller than that of the VC strategy. This reduced RoCoF enhances system stability immediately following a disturbance. During the primary frequency regulation stage, the VSG exhibits a higher
fnadir and a smaller steady-state error, further contributing to improved stability. In the secondary frequency regulation stage, the VSG achieves faster recovery to the rated frequency, underscoring its effectiveness in maintaining transient frequency stability.
5.1. Influence of VSG Inertia Constant on Transient Frequency
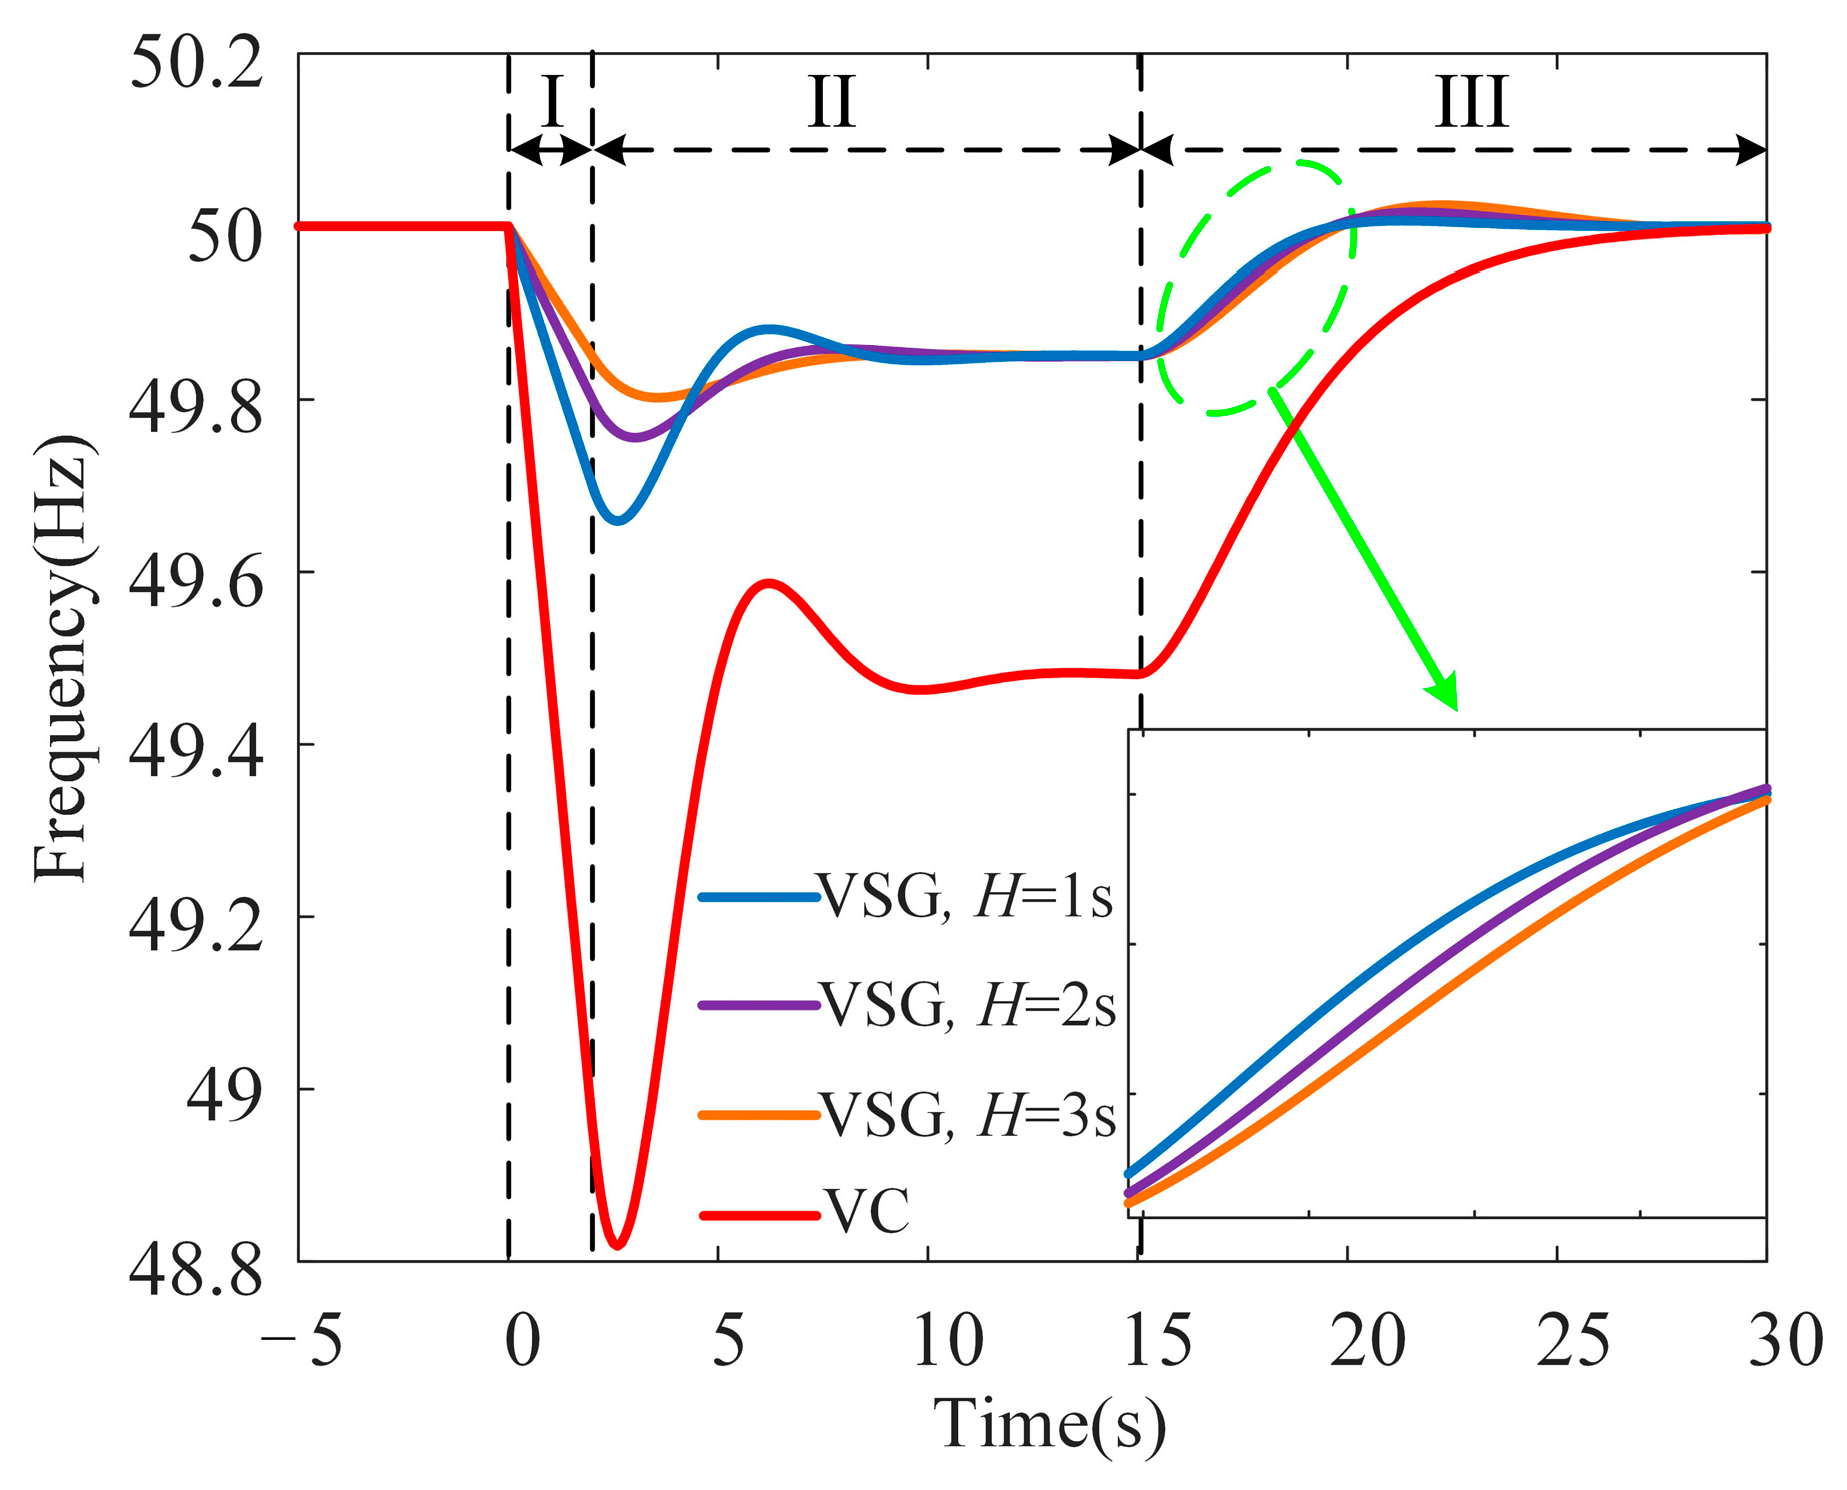
The influence of the VSG inertia constant on transient frequency is depicted in
Figure 7. As the inertia constant increases from 1 s to 3 s, the system exhibits notable changes in its transient frequency characteristics across different stages. During the inertial response stage, a higher inertia constant effectively reduces the rate of change in frequency (RoCoF). This reduction provides the system with additional reserve time to activate primary frequency regulation, mitigating the risk of abrupt frequency deviations that could destabilize the system. The enhanced damping effect during this stage ensures that the system can better absorb the initial impact of power disturbances.
In the primary frequency regulation stage, an increased inertia constant leads to a higher fnadir, reducing the depth of frequency dips. This improvement in frequency stability minimizes the likelihood of triggering protection mechanisms, such as under-frequency load shedding, and enhances the system’s ability to withstand disturbances. However, the benefits of a high inertia constant diminish during the secondary frequency regulation stage. A higher inertia constant slows the frequency recovery process as the increased energy storage delays the system’s ability to return to its rated frequency. This delayed recovery can prolong the period of frequency instability, potentially impacting system performance.
Moreover, the choice of the inertia constant involves a trade-off between stability and recovery speed. While a higher inertia constant is advantageous for mitigating the immediate effects of power disturbances, it may not be suitable for ensuring a rapid return to normal operating conditions. Conversely, a lower inertia constant can accelerate recovery during the secondary frequency regulation stage but may compromise system stability during the initial disturbance.
In summary, the inertia constant should be dynamically adjusted based on the system’s operational stage. Increasing the inertia constant immediately after a power disturbance can enhance system stability by reducing RoCoF and supporting primary frequency regulation. However, decreasing the inertia constant during the recovery phase can expedite the return to the rated frequency, balancing stability and recovery speed for optimal system performance.
5.2. Influence of VSG Damping Coefficient on Transient Frequency
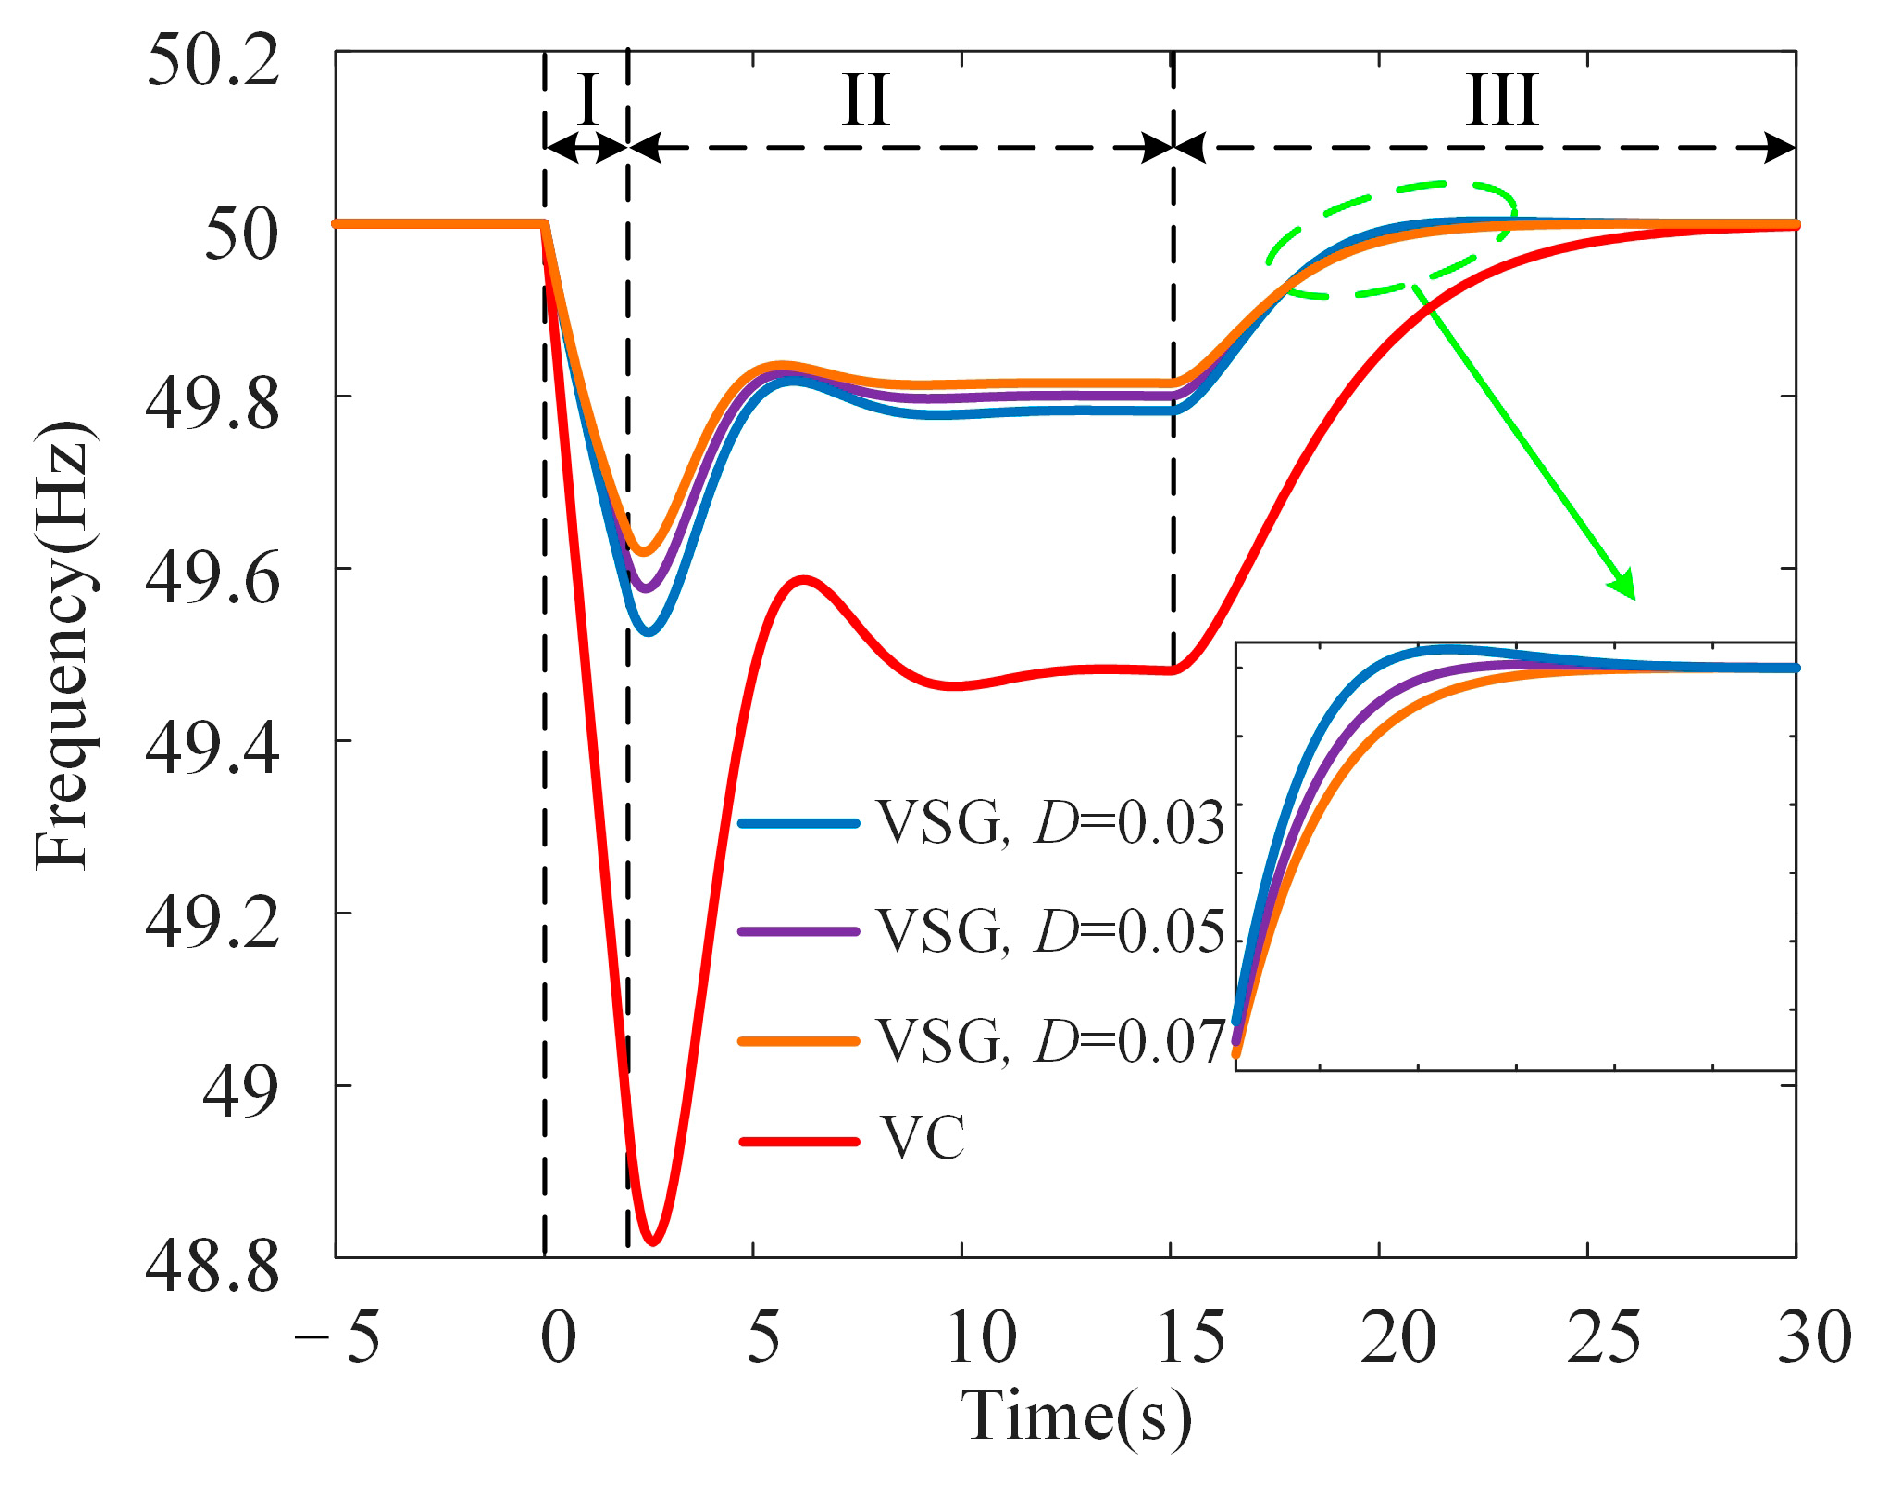
The influence of the VSG damping coefficient on transient frequency is illustrated in
Figure 8. As the damping coefficient increases from 0.03 to 0.07, the system’s transient frequency response demonstrates significant improvements in certain stages, albeit with trade-offs in others.
During the inertial response stage, a higher damping coefficient effectively reduces the rate of change of frequency (RoCoF). This reduction provides the system with additional time to engage primary frequency regulation mechanisms, thereby mitigating the immediate effects of power disturbances. The decreased RoCoF minimizes the likelihood of abrupt frequency variations, enhancing the system’s robustness in the face of sudden disturbances.
In the primary frequency regulation stage, an increased damping coefficient contributes to a higher fnadir and a smaller steady-state error. These improvements enhance frequency stability, reducing the risk of triggering protective measures such as low-frequency load shedding. A smaller steady-state error also ensures that the system operates closer to its rated frequency, maintaining better overall performance during this critical stabilization phase.
However, in the secondary frequency regulation stage, the influence of a higher damping coefficient becomes less favorable. The increased damping introduces a sluggish response, slowing the system’s ability to return to its rated frequency. This delay can prolong the period of frequency instability, potentially impacting the system’s ability to maintain normal operations during extended disturbances. The trade-off presented by varying damping coefficients highlights the importance of adaptive control strategies. A higher damping coefficient is beneficial immediately following a power disturbance as it stabilizes the system and prevents excessive frequency deviations. Conversely, a lower damping coefficient is advantageous during the recovery phase as it accelerates the return to the rated frequency, ensuring faster stabilization of the system.
In summary, the damping coefficient should be dynamically adjusted based on the operational stage of the system. Increasing the damping coefficient at the moment of a power disturbance enhances stability by reducing RoCoF and improving frequency fnadir and the steady-state error. However, decreasing the damping coefficient during the recovery phase allows for a faster return to the rated frequency, balancing stability and recovery speed for optimal system performance.
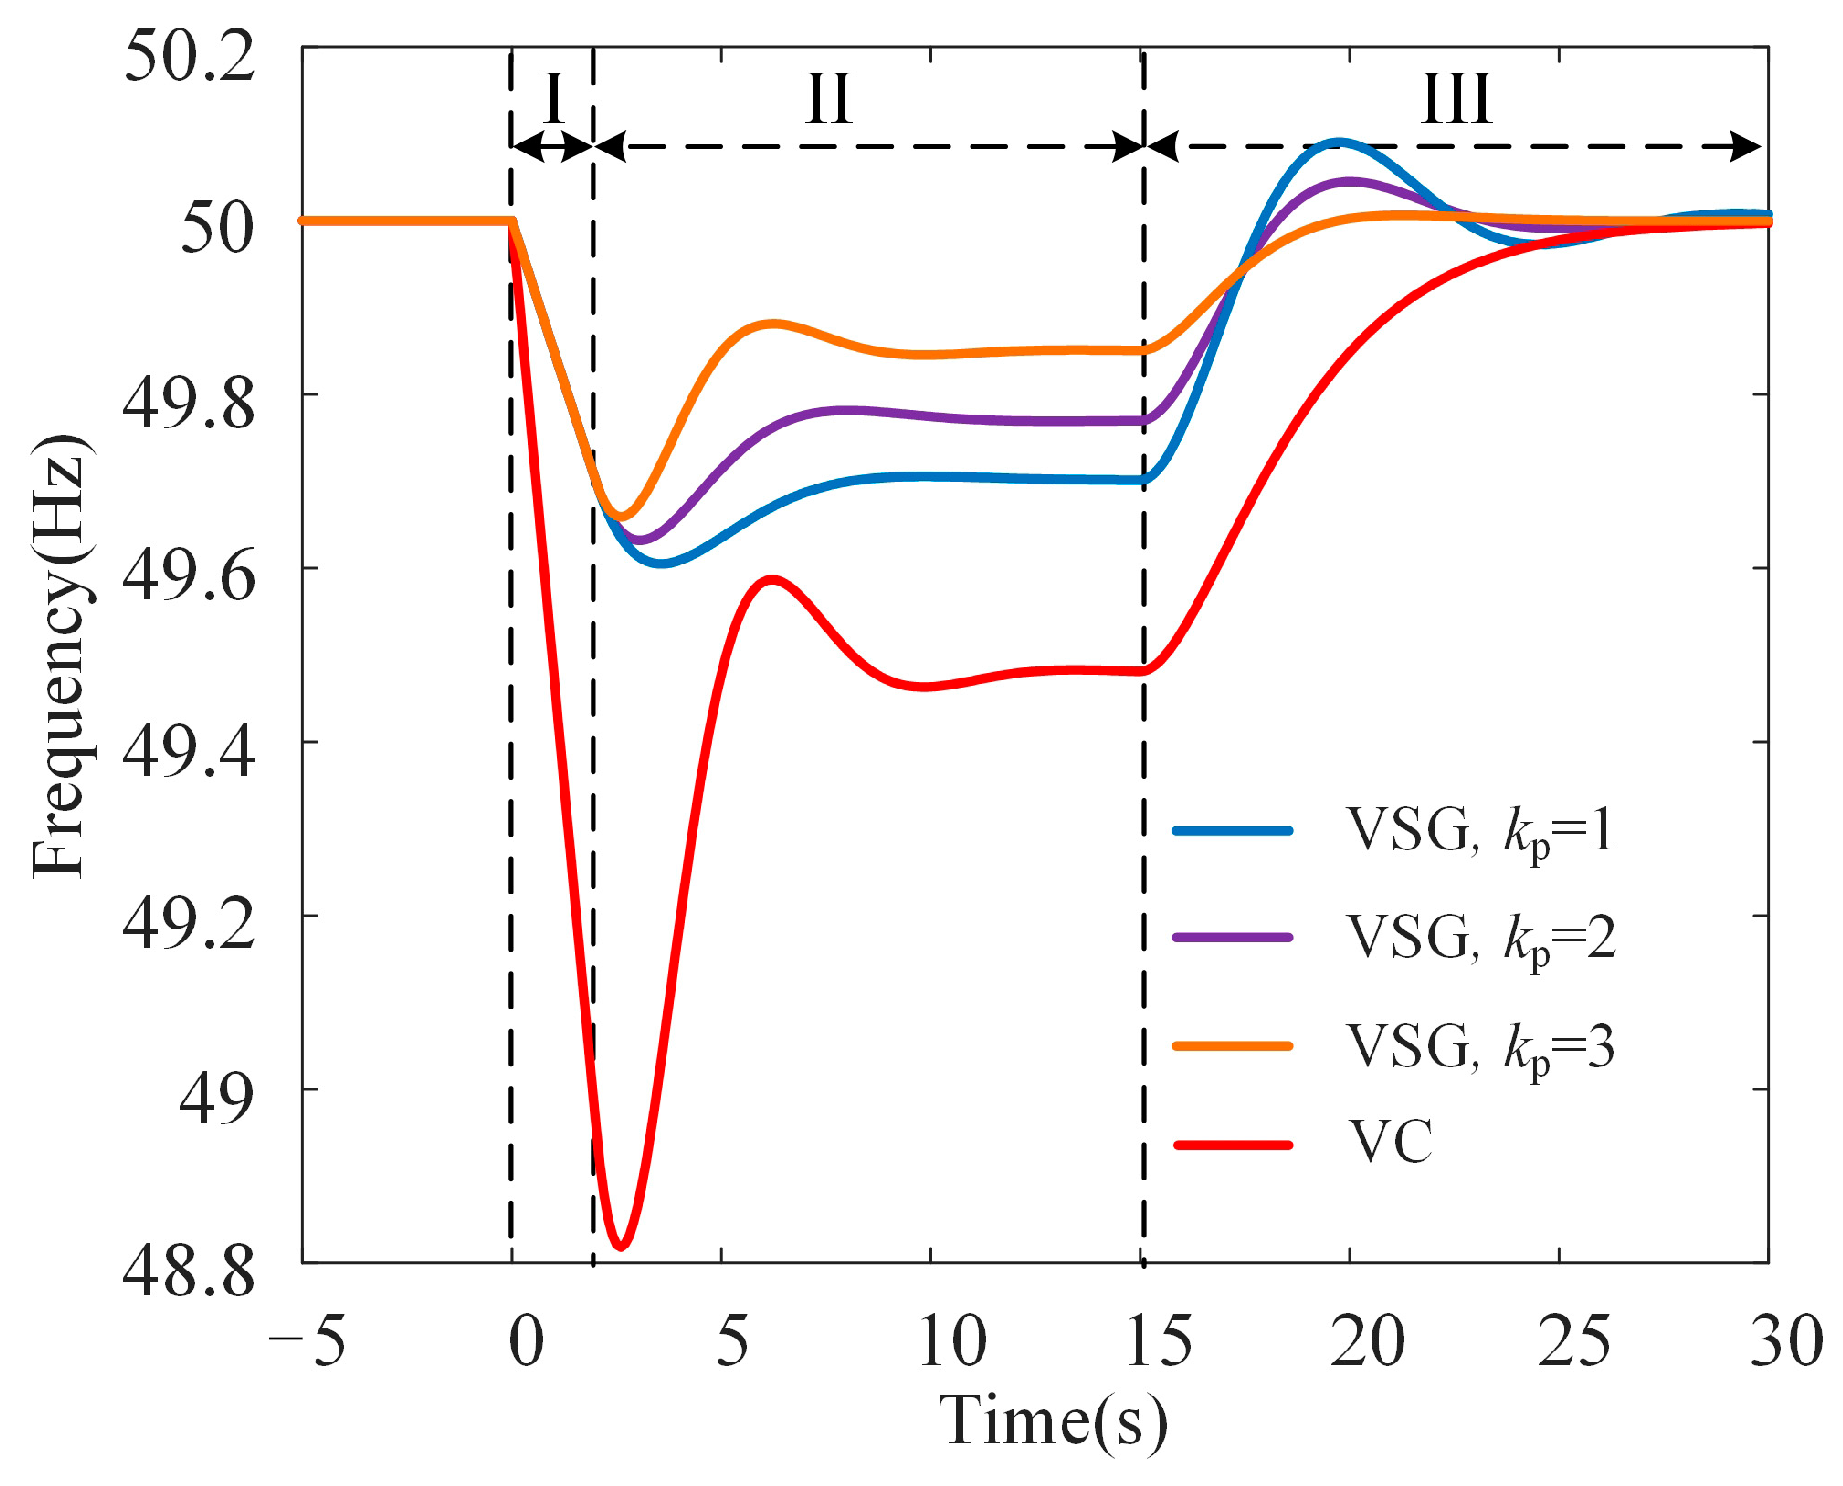
5.3. Influence of VSG Primary Frequency Regulation Coefficient on Transient Frequency
The influence of the VSG primary frequency regulation coefficient on transient frequency is depicted in
Figure 9. As the coefficient increases from 1 to 3, the system exhibits significant improvements in its transient frequency response. During the primary frequency regulation stage, a higher coefficient raises the
fnadir, reducing the severity of frequency dips. This enhancement minimizes the risk of triggering protective measures, such as low-frequency load shedding, thereby improving the system’s resilience to disturbances. Additionally, the steady-state operating point of the transient frequency is elevated, leading to a smaller steady-state error. This improvement ensures that the system operates closer to its rated frequency, enhancing overall stability and performance.
Furthermore, in the secondary frequency regulation stage, an increased primary frequency regulation coefficient accelerates the system’s recovery to its rated frequency. This faster recovery reduces the duration of frequency instability, promoting a more efficient stabilization process. The combined effects of a higher fnadir, reduced steady-state error, and faster recovery underscore the critical role of the primary frequency regulation coefficient in maintaining system stability and performance across different operational stages.
In summary, increasing the VSG primary frequency regulation coefficient during the primary frequency regulation stage enhances the system’s ability to manage frequency deviations, improves stability, and ensures a more rapid return to normal operating conditions.
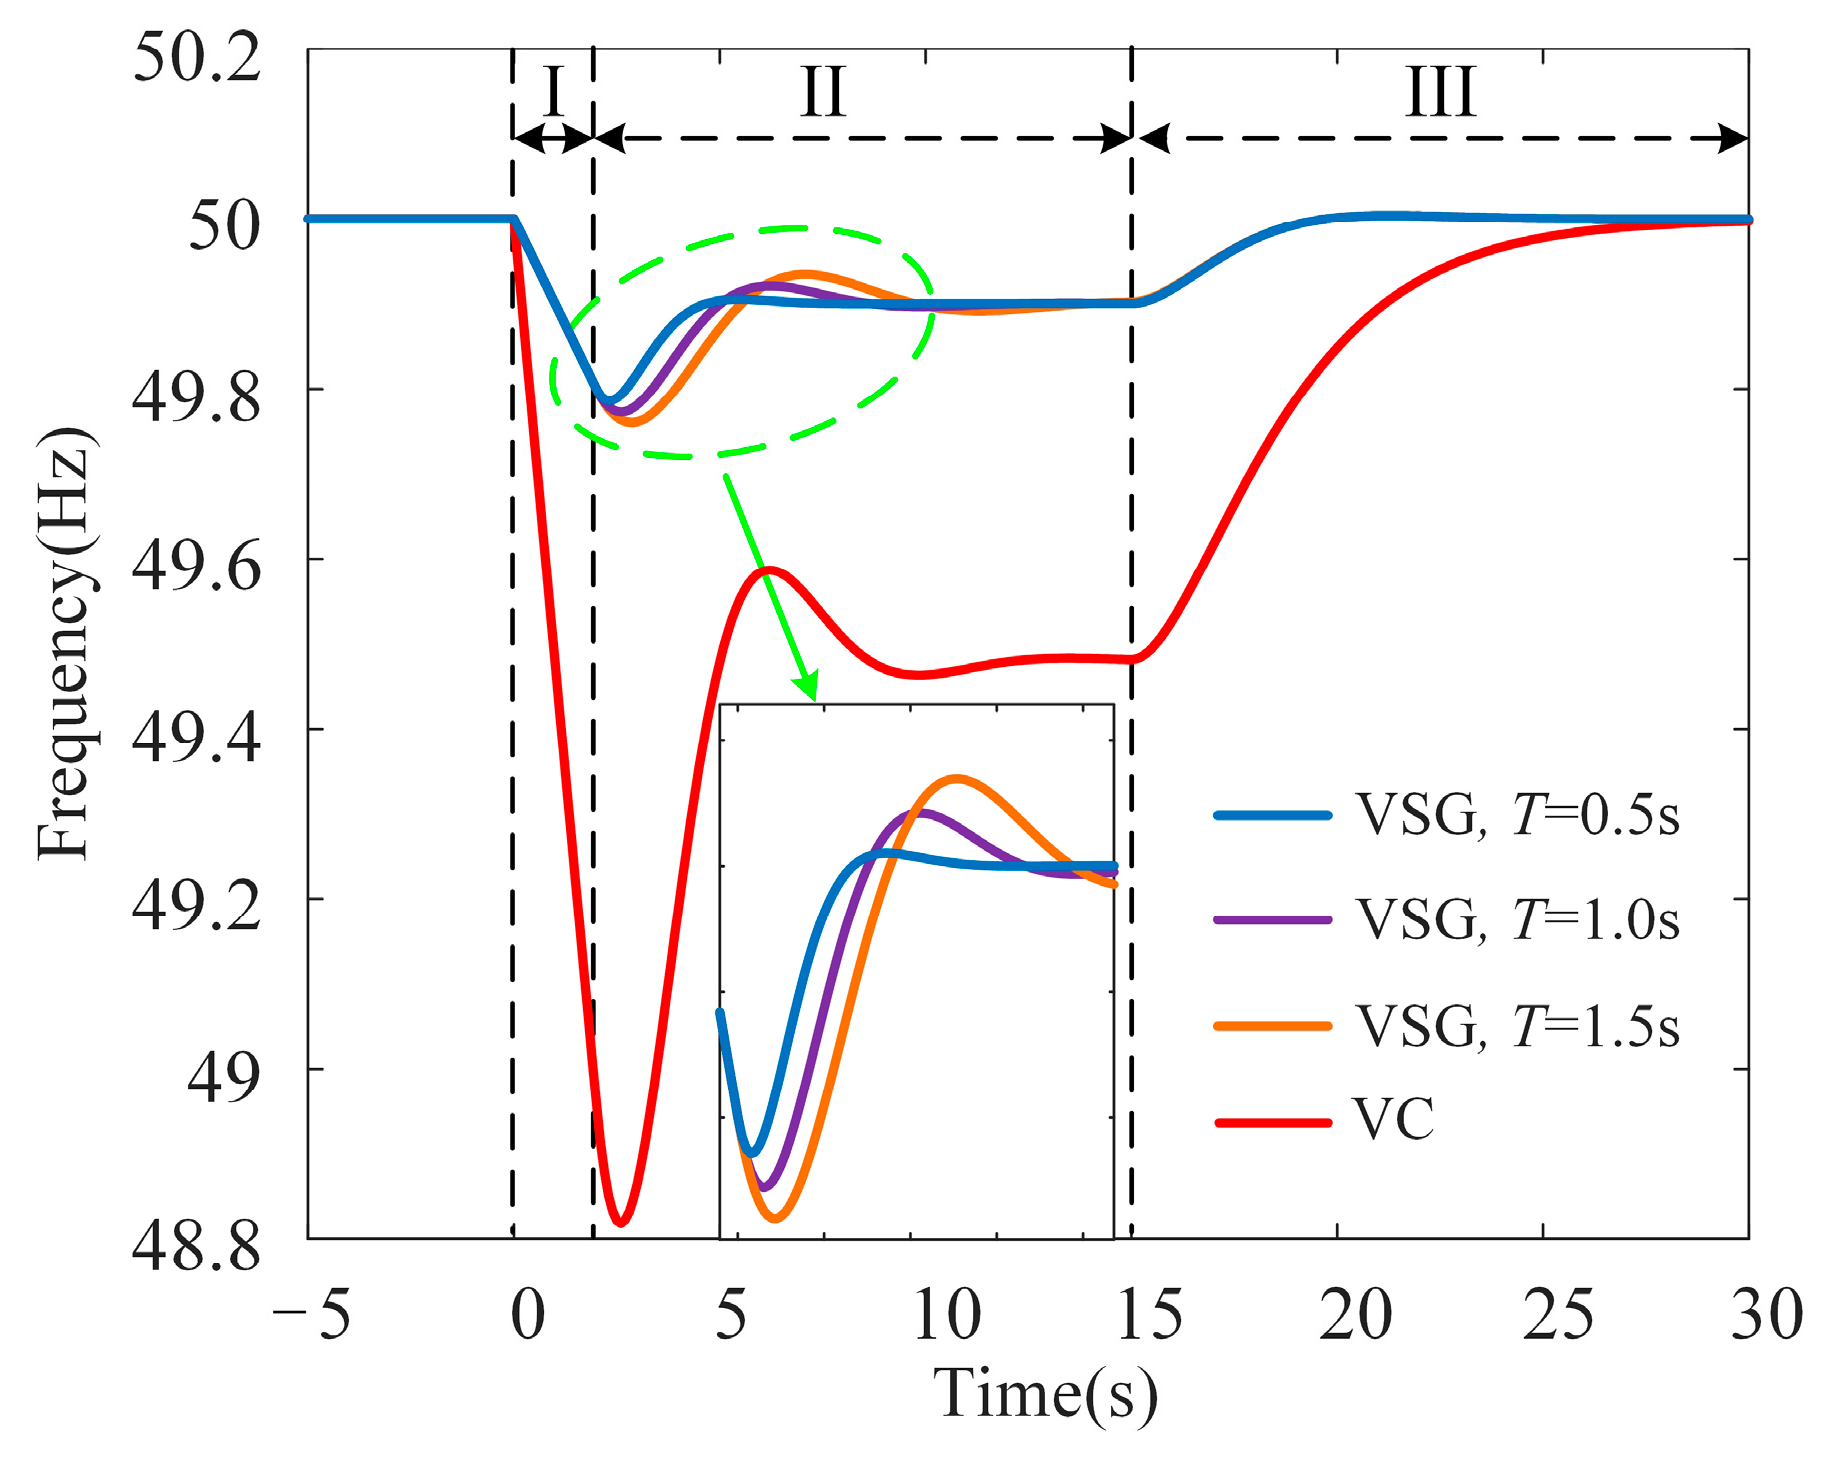
5.4. Influence of Time Constant of First-Order Filter on Transient Frequency
The influence of the time constant of the first-order filter on transient frequency is shown in
Figure 10. As the time constant decreases from 1.5 s to 0.5 s during the primary frequency regulation stage, several improvements in the system’s transient frequency response are observed. On one hand, the lowest point of transient frequency increases, which reduces the likelihood of triggering protective measures, such as low-frequency load shedding, thereby enhancing the system’s stability. A higher
fnadir helps prevent excessive frequency drops, ensuring the system remains within safe operational limits.
On the other hand, a shorter time constant reduces the time it takes for the transient frequency to reach the steady-state operating point. This reduction in adjustment time leads to a faster recovery from disturbances, further contributing to the system’s stability. By minimizing the duration of frequency instability, the system can return to normal operation more quickly, which is crucial for maintaining overall grid stability, especially during transient events.
In summary, the time constant of the first-order filter should be decreased during the primary frequency regulation stage to improve system performance. This adjustment reduces both the fnadir and the adjustment time, enhancing transient frequency stability and accelerating the system’s return to steady-state conditions.
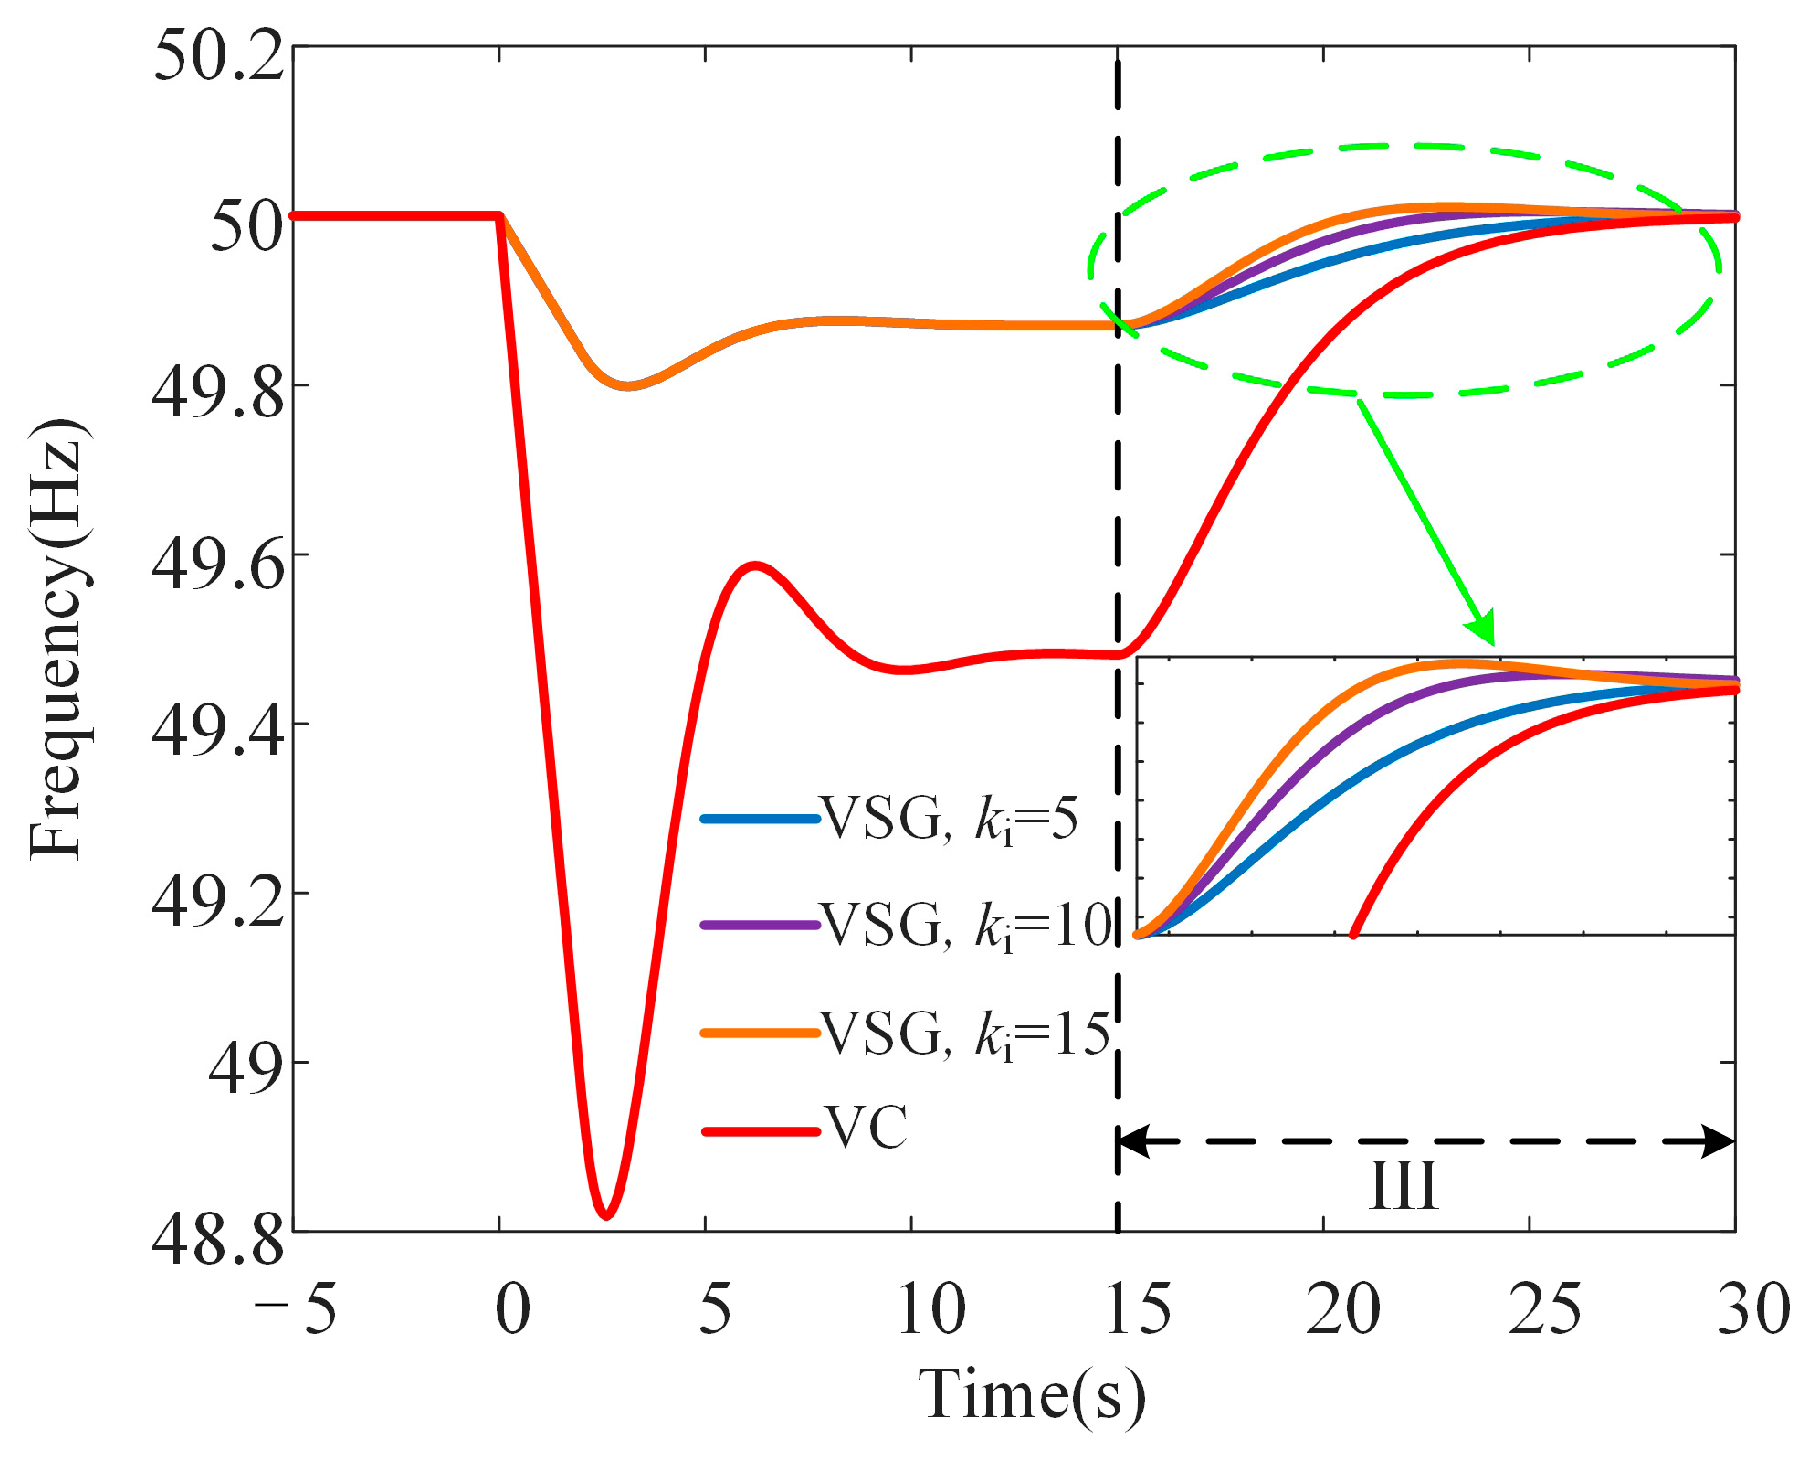
5.5. Influence of VSG Secondary Frequency Regulation Coefficient on Transient Frequency
The influence of the VSG secondary frequency regulation coefficient on transient frequency is illustrated in
Figure 11. As the coefficient increases from 5 to 15 during the secondary frequency regulation stage, the system demonstrates a significantly faster recovery to its rated frequency. This accelerated recovery minimizes the duration of frequency deviations, ensuring that the system quickly returns to stable operation after a disturbance. A faster response provided by a higher secondary frequency regulation coefficient enhances the overall stability of the power system, reducing the risk of prolonged instability that could impact system reliability and performance.
By effectively correcting the steady-state error left unresolved by primary frequency regulation, the increased secondary frequency regulation coefficient ensures that the system achieves a more precise and timely restoration of the rated frequency. This improvement not only stabilizes the system but also mitigates the potential cumulative effects of frequency deviations on connected devices and loads.
In summary, the VSG secondary frequency regulation coefficient should be increased during the secondary frequency regulation stage to enhance the system’s transient frequency stability and ensure a faster recovery to the rated frequency. This adjustment is essential for maintaining the reliability and resilience of renewable-energy-dominated power systems.

