1. Introduction
Poland has been undergoing an energy transition since 2008, which includes a 20% reduction in greenhouse gas emissions, a 20% increase in energy efficiency, and the achievement of a 20% share of energy produced from renewable energy sources [
1]. Poland has taken several measures to achieve the set goals. Until the 2020s, the primary heating source in residential construction was solid fuel boilers. The transition from fossil fuels to renewable fuels, such as pellets, has resulted in a significant reduction in air pollution, particularly during the winter. During this period, a considerable portion of harmful emissions was associated with meeting heating needs [
2,
3].
Experimental investigations on vacuum solar collectors have demonstrated that optimizing vacuum conditions can markedly enhance thermal efficiency and material performance, paralleling findings from studies on cavitation-enhanced emulsification in waste fried-oil collectors [
4] and vacuum sintering of lunar regolith simulants [
5].
The energy transition is a deliberate and long-term process, with individual goals being refined in terms of specific numerical targets and required timeframes. An analysis of current data on the primary factors responsible for environmental pollution indicates that residential buildings account for approximately 40% of energy consumption and 36% of CO
2 emissions in the EU [
6]. A similar level of energy consumption characterizes Polish residential construction [
7]. To reduce its impact on air quality, the latest Directive of the European Parliament on the energy performance of buildings was published on 24 April 2024 [
8]. It imposes a range of requirements related to increasing the energy performance criteria for buildings, the gradual phasing out of fossil fuel boilers, and the greater use of solar technologies in newly constructed residential buildings. Unfortunately, the geopolitical situation in Poland’s immediate vicinity in 2022 led to a sudden shift in the energy and economic landscape of this part of Europe. Several factors significantly influenced Poles’ awareness when choosing heating sources for both new and older buildings:
Due to the significant dependence of European and Polish energy industries on imported fossil fuels (hard coal and natural gas), supply chain disruptions and a sharp increase in prices occurred. The price of hard coal tripled, while natural gas prices did not experience such drastic spikes. However, the inability to quickly diversify fuel sources posed a real threat of total supply cuts.
Economic uncertainty regarding the availability of fossil fuels led to a substantial rise in the cost of biomass-based fuels (e.g., wood pellets), with prices artificially inflated to exploit the political situation.
The EU’s push to increase the role of heat pumps in the European energy system, combined with pro-consumer policies supporting photovoltaic installations, resulted in growing interest among Polish consumers in installing heat pumps. It is estimated that, in 2022, Poland was the largest importer of heat pumps in the EU, with sales reaching approximately 200,000 units.
The large number of installed heat pumps generated increased demand for electricity. However, Polish energy networks were unprepared for such high transmission expectations, leading to further risks of power outages during the heating season.
It is difficult to predict the future development of the Polish energy sector in the context of decentralized heating systems. The EU’s high expectations for reducing residential buildings’ heat demand, combined with the need to increase the share of energy derived from renewable sources, create an opportunity to adopt modern heating solutions such as heat pumps and photovoltaic installations. However, recent years have shown that ensuring energy security and achieving high independence in heating sources is crucial from both economic and energy perspectives. As a result of these changes, hybrid heating systems incorporating renewable energy sources are becoming increasingly popular.
Hybrid Renewable Energy Systems are understood as heating installations comprising one renewable and one conventional energy source or more than one renewable energy source, with or without conventional energy sources, operating in an autonomous mode or connected to the grid [
9]. For several years, the topic of hybrid heating systems has been widely analyzed by both the scientific community and leading manufacturers of heating equipment, who, within their product offerings, are capable of providing both renewable and conventional heat sources. Many scientific studies address the economic and environmental aspects of operating hybrid heating systems, with particular emphasis on transitioning away from fossil fuels in favor of installations utilizing electricity generated by photovoltaic panels. At the same time, the impact of such installations on the actual reduction of carbon dioxide (CO
2) emissions is considered [
10]. Assuming a significant role for heat pumps in heat energy production, it is essential to implement sufficiently efficient energy storage systems characterized by specific durability. This durability significantly influences the lifecycle of a hybrid heating installation [
11]. Due to the specific operating conditions determined by geographical location, the duration of sunlight exposure, and the range of external temperatures, a general approach to hybrid installations is not feasible. Detailed research is required to precisely reflect the actual conditions in a given country [
12,
13,
14].
In Poland, there is growing interest in hybrid heating systems. However, due to the lack of scientific studies on their design and operation, it must be noted that this is still in the early stages. The increase in interest is evidenced by the emergence of popular science articles in technical industry journals [
15,
16,
17,
18,
19].
Given the current direction of development in the European energy sector, hybrid installations in newly constructed buildings are typically designed with a heat pump or wood pellet boiler as the primary heat source, while the supplementary heat source is mostly based on solar energy. The most popular solutions include photovoltaic installations, which allow flexibility in the use of the generated electricity. This electricity can be used for heating purposes or other household needs. Due to the introduction of dynamic energy tariffs in Poland in July 2024, where electricity rates vary throughout the day, the continued use of photovoltaic installations is increasingly linked to the necessity of installing energy storage systems. Unfortunately, this solution significantly increases the cost of the heating installation and limits its efficiency during transitional periods (spring and autumn). In Poland, the dynamic development of photovoltaic installations has been evident over the past decade. However, as early as the 20th century, additional solar collector systems, which convert solar radiation into heat energy for a liquid heat carrier, were already popular. Most solar collector installations used in Poland traditionally serve only for domestic hot water preparation. However, more frequently, solar collector installations connected to a heat buffer are also used to support space heating. For example, in Germany, solar collectors initially worked solely for DHW purposes, but today more than half of such systems also support central heating. Solar energy is currently utilized in four main areas:
- –
Production of domestic hot water,
- –
Additional support for heating systems,
- –
Heating swimming pools,
- –
Assisting in generating process heat in the industry [
20,
21].
Due to the lower financial investment required for installing solar collectors, they are increasingly becoming part of hybrid heating systems, working alongside gas boilers, solid fuel boilers, or heat pumps. For a single-family house, a solar collector system for heating purposes operating in a hybrid setup can achieve savings of 10% to 30%, and under favorable conditions, even up to 40% of total heating costs. These savings are expected to grow as energy carrier prices increase [
22].
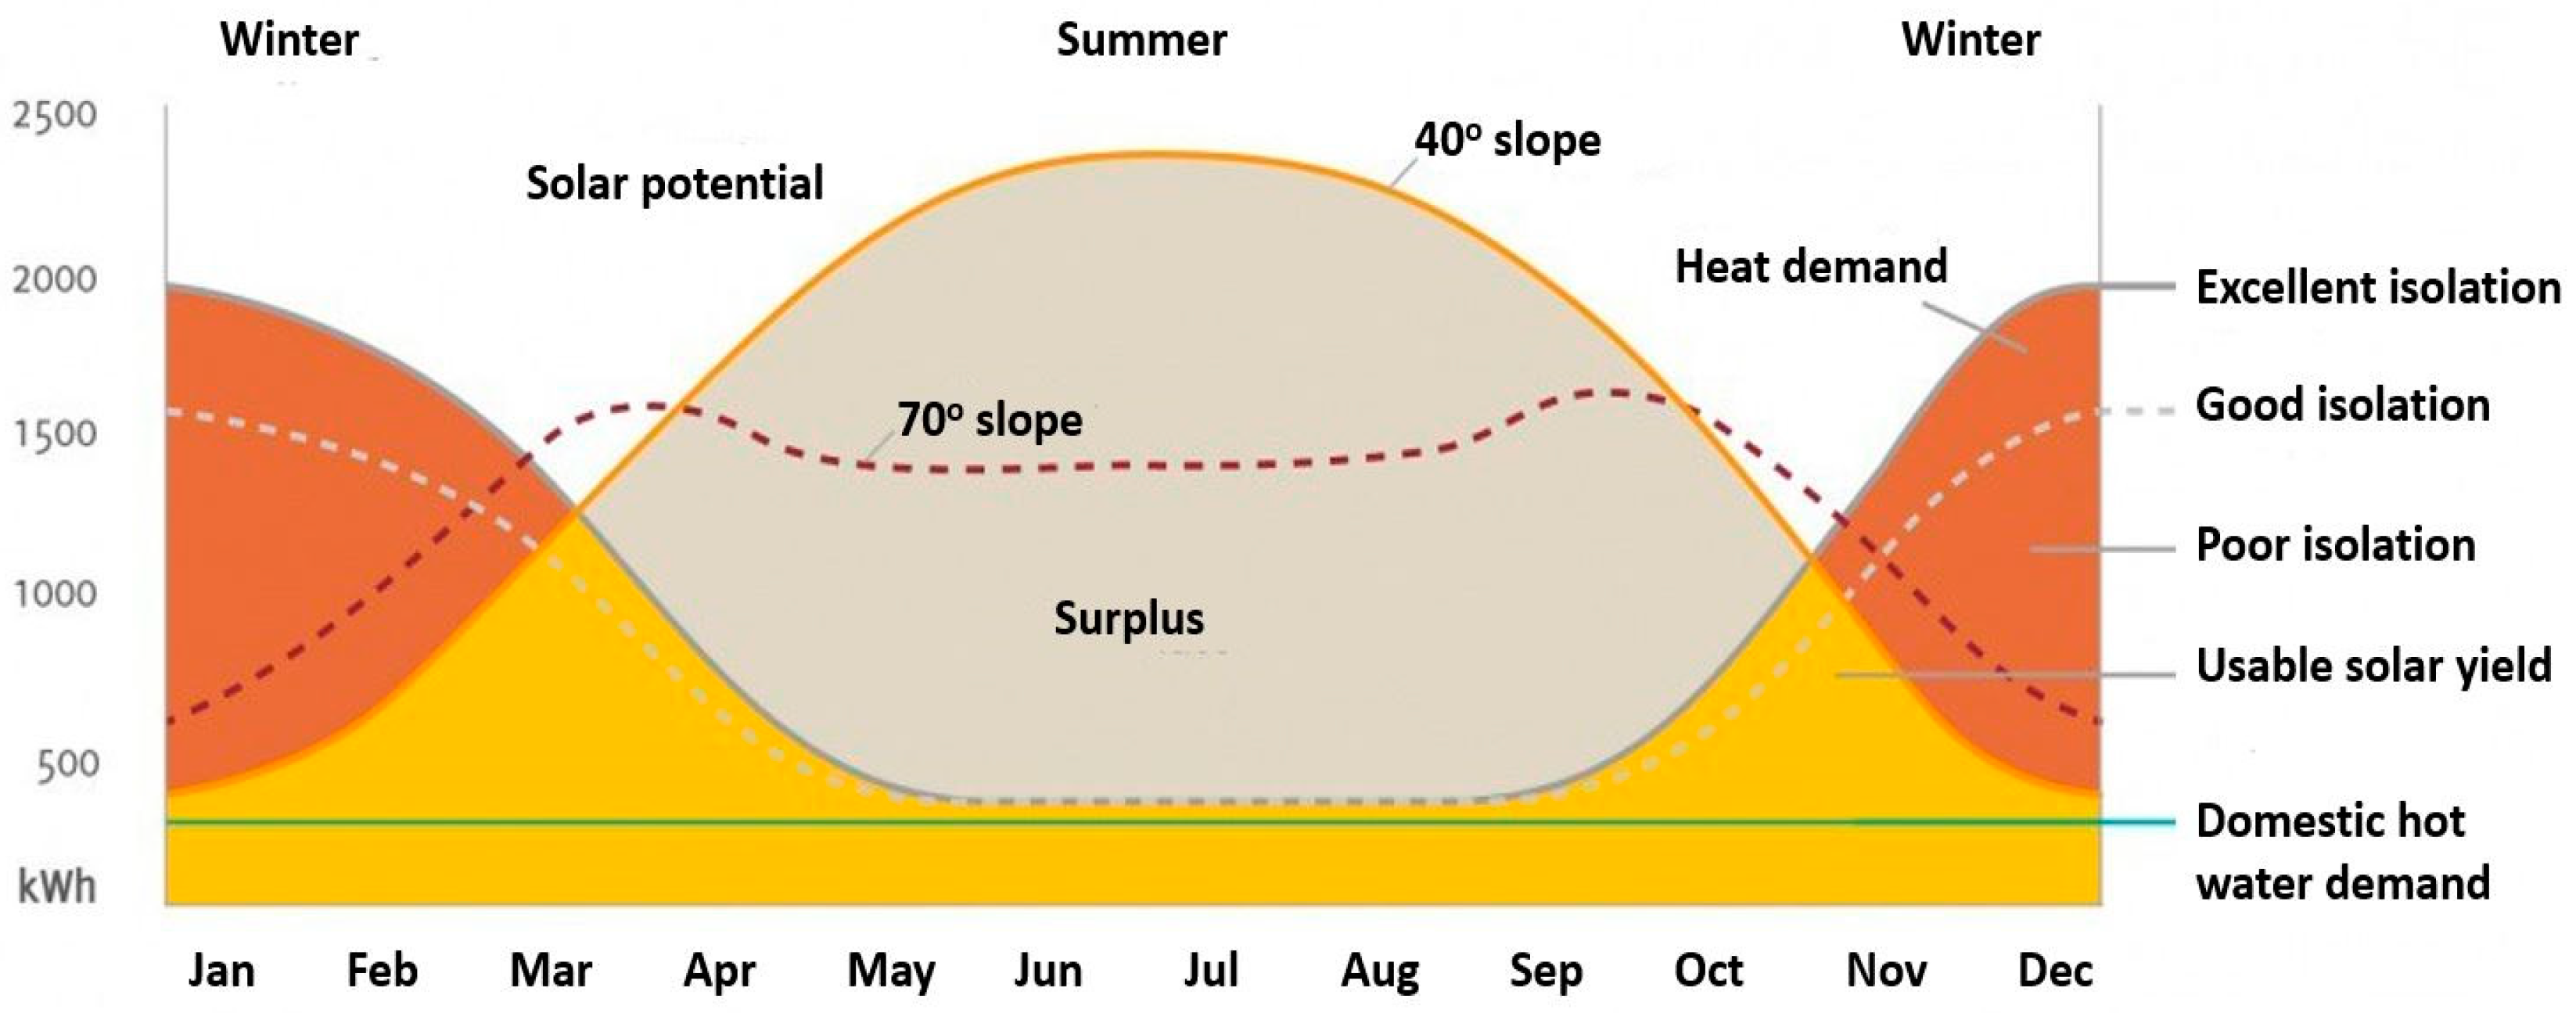
Figure 1 shows the annual balance of solar heat supply, and heat and hot water demand determined for the German area by the Sonnenhaus-Institut eV. It shows that despite the investment in a solar system equipped with a heat storage unit (allowing for short-term heat energy storage), the effectiveness of such systems is greatest during the autumn and spring months. When analyzing hybrid heating installations, not only in terms of energy efficiency but also considering the payback period, the economic factor associated with the total installation cost of all system components plays a key role. A solution utilizing solar energy that features a simple design and low production costs is the air solar collector. In air collectors, solar radiation energy is transferred to the absorber, which heats the air flowing through it. Air solar collectors offer several advantages, including no risk of the working fluid freezing, direct use of the working fluid to heat rooms, and fast response times. They can be constructed as uncovered systems, where solar radiation directly hits the absorber, or covered systems, with the absorber placed under a transparent cover. Depending on the design of the collector, the airflow may pass above the absorber, below it, or in more advanced designs, both above and below the absorber or through the absorber itself [
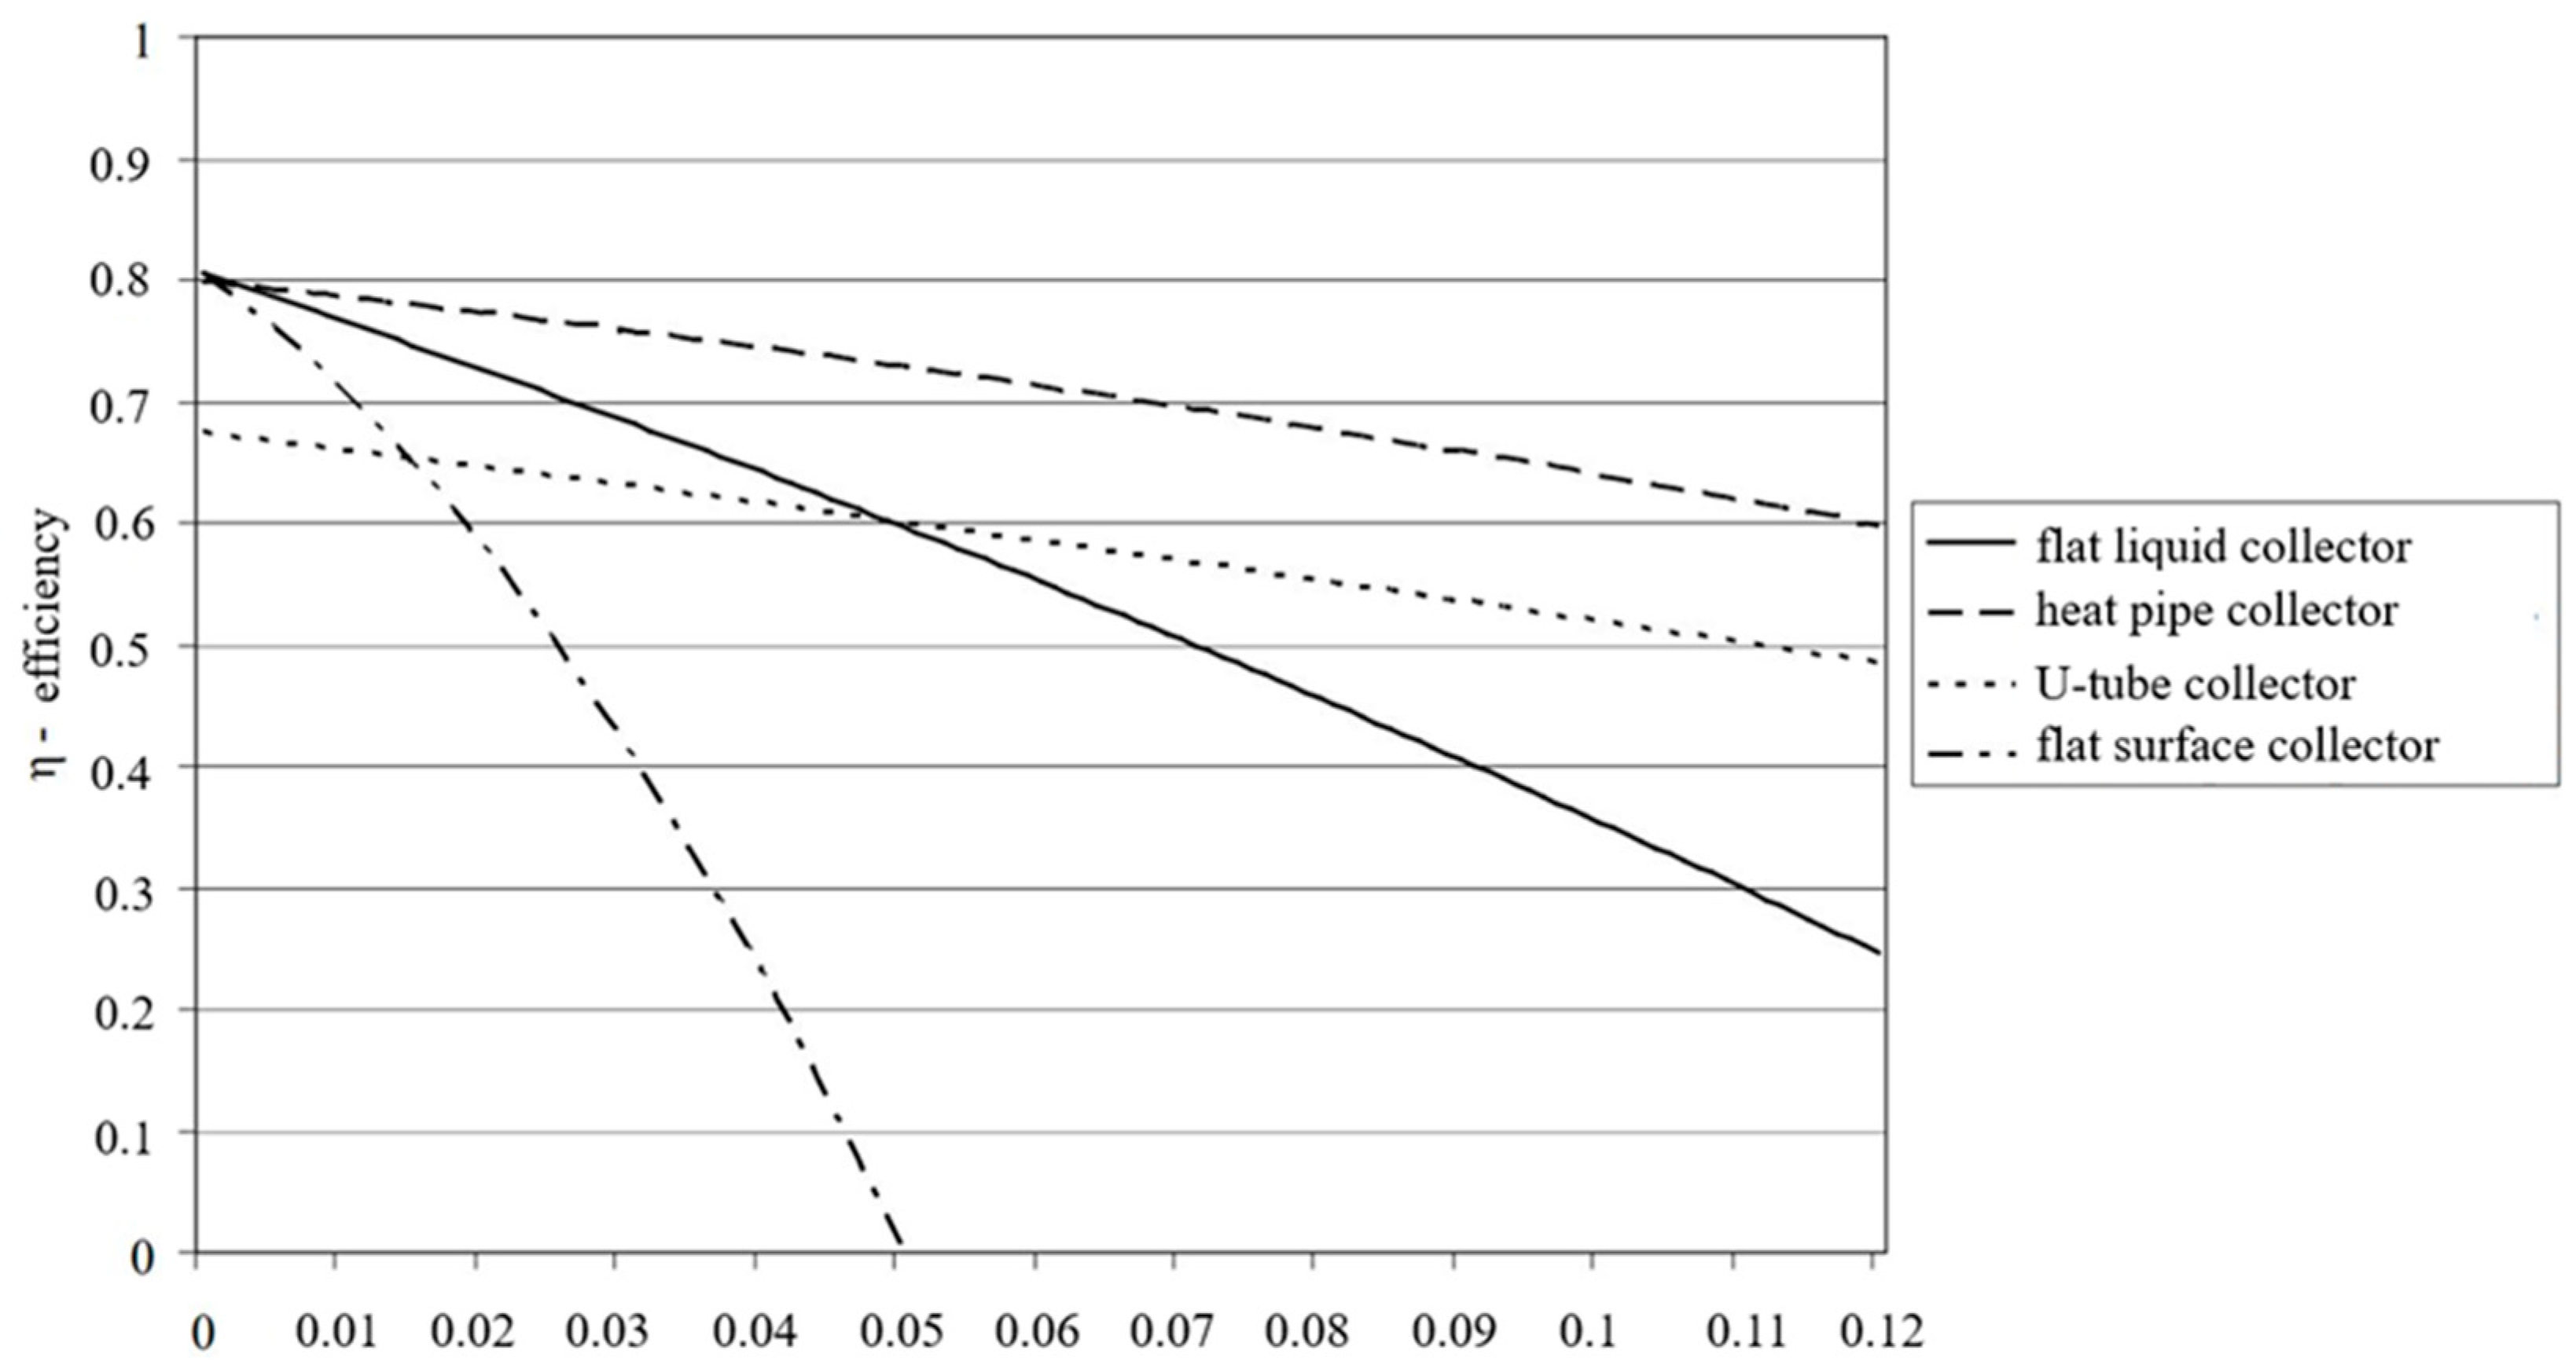
22]. Air solar collectors are characterized by high efficiency in converting solar energy into thermal energy [
22].
Figure 2 presents a comparative chart of the efficiency curves for selected solar collectors.
Despite their simple design, air solar collectors represent a complementary heat source, with efficiency dependent on various factors. Their design parameters are subject to experimental studies, as well as numerical simulations [
19,
24,
25,
26,
27,
28,
29]. The presented research results highlight the high potential of air solar collectors in hybrid heating systems. However, as with other heat sources, to improve energy efficiency, detailed experimental studies are necessary within the target climatic zone. Examples include studies conducted in Iraq [
30] and Poland [
22]. In the studied facility, an air-to-water heat pump is used for heating purposes, serving as the primary heat source. The authors of the article undertook an assessment of the validity of using the developed design as a supplementary heat source in a hybrid system [
23,
31,
32,
33]. There are also known tests of the operating properties of a vacuum solar collector for air heating [
34]. Direct contact membrane tubular desalination systems driven by heat pipe solar collectors were also investigated [
35].
The objective of the conducted study was the practical identification of the potential for utilizing air solar collectors as an auxiliary heating source. The obtained results demonstrate the feasibility of applying the proposed design in individual heating systems. Unlike previous research studies, the focus was placed on the practical aspect of implementing the designed construction in existing residential buildings. Numerical simulation aspects were omitted in favor of analyzing the device’s operation under real conditions. The broad scope of topics covered—including design work, experimental research, and analysis of the obtained results—narrowed the mathematical calculations to parameters related to the effective power (Pu) at the solar installation’s output. Based on actual data on building heat demand, external temperature distributions, and the amount of generated thermal energy, actions were taken to define the target technical design of the innovative air solar collector solution. The study presents experimental research results for the climate of central Poland. The research was conducted between 2022 and 2024, allowing for modifications to the device’s original design, adjustments to the planned thermal output, and the development of a heat distribution system for a single-family house. Due to the need to install the system on a building’s façade, the modified design also incorporated mounting elements and aesthetic considerations, providing a basis for the device’s commercialization.
2. Materials and Methods
The first stage of the work involved designing and constructing the basic structure of tubular solar collectors. This phase analyzes available design solutions and selects one that meets the expected performance requirements while considering available production technologies. In the second stage of the research, from November 2022 to April 2023, experimental studies were conducted on a real residential building to verify the selected and designed solar system structure. Based on the measurement results, modifications were introduced to the designed structural solution. In the third stage of the research, a second version of tubular air collectors was designed and constructed. Their energy parameters and structural mounting solutions allowed for their use in supporting heating functions in a single-family house. In the fourth stage, from October 2023 to April 2024, experimental research was conducted in a newly built residential building where the designed solar system functioned as a supplementary heat source.
2.1. Tubular Air-Collector Designs
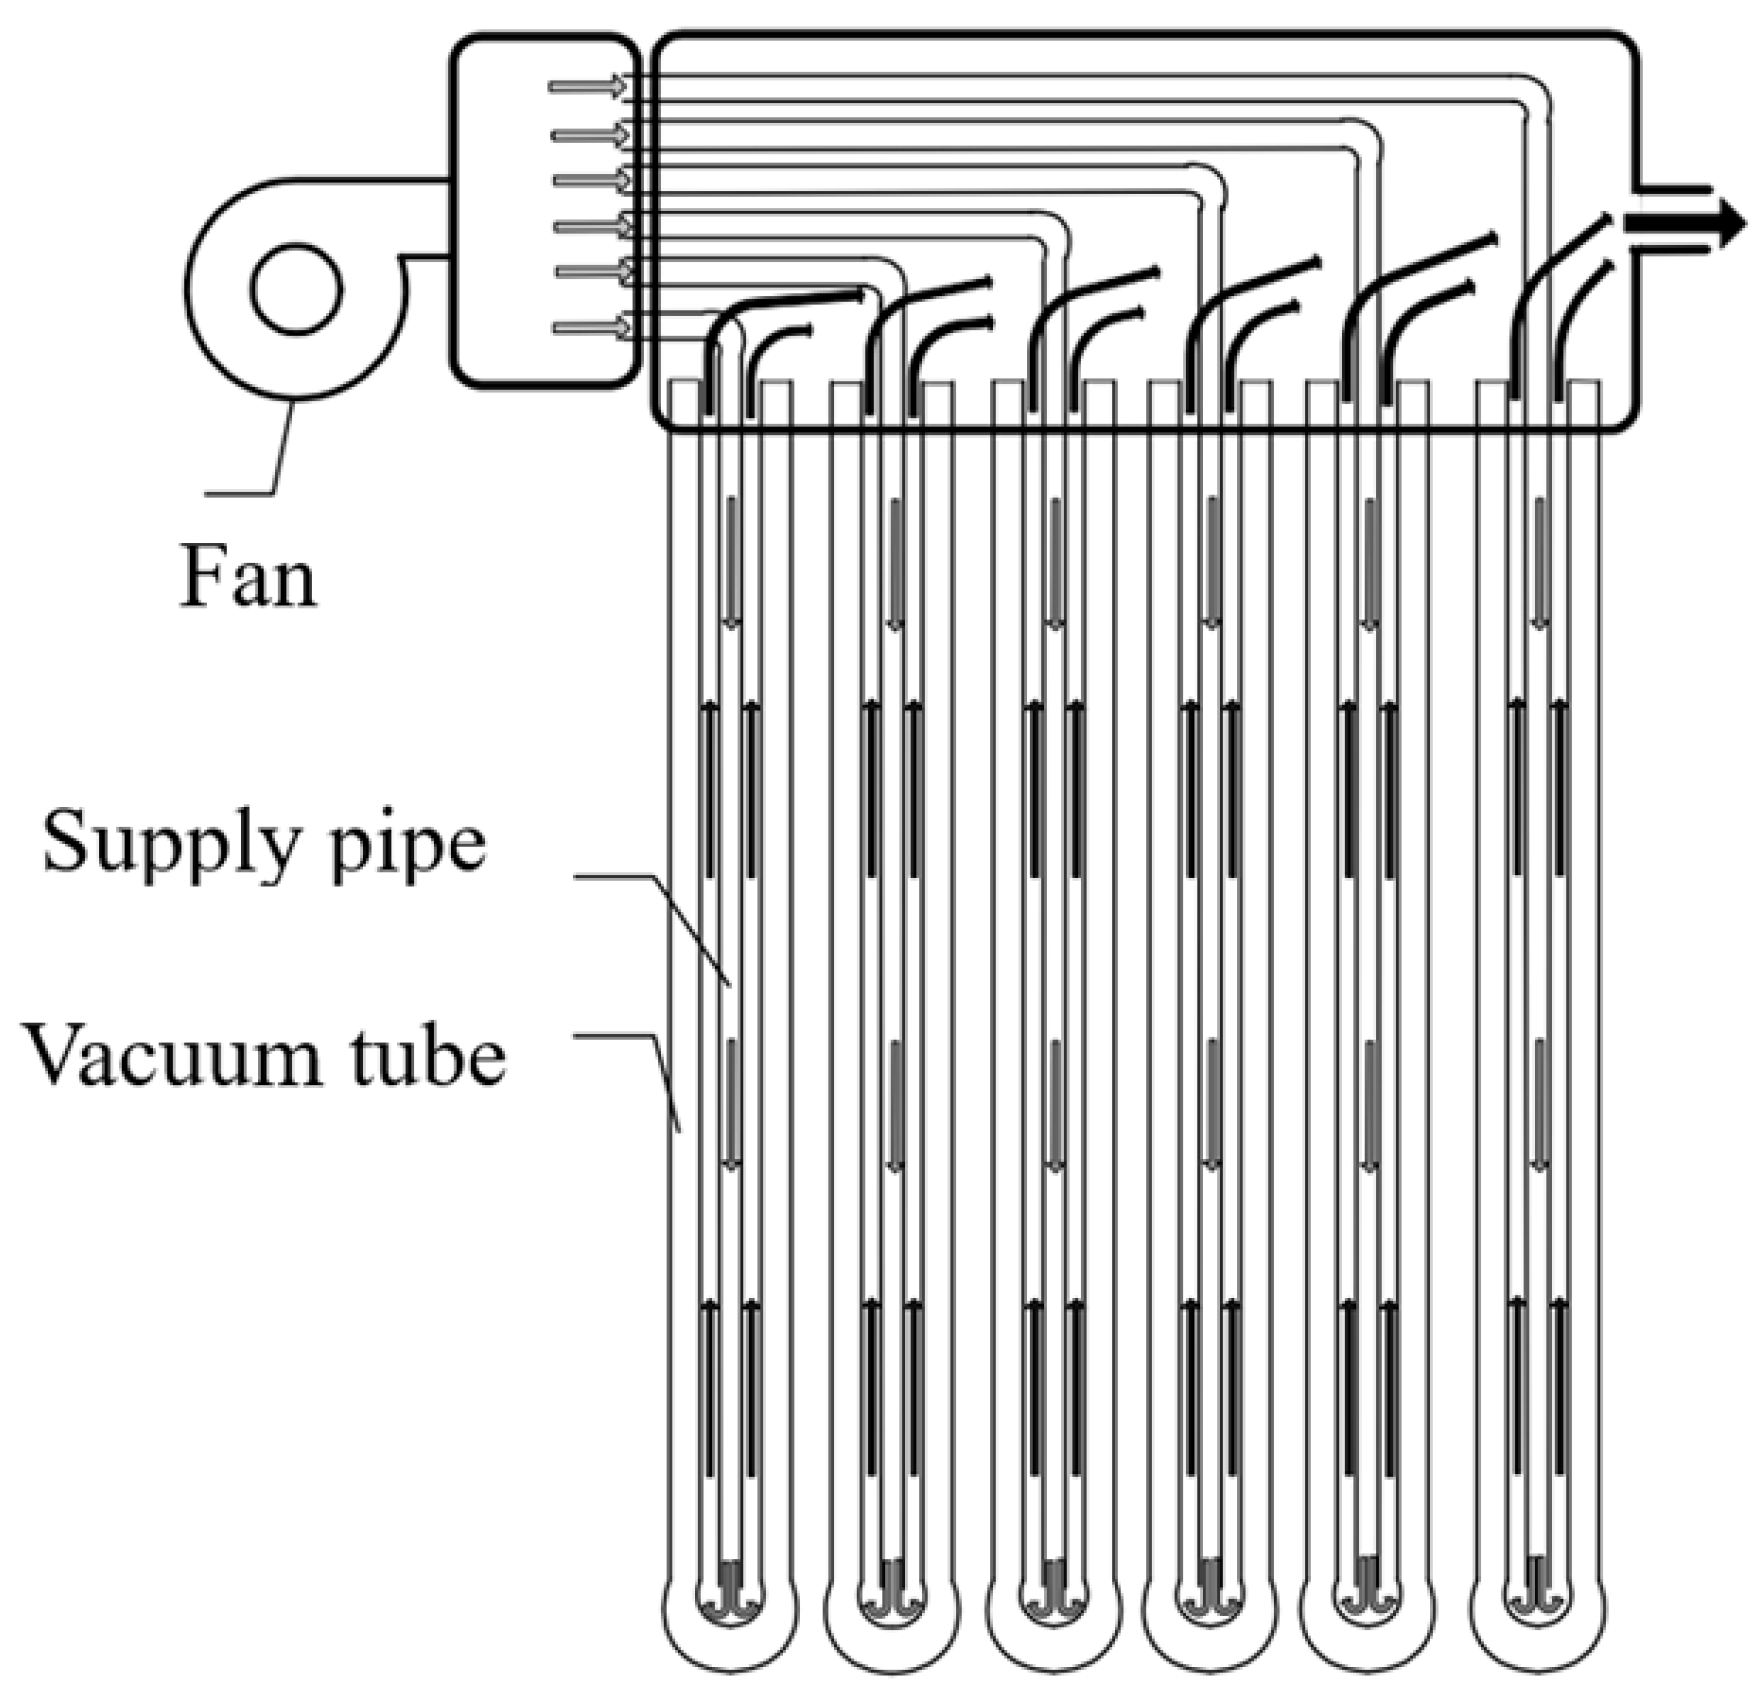
The primary purpose of tubular air collectors is to heat the airflow passing through vacuum tubes. The construction of these collectors consists of a set of glass vacuum tubes that absorb solar energy and air supply tubes that direct air to the lower section of the glass vacuum tubes. The operation of the collector can be described as follows: Air, compressed by a fan, is directed to the lower part of the vacuum tube. Inside the vacuum tube, the air absorbs thermal energy. The heated air is then delivered to a collective collector [
36]. A schematic diagram of the operation of the basic tubular air-collector design is presented in
Figure 3.
The vacuum tubes employed in the collectors are characterized by high solar energy absorption and low emission rates. They also absorb energy from diffuse solar radiation. The simple construction of the collector facilitates straightforward installation. Lightweight collector modules for air heating can be installed independently or as collector arrays on roofs, wall façades, or designated sunny areas. By using appropriate materials, these collectors avoid issues of overheating during intense sunlight or stagnation periods. The integration of a system for distributing the air heated within the solar collector ensures high device efficiency and thermal output [
36].
To enhance solar energy absorption, both versions of the collectors were constructed using vacuum tubes with a triple absorber (AL./AIN-SS/CU) featuring an external diameter of 58 mm and a length of 1800 mm. The tubes were made from borosilicate glass. In the triple magnetron metallization process, an absorber was applied to the tubes that captures solar radiation and converts it into thermal energy. Additional absorber layers are designed to retain as much energy as possible inside the tubes and prevent heat loss via infrared radiation. The absorptive layer was enriched with copper, improving its efficiency by up to 12% compared to older designs. The temperature resistance of the tubes used reaches up to 300 °C [
31].
Table 1 presents the basic technical parameters of the evacuated tubes used.
The purpose of the first stage of experimental research was to verify, in practice, the correctness of the operation of the author’s design of an air solar system. Having a real residential building at our disposal, the following boundary conditions were adopted as the starting point for the design and installation of the device:
- (a)
The designed thermal output of the airborne solar system should not exceed the theoretical thermal energy demand of the heated room. For the selected building, the calculated thermal energy demand is 50 W/m2.
- (b)
The heated air supply system should allow at least one air change per hour in the heated room.
- (c)
Non-invasive installation and removal of the system is assumed, which will eliminate the need for renovation of the building.
- (d)
The solar installation should face south.
In the first stage of research, a test stand was designed and built, consisting of five vacuum tubes mounted on a support frame. The construction of the test stand designed and built in the first stage of the research is shown in
Figure 4. The device was named Solar Dragon 2022.
The structural components of Solar Dragon 2022 were mounted on a support frame (2). The support frame was made from 18 mm thick laminated chipboard. Its external dimensions were 2160 mm in height and 1200 mm in width. The heat-exchanger housing was also constructed from chipboard, comprising two side panels (140 mm × 1200 mm) and one front panel (125 mm × 1200 mm). All three panels forming the heat-exchanger housing were thermally insulated on the inner side with a 3 mm thick thermal screen covered with aluminum foil.
The solar collector operates in a closed-loop system: An intake fan (4) supplies room-temperature air from inside the building to the cold-air chamber (6). Pressure in the cold-air chamber drives the air through aluminum inlet pipes (3), where it is heated inside the solar vacuum tube (8). The heated air is transferred to the hot-air chamber (7) and distributed to the heated room using an exhaust fan (5).
The construction was installed at a 90° angle in the terrace door of a single-family house. The solar installation heated a room with a total volume of approximately 78 m3. Mounting the structure at a 90° angle eliminates the need for additional supporting structures. The design ensured a snug fit within the terrace door opening. To create a forced air-circulation system, a 120 mm diameter intake duct fan (4) powered by 230 VAC was used. The maximum efficiency of the intake fan is 150 m3/h. The function of transporting heated air to the heated room was performed by the exhaust fan (5), powered by a 12V DC voltage, with a maximum efficiency of 87.5 m3/h. The regulation of the solar installation was carried out by an electronic thermostat, which activated the fan when the temperature in the central solar tube exceeded the set value. During the research period, the activation temperature value was adjusted depending on external conditions and the observations of the researchers.
Based on the measurement results obtained between November 2022 and April 2023, as part of the third stage of research, the design of the vacuum air collector was modified.
The authors of the article confirmed the validity of using an additional heat energy source, which, for the next stage of research, underwent the following modifications:
- –
The purpose of Solar Dragon 2022 was to provide thermal energy to a single room with an area of 30 m2, so only five pieces of vacuum tubes were installed with a total thermal output of about 0.5 kWh. As part of the implementation of the third stage of the study, the modified installation was designed to act as a reheating system for a single-family house with a floor area of 113 m2. For this purpose, the number of vacuum tubes was increased to 24 pieces, with a total thermal output of about 2.4 kWh.
- –
The supply system of heated air should allow at least one air exchange per hour in the heated room.
- –
Assumed permanent installation of the system allowing interference with the structure of the building.
- –
Installation of the system facing south.
- –
Due to the observed airflow resistance and uneven pressure distribution in the first design, modifications were introduced to the heat-exchanger system to improve airflow through the tubular installation. The proposed structural modification involved tilting the partition separating the warm and cold-air chambers to reduce the flow area and increase air pressure in the tubes located farthest from the inlet and outlet openings connecting the exchanger to the building’s ventilation system.
- –
To reduce device costs and limit the weight of the finished product, a two-section design was chosen. The chipboard panels, which in the first version of the device served as the mounting frame and heat-exchanger casing, were eliminated. The modified design required shifting the responsibility for assembling the finished device from the collector manufacturer to the installer, who would carry out the installation on-site.
Figure 5 presents the construction of the modified version of the vacuum air collector installation, named Solar Dragon 2023.
In the modified device design, the fundamental operating principle remained unchanged. Thus, the device still uses indoor air (from rooms with lower temperatures), which then flows through the upper part of the collector and moves downward through the inner aluminum tubes inside the solar tube. Due to the vacuum created by the intake fan, the air heated in the vacuum tubes (8) is transported to the hot-air chamber (6) and then supplied to the building.
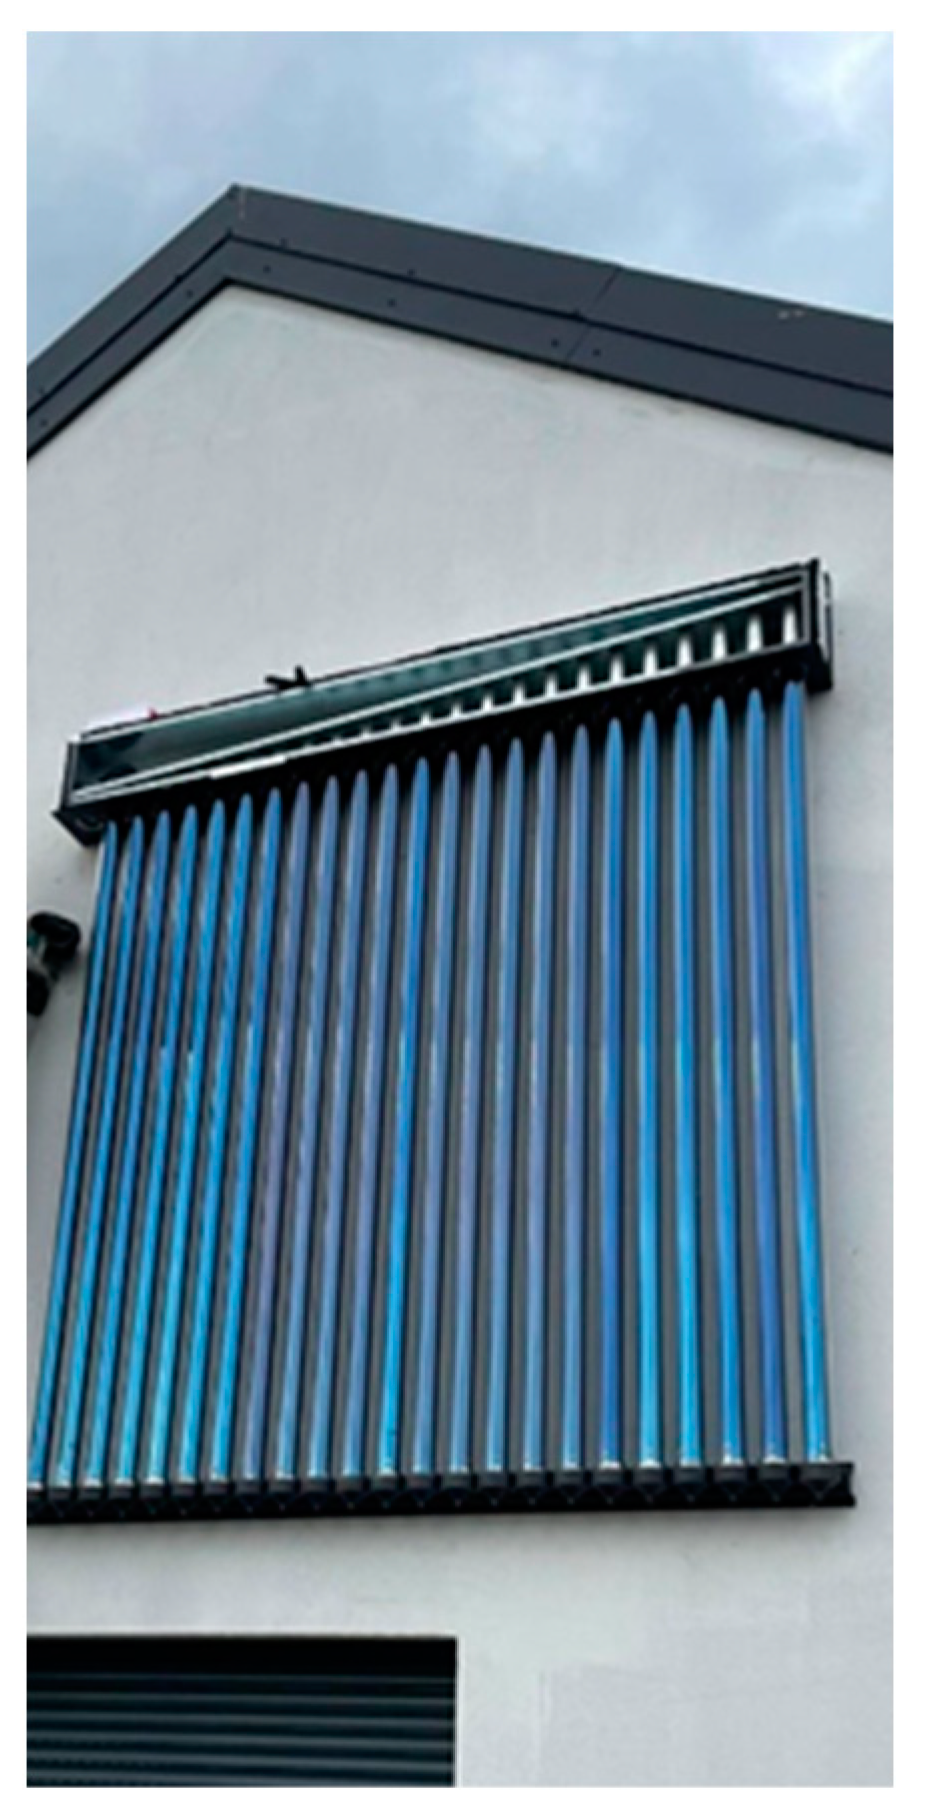
Figure 6 presents the view of Solar Dragon 2023 installed on the façade of the residential building where the research was conducted.
The collector structure consists of a set of 24 glass vacuum tubes that absorb solar energy. Each vacuum tube (8) contains an aluminum tube (6) connected to the upper part of the main heat exchanger (5). Thanks to the AN1 intake fan with a capacity of 400 m3/h, compressed air is delivered through the upper part of the exchanger (5) to the lower section of the tube (6). The air then flows from bottom to top along the entire length of the inner part of the vacuum tube (8), absorbing heat energy, becoming heated, and being directed to the lower chamber of the main heat exchanger (7). The lower section of the exchanger connects the open ends of each vacuum tube (8), guiding the heated air through the outlet (9) into the room. The cold-air inlet is connected to the supply fan via an 8 m long insulated flexible aluminum duct. The hot-air outlet is connected to an intake grille located on the ceiling of the room via an insulated flexible aluminum tube.
The control and activation of the airflow are managed by a speed controller with a thermal probe. The fan is powered by 230 VAC, and its maximum noise level is 65 dB. The thermal probe is installed inside the solar tube, with its placement determined experimentally. The supply fan is activated when the temperature inside the solar tube reaches 40 °C. The hysteresis is set to 5 degrees. The cold-air supply tubes are made of aluminum and serve as a thermal energy storage medium. The diameter of the 24 aluminum tubes was carefully selected to balance the airflow across the entire system. For insulating the heat exchanger, self-adhesive rubber foam with aluminum, 19 mm thick, was used.
2.2. Design of the Measurement and Data-Recording System
Both in the second and fourth stages of the research, it was necessary to continuously record multiple temperature readings at fixed time intervals. The required measurement accuracy was set at 0.5 °C within a temperature range from –10 °C to 85 °C. For temperature measurements, six electronic relays, TH10/TH16, were used, each equipped with DS19B20 digital temperature sensors, communicating with the relay via a single-wire 1 Wire bus [
32]. Sensors without an additional protective housing were used for the measurements, so the temperature conversion time was less than 750 ms for the 12-bit measurement resolution used. The applied resolution provides a measurement accuracy level of 0.0625 °C. The electronic relays featured built-in 2.4 GHz WiFi communication modules, enabling real-time transmission of measurement data to the Internet.
The system for recording and analyzing measurement data was implemented on the external SUPLA platform, which allowed for the direct registration of all measurement data. This solution eliminated the need for an independent data-recording system. The SUPLA environment allows for continuous registration of specified measurement data, real-time analysis within a graphical interface, and exporting measurement data to CSV files [
37].
Figure 7 presents a sample dataset recorded during the research using the SUPLA environment.
During the research, a maximum of six measurement systems were used, which performed the following functions in different research stages:
2.3. Calculation Methodology
Air solar collectors, using air as the working medium, allow for operation over a wide temperature range. At temperatures typical of Earth’s climate, air is resistant to phase changes, so the operation of air collectors does not cause difficulties related to temperature fluctuations. Additionally, the heated air from the collector can be used directly for heating a building without intermediary factors. The use of warm airflow from the collector can also ensure excellent ventilation of designated rooms. A significant advantage of air collectors is the easy control of the airflow, the ability to quickly adjust temperature, and the capability to monitor the thermodynamic state of rooms [
22]. The absence of a working medium sensitive to low temperatures, as well as the elimination of heat exchange losses between working mediums, guarantees high efficiency.
One of the fundamental parameters characterizing an air collector installation is the effective power (
Pu) obtained at its output. However, to fully characterize the operational properties of air solar collectors, the following parameters are used: thermal efficiency, airflow rate, and collector surface area. The most important parameter of a collector is its thermal efficiency, defined as the ratio of the useful energy received by the medium (effective power) to the solar radiation energy delivered to the collector—input energy, as determined by Equation (1).
where
Pu—effective power (W);
I—solar radiation intensity (W/m
2); and
A—collector surface area (m
2).
Based on the inlet and outlet air temperatures of the collector, the amount of energy, Q, is determined by Equation (2):
and, respectively, by Equations (3) and (4),
where
Q—amount of energy transferred by the collector (J/s);
mp—mass of the heated medium (kg);
—air density (kg/m
3);
cp—specific heat capacity of the heated medium (J/kg·K);
tk—outlet air temperature from the collector (°C);
tp—inlet air temperature to the collector (°C);
Vp—flow rate of the heated medium (m/s);
—volume flow rate of the medium over time (m
3/h); and
t—time of medium flow (s).
Thus, the effective output power,
Pu, obtained at the collector outlet is given by Equation (5) [
34].
3. Results
The actual nature of the research, taking into account factors such as external temperature, solar radiation, building orientation, and solar installation positioning, provided a range of information that was further analyzed to assess the feasibility of using tubular air collectors for residential heating. To fully replicate and compare the energy gain obtained from the first and second Solar Dragon designs, the same parameters were analyzed in both cases.
The total amount of thermal energy produced was categorized by month. Both designs differed in the number of installed vacuum tubes, which resulted in significant variations in the amount of energy generated. However, this differentiation allowed for evaluating the scale of the installation that could play a significant role in the overall energy balance of the building. At each research stage, specific months were selected for a detailed analysis of the following parameters:
- (a)
Comparative analysis of the total amount of thermal energy produced (kWh) for individual days about the average external temperature on that day (°C). The applied comparison does not reflect the actual relationship between the external temperature and the amount of energy obtained, as the solar installation operates only when solar radiation is present. Consequently, the actual operating time of the installation was only a few hours per day. Meanwhile, the average external temperature accounts for temperatures recorded over 24 h. During the analyzed months, there were significant temperature fluctuations between day and night, which significantly lowered the average external temperature value. Despite the inaccuracies characterized by the applied methodology, its analysis allows for identifying the relationship between external temperature and the produced thermal energy, which is crucial for the energy balance of a residential building.
- (b)
Comparative analysis of the total amount of thermal energy produced (kWh) for individual hours in relation to the average external temperature at that hour (°C). A graphical visualization of the processed data allows for assessing the actual operating potential of the tubular air installation over a full 24-h period. At the same time, it enables the identification of the relationship between external temperature and energy generated in a given time unit.
- (c)
Analysis of average temperature values divided into hourly time intervals. Simultaneously, the following were compared: average external temperature, average inlet temperature of the solar installation, and average outlet temperature of the solar installation. The analysis aimed to assess the temperature differences between the external temperature and the inlet temperature. These differences may result from the positioning of the temperature sensors or the preliminary heating of the incoming air by the ventilation system. The temperature difference between the inlet and outlet of the solar installation directly indicates the amount of generated thermal power. Recording and analyzing the outlet temperature values of the solar installation provides additional information for the article’s authors regarding the potential need to mix the outlet air to reduce its temperature. This may be necessary due to the introduction of heated air into the residential area, which could cause discomfort due to excessively high temperatures.
- (d)
Comparative analysis of the average external temperature and the average outlet temperature of the solar installation concerning the average energy generated by the collector for hourly time intervals. Based on the useful energy value presented in Equation (5), produced by the solar installation, additional guidelines for the control system can be developed. By maintaining the current power of the collectors, the system would be responsible for ensuring a constant outlet temperature (tkby) regulating the flow rate of the working medium over time (m3/h) through adjustments to the fan efficiency.
3.1. Analysis of Experimental Research Conducted Using Solar Dragon 2022
All recorded temperature profile data were presented in the form of sixth-degree polynomial interpolation. The calculations were made to improve the readability of the graphs and to facilitate the analysis of the obtained results. The research conducted from November 2022 to April 2023 was carried out in a single-family house built and commissioned in 2019. The solar installation heated a 30 m
2 living room. The building is located in Southern Wielkopolska, within Poland’s second climatic zone. The total building area is 135 m
2, with an internal volume of 785.545 m
3. An energy audit was conducted for the building, according to which the calculated primary energy (PE) demand is 89.23 kWh/(m
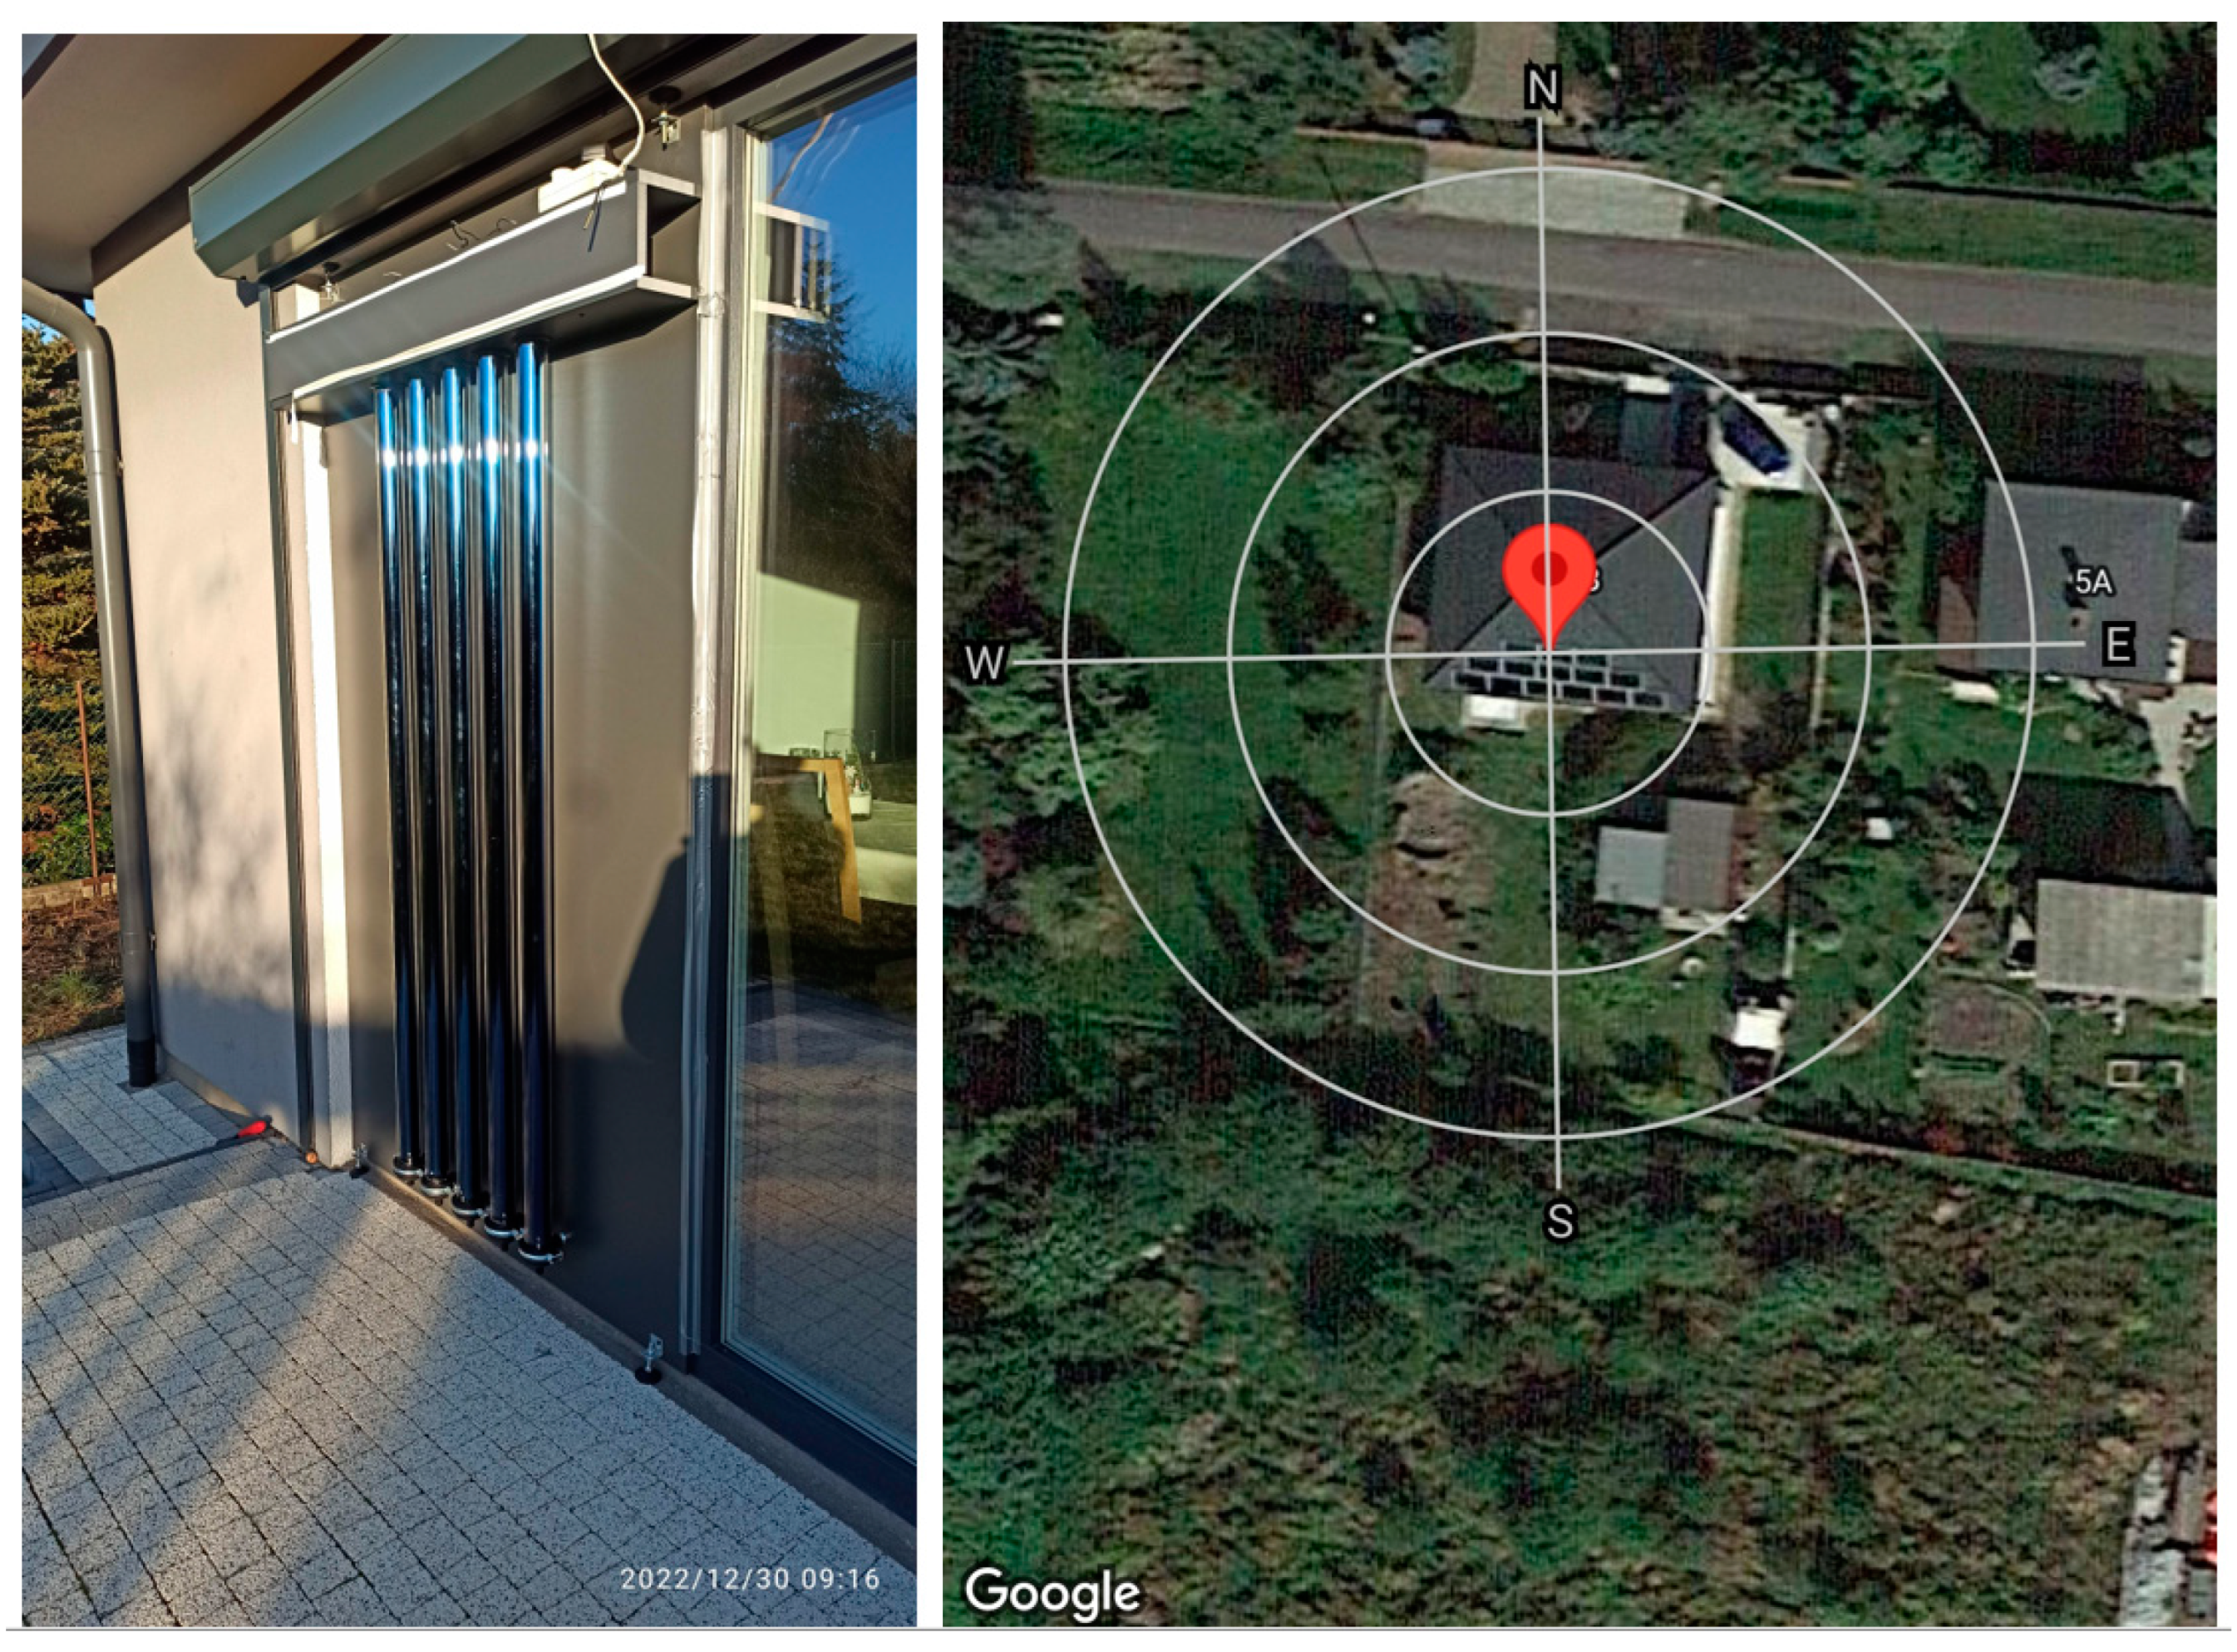
2·year). The placement of the installation concerning the cardinal directions is shown in
Figure 8. The structure was mounted facing south, with a 5% deviation toward the west.
During the analyzed period from November 2022 to April 2023, the Solar Dragon 2022 air solar installation, consisting of five vacuum tubes, supplied 397.67 kWh of thermal energy to the building. The total amount of thermal energy generated in each month of the study period is presented in
Figure 9. During the winter months, from November to February, the monthly amount of thermal energy produced ranged from 21 kWh to 26 kWh. In March and April, the total monthly thermal energy production ranged from 145 kWh to 150 kWh. Due to the low thermal energy production during winter months, the month of March was selected for further analysis.
The average external temperature values, along with the total amount of thermal energy produced for each day of March 2023, are shown in
Figure 10. During the analyzed period, the average external temperature ranged from 1 °C to 14 °C. In the Polish climate, such temperature values necessitate heating buildings to ensure thermal comfort for residents. No clear correlation was observed between external temperature and the amount of thermal energy produced, which indicates that the efficiency of the designed tubular air collector installation depends on solar radiation rather than external temperature fluctuations. The average daily thermal energy production ranged from 0.2 kWh to 12.2 kWh.
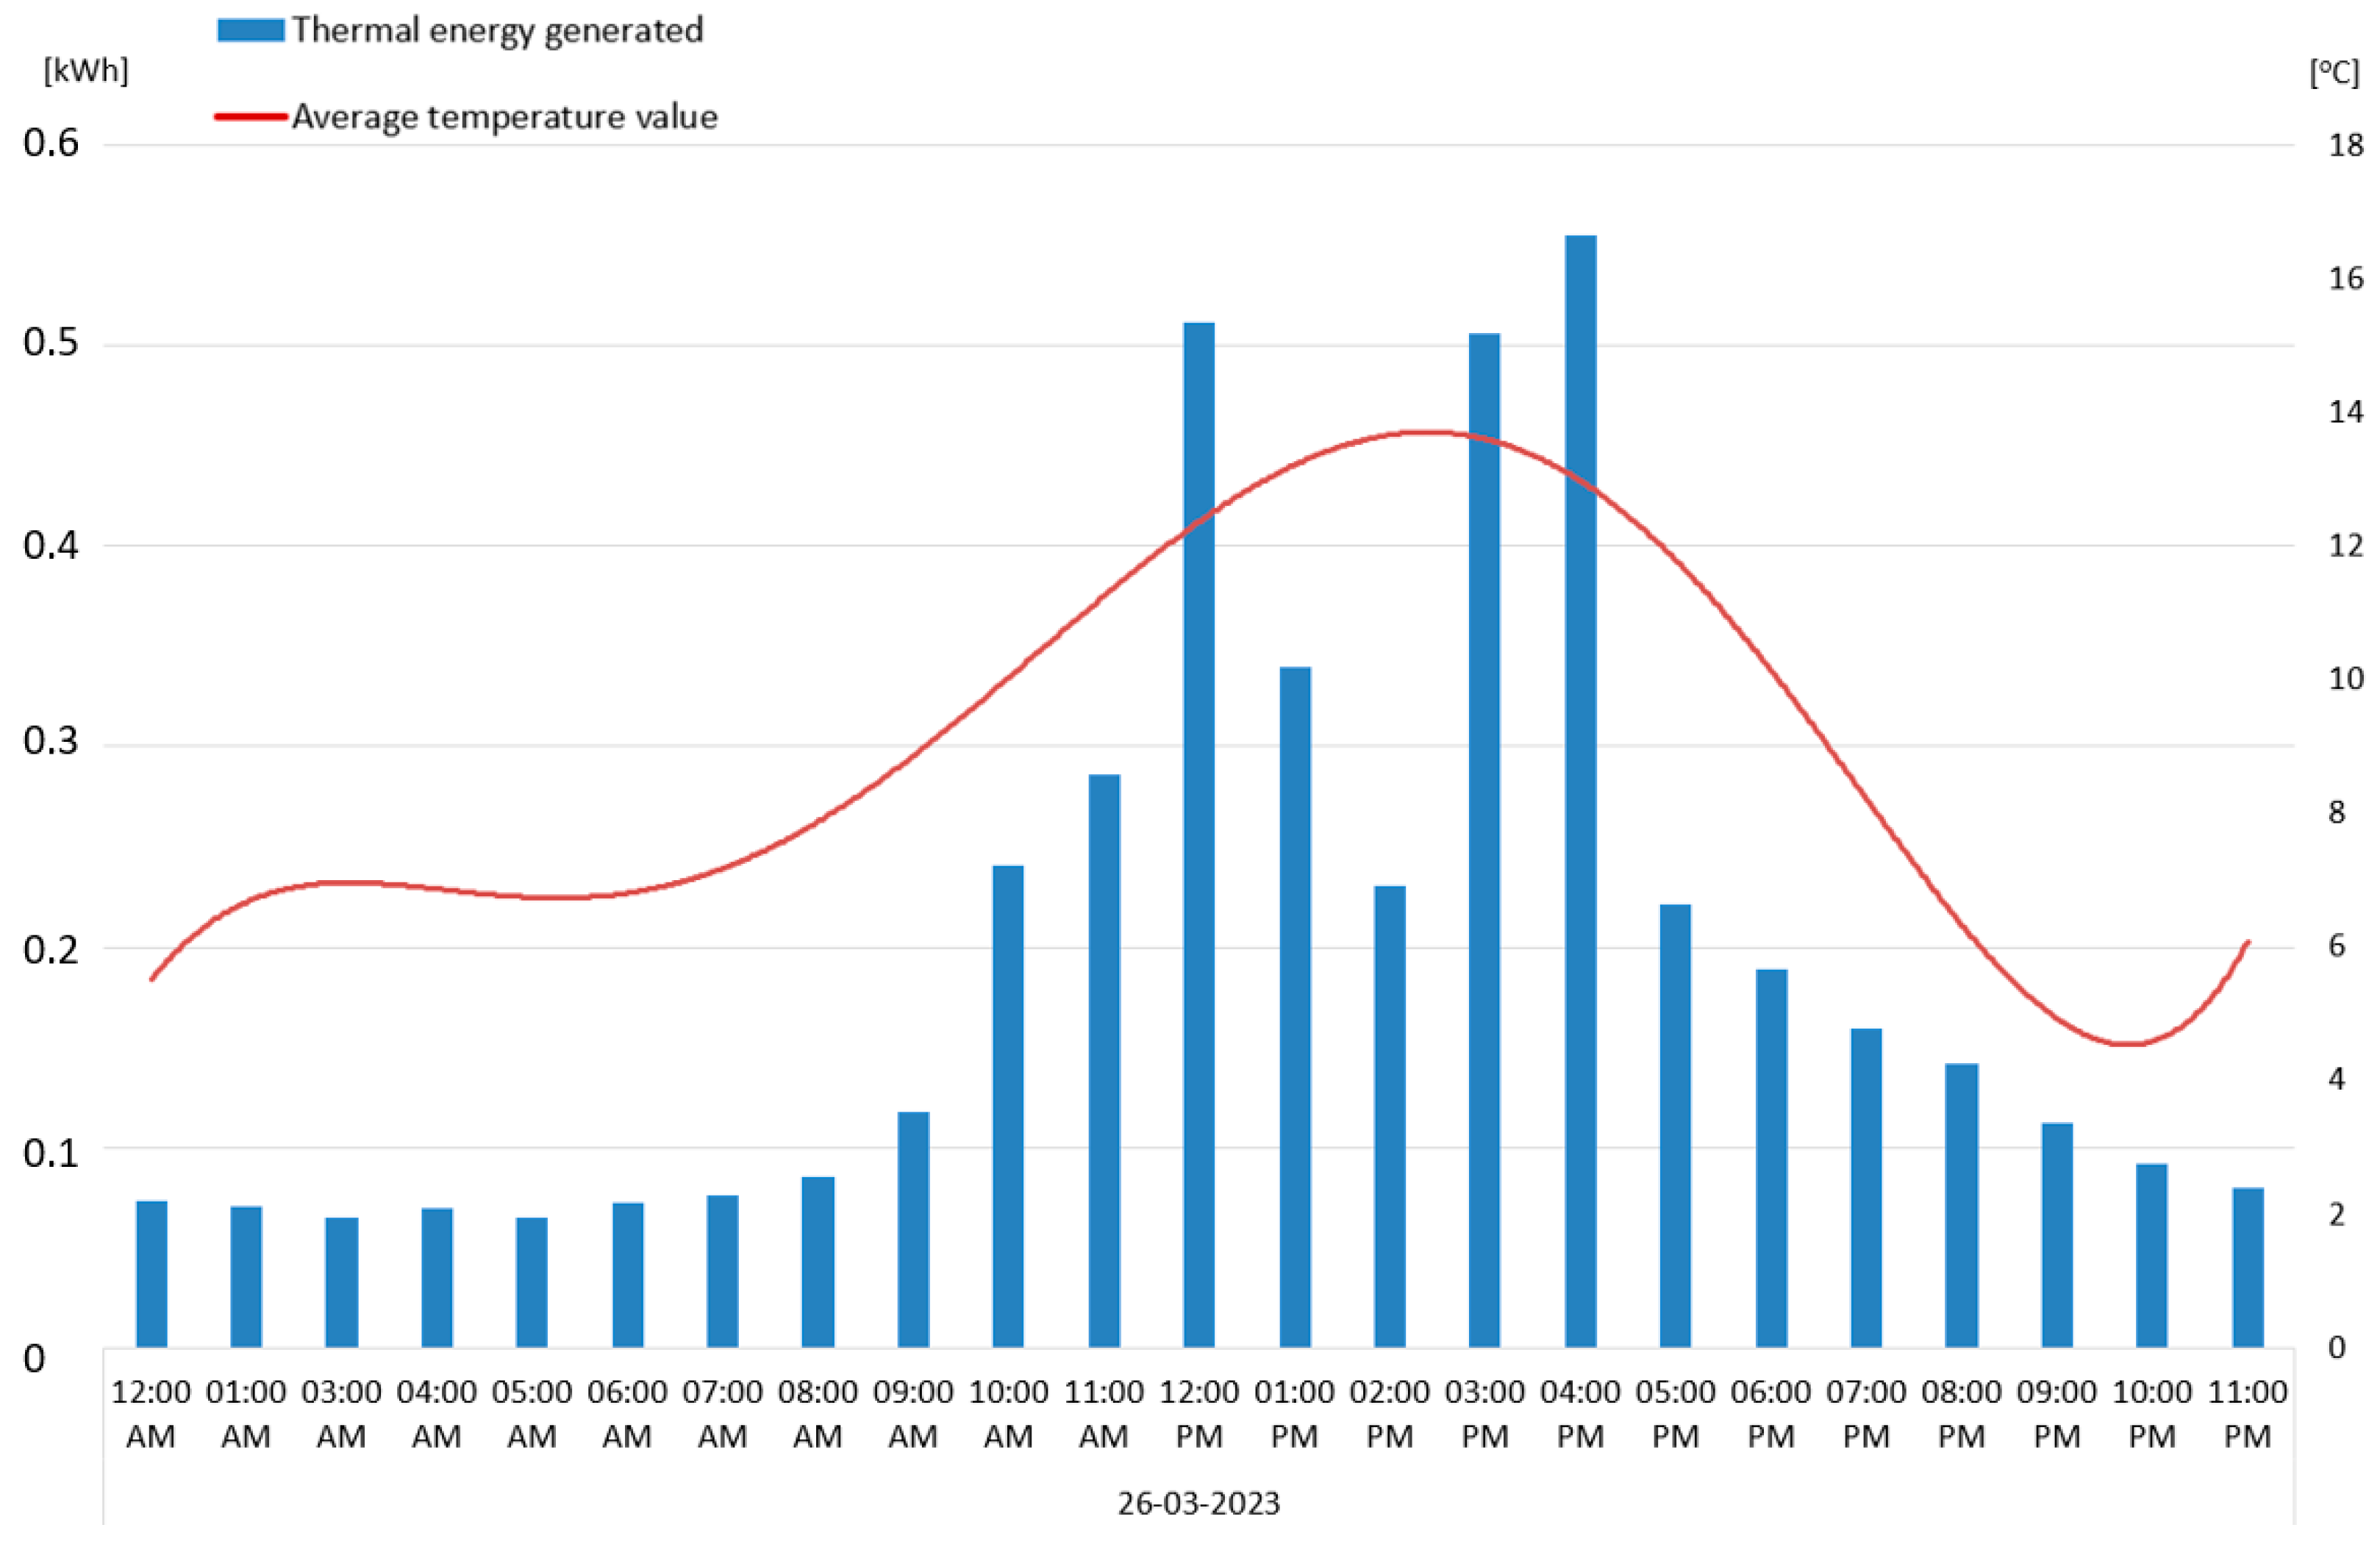
The date 26 March 2023 was selected for further analysis. On this day, the average external temperature ranged from 5 °C to 16 °C. The solar installation operated efficiently for six hours, from 10 AM to 4 PM. The total thermal energy generated for each hour is shown in
Figure 11. Changes in efficiency due to variations in solar radiation intensity are visible, which is reflected in the recorded external temperature. For individual operating hours of the solar installation, the total amount of generated thermal energy ranged from 0.25 kWh to 0.55 kWh.
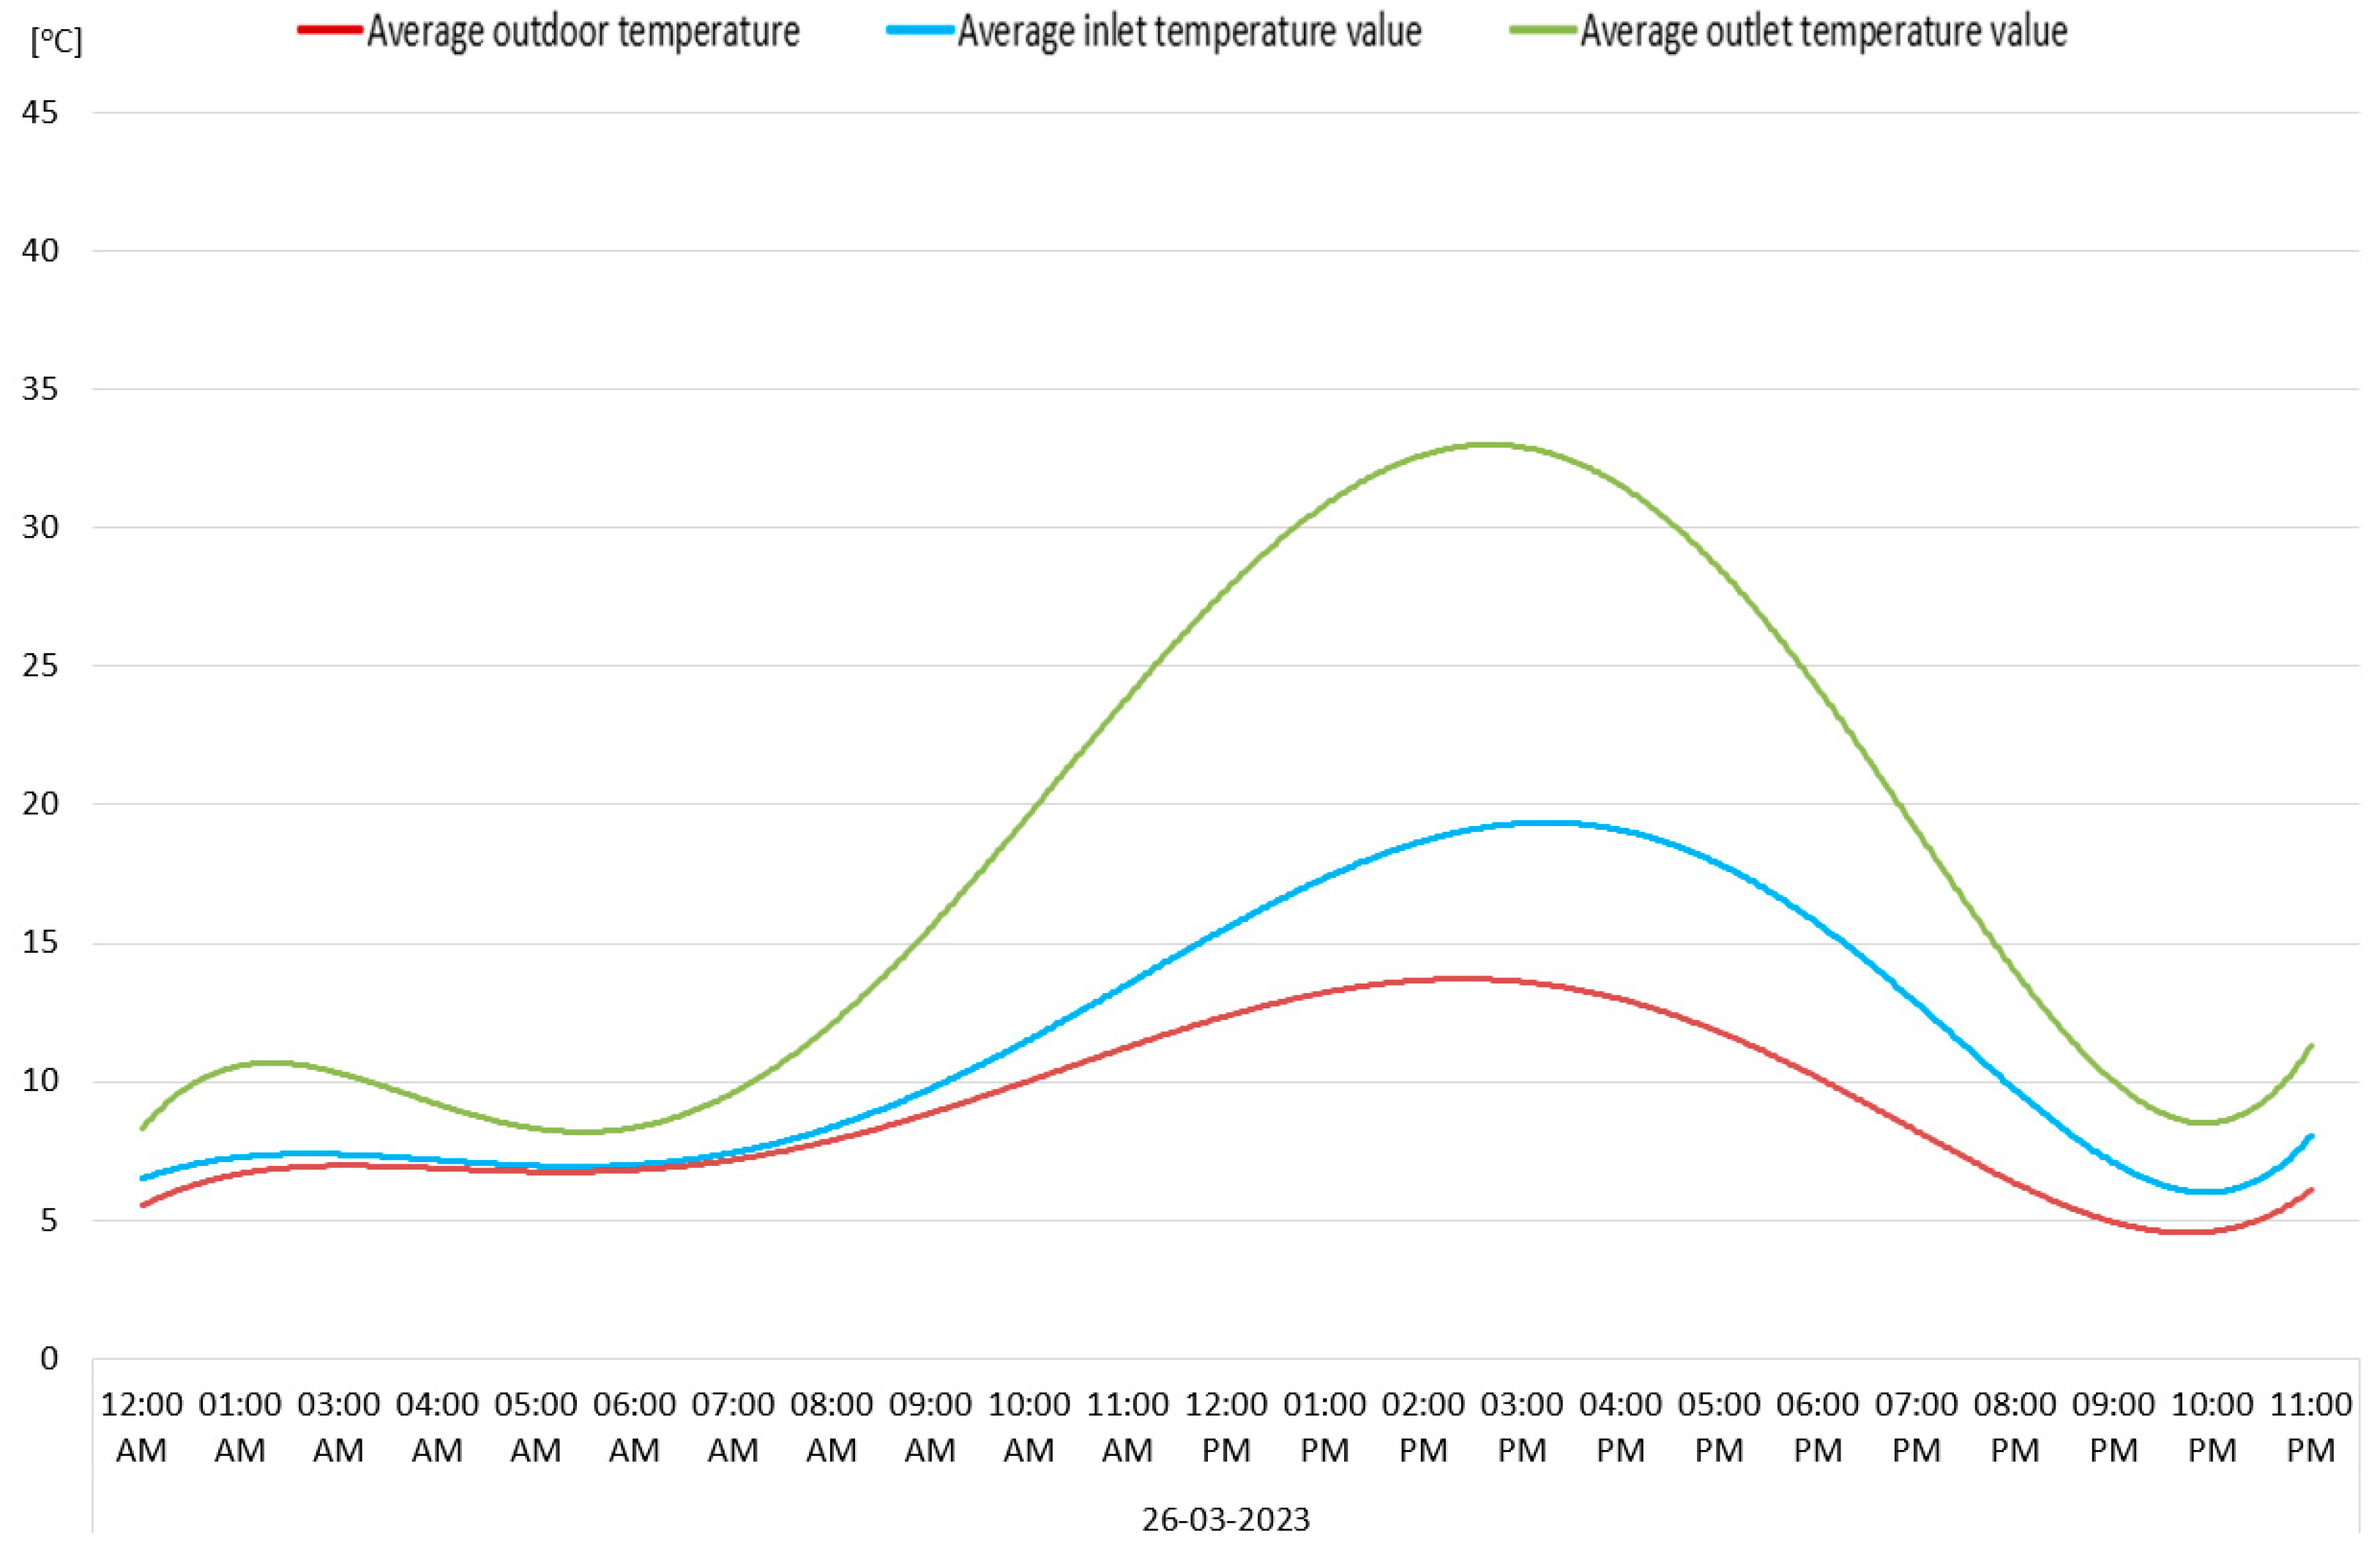
With a constant flow rate of the heating medium over time (
Vp), at 87.5 m
3/h, variations in the outlet temperature of the solar installation were recorded in the range from 20 °C to 42 °C. The relationship between the increase in the heating medium temperature and the inlet temperature is presented in
Figure 12. It should be noted that temporary changes in the inlet temperature do not affect the outlet temperature, which depends on the intensity of solar radiation. The observed temperature differences between the external temperature and the inlet temperature of the solar installation result from the location of the inlet temperature sensor. The inlet temperature sensor was installed in the first vacuum tube, where it was heated during the operation of the blower fan. The outlet temperature sensor was mounted in tube No. 5, and it was assumed that the measured value corresponds to the temperature of the air supplied for heating. In the first version of Solar Dragon 2022, its five-tube construction prevented excessive increases in outlet temperature. This setup allowed for direct delivery of heated air to the building without the risk of causing thermal discomfort for residents.
Figure 13 presents the average values of thermal power generated by Solar Dragon 2022. During the effective operating period of the solar installation, the instantaneous thermal power ranged from 0.2 kW to 0.55 kW. With the knowledge that the estimated heating power of a single vacuum tube is up to 100 W, it can be assumed that at peak performance, the solar installation operated at approximately 100% of its potential heating power.
Experimental research conducted from November 2022 to April 2023 demonstrated the possibility of supplementary heating for a 30 m2 residential room using the vacuum air solar installation, Solar Dragon 2022. However, due to reduced thermal efficiency during the winter months, when the operation time was limited to about 6 h and heating demand was increased, the solar air installation was not capable of operating autonomously as the sole heating source.
3.2. Analysis of Experimental Research Conducted Using Solar Dragon 2023
For the Solar Dragon 2023 installation, research was conducted from October 2023 to April 2024. The system was installed in a residential building constructed and commissioned in 2024. The solar installation was mounted facing south and heated the entire building with a total area of 113 m
2. The building is located in Southern Wielkopolska, within climatic zone II for Poland. An energy audit was conducted for the building, according to which the calculated primary energy (PE) demand is 52.61 kWh/(m
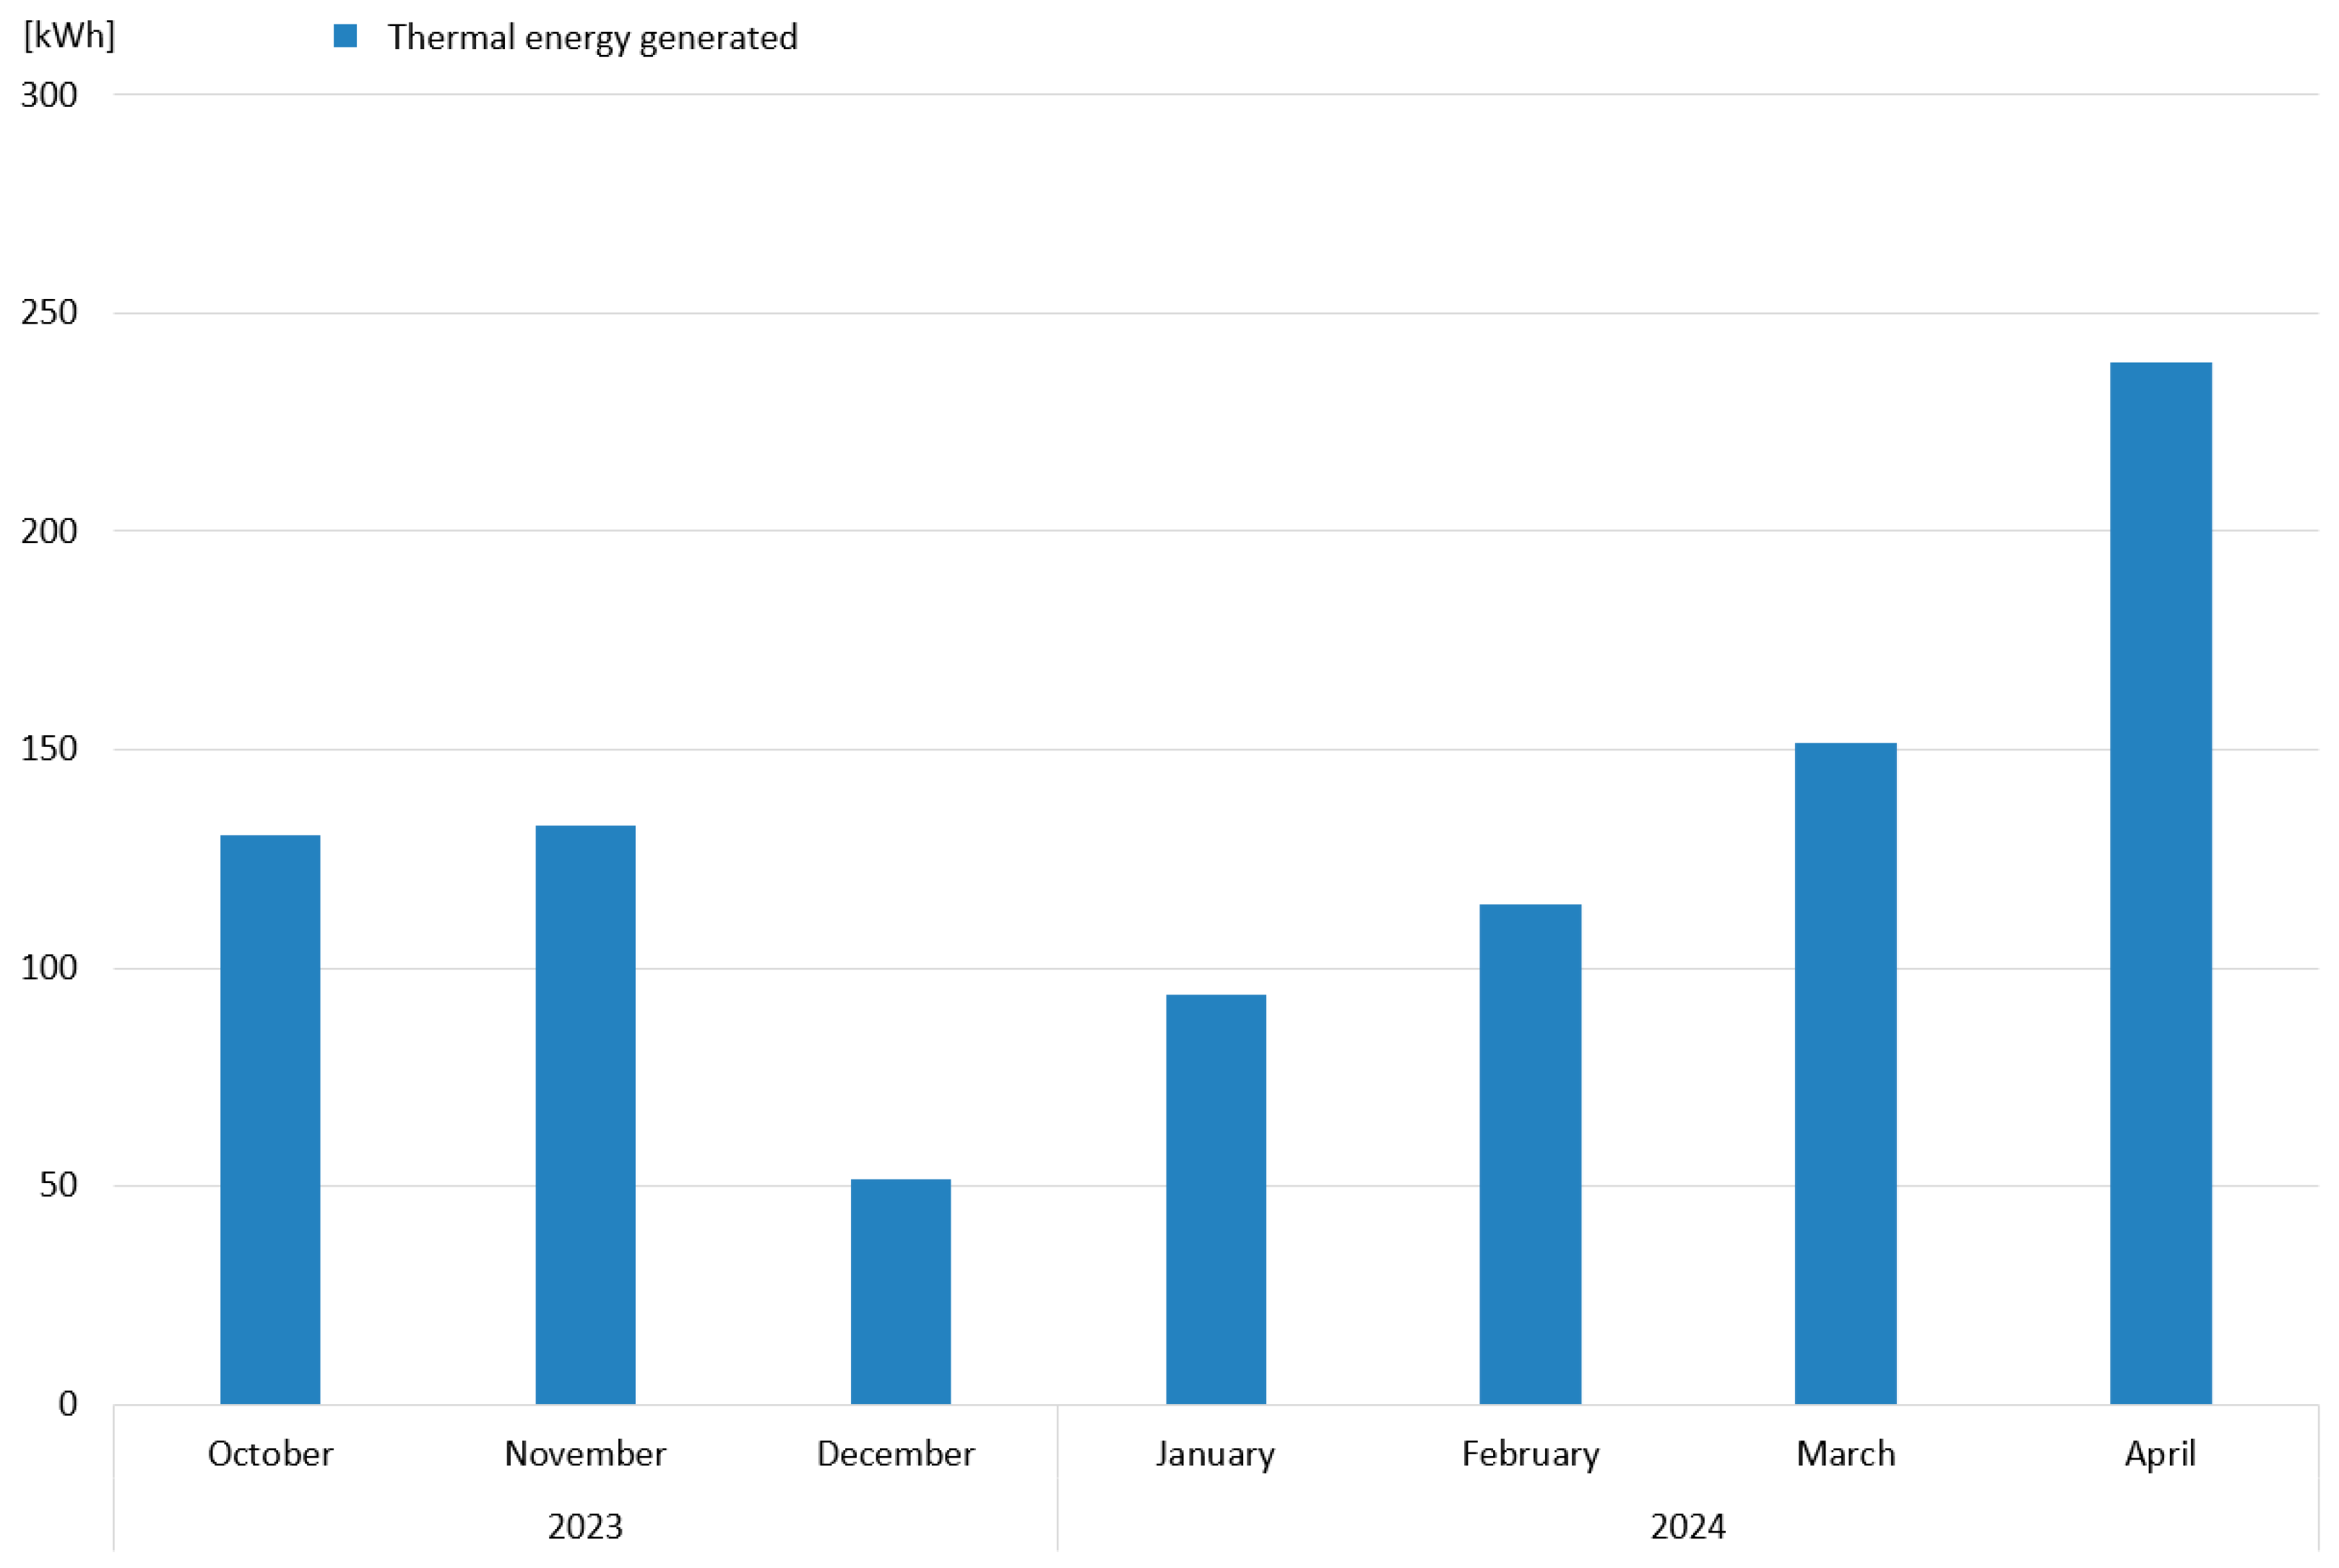
2·year). During the analyzed period, the air solar installation, consisting of 24 vacuum tubes, supplied 911.69 kWh of thermal energy to the building. The total amount of thermal energy generated in each month of the study period is shown in
Figure 14. The lowest system efficiency was recorded in December, with a total thermal energy output of 50 kWh. In the remaining months, the monthly output ranged from 98 kWh in February 2024 to 240 kWh in April.
The Solar Dragon 2023 system was designed using 24 solar vacuum tubes, which, assuming a maximum output of approximately 100 W per tube, should provide up to 2.4 kWh of thermal energy per hour. Analyzing the monthly summaries of produced thermal energy and the significant variations between different months, a detailed analysis was carried out based on the data recorded in December 2023 and March 2024.
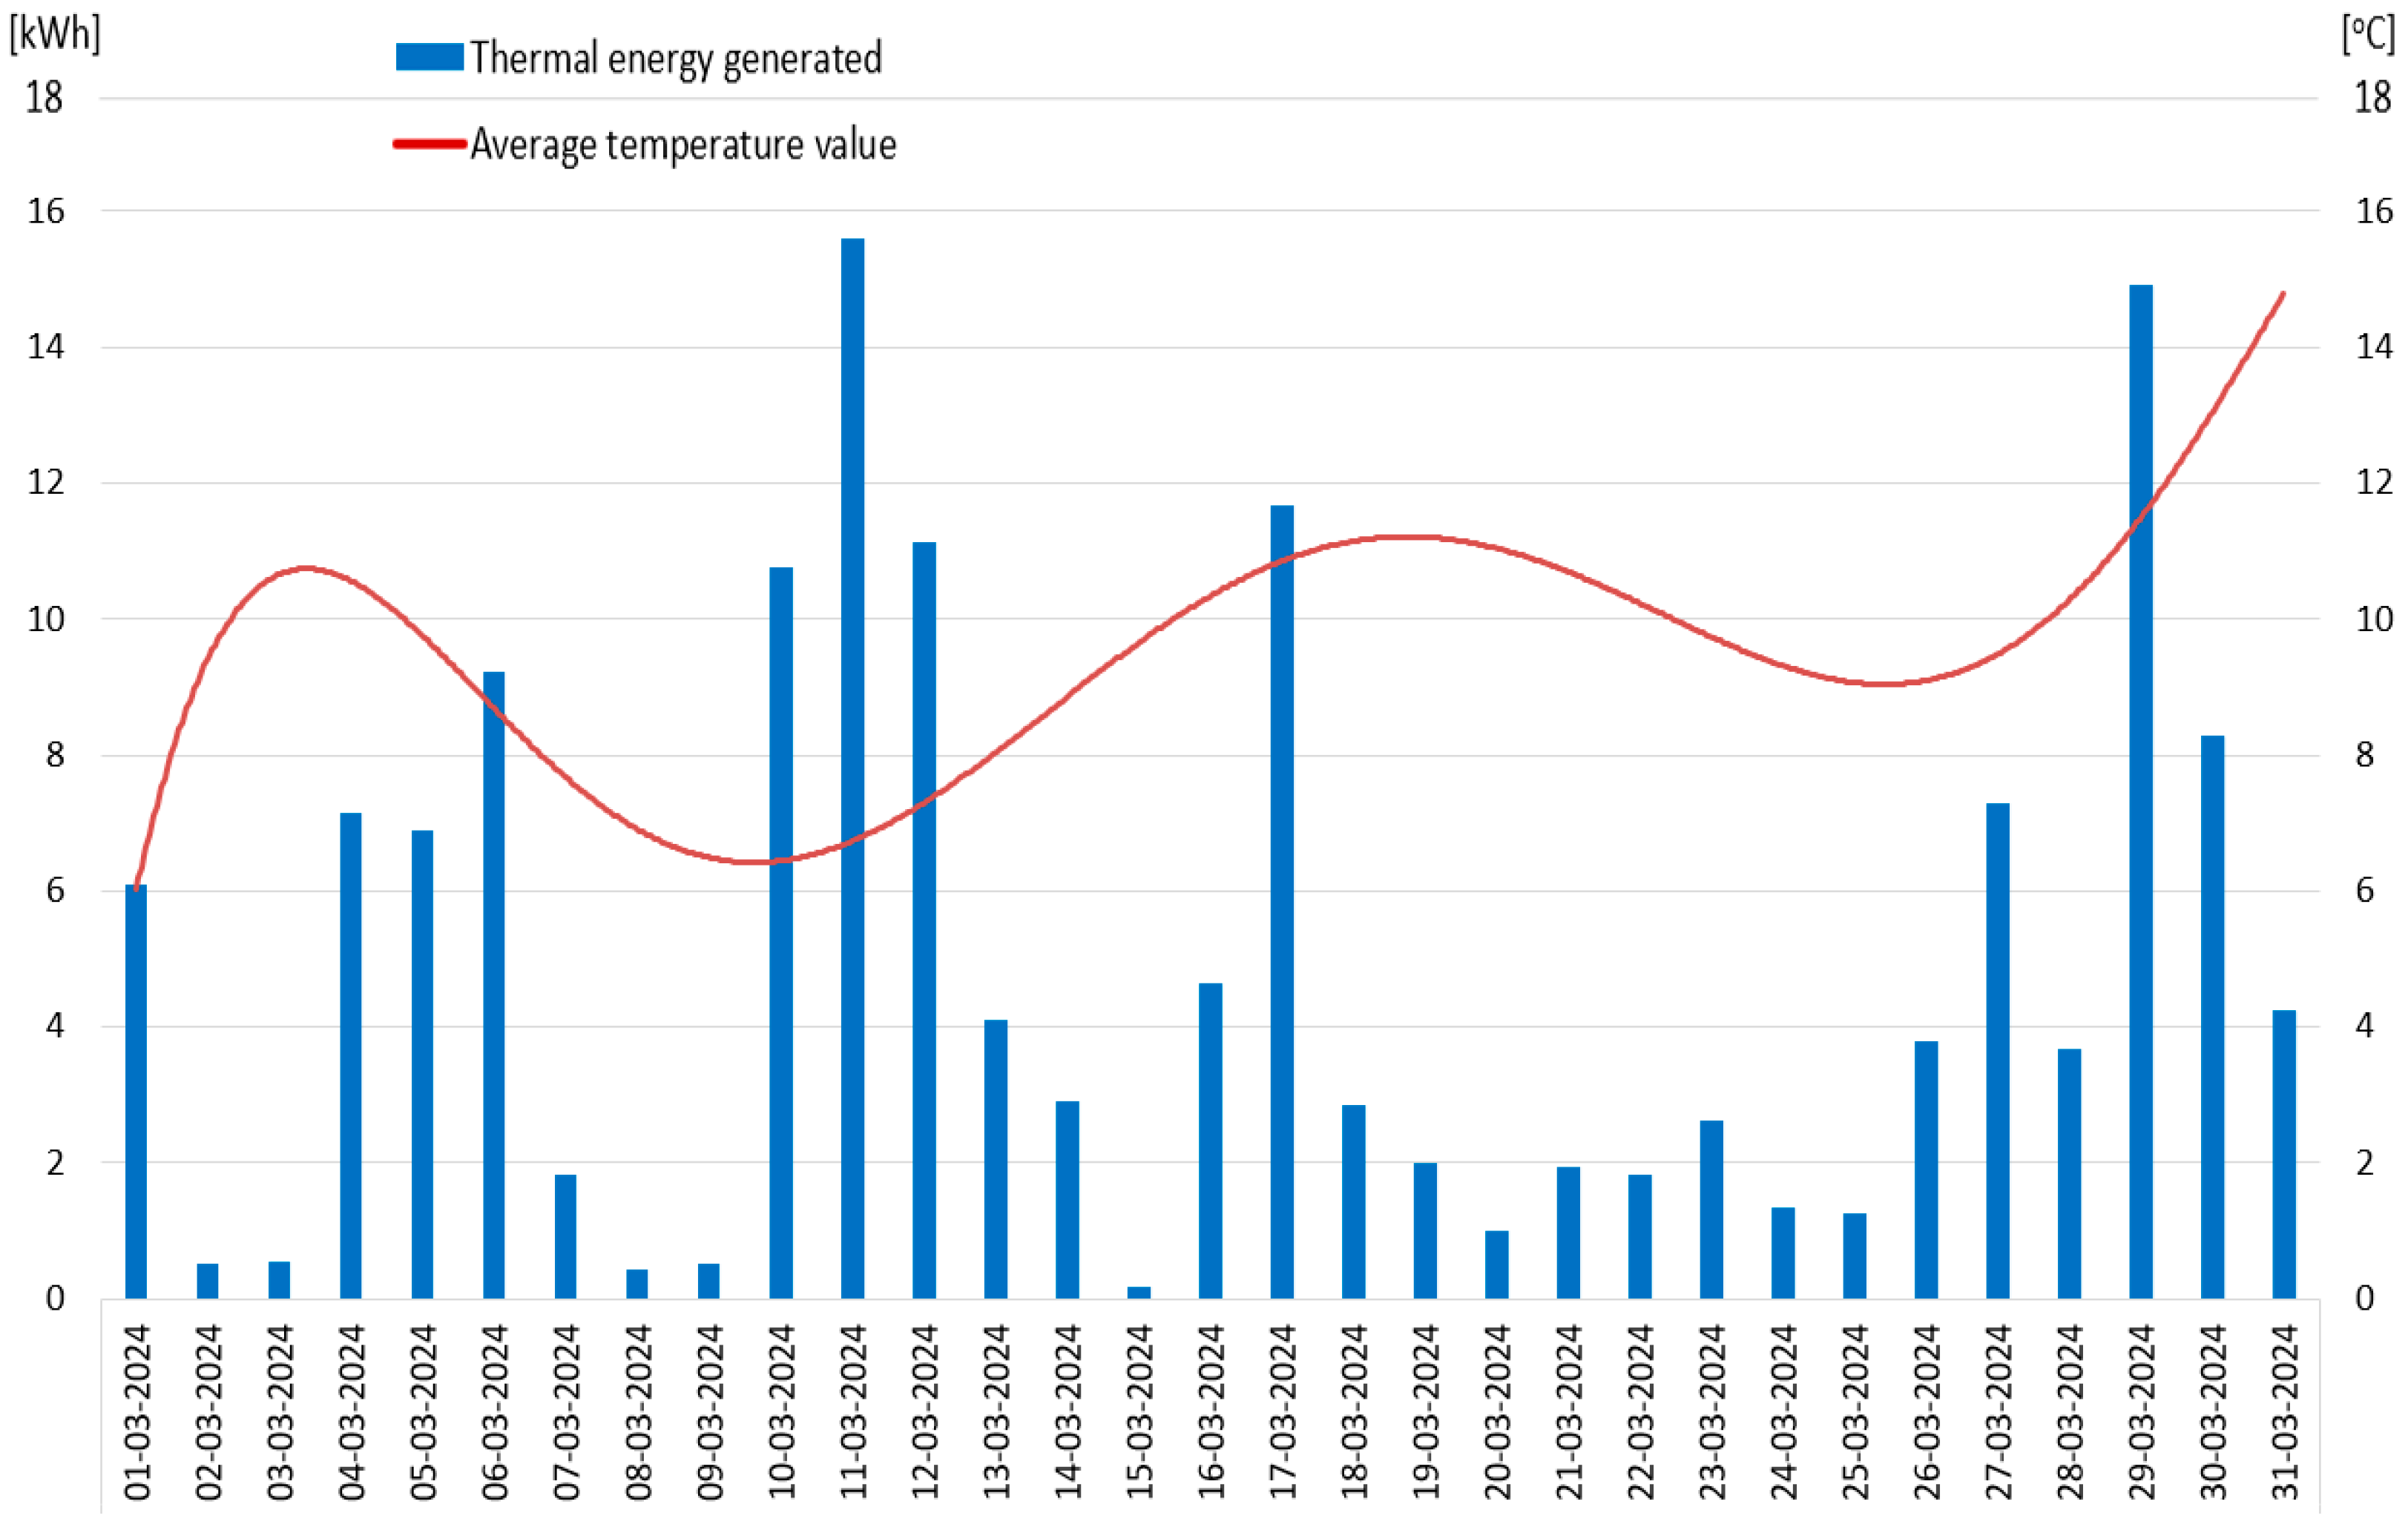
Figure 15 and
Figure 16 show the average external temperatures and the total daily thermal energy production for December 2023 and March 2024. In December, the average external temperatures ranged from –4 °C to 8 °C. In March, the average temperatures ranged from 2 °C to 14.5 °C. These data confirm previous observations from research using Solar Dragon 2022, showing that the efficiency of the solar installation does not depend on the external temperature. On 7 December 2023, the lowest recorded average external temperature was –4 °C, yet the solar installation generated 8.4 kWh of thermal energy. A similar amount of energy was recorded on 30 March 2024 when the average external temperature was 15 °C. This comparison highlights the unpredictability of the expected thermal energy production, which is highly dependent on weather conditions. The December data indicate a multi-day period during which the solar installation remained non-operational. This was due to snowfall and significant cloud cover, which, despite positive temperatures, prevented the system from working effectively. By analyzing the operation of the system in March, a greater stability in the amount of generated thermal energy can be observed. The highest daily production was recorded on 11 March 2024 reaching 15.5 kWh, generated at an average external temperature of 4.2 °C. It was generated at an average external temperature of 4.2 °C.
For a detailed hourly analysis, the following days were selected:
Figure 17 presents data for 11 December 2023, with an average external temperature of –0.5 °C and a total thermal energy output of 4.1 kWh.
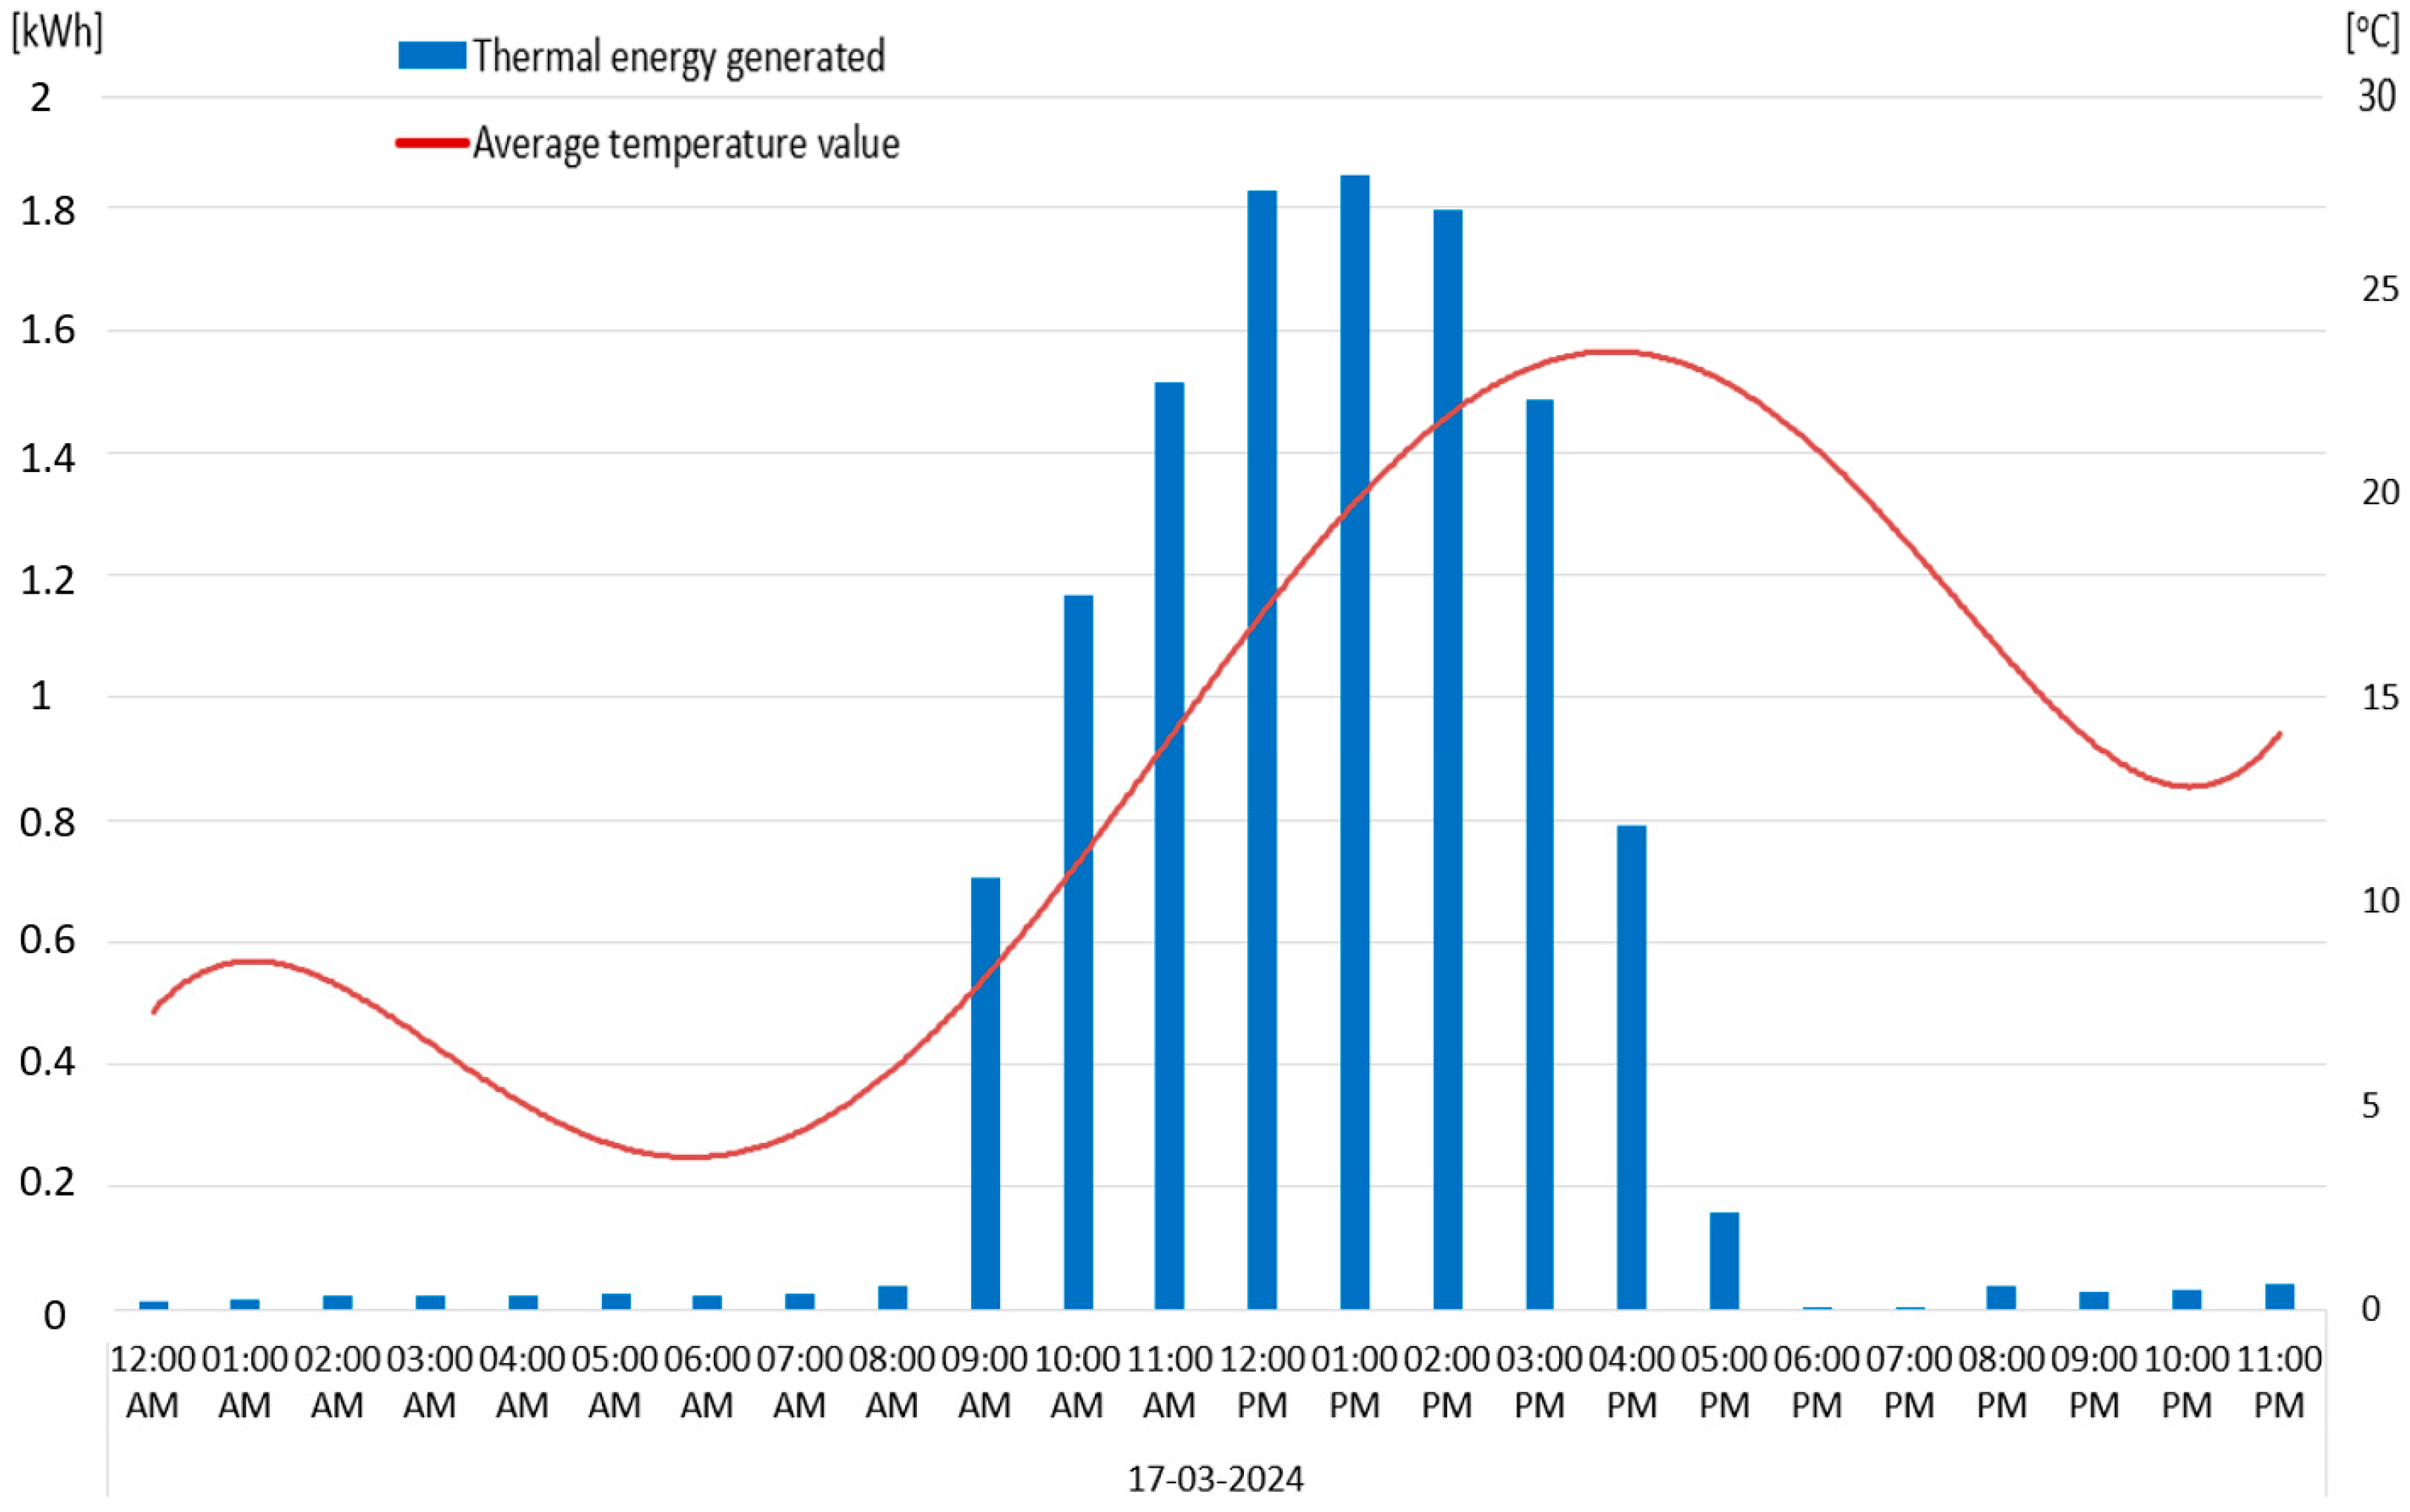
Figure 18 presents data for 17 March 2024, with an average external temperature of 12.2 °C and a total thermal energy output of 11.8 kWh.
A comparative analysis of these two days shows that despite significant differences in average external temperatures, there are no major differences in the total hourly thermal energy output. The maximum hourly output for 11 December was 1.31 kWh, while for 17 March, it was 1.82 kWh. The difference in average external temperatures between the two days was 24 °C. The key factor affecting daily thermal energy production was the duration of the solar installation’s effective operation: On 11 December, the system operated for 4 h. On 17 March, the effective operation time was 8 h. To verify the performance of the system, the obtained result was compared with previous scientific publications using a similar research methodology. For comparison, it was found that the Solar Dragon 2023 installation, during the winter period for the days analyzed, showed a maximum efficiency of 55% (1.32 kWh) on 11 December 2023 and a maximum efficiency of 75% (1.80 kWh) on 17 March 2024. On the other hand, the air solar system studied by scientists from the Gdansk University of Technology showed an efficiency of 60% during the winter period [
34].
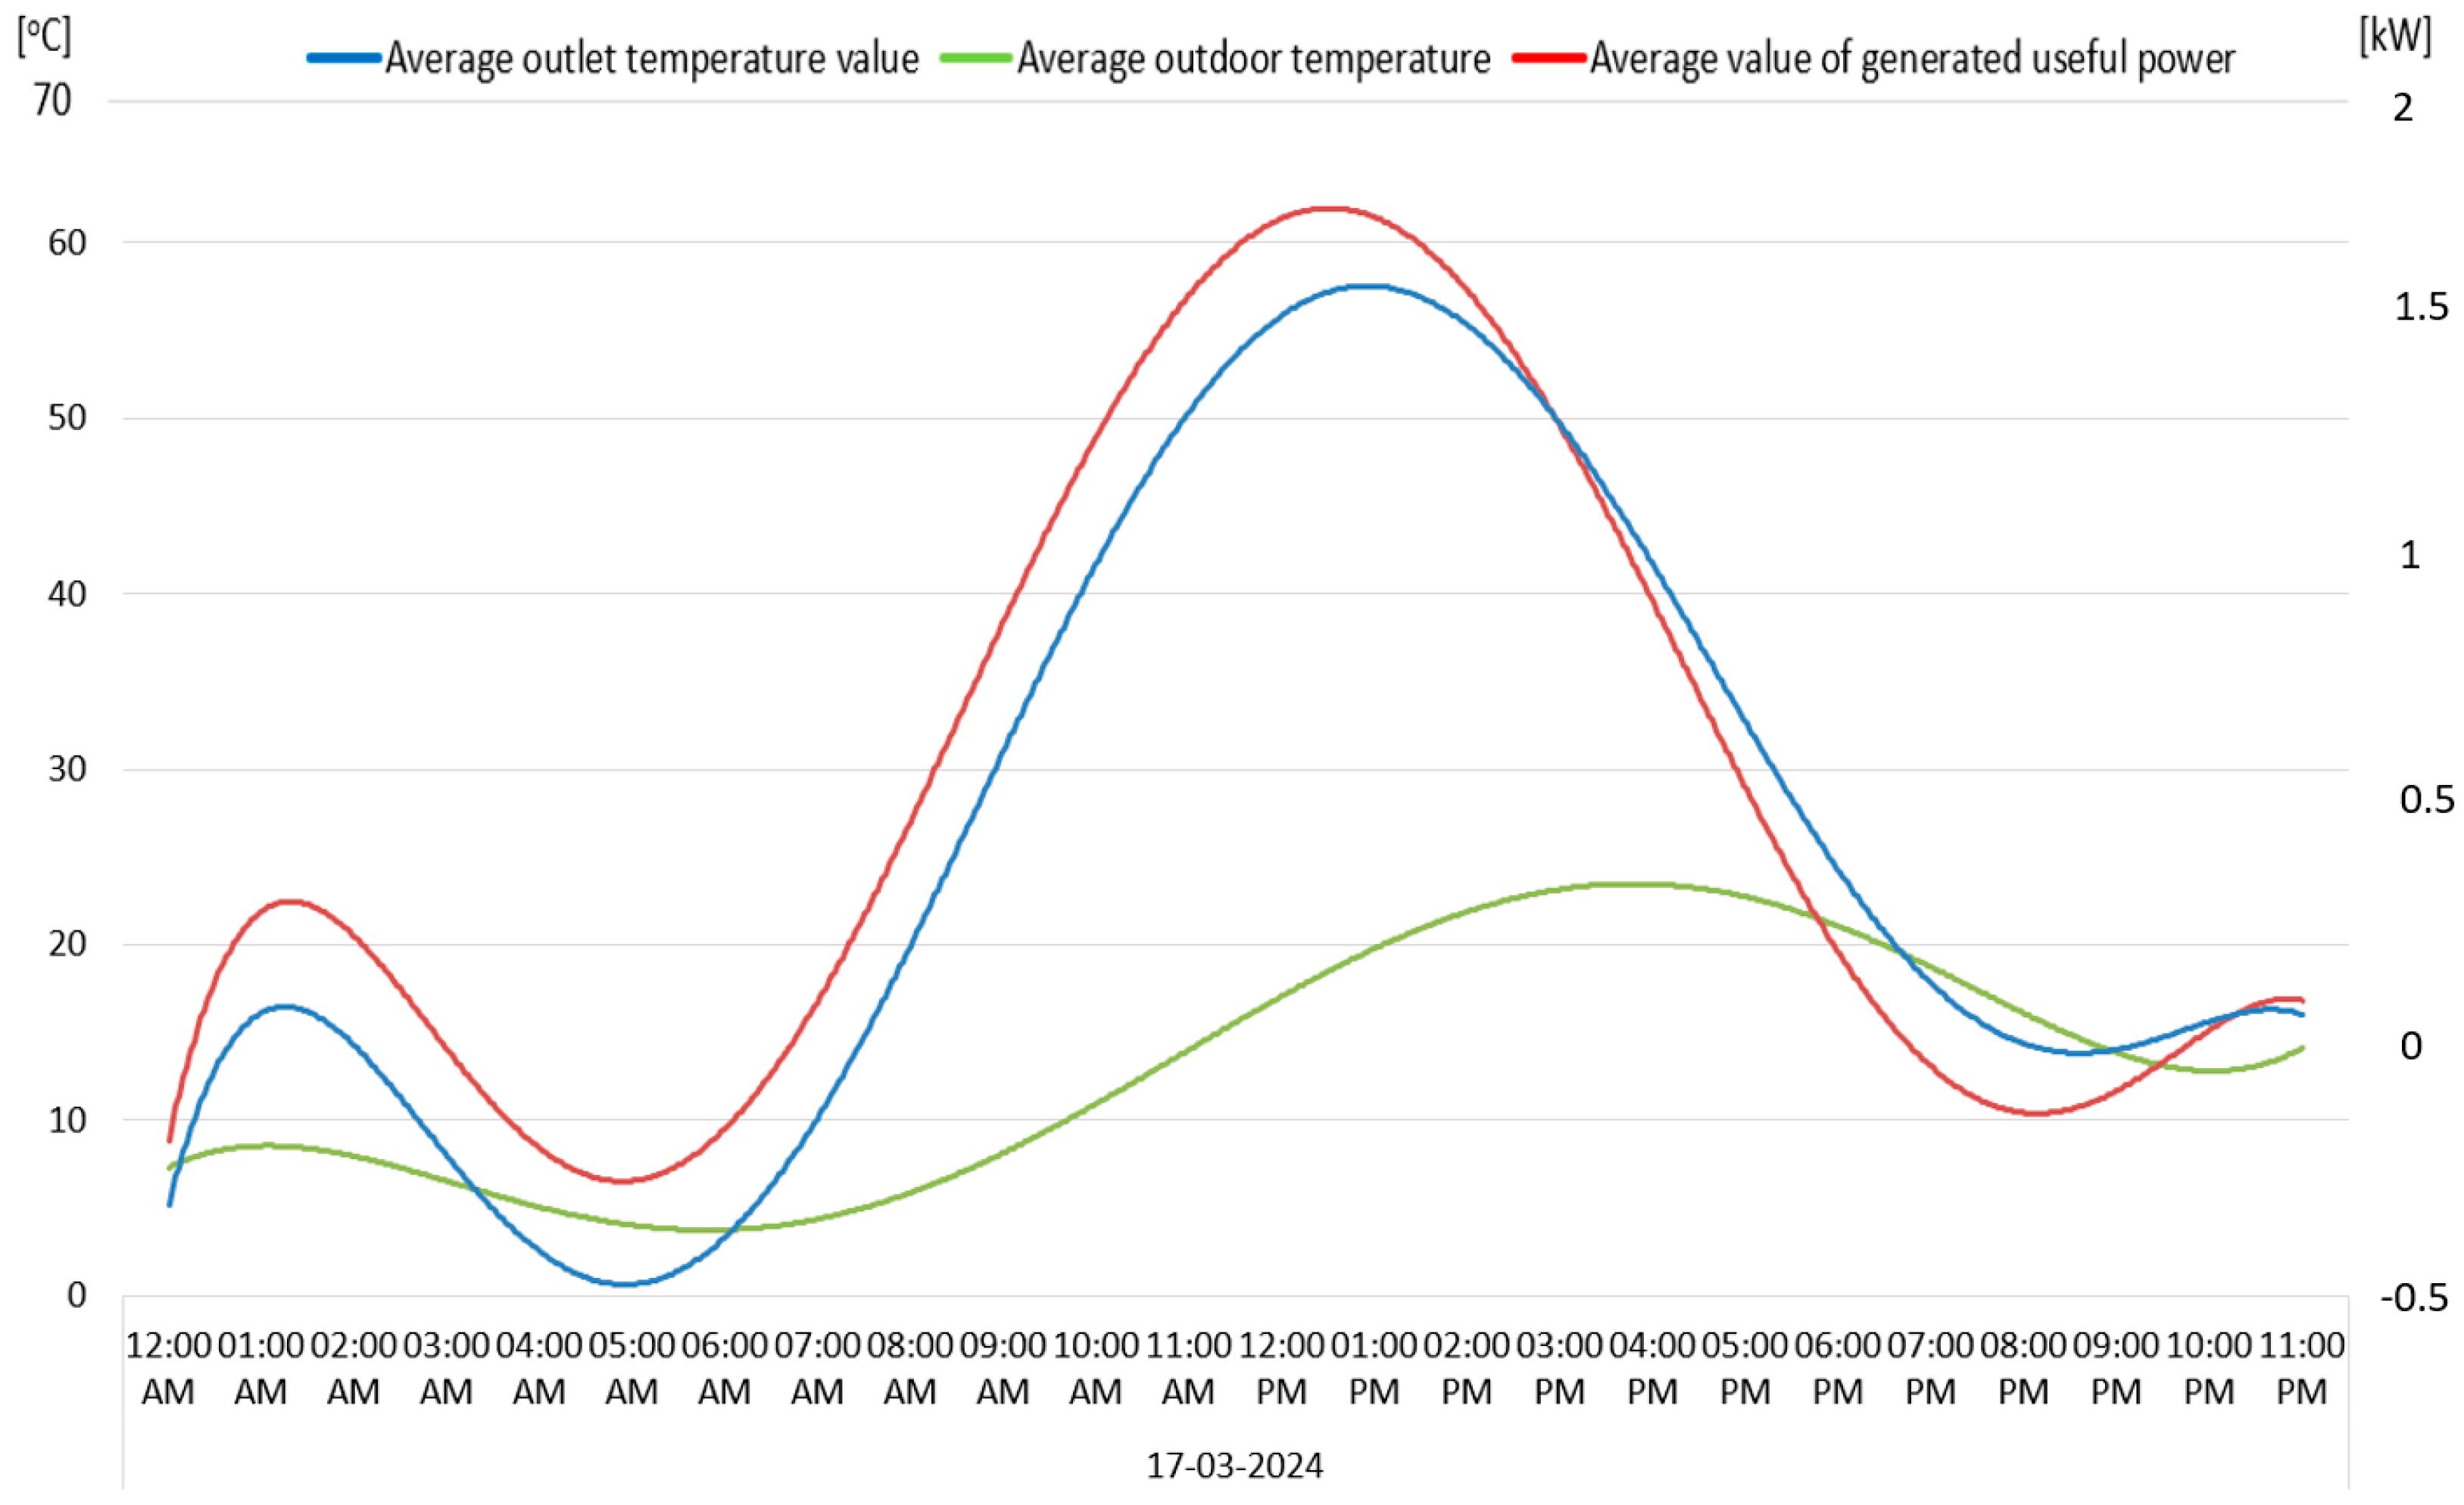
Figure 19 and
Figure 20 show the average temperature values for both compared days. The maximum outlet air temperature from the solar installation, which was supplied to the heated building, was analyzed. On 11 December, the maximum temperature was 36 °C. On 17 March, the maximum air temperature reached 62 °C.
Such a high outlet temperature from Solar Dragon 2023, when directly supplied to residential rooms, may cause discomfort for residents and excessively dry the undesirable air. Another issue is the lack of stabilization in the temperature conditions of the supplied air, where the temperature fluctuates between 25 °C and 60 °C over a few hours.
Figure 21 presents the average temperature values and instantaneous power output for each hour on 17 March 2024. The maximum instantaneous thermal power reached 1.8 kW, which, considering the 24 vacuum tubes used in the design, indicates a maximum system efficiency of 75%. The authors of the article do not have detailed solar radiation data for the analyzed periods. Therefore, it is assumed that maximum solar radiation did not occur during the analyzed timeframe.
A two-stage scientific experiment carried out by the article’s authors from 2022 to 2024 provided experimental data on temperatures and thermal outputs generated by vacuum air solar collectors. Considering the second version of the device under the name Solar Dragon 2023, whose maximum thermal output was designed at about 2.4 kW, it was found that during the studied period from October 2023 to April 2024, on cloudless days, the maximum energy efficiency of tubular vacuum air collectors ranged from 55% to 75%. A similar design tested at the Gdansk University of Technology had an average efficiency of 60% [
34]. In both cases, the installations had similar energy efficiencies, while the differences in heated air temperature values were the result of different heated air velocities. There is a lack of parallels in the recent scientific literature with the study conducted by the authors of this article. Zhu et al. [
38] used vacuum air solar collectors for their study, but the generated thermal energy was stored in a water-based energy store. As a result of their experiments, they found that the average equivalent heat storage efficiency of the AVSC collector with integrated phase-change heat storage rods was 61% [
38]. Similar conclusions were reached by Elbrashy at al. [
39] in ongoing studies on series and parallel tubular connections of air collectors. Choi at al. [
40], in a scientific review paper, presented research results for six different liquid-type solar installations. The paper studied both flat plate solar collectors and evacuated tube (compound parabolic concentrator (CPC) reflector) collectors. The tests were carried out under real conditions, which influenced some differences in results related to heating medium temperatures and thermal efficiency of the system. However, the average level of energy efficiency for liquid solar collectors ranged from 35% to 60%. There are a number of studies in the scientific literature that present work indicating the possibility of modifying popular flat plate solar collectors, for example, by adding additional rectangular channels [
41] to increase their efficiency. Another interesting solution is the development of a double-sided design of the solar air heater (SAH), which significantly increases its operating time during the day [
42]. However, these are experimental designs whose high efficiency values have not yet been applied to consumer designs.


