Article

Absorption and Desorption Heat of Carbon Dioxide Capture Based on 2-Amino-2-Methyl-1-Propanol

1
College of Pipeline and Civil Engineering, China University of Petroleum (East China), Qingdao 266580, China
2
The Ground Engineering Test Base High Efficient Separation Technology Laboratory and Shandong Provincial Key Laboratory of Oil, Gas and New Energy Storage and Transportation Safety, Qingdao 266580, China
3
Sinopec Petroleum Engineering Corporation, Dongying 257061, China
*
Author to whom correspondence should be addressed.
Energies 2025, 18(5), 1075; https://doi.org/10.3390/en18051075
Submission received: 23 January 2025 / Revised: 18 February 2025 / Accepted: 19 February 2025 / Published: 22 February 2025
(This article belongs to the Section B: Energy and Environment)

Abstract

:
In chemical absorption for carbon capture, the regeneration heat is a key factor determining solvent regeneration energy consumption, and the sterically hindered amine 2-amino-2-methyl-1-propanol (AMP) has great potential for application. In this paper, a CO2 reaction heat measurement system designed and constructed by our team was used to perform a comparative study on AMP and monoethanolamine (MEA). Moreover, five additives—MEA, diglycolamine (DGA), diethanolamine (DEA), methyldiethanolamine (MDEA), and piperazine (PZ)—were introduced into AMP-based solutions to investigate the promotion performance of these blended solvents. The results revealed that although AMP exhibited a slower absorption rate compared to MEA, it demonstrated a higher CO2 loading capacity and cyclic capacity, as well as a lower reaction heat, making it advantageous in terms of regeneration energy consumption. At the same total concentration, the absorption capacity of blended solutions (excluding AMP-MEA solutions) was generally lower than that of single-component AMP solutions. Among these additives, MEA and PZ could enhance the absorption rate clearly yet increase the reaction heat at the same time; DGA and DEA could decrease the overall absorption performance. Generally, AMP-MDEA solutions showed the best desorption performance, with the 15 wt% AMP + 5 wt% MDEA mixture demonstrating the lowest regeneration heat and good cyclic capacity.

1. Introduction

Carbon Capture, Utilization, and Storage (CCUS) is recognized as one of the key technologies in the global effort to mitigate climate change [1]. Currently, carbon dioxide (CO2) capture technologies are predominantly classified into four major categories, namely, pre-combustion capture, post-combustion capture, oxy-fuel combustion, and chemical looping combustion [2,3,4,5], among which post-combustion capture prevails as the most extensively adopted approach in the contemporary market [6]. The methods employed in post-combustion capture encompass cryogenic distillation, membrane separation, adsorption, and solvent absorption [7], with the latter being further subclassified into physical absorption and chemical absorption. Chemical absorption, which is generally employed for treating CO2 gas at low to medium partial pressures, features excellent absorption efficiency and stable reactions, making it the most mature and feasible method at present [8,9,10].
Organic amines are the most common chemical absorbents. The amine absorption process is simple, technologically mature, and commercially viable, offering excellent CO2 capture performance and serving as a representative for many chemical absorbents [11,12,13,14,15,16,17,18,19]. Among conventional amine-based absorbents, monoethanolamine (MEA) stands out as the most prevalently utilized one, owing to its rapid reaction kinetics. Nevertheless, MEA has several inherent limitations, including low CO2 loading capacity, high energy requirements for regeneration, and proneness to oxidative degradation [20,21,22,23,24]. To address these issues, researchers have been exploring novel amine-based absorbents aimed at reducing energy consumption while maintaining high absorption capacity and fast absorption rates.
In recent years, sterically hindered amines have garnered substantial research interest [7]. As a category of organic compounds distinguished by steric hindrance effects, these amines outperform traditional amines with regard to absorption capacity, reaction rate, selectivity, and degradation resistance. Sartori and Savage initially formulated the definition of sterically hindered amines as follows: (i) primary amines with the amino group bonded to a tertiary carbon atom; (ii) secondary amines featuring the amino group attached to at least one secondary or tertiary carbon atom. These compounds offer high CO2 absorption capacities; theoretically, one mole of sterically hindered amine can absorb one mole of CO2, resulting in high utilization efficiency. Furthermore, the carbamates engendered from the reaction between sterically hindered amines and CO2 are characterized by extreme instability, which expedites the easy desorption of CO2 and, in turn, curtails the energy consumption requisite for regeneration [17,25,26]. Additionally, on account of the formation of a safeguarding corrosive layer, sterically hindered amines manifest decreased corrosivity, in contrast to other primary and secondary amines [27]. These amines are capable of being deployed not merely for intensifying the selective elimination of hydrogen sulfide but also for actuating other amine absorbents, thereby augmenting the absorption rate. 2-amino-2-methyl-1-propanol (AMP) is one of the more studied sterically hindered amines [28,29], with its amino group presenting excellent chemical activity due to the branched alkyl group attached to the nitrogen atom, which significantly enhances the reaction rate. However, AMP is prone to crystallization under high-concentration and high-carbon-loading conditions, impeding gas–liquid mass transfer [30]. With the advancement of chemical technology, the production cost of AMP has been significantly reduced, promoting its use as a primary absorbent [31].
Currently, numerous studies focus on mixing two or more amine absorbents to form novel absorbents, so as to meet the requirements of practical industrial applications [32]. The concept of blended amine absorbents was first proposed by Chakravarty et al. [33]. By combining amines with different properties, novel absorbents with high absorption rates, high capacities, low regeneration energy consumption, low losses, and low corrosivity have been developed, becoming one of the current research hotspots in chemical solvent CO2 absorption [34]. Two strategies are commonly employed in the development of blended amine absorbents: (i) using primary or secondary amines with high absorption rates as the main absorbents, supplemented with other amines to reduce regeneration energy consumption and increase overall absorption capacity [35]; (ii) using tertiary amines or sterically hindered amines with high absorption capacities and low regeneration energy demands as the main absorbents, supplemented with activators to enhance the absorption rate [36]. In comparison, the second strategy offers a more significant advantage in reducing regeneration energy demand and holds greater potential for industrial applications [37].
Among the performance parameters of chemical absorbents, the reaction heat plays a critical role in the operation and design of CO2 removal units. This is because the reaction heat is closely related to the regeneration energy consumption, and achieving low regeneration energy consumption is a key objective in the CO2 capture process. [38,39,40,41] In the early days, reaction heat was primarily calculated using equilibrium equations and gas–liquid equilibrium data. In 1962, Sherwood et al. [42] calculated the reaction heat of gas–liquid reactions using phase equilibrium equations. In 1969, Zambonin et al. [43] proposed the principle of “Gas Enthalpimetry”, which measures the CO2 content in a gas mixture based on the heat released during the absorption process. Lee [44] and Jou [45] conducted experimental measurements of CO2 partial pressures and subsequently calculated the heat of reaction via the Gibbs–Helmholtz equation. Kim et al. [46] analyzed the equilibrium constants for the reactions of CO2 with MEA and methyldiethanolamine (MDEA) aqueous solutions and calculated the absorption enthalpies using the Gibbs–Helmholtz equation.
Despite the fact that estimating reaction heat by means of solubility data constitutes a simplified approach, it is markedly prone to significant inaccuracies. Nowadays, the heat of a reaction is gradually measured by calorimeters. Common calorimeters include differential scanning calorimeters (DSCs), accelerated rate calorimeters (ARCs), Calvet-type calorimeters, CPA thermal conductivity isothermal calorimeters, and automatic reaction calorimeters (RC1s). Christensen, Merkley [47], and Oscarson [48] measured the absorption heats of diglycolamine (DGA), MDEA, and diethanolamine (DEA) using flow calorimetry, with Merkley noting that the absorption heat of the solution mainly depends on the solute concentration. Kim et al. [49] conducted experiments using a CPA-122 calorimeter and identified three major factors influencing the reaction heats of single-component amine solutions, namely, CO2 loading, reaction temperature, and solvent composition; for blended amine solutions, the solute concentration has a more significant impact on the heat of the reaction. Liu et al. [50] used a CPA-122 calorimeter to measure the absorption heats of ammonia/piperazine (PZ) mixtures. In addition, researchers such as Dallos [51] and Zheng [52] conducted their measurements using the C-80 calorimeter.
Most experimental studies on the heat of reactions in amine solutions primarily focus on absorption heat, using it as an indicator to evaluate the regeneration energy consumption, while few studies directly investigate the desorption heat. However, in industrial processes, the operating conditions of absorption and desorption vary significantly, and it is a valuable subject to investigate both the absorption heat and the desorption heat. Previous studies have predominantly focused on measuring and predicting the vapor–liquid equilibrium (VLE) data of AMP and its blended solutions, with relatively limited research directly measuring their reaction heat. This study focuses on the reaction heat, using a self-developed experimental system to accurately measure both the absorption and desorption heat during the reaction process. Experiments were conducted to evaluate the CO2 absorption and desorption performance of single-component AMP and binary mixtures based on AMP. Comparative investigations were conducted between MEA and AMP to explore the performance variations under different conditions: varying concentrations (10 wt%, 15 wt%, and 20 wt%), temperatures (40 °C, 60 °C, and 80 °C), pressures (1 bar, 3 bar, and 5 bar), and CO2 loads. With AMP as the main absorbent, five additives, namely, MEA, DGA, DEA, MDEA, and PZ, were introduced to formulate respective binary absorbent solvents, with the total mass fraction of the blended solutions set at 20 wt%. The absorption and regeneration performance of binary absorbents with different concentration ratios was analyzed.

2. Experimental Section

2.1. Materials

Both CO2 (99.9%) and N2 (99.9%) were supplied by the Qingdao Guida Gas Company and did not necessitate further purification. The chemical reagents utilized in the experiment along with their corresponding parameters are presented in Table 1. N-Heptane (99%), MEA (99%), AMP (99%), DGA (99%), DEA (99%), MDEA (99%), and PZ (99%) were all purchased from the Shanghai Macklin Company. All solutions were prepared with deionized water.

2.2. Experimental Apparatus

The self-developed CO2 capture reaction heat measurement apparatus [53], which was mentioned in previous studies, (shown in Figure 1) consists of several key components: the main reactor equipped with a magnetic stirrer, the N2 purging and CO2 preheating regulating and measuring unit, the discharged gas–liquid cooling and pressure-regulating unit, the heating coils and instrument power supply unit, and the sensor data acquisition and control unit. The reactor, the core component of the system, is fabricated from 316L stainless steel. The exterior of the reactor is equipped with an insulating layer and thermal insulation materials. Simultaneously, temperature sensors are installed both on the interior and the exterior of the reactor. The main heater, which is placed on the exterior of the reactor, supplies the required thermal energy for the reaction system. The power supply to the heating wires in the outer insulation layer is controlled to ensure that the temperature of the insulation layer tracks the internal temperature of the reactor, enabling an adiabatic system with no heat loss.
The entire experimental system employs National Instruments’ C-DAQ series data acquisition cards for precise signal collection. Pressure, temperature, flow rate, and other parameters are measured using a data acquisition program written based on the LabVIEW 2022 platform, which also controls the input and output of electrical signals. Additionally, a dedicated data post-processing program is used to compute the relevant physical quantities for this experiment.

2.3. Experimental Conditions and Procedures

All the experiments and corresponding operating conditions in this study are listed in Table 2.
The experimental operating procedures were standardized to facilitate a comparative analysis of the performance of the different absorbents. The reagents were weighed using a precision balance (with an accuracy of ±0.001 g), and a 500 g solution was prepared using deionized water. Prior to starting the experiment, the thermostatic water baths, mass flow controllers, and DC power supplies were preheated. The valve of the N2 cylinder was opened to cleanse all pipelines and the reactor to remove residual gases. The prepared solution was then added to the reactor via the top funnel, and the magnetic stirrer was operated for 15–20 min to stabilize the initial temperature field of the system. Throughout the experiment, the stirring speed was consistently set to 200 rpm.
Upon heating the solution to the pre-set temperature, CO2 was introduced to initiate the absorption reaction. An adiabatic environment was created for the reactor in the absorption process. The CO2 flow rate was dynamically controlled in real time by the inlet mass flow controller based on the reactor pressure, with a maximum flow rate of 500 mL/min. The termination of the absorption reaction was determined when the temperature, as measured by the thermal resistor inside the reactor, maintained a steady state.
Following the absorption reaction, the system was directly heated to initiate the desorption process. Owing to the high measurement precision and excellent heat insulation performance of this experimental system, coupled with the consideration that excessive water vaporization occurs at overly high temperatures, which would affect the experimental results, and taking into account practical industrial applications, the desorption temperature was set at 105 °C. During the desorption process, the set pressure of the reactor was adjusted to match the saturation vapor pressure of the solution at the corresponding temperature. The outlet mass flow controller valve opening was adjusted in real time by the data acquisition program based on the set pressure.

2.4. Experimental Principles and Methods

During the absorption experiment, the reactor operates as an open system. According to the first law of thermodynamics, the absorption heat ( Q abs ) can be expressed as Equation (1):
d Q abs = d E + d W
where E signifies the total energy of the open system (including chemical energy) (kJ) and W denotes the work done by the open system (kJ), and the expression of “ E ” is:
d E = d E CV + ( e 2 d m 2 e 1 d m 1 )
where E CV denotes the energy of the control volume (kJ), e 1 and e 2 indicate the specific total energy per unit mass of the working fluid entering and leaving the control volume (kJ/kg), and m 1 and m 2 represent the mass of the working fluid entering and leaving the control volume (kg).
Additionally, the work done by the open system is given by the following:
d W =   ( p 2 v 2 d m 2 p 1 v 1 d m 1 ) + d W n e t
where p 1 v 1 and p 2 v 2 signify the flow work per unit mass of the working fluid entering and leaving the control volume (kJ/kg) and d W n e t represents the net work done by the system (kJ).
Substituting Equations (2) and (3) into Equation (1), the energy balance equation for the open system becomes
d Q abs = d E CV + ( e 2 + p 2 v 2 ) d m 2 ( e 1 + p 1 v 1 ) d m 1 + d W net
Since no working fluid exits during the absorption process, d m 2 = 0 . Additionally, as the system does not perform net external work, d W net = 0 . Due to the small contribution of the internal energy and flow work (approximately 0.66 J), these terms can be neglected. Therefore, Equation (4) simplifies to the following:
d Q abs = d E CV
Based on energy conservation analysis, the heat generated during the absorption reaction is converted into the temperature elevation of both the solution and the system:
d E CV = C P   abs ¯ M t + dt d T + H T d T
where C P   abs ¯ represents the average specific heat of the lean solution (kJ/(kg·°C)), M t denotes the mass of the solution at time t (kg), and H T stands for the heat capacity of the system at temperature T (kJ/°C).
The amount of CO2 remaining in the gas phase at the end of the reaction can be determined using the ideal gas law:
V l = P C O 2 V 0 M C O 2 T e R ρ C O 2
where V l represents the volume of unabsorbed CO2 in the reactor at reaction equilibrium (L), P C O 2 denotes the partial pressure of CO2 in the reactor at reaction equilibrium (Pa), V 0 stands for the gas-phase volume in the reactor (L), M C O 2 indicates the molar mass of CO2 (kg/mol), T e signifies the temperature at absorption reaction equilibrium (°C), R is the gas constant, and ρ C O 2 represents the density of CO2 (kg/m3).
The change in solution mass over the time interval d t is given by the following:
Δ M = M t + dt M t = M C O 2 ( Q in d t V l ) V M
where Q in represents the real-time flow rate of CO2 entering the reactor during the absorption process (L/min) and V M denotes the molar volume of gas (L/mol).
The heat released during the absorption reaction over the time interval d t is expressed as follows:
d Q abs = C P   abs ¯ M abs + M C O 2 ( Q in d t V l ) V M ( T t + dt T t ) + H T ( T t + dt T t )
And the total heat released during the entire absorption reaction is as follows:
Q abs = V M V C O 2 V l C P   abs ¯ M abs + M C O 2 ( t s t e Q in d t V l ) V M ( T e T s ) + H T e ( T e T s )
where V C O 2 represents the total absorbed volume of CO2 (L), M abs denotes the initial mass of the solution (kg), t s stands for the start time of the absorption reaction (s), t e indicates the end time of the absorption reaction (s), T s signifies the solution temperature at the start of the absorption reaction (°C), and T e represents the solution temperature at the absorption reaction equilibrium (°C).
The CO2 loading of the solution, or carbon loading ( α ), is defined as follows:
α = n CO 2 n amine
where n CO 2 represents the absorbed amount of CO2 (mol) and n amine denotes the total amount of amine in the solute (mol).
The standard uncertainty of the absorption reaction heat is expressed as follows:
u Q abs = ( Q abs t e ) 2 u t e 2 + ( Q abs T e ) 2 u T e 2 + ( Q abs Q i n ) 2 u Q i n 2
where u t e represents the standard uncertainty of the end time of absorption, u T e denotes the standard uncertainty of the solution temperature at the end of absorption, and u Q in stands for the standard uncertainty of the inlet flow rate of CO2.
The desorption reaction heat can be derived by subtracting the heat of the solution temperature rise, the heat of the system temperature rise, and the latent heat of solution vaporization from the total work of the main heater. During the desorption reaction, the reactor remains an open system. Given that no working fluid flows in during the desorption process, it follows that d m 1 = 0 . Hence, the energy balance equation for the open system (Equation (4)) simplifies to the following:
d Q des =   d E CV + ( e 2 + p 2 v 2 ) d m 2 +   d W net
Similar to the absorption process, the internal energy and flow work of CO2 during desorption are negligible, further simplifying the equation to the following:
d Q des =   d E CV +   d W net
The change in solution mass over the time interval d t is given by the following:
Δ M = M t + dt M t = M C O 2 Q out d t V M ( 1 + M w V M M C O 2 V C O 2 )
where Q out represents the real-time desorption flow rate of CO2 (L/min), M w denotes the mass of the condensate (kg), and V C O 2 represents the total desorbed volume of CO2 (L).
The latent heat of vaporization of the solution can be calculated using the latent heat formula for saturated water vapor:
Q w = h d M w
where Q w represents the latent heat of vaporization of the solution (kJ) and h denotes the latent heat of vaporization value of dry saturated water vapor (kJ/kg).
The heat absorbed during the desorption reaction over an infinitesimal time period is expressed as follows:
d Q des = d Q heat C P   des ¯ ( M des M C O 2 Q out V M ( 1 + M w V M M C O 2 V C O 2 ) d t ) ( T t + dt T t ) H T ( T t + dt T t ) h d M w
And the total heat absorbed during the entire desorption reaction is the following:
Q des = V M V C O 2 Q heat C P   des ¯ M des t e t f M C O 2 Q out V M ( 1 + M w V M M C O 2 V C O 2 ) d t ( T f T e ) H T f ( T f T e ) h M w
where Q heat represents the total work of the heater after the desorption reaction (kJ), C P   des ¯ denotes the average specific heat of the rich solution (kJ/(kg·°C)), and T f stands for the solution temperature at the desorption reaction equilibrium (°C).
The standard uncertainty of the heat of desorption is the following:
u Q des = ( Q des t f ) 2 u t f 2 + ( Q des T f ) 2 u T f 2 + ( Q des Q o u t ) 2 u Q o u t 2
where u t f represents the standard uncertainty of the end time of desorption, u T f denotes the standard uncertainty of the solution temperature at the end of desorption, and u Q out stands for the standard uncertainty of the outlet flow rate of CO2.
The direct measurement results in Equations (12) and (19) are analyzed as follows: The temperature is measured by a PT100 platinum resistance in the reactor, and its allowable tolerance is ±(0.01 + 0.0017|t|)°C, where t is the reaction temperature. The inlet and outlet flow rates of CO2 are measured by inlet and outlet mass flow controllers. Their accuracy grades are both ±0.5%FS, the maximum range is 500 mL/min, and the maximum allowable error is ±2.5 mL/min. The measurement errors of temperature and flow rate both follow a uniform distribution, and the Type B uncertainty can be calculated by Equation (20). The end times of the absorption and desorption reactions are measured by a stopwatch, and their combined standard uncertainty is 3.1 ms.
u B = m a x 3
where m a x represents the maximum allowable error.
The reaction heat reflects the performance of the absorption and desorption processes. Generally, lower reaction heat indicates better energy efficiency during solvent regeneration in industrial applications.
The cyclic capacity of the solution is expressed as follows:
α = n C O 2 n amine
where n C O 2 represents the desorbed amount of CO2 (mol).
The CO2 removal efficiency over the entire absorption–desorption process can be expressed as follows:
η = V C O 2 V C O 2 × 100 %

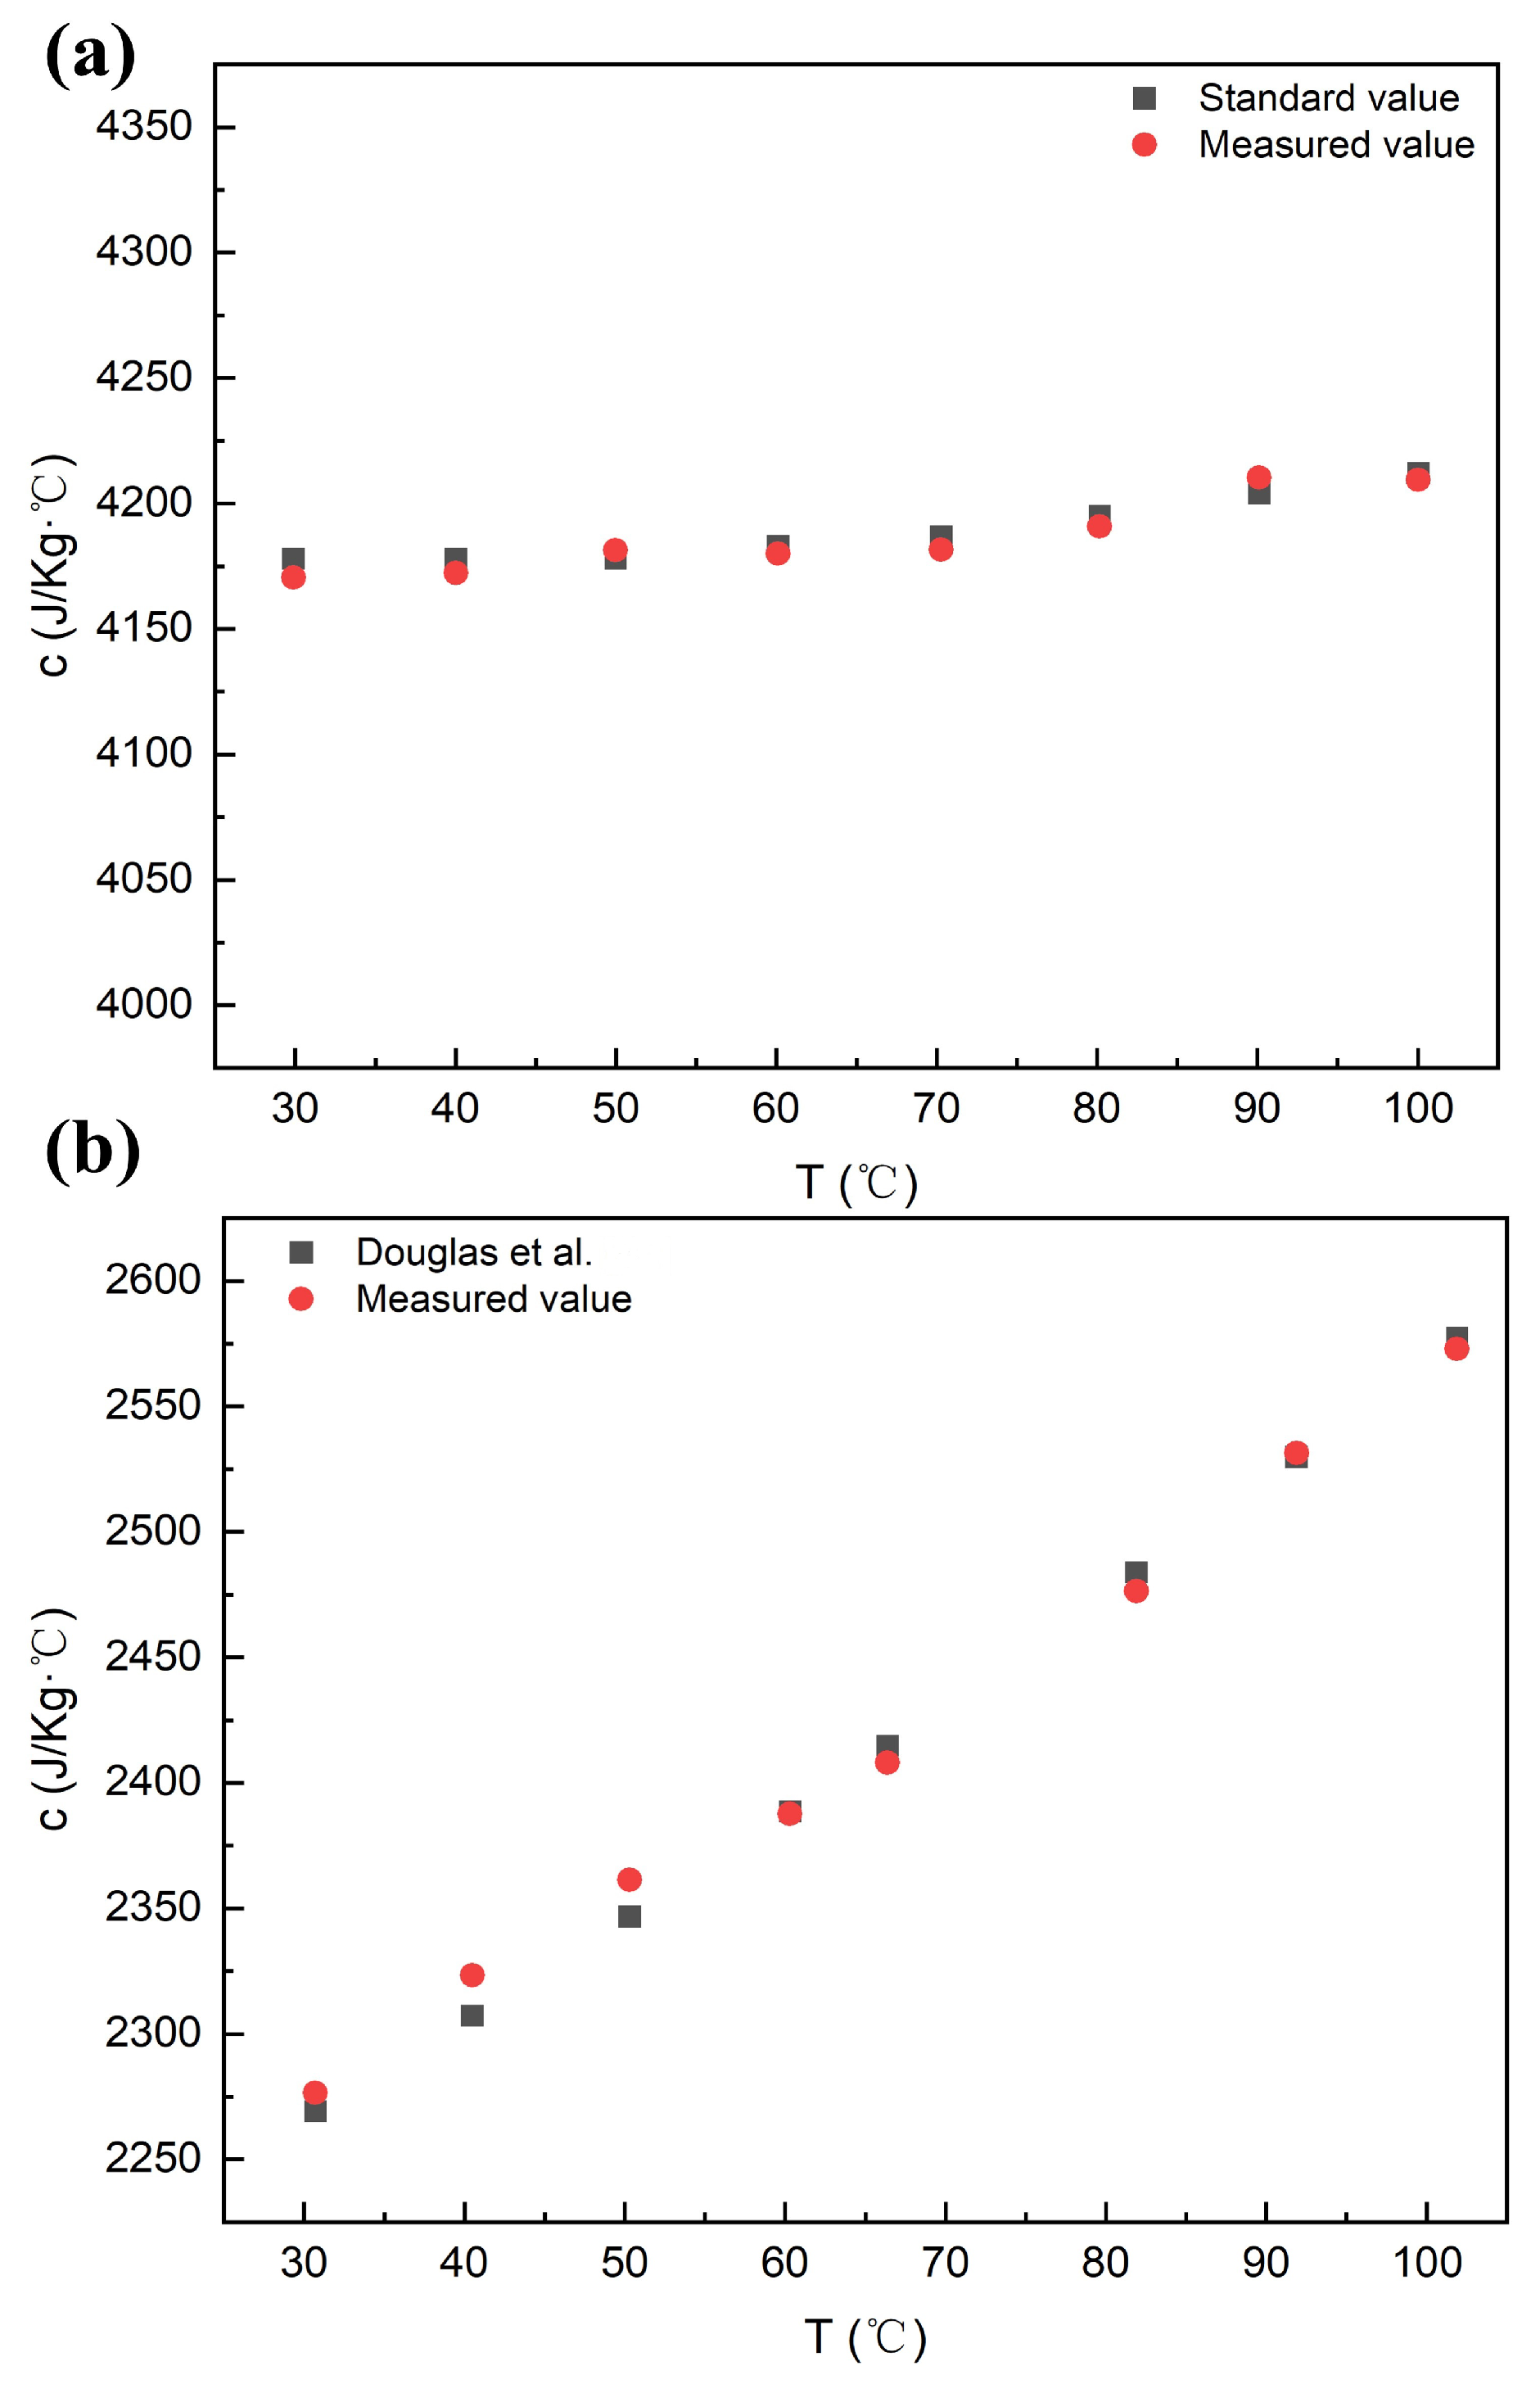
2.5. Reliability Verification of the Experimental System

To verify the reliability of the calorimetric system, the specific heat capacities of pure water and n-heptane were measured in the temperature range of 30–100 °C and compared with standard values.
As shown in Figure 2a, the measured values for pure water matched closely with the standard values, with an average error of 0.056% and a maximum absolute error of 0.18%. N-heptane is a standard reference material recommended by calorimetric conferences, and its heat capacity has been precisely measured by many calorimetric researchers. Among these, the measurements by Douglas et al. from the U.S. National Bureau of Standards [54] have been adopted as standard data. As shown in Figure 2b, the absolute error of the measured values compared to the standard values was within 0.7%, with an average error of only 0.07%.
To evaluate the measurement accuracy of the system and the precision of the reaction heat calculation model, the 30 wt% MEA solution, one of the most extensively studied systems, was selected for the experiment. The results indicate that the uncertainty in the absorption heat was 2%. Due to differences in temperature and pressure conditions, there are slight discrepancies in the absorption heat values across different literature sources, but the overall range of results remains consistent (as shown in Table 3). Therefore, the calorimetric system used in this experiment demonstrates excellent performance.

3. Results and Discussion

3.1. Single-Component Amine

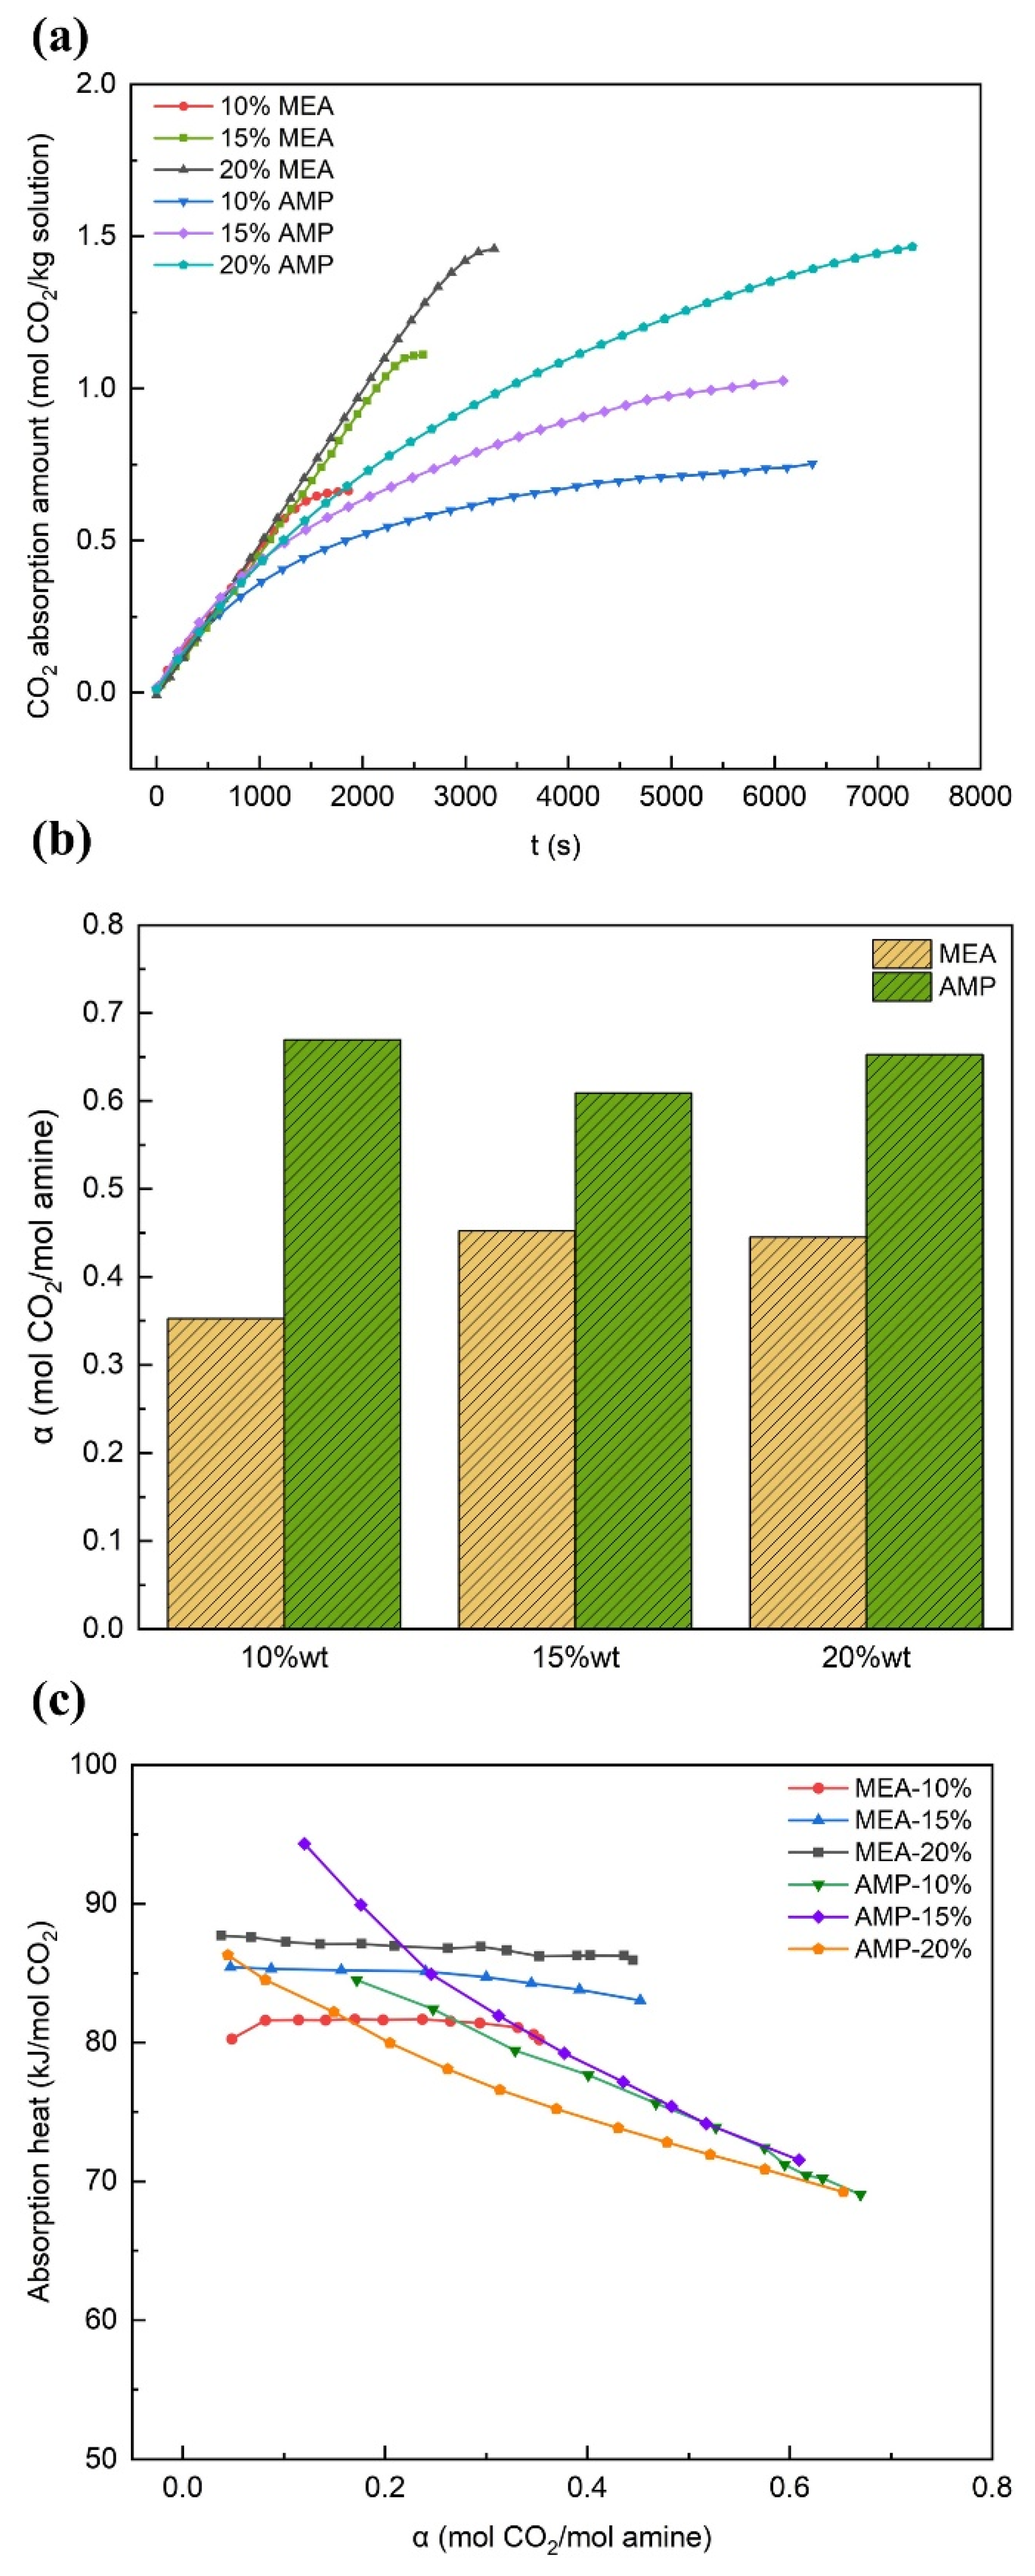
3.1.1. The Effect of Concentration

Figure 3 presents the CO2 absorption reaction results for single-component AMP and MEA solutions with concentrations of 10 wt%, 15 wt%, and 20 wt% under initial conditions of 40 °C and 1 bar. As illustrated in Figure 3a, both the cumulative CO2 absorption quantity and the absorption rate of the AMP and MEA solutions increased concomitantly with the rise in concentration. It is worth noting that the total CO2 absorption amounts in the two solutions at 20 wt% were nearly equivalent, approximately 1.46 mol CO2/kg solution. Nevertheless, compared to MEA, the absorption rate of AMP solutions was more markedly influenced by concentration. Specifically, AMP solutions exhibited a longer overall reaction time, and the absorption process proceeded at a slower pace. Notably, the total reaction times of the 10 wt% and 15 wt% AMP solutions were very similar, whereas the reaction time of the 20 wt% AMP solution was significantly prolonged.
As shown in Figure 3b, with an increase in the amine solution concentration, the CO2 absorption capacity of MEA increased, with the maximum carbon loading rising from 0.35 mol CO2/mol amine to 0.45 mol CO2/mol amine. In contrast, the maximum carbon loading of AMP solutions showed no significant trend with concentration. Under all experimental conditions in this group, the maximum carbon loading of AMP solutions consistently exceeded 0.6 mol CO2/mol amine, demonstrating a higher utilization efficiency of the absorbent compared with MEA solutions at the same concentration. Theoretically, the maximum carbon loading for AMP could reach 1 mol CO2/mol amine. However, the instability of the formed carbamates during the absorption reaction led to their easy decomposition [24], resulting in a lower actual CO2 absorption capacity in the solution.
According to Figure 3c, the variation trends in the absorption heats of AMP solutions at different concentrations were generally consistent as the carbon loading increased, with the absorption heats decreasing to approximately 70 kJ/mol CO2. The magnitudes of these changes were more significant for AMP solutions compared to MEA solutions. Furthermore, under higher carbon loadings, the absorption heats of AMP solutions were lower than those of MEA solutions. Meanwhile, the values of the absorption heats of AMP solutions at different concentrations were similar, indicating that the influence of concentration on the absorption heats of AMP solutions decreased as the carbon loading increased.
Table 4 presents the desorption results for MEA and AMP solutions at different concentrations. Compared to MEA, the CO2 removal efficiency of the rich solutions was less affected by the concentration of AMP. The products of the AMP-CO2 absorption reaction were predisposed to decomposition, more so than those of the MEA-CO2 absorption reaction. Therefore, the desorption performance of AMP was better than that of MEA, with the removal rates all around 68% and the cyclic capacities all exceeding 0.4 mol CO2/mol amine. Moreover, the desorption heats of the AMP solutions increased with the rise in amine concentration, which were consistent with those of the MEA solution. However, the measured desorption heats of AMP ranged from approximately 82 to 85 kJ/mol CO2, which values were lower than those of MEA (around 95 to 101 kJ/mol CO2).

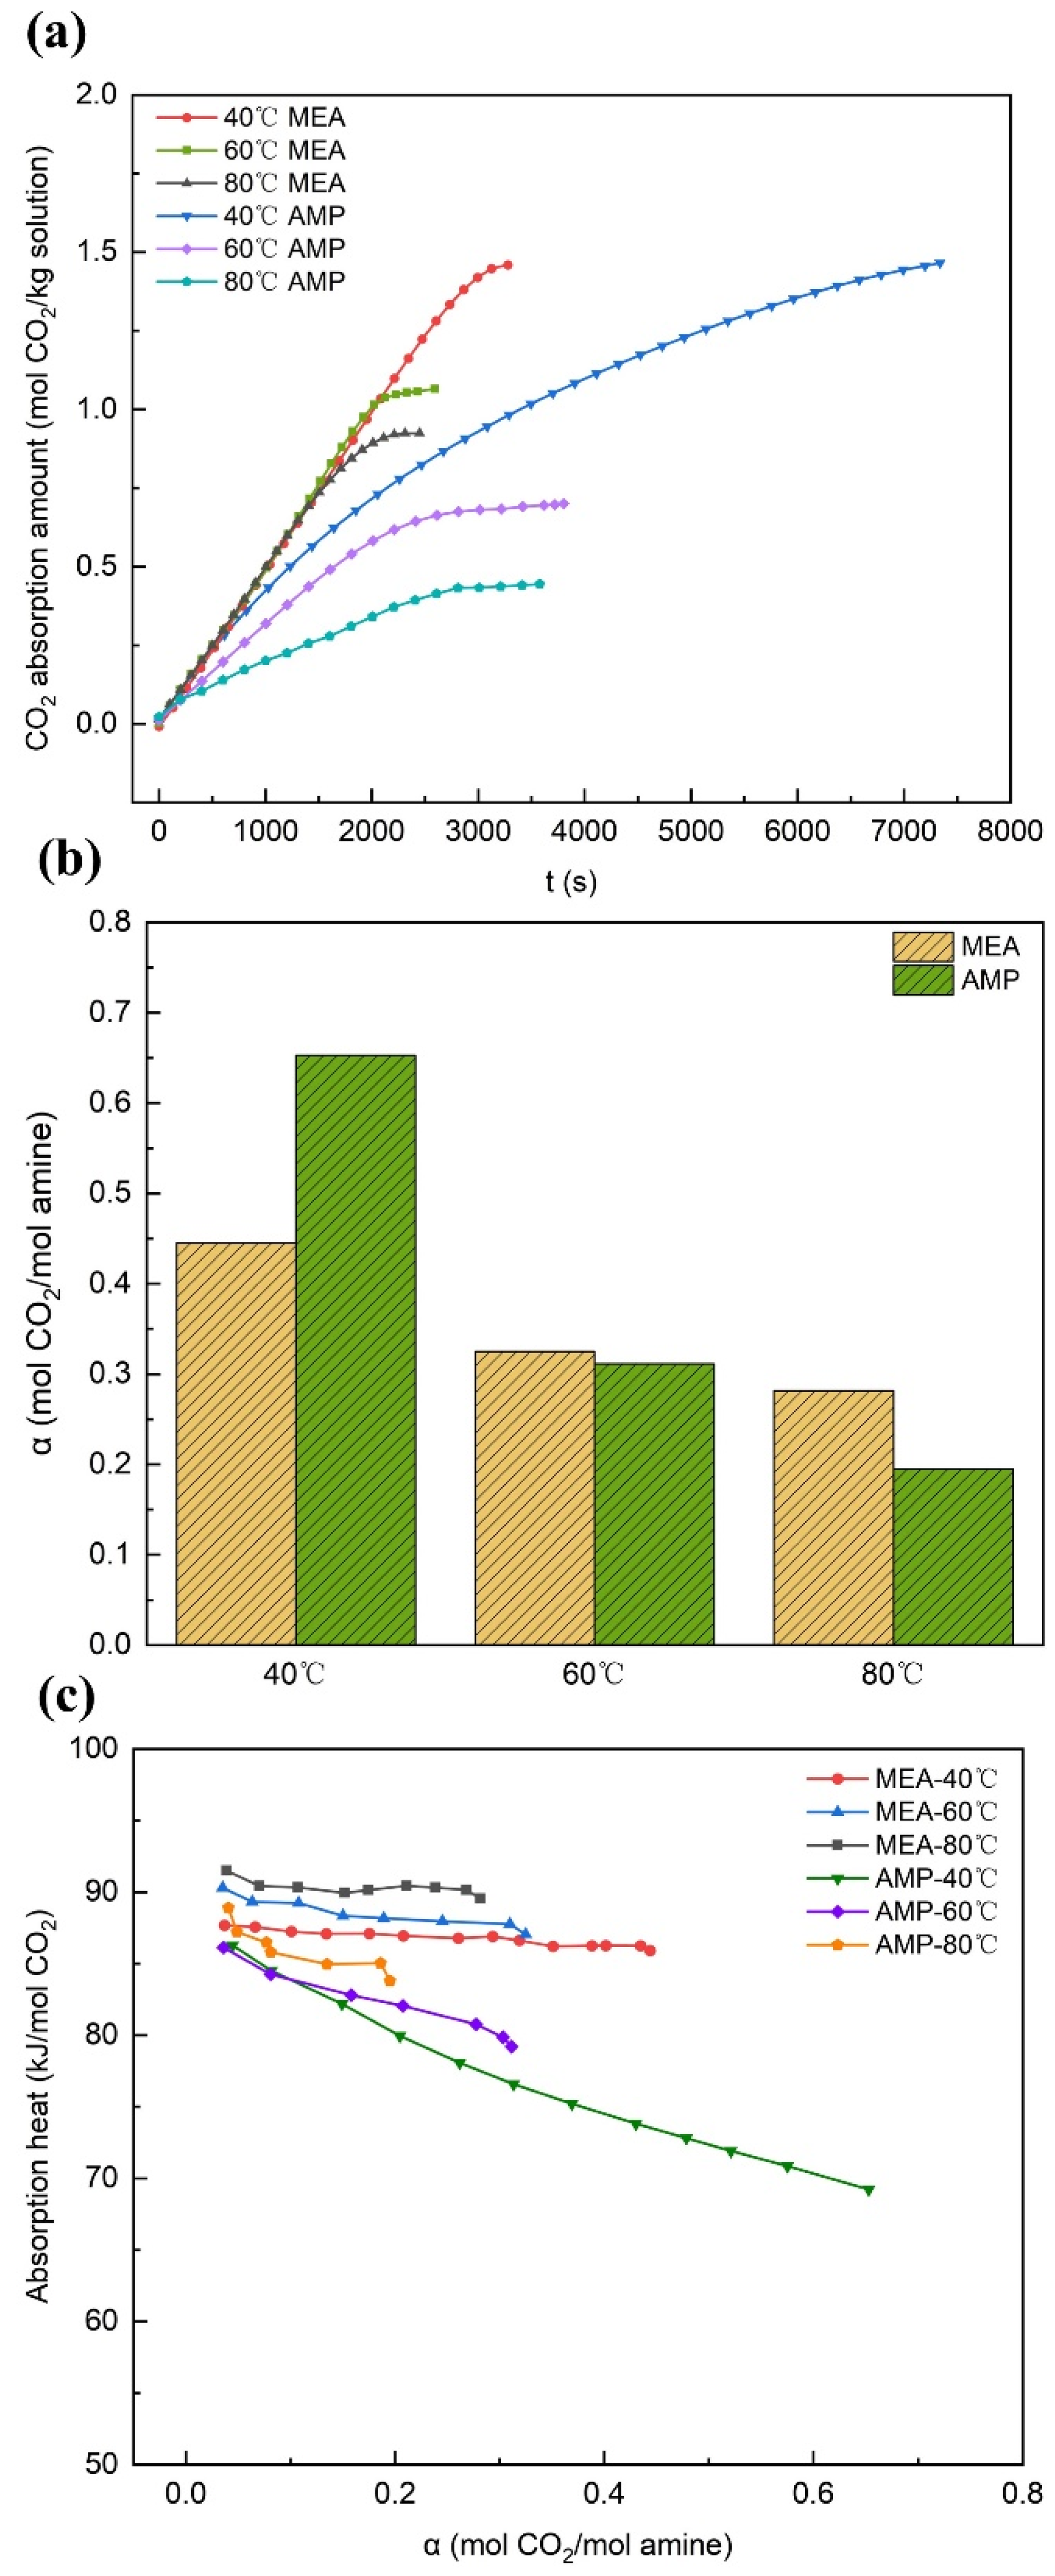
3.1.2. The Effect of Temperature

Figure 4 illustrates the experimental results of the CO2 absorption reaction for single-component 20 wt% AMP and MEA solutions under the conditions of 1 bar pressure, with initial temperatures of 40 °C, 60 °C, and 80 °C. As shown in Figure 4a, both AMP and MEA decreased in CO2 absorption amounts as the initial reaction temperature increased. This can be attributed to the enhanced reverse reaction of CO2 capture by alcoholamines with rising temperature. Compared with MEA, the absorption amount and the macroscopic absorption rate of AMP decreased more significantly, indicating that the temperature variations had a greater impact on the absorption performance of AMP than that of MEA [58].
The comparison of the data in Figure 4b shows that the maximum carbon loadings of the corresponding solutions varied significantly under different temperature conditions. At the reaction pressure of 1 bar, the maximum carbon loading of the 20 wt% MEA solution decreased from 0.44 mol CO2/mol amine at 40 °C to 0.28 mol CO2/mol amine at 80 °C, while that of the 20 wt% AMP solution dropped from 0.65 mol CO2/mol amine at 40 °C to 0.195 mol CO2/mol amine at 80 °C. The decline in AMP’s absorption capacity was more pronounced compared with MEA under the same experimental conditions.
Figure 4c shows that both AMP and MEA solutions exhibited an increase in absorption heat with rising initial reaction temperature. This trend is consistent with the experimental results reported by Mathonat [59] and Kim [56]. Specifically, the absorption heats of the AMP solutions at 40 °C and 60 °C were similar at lower loads (below 0.1 mol CO2/mol amine), and the absorption heat curves showed the intersection.
The desorption results for MEA and AMP rich solutions (as shown in Table 5) indicate that the desorption heats of AMP solutions followed a similar trend to those of MEA solutions, increasing with the rise in absorption temperature in the former capture reaction. However, the values and the extent of increase in the desorption heat for AMP were smaller than those for MEA, suggesting that the effect of absorption temperature on the desorption performance of AMP was less significant. The CO2 removal rate from AMP rich solutions decreased noticeably with higher absorption temperatures, and the cyclic capacity also decreased significantly. Nevertheless, the overall desorption efficiency still outperformed that of MEA solutions.

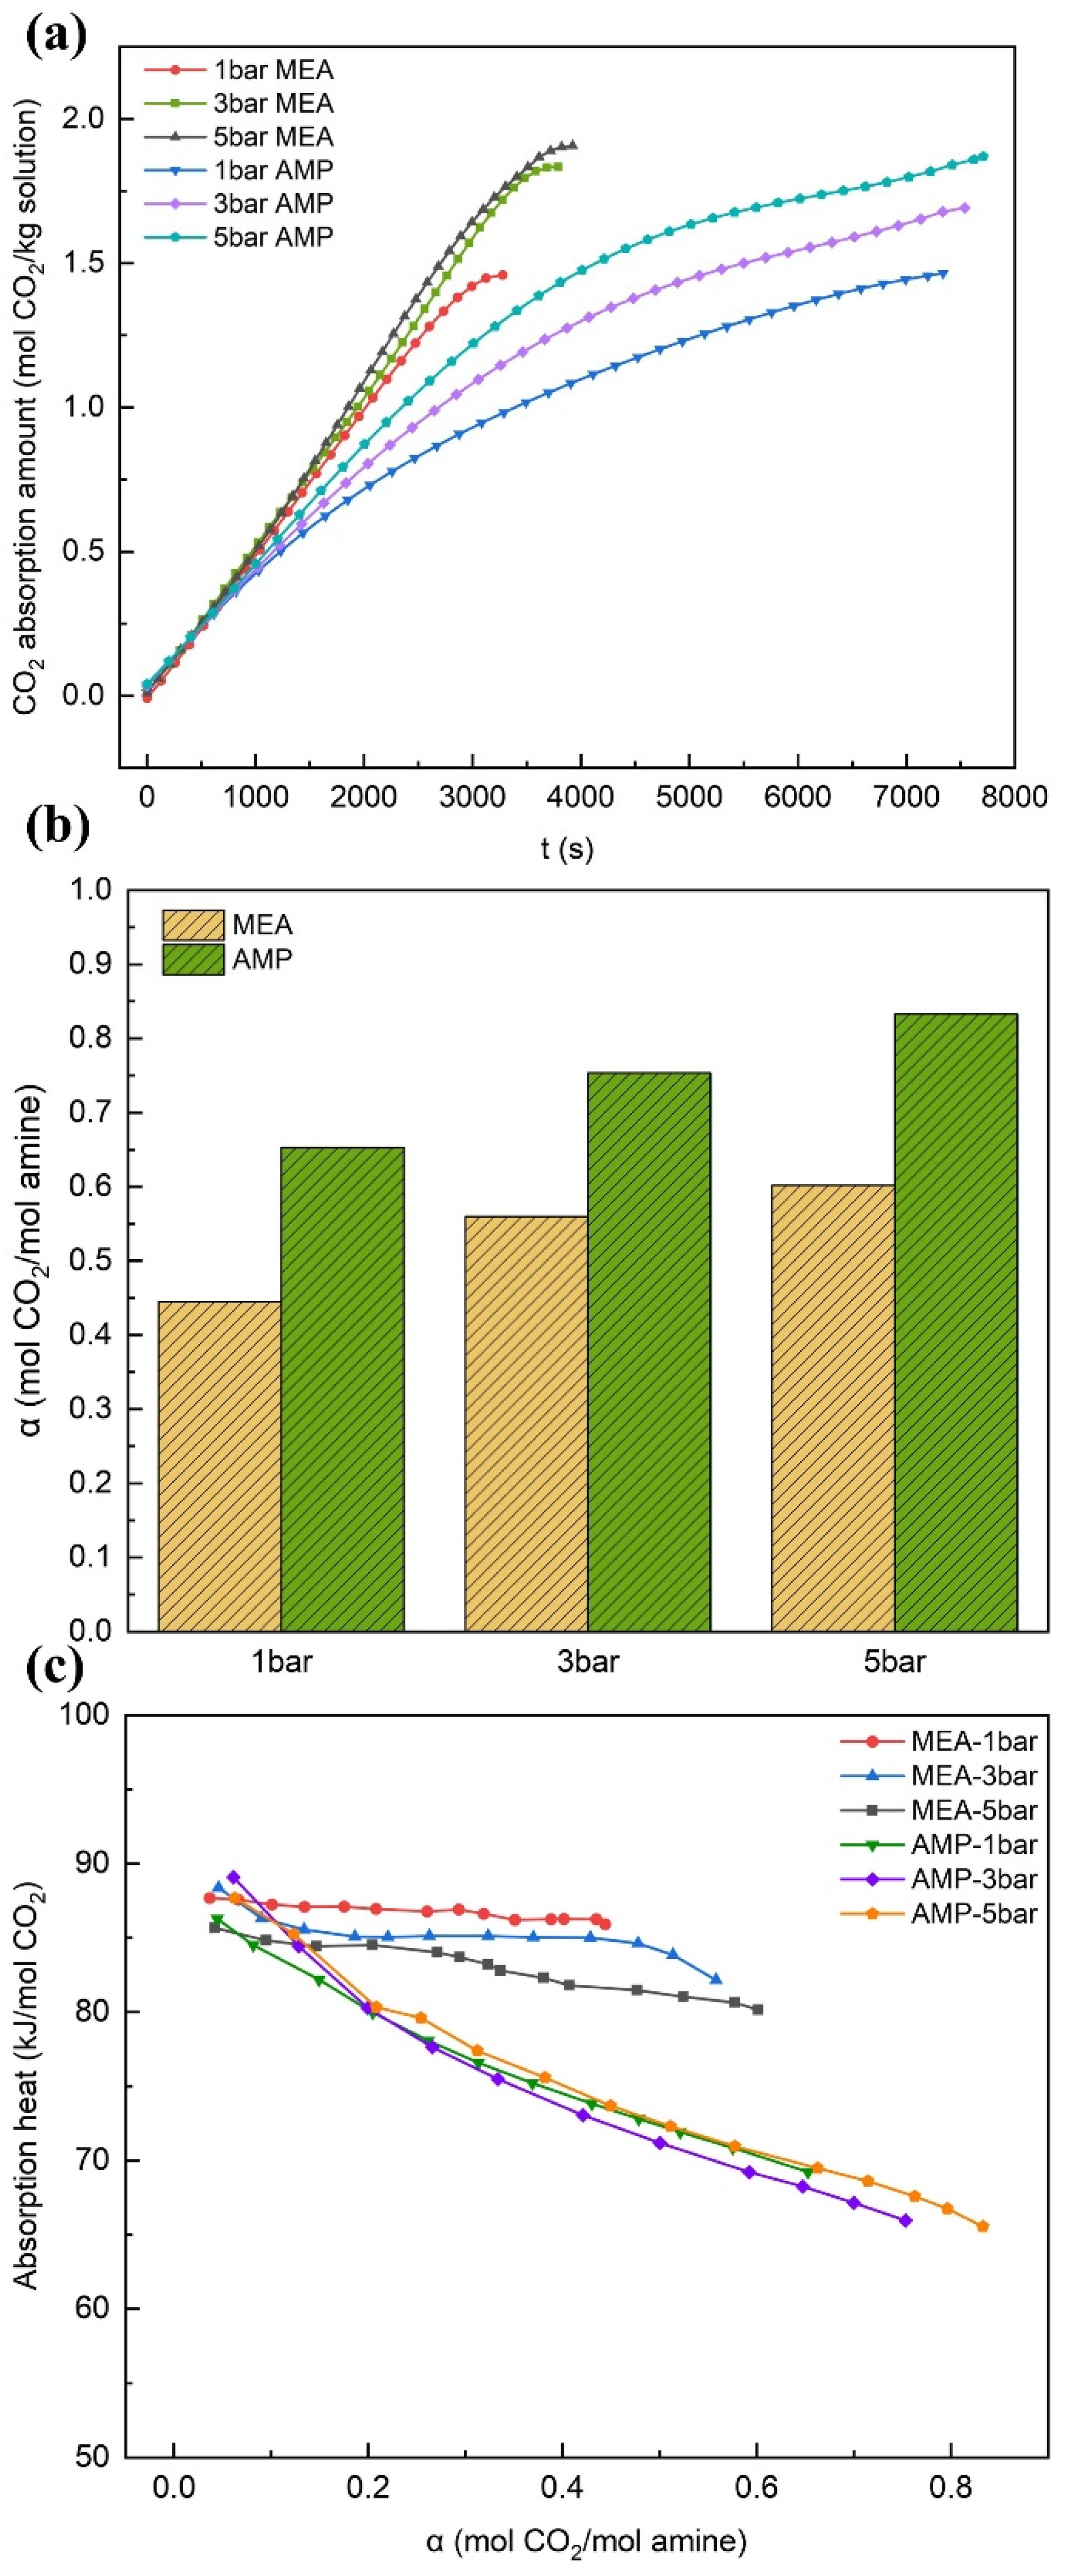
3.1.3. The Effect of Pressure

Figure 5 presents the CO2 absorption results for 20 wt% AMP and 20 wt% MEA solutions at an initial absorption temperature of 40 °C and varying absorption pressures. According to Figure 5a, as the system pressure increased, the dissolution rate of CO2 in the liquid phase accelerated, and its dissolution capacity enhanced. Both AMP and MEA exhibited increases in absorption rate and total absorption, although to varying degrees. Compared with MEA, the variation range of the absorption rate of AMP was more significant, and its absorption amount presented a more linear growth trend over time.
From Figure 5b, the maximum CO2 loading capacity of the solution increased with pressure, and the changes in the maximum CO2 loading for both solutions were quite significant. Specifically, the maximum CO2 loading of MEA increased from 0.445 mol CO2/mol amine at 1 bar to 0.6 mol CO2/mol amine at 5 bar. In contrast, AMP reached a maximum CO2 loading of 0.83 mol CO2/mol amine at 5 bar.
As depicted in Figure 5c, the absorption heats of MEA gradually declined with the increase in system pressure. Combining this with the results on the absorption amount, absorption rate, and maximum CO2 loading capacity, it was observed that increasing the pressure improved the absorption performance of the MEA solution. In contrast, the effect of pressure on the absorption heats of AMP was minimal. When the carbon loading exceeded 0.75 mol CO2/mol amine, the overall absorption heats of AMP were lower than those of MEA.
Table 6 presents the desorption results of MEA and AMP rich solutions at different absorption pressures. As the absorption pressure increased, the CO2 removal efficiency of the MEA rich solution significantly improved, and the cyclic capacity also increased markedly, while the desorption heat remained relatively unchanged. Similarly, the desorption heat for AMP rich liquid showed little variation, and it was lower than that of the MEA solution. This was consistent with the experimental trend observed for absorption heats. When the absorption pressure was raised from 1 bar to 3 bar, the CO2 removal effect of the AMP rich solution was greatly strengthened. However, when the pressure was further increased to 5 bar, the removal rate of the solution decreased instead.
Overall, as the CO2 absorption load increases, the decline in absorption heat for AMP is more noticeable compared to MEA. This is due to the different reaction mechanisms of the two amines with CO2. MEA primarily forms stable carbamates at CO2 loadings below its maximum theoretical capacity, resulting in minimal variation in absorption heat within this loading range. In contrast, the carbamates formed with AMP are less stable and partially hydrolyze into bicarbonates.
2 AMP + C O 2 AMPCO O + AMP H +
AMPCO O + H 2 O AMP + HC O 3
As the absorption reaction proceeds, the concentration of free amines in the solution decreases, and the accumulation of carbamates promotes the formation of bicarbonates. Since the heat released in Reaction (R1) is generally higher than that in Reaction (R2) [60], the absorption heat for AMP decreases significantly. Additionally, the desorption performance of AMP is better than that of MEA, leading to a reduction in energy consumption while improving the regeneration efficiency.

3.2. Binary Blended Amines with AMP as the Main Absorbent

Taking AMP as the main agent, MEA, DGA, DEA, MDEA, and PZ were introduced individually. The total concentration of the solution was controlled at 20 wt%. The aim was to explore the impacts of additives of different types and at different concentrations on the overall performance of the solution.

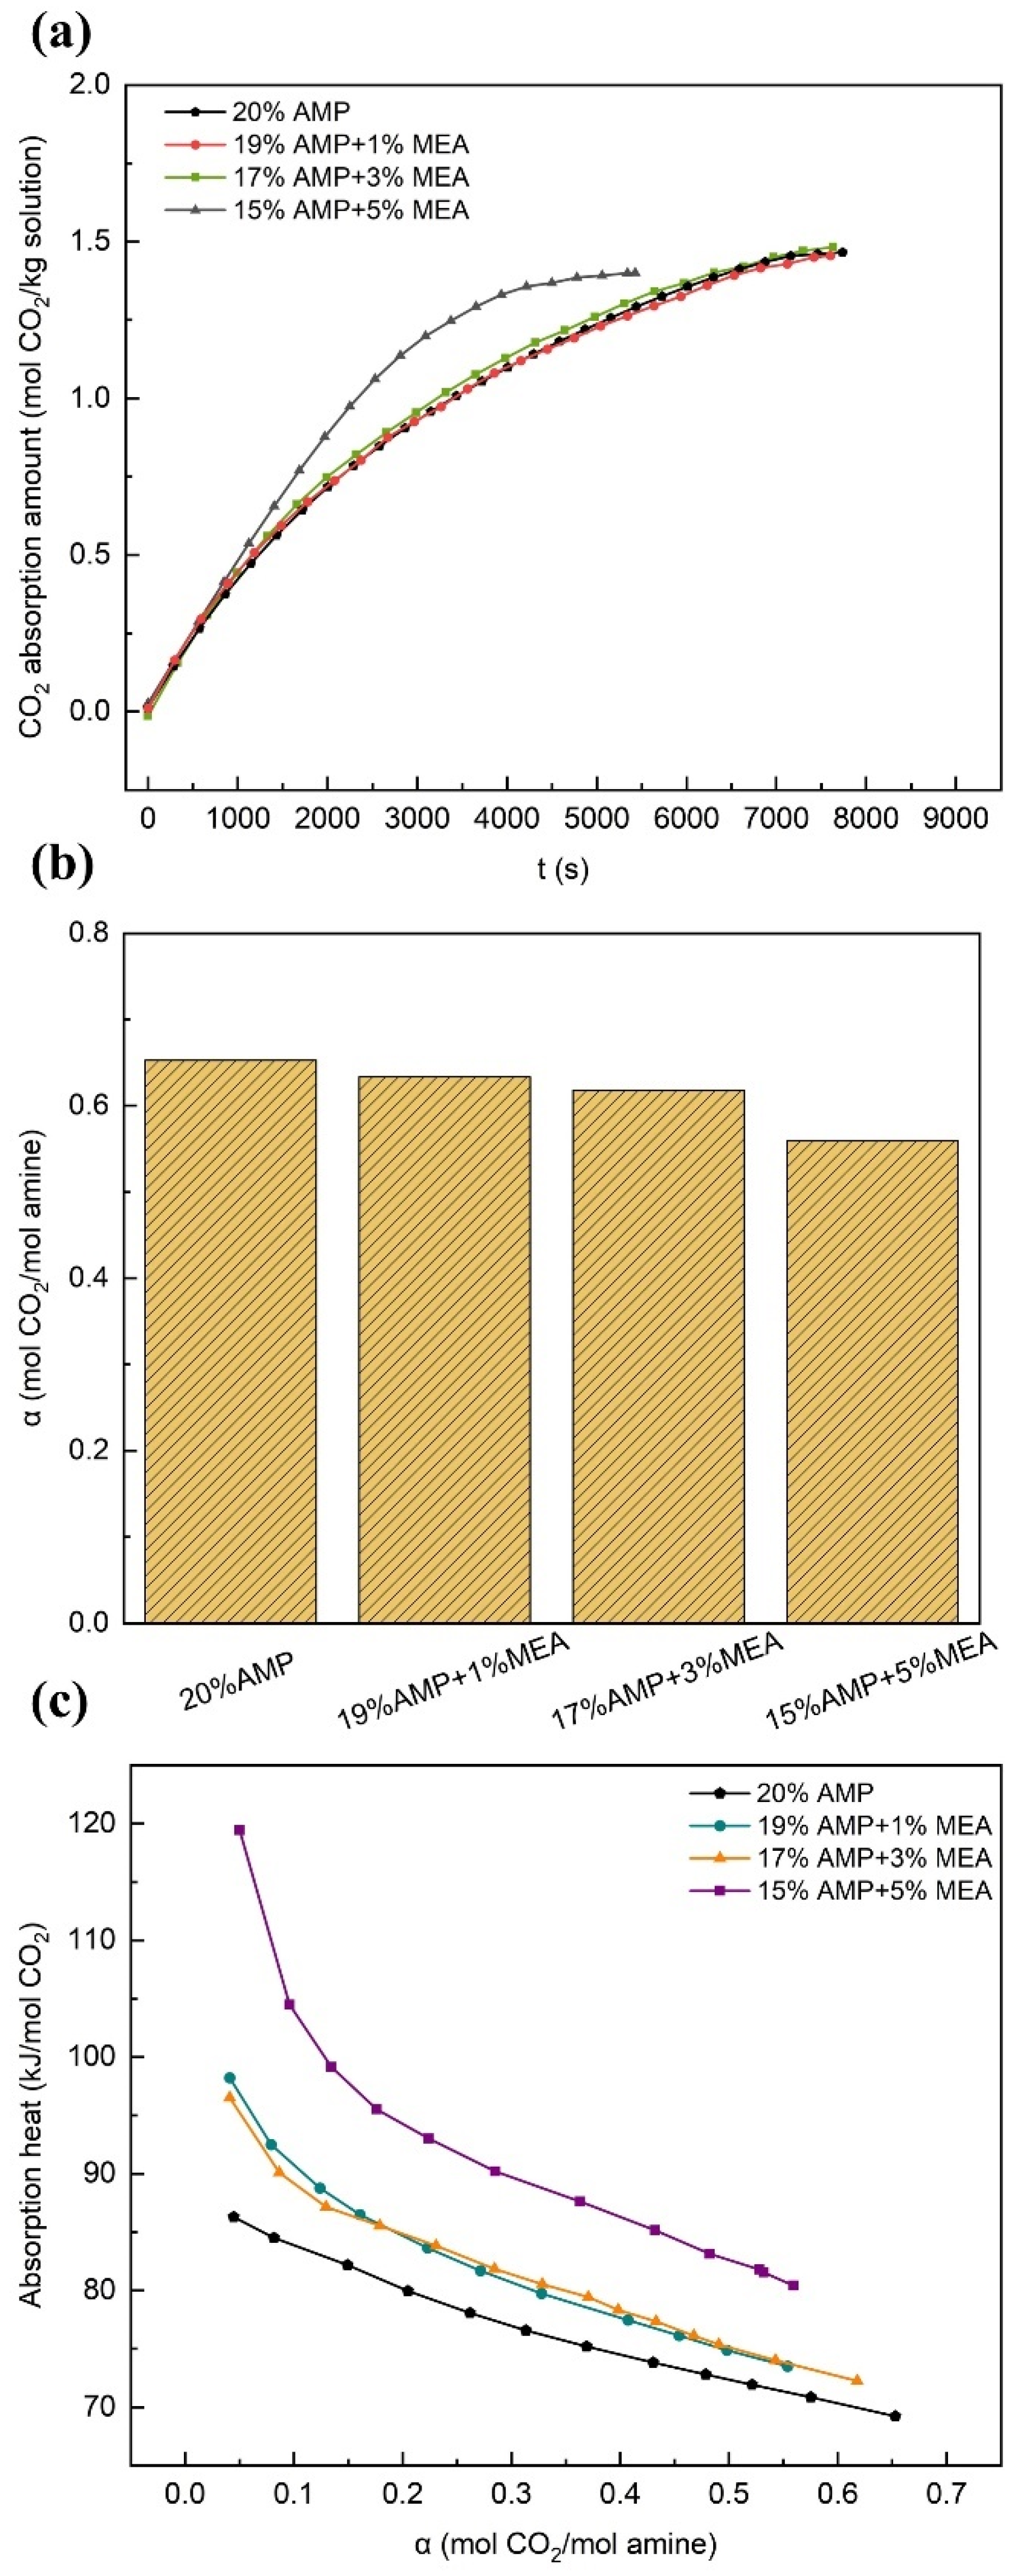
3.2.1. Effects of MEA

Figure 6 presents the absorption experiment results of AMP-MEA solutions with different ratios under the initial temperature of 40 °C and the pressure of 1 bar. From Figure 6a, it can be observed that the total CO2 absorption amounts of the three binary solutions were nearly identical. Specifically, the absorption curve of the 19 wt% AMP + 1 wt% MEA solution was similar to that of the pure AMP solution. In contrast, the 17 wt% AMP + 3 wt% MEA solution exhibited a slightly higher absorption load within the same time period. Additionally, the 15 wt% AMP + 5 wt% MEA solution showed a steeper slope during the early stages of the reaction, and it reached saturation the fastest, indicating the highest overall absorption rate.
As shown in Figure 6b, with the increase in the MEA proportion, the maximum carbon loading capacity of the blended solutions gradually decreased. Figure 6c demonstrates that the absorption heats of the three AMP-MEA blended solutions exhibited a consistent trend. Initially, the absorption heats decreased rapidly; however, as the CO2 loading increased, the rate of decrease gradually slowed. This phenomenon can be attributed to the higher reactivity of MEA compared with AMP. The CO2 dissolved in the solution tends to first react with MEA, leading to relatively higher absorption heats at lower CO2 loads. As the CO2 loading increases, the concentration of CO2 in the solution rises, thereby increasing the opportunities for CO2 to react with AMP. Consequently, the average absorption heats of the binary solutions decrease, and the absorption heat curve shows a decreasing trend similar to that of the single-component AMP solution.
The absorption heats for the AMP-MEA solutions were consistently higher than those of the corresponding concentrations of pure AMP solution. Among the binary solutions, the experimental results for the 19 wt% AMP + 1 wt% MEA and 17 wt% MEA + 3 wt% AMP solutions were quite similar, while the 15 wt% AMP + 5 wt% MEA solution exhibited significantly higher heat release than the other composition ratios.
Table 7 presents a comparison of the desorption results for the AMP-MEA blended solutions. It can be observed that the incorporation of MEA initiated a deterioration in the desorption performance of the solution. Among the three composition ratios, the 19 wt% AMP + 1 wt% MEA solution had the lowest desorption heat value (88.17 kJ/mol CO2), the strongest cyclic capacity (0.48 mol CO2/mol amine), and the highest removal efficiency (75.05%).

3.2.2. Effects of DGA

Figure 7 shows the absorption experimental results for the AMP-DGA solutions at an initial temperature of 40 °C and a pressure of 1 bar. It can be seen from Figure 7a that there was no significant difference in the absorption rates of the three differently proportioned AMP-DGA solutions in the early stage of the reaction. As the DGA mass fraction increased, the time required for the binary solution to reach equilibrium was significantly shortened, while the total CO2 absorption also decreased substantially. Notably, the 15 wt% AMP + 5 wt% DGA solution reached saturation in just half the time of the 20 wt% AMP solution, and its maximum absorption capacity, at 0.99 mol CO2/kg solution, was clearly lower than that of the other solutions, indicating the weakest overall absorption performance. As shown in Figure 7b, with the increase in DGA content, the maximum carbon loading capacity of the AMP-DGA system significantly decreased.
Figure 7c reveals that the absorption heats of the AMP-DGA solutions in various proportions were consistently higher than those of the single-component AMP solution at the equivalent concentrations, and they exhibited a decreasing trend with the increase in CO2 loading. It is worth noting that in the initial stage of the absorption reaction, when the carbon loading was 0.04 mol CO2/mol amine, the absorption heats for all three blended solutions were 90 kJ/mol CO2. In this set of experiments, the higher the mass fraction of DGA was, the higher the absorption heats of the blended solutions were.
Table 8 shows the results of the desorption experiment for AMP-DGA solutions, from which it can be observed that the 19 wt% AMP + 1 wt% DGA solution exhibited the most favorable desorption performance. Compared with the 20 wt% AMP solution, the desorption heat of the 19 wt% AMP + 1 wt% DGA solution was reduced by 7.8% and its removal rate was increased by 3.8%. Previous studies in the literature contain limited research on the interactions between AMP and DGA. Based on the above results, it can be observed that although both MEA and DGA are primary amines, there are significant differences in the absorption and desorption characteristics between AMP-MEA and AMP-DGA systems.

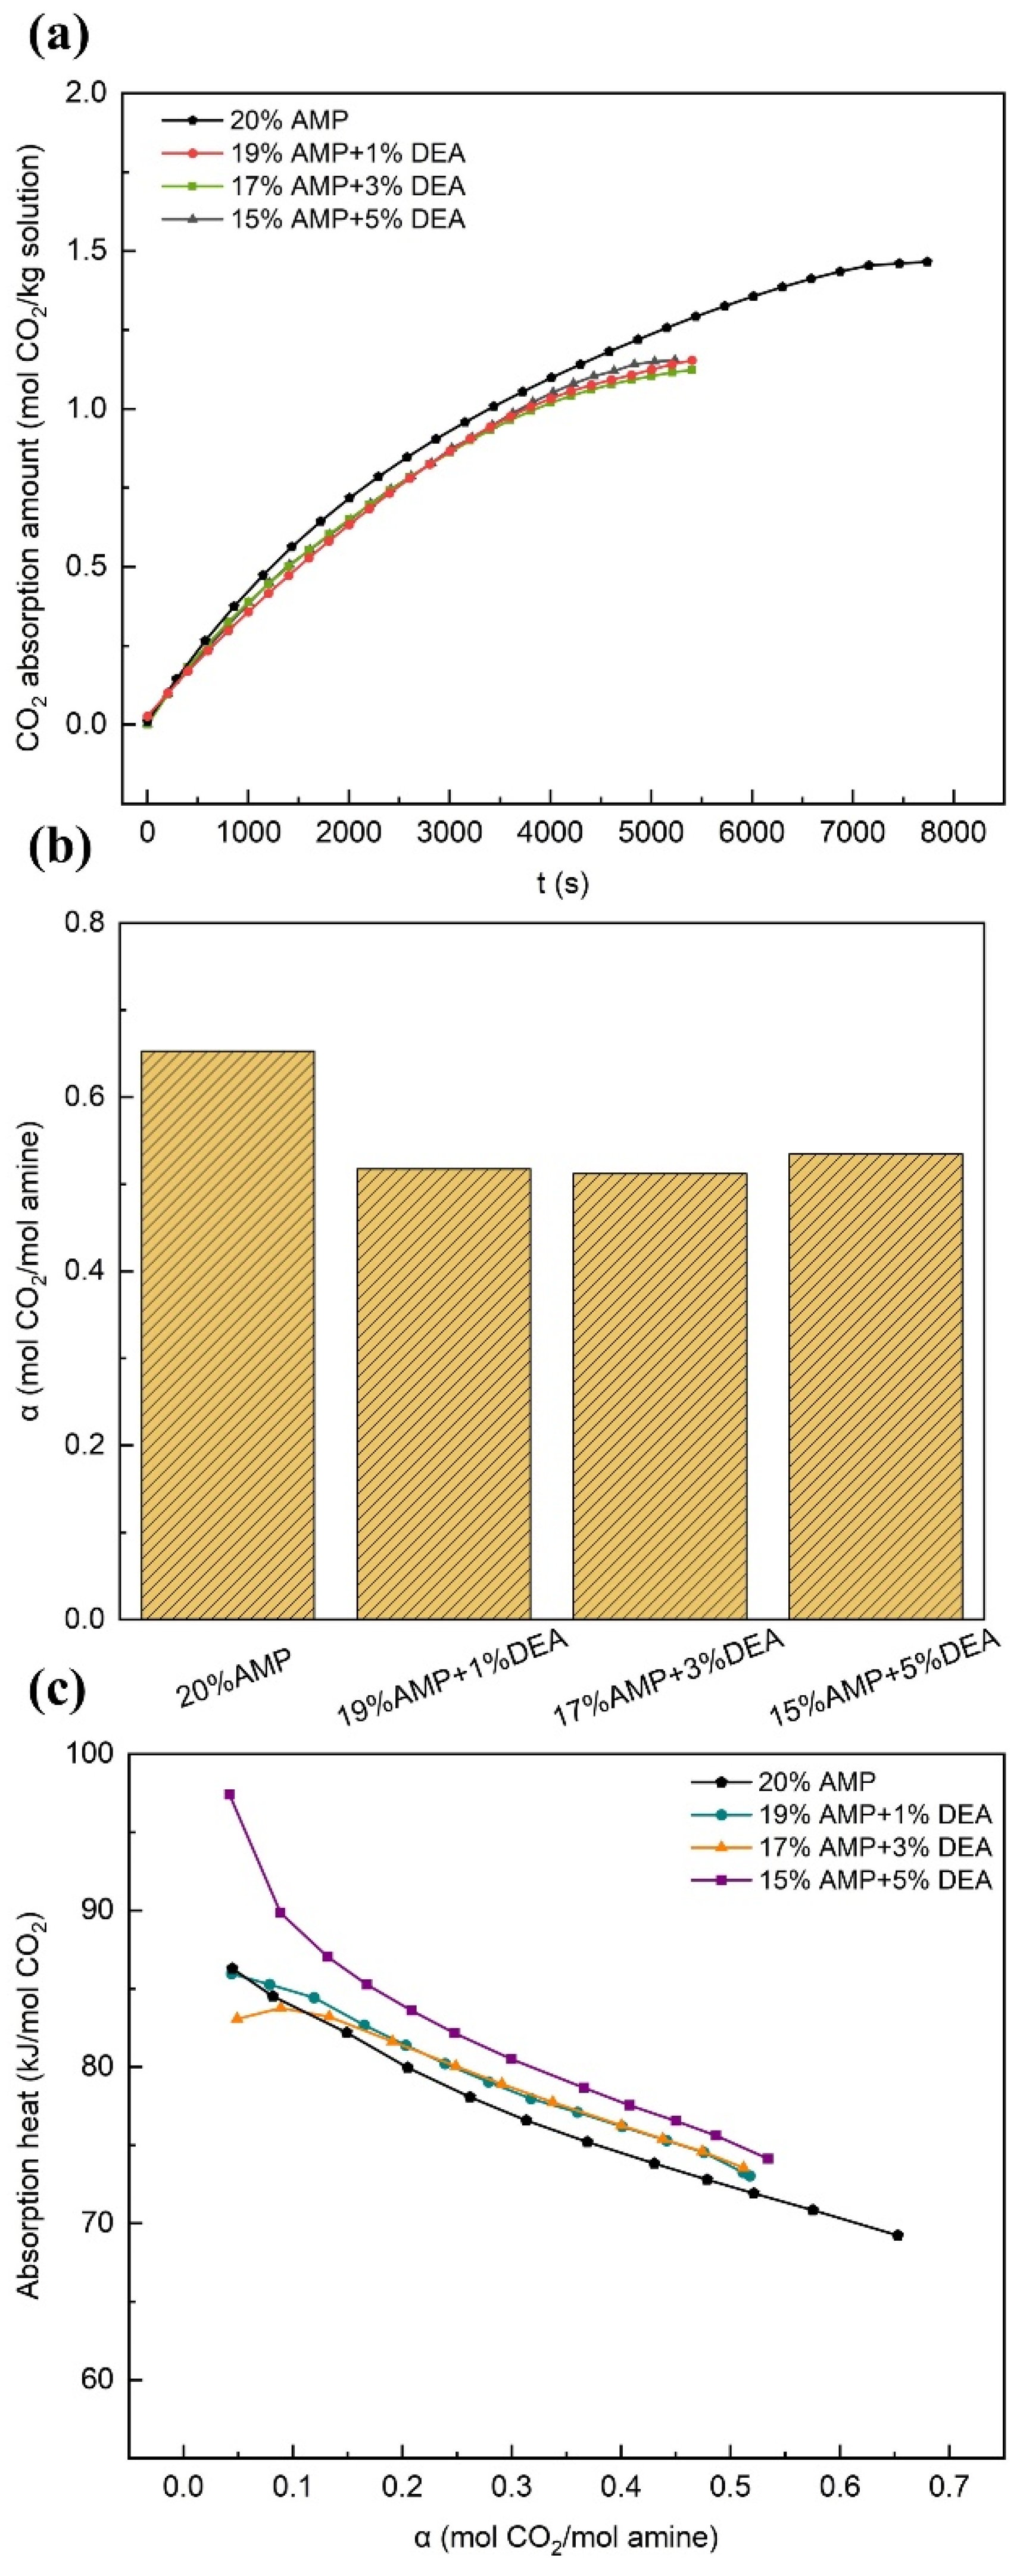
3.2.3. Effects of DEA

Figure 8 presents the absorption reaction results for the AMP-DEA solutions at an initial temperature of 40 °C and a pressure of 1 bar. As indicated in Figure 8a, the total absorption time for all three binary solutions was less than that of the 20 wt% single-component AMP solution. The introduction of DEA led to a decrease in CO2 solubility in the binary solutions, which is consistent with the findings of Kundu et al. [61]. The cumulative CO2 absorption of the three AMP-DEA solutions at the same time was lower than that of the AMP solution, with the total absorption amounts being similar for all three, approximately 1.1 mol CO2/kg solution.
As shown in Figure 8b, the maximum carbon loading of the three AMP-DEA solutions ranged from 0.51 to 0.53 mol CO2/mol amine, which was lower than that of the AMP solution with the same concentration. Figure 8c reveals that during the initial stage of the absorption reaction (when the carbon loading was below 0.05 mol CO2/mol amine), there were significant differences in the absorption heat values. Precisely, the 15 wt% AMP + 5 wt% DEA solution had the highest absorption heat, followed by the 20 wt% AMP solution and the 19 wt% AMP + 1 wt% DEA solution, whose absorption heat values were approximately equal, and the 17 wt% AMP + 3 wt% DEA solution had the lowest absorption heat. As the reaction progressed, the absorption heat curves for all the binary solutions showed a decreasing trend. The 15 wt% AMP + 5 wt% DEA solution maintained the highest heat value, while the heat curves for the 19 wt% AMP + 1 wt% DEA and 17 wt% AMP + 3 wt% DEA solutions nearly overlapped. Overall, the absorption heats of the binary solutions were greater in magnitude than that of the single-component AMP solution.
Table 9 presents the desorption results for AMP-DEA solutions. A comparison of the three formulations revealed that the 15 wt% AMP + 5 wt% DEA solution exhibited the best cyclic performance and CO2 removal efficiency, although its desorption heat was relatively high. The 19 wt% AMP + 1 wt% DEA solution had the lowest desorption heat value, yet its cycling performance and removal rate were the poorest. It can be concluded that increasing the DEA content in the AMP solution enhanced the CO2 removal capacity of the rich solvent but simultaneously led to higher regeneration energy consumption.

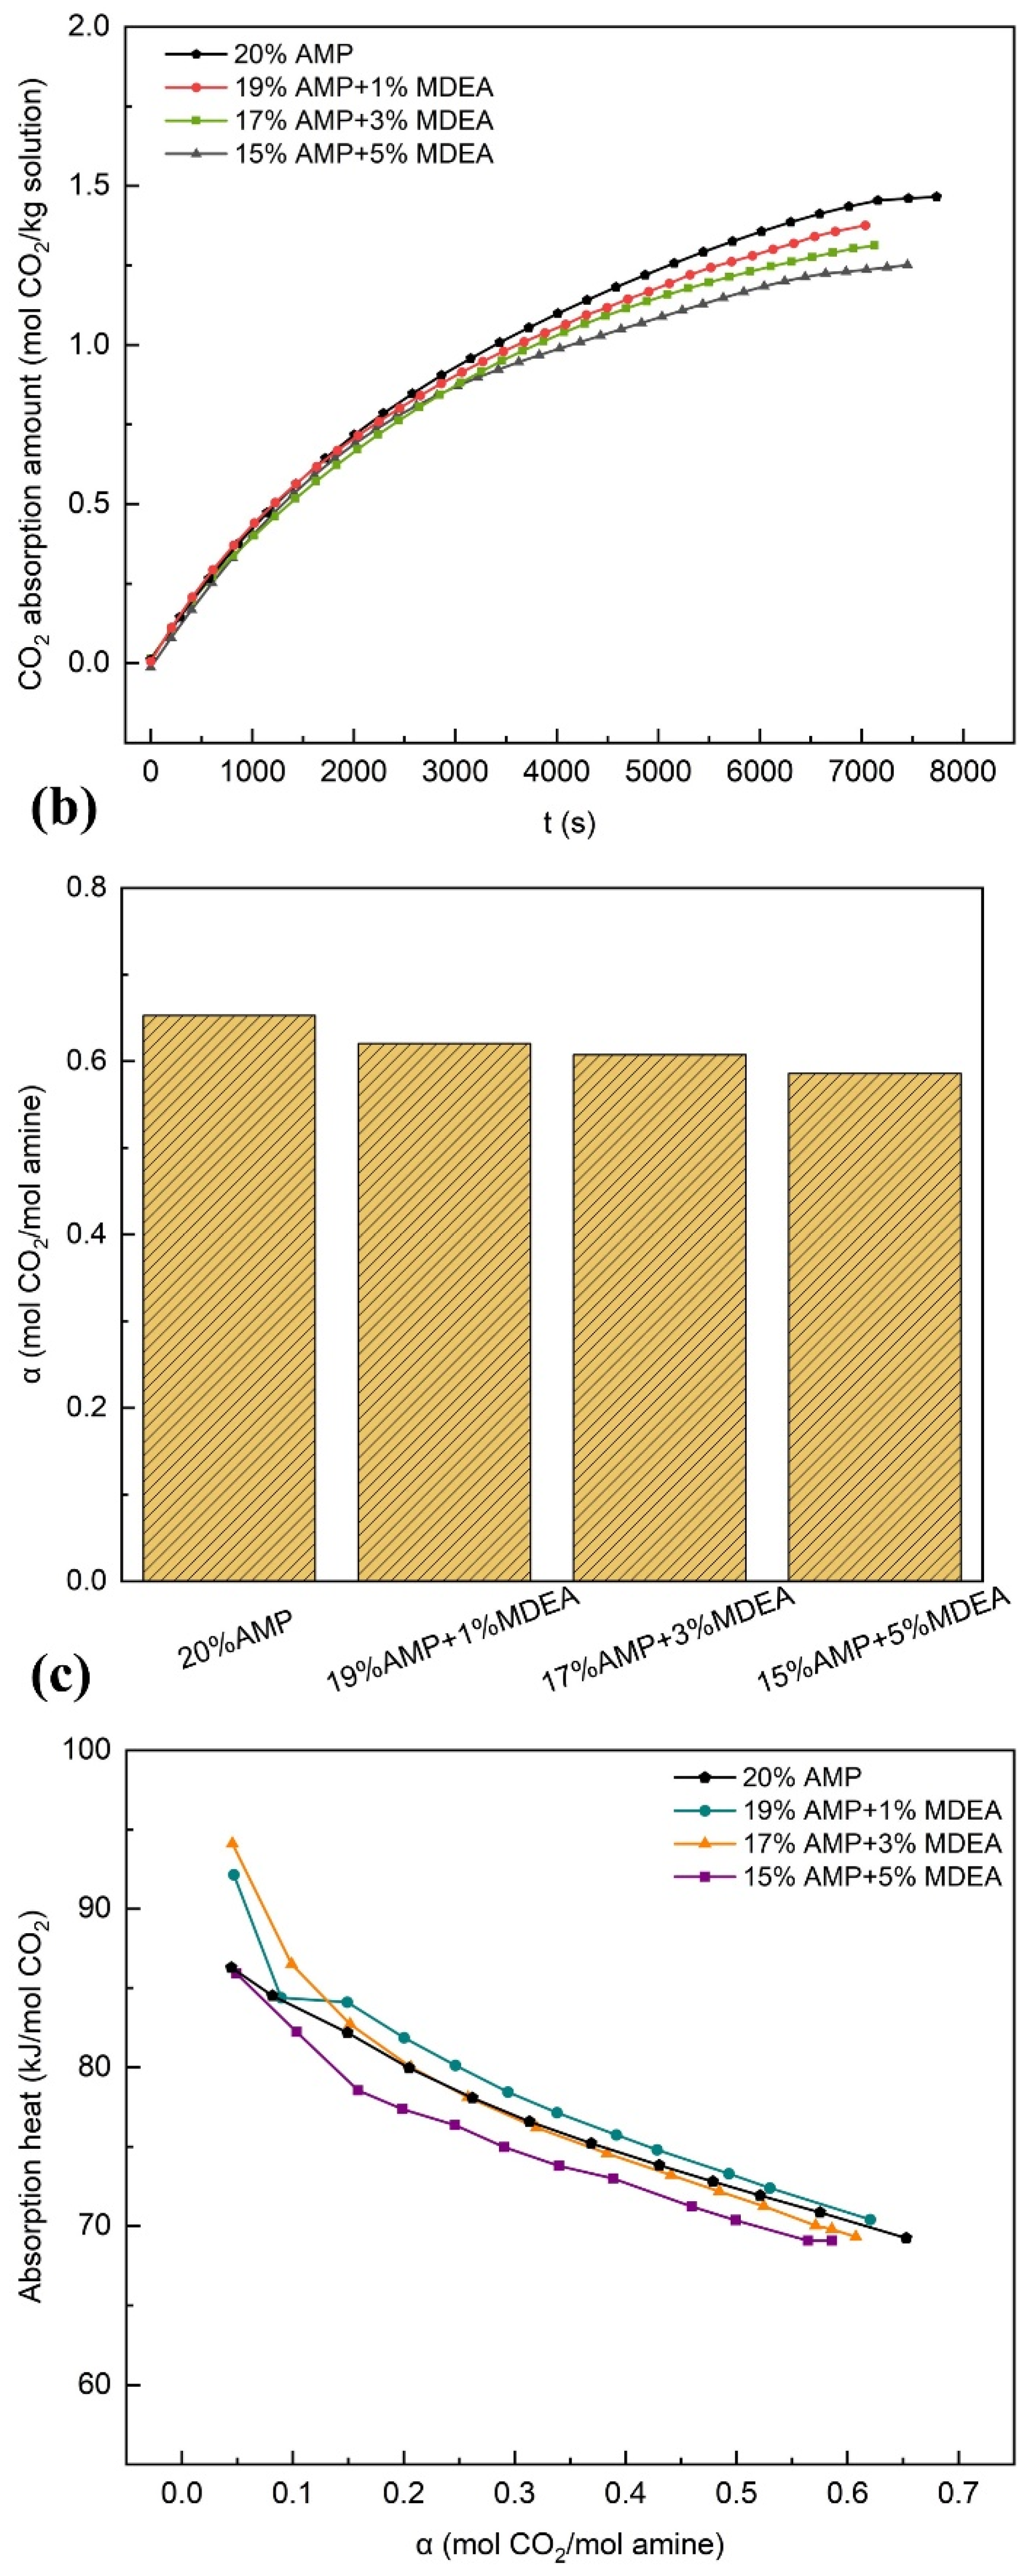
3.2.4. Effects of MDEA

Figure 9 depicts the outcomes of absorption experiments on AMP-MDEA solutions with varying ratios, which were conducted under an initial temperature of 40 °C and a pressure of 1 bar. As shown in Figure 9a, there was no significant difference in the absorption rates of the 19 wt% AMP + 1 wt% MDEA, 15 wt% AMP + 5 wt% MDEA, and 20 wt% AMP solutions in the early stages of the reaction. By contrast, the 17 wt% AMP + 3 wt% MDEA solution exhibited a smaller initial slope of the curve. As the absorption process progressed, the cumulative absorption amounts of the three blended solutions at the same time were all lower than that of the AMP solution, with the saturated absorption capacities being 1.38 mol CO2/kg solution (19 wt% AMP + 1 wt% MDEA), 1.31 mol CO2/kg solution (17 wt% AMP + 3 wt% MDEA), and 1.25 mol CO2/kg solution (15 wt% AMP + 5 wt% MDEA). The results indicated that AMP-MDEA solutions exhibited a stronger overall absorption capacity than AMP-DEA solutions. Barzagli et al. also observed that AMP-MDEA solutions had better absorption performance than AMP-DEA solutions, which was attributed to the lower efficiency of carbamate DEA in CO2 absorption and amine regeneration [62].
As shown in Figure 9b, with the increase in MDEA content, the maximum carbon loading capacity of the blended solutions slightly decreased. Figure 9c illustrates that the 15 wt% AMP + 5 wt% MDEA solution had the lowest overall absorption heat during the reaction process. The 19 wt% AMP + 1 wt% MDEA and 17 wt% AMP + 3 wt% MDEA solutions exhibited higher heat release in the early stages of the reaction, with the overall absorption heat of the 19 wt% AMP + 1 wt% MDEA solution being higher than that of the 20 wt% AMP solution. Additionally, the absorption heat curve of the 17 wt% AMP + 3 wt% MDEA solution intersected with that of the 20 wt% AMP solution. When the reaction attained equilibrium, the absorption heats of the four solutions were approximately 70 kJ/mol CO2.
As shown in the desorption results of the AMP-MDEA solutions (Table 10), the addition of MDEA significantly enhanced the desorption performance of the solution. The cyclic capacity of the three blended solutions showed little difference compared with the 20 wt% AMP solution. Among them, the 15 wt% AMP + 5 wt% MDEA solution exhibited the lowest desorption heat, demonstrating a clear advantage in regeneration energy consumption. Considering the excellent performance of this ratio, duplicate experiments were conducted, and the results were consistent.

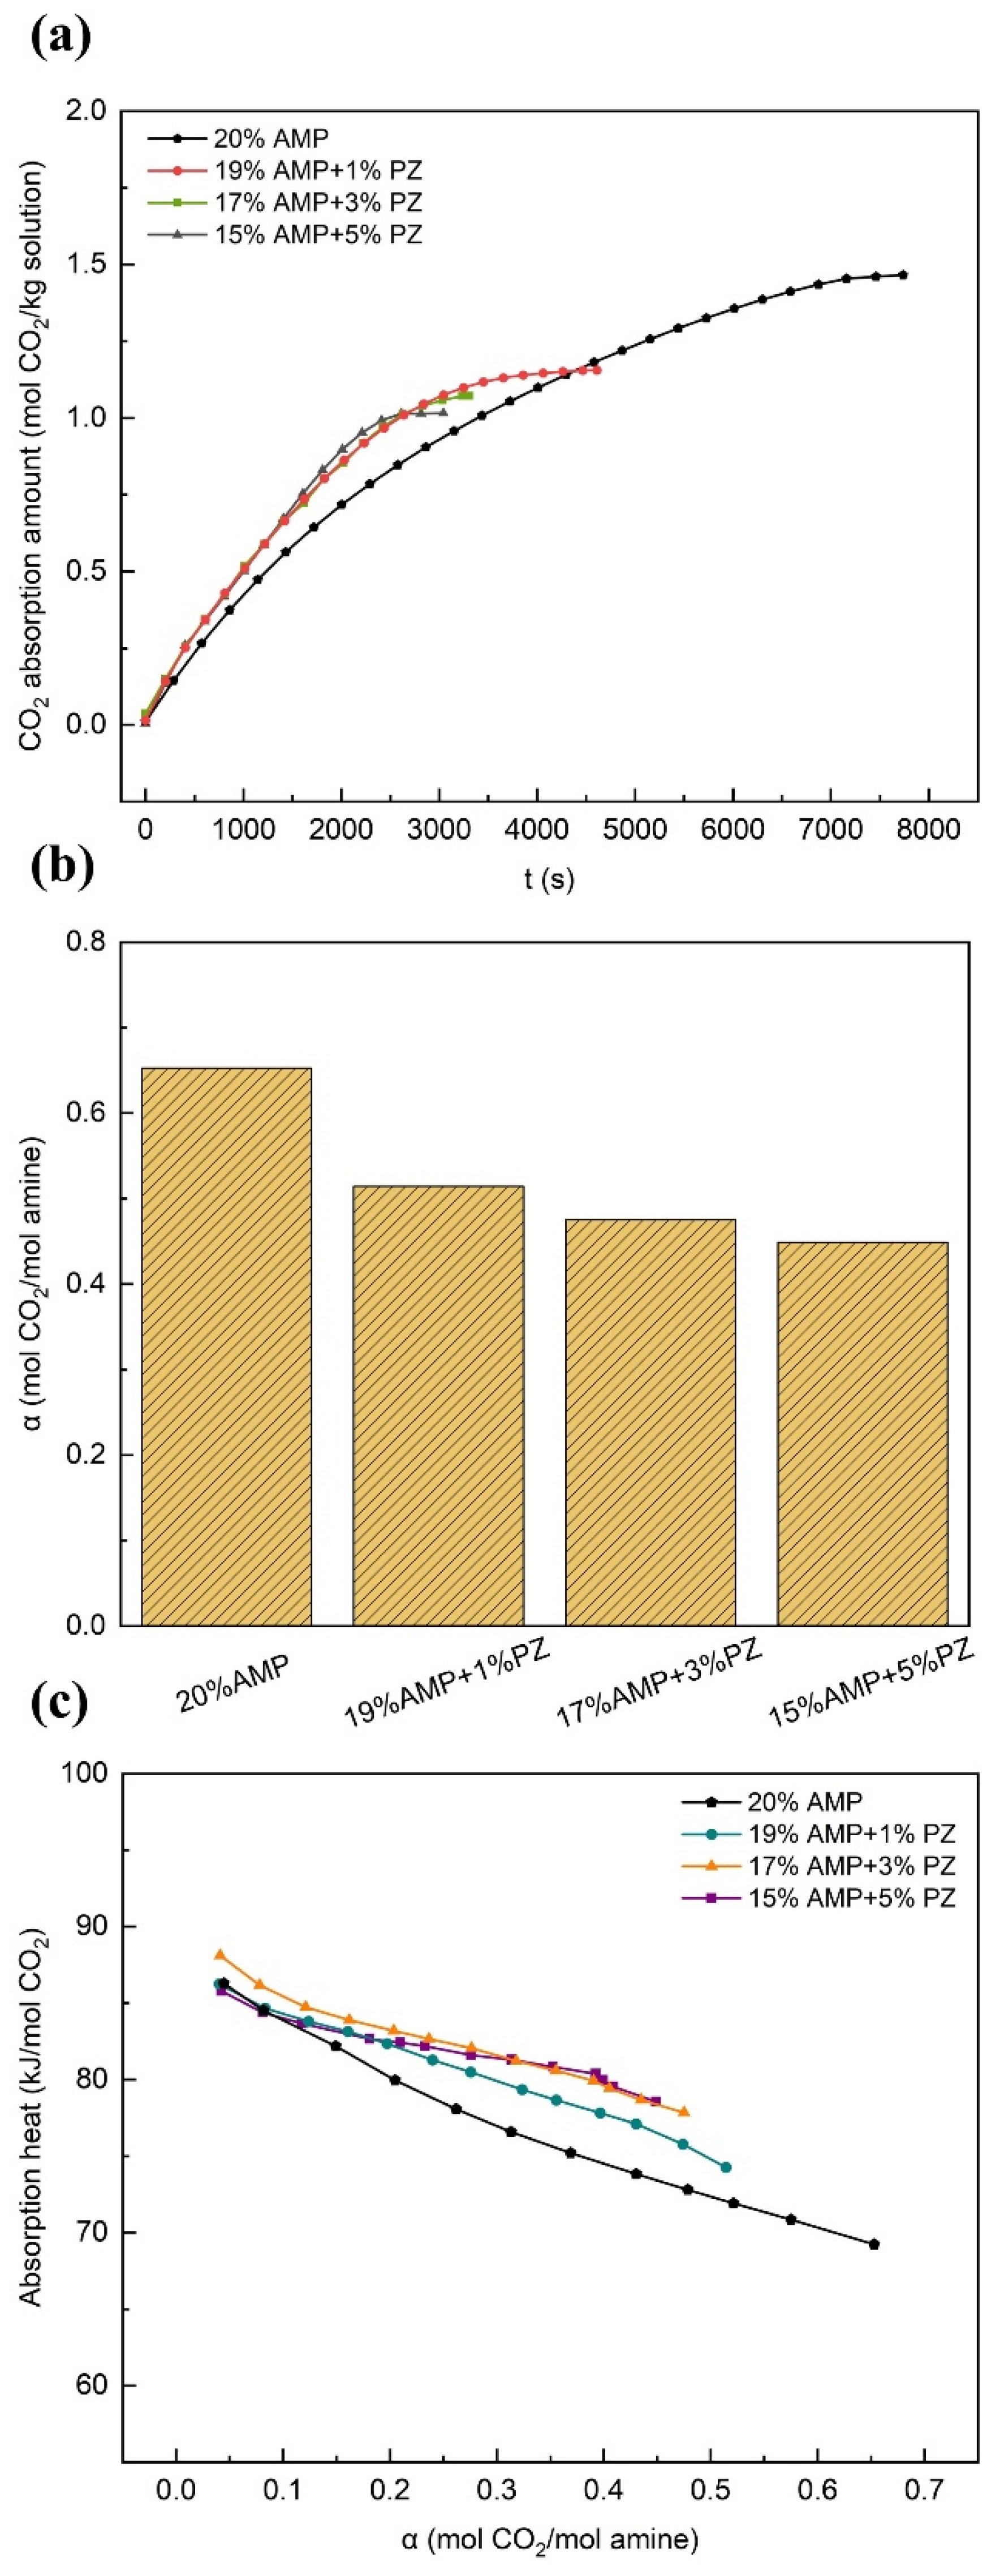
3.2.5. Effects of PZ

Figure 10 presents the absorption experimental results of AMP-PZ solutions with different ratios at an initial temperature of 40 °C and a pressure of 1 bar. As shown in Figure 10a, compared to the AMP solution of the same concentration, the absorption curves of the three AMP-PZ solutions exhibited steeper slopes, and the total absorption reaction time was significantly shortened, indicating that the addition of PZ enhanced the reaction rate of the solution. However, the total CO2 absorption capacity of the blended solutions was lower. Combining these results with the maximum carbon loading shown in Figure 10b, it is evident that the overall absorption capacity of the AMP-PZ system decreased significantly.
As shown in Figure 10c, the absorption heats of the three AMP-PZ solutions were higher than the absorption heat of the AMP solution. Moreover, with the increase in the PZ content, the downward trend of the absorption heat curves of the blended solutions gradually became gentler. This can be attributed to the complex reaction process of PZ with CO2, where the products include piperazine carbamate, piperazine dicarbamate, and protonated piperazine carbamate [63]. At lower carbon loadings (<0.5 mol CO2/mol amine), the main product of PZ is piperazine carbamate, and this reaction releases a relatively large amount of heat, resulting in a higher absorption heat for the mixed solutions. The experimental results were consistent with the findings of Xie [64] and Liu [50], who observed similar trends within the same CO2 loading range.
The desorption results of the AMP-PZ-rich solutions (Table 11) show that, compared with the desorption heat value of the AMP solution, the desorption heat values of the three AMP-PZ solutions were slightly higher. Among them, the 19%wt. AMP + 1%wt. PZ solution achieved the highest removal rate of 76.76%, demonstrating the best desorption performance. Additionally, its desorption heat was relatively low, which provided an advantage in terms of regeneration energy consumption.

4. Conclusions

In this study, CO2 capture experiments were carried out under various operational conditions for single-component AMP and MEA solutions, as well as AMP binary blended solutions, and the detailed investigation was focused on their absorption and regeneration performance. The specific parameters investigated included CO2 absorption capacity and rate, maximum carbon loading, absorption heat, desorption heat, CO2 removal efficiency, etc. The following conclusions can be drawn:
(1)
In the case of MEA, an upward trend was observed in the CO2 absorption capacity as the solution concentration increased. Specifically, the difference in terms of absorption rate and maximum carbon loading between the 15 wt% and 20 wt% solutions could be neglected. With a rise in solution concentration, the reaction heat grew higher, while the removal rate of the rich solution declined. When the absorption temperature was increased, the absorption capacity of the solution was reduced, accompanied by an increase in regeneration energy consumption. However, a slight improvement in the removal rate was noted. By contrast, raising the absorption pressure could augment the absorption capacity, reduce the absorption heat, and increase the removal rate of the rich solution, yet it exerted a little influence on the desorption heat.
(2)
In the case of AMP, with the increase in the solution concentration, a fast rise in the CO2 absorption capacity and absorption rate was observed. By contrast, the variation tendencies of the maximum carbon loading, absorption heat, and the removal rate of the rich solution were less conspicuous. Meanwhile, the desorption heat demonstrated a slight increment. The increase in the absorption temperature exerted negative influences on both the absorption and desorption performances. When the absorption pressure was increased, it served to boost the absorption capacity and the removal rate of the rich solution, yet it exerted a relatively minor impact on the heat of the reaction. In comparison with MEA, AMP demonstrated a slower overall absorption rate; however, it showed stronger carbon loading capability and cyclic capacity, a lower reaction heat, more favorable regeneration energy consumption levels, and a more remarkable effect in terms of rich solution removal.
(3)
The experimental results demonstrated that the overall performance of the solution was significantly enhanced or promoted by even minute quantities of additives. In comparison with the single-component AMP solution, the AMP-MEA solutions showed higher absorption rates, while the total absorption amounts remained nearly unchanged; however, this was accompanied by higher reaction heats. The absorption performances of the AMP-DGA solutions and AMP-DEA solutions declined, yet certain ratios manifested enhanced desorption performances. As for the AMP-MDEA solutions, both their absorption capacities and rates decreased, but the desorption performances of all three ratios were shown to increase remarkably. The AMP-PZ solutions exhibited high absorption rates and faster kinetics, yet their absorption capacities were significantly decreased, along with an increase in the heat of the reactions.
(4)
Due to the interactions among diverse components in the binary blended solvents, typically only one or two specific properties of the absorbent were enhanced, but overall performance improvements were not achieved. Through a comprehensive analysis of the experimental data, the 15 wt% AMP + 5 wt% MDEA solution demonstrated a distinct advantage in terms of the heat of reaction. Future research is recommended to develop multi-component blends based on this formulation and pilot-scale CO2 capture experiments to optimize the design parameters and operating conditions for industrial processes.

Author Contributions

Conceptualization, J.G., X.W. and Q.L.; methodology, J.G. and Y.L.; software, J.G. and X.W.; validation, J.G. and Y.L.; formal analysis, X.W.; investigation, H.W.; resources, Y.L., Q.L., H.L. and H.W.; data curation, J.G.; writing—original draft preparation, J.G.; writing—review and editing, J.G., X.W. and H.L.; supervision, X.W; project administration, X.W; funding acquisition, X.W. and Q.L. All authors have read and agreed to the published version of the manuscript.

Funding

This research was funded by the National Science and Technology Major Project of the Ministry of Science and Technology of China (No. 2024ZD1406603).

Data Availability Statement

The original contributions presented in this study are included in the article. Further inquiries can be directed to the corresponding author.

Conflicts of Interest

Y.L., Q.L., H.L. and H.W. were employed by Sinopec Petroleum Engineering Corporation. The remaining authors declare that the research was conducted in the absence of any commercial or financial relationships that could be construed as a potential conflict of interest.

References

  1. Li, G.; Shen, X.; Jiao, X.; Xie, F.; Hua, J.; Lin, H.; Yan, F.; Wu, H.; Zhang, Z. Novel Tri-Solvent Amines Absorption for Flue Gas CO2 Capture: Efficient Absorption and Regeneration with Low Energy Consumption. Chem. Eng. J. 2024, 493, 152699. [Google Scholar] [CrossRef]
  2. Aghaie, M.; Rezaei, N.; Zendehboudi, S. A Systematic Review on CO2 Capture with Ionic Liquids: Current Status and Future Prospects. Renew. Sust. Energ. Rev. 2018, 96, 502–525. [Google Scholar] [CrossRef]
  3. Madejski, P.; Chmiel, K.; Subramanian, N.; Kuś, T. Methods and Techniques for CO2 Capture: Review of Potential Solutions and Applications in Modern Energy Technologies. Energies 2022, 15, 887. [Google Scholar] [CrossRef]
  4. Arshad, N.; Alhajaj, A. Process Synthesis for Amine-Based CO2 Capture from Combined Cycle Gas Turbine Power Plant. Energy 2023, 274, 127391. [Google Scholar] [CrossRef]
  5. Baudoux, A.; Demeyer, F.; Paepe, W.D. Advanced Configurations of Amine Based Post-Combustion Carbon Capture Process Applied to Combined Cycle Gas Turbine. Energy Convers. Manag. 2024, 22, 100537. [Google Scholar] [CrossRef]
  6. Gao, J.; Zhang, Y.; Son, J.; Bara, J.E.; O’Harra, K.E.; Engelhard, M.H.; Heldebrant, D.J.; Rousseau, R.; Yu, X.-Y. The Interfacial Compatibility between a Potential CO2 Separation Membrane and Capture Solvents. Carbon Capture Sci. Technol. 2022, 2, 100037. [Google Scholar] [CrossRef]
  7. Guo, R.-T.; Li, G.-Y.; Liu, Y.; Pan, W. Recent Progress on CO2 Capture Based on Sterically Hindered Amines: A Review. Energy Fuels 2023, 37, 15429–15452. [Google Scholar] [CrossRef]
  8. Kimura, N.; Omata, K.; Kiga, T.; Takano, S.; Shikisma, S. Characteristics of Pulverized Coal Combustion in O2/CO2 Mixtures for CO2 Recovery. Energy Convers. Manag. 1995, 36, 805–808. [Google Scholar] [CrossRef]
  9. Wolsky, A.M.; Daniels, E.J.; Jody, B.J. CO2 Capture from The Flue Gas of Conventional Fossil-Fuel-Fired Power Plants. Environ. Prog. 1994, 13, 214–219. [Google Scholar] [CrossRef]
  10. Thitakamol, B.; Veawab, A.; Aroonwilas, A. Environmental Impacts of Absorption-Based CO2 Capture Unit for Post-Combustion Treatment of Flue Gas from Coal-Fired Power Plant. Int. J. Greenh. Gas Control 2007, 1, 318–342. [Google Scholar] [CrossRef]
  11. MacInnes, J.M.; Ayash, A.A.; Dowson, G.R.M. CO2 Absorption Using Diethanolamine-Water Solutions in a Rotating Spiral Contactor. Chem. Eng. J. 2017, 307, 1084–1091. [Google Scholar] [CrossRef]
  12. Oh, S.-Y.; Kim, J.-K. Operational Optimization for Part-Load Performance of Amine-Based Post-Combustion CO2 Capture Processes. Energy 2018, 146, 57–66. [Google Scholar] [CrossRef]
  13. Bui, T.Q.; Khokarale, S.G.; Shukla, S.K.; Mikkola, J.-P. Switchable Aqueous Pentaethylenehexamine System for CO2 Capture: An Alternative Technology with Industrial Potential. ACS Sustain. Chem. Eng. 2018, 6, 10395–10407. [Google Scholar] [CrossRef]
  14. Varghese, A.M.; Karanikolos, G.N. CO2 Capture Adsorbents Functionalized by Amine—Bearing Polymers: A Review. Int. J. Greenh. Gas Control 2020, 96, 103005. [Google Scholar] [CrossRef]
  15. Ochedi, F.O.; Yu, J.; Yu, H.; Liu, Y.; Hussain, A. Carbon Dioxide Capture Using Liquid Absorption Methods: A Review. Environ. Chem. Lett. 2020, 19, 77–109. [Google Scholar] [CrossRef]
  16. Rochelle, G.; Chen, E.; Freeman, S.; Van Wagener, D.; Xu, Q.; Voice, A. Aqueous Piperazine as the New Standard for CO2 Capture Technology. Chem. Eng. J. 2011, 171, 725–733. [Google Scholar] [CrossRef]
  17. Meng, F.; Ju, T.; Han, S.; Lin, L.; Li, J.; Chen, K.; Jiang, J. Study on Biogas Upgrading Characteristics and Reaction Mechanism of Low Energy Consumption 2-Amino-2-Methylpropanol (AMP)/Piperazine (PZ)/H2O Mixed Amines. Sep. Purif. Technol. 2023, 310, 123195. [Google Scholar] [CrossRef]
  18. Zhang, R.; He, X.; Liu, T.; Li, C.; Xiao, M.; Ling, H.; Hu, X.; Zhang, X.; Tang, F.; Luo, H. Thermodynamic Studies for Improving the Prediction of CO2 Equilibrium Solubility in Aqueous 2-Dimethylamino-2-Methyl-1-Propanol. Sep. Purif. Technol. 2022, 295, 121292. [Google Scholar] [CrossRef]
  19. Farooqi, A.S.; Ramli, R.M.; Lock, S.S.M.; Farooqi, A.S.; Shahid, M.Z.; Wajahat ul Hasnain, S.M.; Hira, N.; Abdullah, B. Removal of Carbon Dioxide and Hydrogen Sulfide from Natural Gas Using a Hybrid Solvent of Monoethanolamine and N-Methyl 2-Pyrrolidone. ACS Omega 2024, 9, 25704–25714. [Google Scholar] [CrossRef]
  20. Chakma, A. CO2 Capture Processes Opportunities for Improved Energy Efficiencies. J. Energy Convers. Manag. 1997, 38, S51–S56. [Google Scholar] [CrossRef]
  21. Ma’mun, S.; Nilsen, R.; Svendsen, H.F.; Juliussen, O. Solubility of Carbon Dioxide in 30 mass % Monoethanolamine and 50 mass % Methyldiethanolamine Solutions. J. Chem. Eng. Data 2005, 50, 630–634. [Google Scholar] [CrossRef]
  22. Vaidya, P.D.; Mahajani, V.V. Kinetics of the Reaction of CO2 with Aqueous Formulated Solution Containing Monoethanolamine, N-Methyl-2-pyrrolidone, and Diethylene Glycol. Ind. Eng. Chem. Res. 2005, 44, 1868–1873. [Google Scholar] [CrossRef]
  23. Reynolds, A.J.; Verheyen, T.V.; Adeloju, S.B.; Meuleman, E.; Feron, P. Towards Commercial Scale Postcombustion Capture of CO2 with Monoethanolamine Solvent: Key Considerations for Solvent Management and Environmental Impacts. Environ. Sci. Technol. 2012, 46, 3643–3654. [Google Scholar] [CrossRef] [PubMed]
  24. Ayittey, F.K.; Saptoro, A.; Kumar, P.; Wong, M.K. Energy-Saving Process Configurations for Monoethanolamine-Based CO2 Capture System. Asia-Pac. J. Chem. Eng. 2020, 16, e2576. [Google Scholar] [CrossRef]
  25. He, X.; He, H.; Barzagli, F.; Amer, M.W.; Li, C.E.; Zhang, R. Analysis of the Energy Consumption in Solvent Regeneration Processes Using Binary Amine Blends for CO2 Capture. Energy 2023, 270, 126903. [Google Scholar] [CrossRef]
  26. Kontos, G.; Leontiadis, K.; Tsivintzelis, I. CO2 Solubility in Aqueous Solutions of Blended Amines: Experimental Data for Mixtures with MDEA, AMP and MPA and Modeling with the Modified Kent-Eisenberg Model. Fluid Phase Equilibria 2023, 570, 113800. [Google Scholar] [CrossRef]
  27. Veawab, A.; Tontiwachwuthikul, P.; Bhole, S.D. Studies of Corrosion and Corrosion Control in CO2-2-Amino-2-Methyl-1-Propanol (AMP) Environment. Ind. Eng. Chem. Res. 1997, 36, 264–269. [Google Scholar] [CrossRef]
  28. Choi, B.-K.; Kim, S.-M.; Lee, J.-S.; Park, Y.C.; Chun, D.-H.; Shin, H.-Y.; Sung, H.-J.; Min, B.-M.; Moon, J.-H. Effect of Blending Ratio and Temperature on CO2 Solubility in Blended Aqueous Solution of Monoethanolamine and 2-Amino-2-Methyl-Propanol: Experimental and Modeling Study Using the Electrolyte Nonrandom Two-Liquid Model. ACS Omega 2020, 5, 28738–28748. [Google Scholar] [CrossRef] [PubMed]
  29. Bougie, F.; Iliuta, M.C. Sterically Hindered Amine-Based Absorbents for The Removal of CO2 from Gas Streams. J. Chem. Eng. Data 2012, 57, 635–669. [Google Scholar] [CrossRef]
  30. Li, Q.; Wang, Y.; An, S.; Wang, L. Kinetics of CO2 Absorption in Concentrated K2CO3/Pz Mixture Using a Wetted-Wall Column. Energy Fuels 2016, 30, 7496–7502. [Google Scholar] [CrossRef]
  31. An, S.; Huang, X.; Li, N.; Li, Q.; Qi, T.; Wang, R.; Wang, L. Preventing Crystallization at High Concentrated 2-Amino-2-Methyl-1-Propanol for Energy-Saving CO2 Capture. Sep. Purif. Technol. 2024, 330, 125484. [Google Scholar] [CrossRef]
  32. Paul, S.; Ghoshal, A.K.; Mandal, B. Kinetics of Absorption of Carbon Dioxide into Aqueous Solution of 2-(1-Piperazinyl)-Ethylamine. Chem. Eng. Sci. 2009, 64, 313–321. [Google Scholar] [CrossRef]
  33. Chakravarty, T.; Phukan, U.K.; Weilund, R.H. Reaction of Acid Gases with Mixtures of Amines. Chem. Eng. Prog. 1985, 81, 4. [Google Scholar]
  34. Fu, W.; Yu, K.; Song, H.; Zhang, K.; Yang, W. Design Strategy of Polyamine for CO2 Absorption Guided by a Novel Descriptor of Hydrogen Bond Strength. Fuel 2024, 359, 130393. [Google Scholar] [CrossRef]
  35. Nwaoha, C.; Saiwan, C.; Supap, T.; Idem, R.; Tontiwachwuthikul, P.; Rongwong, W.; Al-Marri, M.J.; Benamor, A. Carbon Dioxide (CO2) Capture Performance of Aqueous Tri-Solvent Blends Containing 2-Amino-2-Methyl-1-Propanol (Amp) and Methyldiethanolamine (Mdea) Promoted by Diethylenetriamine (Deta). Int. J. Greenh. Gas Control 2016, 53, 292–304. [Google Scholar] [CrossRef]
  36. Meng, F.; Han, S.; Meng, Y.; Ju, T.; Lin, L.; Jiang, J. A Comparative Study of the Effects of Aqueous Mixed Amines on Biogas Upgrading Based on 13c Nuclear Magnetic Resonance (Nmr) Analysis. J. Clean. Prod. 2022, 369, 133288. [Google Scholar] [CrossRef]
  37. El Hadri, N.; Quang, D.V.; Goetheer, E.L.V.; Abu Zahra, M.R.M. Aqueous Amine Solution Characterization for Post-Combustion CO2 Capture Process. Appl. Energy 2017, 185, 1433–1449. [Google Scholar] [CrossRef]
  38. Zhang, R.; Li, T.; Zhang, Y.; Ha, J.; Xiao, Y.; Li, C.; Zhang, X.; Luo, H. Cuo Modified Kit-6 as a High-Efficiency Catalyst for Energy-Efficient Amine Solvent Regeneration. Sep. Purif. Technol. 2022, 300, 121702. [Google Scholar] [CrossRef]
  39. Zheng, Y.; Gao, L.; He, S. Analysis of the Mechanism of Energy Consumption for CO2 Capture in a Power System. Energy 2023, 262, 125103. [Google Scholar] [CrossRef]
  40. Muchan, P.; Saiwan, C.; Narku-Tetteh, J.; Idem, R.; Supap, T.; Tontiwachwuthikul, P. Screening Tests of Aqueous Alkanolamine Solutions Based on Primary, Secondary, and Tertiary Structure for Blended Aqueous Amine Solution Selection in Post Combustion CO2 Capture. Chem. Eng. J. 2017, 170, 574–582. [Google Scholar] [CrossRef]
  41. Nwaoha, C.; Idem, R.; Supap, T.; Saiwan, C.; Tontiwachwuthikul, P.; Rongwong, W.; Al-Marri, M.J.; Benamor, A. Heat Duty, Heat of Absorption, Sensible Heat and Heat of Vaporization of 2–Amino–2–Methyl–1–Propanol (AMP), Piperazine (PZ) and Monoethanolamine (Mea) Tri–Solvent Blend for Carbon Dioxide (CO2) Capture. Chem. Eng. Sci. 2017, 170, 26–35. [Google Scholar] [CrossRef]
  42. Sherwood, A.E.; Prausnitz, J.M. The Heat of Solution of Gases at High Pressure. AIChE J. 2004, 8, 519–521. [Google Scholar] [CrossRef]
  43. Zambonin, P.G.; Jordan, J. Gas enthalpimetry. Anal. Chem. 1969, 41, 437–442. [Google Scholar] [CrossRef]
  44. Lee, J.I.; Otto, F.D.; Mather, A.E. The Solubility of H2S and CO2 in Aqueous Monoethanolamine Solutions. Can. J. Chem. Eng. 1974, 52, 803. [Google Scholar] [CrossRef]
  45. Jou, F.-Y.; Otto, F.D.; Mather, A.E. Vapor-Liquid Equilibrium of Carbon Dioxide in Aqueous Mixture of Monoethanolamine and Methyldi-ethanolamine. Ind. Eng. Chem. Res. 1994, 33, 2002. [Google Scholar] [CrossRef]
  46. Kim, I.; Hoff, K.A.; Hessen, E.T.; Haug-Warberg, T.; Svendsen, H.F. Enthalpy of Absorption of CO2 with Alkanolamine Solutions Predicted from Reaction Equilibrium Constants. Chem. Eng. Sci. 2009, 64, 2027–2038. [Google Scholar] [CrossRef]
  47. Merkley, K.E.; Christensen, J.J.; Izatt, R.M. Enthalpies of Absorption of Carbon Dioxide in Aqueous Methyldietiianolamine Solutions. Thermochim. Acta 1987, 121, 437–446. [Google Scholar] [CrossRef]
  48. Oscarson, J.L.; Van Dam, R.H.; Christensen, J.J. Enthalpies of Absorption of Carbon Dioxide in Aqueous Diethanolamine Solutions. Thermochim. Acta 1989, 146, 107–111. [Google Scholar] [CrossRef]
  49. Kim, I.; Svendsen, H.F. Comparative Study of the Heats of Absorption of Post-Combustion CO2 Absorbents. Int. J. Greenh. Gas Control 2011, 5, 390–395. [Google Scholar] [CrossRef]
  50. Liu, J.; Wang, S.; Svendsen, H.F.; Idrees, M.U.; Kim, I.; Chen, C. Heat of Absorption of CO2 in Aqueous Ammonia, Piperazine Solutions and Their Mixtures. Int. J. Greenh. Gas Control 2012, 9, 148–159. [Google Scholar] [CrossRef]
  51. Dallos, A.T.; Altsach, L.; Kotsis, L. Enthalpies of Absorption and Solubility of Carbon Dioxide in Aqueous Polyamine Solutions. J. Therm. Anal. Calorim. 2001, 65, 419–423. [Google Scholar] [CrossRef]
  52. Zheng, Y.; El Ahmar, E.; Simond, M.; Ballerat-Busserolles, K.; Zhang, P. CO2 Heat of Absorption in Aqueous Solutions of Mdea and Mdea/Piperazine. J. Chem. Eng. Data 2020, 65, 3784–3793. [Google Scholar] [CrossRef]
  53. Lu, S.; Yang, F.; Zhang, J.; Wang, N.; Liu, L.; Kang, G.; Zhao, D.; Yu, X.; Li, Q. Experimental Analysis of Reaction Heat of CO2 Absorption of Phase Change Absorber Aep-Dpa at Low Partial Pressure. Energies 2023, 16, 1867. [Google Scholar] [CrossRef]
  54. Douglas, T.B.; George, T.; Furukawa, R.E.; Mccoskey Ball, A.F. Calorimetric properties of normal heptane from 0-degrees to 520-degrees-k. J. Res. Natl. Bur. Stand. 1954, 53, 139. [Google Scholar] [CrossRef]
  55. Mathonat, C.; Majer, V.; Mather, A.E.; Grolier, J.P.E. Use of Flow Calorimetry for Determining Enthalpies of Absorption and The Solubility of CO2 in Aqueous Monoethanolamine Solutions. Ind. Eng. Chem. Res. 1998, 37, 4136–4141. [Google Scholar] [CrossRef]
  56. Kim, I.; Svendsen, H.F. Heat of Absorption of Carbon Dioxide (CO2) in Monoethanolamine (MEA) and 2-(Aminoethyl)ethanolamine (AEEA) Solutions. Ind. Eng. Chem. Res. 2007, 46, 5803–5809. [Google Scholar] [CrossRef]
  57. Arcis, H.; Ballerat-Busserolles, K.; Rodier, L.; Coxam, J.-Y. Enthalpy of Solution of Carbon Dioxide in Aqueous Solutions of Monoethanolamine at Temperatures of 322.5 K and 372.9 K and Pressures up to 5 MPa. J. Chem. Eng. Data 2011, 56, 3351–3362. [Google Scholar] [CrossRef]
  58. Kim, Y.E.; Lim, J.A.; Jeong, S.K.; Yoon, Y.I.; Bae, S.T.; Nam, S.C. Comparison of Carbon Dioxide Absorption in Aqueous MEA, DEA, TEA, and AMP Solutions. Bull. Korean Chem. Soc. 2013, 34, 783–787. [Google Scholar] [CrossRef]
  59. Mathonat, C.; Majer, V.; Mather, A.E.; Grolier, J.P.E. Enthalpies of Absorption and Solubility of CO2 In Aqueous Solutions of Methyldiethanolamine. Fluid Phase Equilibria 1997, 140, 171–182. [Google Scholar] [CrossRef]
  60. McCann, N.; Maeder, M.; Hasse, H. Prediction of the Overall Enthalpy of CO2 Absorption in Aqueous Amine Systems from Experimentally Determined Reaction Enthalpies. Energy Procedia 2011, 4, 1542–1549. [Google Scholar] [CrossRef]
  61. Kundu, M.; Bandyopadhyay, S.S. Solubility of CO2 in Water + Diethanolamine + 2-Amino-2-methyl-1-propanol. J. Chem. Eng. Data 2006, 51, 398–405. [Google Scholar] [CrossRef]
  62. Barzagli, F.; Mani, F.; Peruzzini, M. Continuous Cycles of CO2 Absorption and Amine Regeneration with Aqueous Alkanolamines: A Comparison of the Efficiency Between Pure and Blended DEA, MDEA And AMP Solutions by 13C NMR Spectroscopy. Energy Environ. Sci. 2010, 3, 772–779. [Google Scholar] [CrossRef]
  63. Bishnoi, S.; Rochelle, G.T. Thermodynamics of Piperazine/Methyldiethanolamine/Water/Carbon Dioxide. Ind. Eng. Chem. Res. 2002, 41, 604–612. [Google Scholar] [CrossRef]
  64. Xie, Q.; Aroonwilas, A.; Veawab, A. Measurement of Heat of CO2 Absorption into 2-Amino-2-Methyl-1-Propanol (Amp)/Piperazine (Pz) Blends Using Differential Reaction Calorimeter. Energy Procedia 2013, 37, 826–833. [Google Scholar] [CrossRef]
Figure 1. CO2 capture reaction heat measurement system: 1—CO2 cylinder; 2—N2 cylinder; 3—Reduction valve; 4—Micrometering valve; 5—Pressure gauge; 6—Thermostatic water bath; 7—Copper coil; 8—Mass flow controller; 9—Check valve; 10,12—Thermal resistors; 11—Funnel; 13—Safety valve; 14—Pressure transducer; 15—Condensing jacket; 16—PFA hose; 17—Liquid-collecting cylinder; 18—Liquid-collecting beaker; 19—Desiccator; 20—Computer; 21—Data acquisition card (DAQ); 22—Reactor; 23—Magnetic rotor; 24—Magnetic stirrer; 25—DC-regulated power supply; ①~⑫—Ball valve.
Energies 18 01075 g001
Figure 2. Comparison of measured specific heat capacities with standard values: (a) pure water; (b) N-heptane [54].
Energies 18 01075 g002
Figure 3. Absorption reaction results at 40 °C and 1 bar: (a) time-dependent variation in absorption for different concentrations of AMP and MEA solutions; (b) comparison of the maximum carbon loading of AMP and MEA solutions at different concentrations; (c) variation in heat of absorption with carbon loading for different concentrations of AMP and MEA solutions.
Energies 18 01075 g003
Figure 4. Absorption reaction results of 20 wt% solutions at 1 bar: (a) time-dependent variation in absorption for different temperatures of AMP and MEA solutions; (b) comparison of the maximum carbon loading of AMP and MEA solutions at different temperatures; (c) variation in heats of absorption with carbon loading for different temperatures of AMP and MEA solutions.
Energies 18 01075 g004
Figure 5. Absorption reaction results of 20 wt% solutions at 40 °C: (a) time-dependent variation in absorption for different pressures of AMP and MEA solutions; (b) comparison of the maximum carbon loading of AMP and MEA solutions at different pressures; (c) variation in heats of absorption with carbon loading for different pressures of AMP and MEA solutions.
Energies 18 01075 g005
Figure 6. Absorption reaction results at 40 °C and 1 bar: (a) time-dependent variation in absorption for different ratios of AMP-MEA solutions; (b) comparison of the maximum carbon loading of AMP-MEA solutions at different ratios; (c) variation in heats of absorption with carbon loading for different ratios of AMP-MEA solutions.
Energies 18 01075 g006
Figure 7. Absorption reaction results at 40 °C and 1 bar: (a) time-dependent variation in absorption for different ratios of AMP-DGA solutions; (b) comparison of the maximum carbon loading of AMP-DGA solutions at different ratios; (c) variation in heats of absorption with carbon loading for different ratios of AMP-DGA solutions.
Energies 18 01075 g007
Figure 8. Absorption reaction results at 40 °C and 1 bar: (a) time-dependent variation in absorption for different ratios of AMP-DEA solutions; (b) comparison of the maximum carbon loading of AMP-DEA solutions at different ratios; (c) variation in heats of absorption with carbon loading for different ratios of AMP-DEA solutions.
Energies 18 01075 g008
Figure 9. Absorption reaction results at 40 °C and 1 bar: (a) time-dependent variation in absorption for different ratios of AMP-MDEA solutions; (b) comparison of the maximum carbon loading of AMP-MDEA solutions at different ratios; (c) variation in heats of absorption with carbon loading for different ratios of AMP-MDEA solutions.
Energies 18 01075 g009
Figure 10. Absorption reaction results at 40 °C and 1 bar: (a) time-dependent variation in absorption for different ratios of AMP-PZ solutions; (b) comparison of the maximum carbon loading of AMP-PZ solutions at different ratios; (c) variation in heats of absorption with carbon loading for different ratios of AMP-PZ solutions.
Energies 18 01075 g010
Table 1. Information about experimental reagents.
Chemical ReagentMolecular FormulaMolar Mass
(g/mol)
CAS. No.Chemical Structure
N-HeptaneCH3(CH2)5CH3114.23142-82-5Energies 18 01075 i001
MEAH2NCH2CH2OH61.08141-43-5Energies 18 01075 i002
AMP(CH3)2C(NH2)CH2OH89.14124-68-5Energies 18 01075 i003
DGAH2NCH2CH2OCH2CH2OH105.14929-06-6Energies 18 01075 i004
DEAHN(H2CH2OH)2105.14111-42-2Energies 18 01075 i005
MDEANCH3N(CH2CH2OH)2119.16105-59-9Energies 18 01075 i006
PZNHC2H4NHC2H482.10110-85-0Energies 18 01075 i007
Table 2. The experimental scheme of amines: reagents and operational conditions.
Amine SystemConcentrationAbsorption
Temperature
(°C)
Absorption
Pressure
(bar (G))
Desorption
Temperature
(°C)
Desorption
Pressure
MEA10 wt%, 15 wt%, 20 wt%40, 60, 801, 3, 5105Follows the saturated vapor pressure of the water solution
AMP10 wt%, 15 wt%, 20 wt%40, 60, 801, 3, 5
AMP + MEA19 wt% + 1 wt%, 17 wt% + 3 wt%, 15 wt% + 5 wt%401
AMP + DGA19 wt% + 1 wt% *, 17 wt% + 3 wt%, 15 wt% + 5 wt%401
AMP + DEA19 wt% + 1 wt%, 17 wt% + 3 wt%, 15 wt% + 5 wt%401
AMP + MDEA19 wt% + 1 wt%, 17 wt% + 3 wt%, 15 wt% + 5 wt% *401
AMP + PZ19 wt% + 1 wt%, 17 wt% + 3 wt%, 15 wt% + 5 wt%401
* Experiments were carried out twice at this concentration to verify the repeatability.
Table 3. Comparison of experimental results of 30 wt% MEA absorption heat with literature data.
SourcesEquipmentT
(°C)
P
(bar)
P C O 2
(bar)
Absorption Heat
(kJ/mol CO2)
Mathonat et al. [55]C-8040~12020~100 81~102
Kim et al. [56]CPA 12240~1201~3 84~110
El Hadri et al. [37]URC40 0.1585.13
Arcis et al. [57]C-8050~1005~50 83~96
This studyIndependent
development
401 86.44
Table 4. Desorption data of single-component solutions with different concentrations at 105 °C.
Amine SystemConcentration
(wt%)
Cyclic Capacity
(mol CO2/mol Amine)
Removal Rate
(%)
Desorption Heat
(kJ/mol CO2)
MEA100.2460.1395.10
MEA150.2452.4797.89
MEA200.1227.40101.05
AMP100.4668.7181.92
AMP150.4167.7282.18
AMP200.4669.5885.16
Table 5. Desorption data of single-component solutions under different absorption temperature conditions (desorption temperature: 105 °C).
Amine SystemAbsorption Temperature
(°C)
Cyclic Capacity
(mol CO2/mol Amine)
Removal Rate
(%)
Desorption Heat
(kJ/mol CO2)
MEA400.1227.4101.05
MEA600.0927.5108.01
MEA800.0932.5116.76
AMP400.4669.5885.16
AMP600.175586.8
AMP800.1049.1488.87
Table 6. Desorption data of single-component solutions under different absorption pressure conditions (desorption temperature: 105 °C).
Amine SystemAbsorption Pressure
(bar)
Cyclic Capacity
(mol CO2/mol Amine)
Removal Rate
(%)
Desorption Heat
(kJ/mol CO2)
MEA10.1227.4101.05
MEA30.2850.49102.84
MEA50.4476.08101.81
AMP10.4669.5885.16
AMP30.6687.2786.3
AMP50.7286.0885.71
Table 7. Desorption data for different ratios of AMP-MEA solutions (desorption temperature: 105 °C).
Amine SystemCyclic Capacity
(mol CO2/mol Amine)
Removal Rate
(%)
Desorption Heat
(kJ/mol CO2)
20 wt% AMP0.4669.5885.16
19 wt% AMP + 1 wt% MEA0.4875.0588.17
17 wt% AMP + 3 wt% MEA0.4369.9491.12
15 wt% AMP + 5 wt% MEA0.3968.8497.68
Table 8. Desorption data for different ratios of AMP-DGA solutions (desorption temperature: 105 °C).
Amine SystemCyclic Capacity
(mol CO2/mol Amine)
Removal Rate
(%)
Desorption Heat
(kJ/mol CO2)
20 wt% AMP0.4669.5885.16
19 wt% AMP + 1 wt% DGA0.4172.1978.54
17 wt% AMP + 3 wt% DGA0.3771.7284.21
15 wt% AMP + 5 wt% DGA0.3065.5289.12
Table 9. Desorption data for different ratios of AMP-DEA solutions (desorption temperature: 105 °C).
Amine SystemCyclic Capacity
(mol CO2/mol Amine)
Removal Rate
(%)
Desorption Heat
(kJ/mol CO2)
20 wt% AMP0.4669.5885.16
19 wt% AMP + 1 wt% DEA0.3567.4286.63
17 wt% AMP + 3 wt% DEA0.4078.5787.32
15 wt% AMP + 5 wt% DEA0.4279.1593.711
Table 10. Desorption data for different ratios of AMP-MDEA solutions (desorption temperature: 105 °C).
Amine SystemCyclic Capacity
(mol CO2/mol Amine)
Removal Rate
(%)
Desorption Heat
(kJ/mol CO2)
20 wt% AMP0.4669.5885.16
19 wt% AMP + 1 wt% MDEA0.4877.6984.35
17 wt% AMP + 3 wt% MDEA0.4878.5581.45
15 wt% AMP + 5 wt% MDEA0.4676.6176.24
Table 11. Desorption data for different ratios of AMP-PZ solutions (desorption temperature: 105 °C).
Amine SystemCyclic Capacity
(mol CO2/mol Amine)
Removal Rate
(%)
Desorption Heat
(kJ/mol CO2)
20 wt% AMP0.4669.5885.16
19 wt% AMP + 1 wt% PZ0.3976.7687.68
17 wt% AMP + 3 wt% PZ0.3266.489.35
15 wt% AMP + 5 wt% PZ0.2352.3588.52
Disclaimer/Publisher’s Note: The statements, opinions and data contained in all publications are solely those of the individual author(s) and contributor(s) and not of MDPI and/or the editor(s). MDPI and/or the editor(s) disclaim responsibility for any injury to people or property resulting from any ideas, methods, instructions or products referred to in the content.

