
Solar Energy to Water Desalination: Long-Term Experimental Studies of Solar Still in Poland


Abstract
1. Introduction
2. Materials and Methods
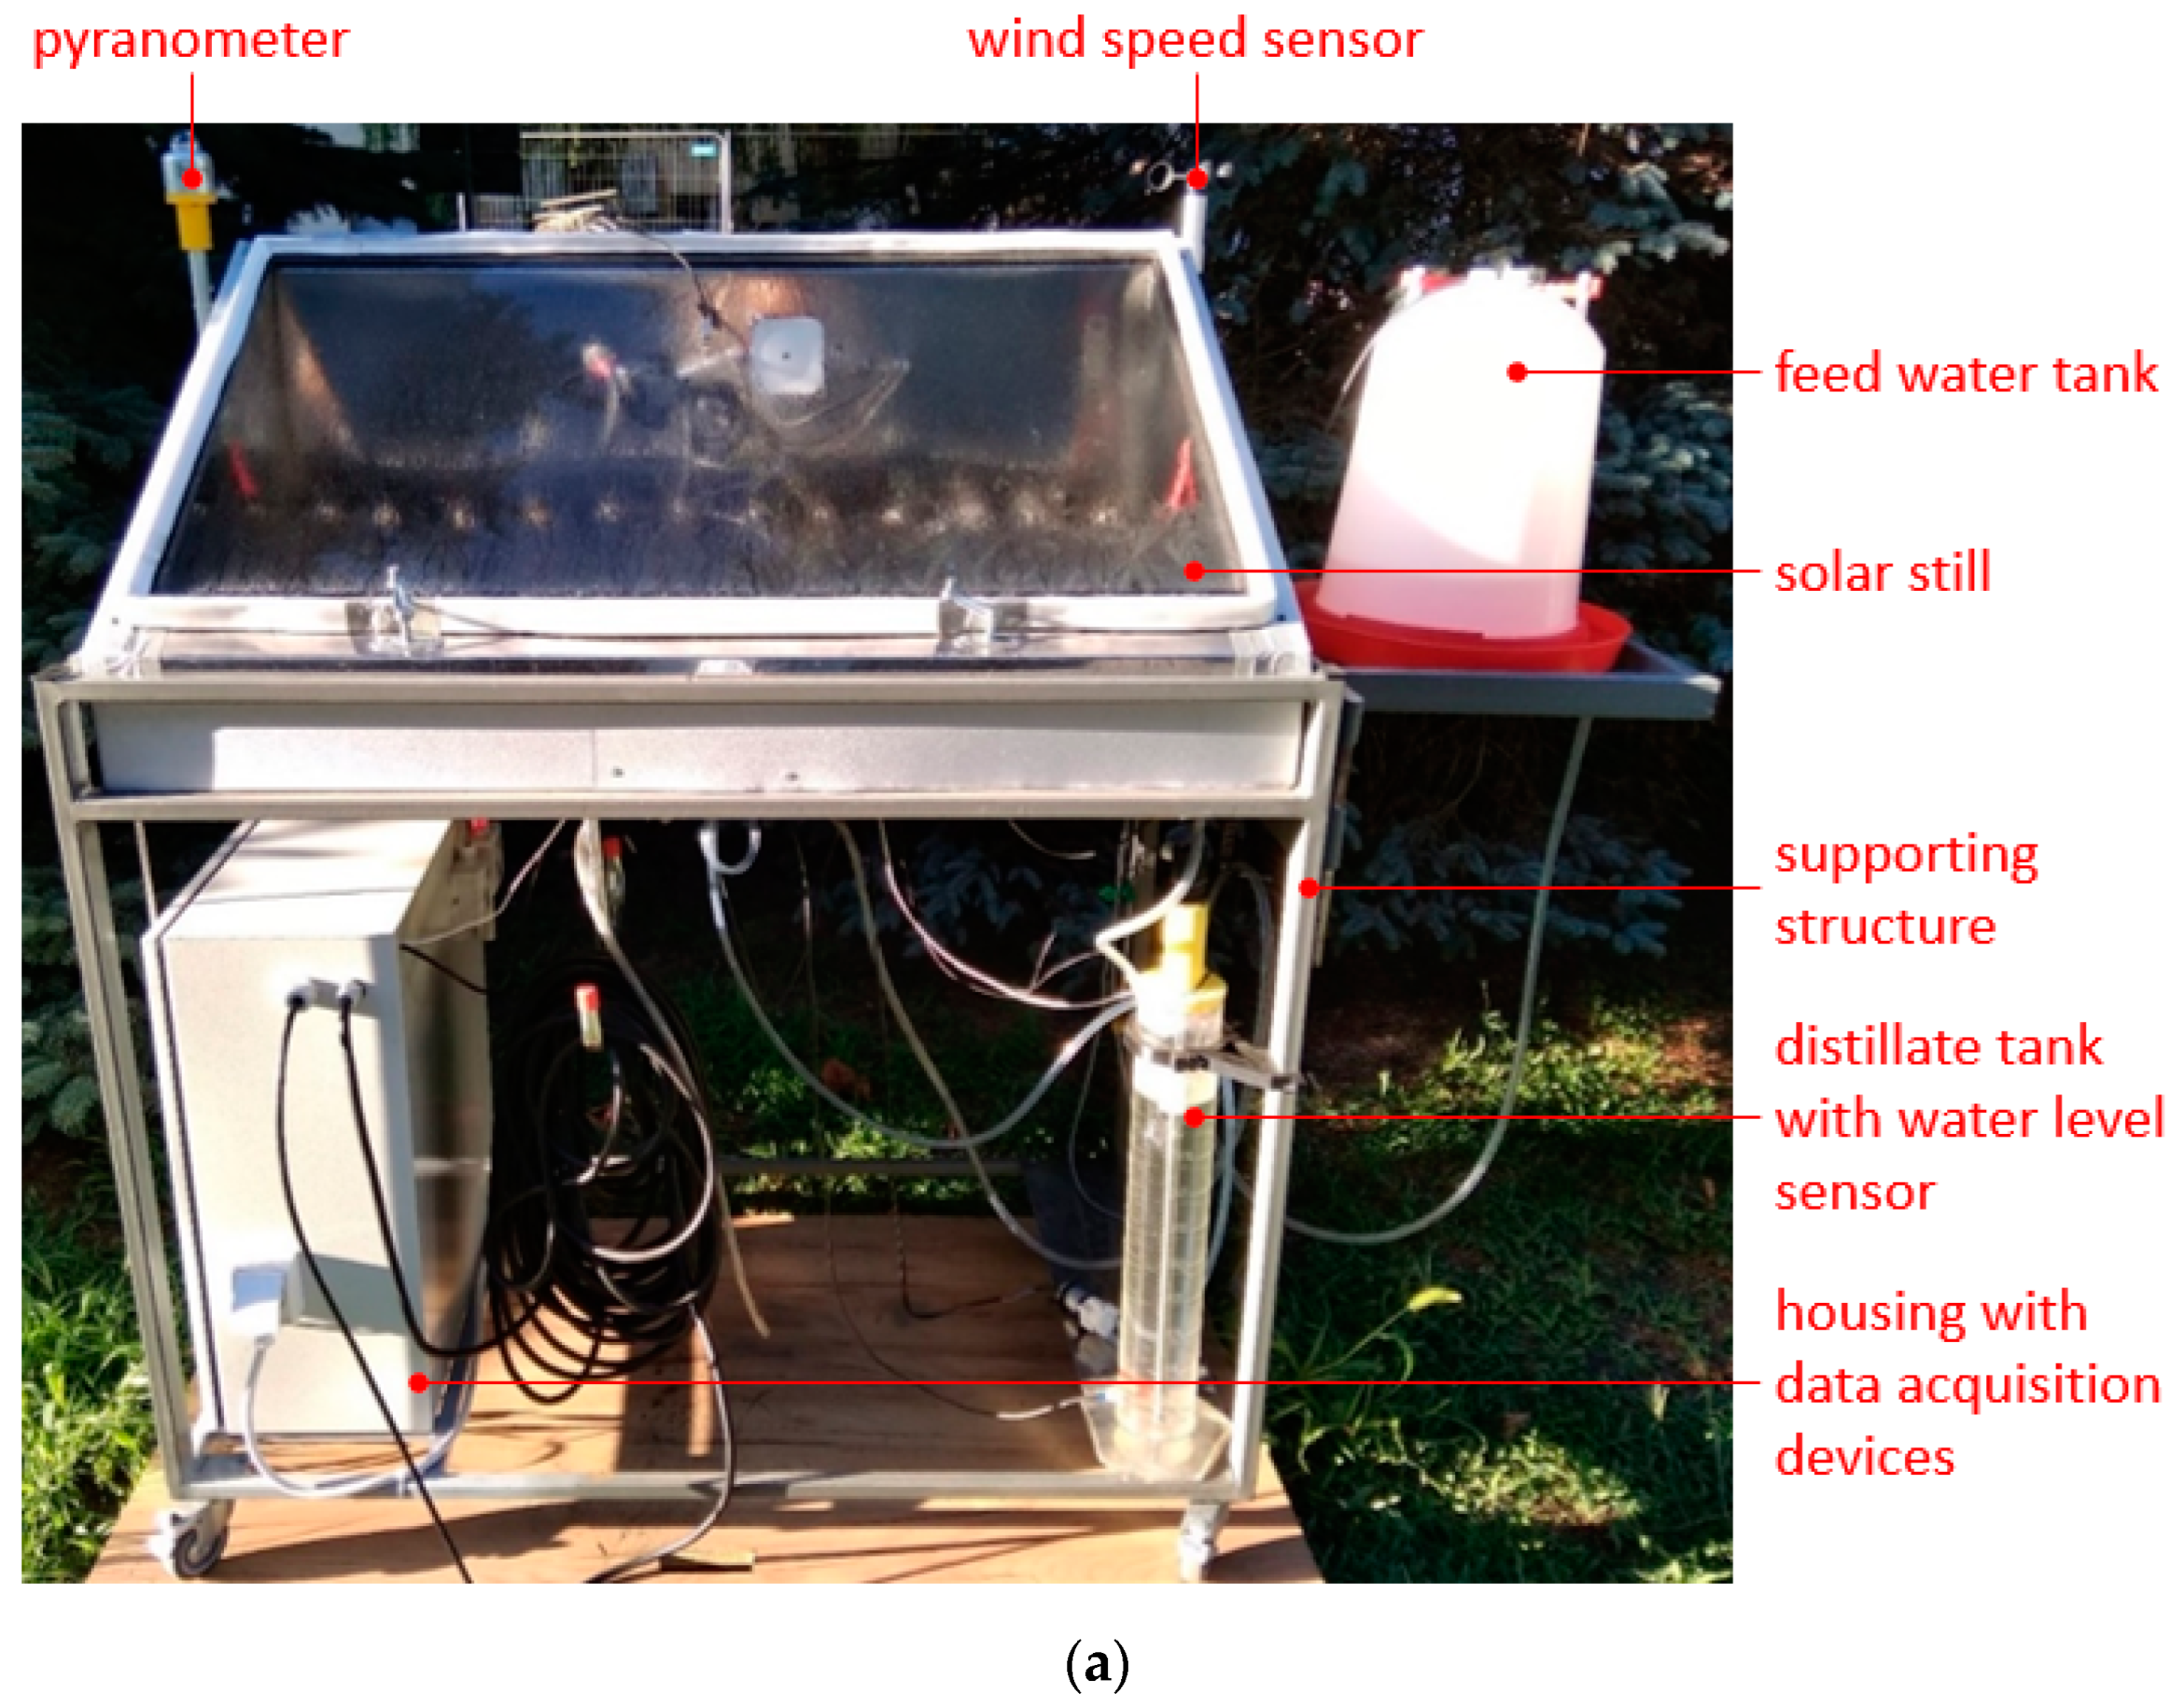
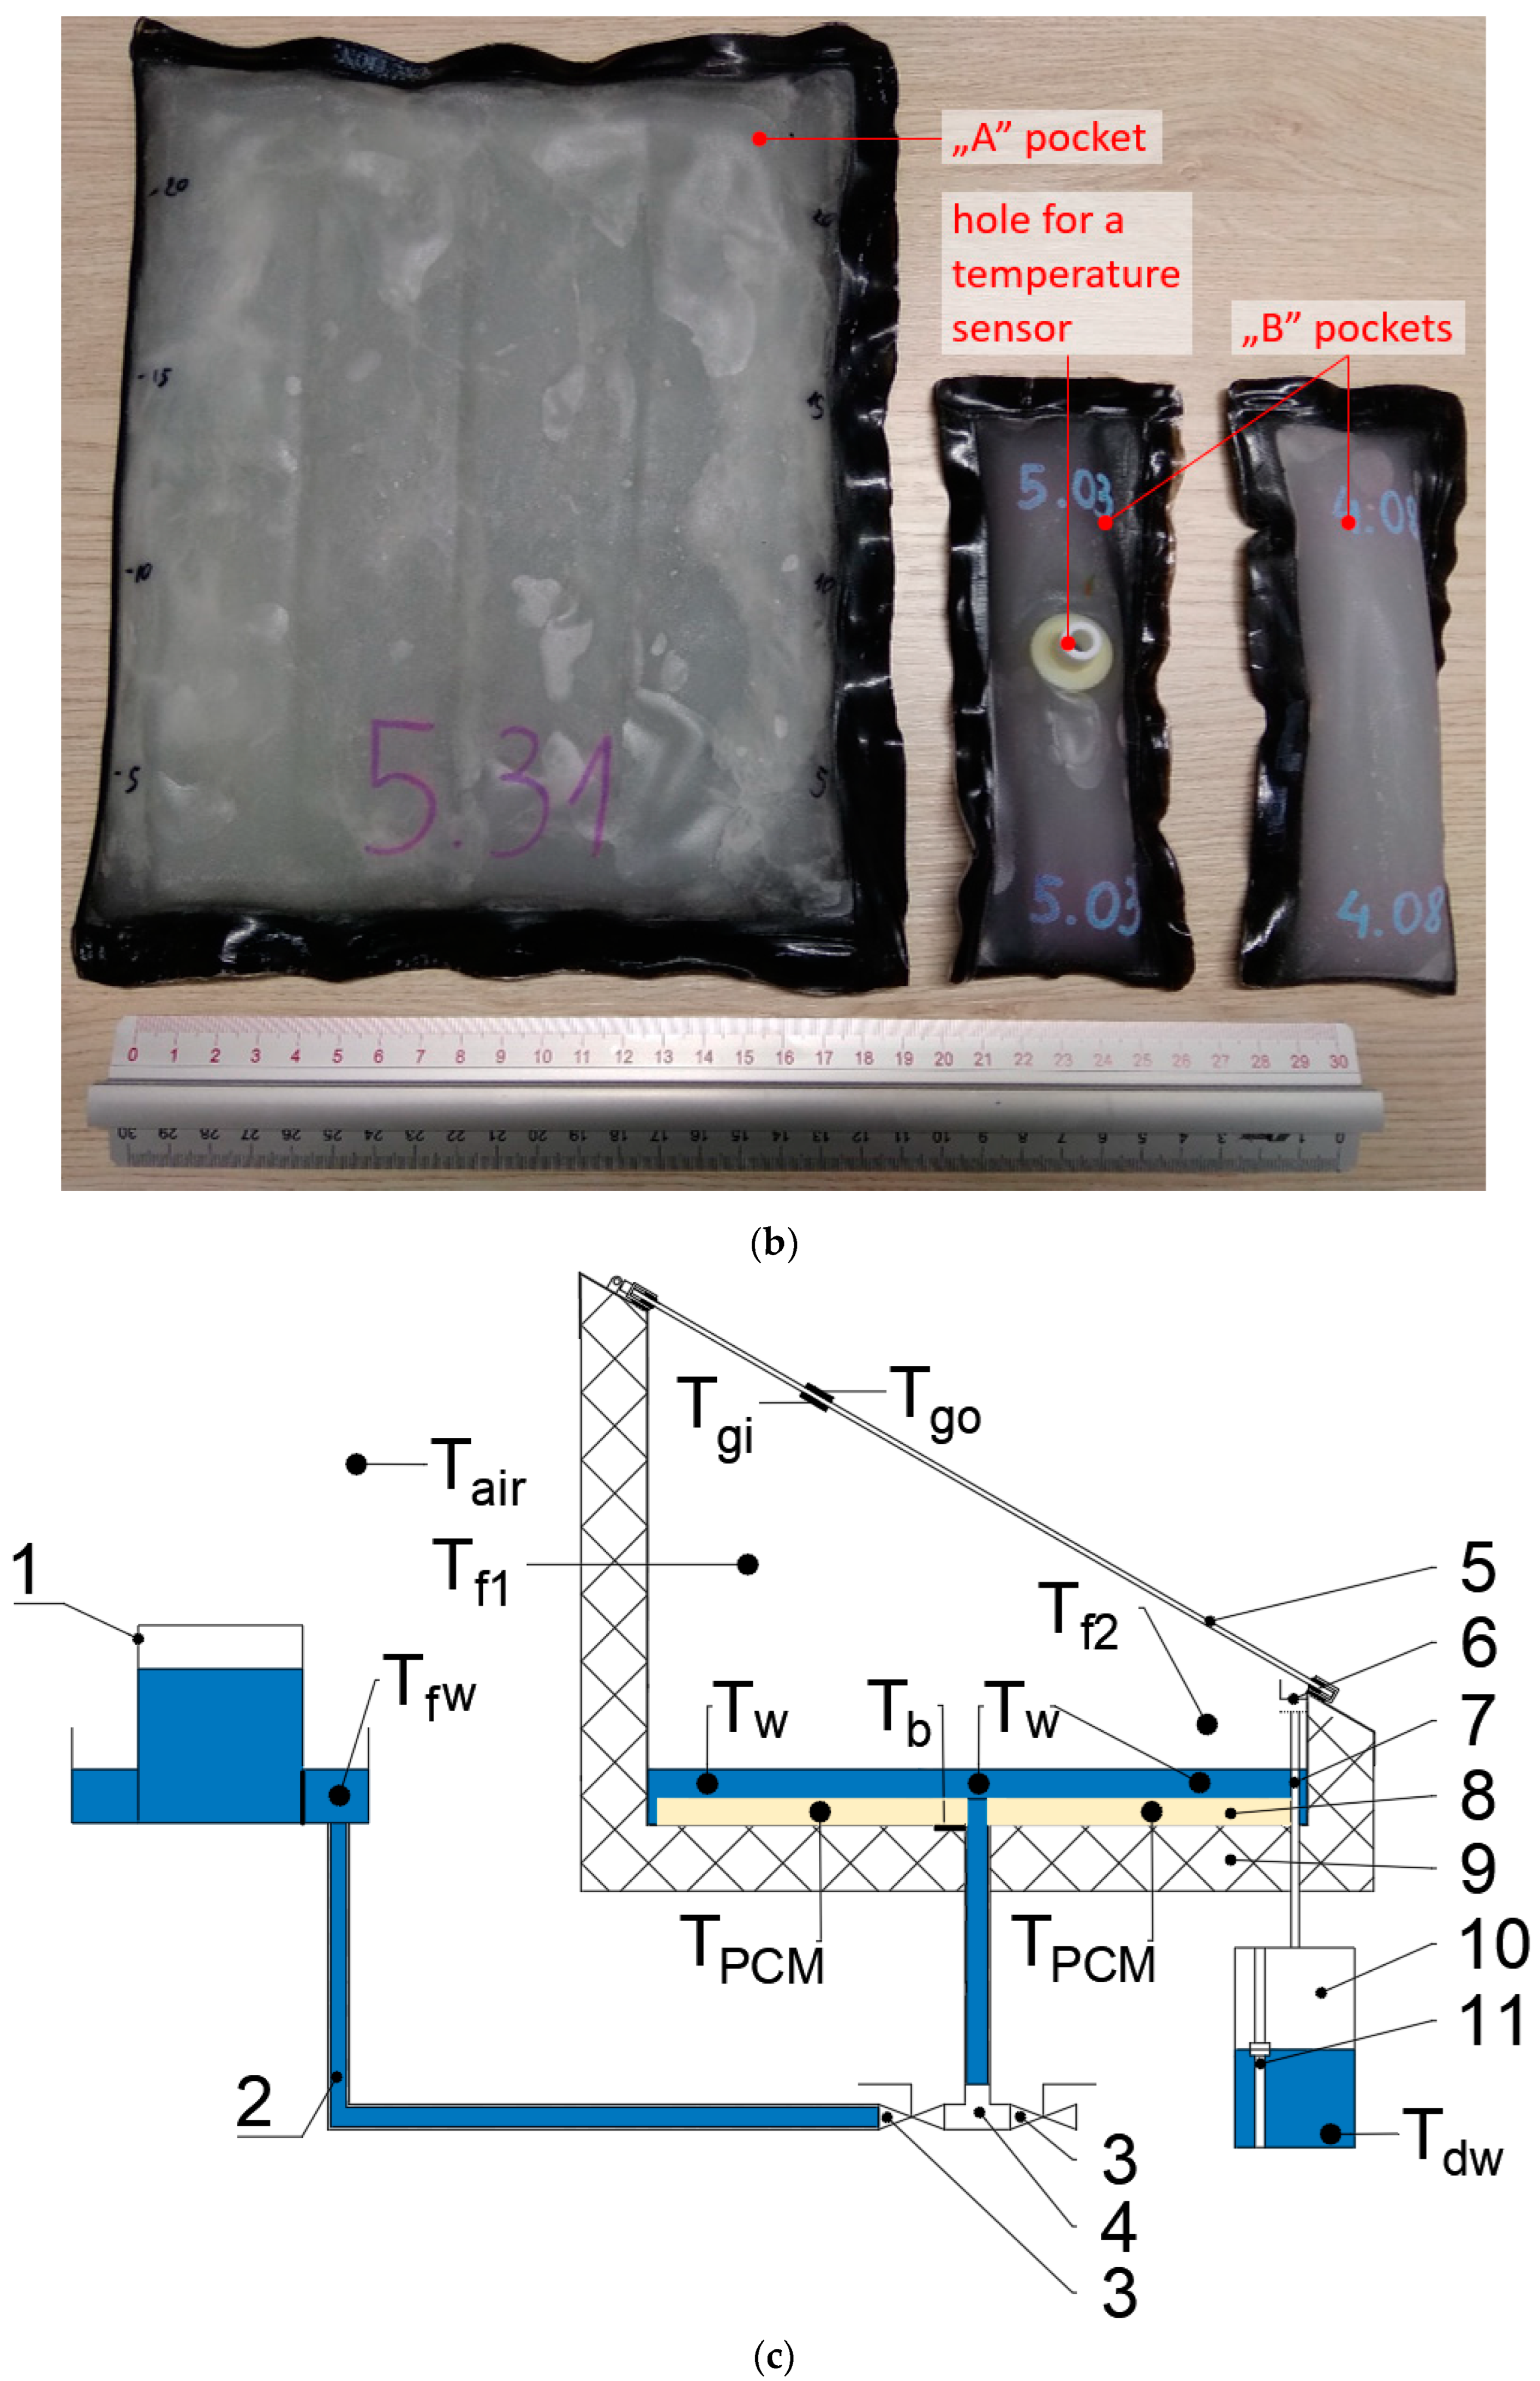
2.1. Experimental Setup
- Pocket A: 0.230 × 0.180 × 0.017 m3; PCM mass in one pocket 0.50 kg;
- Pocket B: 0.145 × 0.040 × 0.017 m3; PCM mass in one pocket 0.05 kg.
2.2. Experimental Procedure
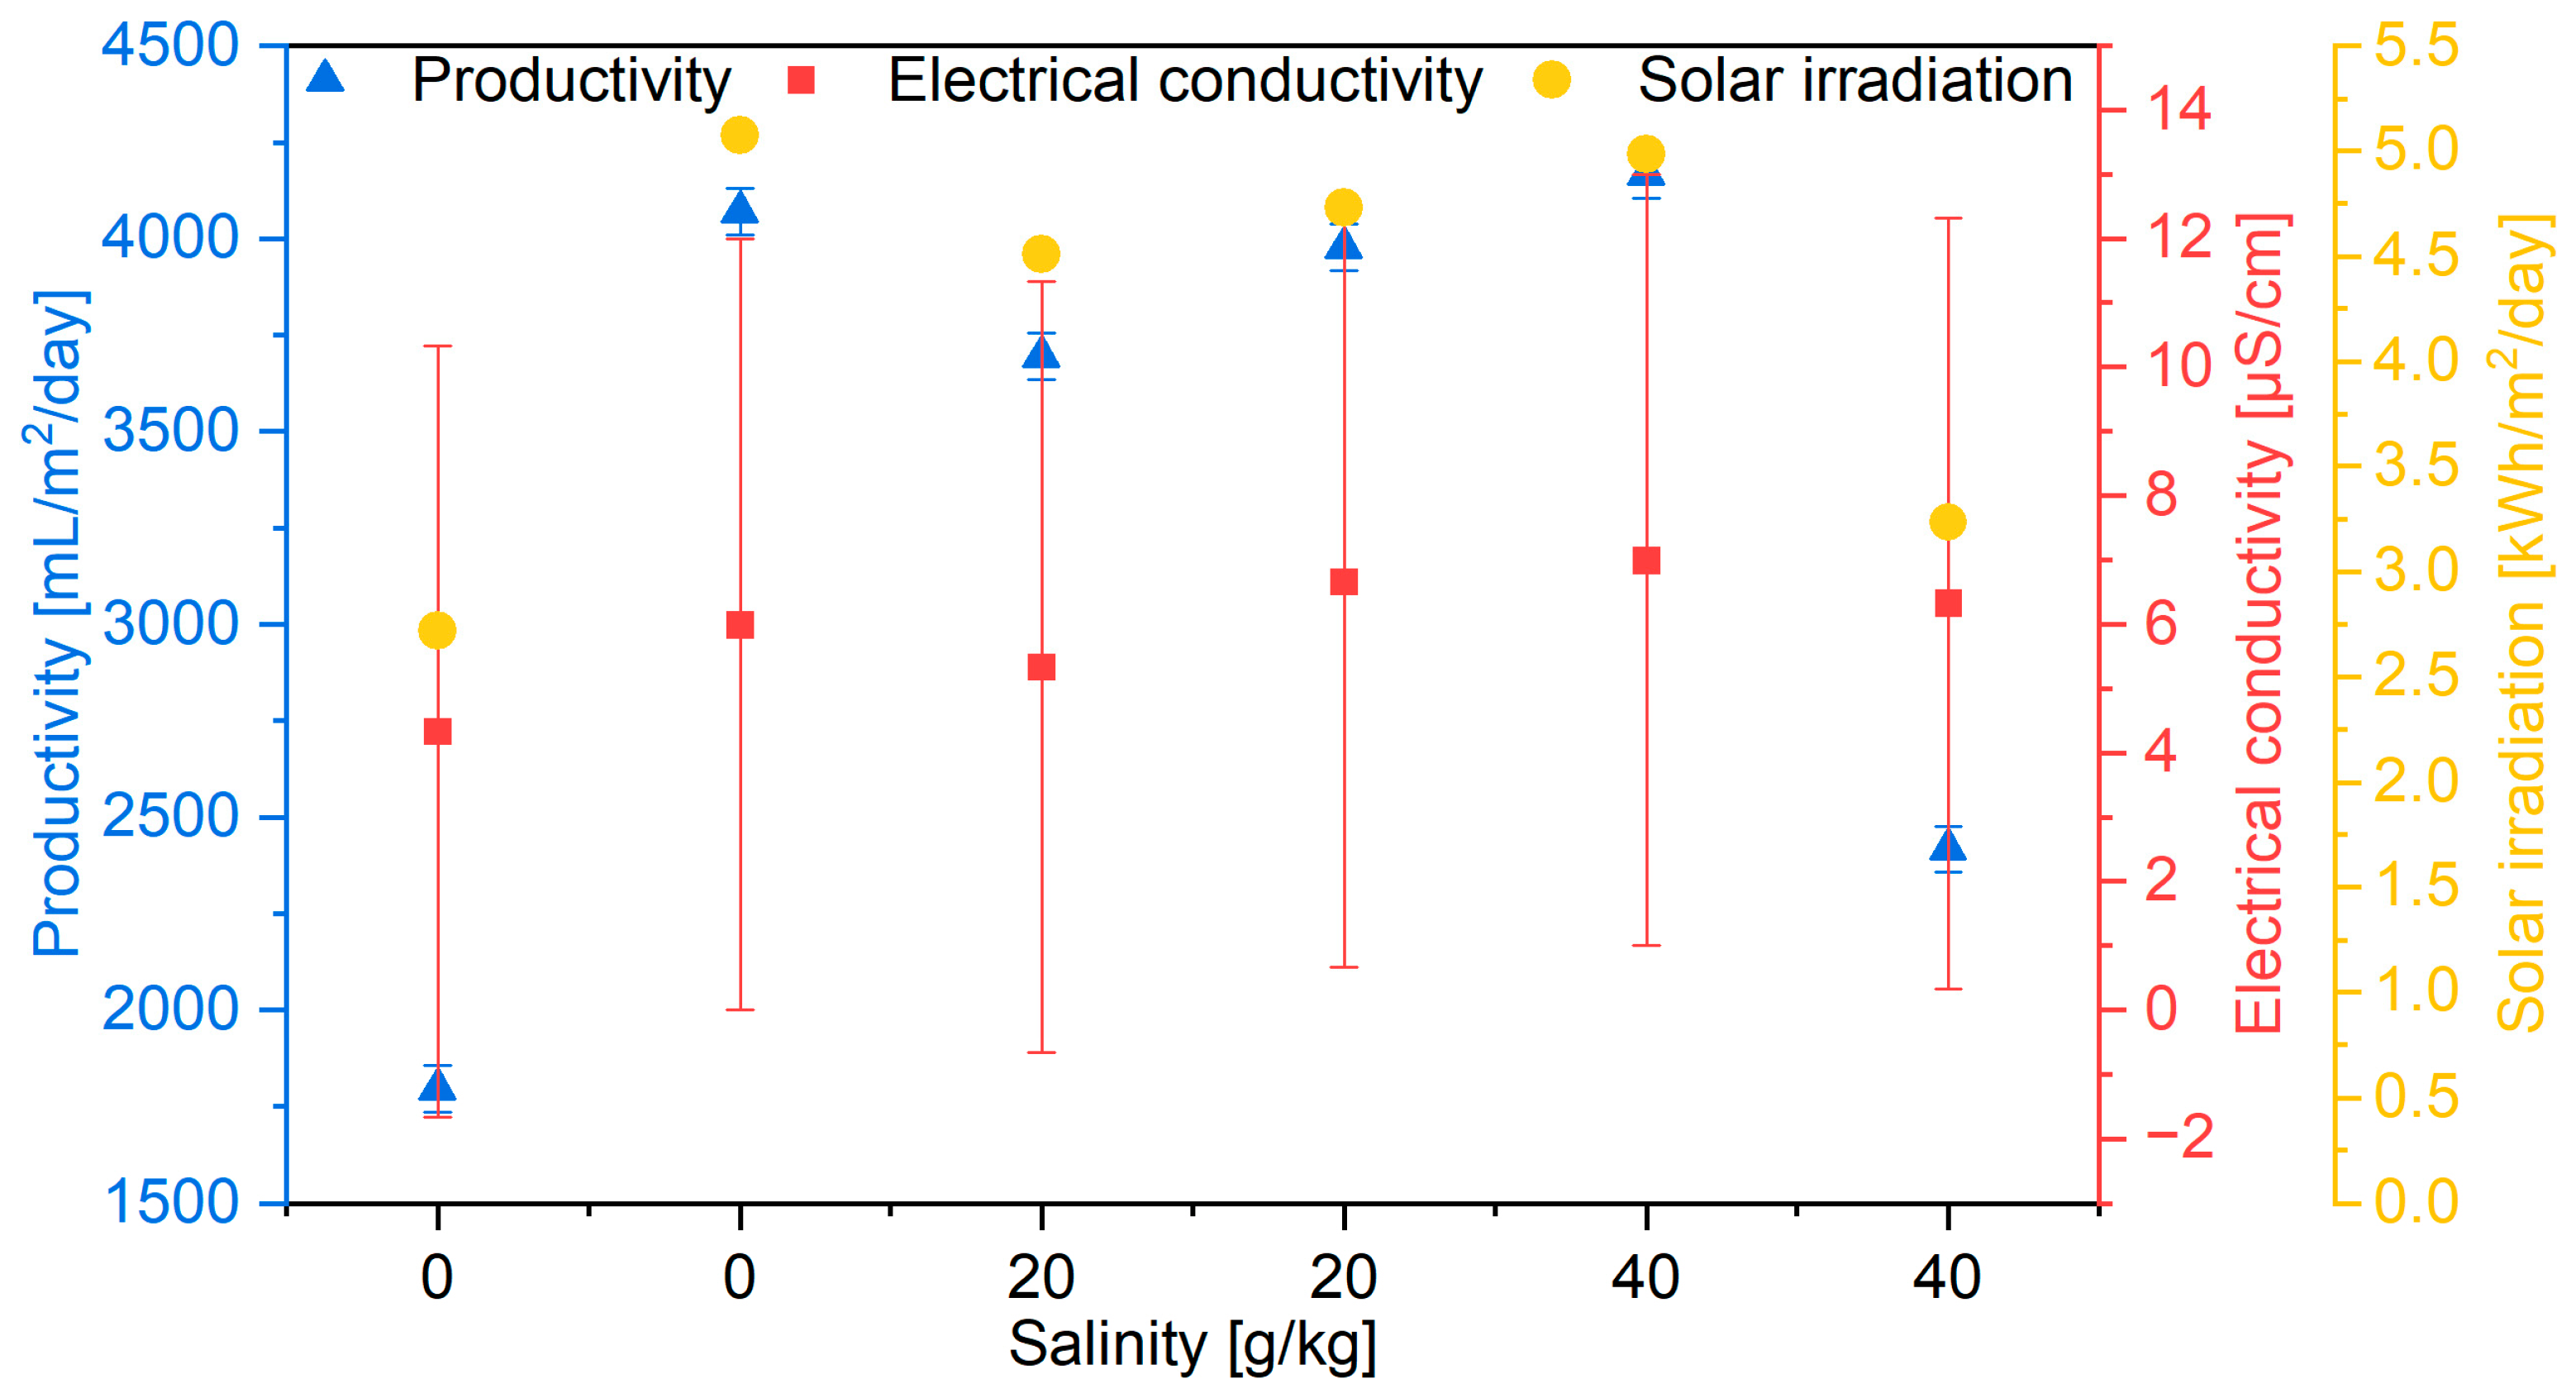
2.2.1. The Effect of Water Salinity on the Removal Efficiency
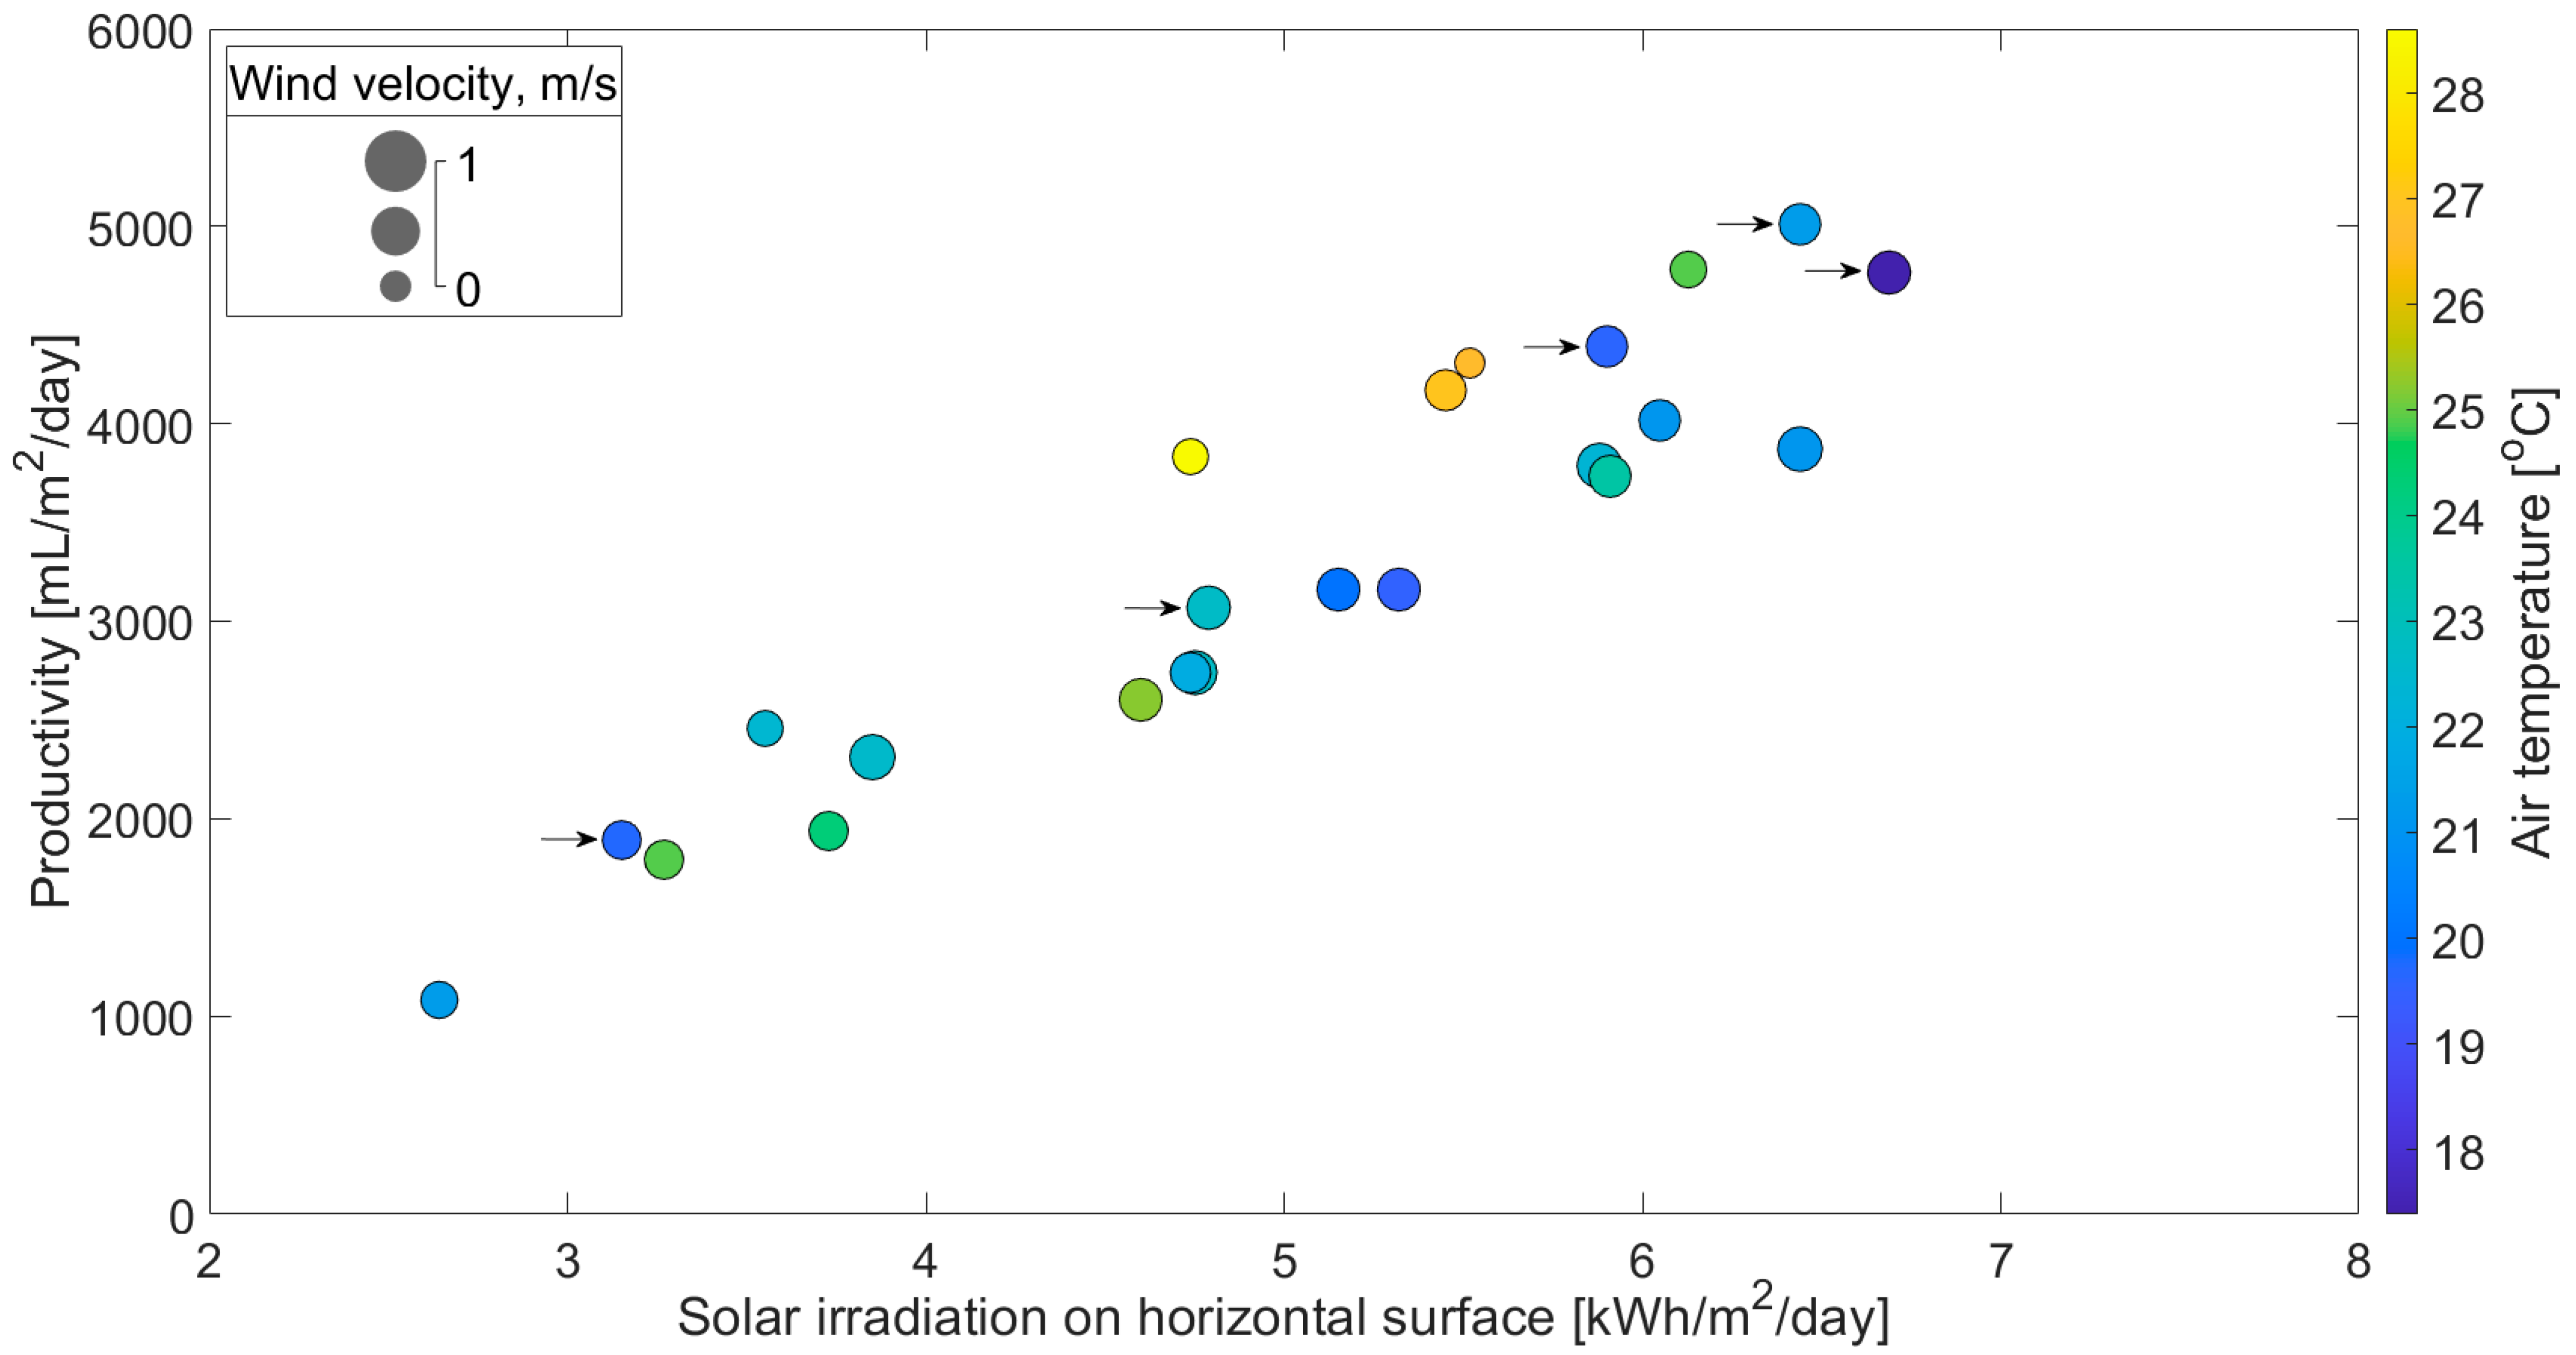
2.2.2. The Productivity of SS
3. Results and Discussion
3.1. The Effect of Water Salinity on the Removal Efficiency
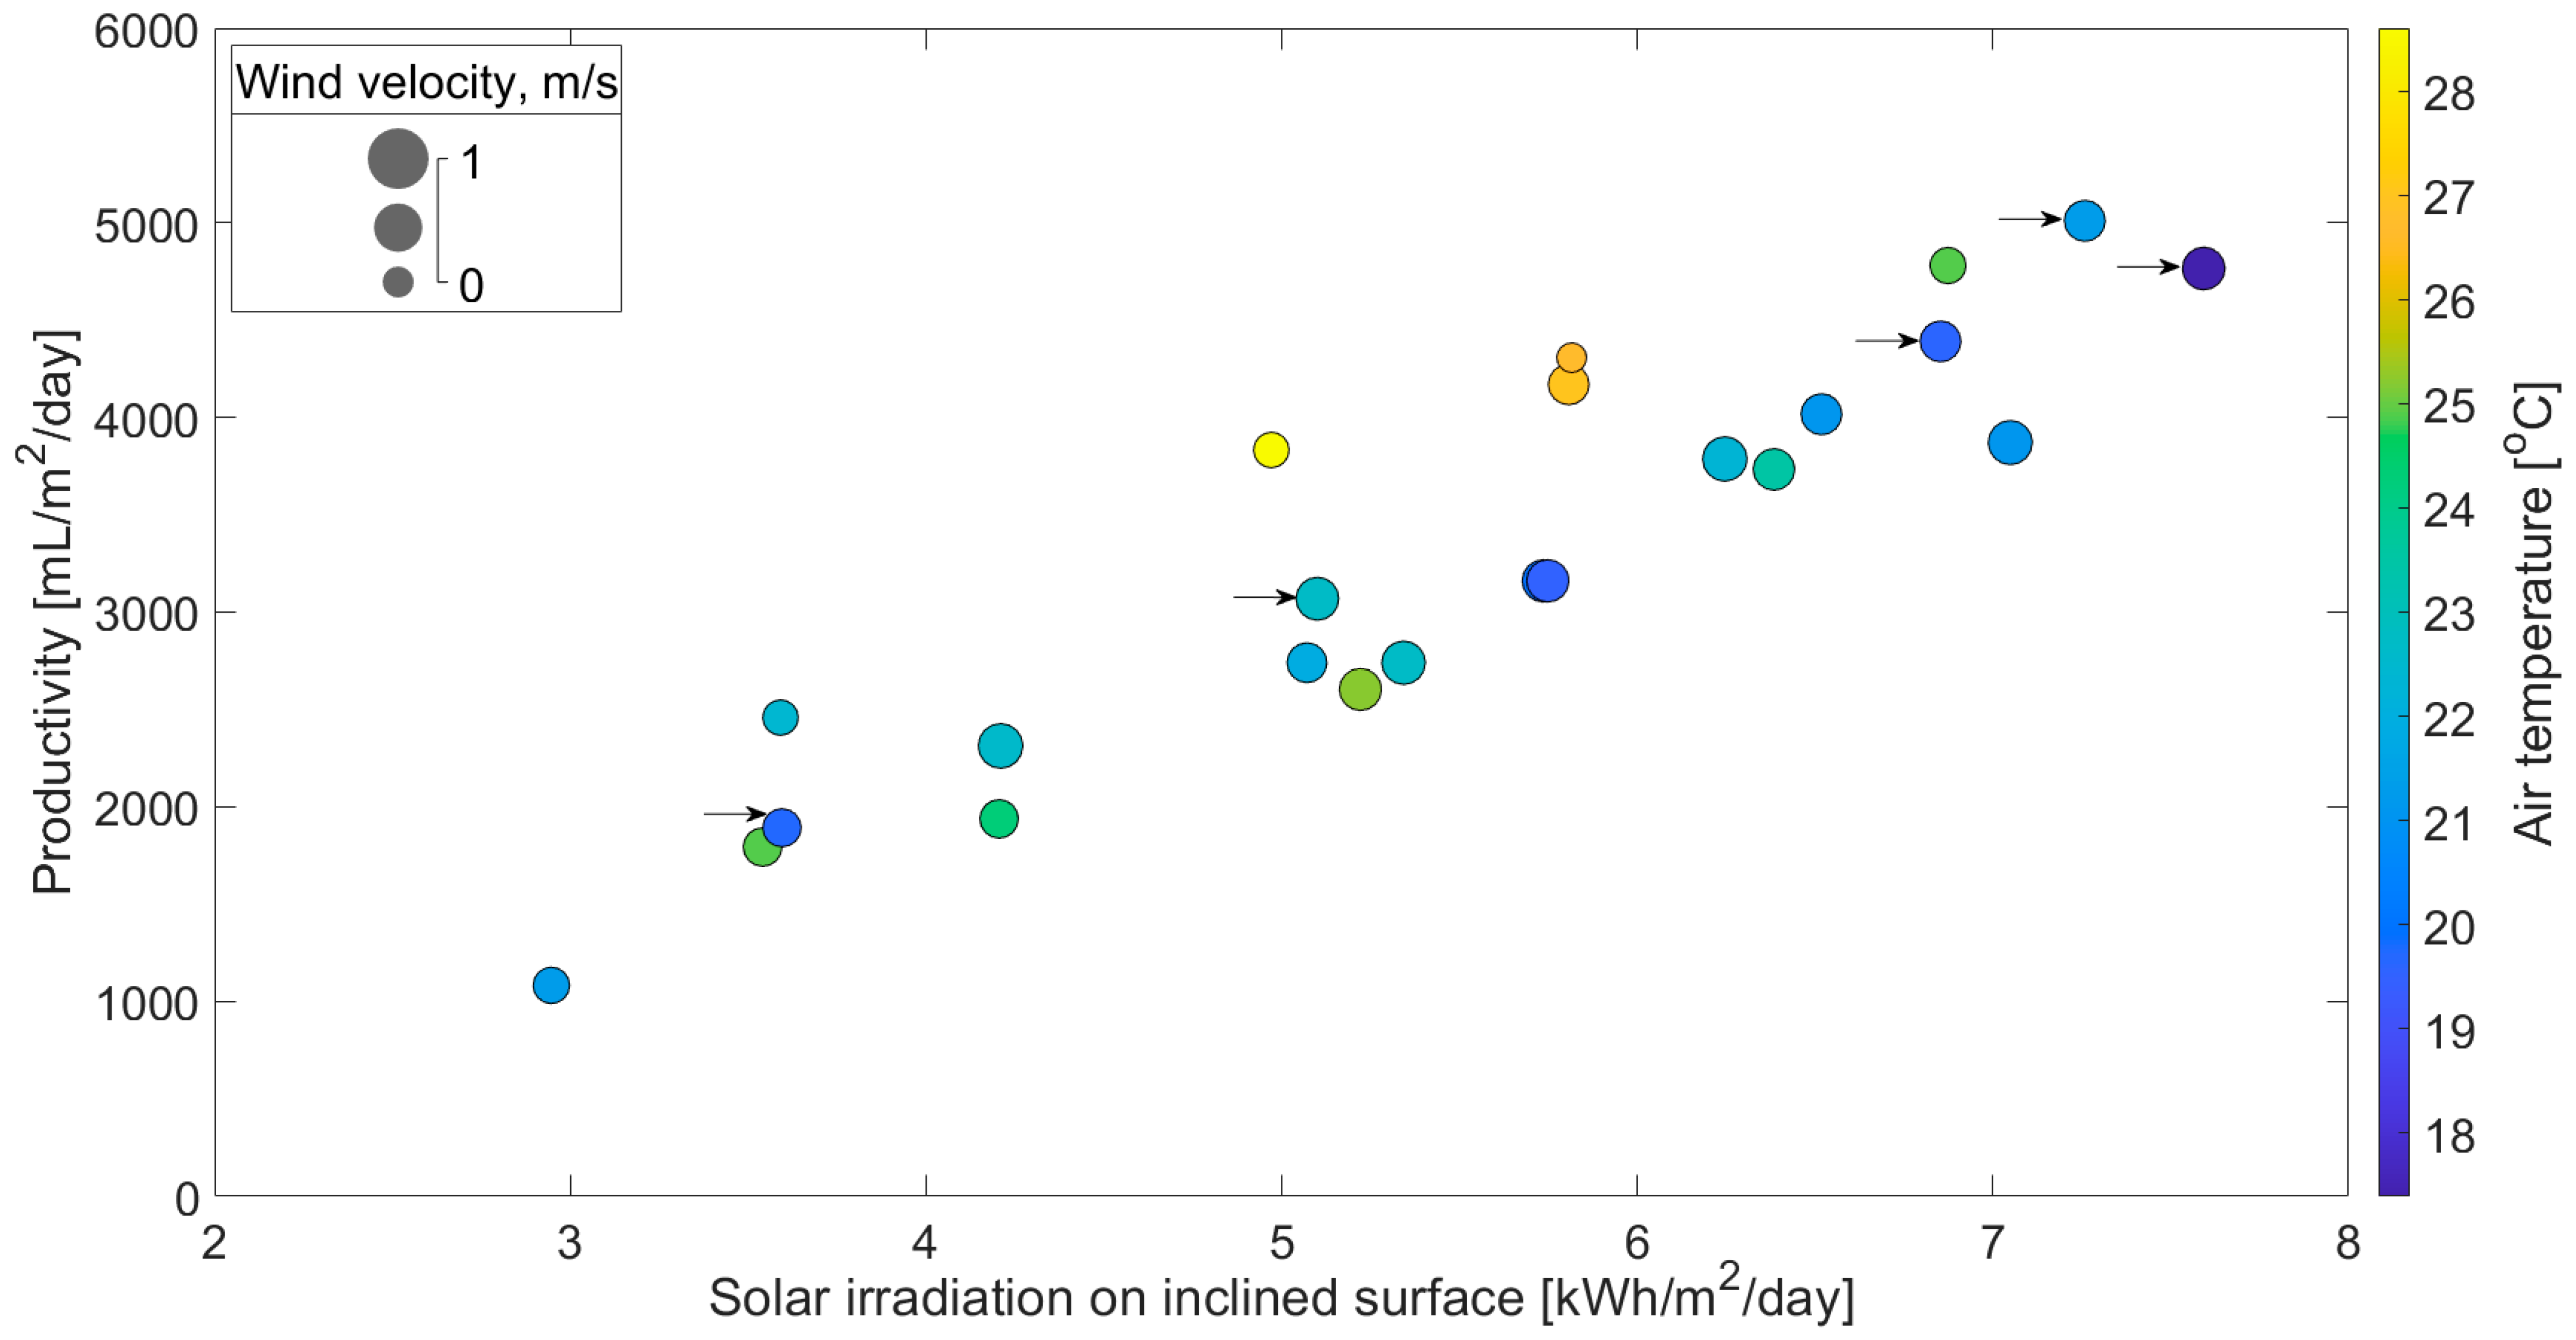
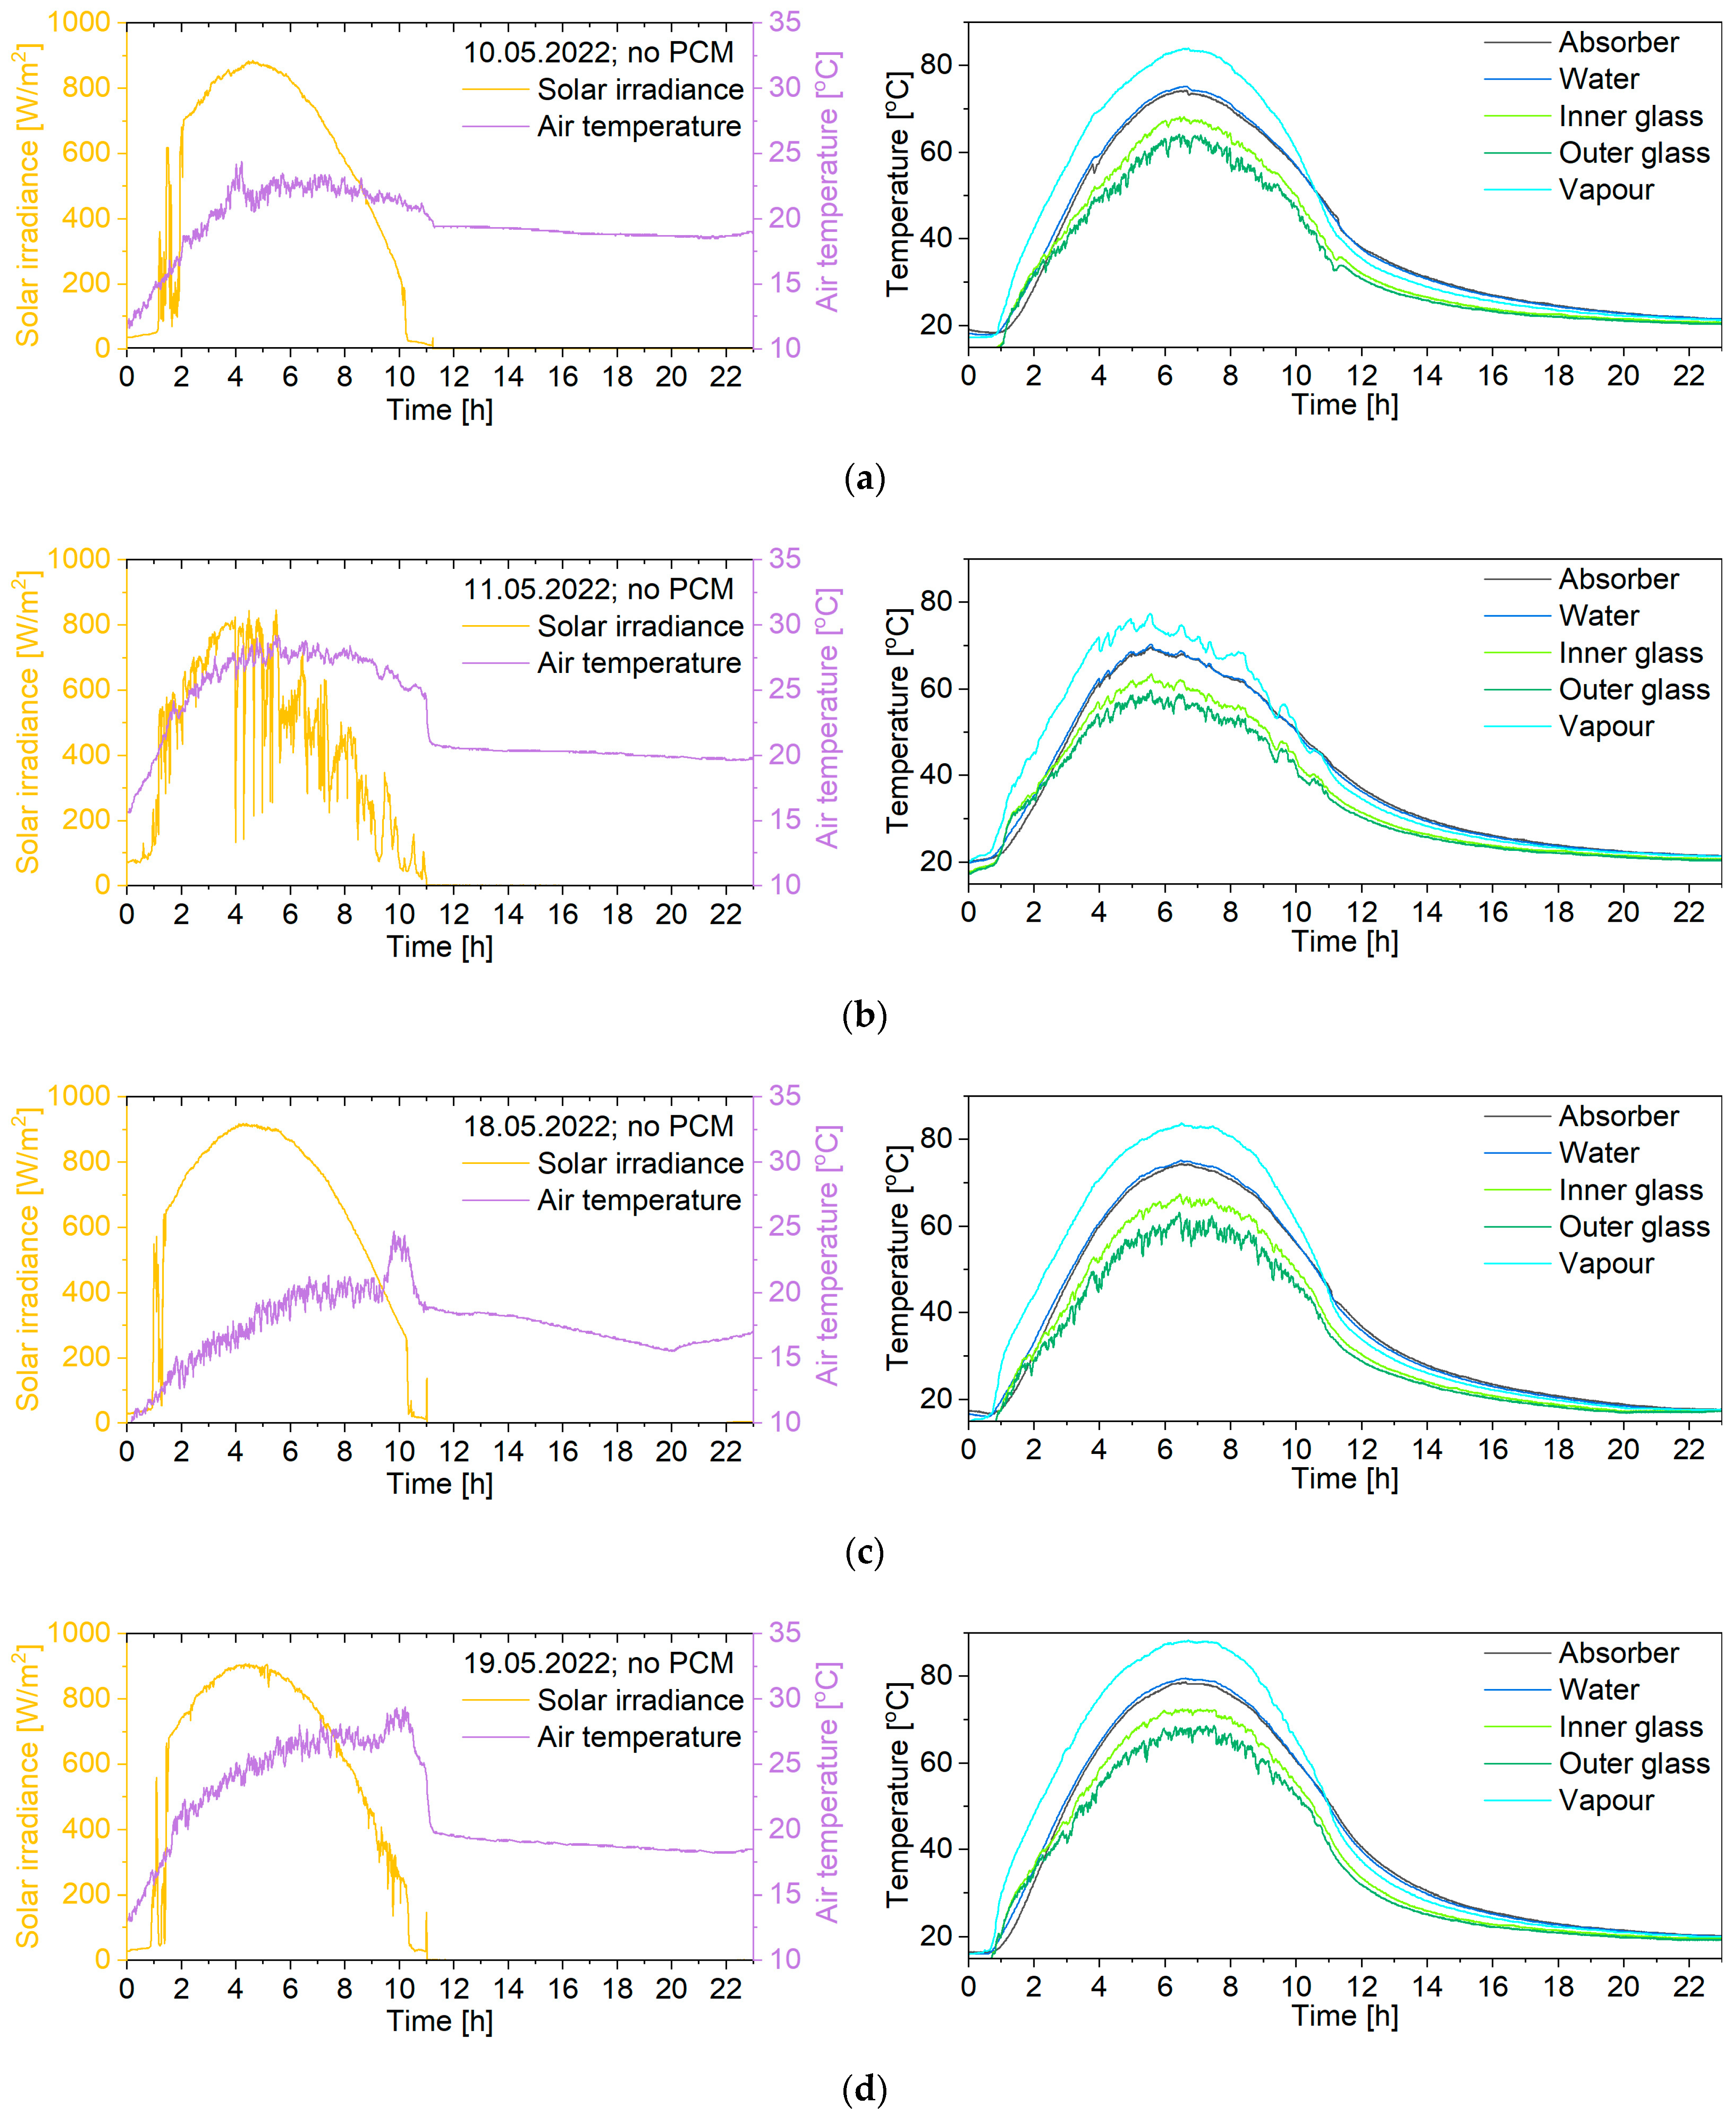
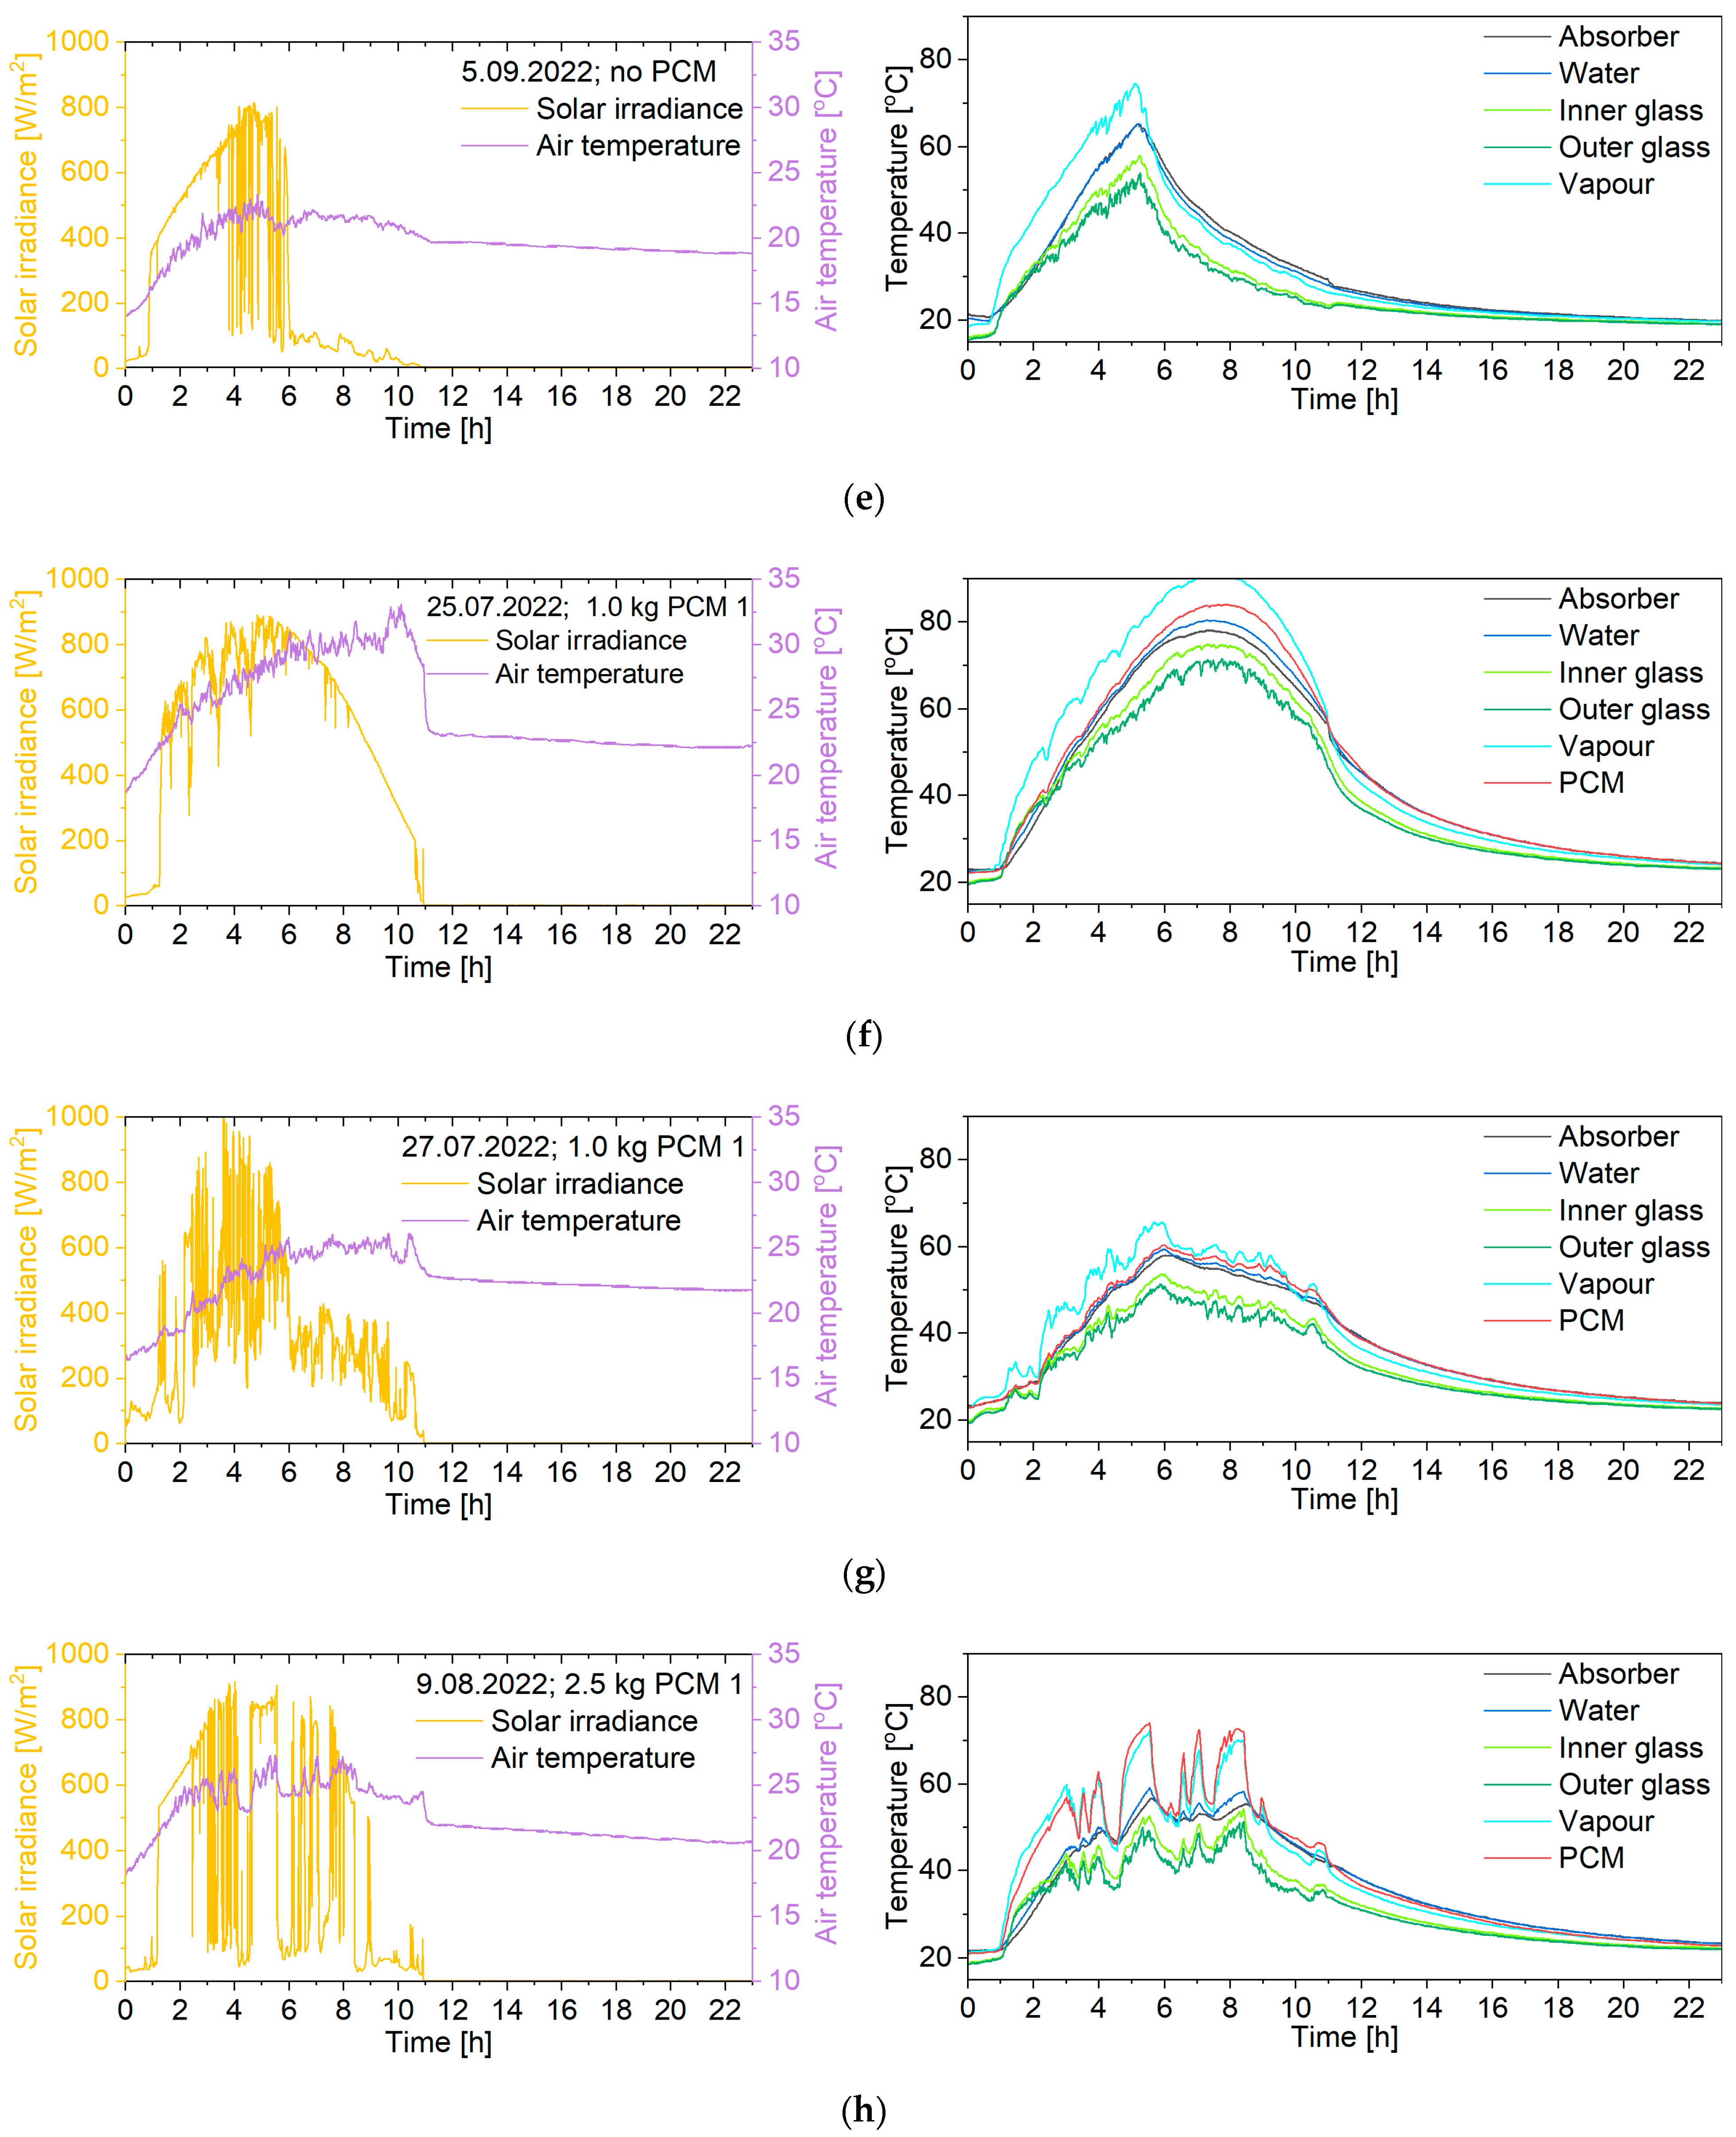
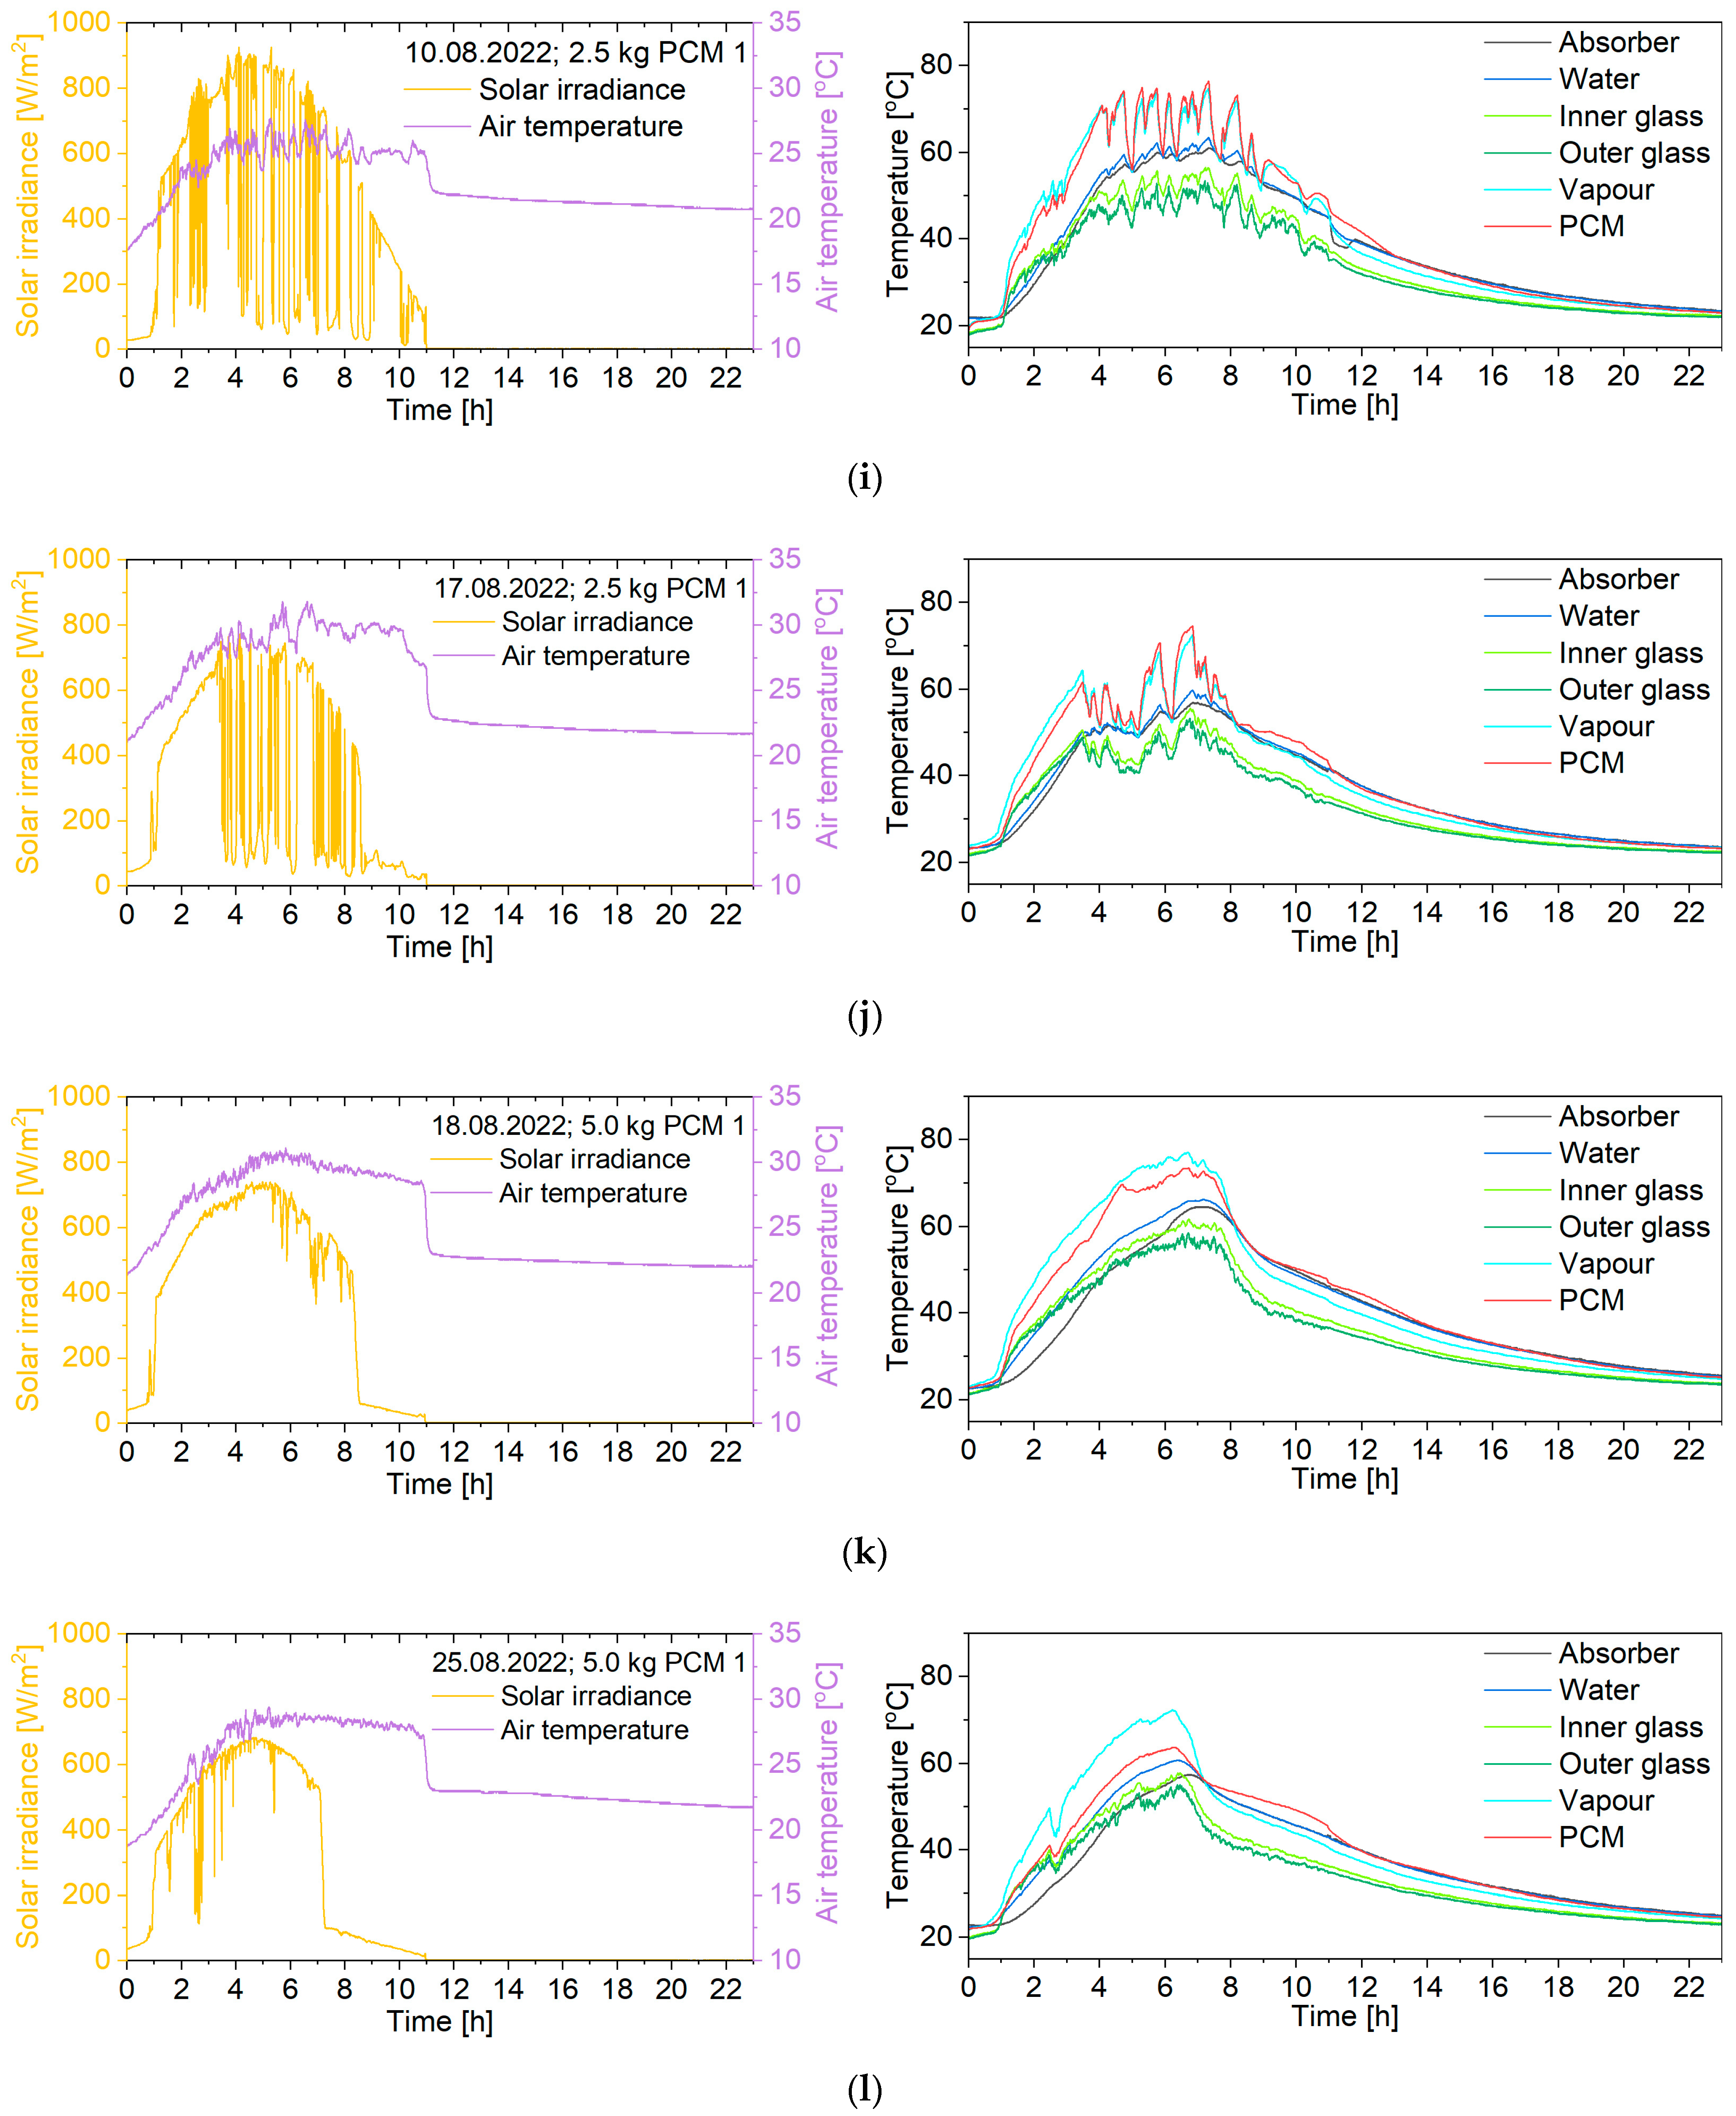
3.2. The Productivity of SS
3.3. Comparison to Literature
4. Conclusions
Author Contributions
Funding
Data Availability Statement
Conflicts of Interest
Abbreviations
| PCM | Phase-change material |
| SS | Solar still |
References
- Ritchie, H.; Roser, M. Water Use and Stress How Much Water Do We Use? How Did It Change over Time? Available online: https://ourworldindata.org/water-use-stress (accessed on 16 January 2025).
- UN World Water Development Report. Available online: https://www.unesco.org/reports/wwdr/en/2024/s (accessed on 16 January 2025).
- United States Geological Survey How Much Water Is There on Earth? Available online: https://www.usgs.gov/special-topic/water-science-school/science/how-much-water-there-earth?qt-science_center_objects=0#qt-science_center_objects (accessed on 20 July 2020).
- Al-Saidi, S.; Kyaw, H.H.; Myint, M.T.Z.; Al-Hajri, R.; Al-Abri, M. Capacitive deionization for water desalination: Optimizing operational parameters and validating the model across concentrations variant. Electrochim. Acta 2025, 514, 145614. [Google Scholar] [CrossRef]
- Zaed, M.; Saidur, R.; Saleque, A.M.; Tan, K.H.; Cherusseri, J.; Pandey, A.K.; Kabir, M.M. Unlocking desalination’s potential: Harnessing MXene composite for sustainable desalination. Chem. Eng. J. 2024, 500, 156910. [Google Scholar] [CrossRef]
- Tareemi, A.A.; Sharshir, S.W. A state-of-art overview of multi-stage flash desalination and water treatment: Principles, challenges, and heat recovery in hybrid systems. Sol. Energy 2023, 266, 112157. [Google Scholar] [CrossRef]
- Ellersdorfer, P.; Omar, A.; Taylor, R.A.; Daiyan, R.; Leslie, G. Multi-effect distillation: A sustainable option to large-scale green hydrogen production using solar energy. Int. J. Hydrogen Energy 2023, 48, 31491–31505. [Google Scholar] [CrossRef]
- Lim, Y.J.; Goh, K.; Kurihara, M.; Wang, R. Seawater desalination by reverse osmosis: Current development and future challenges in membrane fabrication—A review. J. Membr. Sci. 2021, 629, 119292. [Google Scholar] [CrossRef]
- Patel, S.K.; Lee, B.; Westerhoff, P.; Elimelech, M. The potential of electrodialysis as a cost-effective alternative to reverse osmosis for brackish water desalination. Water Res. 2024, 250, 121009. [Google Scholar] [CrossRef]
- Tian, J.; Zhao, X.; Gao, S.; Wang, X.; Zhang, R. Progress in Research and Application of Nanofiltration (NF) Technology for Brackish Water Treatment. Membranes 2021, 11, 662. [Google Scholar] [CrossRef] [PubMed]
- Bait, O. Direct and indirect solar–powered desalination processes loaded with nanoparticles: A review. Sustain. Energy Technol. Assess. 2020, 37, 100597. [Google Scholar] [CrossRef]
- Tan, X.; Saha, P.; Klausner, J.; Abbasi, B.; Benard, A. Modeling and experimental validation of direct contact crossflow packed beds condenser used in HDH desalination systems. Desalination 2023, 548, 116297. [Google Scholar] [CrossRef]
- Abedi, M.; Tan, X.; Saha, P.; Klausner, J.F.; Bénard, A. Design of a solar air heater for a direct-contact packed-bed humidification–dehumidification desalination system. Appl. Therm. Eng. 2024, 244, 122700. [Google Scholar] [CrossRef]
- Elsheikh, A.; Hammoodi, K.A.; Ibrahim, A.M.M.; Mourad, A.-H.I.; Fujii, M.; Abd-Elaziem, W. Augmentation and evaluation of solar still performance: A comprehensive review. Desalination 2024, 574, 117239. [Google Scholar] [CrossRef]
- Mu, L.; Chen, L.; Lin, L.; Park, Y.H.; Wang, H.; Xu, P.; Kota, K.; Kuravi, S. An overview of solar still enhancement approaches for increased freshwater production rates from a thermal process perspective. Renew. Sustain. Energy Rev. 2021, 150, 111458. [Google Scholar] [CrossRef]
- Essa, F.A.; Abdullah, A.K.; Majdi, H.S.; Basem, A.; Dhahad, H.A.; Omara, Z.M.; Mohammed, S.A.; Alawee, W.H.; Al Ezzi, A.; Yusaf, T. Parameters Affecting the Efficiency of Solar Stills—Recent Review. Sustainability 2022, 14, 668. [Google Scholar] [CrossRef]
- Yadav, P.; Prakash, O. Productivity Enhancement of Solar Stills: A Review on Factors Affecting the Performance of Solar Still. Process Integr. Optim. Sustain. 2023, 7, 1055–1079. [Google Scholar] [CrossRef]
- Muñoz, F.; Barrera, E.; Ruiz, A.; Martínez, E.M.; Chargoy, N. Long-term experimental theoretical study on several single-basin solar stills. Desalination 2020, 476. [Google Scholar] [CrossRef]
- Nian, Y.L.; Huo, Y.K.; Cheng, W.L. Study on annual performance of the solar still using shape-stabilized phase change materials with economic analysis. Sol. Energy Mater. Sol. Cells 2021, 230, 111263. [Google Scholar] [CrossRef]
- Ali, H.; Ali, S.; Khan, S.; Siddiqui, M.U. Experimental Investigations of a Single-Slope Solar Still: Energy and Exergy Analysis. Energies 2023, 16, 7659. [Google Scholar] [CrossRef]
- Vaithilingam, S.; Esakkimuthu, G.S. Energy and exergy analysis of single slope passive solar still: An experimental investigation. Desalin. Water Treat. 2015, 55, 1433–1444. [Google Scholar] [CrossRef]
- Nafey, A.S.; Abdelkader, M.; Abdelmotalip, A.; Mabrouk, A.A. Parameters affecting solar still productivity. Energy Convers. Manag. 2000, 41, 1797–1809. [Google Scholar] [CrossRef]
- El-Sebaii, A.A.; El-Naggar, M. Year round performance and cost analysis of a finned single basin solar still. Appl. Therm. Eng. 2017, 110, 787–794. [Google Scholar] [CrossRef]
- Sharon, H.; Prabha, C.; Vijay, R.; Niyas, A.M.; Gorjian, S. Assessing suitability of commercial fibre reinforced plastic solar still for sustainable potable water production in rural India through detailed energy-exergy-economic analyses and environmental impacts. J. Environ. Manag. 2021, 295, 113034. [Google Scholar] [CrossRef] [PubMed]
- Al-Helal, I.M.; Alsadon, A.; Marey, S.; Ibrahim, A.; Shady, M.R. Optimizing a Single-Slope Solar Still for Fresh-Water Production in the Deserts of Arid Regions: An Experimental and Numerical Approach. Sustainability 2024, 16, 800. [Google Scholar] [CrossRef]
- Shatar, N.M.; Sabri, M.F.M.; Salleh, M.F.M.; Ani, M.H. Energy, exergy, economic, environmental analysis for solar still using partially coated condensing cover with thermoelectric cover cooling. J. Clean. Prod. 2023, 387, 135833. [Google Scholar] [CrossRef]
- Wiener, J.; Khan, M.Z.; Shah, K. Performance enhancement of the solar still using textiles and polyurethane rollers. Sci. Rep. 2024, 14, 5202. [Google Scholar] [CrossRef]
- Murali, G.; Ramani, P.; Murugan, M.; Elumalai, P.V.; Ranjan Goud, N.U.; Prabhakar, S. Improved solar still productivity using PCM and nano- PCM composites integerated energy storage. Sci. Rep. 2024, 14, 15609. [Google Scholar] [CrossRef] [PubMed]
- Radomska, E.; Mika, L.; Sztekler, K.; Kalawa, W. Experimental validation of the thermal processes modeling in a solar still. Energies 2021, 14, 2321. [Google Scholar] [CrossRef]
- Radomska, E.; Mika, Ł.; Sztekler, K.; Kalawa, W.; Lis, Ł.; Pielichowska, K.; Szumera, M.; Rutkowski, P. Experimental and Theoretical Investigation of Single-Slope Passive Solar Still with Phase-Change Materials. Energies 2023, 16, 1188. [Google Scholar] [CrossRef]
- Radomska, E.; Mika, Ł. Long-term modeling of the performance of a solar still with phase-change material. Appl. Therm. Eng. 2023, 235, 121339. [Google Scholar] [CrossRef]
- Radomska, E.; Mika, Ł.; Boruta, P.; Bujok, T. The Performance of Solar Still in Continental Climates: A Case Study in Poland. Heat Transf. Eng. 2024, 1–13. [Google Scholar] [CrossRef]
- Singh, H.N.; Tiwari, G.N. Monthly performance of passive and active solar stills for different Indian climatic conditions. Desalination 2004, 168, 145–150. [Google Scholar] [CrossRef]
- Tiwari, G.N.; Sahota, L. Advanced Solar-Distillation Systems: Basic Principles, Thermal Modeling, and Its Application; Springer: Singapore, 2017; ISBN 9789811046711. [Google Scholar]
- Sharshir, S.W.; Yang, N.; Peng, G.; Kabeel, A.E. Factors affecting solar stills productivity and improvement techniques: A detailed review. Appl. Therm. Eng. 2016, 100, 267–284. [Google Scholar] [CrossRef]
- Ray, C.; Jain, R. (Eds.) Drinking Water Treatment; Springer: Dordrecht, The Netherlands, 2011; ISBN 978-94-007-1103-7. [Google Scholar]
- Nagaraju, V.; Murali, G.; Bewoor, A.K.; Kumar, R.; Sharifpur, M.; Assad, M.E.H.; Awad, M.M. Experimental study on performance of single slope solar still integrated with sand troughs. Sustain. Energy Technol. Assess. 2022, 50, 101884. [Google Scholar] [CrossRef]
- Manoj Kumar, P.; Sudarvizhi, D.; Prakash, K.B.; Anupradeepa, A.M.; Boomiha Raj, S.; Shanmathi, S.; Sumithra, K.; Surya, S. Investigating a single slope solar still with a nano-phase change material. Mater. Today Proc. 2021, 45, 7922–7925. [Google Scholar] [CrossRef]
- Kumar, S.; Prakash, O. Improving the Single-Slope Solar Still Performance Using Solar Air Heater with Phase Change Materials. Energies 2022, 15, 8013. [Google Scholar] [CrossRef]
- Jahanpanah, M.; Sadatinejad, S.J.; Kasaeian, A.; Jahangir, M.H.; Sarrafha, H. Experimental investigation of the effects of low-temperature phase change material on single-slope solar still. Desalination 2021, 499, 114799. [Google Scholar] [CrossRef]
- Hameed, H.G. Experimentally evaluating the performance of single slope solar still with glass cover cooling and square cross-section hollow fins. Case Stud. Therm. Eng. 2022, 40, 102547. [Google Scholar] [CrossRef]


| Parameter | Device | Range | Uncertainty |
|---|---|---|---|
| The temperature of the absorber and inner and outer glass cover | RTD Pt100 (TP878.3, Delta Ohm, Padua, Italy) | −30 to +200 °C | ±(0.1 °C + 0.1% |T|) °C |
| The temperature of the water, PCM, and ambient air | RTD Pt1000 (SN108, Comet System, Rožnov pod Radhoštěm, Czech Republic) | 0 to +150 °C | ±0.3 °C |
| Distilled water volume | Float liquid level sensor (EIEWIN, Gliwice, Poland) | 0 to 2365 mL | ±30 mL |
| Solar irradiance | Pyranometer (SR05-D2A2, Hukseflux, Delft, The Netherlands) | 0 to 1600 W/m2 | ±8.4% of the measured value |
| Wind speed | Wind speed sensor (WSS 100/4–20 mA, NAVIS elektronika, Kamnik, Slovenia) | 0.7 to 50.0 m/s | ±0.15 m/s or 2.5% of measured value |
| Electrical conductivity | Conductivity measuring device (Greisinger GLF 100, GHM Messtechnik GmbH, Regenstauf, Germany) | 0.0–100 mS/cm | ±(0.5% of the measured value + 0.5% of the measuring range) |
| PCM | Peak Melting Temperature, °C | Peak Solidification Temperature, °C | Latent Heat of Fusion, J/g | Thermal Conductivity, W/(mK) |
|---|---|---|---|---|
| 1 | 55.8 | 53.3 | 192.7 | 0.251 |
| 2 | 59.9 | 58.6 | 181.5 | 0.267 |
| Feed Water Salinity, g/kg | Date | Electrical Conductivity, μS/cm | ξ, % | V, mL/m2/day | I, kWh/m2/day | Tair, °C | ||
|---|---|---|---|---|---|---|---|---|
| Feed Water | Distilled Water | Brine | ||||||
| 0 | 7 July 2022 | 391.0 | 4.3 | 459.0 | 98.89 | 1796 | 2.72 | 22.1 |
| 0 | 18 July 2022 | 398.3 | 6.0 | 498.0 | 98.49 | 4070 | 5.08 | 23.7 |
| 20 | 19 July 2022 | 31,600.0 | 5.3 | 42,900.0 | 99.98 | 3694 | 4.51 | 26.4 |
| 20 | 20 July 2022 | 30,633.3 | 6.7 | 45,800.0 | 99.98 | 3977 | 4.73 | 29.0 |
| 40 | 21 July 2022 | 53,500.0 | 7.0 | 69,000.0 | 99.99 | 4167 | 4.99 | 29.1 |
| 40 | 22 July 2022 | 52,800.0 | 6.3 | 55,633.3 | 99.99 | 2416 | 3.23 | 27.5 |
| No. | Date | PCM | mPCM, kg | I, kWh/m2 | I30, kWh/m2 | Tair, °C | vavg, m/s | Tw,max, °C | TPCM,max, °C | V, mL/m2/day | V/I, mL/kWh | V/I30, mL/kWh |
|---|---|---|---|---|---|---|---|---|---|---|---|---|
| 1 | 10 May 2022 | - | 0.0 | 5.90 | 6.85 | 19.6 | 0.30 | 75.1 | - | 4393 | 745 | 641 |
| 2 | 11 May 2022 | - | 0.0 | 4.79 | 5.10 | 22.7 | 0.36 | 70.3 | - | 3072 | 641 | 602 |
| 3 | 18 May 2022 | - | 0.0 | 6.69 | 7.59 | 17.4 | 0.35 | 75.1 | - | 4769 | 713 | 628 |
| 4 | 19 May 2022 | - | 0.0 | 6.44 | 7.26 | 21.3 | 0.30 | 79.6 | - | 5014 | 779 | 691 |
| 5 | 5 September 2022 | - | 0.0 | 3.15 | 3.60 | 19.7 | 0.22 | 65.3 | - | 1889 | 600 | 525 |
| 6 | 25 July 2022 | 1 | 1.0 | 6.13 | 6.87 | 24.9 | 0.16 | 80.4 | 84.1 | 4783 | 780 | 696 |
| 7 | 27 July 2022 | 1 | 1.0 | 3.55 | 3.59 | 22.4 | 0.14 | 59.4 | 60.4 | 2459 | 693 | 685 |
| 8 | 9 August 2022 | 1 | 2.5 | 3.85 | 4.21 | 22.6 | 0.42 | 59.1 | 74.1 | 2315 | 601 | 550 |
| 9 | 10 August 2022 | 1 | 2.5 | 4.75 | 5.34 | 22.7 | 0.38 | 63.3 | 76.3 | 2742 | 577 | 513 |
| 10 | 17 August 2022 | 1 | 2.5 | 3.27 | 3.54 | 24.9 | 0.23 | 59.8 | 74.5 | 1795 | 549 | 507 |
| 11 | 18 August 2022 | 1 | 5.0 | 4.60 | 5.22 | 25.2 | 0.34 | 66.2 | 73.4 | 2601 | 565 | 498 |
| 12 | 25 August 2022 | 1 | 5.0 | 3.73 | 4.21 | 24.3 | 0.23 | 60.7 | 63.6 | 1938 | 520 | 461 |
| 13 | 30 August 2022 | 1 | 5.0 | 2.64 | 2.95 | 21.3 | 0.17 | 52.8 | 59.9 | 1084 | 411 | 368 |
| 14 | 27 June 2022 | 2 | 1.0 | 5.45 | 5.81 | 27.0 | 0.29 | 80.0 | 84.5 | 4168 | 765 | 718 |
| 15 | 30 June 2022 | 2 | 1.0 | 4.74 | 4.97 | 28.6 | 0.14 | 78.4 | 82.7 | 3836 | 809 | 772 |
| 16 | 4 July 2022 | 2 | 1.0 | 5.52 | 5.82 | 26.7 | 0.00 | 79.1 | 82.3 | 4308 | 780 | 741 |
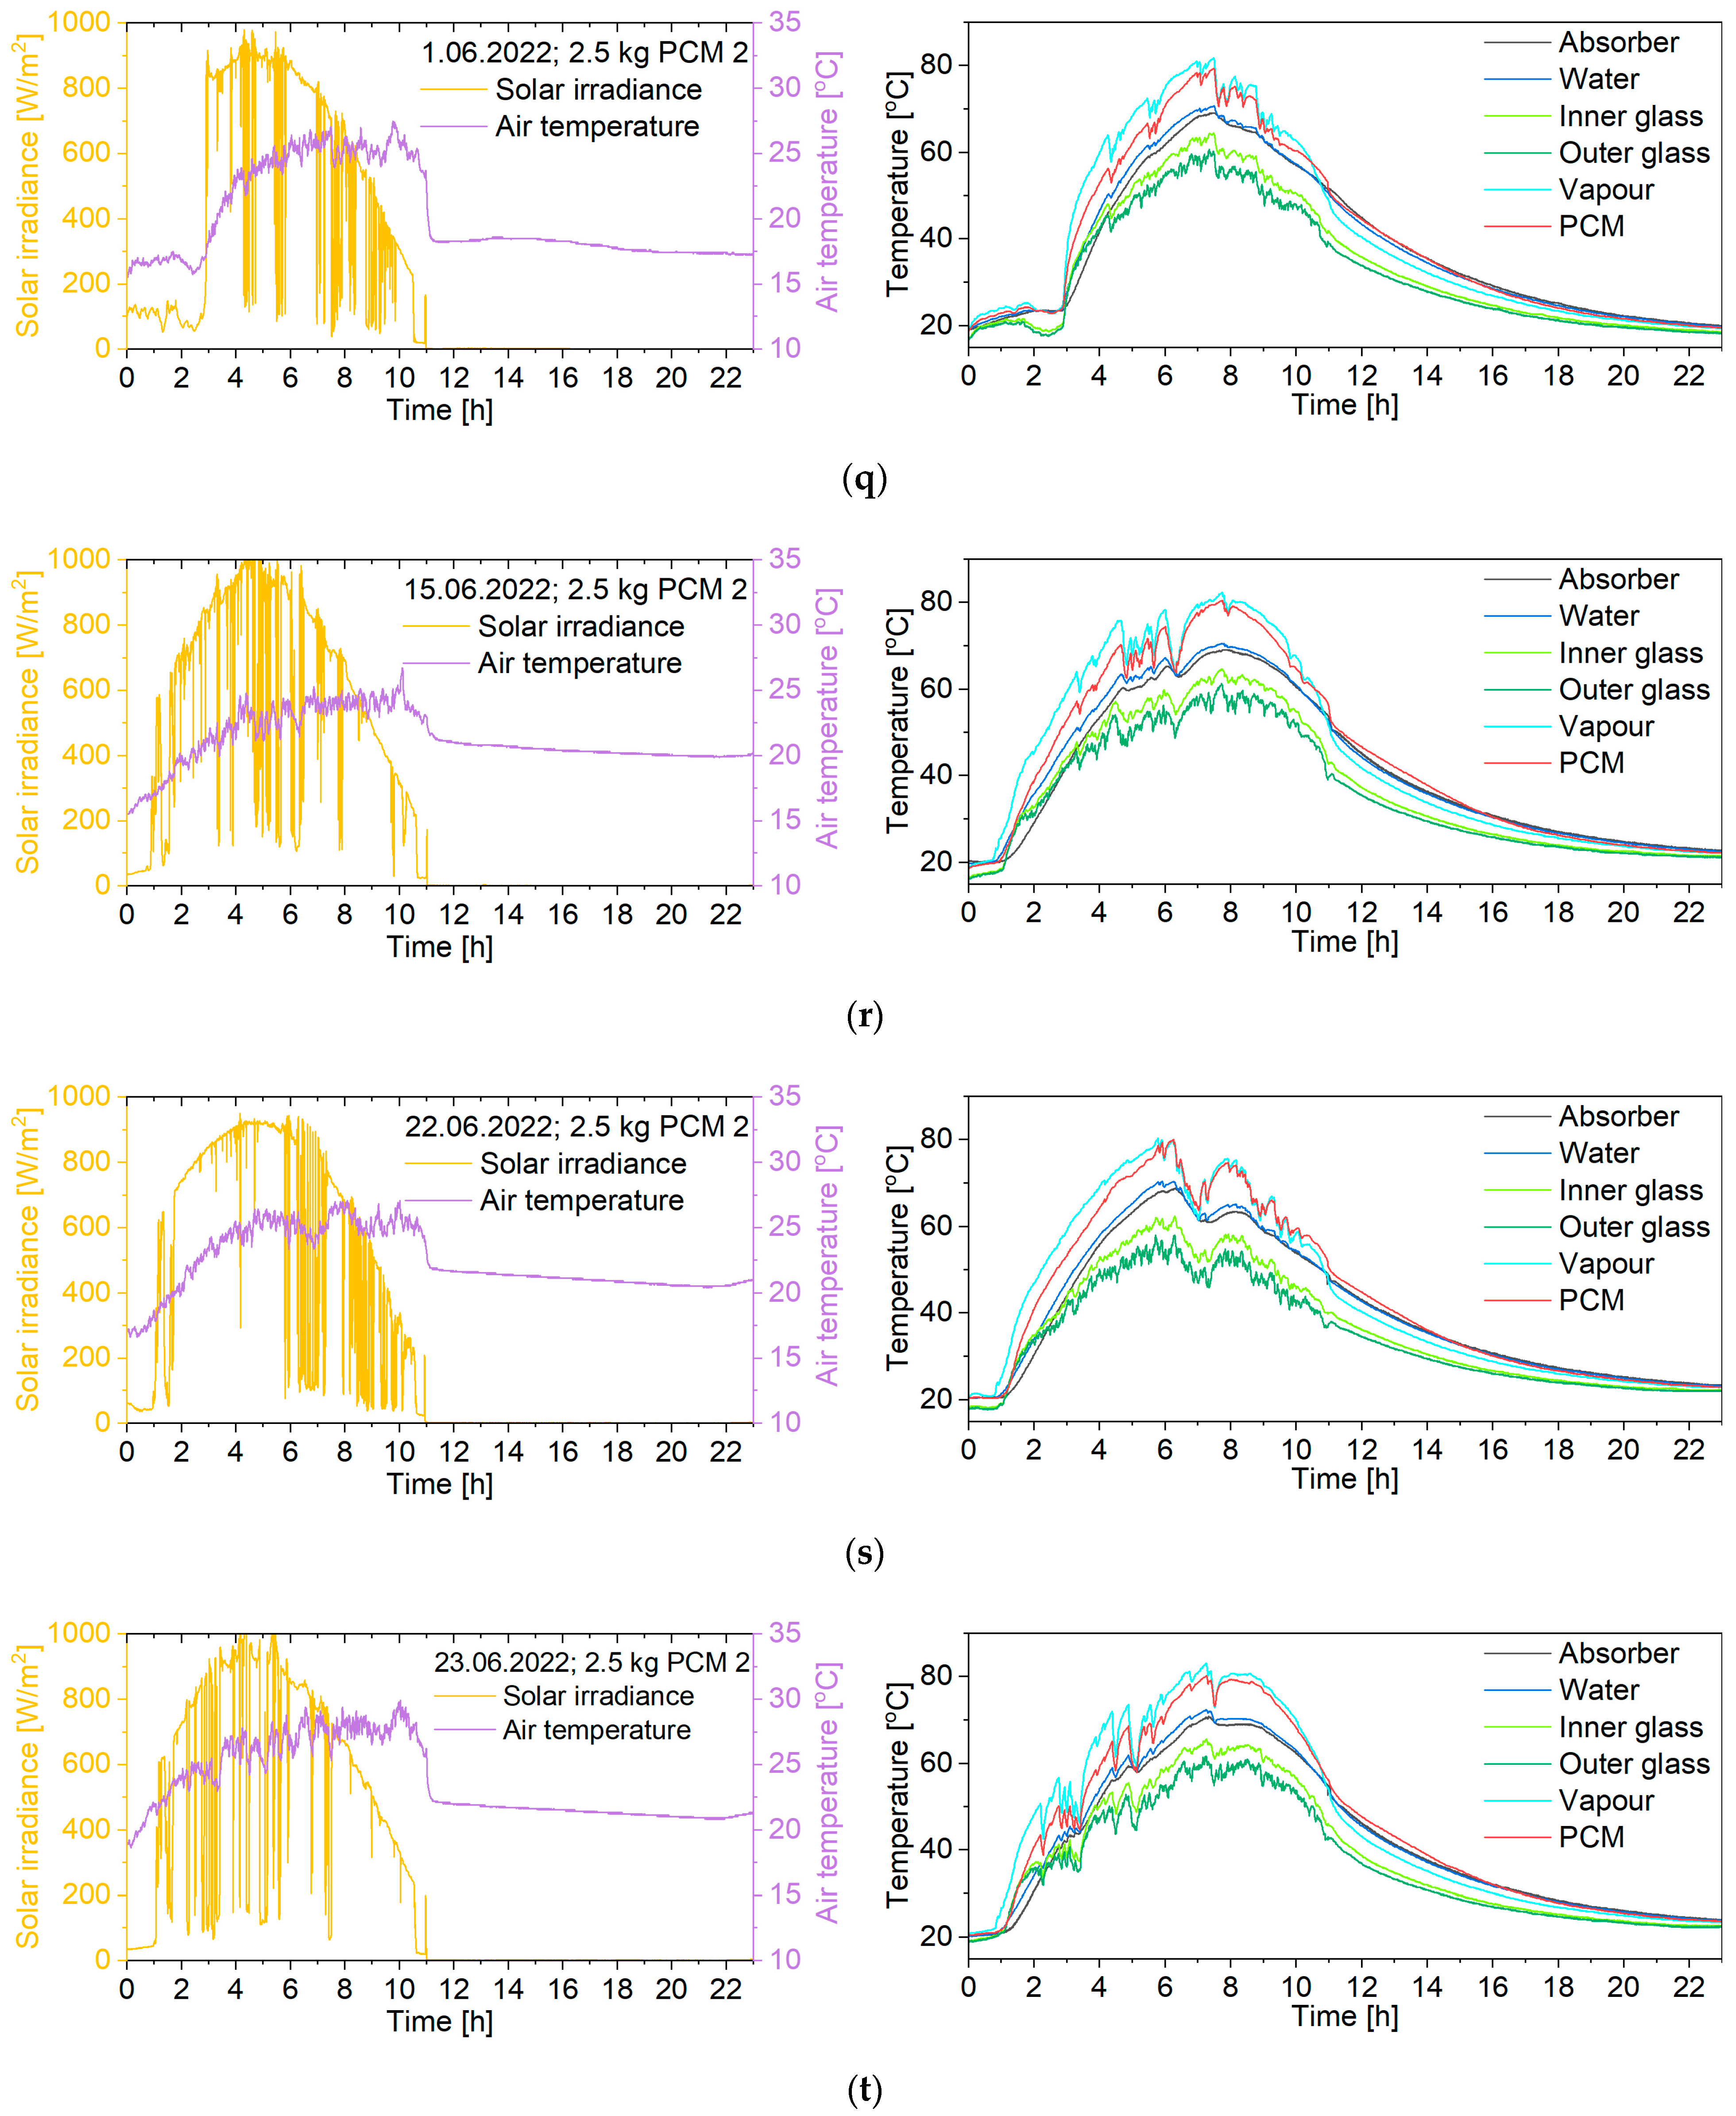
| 17 | 1 June 2022 | 2 | 2.5 | 5.15 | 5.74 | 20.0 | 0.34 | 70.7 | 79.3 | 3164 | 614 | 552 |
| 18 | 15 June 2022 | 2 | 2.5 | 6.05 | 6.52 | 21.1 | 0.30 | 70.5 | 80.4 | 4018 | 664 | 616 |
| 19 | 22 June 2022 | 2 | 2.5 | 5.88 | 6.25 | 22.3 | 0.41 | 70.4 | 80.0 | 3784 | 644 | 606 |
| 20 | 23 June 2022 | 2 | 2.5 | 5.91 | 6.38 | 23.5 | 0.32 | 72.3 | 80.2 | 3737 | 632 | 585 |
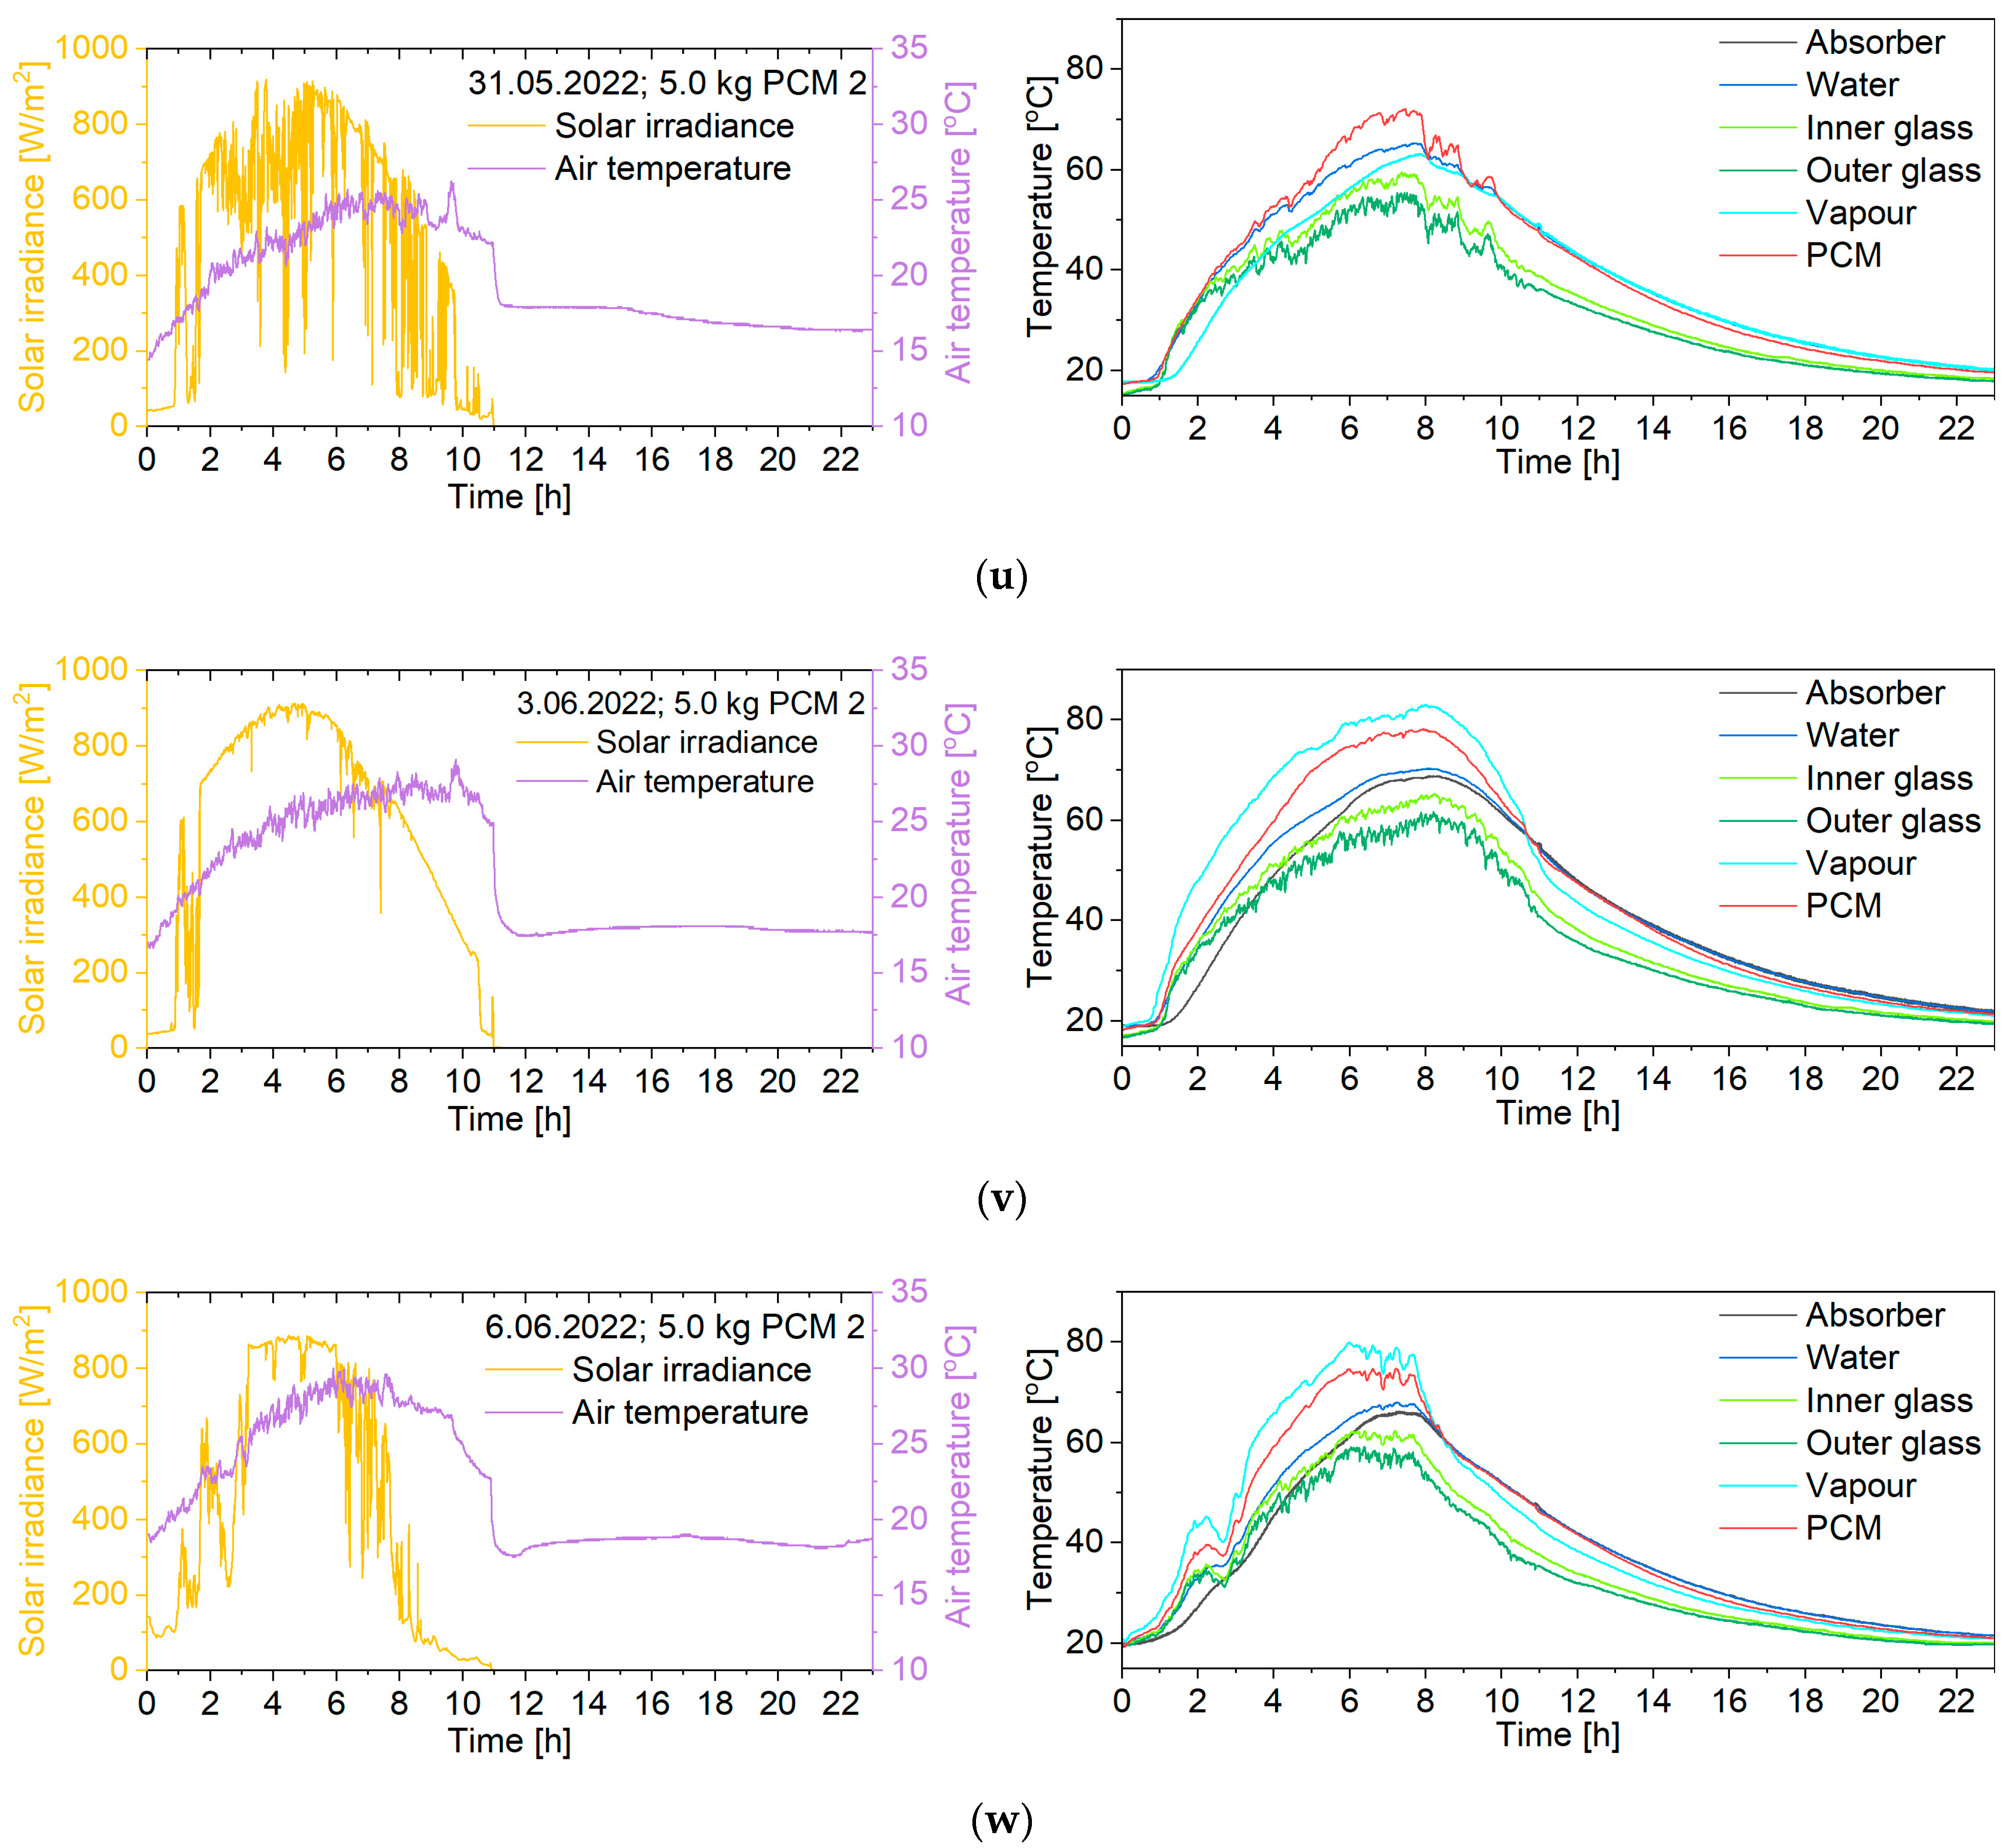
| 21 | 31 May 2022 | 2 | 5.0 | 5.32 | 5.75 | 19.5 | 0.34 | 65.2 | 72.0 | 3162 | 594 | 550 |
| 22 | 3 June 2022 | 2 | 5.0 | 6.44 | 7.05 | 21.1 | 0.40 | 70.2 | 78.0 | 3873 | 601 | 550 |
| 23 | 6 June 2022 | 2 | 5.0 | 4.74 | 5.07 | 21.9 | 0.27 | 67.9 | 74.7 | 2739 | 578 | 540 |
| Ref. | Location | Date | I, kWh/m2 | Tair, °C | V, mL/m2/day | Remarks |
|---|---|---|---|---|---|---|
| Nafey et al. [22] | Suez City, Egypt | January | 3.85 | 23.6 | 2350 | Different water depths (from 1.0 cm to 3.0 cm) |
| February | 4.56 | 23.7 | 2810 | |||
| March | 5.75 | 24.0 | 3490 | |||
| April | 6.52 | 24.4 | 4750 | |||
| May | 7.71 | 28.5 | 5830 | |||
| June | 7.63 | 31.0 | 5900 | |||
| July | 7.41 | 32.4 | 5390 | |||
| August | 6.94 | 34.0 | 5380 | |||
| September | 6.45 | 30.8 | 4960 | |||
| October | 5.59 | 28.7 | 4100 | |||
| November | 4.20 | 25.0 | 2400 | |||
| December | 4.00 | 24.0 | 2500 | |||
| Nagaraju et al. [37] | Vijayawada, Andhra Pradesh, India | n.d. | n.d. | n.d. | 907 | - |
| n.d. | n.d. | n.d. | 1043 | |||
| n.d. | n.d. | n.d. | 1050 | |||
| Kumar et al. [38] | Coimbatore, Tamilnadu, India | 19 April 2019 | 6.92 | 31.5 | 5467 | No PCM |
| 19 April 2019 | 6.92 | 31.5 | 8267 | With 5 kg of PCM | ||
| 19 April 2019 | 6.92 | 31.5 | 9133 | With 5 kg of nano-enhanced PCM | ||
| Vaithilingam and Esakkimuthu [21] | Chennai, India | 13 March 2013 | 6.255 | 32.4 | 2970 | Different water depths (from 1.0 cm to 2.5 cm) |
| 22 March 2013 | 6.261 | 34.1 | 2666 | |||
| 4 April 2013 | 6.237 | 35.0 | 2494 | |||
| 18 April 2013 | 6.249 | 35.9 | 1840 | |||
| Kumar and Prakash [39] | India | n.d. | 8.64 | 35.8 | 1444 | Water depth of 3 cm, no PCM |
| n.d. | 2163 | Water depth of 3 cm, with 17 kg of PCM | ||||
| n.d. | 7.90 | 39.2 | 1062 | Water depth of 6 cm, no PCM | ||
| n.d. | 1159 | Water depth of 6 cm, with 17 kg of PCM | ||||
| n.d. | 7.52 | 35.8 | 736 | Water depth of 9 cm, no PCM | ||
| n.d. | 949 | Water depth of 9 cm, with 17 kg of PCM | ||||
| n.d. | 7.99 | 35.7 | 728 | Water depth of 12 cm, no PCM | ||
| n.d. | 737 | Water depth of 12 cm, with 17 kg of PCM | ||||
| n.d. | 8.64 | 37.2 | 1035 | Water depth of 15 cm, no PCM | ||
| n.d. | 1039 | Water depth of 15 cm, with 17 kg of PCM | ||||
| Jahanpanah et al. [40] | Tehran, Iran | 3 October 2019 | n.d. | n.d. | 2917 | No PCM |
| 4 October 2019 | 6.7 | n.d. | 3150 | With 3 kg of PCM | ||
| 5 October 2019 | n.d. | n.d. | 3800 | With 6 kg of PCM | ||
| Hameed [41] | Najaf, Iraq | 16 October 2021 | 4.7 | 30.2 | 2218 | - |
| Ali et al. [20] | Karachi, Pakistan | January 2022 | n.d. | n.d. | 1719 | Results for representative days of the month for the year 2022; simulations previously validated by experimental studies. |
| February 2022 | n.d. | n.d. | 2021 | |||
| March 2022 | 5.8 | n.d. | 2046 | |||
| April 2022 | n.d. | n.d. | 2010 | |||
| May 2022 | n.d. | n.d. | 2104 | |||
| June 2022 | 6.3 | n.d. | 1732 | |||
| July 2022 | n.d. | n.d. | 1598 | |||
| August 2022 | n.d. | n.d. | 1587 | |||
| September 2022 | 6.3 | n.d. | 2125 | |||
| October 2022 | n.d. | n.d. | 1939 | |||
| November 2022 | n.d. | n.d. | 1667 | |||
| December 2022 | 3.6 | n.d. | 1519 | |||
| This work | Krakow, Poland | 10 May 2022 | 5.90 | 19.6 | 4393 | No PCM |
| 11 May 2022 | 4.79 | 22.7 | 3072 | |||
| 18 May 2022 | 6.69 | 17.4 | 4769 | |||
| 19 May 2022 | 6.44 | 21.3 | 5014 | |||
| 5 September 2022 | 3.15 | 19.7 | 1889 | |||
| 25 July 2022 | 6.13 | 80.4 | 4783 | with 1.0 kg of PCM 1 | ||
| 27 July 2022 | 3.55 | 59.4 | 2459 | with 1.0 kg of PCM 1 | ||
| 9 August 2022 | 3.85 | 59.1 | 2315 | with 2.5 kg of PCM 1 | ||
| 10 August 2022 | 4.75 | 63.3 | 2742 | with 2.5 kg of PCM 1 | ||
| 17 August 2022 | 3.27 | 59.8 | 1795 | with 2.5 kg of PCM 1 | ||
| 18 August 2022 | 4.60 | 66.2 | 2601 | with 5.0 kg of PCM 1 | ||
| 25 August 2022 | 3.73 | 60.7 | 1938 | with 5.0 kg of PCM 1 | ||
| 30 August 2022 | 2.64 | 52.8 | 1084 | with 5.0 kg of PCM 1 | ||
| 27 June 2022 | 5.45 | 80.0 | 4168 | with 1.0 kg of PCM 2 | ||
| 30 June 2022 | 4.74 | 78.4 | 3836 | with 1.0 kg of PCM 2 | ||
| 4 July 2022 | 5.52 | 79.1 | 4308 | with 1.0 kg of PCM 2 | ||
| 1 June 2022 | 5.15 | 70.7 | 3164 | with 2.5 kg of PCM 2 | ||
| 15 June 2022 | 6.05 | 70.5 | 4018 | with 2.5 kg of PCM 2 | ||
| 22 June 2022 | 5.88 | 70.4 | 3784 | with 2.5 kg of PCM 2 | ||
| 23 June 2022 | 5.91 | 72.3 | 3737 | with 2.5 kg of PCM 2 | ||
| 31 May 2022 | 5.32 | 65.2 | 3162 | with 5.0 kg of PCM 2 | ||
| 3 June 2022 | 6.44 | 70.2 | 3873 | with 5.0 kg of PCM 2 | ||
| 6 June 2022 | 4.74 | 67.9 | 2739 | with 5.0 kg of PCM 2 |
Disclaimer/Publisher’s Note: The statements, opinions and data contained in all publications are solely those of the individual author(s) and contributor(s) and not of MDPI and/or the editor(s). MDPI and/or the editor(s) disclaim responsibility for any injury to people or property resulting from any ideas, methods, instructions or products referred to in the content. |
© 2025 by the authors. Licensee MDPI, Basel, Switzerland. This article is an open access article distributed under the terms and conditions of the Creative Commons Attribution (CC BY) license (https://creativecommons.org/licenses/by/4.0/).
Share and Cite
Mika, Ł.; Radomska, E. Solar Energy to Water Desalination: Long-Term Experimental Studies of Solar Still in Poland. Energies 2025, 18, 1070. https://doi.org/10.3390/en18051070
Mika Ł, Radomska E. Solar Energy to Water Desalination: Long-Term Experimental Studies of Solar Still in Poland. Energies. 2025; 18(5):1070. https://doi.org/10.3390/en18051070
Chicago/Turabian StyleMika, Łukasz, and Ewelina Radomska. 2025. "Solar Energy to Water Desalination: Long-Term Experimental Studies of Solar Still in Poland" Energies 18, no. 5: 1070. https://doi.org/10.3390/en18051070
APA StyleMika, Ł., & Radomska, E. (2025). Solar Energy to Water Desalination: Long-Term Experimental Studies of Solar Still in Poland. Energies, 18(5), 1070. https://doi.org/10.3390/en18051070