Abstract
Hybrid PVT systems simultaneously produce electrical energy using photovoltaic technology and thermal energy using a heat extraction method that collects induced heat from the module. The purpose of this work is to establish a PVT system based on characterization, efficiency study, and performance analysis for both an electrical and a thermal system. A mathematical analysis of the electrical, thermal, and optical model is performed to establish the proposed system. Three types of heat exchanger pipes, including stainless steel, aluminum, and copper, are considered for a heat transfer analysis of the system. The results include temperature profiling, a comparison of the PVT system’s different components, and an overall output and efficiency study for all of the mentioned pipes. Results show that the obtained electrical and thermal efficiency for stainless steel is 0.1653 and 0.237, respectively, for aluminum it is 0.16515 and 0.2401, respectively, and for copper it is 0.16564 and 0.24679, respectively. After comparison, it was found that the overall efficiency for stainless steel is 0.40234, for aluminum is 0.40526, and for copper is 0.41244. Thus, this study will enhance the opportunity to provide an effective hybrid PVT energy management system.
1. Introduction
All aspects of the economy, society, environment, and the improvement of living standards are entwined with energy. With the increase of population, which is around 7.9 billion, the need for energy is growing rapidly, and is hardly being fulfilled. With the growing energy demand, we are becoming more reliant on fossil fuels, which leads to a quicker shortage of existing fossil fuels and the release of greenhouse gas emissions. Therefore, the world is moving towards the production and development of renewable energy [,]. Employing efficient energy management strategies and utilizing renewable energy sources are key to achieving this goal. A significant focus in current energy studies revolves around minimizing energy consumption and lowering the emissions of carbon dioxide, which is an unfavorable greenhouse gas []. Many research projects and activities have been motivated by this important environmental goal [,]. To overcome and emphasize this issue, two significant strategies are provided. The use of clean and renewable energy resources, such as solar, hydro, or wind, that has the ability to minimize the adverse environmental impacts, is considered as the first solution [,,]. Effective energy management is considered a second solution that will accelerate responsible and effective energy utilization, further promoting sustainability and green energy [,].
By 2050, the world’s power consumption is expected to be tripled due to improved living conditions and electricity dependency []. The need for affordable, renewable energy sources is higher than before due to the current world situation and the motivation towards a low-carbon future energy supply. Solar energy usage can secure a sustainable energy supply for future generations, which also helps to drastically lower global carbon emissions []. Additionally, it is abundant, clean, and renewable. The Earth receives 173,000 TW of solar power per second which is more than 10,000 times higher than the world’s daily global energy requirements [,]. Thus, solar energy can effectively satisfy the world’s energy needs. Nonetheless, due to the developing solar technology, there are some other issues to be solved, like storage, efficiency, maintenance, and material []. Additionally, the sun does not provide continuous sunlight, resulting in unreliability in solar energy production.
The use of solar energy will not be proper and efficient without solar technology. Photovoltaic (PV) panels, collector technology, and solar stills are all a part of solar technology []. Solar energy technology integration is beneficial for both rural and urban locations, including agriculture facilities in rural areas []. According to the research study in [], it was discovered that energy expenses can be minimized by 15% in a greenhouse with a 25% photovoltaic covering ratio.
Sunlight is converted into electricity using photovoltaic cells through the photovoltaic effect. Two types of silicon material, one p-type and the other n-type, are typically used for photovoltaic cells []. The effectiveness of solar panels in converting sunlight into electricity is not high, with the typical silicon PV cell having an efficiency of only about 20% [,]. Nevertheless, despite its immense potential, PV technology has particular challenges that reduce its stability and efficient generation. Photovoltaic panels frequently have low conversion efficiency caused by several factors, like temperature [,], shading [], dust [], and reflection.
In a PV cell, only visible light is converted to electrical energy, and the rest of the light, particularly infrared light, transforms into heat/thermal energy. PV panels suffer from degradation from this excess heat, which shortens their lifespan and performance, reducing overall output and efficiency. The vast majority of solar panels undergo testing at 25 °C under Standard Test Conditions (STC). The output efficiency decreases by roughly 10% to 25% with the increase in temperature [,]. It is therefore essential to extract the excessive heat using cooling techniques or reliable heat extraction methods [,].
1.1. Background
A PVT system is a hybrid and innovative energy system that generates thermal and electrical energy by combining photovoltaic and solar thermal modules. It uses a single, integrated structure to generate both heat energy and electricity. It consists of a PV panel, heat exchanger equipment, like a heat pipe, heat transfer fluid (HTF), a pump, and other relevant components. In a hybrid PVT system, efficiency is increased as the PV panels produce electricity, and the working fluid absorbs thermal energy by heat extraction (HE), and then provides that electricity to end users. In addition to regulating the characteristics of both systems, it is less expensive than utilizing PV or thermal panels independently [].
A PVT system is designed such that it can capture the generated excess heat by the panel, resulting in a lower module temperature, and thus in improved overall energy conversion efficiency. In this type of system, the use of a cooling fluid for heat recovery is the most notable and reliable aspect. Different kinds of fluids can be utilized as working fluids to cool the PV panel through the heat exchanger equipment. Water is commonly used as a cooling fluid in such systems; however, performance improvement is not as significant as expected due to its low thermal conductivity. Because of the improved thermal characteristics over traditional fluids, which are believed to be a factor in their higher heat transfer capacity, nanofluids have recently gained better attention [].
Environmental conditions, design and construction, installation techniques, operation and maintenance, and other internal and external elements can all have an impact in the system’s efficiency []. The system’s performance is significantly influenced by a number of variables, including the temperature of the outside air, irradiance, mass flow rate, and the module temperature []. That is why many academic researchers are exploring the optimal operating parameters to establish an energy efficient system. To obtain the overall output of the PVT system, internal and external parameter sensitivity analysis is also required. Thermal output greatly depends on the used HTF, as well as the heat exchanger pipe/material used in the system.
Not many variations of PVT systems have been created and introduced to the market in recent decades despite extensive research having already been conducted. However, uncertainties still exist because of the PVT systems parameter sensitivity, design analysis, and proper selection of HE materials. The existing PVT devices are comparatively costly and not so flexible in terms of design pattern. Additionally, no specific comparison of various heat exchanger pipes is provided in the literature. A conventional PVT system is mostly focused on thermal energy improvement but, in this study, both thermal and electrical energy with improved efficiency are analyzed.
1.2. Literature Survey
Photovoltaic (PV) panels are unable to convert a portion of the total solar irradiation into electrical energy, with a significant amount of energy transformed into heat. This excess heat reduces the performance of PV panels. In [], the authors analyzed various cooling techniques, including phase change materials (PCMs), thermoelectric cooling, and nanotube cooling. Among these, water cooling, especially through spraying from both sides of the panel, is highlighted as an efficient method to lower panel temperatures and improve performance.
In [], an air-heating technique was discussed, which extracts hot air generated by the PV panels. While PV panels convert solar irradiation into electricity, a substantial portion is converted into heat. The study showed that the back of the PV panel can be 5.5 °C higher than the ambient temperature. Utilizing a PV-air thermal collector (ATC) hybrid system, the electrical efficiency could be increased by 11.16%, thermal efficiency by 45.27%, and the total efficiency reached 56.44%. Despite the efficiency improvements, the implementation of this technique in real-life conditions is challenging, due to structural limitations, such as the use of a wooden frame.
In [], the authors investigated three cooling techniques for PVT systems, using air, fluid, and PCMs as cooling media. These approaches demonstrated an improved performance for PV/T systems. However, the study did not incorporate any heat-extracting materials, and no significant variations in the effectiveness of different HE metals were presented in the review.
Ref. [] analyzed PVT system data collected from panels and steady water used for cooling. Both experimental and simulation data were compared. Using thermocouple sensors, the study captured detailed system information from layers such as the solar panel, aluminum thermal plate, and heatsinks. The findings reveal that effective thermal transfer between system layers enhances cooling and boosts PV efficiency, particularly under non-optimal conditions.
The idea of employing cooling techniques in PV systems results from excessive temperature and associated efficiency decrease in the system. An analysis of electrical efficiency due to the increase of cell temperature was discussed in []. In this study, the experimental results were obtained using the given cooling fluids. Use of phase change materials and nanofluids were considered to cool the system to provide effective results. Additionally, it also provided thermal efficiency based on mass flow rate of the cooling fluid. A comparison of using two types of cooling fluids, namely PCMs and nanoparticles, was considered, but no effective thermal output variation for heat exchanger part was provided.
A mathematical model based on numerical analysis including electrical and thermal modeling was provided in []. Parameter sensitivity and variation effects for a few external parameters and other electrical model related parameters of PVT system was also studied. An extensive analysis of electrical power output due to these variations were provided in the results section. However, related thermal parameters and optical modeling, and its effect on the overall output, was not discussed. Additionally, thermal modeling and thermal parameters sensitivity, namely heat exchanger, HTF, and temperature profiling, were not analyzed.
Research on PV module temperature dynamics was presented in []. The use of heat pipes and an efficiency evaluation in different conditions was analyzed in [], where a yearly efficiency evaluation for the used heat pipes in various locations was studied. Waste heat recovery in a system, with an experimental analysis and a decision-based study of heat pipes, was discussed in []. A double micro-channel heat exchanger pipe for hybrid PVT system was studied in [], which also established a mathematical model including an internal and external parameter sensitivity analysis.
Detailed optimization and practical application of hybrid PVT system was provided in []. It mainly discussed the dynamic behavior of a PVT system based on various internal and external factors responsible for performance and efficiency improvement. Optimization of a PVT system in partially humid weather situations was discussed in []. A design of experiment (DOE) optimization technique was used to obtain and optimize the electrical and thermal performance. This optimization technique was studied considering the parameters of irradiance, convection heat transfer coefficient. and flow rate. A heat pipe-based PVT system’s improvements, optimization, and classification were analyzed in []. Performance optimization and evaluation of various types of PVT system was also compared and studied in this study.
1.3. Motivations and Contributions
PVT system modeling and parameter sensitivity analysis [] shows the various effects on the overall output. In [], mathematical modeling did not include optical characteristics, like reflection and refraction, as they were overlooked due to simplification. An optimal, energy efficient PVT system still needs to be developed to overcome the ongoing challenges. In this study, every possible parameter related to the electrical, thermal, and optical parameters of a PVT system for modeling purpose is discussed and taken into consideration. The reported system also provides a simplified method to evaluate a hybrid PVT system using provided mathematical models.
Hybrid PVT system modeling includes a performance study by thermal and electrical model analysis. It provides a general overview of the hybrid PVT system, including structural and operational methods. It will make a significant contribution in the research community. In the literature, no simplified PVT system with modeling and performance analysis is provided. Thermal analysis of a PVT system is discussed in many works with different types of HTF and different cooling techniques. The use of heat exchanger pipes is prioritized in different research works for PVT, but no significant or detailed study is provided and no comparison for using different heat absorption pipes is discussed. The impact of using different types of heat exchanger pipe is discussed in several research works but no specific impact/output in specific parameters are studied.
The main contribution of the proposed work is the study and performance analysis of a hybrid PVT system based on several components. It provides an updated and energy efficient hybrid PVT system. Various heat exchanger pipes are used to analyze the system behavior. It simulates three types of heat exchanger pipes for thermal performance analysis. The output and efficiency variation due to the use of stainless steel, aluminum, and copper as heat exchanger pipes in the PVT system is briefly analyzed. The results identify the most effective heat exchanger, demonstrating that copper is an excellent candidate for heat extraction from the panel, thereby enhancing the performance of the PVT system.
This paper examines the latest and innovative advancements in PVT technology. The following main sections and subsections are the main focus of this study. Modeling and analysis of a hybrid PVT system based on a conceptual study and performance analysis is discussed in Section 2. It also includes the mathematical modeling of an electrical, thermal, and optical analysis of the system. In Section 3, a brief and detailed thermal analysis of the PVT system is shown. The functional methods of the proposed PVT system are also described, including input parameters and heat transfer analysis. The obtained results and related discussions are provided in Section 4. The use of three different types of heat exchanger pipes is discussed, the impact and efficiency variations are also discussed. Finally, the conclusions, future work, and key observations are summarized in Section 5.
2. Hybrid PVT System Modeling and Analysis
The hybrid photovoltaic thermal system was developed to increase energy efficiency by extracting heat as thermal energy from the PV panel, in addition to increasing electrical energy efficiency from the PV panel. This concept was first introduced by Kern and Russel in the mid-1970s []. The PVT system is not only capable of increasing electrical energy but produces thermal energy that improves the system’s performance by increasing overall output and efficiency, which is impossible in the PV system alone []. The heat extraction or removal of heat may occur using air flow or any other fluid, including phase change materials.
PVT panels serve as photovoltaic and thermal panels [,], where ducts/pipes are integrated within or beneath the module. These pipes are typically filled with air, HTF, or any other phase change material. The heated fluid is sent to a hot water storage reservoir for domestic or industrial consumer use []. The optimal efficiency of a PV panel is obtained after the heat extraction/cooling cycle [].
Figure 1 provides an overview of a hybrid PV system []. The two parts that produce energy from solar irradiance are photovoltaic and thermal, which requires a PV panel and a thermal panel separately. Finally, it is also shown that a hybrid PVT system consists of both a photovoltaic part and a thermal part that produces electricity and thermal power simultaneously. It is cost-effective, efficient, and requires less space than the traditional PV systems.
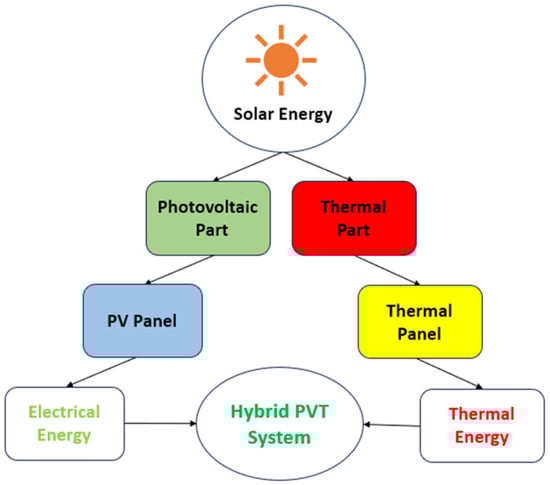
Figure 1.
General outline of the Hybrid PVT System.
The proposed schematic of the hybrid PVT system for the analysis and systematic overview, including an efficiency and performance analysis, is shown in Figure 2 []. It describes that there are two main parts in this system: the photovoltaic part; and the thermal part. The PV part produces electricity by converting irradiance from sunlight. The produced electrical energy can be sent to a load and/or stored locally. Due to the less efficient conversion system in the PV part, the remaining incident energy is converted to thermal energy. The thermal part of the PVT system extracts this heat using a heat extraction pipe and sends it to the consumption reservoir.
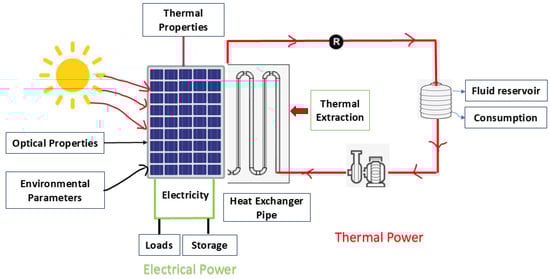
Figure 2.
Illustration of the proposed Hybrid PVT System.
The affordability of a PVT system is an important factor to be considered as it is related with the type of PV panel, the type of heat extraction pipe (HEP), the kind of HTF, and the use of other components, such as a pump, water, or a thermal energy reservoir.
Research on PVT systems is still in progress despite having started in the early 1970s. It is still a challenge to establish an optimum and efficient low-cost PVT system that can provide maximum output and be sufficiently robust in adverse climate conditions []. The developed model was analyzed in a MATLAB/Simulink R2020a environment based on []. The structure of the simulated model is combined with the electrical part, the thermal part, and the thermal liquid part, as shown in Figure 3.
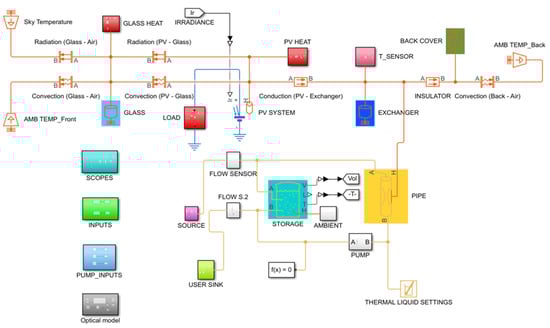
Figure 3.
PVT system simulation model.
2.1. PVT System’s Performance Modeling
Performance monitoring, evaluation, and efficiency analysis of the electrical part of the hybrid PVT system is less complex, as the output electrical energy is normally used instantaneously, and large-scale storage is not mandatory. It is associated with electrical components, storage, heat pipes, additional heaters, pumps, and many other subsystems []. The appropriate location, tilt angle, and other design parameters must be selected in order to achieve overall maximum benefits from that system []. In a PVT system the overall efficiency is as follows [,,]:
where the overall electrical efficiency is and the overall thermal efficiency is . Thermal efficiency can be calculated as follows [,]:
where the useful heat is , the solar irradiance is , and the area of the chosen panel is . For a standard solar flat plate collector, the thermal efficiency of that PVT system is as follows []:
where is the useful heat, the intensity of irradiance is , the fluid mass flow rate is , the fluid’s specific heat is , and the temperature difference is . The useful heat equation is as follows:
Conventionally, the electrical efficiency is as follows []:
where and are the current and voltage of the panel, respectively, and is the irradiance from the solar spectrum. Conversely, by incorporating the thermal energy generated within the panel, the temperature-dependent electrical efficiency of the panel is described as follows []:
where is the reference efficiency, the panel temperature is , the PV panel reference temperature is , and the temperature coefficient is = 0.0045 °C−1. The addition of more variables made this equation more complicated for the developed numerical model. The maximum power of the PVT system is calculated using the following []:
where is the voltage at maximum power and is the current at maximum power. The total electrical power efficiency of a PV cell is obtained by the following []:
The daily overall electrical energy obtained in a PVT system is given by the following []:
where is the daily irradiance, is the module efficiency, and is the wire efficiency.
Overall output calculation, efficiency analysis, and performance studies are fundamental in the development of a hybrid PVT system. Important parameters to be considered for the PVT system’s efficiency and performance analysis are the electrical and thermal outputs, which are also dependent on other variables. For both cases, PV panel geometrical structures, incident radiation, or irradiance value and temperature variables are significant. For a deeper understanding of the electrical output of the proposed system, a modelling approach and parameter relationship of the electrical model is described in the next section.
2.2. Electrical Modeling of the PVT System
The electrical modeling and analysis are mainly focused on the upper part of the PVT system. It is composed by a PV panel which is responsible for electrical energy production. Electrical modeling is required for the electrical power output, efficiency, and performance analysis. An equivalent electrical circuit model of five parameters is considered here. The schematic diagram of the electrical equivalent circuit for the PV panel is shown in Figure 4 [].
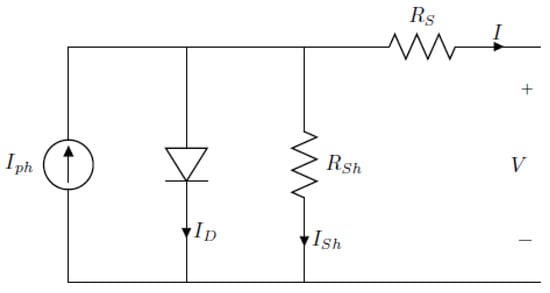
Figure 4.
PVT system electrical equivalent model.
In this model, the photocurrent is denoted by , the diode current is denoted by , the series and shunt resistance are and , respectively, the shunt resistance current is denoted as , the diode saturation current is , the diode ideality factor is N, K is the Boltzmann constant, and the electron charge is q. The load current of this equivalent circuit is as follows []:
which can be rearranged into the following:
Finally, the output voltage and current relation for the solar cells connected in series is as follows:
where is the diode thermal voltage expressed as follows:
2.3. Thermal Modeling Analysis of PVT System
Conventional methods for measuring electronic junction temperature are not suitable for determining the temperatures within or on the surface of a PVT panel. Rather, these temperatures are estimated through the use of several other models. Considering a PVT system as a single system, the thermal heat balance equation (HBE) [] is obtained as the total absorbed heat () as follows []:
where is the converted heat energy and is the lost energy.
The provided electrical and thermal output by the PV panel is obtained from the incident irradiance and heat produced by the internal and external parameters. Heat losses occur in a PVT system through various heat transfer processes. Several parameters are responsible for the absorbed overall energy in the system, including the supporting materials of the panel, the direct and diffuse radiation, the materials’ physical and structural properties, as well as several other optical characteristics, like reflection, absorption, transmission, etc.
Heat transfer in a PVT module occurs in various ways, including heat radiation, heat conduction, and heat convection. Conduction takes place in the structural interfaces made of metals. Heat transfer by convection occurs at the boundary where the PVT module interacts with the surrounding air. The total heat transfer by convection in a PVT panel is obtained as follows []:
where the ambient temperature is and the heat transfer coefficient is .
Heat transfer by radiation is obtained using the Stefan–Boltzmann law as follows []:
where the surface temperature and radiation temperature from the object is and , respectively, the surface emissivity is , the view factor is , and is the Stefan–Boltzmann constant. Considering a flat plate collector, a one-dimensional model which is in a steady state can be used to analyze both the thermal and electrical performance of the hybrid PVT system. Therefore, the modified Hottel–Willier equations are utilized for this purpose [,]. The generated heat energy due to incident radiation is determined as follows [,]:
where is the electrical efficiency, is the packing factor, is the solar absorptance, and is the glass transmissivity. The total thermal loss of the PVT system is determined by the following []:
where is the heat loss coefficient of the panel (absorber–ambient), the module’s electrical efficiency for a given reference temperature is , and the temperature coefficient of the PV cell is . The heat removal factor (HRF) is determined by the following [,,]:
where the mass flow rate of water is and the water specific heat is . Now, the PVT efficiency factor is determined by the following [,]:
where the tube’s distance of the tubes is W, the tube diameter of the inner part is , fin efficiency is , the bond width average is a, is the bond thermal conductance, and is the heat transfer coefficient due to forced convection. The useful heat gain formula for a flat plate PVT system is obtained as follows []:
The total loss coefficient in the PVT system is obtained as follows []:
where the top loss coefficient is , the bottom loss coefficient is , and the edge loss coefficient is .
As, and , Equation (22) can be rewritten as follows:
where the back thermal is , the thickness of back insulation is , and the edge area is .
Overall input energy is determined by the following []:
Additionally, the thermal efficiency of the system is calculated as follows []:
where the useful energy is and the input energy is .
For a domestic water heating-based PVT system, the value of temperatures in the input (cold) and output (hot) can be used to assess a counterflow heat exchanger. An effectiveness of heat transfer unit (NTU-) analysis is determined by the following [,]:
where the ratio of capacity is , the minimum hot fluid capacity is , the maximum hot fluid capacity is , the heat transfer unit number is , where the area of the exchanger is and the total heat transfer coefficient is U. Consequently, the solar energy that the storage tank receives is as follows [,]:
where the hot water temperature towards the heat exchanger is and the cold water temperature from the exchanger is . The temperature of the heat exchanger at the outlet is determined by the following [,]:
where is thermal energy supplied to tank and is the heat exchange capacity rate for hot fluid. The cold temperature of the heat exchanger at the outlet is determined by the following [,]:
where is the cold water capacity rate of fluid in the heat exchanger. It is necessary to integrate the energy balance over time in order to assess long-term performance. The household water heater’s loss to the ambient air is calculated as follows:
where the storage tank heat loss coefficient is , the surface area of storage tank is , is the starting temperature of storage tank, and is the outdoor dry bulb temperature. The amount of energy supplied by the household heaters is determined by the following [,]:
where the extracted heat from the storage tank to the load is , the water’s composition temperature is , and is the specific heat of the water. Subsequently, a well-mixed storage tank’s energy balance at any given time is as follows [,]:
where the water density is and the tank volume is .
The performance and efficiency analysis, including the thermal output of the PVT system, is obtained by using mathematical modeling and simulation techniques.
2.4. Optical Modeling of PVT System
To establish a complete and effective PVT system model, and for optimal output, it is eventually necessary to model and consider loss/gain due to optical properties of the PVT system. Mainly, the optical properties related to the glass cover of the PVT panel is considered for the evaluation and analysis purpose. The equations for reflection, absorption, and transmission coefficients are established based on Fresnel equations and other physical fundamentals. The Fresnel equations describe the behavior at the interface between two media, which are air to glass and glass to air. The reflection coefficients of parallel p-polarization for the first boundary from air to glass are as follows []:
where is the refractive index and is the incidence angle. Reflection coefficients for s-polarization (perpendicular polarization) are as follows []:
Effective reflection at the first boundary is determined by the following:
At the second boundary, effective reflection is determined by the following:
Equations (37)–(40) are based on the reflection coefficients that take part in the PVT system performance analysis. Transmission coefficients for both boundaries are also required to be determined.
Transmission at the first boundary is determined as follows:
Transmission at the second boundary is determined as follows:
The following is a model for the absorption-induced light attenuation inside the glass:
where the glass absorption coefficient is , the glass thickness is , and is the refraction angle inside the glass.
The effective coefficients are computed using the following recursive transmissions and reflections []. For transmission:
For reflection:
For absorption, according to energy conservation:
The interaction of light with the solar panel’s glass cover [] is governed by these given equations. A set of mathematical models of a hybrid PVT system is developed and demonstrated in this section. It discusses the PVT system’s performance analysis using a different mathematical model of a PVT module. The efficiency model is calculated using related electrical, thermal, optical, and other parameters.
3. Thermal Analysis of the PVT System
The most significant disadvantage of PV panels is that only a portion of solar irradiance can be converted into electrical energy, and the rest is converted into thermal energy that raises the temperature in the panel. PV cell electrical yield can drop by 0.1–0.5% with each 1 °C temperature rise, which significantly reduces PV cell output, particularly when it is exposed to constant irradiation. Higher temperatures also result in an increase in circuit resistance. Additionally, it has a negative impact on the performance of the materials and its open circuit voltage []. It is essential to use various cooling techniques for the solar collectors to mitigate the temperature increase effect and increase the efficiency of the PVT system []. Heat can therefore be efficiently relocated from PV cells by adding a cooling/heat transfer fluid (HTF) into the module. The recovered heat can be efficiently used as thermal energy [].
Parameter sensitivity is very significant for an overall output and performance analysis. The related current–voltage (I-V) and power–voltage (P-V) behavior due to temperature variation in the cell is shown in Figure 5 []. This figure shows the reduction of values in both I-V and P-V curves as the temperature increases. As a result, the maximum power point (MPP) value also decreases with the gradual increase of cell temperature value.
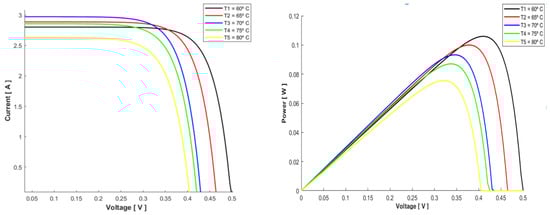
Figure 5.
I-V curve and P-V curve variation for different cell temperatures [].
The MPP variation due to the variation in cell temperature is shown in Figure 6. It shows that the power at the MPP decreases with temperature. Therefore, as the temperature rises, the overall efficiency of the system is reduced.
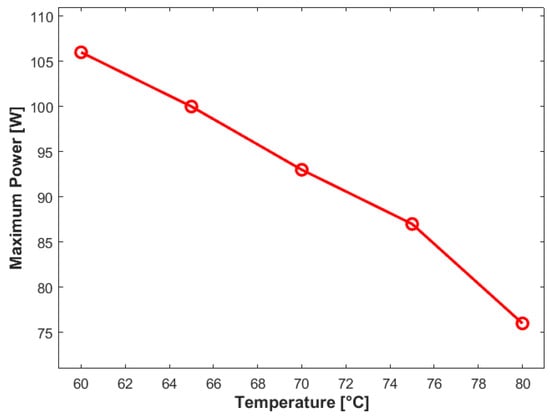
Figure 6.
MPP values for different temperature values [].
3.1. Analysis of Proposed PVT System
Temperature in a PV panel is controlled by a variety of cooling strategies, which vary based on whether it is designed for active or counted for passive cooling. A number of studies have focused on certain cooling methods. Some have considered water-based cooling, air-based cooling, PCM-based cooling, heat pipe-based, and bi-fluid-based. Table 1 provides a summary of existing cooling techniques.

Table 1.
PVT cooling classification techniques based on primary materials used.
Table 1 shows the classification of the main materials used for the cooling of PVT panels. It demonstrates several techniques used to manage thermal energy in PV systems, including water pipes, PCMs, heat pipes, and many other systems. Different strategies for maximizing energy use and improving solar panel cooling efficiency are represented by each category.
A practical way to mitigate the negative impacts of high temperatures on PV systems is water cooling techniques. It is beneficial as it helps to maintain the longevity and efficiency of a solar module. Among various water-based cooling techniques, mainly tubes water cooling, evaporation-based water cooling, combining water and nanofluid cooling, and channels-based water cooling are attractive to the users due to their ability to ensure the optimal performance of the system. Heat exchange occurs using evaporation which helps to maintain the PV panel in a reduced temperature situation. This procedure involves applying water to a porous substance that maintains temperature at an optimal level, thereby improving efficiency [].
Specialized approaches within the field of water-based cooling techniques for solar PVT systems consist of cooling channels and water pipes. In this method, water is used and pumped through heat pipes that are fixed to the panels and absorb the heat and cool the system while water flows inside of it. After that, the hot water is accumulated and stored/supplied to an end user [].
A water-based hybrid PVT [] system is studied, analyzed, and considered to implement in this proposed work. The two subparts in this proposed model are an electrical system and a thermal system. An advanced cell block, consisting of PV cells, is connected to a load that properly simulates dynamic resistive loads. This is extended by a thermal network that monitors the complex heat exchange processes between the back cover, the glass cover, and the thermal exchanger, including surroundings parameters. Heat transfer in this PVT system is modelled considering convection, conduction, and radiation.
The thermal liquid network in this model incorporates intelligently designed components, consisting of precise pipes, a storage tank, and an adaptive pump which coordinates the liquid flow in a controlled and efficient process, providing an optimal system and performance. Both active and passive cooling systems can be used with water-cooled PVT systems. In this model, to enable water to pass through the PV panel, water pipes are positioned behind it in both methods. The water cools the panel and creates hot water by drawing heat from the PVT system. There are several kinds of uses for this extracted heated water in a household or any other place. The inlet for the collector is positioned at the tank bottom, while the heated water enters the upper section of the tank from the collector. This configuration improves thermal performance and lowers the temperature of the PVT systems by stratifying the tank with a lower hot water density []. A linear flowchart based on the proposed PVT system and its related activities, parameters, and other analysis is shown in the Figure 7.
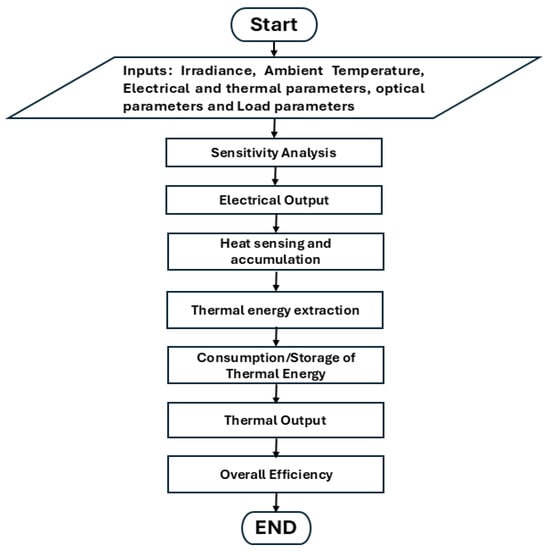
Figure 7.
Process flowchart for the proposed PVT system.
The external and internal parameters, including electrical, thermal, optical, and load parameters, are considered in this model. A brief description of sensitivity analysis is also provided. Electrical output from this model is calculated and analyzed. Heat sensing and accumulation is also obtained here. Thermal energy extraction, usage, and storage, including overall output, is also studied. Finally, the overall efficiency is calculated from both thermal and electrical efficiency.
Input Parameters and Heat Transfer Analysis
In this work, an enhanced simulation using MATLAB R2020a is studied. The related parameters for effective output and efficiency are discussed. This section provides a detailed description of the input parameters and simulations output. The value of the used load in this work is considered to be 5 Ω. It might vary depending on the user’s demand. Solar parameters include the temperature, panel geometry, and optical properties of the panel, the heat transfer properties, and the electrical properties of the PV cell. Table 2 presents the initial temperature of various components, while the geometrical properties of the solar panel are provided in Table 3.
Table 2.
Initial temperatures.
Table 3.
Solar panel geometrical properties.
Optical properties of the cell also take part in the output calculation of a PVT system. The generalized used optical properties for this model are provided in Table 4.
Table 4.
Solar panel optical properties.
In order obtain the thermal energy output of this system, the used thermal properties for the heat transfer process are provided in Table 5.
Table 5.
Heat transfer properties of the system.
Electrical properties are generally given in the datasheets of the chosen photovoltaic module by the manufacturer. The used electrical properties for the simulation purpose are provided in Table 6.
Table 6.
Electrical properties of the PV cell.
In a hybrid PVT system, the pipe is used for the heat transfer fluid flow, which is also known as the HEP. Various types and shapes of pipes have different output characteristics. The specific values of the pipes used for the proposed model’s simulation are shown in the Table 7. A tank is used to provide/store the extracted thermal energy to the consumers. The considered parameters for this case are provided in Table 8.
Table 7.
Pipe parameters of the system.
Table 8.
Input parameters of the tank.
The input parameters for the pump flow of this system are provided in Table 9.
Table 9.
Input parameters of the pump flow.
To analyze the effective performance and output characteristics for the proposed PVT system, a simulation model based on the given properties is conducted in this work. Figure 8 shows that the maximum irradiance value is 1200 W/m2 obtained at 15 h and the minimum is considered 0 W/m2 before sunrise and after sunset.
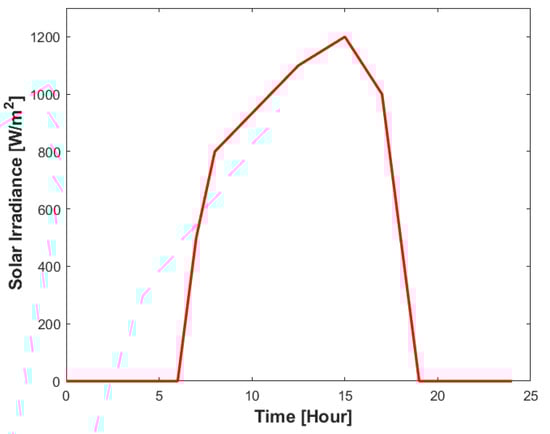
Figure 8.
Irradiance values for a one-day period.
Heat exchanger pipes can help improve the performance of solar panels as they are able to work in a passive system with the capability for a high rate of heat transfer []. Even at a minimal temperature differential, the PCM maintains the heat pipe’s remarkable heat transfer performance. Because of its high performance even at a low temperature, this type of heat exchanger is often used in air conditioning, heating, and ventilation system [].
The efficiency of a PVT system is mostly dependent on the heat transfer mechanism. This mechanism includes the type of material used for the heat extraction purpose. The heat transfer fluid also takes part in the performance analysis. Heat extraction pipe parameters are also considered for this purpose. Our proposed work provides an overview of the effectiveness of using different types of HE pipes. A water heating system through heat extraction using a copper pipe from a PVT panel was discussed in []. Heat sinks were connected to the copper pipe, and a pump moved the cooler water of the tank circulating in a pipe that extracts the extra heat accumulated in the panel. The solar absorber material or the solar HEPs made of aluminum and steel were considered, as well as their design analysis in []. The schematic view of the attached heat exchanger pipe is shown in Figure 9. It provides an overview of the layout of the pipe and the flow of HTF inside it.
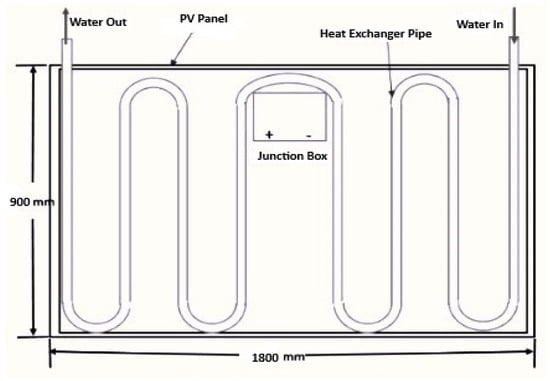
Figure 9.
Schematic of a heat exchanger pipe in a PVT system.
In this work, a brief discussion on the PVT system’s performance analysis based on various heat transfer pipes is discussed. Three types of pipes are considered: stainless steel, aluminum, and copper. The effective differences in overall output and efficiency are discussed in the next section.
4. Results and Discussion
The performance of the proposed PVT system is analyzed based on PV panel electrical properties and thermal properties. An electrical equivalent circuit and related parameters are studied in the electrical modeling and analysis part. The thermal model is composed of several components: heat exchanger pipes, motor/pump to water flow, storage tank, and other thermal components. The feasibility, temperature profiling, and related output are also described. Three types of heat exchanger pipes, stainless steel, aluminum, and copper, are analyzed. Copper, aluminum, and stainless steel are considered for use as heat transfer pipes for the simulation purpose due to their better thermal and electrical properties, mechanical strength, and corrosion resistance. Additionally, these pipes are also easily available on the market, which makes them practical options for real world implementation.
4.1. Stainless Steel
The pipe roughness for this exchanger is 15 × 10−6 m and other parameters are similar to the proposed model parameters. The heat transfer properties are presented in Table 10.
Table 10.
Heat transfer properties of stainless steel pipe.
4.1.1. Simulation Results Analysis (Stainless Steel)
Temperature variations in the different component of a PVT system over time is simulated and provide in Figure 10.
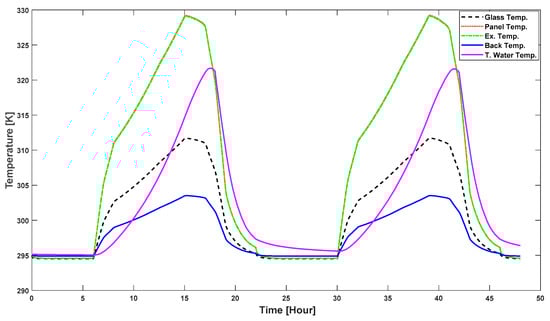
Figure 10.
Temperature dynamics of hybrid PVT system.
Figure 10 provides the dynamic behavior of temperatures over time for panel glass, PV panel, heat exchanger, back surface, and tank water. After sunrise, the temperature of all components increases. As the water flows through the pipe, the water temperature increases with the increasing irradiance. Electrical and thermal power output from this system, using a stainless steel pipe, is provided in Figure 11.
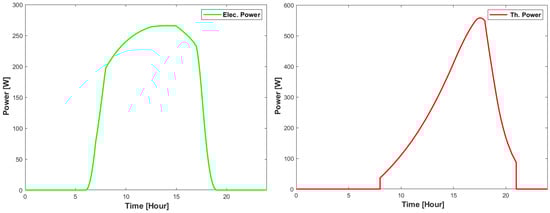
Figure 11.
Electric and thermal power output of hybrid PVT system.
Electric and thermal power output for a period of 24 h is shown in Figure 11, which shows that the value of electric power is at peak while irradiance is higher and thermal output is at peak in the late afternoon.
The temperature profile of the panel temperature and the back cover temperature is provided in Figure 12. As solar radiation increases during the day, the temperatures of the PV panel and back surface also increase. And, in the evening, the temperature also reduces as the irradiance value reduces. It is clearly visible that the back surface temperature is lower than the PV panel temperature, which is due to the heat dissipation and the material’s insulating effect.
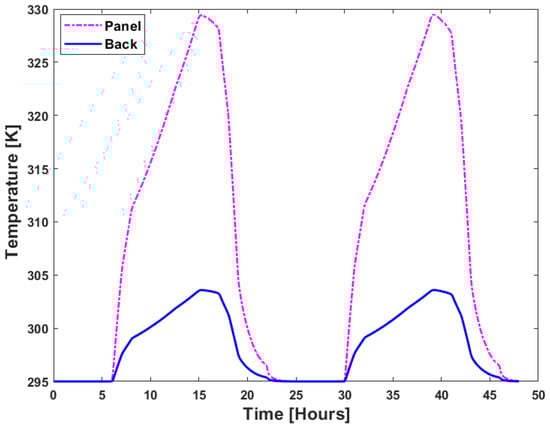
Figure 12.
PV panel vs. back surface temperature.
According to Figure 13, the tank water temperature is projected to rise more gradually as heat is absorbed over time, and drops more slowly due its thermal storage characteristics.
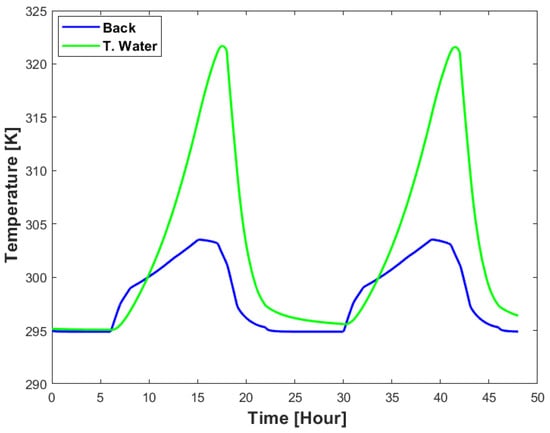
Figure 13.
Back surface vs. tank water temperature for stainless steel.
Figure 14 shows the pattern of water volume in the storage tank over a 24-h period. The figure shows that the water volume follows a daily cycle, decreasing during use and increasing during refilling.
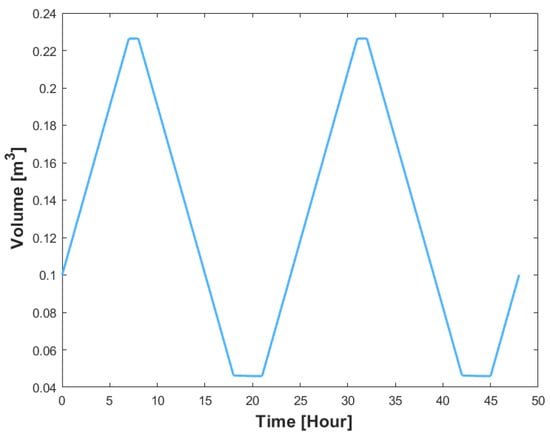
Figure 14.
Tank water volume dynamics.
A comparison of the electrical and thermal power output of the PVT system is shown in Figure 15.
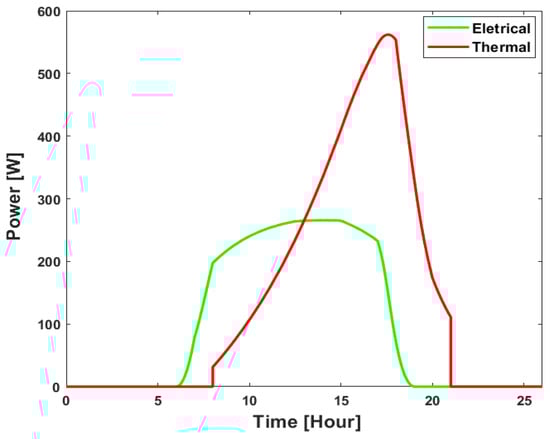
Figure 15.
Electrical vs. thermal power output of the PVT.
The electrical power output is obtained from the PV part, and the thermal power output is obtained using heat utilization from the thermal portion of the system. The highest electrical power output occurs when solar radiation is maximum, and there is no output at night as it solely depends on sunlight. On the other hand, thermal power increases around noon but declines slowly after sunset, resulting in sustained high output due to thermal inertia. The panel temperature and water temperature due to the heat absorption from the surroundings is depicted in Figure 16.
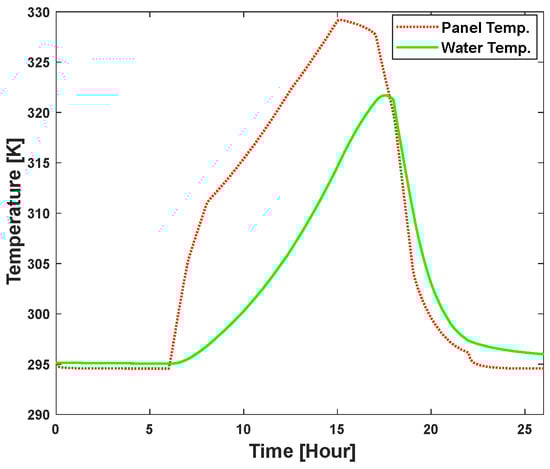
Figure 16.
Panel temperature vs. water temperature.
The panel temperature indicates the amount of heat the panel absorbs from the sun and is crucial for comprehending the panel’s effectiveness. The water temperature shows the available tank water temperature over the course of 1 day.
A comparison between total power input and total power output of the PVT system is illustrated in Figure 17. For better understanding, a two-day (48-h) observation period is considered here. The green line depicts the fluctuation in the overall output of the system, comprising thermal and electrical power. The overall power input is symbolized by the red dotted line, which is obtained from the external parameters and the irradiance absorbed from the system. Power input normally varies based on the available irradiance profile which increases during the day period. Differences in input and output reflect the losses in the system, such as those related to energy conversion, storage, or distribution.

Figure 17.
Total power output vs. power input.
4.1.2. Efficiency Analysis (Stainless Steel)
This part analyzes and discusses the usable electrical and thermal energy generated in relation to the total energy received by the panel from the sun in order to determine the hybrid PVT systems efficiency. The efficiency of this system is calculated by using total input energy, electrical energy, and thermal energy. Electrical efficiency is defined as the proportion of electrical energy in relation to overall input energy. Thermal efficiency is defined as the proportion of total input energy that is considered useful as thermal energy.
Table 11 provides the results obtained for the efficiency of the PVT system when stainless steel is used as a heat exchanger. The table provides the information about the input energies, supplied heat energy, electrical energy, electrical efficiency, thermal efficiency, and total efficiency. From the calculations, it is found that the electrical efficiency is 0.165, thermal efficiency is 0.237, and total efficiency of the PVT system using a stainless steel heat pipe is 0.402. Figure 18 shows the efficiencies and exergies of this system.
Table 11.
Efficiency table for stainless steel heat exchanger pipe.
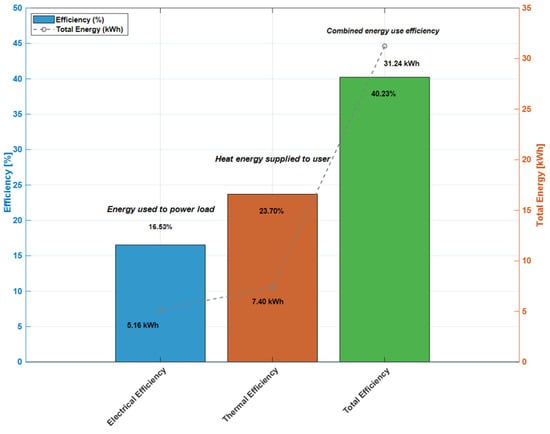
Figure 18.
Efficiency analysis of PVT system.
4.2. Aluminum
In many PVT systems, aluminum is used as a heat exchanger pipe. We simulated the aluminum pipe as the heat exchanger in the proposed PVT system to study the output variation related to other pipes. The considered pipe roughness of the used aluminum is 1.5 × 10⁻⁶ m. Thermal parameter properties are provided in Table 12.
Table 12.
Heat transfer properties of aluminum pipe.
4.2.1. Results Analysis (Aluminum)
This section describes the outcome of employing aluminum as the heat exchanger pipe in the suggested PVT system. Figure 19 illustrates the temperature changes over time in various PVT system components due to the use of aluminum pipe. It shows the temperature behavior of the panel glass, PV panel, heat exchanger, rear surface, and tank water over time. The temperature of every component rises after sunrise. The temperature of the fluid (water) rises as it passes through the pipe in coordination with the increasing irradiances.
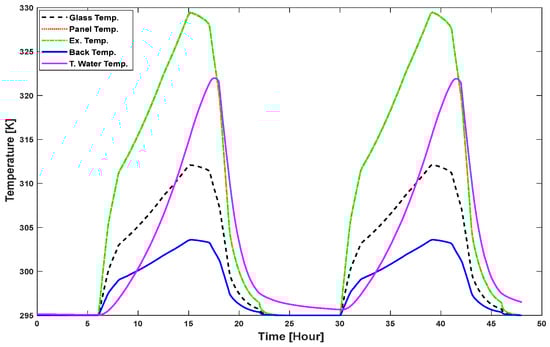
Figure 19.
Temperature behavior of hybrid PVT system.
Electrical power and thermal power output using the aluminum pipe is provided in Figure 20. This figure displays the electric and thermal power output. It indicates that the greater irradiance value around noon causes the electric power and thermal value to peak. The output of thermal power peaks at noon, rises after sunrise, and nearly falls at dusk.
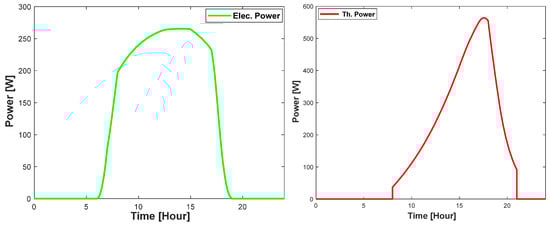
Figure 20.
Electric and thermal power output using aluminum pipe.
Figure 21 provides a temperature profile of the panel and back cover temperatures. It is visible in the figure that the back surface temperature is lower than the PV panel temperature due to the heat dissipation and the material’s insulating effect.
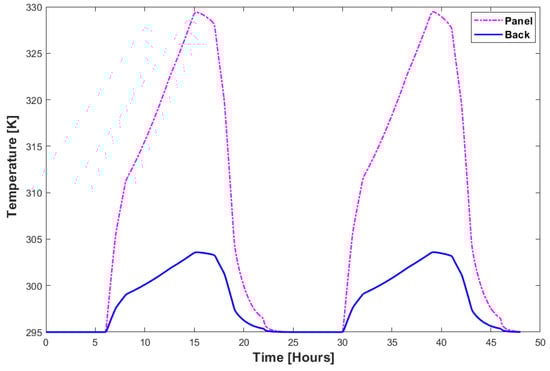
Figure 21.
PV panel vs. back surface temperature for aluminum.
Figure 22 shows the temperature differential between the tank water and the back surface during the PVT operation.
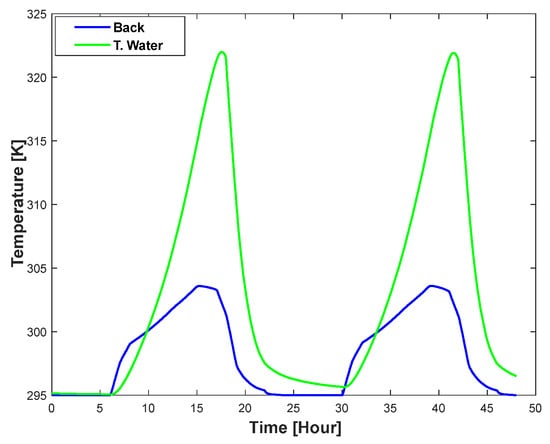
Figure 22.
Back surface vs. tank water temperature for aluminum.
According to the pattern of solar irradiation, the back surface temperature increases during the day and decreases at night. It is projected that the tank water’s temperature will increase more gradually as heat is absorbed over time and decrease more slowly because of its thermal storage properties. The water volume pattern in the storage tank over a 24-h period is shown in Figure 23.
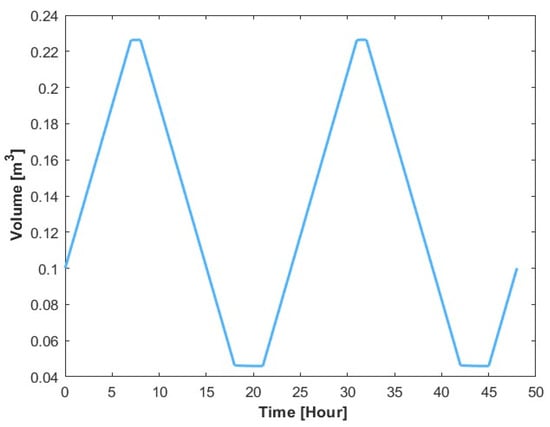
Figure 23.
Tank water volume dynamics for aluminum.
The figure illustrates how the tank’s volume changes over time. It helps to properly control the PVT system through demonstrating how the water volume changes while it operates. The water volume follows a daily cycle, decreasing during consumption and increasing during replenishment. A comparison of the electrical and thermal power output of the PVT system for using aluminum heat exchanger is shown in Figure 24.
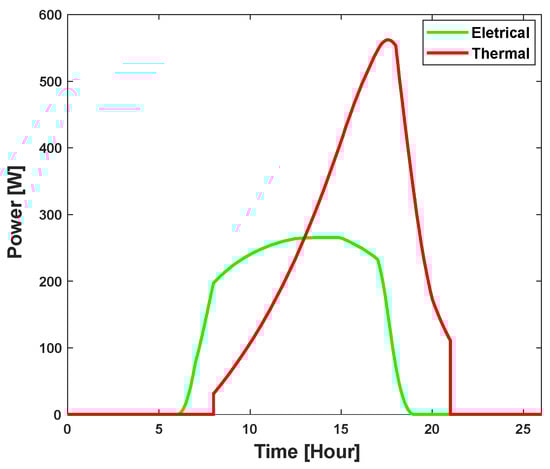
Figure 24.
Electrical vs. thermal power output for aluminum.
This figure depicts the PVT system’s electrical and thermal power output during a 24-h period. The photovoltaic component provides the electrical power output, while the thermal component of the system uses heat to produce the thermal power output. Since it depends entirely on sunlight, the maximum electrical power output comes at midday, when solar radiation is at its most intense. At night, there is no output. However, thermal inertia causes a prolonged high output, with thermal power increasing around midday and gradually decreasing after sunset. Figure 25 compares the temperatures of the panel and water resulting from heat absorption from the environment and the system. The solid green line indicates the water temperature, while the dashed orange line indicates the panel’s temperature.
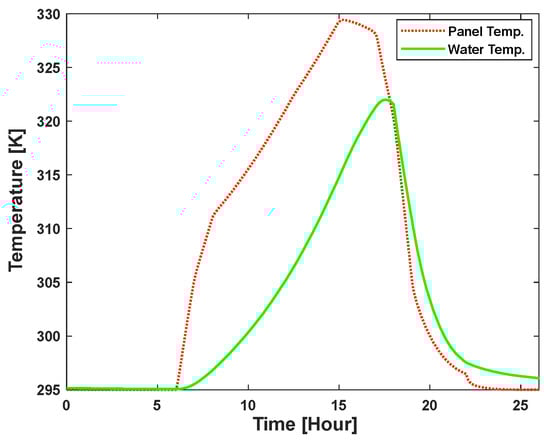
Figure 25.
Comparison of panel temperature and water temperature for aluminum pipe.
Measuring the panel’s efficiency requires knowing its temperature level, which shows how much heat the panel absorbs from the sun and surroundings.
Figure 26 shows a comparison of the PVT system’s total power input and total power output obtained by using aluminum as a heat exchanger. Two days (48 h) of observation are taken into consideration here for easier comprehension. The system’s entire output, which includes both electrical and thermal power, is shown by the green line. The red dotted line represents the total power input, which may come from external factors or radiation that the system absorbs.
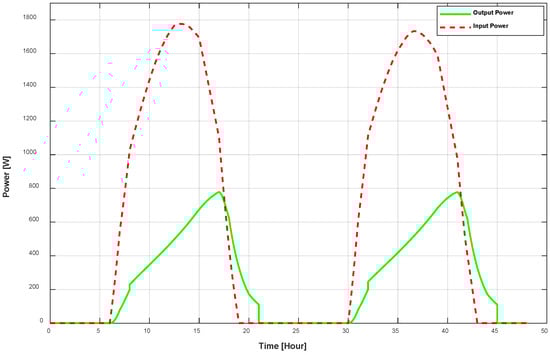
Figure 26.
Comparison between output power and input power.
Typically, power input value fluctuates according to the available irradiance profile, which increases during the day. The generation and losses that take place within the system will determine its outputs.
4.2.2. Efficiency Analysis (Aluminum)
In order to determine the efficiency of the hybrid PVT systems, this part examines and discusses the usable electrical and thermal energy generated in relation to the total energy received by the panel from the sun. The efficiency results of the PVT system when aluminum is utilized as a heat exchanger are shown in Table 13.
Table 13.
Efficiency table for aluminum heat exchanger pipe.
It is found that the electrical efficiency is 0.165, the thermal efficiency is 0.240, and the total efficiency of the PVT system using an aluminum heat pipe is 0.405. Obtained efficiencies using aluminum in the PVT system are depicted in Figure 27.
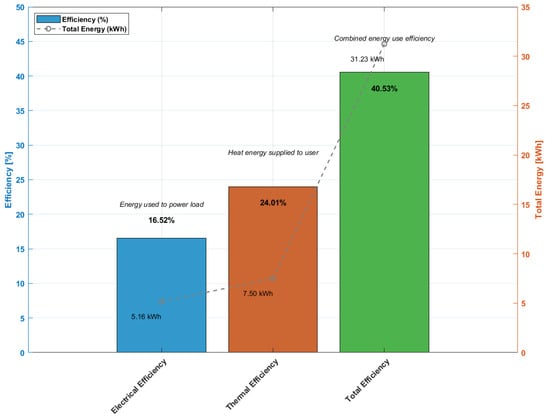
Figure 27.
Obtained efficiencies of PVT system using aluminum as heat exchanger.
4.3. Copper
The use of copper for the heat exchange pipe, its impact, including thermal profiling, outputs, and efficiency increased or decreased, are studied here. The geometrical parameters are considered to be almost the same as the previous pipes, except for the internal surface absolute roughness which is 1.5 × 10⁻⁶ m, with a Nusselt number for laminar flow heat transfer of 4.36. The thermal parameters and the properties of this pipe are provided in the Table 14.
Table 14.
Heat transfer properties of copper pipe.
4.3.1. Results Analysis (Copper)
The results of using copper as the heat exchanger pipe in the proposed PVT system are discussed in this section. Figure 28 illustrates the temperature changes over time in various PVT system components.
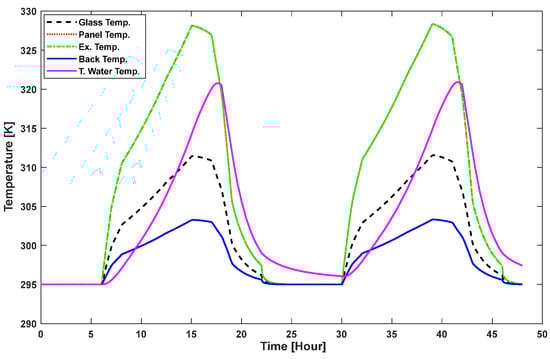
Figure 28.
Temperature variation of PVT components.
Figure 29 shows that every component’s temperature increases as time passes after sunrise. As the fluid (water) moves through the pipe, its temperature increases in parallel with the increased irradiance. It shows the temperature change for different parts of the PVT system. The electrical power and thermal output for this system using a copper pipe as a heat exchanger is provided in Figure 29.
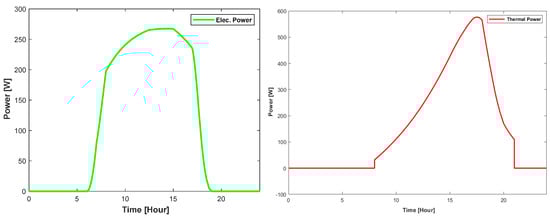
Figure 29.
Electric and thermal power output using copper pipe.
The electric and thermal power value peaks while it has a higher irradiation value, it increases after sunrise, and almost decreases after sunset. It is evident from Figure 30 that the back surface temperature is lower than the PV panel temperature, which is caused by heat dissipation and the insulating effect of the materials in the back of the PVT structure. Additionally, the temperature variation during PVT operation between the tank water and the back side is depicted in Figure 31. The figure states that the back surface temperature rises during the day and falls at night in accordance with the pattern of solar irradiation.
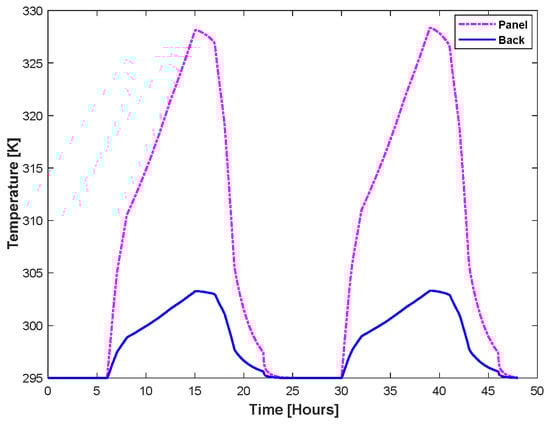
Figure 30.
PV panel vs. back surface temperature for copper heat exchanger.
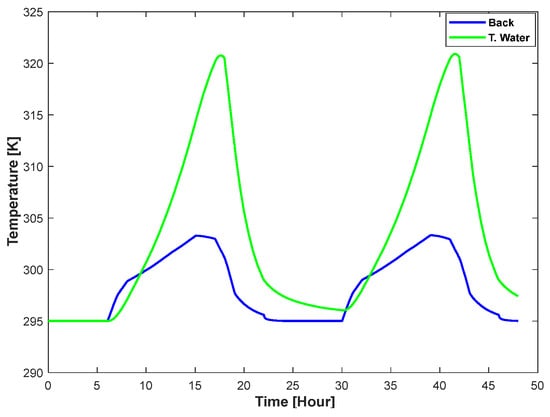
Figure 31.
Temperature variation of back surface vs. tank water.
As heat is absorbed over time, the temperature of the tank water is predicted to rise more gradually and fall more slowly due to its thermal storage characteristics. The water volume pattern in the storage tank over a 24-h period is shown in Figure 32. The tank’s volume fluctuates with time. By showing how the water volume fluctuates while the PVT system is operating, it assists in its appropriate regulation of energy management. The figure indicates a daily cycle in which the volume of water decreases during use and increases after refilling.
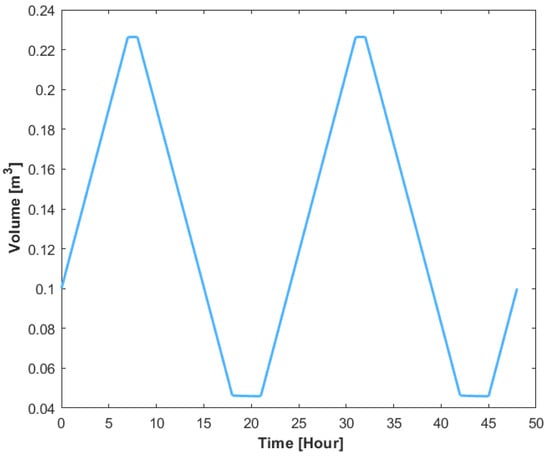
Figure 32.
Tank water volume dynamics for copper heat exchanger.
A comparison of the electrical and thermal power output of the PVT system for using copper heat exchanger is shown in Figure 33.
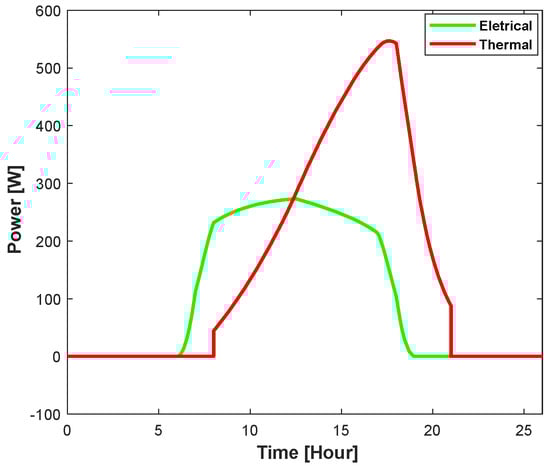
Figure 33.
Comparison of electrical and thermal power output for copper.
The system’s thermal component generates the thermal power output by using heat, while the photovoltaic component provides the electrical power output. Figure 33 also states that there is higher thermal power than electrical power in the output. The active power output occurs mainly during the daytime when there is sufficient sunlight. The temperature difference between the PV panel and water at the storage tank is shown in Figure 34.
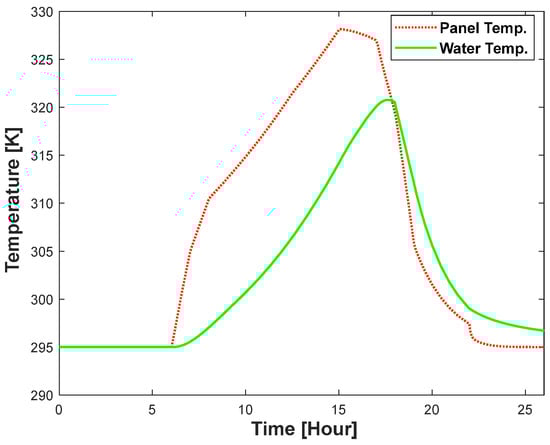
Figure 34.
Comparison of panel temperature and water temperature for copper pipe.
The water’s temperature is shown in the Figure 34 by the solid green line, while the panel’s temperature is shown by the dashed orange line. The temperature level of the panel, which indicates how much heat it receives from the sun and surroundings, is necessary to measure its efficiency. The figure exhibits the temperature gained and the expected result of thermal energy in the system by analyzing the interaction between the PV panel’s temperature and the water in the storage tank. The total power input and output of the PVT system using copper as a heat exchanger are compared in Figure 35.
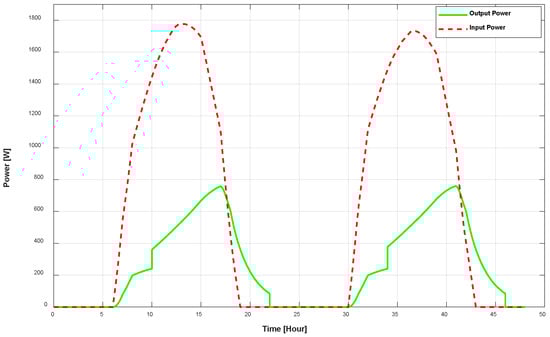
Figure 35.
Comparison of output and input power.
Figure 35 provides a comparison between the obtained input and output power of the PVT system while using a copper pipe as the heat exchanger material.
4.3.2. Efficiency Analysis (Copper)
The usable electrical and thermal energy generated in relation to the total energy collected by the panel from the sun is analyzed and discussed in this part to assess the efficiency of the hybrid PVT systems. Table 15 presents the efficiency results of the PVT system when copper is used as the heat exchanger.
Table 15.
Efficiency table for copper heat exchanger pipe.
The calculations reveal that the electrical efficiency of the PVT system using a copper heat pipe is 0.165, the thermal efficiency is 0.246, and the total efficiency is 0.412. Figure 36 provides an illustration of the copper-based heat pipe PVT system efficiency.
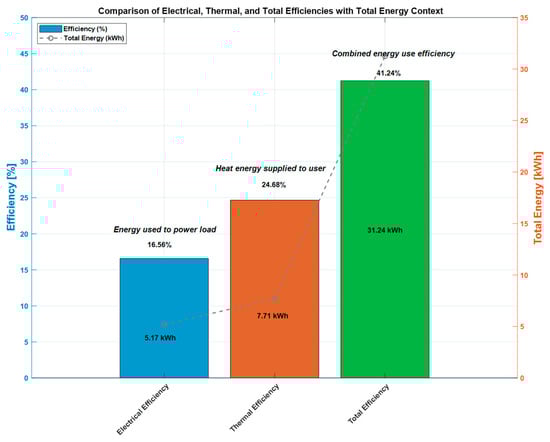
Figure 36.
Obtained efficiencies of the PVT system using copper as heat exchanger.
4.4. Comparison
The related output employing three types of heat exchanger pipes are discussed in Section 4.1, Section 4.2 and Section 4.3. The electrical, thermal, and overall output, including related efficiency comparison, are described in this section. It will enhance the area of knowledge for the research community on the use of different types of heat exchanger pipes.
Electrical Efficiency
The PVT system electrical power output for using heat exchanger pipes with stainless steel, aluminum, and copper are 5.16 kWh, 5.16 kWh, and 5.1742 kWh, respectively. The efficiency when using these pipes is 16.53%, 16.52%, and 16.56%, respectively. The efficiency and output of these pipes are depicted in Figure 37.
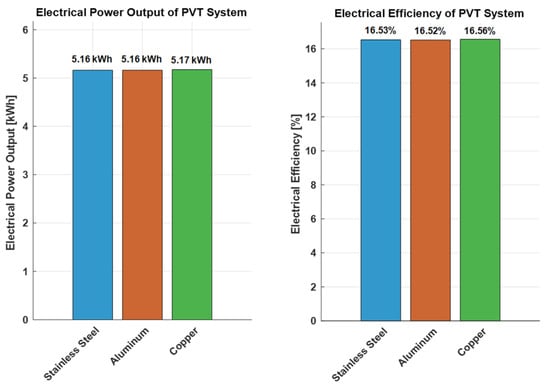
Figure 37.
Electrical efficiency comparison.
From the comparison figure, it is clear that the obtained electrical output and efficiency for stainless steel and aluminum is similar, but copper has a higher output and efficiency. As a result, the use of a copper pipe as a heat exchanger will provide higher electrical efficiency.
The value of thermal energy output for stainless steel, aluminum, and copper is 19.3237 kWh, 19.4199 kWh, and 19.629 kWh, respectively. Additionally, the thermal efficiency of these pipes is 23.70%, 24.01%, and 24.68%, respectively. A comparison of the thermal output and efficiency for the different materials of the heat exchanger pipes is provided in Figure 38.
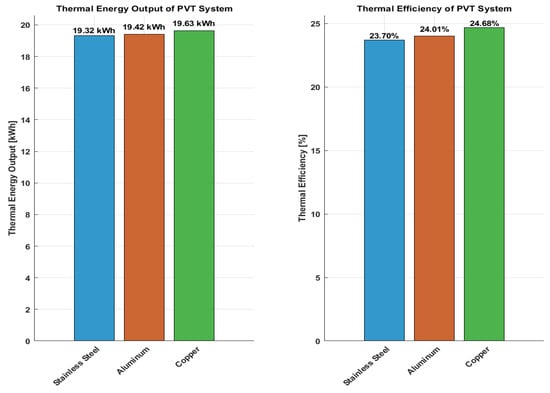
Figure 38.
Thermal efficiency comparison.
From the results, it is found that the thermal output for the stainless steel pipe is 19.32 kWh, for aluminum is 19.42 kWh, and for copper is 19.63 kWh. The thermal efficiency for stainless steel is 23.70%, for aluminum is 24.01%, and for copper is 24.68%. The results show that the copper pipe in the proposed PVT system has a slightly higher thermal output and efficiency when compared to stainless steel and aluminum materials. Additionally, between aluminum and stainless steel, aluminum has a higher thermal capacity as well as efficiency.
Finally, the overall output and efficiency for all three pipes are discussed. It provides an overview of the entire system’s efficiency. The total output that includes the electrical and thermal part for stainless steel, aluminum, and copper is 24.48 kWh, 24.57 kWh, and 24.80 kWh, respectively. The obtained total efficiency for stainless steel, aluminum, and copper is 40.23%, 40.53%, and 41.24%, respectively. The value and comparison of the output is described in Figure 39.
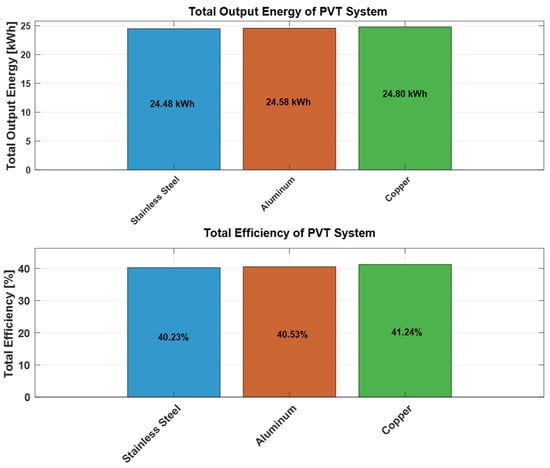
Figure 39.
Total efficiency comparison.
The copper heat pipe has the maximum power output and efficiency. Copper has exceptional higher thermal conductivity than the other materials, which allows it to transfer heat very efficiently. For the PVT, as a heat exchanger application, copper provides long-term performance, better corrosion resistance, and durability. It is also preferred in the thermal systems due to it having high ductility, and designing and shaping flexibility than the other tested materials. On the other side, aluminum has a slightly better efficiency than stainless steel. Thus, it is recommended to use copper pipe in the PVT system instead of the other two types of pipes though there may be other conditions that may need to be considered.
5. Conclusions
This work describes and establishes a working methodology, thermal analysis, and overall performance characterization of a hybrid PVT system. The main purpose of this study is to provide an effective PVT system by analyzing overall efficiency related to both thermal and electrical parameters. The analysis studied related parameters that are responsible for characterization of the system. The outline of the proposed system provides information regarding construction, working methodology, and other electrical and thermal functions. The proposed hybrid PVT system shows the configuration and additional components that are required to construct the system. By analyzing all other existing PVT systems, this type of system is considered and discussed as it provides optimal output. In the end, it shows the feasibility of using these devices in the context of a PVT system for better and efficient output. It reduces the panel temperature, thus cooling the whole system, by extracting the thermal energy and converting it to usable thermal power for an end user. That is the primary success of the proposed work, which is cost effective since water is used as heat transfer fluid instead of a more expensive fluid.
The performance modeling of the PVT system provides energy balance considering useful energy for both thermal and electrical system. It also discusses overall power input, output, and gain in all perspectives required to understand the system’s performance. The mathematical model is obtained by analyzing both the electrical and the thermal model of the existing system. In the thermal modeling case, it is found that the parameters values are sensitive to overall output and, as a result, it changes its efficiency. The optical model of the proposed system also contributed to model the PVT, specifically for the thermal study which takes part in the thermal energy analysis.
The thermal analysis shows the effects of temperature variation at the cell/module level. In general, an increase of the cell temperature decreases the output power of a PV system including also the degradation of the material properties. This problem is mitigated using a proper heat extraction and heat transfer mechanism through a hybrid PVT system. Among the various types of cooling/heat extraction systems, heat pipe-based cooling using water as a heat transfer fluid is found suitable for this experiment. A MATLAB/Simulink R2020a environment is used to simulate the model and extract the outputs, including efficiency. Water is considered as the HTF in this case, and it resulted in optimal output, as expected.
The input characteristics using specific dataset provides an idea about the system’s internal conditions during operation. For example, the state of irradiance with respect to mass flow and pump flow also provides the internal conditions of the PVT system. Mainly, three types of HE pipes, such as stainless steel, aluminum, and copper, are considered for the simulation purposes. According to pipe characteristics, the value of significant parameters is provided for simulation purposes. Initially, the use a of stainless steel pipe in the PVT system and its related profiling are studied. The temperature profile shows the temperature variation during operation. Electrical and thermal power output show the obtained power from the system. Additionally, the temperature behavior and changes during operation in the PV panel, back surface, and tank water are also studied, which provides the realistic variation of these components.
In the context of energy output, the gained electrical energy for stainless steel and aluminum showed similar output, but for copper it was a bit higher. As a result, the electrical efficiency was maximum for copper, while values for aluminum and stainless steel were almost the same. Thermal energy for copper was the maximum, followed by aluminum and stainless steel. For this reason, the maximum efficiency was obtained for copper, and the minimum was obtained for stainless steel. Total maximum efficiency for copper was 41.24%, the minimum for stainless steel was 40.23%, and for aluminum it was 40.53%.
This study and results analysis will provide the insight to choose the appropriate and energy efficient design of a PVT system in real world applications, such as in residential buildings and commercial spaces. This system is able to produce and supply electrical energy in both on-grid and off-grid systems. Additionally, it will provide thermal energy for space heating and water heating in small scale and industrial processes, as well as district heating on a large scale. The simplicity of the design, the available materials, and the cost effective installation makes it attractive to both residential and commercial consumers. It will also contribute to the advancement of the current PVT technologies due to its low-cost properties, easier installation facilities, and better optimization techniques, as well as being easy to integrate with an internet of things platform.
This study analyses the ideal thermal conductivities for steel, aluminum, and copper, but the performance can be varied based on real-world factors like manufacturing tolerances, oxidation, and impurities. Heat transfer efficiency may vary based on contact resistance between the absorber plate and the heat exchanger pipe. If there is fluctuating irradiance, the simulation is unable to adapt the heat transfer transient behavior. This study considers normal or steady state environmental conditions but, due to adverse weather situations, the output may vary. Copper has a higher thermal conductivity but, for practical feasibility, the cost and weight should be considered. Aluminum performance is competitive, but further analysis of the impact of other parameters should be analyzed. Though steel has a comparatively lower thermal conductivity, its structural durability may be beneficial.
Finally, the proposed work enhances the knowledge on the use of different types of heat exchanger/heat transfer pipes in order to be integrated in the hybrid PVT system. Mathematical and electrical models, including the optical equations, are also developed in this work. An extensive analysis including thermal and electrical output and efficiency is discussed. The use and integration of these types of pipes for better output and efficiency within consumer capacity will be further studied in future work. Experimental setup is already planned and required procedures are maintained to verify the authenticity of the simulated work.
Author Contributions
Conceptualization, M.T.A. and M.R.R.; methodology, M.T.A., M.I. and T.T.H.; software, M.T.A., M.I. and T.T.H.; validation, M.T.A., M.R.R. and F.M.J.; formal analysis, M.T.A. and T.T.H.; resources, M.T.A., M.R.R. and M.I.; writing—original draft preparation, M.T.A.; writing—review and editing, M.T.A., M.R.R., M.T. and F.M.J.; visualization, M.T.A., M.T. and F.M.J.; supervision, F.M.J. and M.T. All authors have read and agreed to the published version of the manuscript.
Funding
The first author would like to extend gratitude to the Foundation for Science and Technology (FCT) for the research grant 2020.06312.BD (https://doi.org/10.54499/2020.06312.BD, accessed on 2 December 2024). This work is also funded by FCT/MECI through national funds and when applicable co-funded EU funds under UID/50008: Instituto de Telecomunicações.
Data Availability Statement
The original contributions presented in this study are included in the article. Further inquiries can be directed to the corresponding author.
Acknowledgments
The authors acknowledge the CREATE of the University of Evora for providing the research scope and enabling this work.
Conflicts of Interest
The authors declare no conflicts of interest.
Abbreviations
| PV | Photovoltaic |
| PVT | Photovoltaic Thermal |
| HTF | Heat Transfer Fluid |
| HE | Heat Extraction |
| STC | Standard Test Conditions |
| PCM | Phase Change Material |
| ATC | Air Thermal Collector |
| MPP | Maximum Power Point |
| HEP | Heat Extraction Pipe |
References
- Kibria, M.G.; Paul, U.K.; Mohtasim, M.S.; Das, B.K.; Mustafi, N.N. Characterization, Optimization, and performance evaluation of PCM with Al2O3 and ZnO hybrid nanoparticles for photovoltaic thermal energy storage. Energy Built Environ. 2024, in press. [Google Scholar] [CrossRef]
- Ahmed, M.T.; Rashel, M.R.; Abdullah-Al-Wadud, M.; Hoque, T.T.; Janeiro, F.M.; Tlemcani, M. Mathematical Modeling, Parameters Effect, and Sensitivity Analysis of a Hybrid PVT System. Energies 2024, 17, 2887. [Google Scholar] [CrossRef]
- Hannouch, A.; Faraj, J.; Taher, R.; Mortazavi, M.; Khaled, M. A Simplified Approach to Modeling Temperature Dynamics in Photovoltaic Systems—Validation, Case Studies, and Parametric Analysis. Int. J. Thermofluids 2024, 23, 100767. [Google Scholar] [CrossRef]
- Majeed, Y.; Khan, M.U.; Waseem, M.; Zahid, U.; Mahmood, F.; Majeed, F.; Raza, A. Renewable Energy as an Alternative Source for Energy Management in Agriculture. Energy Rep. 2023, 10, 344–359. [Google Scholar] [CrossRef]
- Sankarananth, S.; Karthiga, M.; Suganya, E.; Sountharrajan, S.; Bavirisetti, D.P. AI-enabled Metaheuristic Optimization for Predictive Management of Renewable Energy Production in Smart Grids. Energy Rep. 2023, 10, 1299–1312. [Google Scholar] [CrossRef]
- Alsaqoor, S.; Alqatamin, A.; Alahmer, A.; Nan, Z.; Al-Husban, Y.; Jouhara, H. The Impact of Phase Change Material on Photovoltaic Thermal (PVT) Systems: A Numerical Study. Int. J. Thermofluids 2023, 18, 100365. [Google Scholar] [CrossRef]
- Ates, E.; Karaarslan, N. Investigation of Hybrid Renewable Energy Greenhouse for Reducing Residential Carbon Emissions. Int. J. Thermofluids 2024, 21, 100558. [Google Scholar] [CrossRef]
- Habchi, C.; Bou-Mosleh, C.; Khaled, M. An Experimental Analysis of a Hybrid Photovoltaic Thermal System through Parallel Water Pipe Integration. Int. J. Thermofluids 2024, 21, 100538. [Google Scholar] [CrossRef]
- Jayathunga, D.S.; Karunathilake, H.P.; Narayana, M.; Witharana, S. Phase Change Material (PCM) Candidates for Latent Heat Thermal Energy Storage (LHTES) in Concentrated Solar Power (CSP) Based Thermal Applications—A Review. Renew. Sustain. Energy Rev. 2024, 189, 113904. [Google Scholar] [CrossRef]
- GaneshKumar, P.; Sivalingam, V.; Vigneswaran, V.S.; Ramalingam, V.; Cheol, K.S.; Vanaraj, R. Spray Cooling for Hydrogen Vehicle, Electronic Devices, Solar, and Building (Low Temperature) Applications: A State-of-Art Review. Renew. Sustain. Energy Rev. 2024, 189, 113931. [Google Scholar] [CrossRef]
- Dunne, N.A.; Liu, P.; Elbarghthi, A.F.; Yang, Y.; Dvorak, V.; Wen, C. Performance Evaluation of a Solar Photovoltaic-Thermal (PV/T) Air Collector System. Energy Convers. Manag. X 2023, 20, 100466. [Google Scholar] [CrossRef]
- Khan, S.U.D.; Wazeer, I.; Almutairi, Z.; Alanazi, M. Techno-Economic Analysis of Solar Photovoltaic Powered Electrical Energy Storage (EES) System. Alexandria Eng. J. 2022, 61, 6739–6753. [Google Scholar] [CrossRef]
- Lakshmi, N.S.; Harini, A.K.; Helina, J.; Kamalashini, T.R.; Kaviya, M. Four Port DC-DC Buck Boost Converter for Hybrid Renewable Energy Sources. In Proceedings of the 3rd International Conference on Electronics and Sustainable Communication Systems (ICESC), Coimbatore, India, 17–19 August 2022; IEEE: Piscataway, NJ, USA, 2022; pp. 84–91. [Google Scholar]
- Kannan, N.; Vakeesan, D. Solar Energy for Future World: A Review. Renew. Sustain. Energy Rev. 2016, 62, 1092–1105. [Google Scholar] [CrossRef]
- Rathore, P.K.S.; Gupta, K.K.; Patel, B.; Sharma, R.K.; Gupta, N.K. Beeswax as a Potential Replacement of Paraffin Wax as Shape Stabilized Solar Thermal Energy Storage Material: An Experimental Study. J. Energy Storage 2023, 68, 107714. [Google Scholar] [CrossRef]
- Barbu, M.; Siroux, M.; Darie, G. Performance Analysis and Comparison of an Experimental Hybrid PV, PVT, and Solar Thermal System Installed in a Preschool in Bucharest, Romania. Energies 2023, 16, 5321. [Google Scholar] [CrossRef]
- Fu, X.; Zhou, Y. Collaborative Optimization of PV Greenhouses and Clean Energy Systems in Rural Areas. IEEE Trans. Sustain. Energy 2023, 14, 642–656. [Google Scholar] [CrossRef]
- Meillaud, F.; Boccard, M.; Bugnon, G.; Despeisse, M.; Hänni, S.; Haug, F.J.; Ballif, C. Recent Advances and Remaining Challenges in Thin-Film Silicon Photovoltaic Technology. Mater. Today 2015, 18, 378–384. [Google Scholar] [CrossRef]
- Shukla, A.; Kant, K.; Sharma, A.; Biwole, P.H. Cooling Methodologies of Photovoltaic Module for Enhancing Electrical Efficiency: A Review. Sol. Energy Mater. Sol. Cells 2017, 160, 275–286. [Google Scholar] [CrossRef]
- Radwan, A.; Mahmoud, M.; Olabi, A.G.; Rezk, A.; Maghrabie, H.M.; Abdelkareem, M.A. Thermal Comparison of Mono-Facial and Bi-Facial Photovoltaic Cells Considering the Effect of TPT Layer Absorptivity. Int. J. Thermofluids 2023, 18, 100306. [Google Scholar] [CrossRef]
- Salameh, W.; Faraj, J.; Khaled, M. Numerical Study of Cooling Photovoltaic Panels with Air Exhausted from Industrial Systems: Comparisons and Innovative Configurations. Int. J. Thermofluids 2023, 20, 100493. [Google Scholar] [CrossRef]
- Almadhhachi, M.; Seres, I.; Farkas, I. Electrical Power Harvesting Enhancement of PV Module by a Novel Hemispherical Configuration. Int. J. Thermofluids 2023, 20, 100460. [Google Scholar] [CrossRef]
- Aljaghoub, H.; Abumadi, F.; AlMallahi, M.N.; Obaideen, K.; Alami, A.H. Solar PV Cleaning Techniques Contribute to Sustainable Development Goals (SDGs) Using Multi-Criteria Decision-Making (MCDM): Assessment and Review. Int. J. Thermofluids 2022, 16, 100233. [Google Scholar] [CrossRef]
- Mussard, M.; Amara, M. Performance of Solar Photovoltaic Modules under Arid Climatic Conditions: A Review. Sol. Energy 2018, 174, 409–421. [Google Scholar] [CrossRef]
- Sun, C.; Zou, Y.; Qin, C.; Zhang, B.; Wu, X. Temperature Effect of Photovoltaic Cells: A Review. Adv. Compos. Hybrid Mater. 2022, 5, 2675–2699. [Google Scholar]
- Salehi, R.; Jahanbakhshi, A.; Ooi, J.B.; Rohani, A.; Golzarian, M.R. Study on the Performance of Solar Cells Cooled with Heatsink and Nanofluid Added with Aluminum Nanoparticle. Int. J. Thermofluids 2023, 20, 100445. [Google Scholar] [CrossRef]
- Shaik, F.; Lingala, S.S.; Veeraboina, P. Effect of Various Parameters on the Performance of Solar PV Power Plant: A Review and the Experimental Study. Sustain. Energy Res. 2023, 10, 6. [Google Scholar] [CrossRef]
- Dixit, K.K.; Yadav, I.; Maurya, S.K. Comparative Study of Efficiency of PV Panels Using Different Cooling Techniques. IOP Conf. Ser. Mater. Sci. Eng. 2021, 1116, 012049. [Google Scholar] [CrossRef]
- Budea, S.; Simionescu, Ş.M. Solar Hybrid System for Electricity and Air Heating-Experimental Research. IOP Conf. Ser. Earth Environ. Sci. 2023, 1185, 012001. [Google Scholar] [CrossRef]
- Pathak, P.K.; Roy, D.G.; Yadav, A.K.; Padmanaban, S.; Blaabjerg, F.; Khan, B. A State-of-the-Art Review on Heat Extraction Methodologies of Photovoltaic/Thermal System. IEEE Access 2023, 11, 49738–49759. [Google Scholar] [CrossRef]
- Hajibeigy, M.T.; Walvekar, R.; Cv, A. Mathematical Modelling, Simulation Analysis of a Photovoltaic Thermal System. J. Therm. Eng. 2021, 7, 291–306. [Google Scholar] [CrossRef]
- Yao, W.; Kong, X.; Han, X.; Wang, Y.; Cao, J.; Gao, W. Research on the Efficiency Evaluation of Heat Pipe PV/T Systems and Its Applicability in Different Regions of China. Energy Convers. Manag. 2022, 269, 116136. [Google Scholar] [CrossRef]
- Zhang, X.; Zhang, X.; Ge, S.; Zhang, B. Multi-Criteria Decision Analysis and Experimental Study on Heat Pipe Thermoelectric Generator for Waste Heat Recovery. Appl. Therm. Eng. 2024, 255, 123930. [Google Scholar] [CrossRef]
- Zhang, Y.; Ji, J.; Song, Z.; Ke, W.; Xie, H. Performance Prediction on a Novel Dual-Mode Heat Pump with a Hybrid Photovoltaic/Micro-Channel Heat Pipe/Fin Heat Exchanger. Energy Convers. Manag. 2023, 293, 117505. [Google Scholar] [CrossRef]
- Andrić, I.; Pina, A.; Ferrão, P.; Fournier, J.; Lacarrière, B.; Le Corre, O. Assessing the feasibility of using the heat demand outdoor temperature function for a long-term district heat demand forecast. Energy Procedia 2017, 116, 460–469. [Google Scholar]
- Terrab, I.; Rebah, N. Optimization of Hybrid Photovoltaic Thermal System Using Design of Experiment Method (DOE). In Springer Proceedings in Energy, Proceedings of the 1st International Conference on Advanced Renewable Energy Systems, ICARES, Tipaza, Algeria, 18–20 December 2022; Mellit, A., Belmili, H., Seddik, B., Eds.; Springer: Singapore, 2024. [Google Scholar]
- Li, R.; Li, J.; Zhu, J.; Liu, X.; Novakovic, V. A numerical and experimental study on a novel micro heat pipe PV/T system. Energy 2023, 282, 128746. [Google Scholar]
- Kern, E.C., Jr.; Russell, M.C. Combined Photovoltaic and Thermal Hybrid Collector Systems. In Proceedings of the IEEE Photovoltaic Specialists Conference, Washington, DC, USA, 5–8 June 1978. [Google Scholar]
- Kibria, M.G.; Mohtasim, M.S.; Paul, U.K.; Das, B.K.; Saidur, R. Impact of Hybrid Nano PCM (Paraffin Wax with Al2O3 and ZnO Nanoparticles) on Photovoltaic Thermal System: Energy, Exergy, Exergoeconomic and Enviroeconomic Analysis. J. Clean. Prod. 2024, 436, 140577. [Google Scholar]
- Herez, A.; El Hage, H.; Lemenand, T.; Ramadan, M.; Khaled, M. Review on Photovoltaic/Thermal Hybrid Solar Collectors: Classifications, Applications, and New Systems. Sol. Energy 2020, 207, 1321–1347. [Google Scholar]
- Fudholi, A.; Sopian, K.; Yazdi, M.H.; Ruslan, M.H.; Ibrahim, A.; Kazem, H.A. Performance Analysis of Photovoltaic Thermal (PVT) Water Collectors. Energy Convers. Manag. 2014, 78, 641–651. [Google Scholar]
- Mostakim, K.; Hasanuzzaman, M. Global Prospects, Challenges and Progress of Photovoltaic Thermal System. Sustain. Energy Technol. Assess. 2022, 53, 102426. [Google Scholar]
- Abo-Zahhad, E.M.; Ookawara, S.; Radwan, A.; El-Shazly, A.H.; ElKady, M.F. Thermal and Structure Analyses of High Concentrator Solar Cell under Confined Jet Impingement Cooling. Energy Convers. Manag. 2018, 176, 39–54. [Google Scholar]
- MathWorks. Photovoltaic-Thermal (PVT) Hybrid Solar Panel. Available online: https://www.mathworks.com/help/sps/ug/photovoltaic-thermal-pvt-hybrid-solar-panel.html (accessed on 10 March 2024).
- Chow, T.T. A Review on Photovoltaic/Thermal Hybrid Solar Technology. Appl. Energy 2009, 87, 365–379. [Google Scholar]
- Ahmed, M.T.; Rashel, M.R.; Islam, M.; Islam, A.K.; Tlemcani, M. Classification and Parametric Analysis of Solar Hybrid PVT System: A Review. Energies 2024, 17, 588. [Google Scholar] [CrossRef]
- Jia, Y.; Alva, G.; Fang, G. Development and Applications of Photovoltaic–Thermal Systems: A Review. Renew. Sustain. Energy Rev. 2019, 102, 249–265. [Google Scholar]
- Wolf, M. Performance Analyses of Combined Heating and Photovoltaic Power Systems for Residences. Energy Convers. 1976, 16, 79–90. [Google Scholar]
- Al-Waeli, A.H.A.; Sopina, K.; Kazem, H.A.; Chaichan, M.T. Photovoltaic/Thermal (PV/T) Systems: Status and Future Prospects. Renew. Sustain. Energy Rev. 2017, 77, 109–130. [Google Scholar]
- Ahmed, M.T.; Gonçalves, T.; Tlemcani, M. Single Diode Model Parameters Analysis of Photovoltaic Cell. In Proceedings of the 2016 IEEE International Conference on Renewable Energy Research and Applications, Birmingham, UK, 20–23 November 2016. [Google Scholar]
- Abdulrazzaq, A.K.; Plesz, B.; Bognár, G. A Novel Method for Thermal Modelling of Photovoltaic Modules/Cells under Varying Environmental Conditions. Energies 2020, 13, 3318. [Google Scholar] [CrossRef]
- Anderson, T.N.; Duke, M. Analysis of a Photovoltaic/Thermal Solar Collector for Building Integration. In Proceedings of the SB07 NZ Conference-Transforming Our Built Environment, Auckland, New Zealand, 14–16 November 2007. [Google Scholar]
- Vokas, G.; Christandonis, N.; Skittides, F. Hybrid Photovoltaic-Thermal Systems for Domestic Heating and Cooling-A Theoretical Approach. Sol. Energy 2006, 80, 607–615. [Google Scholar]
- Hamdoon, O.M.; Alomar, O.R.; Salim, B.M. Performance Analysis of Hybrid Photovoltaic Thermal Solar System in Iraq Climate Condition. Therm. Sci. Eng. Prog. 2020, 17, 100359. [Google Scholar] [CrossRef]
- Najafi, H.; Najafi, B. Sensitivity Analysis of a Hybrid Photovoltaic Thermal Solar Collector. In Proceedings of the 2011 IEEE Electrical Power and Energy Conference, Winnipeg, MB, Canada, 3–5 October 2011; pp. 62–67. [Google Scholar]
- Pop, T.; Buzduga, C.; Ifrim, V.C.; Pentiuc, R.-D.; Bejenar, C. Modeling and Simulation of a Commercial PV/T in MATLAB/Simulink Software Environment. In Proceedings of the 2022 International Conference and Exposition on Electrical and Power Engineering, Iasi, Romania, 20–22 October 2022. [Google Scholar]
- Samykano, M. Hybrid Photovoltaic Thermal Systems: Present and Future Feasibilities for Industrial and Building Applications. Buildings 2023, 13, 1950. [Google Scholar] [CrossRef]
- Mandal, S.; Ghosh, S.K. Experimental Investigation of the Performance of a Double Pass Solar Water Heater with Reflector. Renew. Energy 2020, 149, 631–640. [Google Scholar]
- Khanmohammadi, S.; Baseri, M.M.; Ahmadi, P.; Al-Rashed, A.A.A.; Afrand, M. Proposal of a Novel Integrated Ocean Thermal Energy Conversion System with Flat Plate Solar Collectors and Thermoelectric Generators: Energy, Exergy and Environmental Analyses. J. Clean. Prod. 2020, 256, 120600. [Google Scholar] [CrossRef]
- Abou Akrouch, M.; Faraj, J.; Hachem, F.; Castelain, C.; Khaled, M. A Comprehensive Review and Comparison of Cooling Techniques for Photovoltaic Panels: An Emphasis on Experimental Setup and Energy Efficiency Ratios. Int. J. Thermofluids 2024, 23, 100774. [Google Scholar] [CrossRef]
- Mowafy, A.G. Water-Based Photovoltaic-Thermal Hybrid System. In Proceedings of the 2021 IEEE 62nd International Scientific Conference on Power and Electrical Engineering of Riga Technical University (RTUCON), Riga, Latvia, 15–17 November 2021; pp. 1–8. [Google Scholar]
- Bevilacqua, P.; Perrella, S.; Cirone, D.; Bruno, R.; Arcuri, N. Efficiency Improvement of Photovoltaic Modules via Back Surface Cooling. Energies 2021, 14, 895. [Google Scholar] [CrossRef]
- Senthil, R.; Elavarasan, R.M.; Pugazhendhi, R.; Premkumar, M.; Vengadesan, E.; Navakrishnan, S.; Natarajan, S.K. A Holistic Review on the Integration of Heat Pipes in Solar Thermal and Photovoltaic Systems. Sol. Energy 2021, 227, 577–605. [Google Scholar] [CrossRef]
- Shabgard, H.; Allen, M.J.; Sharifi, N.; Benn, S.P.; Faghri, A.; Bergman, T.L. Heat Pipe Heat Exchangers and Heat Sinks: Opportunities, Challenges, Applications, Analysis, and State of the Art. Int. J. Heat Mass Transf. 2015, 89, 138–158. [Google Scholar] [CrossRef]
- Ismail, B.; Mohammed, B.; Abdelkhalek, O.; Elhadj, S. An Experimental Study of PV/T System Using Parabolic Reflectors and Heat Exchanger. Indonesian J. Electr. Eng. Comput. Sci. 2021, 24, 1297–1306. [Google Scholar] [CrossRef]
- Majid, Z.A.A.; Razak, A.A.; Ruslan, M.H.; Sopian, K. Characteristics of Solar Thermal Absorber Materials for Cross Absorber Design in Solar Air Collector. Int. J. Automot. Mech. Eng. 2015, 11, 2582. [Google Scholar] [CrossRef]
Disclaimer/Publisher’s Note: The statements, opinions and data contained in all publications are solely those of the individual author(s) and contributor(s) and not of MDPI and/or the editor(s). MDPI and/or the editor(s) disclaim responsibility for any injury to people or property resulting from any ideas, methods, instructions or products referred to in the content. |
© 2025 by the authors. Licensee MDPI, Basel, Switzerland. This article is an open access article distributed under the terms and conditions of the Creative Commons Attribution (CC BY) license (https://creativecommons.org/licenses/by/4.0/).