Article

Comparative Analysis of Solar Photovoltaic/Thermal Assisted Heat Pump Systems Coupled with PCM Storage and EV Charging with Reference to the UK’s National Carbon Intensity

1
School of Built Environment, Engineering and Computing, Leeds Beckett University, Leeds LS2 8AG, UK
2
School of Engineering, University of Derby, Derby DE22 3AW, UK
3
Faculty of Engineering, Iskenderun Technical University, 31200 Iskenderun, Hatay, Türkiye
4
Department of Architecture and Built Environment, University of Nottingham, University Park, Nottingham NG7 2RD, UK
5
Department of Mechanical Engineering, Tarsus University, 33400 Tarsus, Mersin, Türkiye
*
Author to whom correspondence should be addressed.
Energies 2025, 18(4), 920; https://doi.org/10.3390/en18040920
Submission received: 27 December 2024 / Revised: 10 February 2025 / Accepted: 12 February 2025 / Published: 14 February 2025

Abstract

:
Emerging trends in heat pump (HP) and electric vehicle (EV) adoption within communities aim to reduce carbon emissions in the heating and transportation sectors. However, these technologies rely on grid electricity, whose carbon intensity varies over time. This study explores how the carbon-saving potential of these technologies can be further enhanced through demand-shifting operations and renewable energy integration. The research compares photovoltaic–thermal (PV/T) and hybrid solar heat pump systems that integrate EV charging and PCM-enhanced heat storage to improve space heating efficiency under low solar irradiance in the UK while reducing CO2 emissions. The study simulates solar collector configurations and sizes, combining PV modules and heat pumps to enhance system performance. Control systems synchronize operations with periods of low grid CO2 intensity, minimizing the environmental impact. The analysis evaluates PV/T systems, separate PV and thermal collectors, highlighting their energy efficiency and CO2 reduction potential. Control systems further optimize HP operation and EV charging during periods of high renewable energy availability, preventing uncontrolled use that could result in elevated emissions. Using real weather data and a detailed building model, the findings show that a solar-assisted HP with 100% thermal collectors achieves a daily COP of 3.49. Reducing thermal collectors to 60% lowers the COP to 2.57, but PV output compensates, maintaining similar emission levels. The system achieves the lowest emission with high-efficiency evacuated flat plate PV/T collectors.

1. Introduction

The global focus on sustainable energy solutions has led to a significant increase in the utilization of renewable energy technologies to reduce carbon emissions in various areas. Among these technologies, photovoltaic (PV) systems, which convert solar energy into electricity, have been widely adopted due to their relatively simple design and decreasing costs. However, the energy output of PV systems is subject to limitations, particularly in climates with lower solar irradiance, such as the United Kingdom (UK), where prolonged winter periods and cloudy weather reduce system efficiency [1]. To address these challenges, hybrid systems such as photovoltaic–thermal (PV/T) systems, which generate both electricity and thermal energy from the same collector, have been proposed to improve energy capture and overall system performance. By capturing the thermal energy that would otherwise be lost as heat in PV systems, PV/T collectors provide a more efficient solution, especially for applications that require both electricity and heating, such as residential space heating [2]. Although domestic hot water provision is the most widespread application of PV/T technology [3], their commercial availability and high thermal efficiency allow solar collectors to be combined with air conditioning systems. By incorporating energy storage, solar-powered AC systems can continue operating into the night [4]; therefore, it has become more important for sustainability. Although heat pump (HP) systems are important for buildings and play a significant role in providing thermal comfort and maintaining indoor air quality, HP systems need electricity, which can contribute to greenhouse gas emissions if the power generation method is a conventional carbon-based system.
Recent advancements in hybrid solar systems have shown that integrating thermal energy storage and demand-side management can significantly enhance the energy efficiency of such systems. Herrando et al. [5] investigated the techno-economic performance of solar combined heat and power systems using flat-box PV/T collectors for domestic applications. Their study showed that PV/T systems can meet a substantial portion of both electrical and thermal demands in single-family homes across various European climates, including the UK. The findings revealed that PV/T systems when optimized with advanced thermal storage solutions, could cover up to 30% of a household’s thermal demand and significantly reduce CO2 emissions by lowering dependence on conventional heating systems. Similarly, Wang et al. [6] conducted a comparative analysis of hybrid PV/T and conventional solar energy systems, underscoring the economic benefits and energy savings achieved by integrating thermal energy into PV systems. These studies highlight the growing recognition that hybrid systems can bridge the gap between electricity and heating needs, offering a solution for reducing energy consumption and carbon emissions, especially in regions with limited solar resources. The optimal type of PV/T collector for meeting space heating demands largely depends on factors such as weather conditions and heating systems. Since the proposed study is for UK winter conditions, the thermal performance of the PV/T collector will be the main limitation while considering the low solar irradiance and high heating demand. Therefore, good thermal efficiency evacuated heat pipe collectors were also used in the modeling to compare the HP efficiency. Some proportion of the electricity needed for the building is also supplied by PV collectors; thus, a comparative study is required to see the potential of solar energy utilization.
Incorporating thermal storage in HP systems is crucial for reducing grid demand and enabling the system to operate using demand-side management techniques. While different control strategies are designed to achieve targets like minimizing operational costs, enhancing thermal comfort, and reducing carbon emissions, shifting heating and cooling loads to periods of lower demand is a practical approach as Le et al. [7] studied three load-shifting strategies for a cascade HP system under Northern Ireland’s climate. These strategies involved using a low-cost electricity tariff, running the unit during the day to take advantage of warmer outdoor temperatures and improved COPs, and a hybrid approach combining the benefits of cheaper nighttime electricity and higher daytime temperatures. Their findings showed that the hybrid strategy was the most effective. In this approach, the heat pump charges the thermal energy storage at 3 a.m. to take advantage of lower electricity prices and again at 2 p.m. when outdoor temperatures peak, with discharging scheduled for the morning and afternoon periods.
Among the various TES materials available, this work focuses on latent heat storage using PCMs. PCMs are increasingly popular in both research and commercial applications because of their high energy density and capacity to store and release heat within a limited temperature range [8]. Thus, PCMs are used for heat storage during off-peak hours and peak demand periods, effectively shifting the load and contributing to demand-side flexibility. In this way, using PCMs as heat storage can help regulate voltage in the distribution grid [9].
In the UK, the transport sector is responsible for 26% of the nation’s total greenhouse gas emissions, making it the most significant contributor among all economic sectors [10]. The gradual adoption of EVs is playing a significant role [11]. However, the growing popularity of EVs, fuelled by initiatives to lower carbon emissions, has introduced new challenges for the electrical grid due to the rapid increase in charging demand [12,13]. Currently, there are approximately 2,160,000 EVs in the UK, including 1,390,000 battery electric vehicles (BEVs) and 770,000 plug-in hybrid electric vehicles (PHEVs) [14]. Projections by the National Grid indicate that the number of BEVs could rise to 33 million by 2050 [15], emphasizing a potential significant charging demand. Recent studies and government reports highlight the necessity of innovative approaches to maintain grid stability and sustainability under the increasing load from EV adoption [12,16]. As EV adoption accelerates, integrating EVs into the grid has become a significant challenge. Recent studies highlight that the increasing penetration of EVs places significant stress on power networks. Without proper management strategies, these additional loads can exacerbate peak demand issues, strain existing grid infrastructure, and increase the likelihood of outages [17]. More specifically, recent research by Dik et al. [18] suggests that the current UK distribution networks are inadequate to handle a 100% EV adoption scenario. The combined adoption of EVs and HPs is projected to impose significant stress on local grids, resulting in overloads and potential reliability concerns. These findings underscore the urgent need for innovative grid management strategies, such as smart charging, to mitigate these impacts and support the ongoing energy transition.
Emerging technologies like HPs and EVs play a vital role in reducing carbon emissions in the heating and transportation sectors. However, their dependence on grid electricity, whose carbon intensity varies over time, highlights the importance of optimizing their operation through demand-side management. While previous studies have focused on individual components, such as PV/T collectors or PCM storage, this study addresses a gap by integrating hybrid PV/T systems, PCM-enhanced thermal storage, and smart EV charging under a unified control strategy. By using real-time weather and grid carbon data, this integrated system optimizes both HP operation and EV charging, offering practical solutions tailored to UK conditions with low solar irradiance and high heating demand. The present study evaluates the comparative performance of an HP system integrated with thermal collectors, PV/T collectors, and hybrid collectors alongside EV charging and PCM-enhanced heat storage. Unlike previous research that focuses on either PV or PV/T systems independently, this study combines these technologies to enhance heat storage and operational efficiency. By incorporating real weather data and a dynamic building energy model, this research assesses the potential of these integrated systems to improve energy efficiency and reduce carbon emissions, addressing key challenges posed by winter conditions and fluctuating grid carbon intensity in the UK.

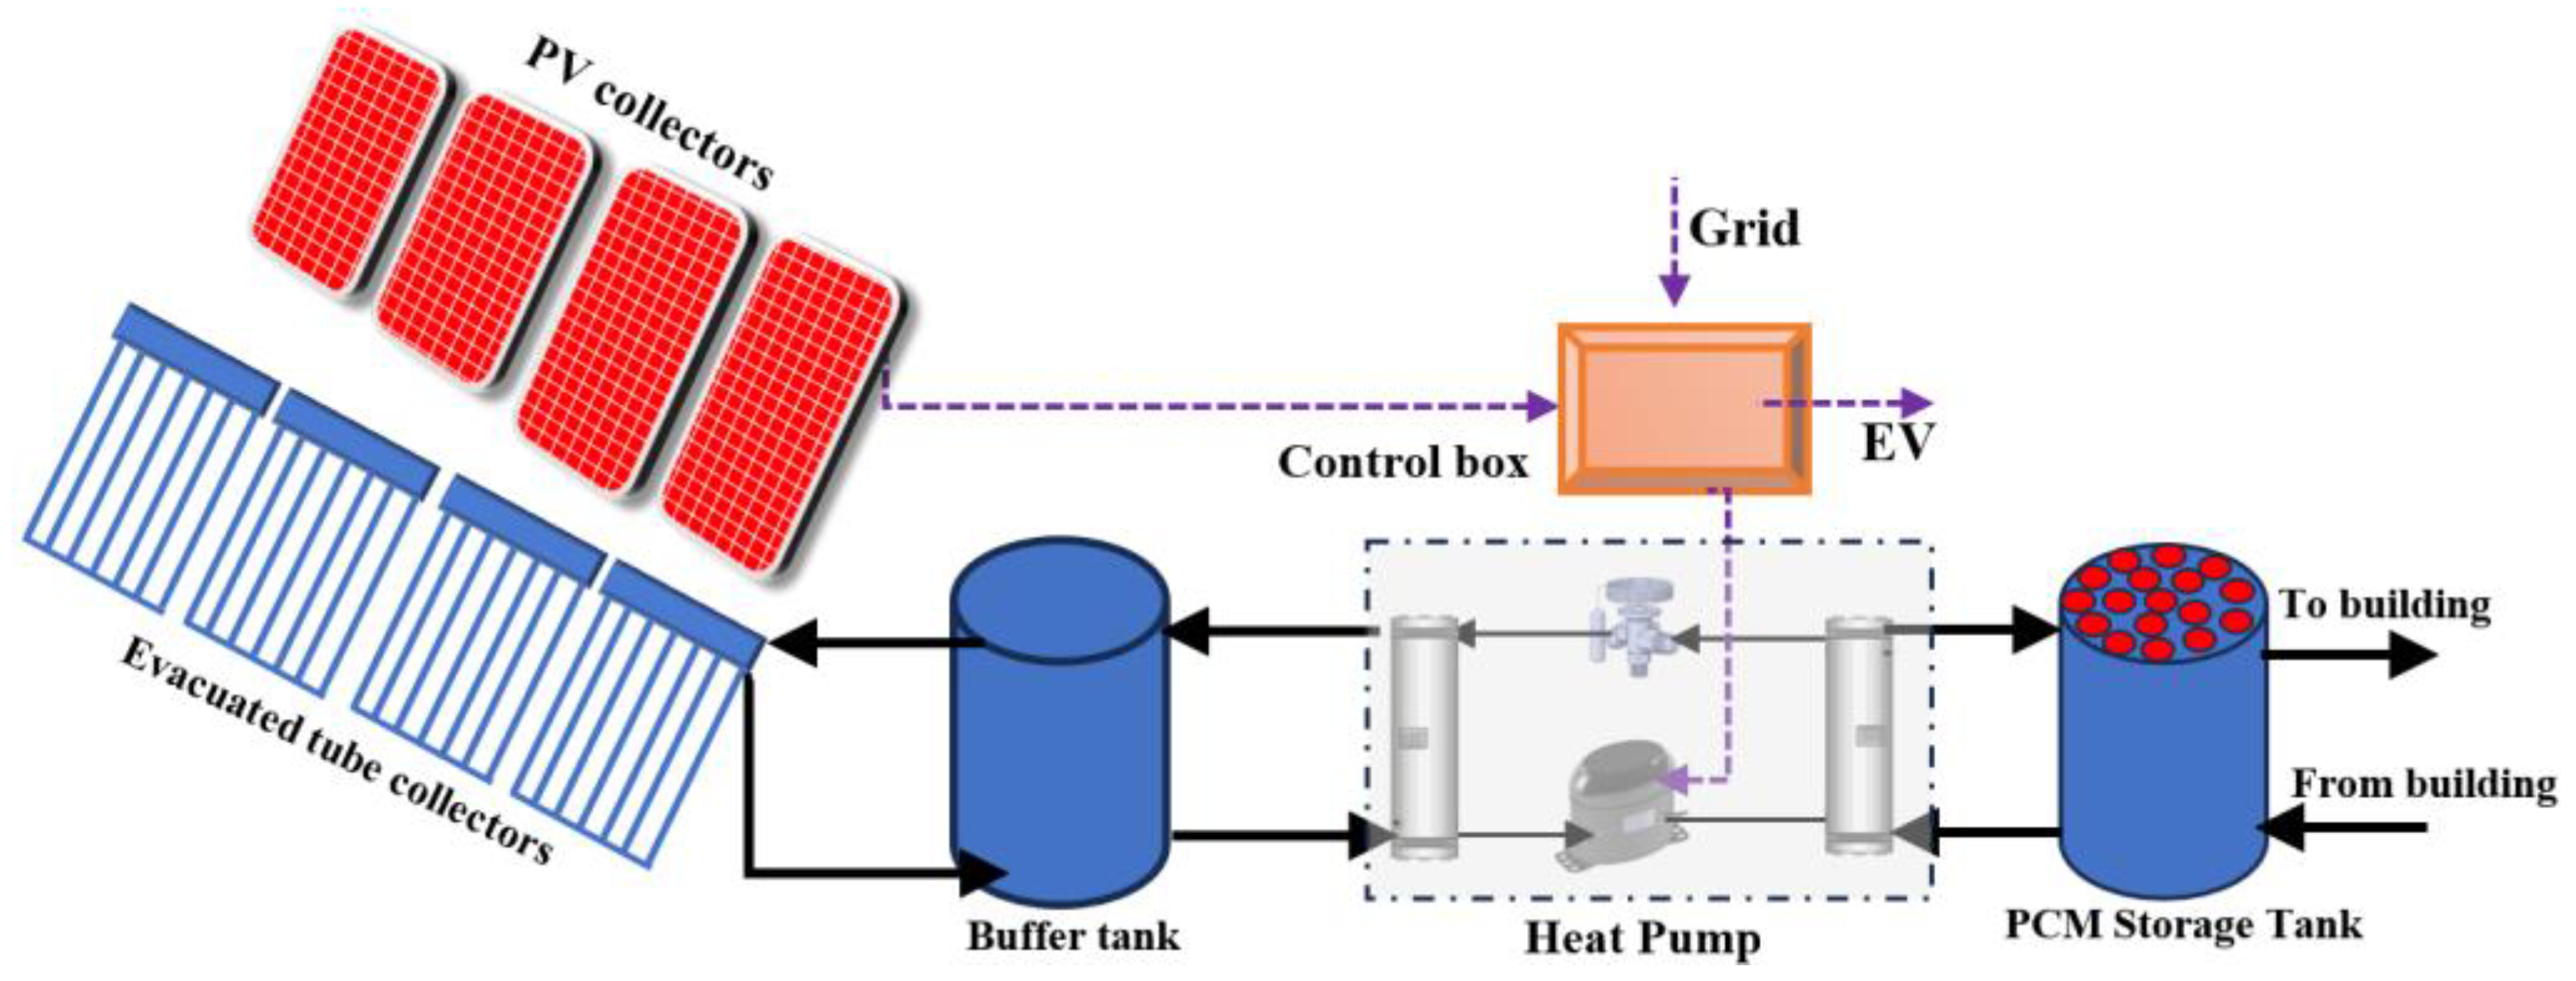
2. Concept Description and Method

The proposed system includes a solar array consisting of proportions of evacuated tube collectors and PV collectors or PV/T collectors. This solar array generates two outputs: electricity, which is directed to a control box, and thermal energy, which is stored in a buffer tank. The heat stored in the buffer tank enhances the HP’s performance, allowing it to consume less electricity for the same heating output. The HP is also connected to another thermal storage unit called a PCM storage tank.
This setup is designed to operate the HP during off-peak hours when carbon emissions are lower. The PCM storage tank provides daily heat storage. When grid carbon intensity is low, HP operates and stores the heat in the PCM tank. When the building requires heating, hot water from the tank is circulated throughout the building to meet its heating demand. Figure 1 shows the schematic of the proposed system. The electricity output from solar arrays reduces the electricity consumption from the grid for conventional household electricity demand.
As this study aims to reduce carbon emissions from space heating and EV charging, examining the carbon emission profile from the grid is necessary, and appropriate control strategies must be developed. For this purpose, data from the UK National Energy System Operator (NESO) were obtained at half-hour intervals [19]. Carbon intensity measures how many grams of carbon dioxide are released to produce one kilowatt-hour of electricity. Therefore, the national carbon intensity (gCO2/kWh) was analyzed to identify daily and hourly variations from 1 November 2023 to 1 February 2024, providing an overview of system operation control. Figure 2 illustrates the variations in carbon intensity over the examined three-month period, covering the peak heating season. It is well known that fossil fuels have high carbon emissions; however, the UK grid benefits from supporting carbon-free renewable energy sources. Consequently, the profile depends on electric demand and renewable energy generation, particularly wind energy. A combination of data from the three months was used to establish an average winter carbon intensity profile.
To construct a representative 24-h emission profile, carbon intensity data were systematically extracted from the records at each full hour (e.g., 1 p.m., 2 p.m., etc.). This procedure enabled the assessment of hourly variability in carbon emissions related to electricity generation throughout the day. These hourly data points were then averaged to form a composite 24-h cycle, presenting a typical pattern of carbon intensity fluctuations within a day. This average hourly profile briefly shows the variation in carbon intensity, which is essential for understanding the patterns of daily emissions. Figure 3 represents the derived profile, showing the typical daily fluctuations in carbon emissions from electricity generation. It highlights the peak and off-peak variations across a standard winter day.

Building Energy Simulation

In this study, the household’s thermal energy demand calculation, including space heating and hot water requirements, follows the methodology detailed in our previous research [18]. The approach involves utilizing Integrated Environmental Solutions Virtual Environment (IES VE 2023) software to model the building and analyze its thermal energy needs, with specific adjustments for the current study.
The model incorporated specific building materials and user profiles, such as occupancy schedules, lighting preferences, and thermostat settings, which were aligned with the physical characteristics and operational behaviors of the E.ON Research House. This house has been extensively analyzed by Hall et al. [20] for energy efficiency and occupant comfort improvements.
Hall et al. [20] also proposed a series of retrofitting options to enhance the energy performance of the E.ON Research House. The U-values for key structural components, such as the roof, floor, external walls, windows, and doors, were derived from their analysis and are shown in Table 1. These U-values were used in the IES VE model to ensure an accurate simulation of the building’s thermal performance.
This model assumed a family of four: two adults and two children. The heating profiles were established following the Chartered Institution of Building Services Engineers (CIBSE) Environmental Design Guide [21], while lighting and occupancy profiles were specified to reflect realistic usage patterns. Specific temperature set points and occupancy rates were applied throughout different times of the day and week, with weekday and weekend variations accounted for, as detailed in previous work [18].
The domestic hot water demand was estimated at 7 h, reflecting typical morning and evening routines. The per capita hot water usage was maintained at 30 L per person. Based on the building energy model, the heating demand profile is found and combined with the carbon intensity profile, as shown in Figure 4. The peak periods of the carbon intensity profile align with the peak hours of building heat demand. During these periods, national electricity demand is expected to be high, and renewable energy production is insufficient, resulting in increased reliance on carbon-based power sources to supply the grid. Considering the increasing number of EVs and the tendency to charge them upon drivers’ arrival, the peak load is expected to be further aggravated. To address this issue, Figure 4 highlights the necessity of heat storage systems and demand-shifting strategies to reduce carbon emissions. It also identifies potential periods for HP and EV charging operations. Therefore, the paper investigates the performance of the HP system considering PCM charging, demand shifting, various PV and thermal collectors, and using state-of-the-art PV/T collectors to present the carbon savings achieved on a simulated day.
Based on the simulated building model, a solar collector area of 50 m2 was selected, taking into account the available roof area. As the study aims to demonstrate the comparative effects of different collector types and proportions on heat pump performance and grid carbon emissions, scenarios ranging from 100% thermal collectors to configurations with gradually increasing proportions of PV collectors are presented. This approach allows for a comprehensive assessment of how varying the thermal and PV collector proportions impacts HP performance and grid emissions. The design of the PCM storage tank is based on the daily heating requirement of the building, ensuring sufficient latent heat storage to meet the space heating demand during typical winter days. The daily heating demand is determined from the building energy simulation, which calculates a requirement of 34.5 kWh on colder winter days. This value is used to size the PCM storage tank to ensure sufficient energy storage capacity for the house when the HP is off. The required PCM mass is determined based on the latent heat of the selected PCM material, yielding a PCM mass of approximately 380 kg. Further considerations in the PCM tank design ensure that the system can be fully charged within 4–5 h during nighttime, taking advantage of low-carbon-intensity periods. The HP heating capacity is selected as 8 kW, considering that when the water temperature in the tank reaches the HP’s maximum heating temperature, the heating capacity will decrease due to the reduced heat transfer rate to the PCM and heat losses to the ambient environment. Additional details regarding these design considerations are provided in the results section.

3. System Modeling for Simulations

3.1. Modeling of Solar HP Components

The solar array can be a combination of several thermal collectors and PV panels or just PV/T collectors. The thermal collectors are modeled under quasi-steady state conditions using steady-state equations, with the thermal capacity of the collectors neglected. Modifications of the thermal efficiencies were applied to the evacuated tube heat pipe collector. The equation of the evacuated heat pipe collector thermal efficiency is used as follows [22]:
η t h = 0.556 0.888 · T m T a G 0.006   · T m T a 2 G
where T a is the ambient temperature, T m is the mean temperature of the fluid inside the collector, and G is the solar irradiance.
As an alternative, in order to produce heat and electricity simultaneously, evacuated flat plate PV/T collectors are chosen for thermal and electrical management. Since the vacuum environment considerably reduces the convection heat losses from collector to environment, using evacuated flat plate collectors would be efficient in winter applications. Experimentally obtained thermal efficiency equation and electrical efficiency variation are taken from the reference paper [23]. Equation (2) is given for the thermal efficiency equation of the PV/T collector:
η P V / T = 0.6185 9.5963 · T i n T a G
where η P V / T is the thermal efficiency of the PV/T collector. Where T i n is the inlet temperature of the fluid to the collector. The electrical efficiency was reported to fall from 12.5% to 10.5% for temperatures from 25 °C to 60 °C. In this study, the operation temperature will reach a maximum of 25–30 °C because of winter application, which means the electrical efficiency will be high and determined from the empirically obtained equation.
The useful solar heat is calculated using Equation (3):
Q ˙ c o l = η t h · A c o l · G
To calculate the collected useful heat from the PV/T collector, the thermal efficiency of the PV/T collector needs to be used in Equation (3). The collected solar heat is stored inside the buffer tank. The heat transfer fluid coming from the buffer tank enters the collector, is heated, and leaves the collector with a higher temperature. Equation (4) is given to calculate the collector exit temperature.
Q ˙ c o l = m h t f · c p h t f · T c o l , e x i t T c o l , i n
For PV panel modeling, normal operating cell temperature (NOCT) is used. This value is given by the manufacturer. In order to calculate the cell temperature, Equation (5) is used [24].
T c e l l = T a + N O C T 20 · G 800
The electrical efficiency of the PV module is calculated by Equation (6):
η P V = η r 1 β r · T c e l l T r
where η r is the efficiency at the reference temperature. It was taken as 12.64%, NOCT was 47 °C and β r was −(0.46)%K [25].
To calculate produced electricity from the PV system, Equation (7) is used:
η g P V = η P V · η D C A C
where η D C A C indicates the conversion efficiency of DC to AC. It changes depending on solar irradiance [26,27]. For < 300   W / m 2 , η D C A C was 80%. For 300   W / m 2   < G < 500   W / m 2 , η D C A C was 85%.
The heat collected by the solar collectors is stored in a buffer tank, which is filled with an ethylene glycol–water mixture to prevent freezing under low-temperature conditions, as commonly done in real applications. The buffer tank serves as a thermal reservoir, being charged by the solar collectors and discharged by the heat pump during operation. Additionally, it experiences ambient heat losses throughout the day. This fluid selection ensures reliable system performance during winter and prevents potential freezing issues. The buffer tank temperature should be higher than the ambient temperature in order to provide a better performance than conventional air-sourced HP.
In order to model the buffer tank, which is charged by solar collectors and discharged by HP, besides being exposed to ambient heat losses during the day. The transient temperature change of the buffer tank was modeled by using a one-node energy balance model [28].
m t · c p ,     H T F · d T t d t = Q ˙ c o l l e c t e d U A t · T t T r o o m Q ˙ e v a p
where T t is the buffer tank temperature, Q ˙ e v a the evaporator capacity, and U is the overall heat loss coefficient (taken as 0.8 W/m2) [29].
The HP unit consists of four main components: compressor, condenser, expansion valve, and evaporator. The evaporator uses the heat that comes from the buffer tank, and the condenser of the HP heats the PCM tank.
The following assumptions are considered for HP performance calculations:
  • The constant pressure is assumed for condensation and evaporation;
  • The 3 °C subcooling ( Δ s u b c o o l i n g ) and superheating ( Δ s u p e r h e a t i n g ) temperatures are given;
  • The evaporation temperature in the evaporator depends on the buffer tank temperature. An 8 K pinch temperature difference is selected;
  • In order to charge the PCM, the condensation temperature is chosen as 70 °C [29].
The refrigerant is evaporated using the heat stored in the buffer tank.
Heating load is calculated by Equation (9):
Q ˙ c o n = m ˙ r × h 2 h 3
The electricity consumed by the compressor W ˙ c o m p r e s s o r is calculated by Equation (10).
W ˙ c o m p = m ˙ r × h 2 h 1
COP of the HP unit can be expressed as follows:
C O P = Q ˙ c o n W ˙ c o m p
The PCM storage unit consists of a cylindrical container holding multiple cylindrical PCM tubes arranged horizontally. The unit is divided into “n” control volumes for analysis. To study temperature gradients and heat transfer, it is assumed that mass transfer within the tank occurs in one dimension. Consequently, the length of the tank is divided into nodes, and the energy balance equations for these nodes are solved simultaneously. Similarly, the PCM tubes are segmented into radial nodes to analyze heat transfer from their center to the outer edges.
To reduce the phase change time and keep the length of the tank as short as possible, 23 PCM tubes are inserted in the tank [30]. As the tank is horizontally positioned as given in Figure 5, the flow is longitudinal, and for the longitudinal flow Equation (12) is given for laminar flows [31]:
N u = 0.128 · R e 0.8 · P r 0.8 · P r P r w 0.14
where Re, Pr, and Prw are the Reynolds number, Prandtl number, and the Prandtl number at the wall temperature. However, this equation is valid for Re > 400, Nu > 7, and staggered arrangement that in this study, the examined PCM storage tank has a different arrangement in order to maintain more PCM tubes. Therefore, to determine the convective heat transfer coefficient between the water and the PCM tube walls, a numerical analysis was conducted using ANSYS Fluent 2021 R1 software.
In space heating and DHW applications, commonly used PCMs have melting points within the 40–60 °C range. In this study, sodium acetate trihydrate was selected due to its stable behavior and relatively higher safety compared to other PCM options. The thermophysical properties of the material can vary slightly depending on the solution concentration and temperature. However, for the simulation, a melting temperature of 58 °C was assumed, while other properties were treated as constants, including a latent heat of 264 kJ/kg, thermal conductivity of 0.6 W/(m·K), and specific heat of 2.9 kJ/(kg·K). The PCM model was validated using experimental data from a single-tube melting study previously reported in [32].

3.2. Modeling of EV Behavior and Charging Operations

In this study, the methodology for modeling EV charging and smart charging operations is adapted from the approach used in our earlier research, which focused on a larger distribution grid with multiple EVs [18]. While this study narrows the scope to a single household with one EV, the same core principles are applied, utilizing a randomized behavior simulation (RBS) approach to account for variability in EV charging patterns and behavior.
EV charging is modeled using a stochastic approach to capture the unavoidable variability and uncertainty in charging behaviors, vehicle types, and environmental factors. In this household-specific study, the RBS approach is employed to simulate the randomness in key parameters such as the vehicle’s battery capacity, state of charge (SOC), charger type, and daily driving patterns, reflecting real-world dynamics.
Vehicle variety remains crucial in determining EV charging demand, as different EV models have varying battery capacities and consumption rates. The International Energy Agency (IEA) [33] reports that over 590 different EV models are available globally and are expected to reach 1000 by 2028. This diversity necessitates accounting for vehicle variety in any predictive model of EV charging demand, even at the household level.
To address this, the most popular EV models in the UK, along with their respective battery capacities and consumption rates, were examined and incorporated into the model, as detailed in Table 2. The data presented in Table 2 were derived from the Department for Transport (DfT) [34] and EV-Database [35]. Instead of assigning a fixed vehicle model, the RBS model randomly assigns one of these EVs to the household from the list. This approach captures the potential variability in energy demand caused by differences in vehicle specifications.
The simulation examines 3 kW and 7 kW home chargers, reflecting the range of charging options typically available in UK households, as discussed by the DfT [36] and Zap-Map [37]. The 3 kW chargers represent standard domestic slow chargers, while the 7 kW chargers offer a faster option that is also available for residential installations. Including both charger types allows RBS to capture the potential variability of home charging scenarios, accounting for differences in charging speeds and power consumption.
The RBS approach also models the availability of the EV for charging by stochastically incorporating vehicle arrival and departure times, a key factor influencing charging demand predictions. The timing of EV availability can significantly impact a house’s hourly energy consumption, as varying arrival and departure times determine when the EV is connected for charging.
In this study, EV availability data were derived from the analysis by Wang et al. [38], who analyzed the UK 2000 Time of Use Survey (TUS) conducted by the Office for National Statistics. For the simulation, vehicle percentages for arrival and departure time slots were taken from [38] and then normalized to create a realistic distribution of EV availability. The arrival and departure times for the household’s EV were generated stochastically using empirical distributions derived from these data, with the inverse transform sampling (ITS) method employed to generate random samples based on the original time-of-use patterns. Following that, to ensure accuracy, a two-sample Kolmogorov–Smirnov (K-S) test was applied to assess the statistical similarity between the generated times and the original distribution from the survey data.
The RBS approach also includes modeling daily travel distances directly influencing the EV’s SOC upon returning to the household. Travel distances are a critical factor in determining how much energy the EV requires for charging, as longer travel distances deplete the battery more, leading to higher energy demand upon arrival. To simulate these variations, the model uses data from the DfT National Travel Survey (NTS) [39], which provides data on typical annual mileage and daily travel patterns in the UK.
The model randomly generates travel distances to reflect the range of travel behaviors observed in the DfT’s NTS data [39]. This process involves two main methods: weighted random sampling (WRS) and uniform random sampling (URS). WRS is used to assign probability weights based on the mileage ranges documented in NTS data, allowing the model to realistically assign travel distances to the EV consistent with real-world data. URS is then applied to generate specific mileage values within these ranges, producing travel distances that are both randomized and representative of typical usage.
To ensure the accuracy of the generated travel distances, a Chi-Square goodness-of-fit test is conducted to compare the simulated distances with the original NTS distribution. This test serves as a validation step, verifying that the modeled travel patterns closely align with actual data and ensuring that the EV’s charging needs are based on realistic travel scenarios.
Additionally, RBS incorporates factors such as daily ambient temperature, which can affect the EV’s energy efficiency. For example, using the methodology developed by Hao et al. [40], the model adjusts energy consumption rates based on changes in ambient temperature, increasing the vehicle’s energy demand when temperatures fall below 10 °C or rise above 28 °C.
To further enhance the simulation, the SOC range is limited to an optimal range of 20–80%, a practice that supports both battery longevity and energy efficiency [41,42]. Finally, the RBS calculates the energy required for a full charge ( E 80 % ), the time necessary to reach this SOC level ( T 80 % ), and the hourly demand on the grid from EV charging operations ( E l o a d ), as shown in Equations (13)–(15), respectively.
E 80 % , n = P b a t t e r y , n × 0.8 S o C n
T 80 % , n = E 80 % , n ÷ P c h a r g e r , n × μ c h a r g e r
E l o a d , t = m i n E 80 % , n , t ÷ μ c h a r g e r ,   P c h a r g e r , n × 1   h o u r
where P b a t t e r y refers to the power capacity of the EV’s battery, P c h a r g e r represents the power rating of the charger and μ c h a r g e r shows the charging efficiency, which is set at 90% for this study, in line with [18]. This approach provides a comprehensive assessment of charging demand at the household, offering a detailed view of the energy impact of EV usage under varied daily conditions.
In this research, a smart charging algorithm is applied to optimize EV charging operations to minimize associated CO2 emissions. The algorithm operates dynamically within the RBS framework by analyzing hourly grid carbon intensity data. This ensures that the charging process is aligned with periods of lower grid emissions, thereby reducing the overall environmental impact of EV charging.
The algorithm evaluates several real-time factors to determine the optimal charging schedule. These include the EV’s availability, which is based on its stochastically generated arrival and departure times, and its charging needs, calculated using the vehicle’s current SOC and battery capacity. The algorithm also takes into account the charger power rating and charging efficiency, ensuring compatibility with the household’s infrastructure. The algorithm dynamically monitors these parameters and identifies the best possible time to initiate charging.
The proposed smart charging algorithm is designed to adapt to varying household energy demands, including electricity usage and heating requirements, by dynamically adjusting EV charging schedules based on grid carbon intensity. The RBS approach accounts for different SOC levels, various driving patterns, and EV ownership scenarios by optimizing charging times to minimize peak demand and emissions, therefore enhancing system scalability. The algorithm also supports different charger power levels, ensuring flexibility across various household settings. Beyond individual homes, the smart charging algorithm is scalable for community-level implementation, where aggregated charging coordination can reduce grid stress and enhance renewable energy utilization, as introduced in [18].
The approach integrates hourly CO2 emission factors from the grid with the modeled charging behaviors, creating a responsive system that prioritizes sustainability. This enables the algorithm to delay charging to periods with lower grid emissions, optimizing the process without compromising the vehicle’s readiness. Balancing user charging requirements with grid emissions data ensures a more efficient and environmentally friendly integration of EVs into the energy system.

4. Results and Discussions

The results section includes the determination of the storage size, which depends on the heat supply performance. Subsequently, the charging performance of the investigated cases for the selected day is presented.
In the charging section, the solar collector type and area significantly influence the collected heat. The cases were compared based on specific types and areas of the collector. As a reference, a solar collector area of 50 m2 was chosen, which can be easily installed on the roof of a building with a floor area of 70–100 m2. Accordingly, the 100% thermal collectors case represents 50 m2 of thermal collectors. The 60% thermal and 40% PV collector case refers to an installation of 30 m2 thermal collectors and 20 m2 PV collectors for the SAHP unit. In all scenarios, a 1 m3 buffer tank was utilized, as the system charged during nighttime.

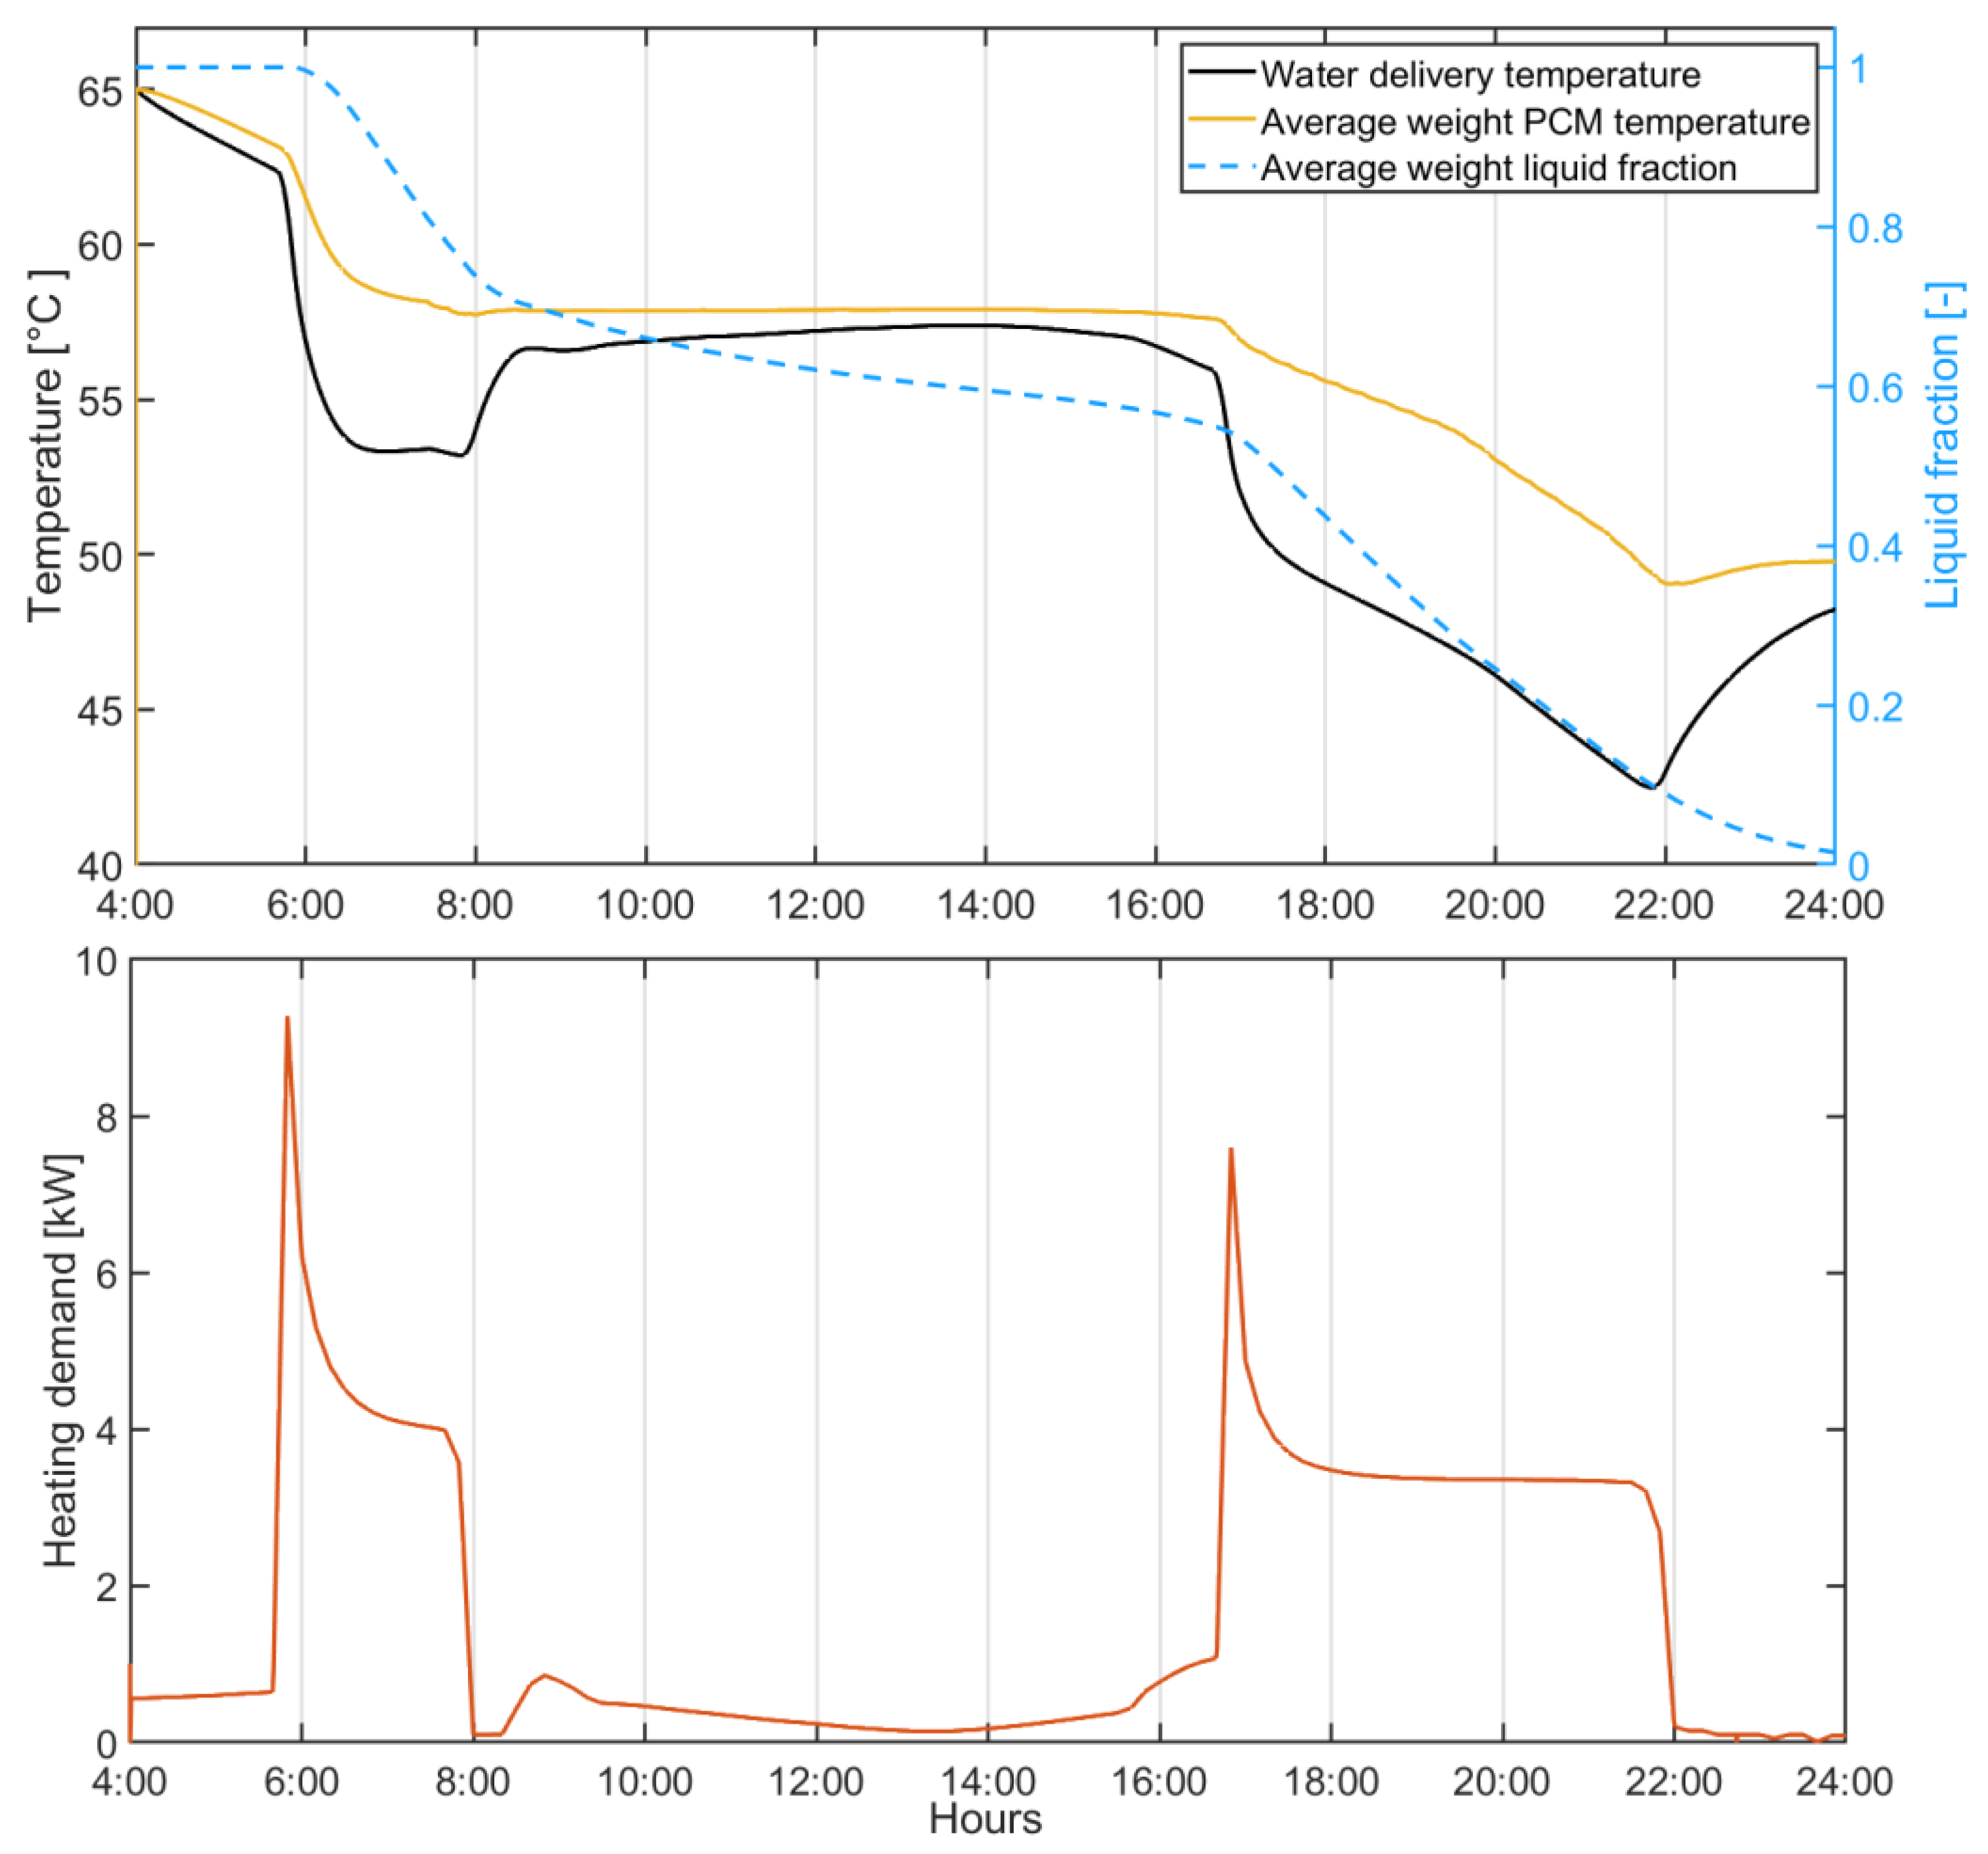
4.1. Heat Supply Performance of the PCM Storage Tank

The PCM storage tank was designed to meet the daily heating requirements of the building and must also be charged during nighttime. The daily heating requirement of the house is calculated to be 34.5 kWh, which accounts for high heating loads on colder winter days. Accordingly, the latent heat capacity of the PCM storage tank is selected to match this demand. Since the heating demand varies with weather conditions, there may be days when the tank is not fully discharged due to lower heating loads. This is acceptable, as the charging load during the night will also be reduced. Conversely, on some days, auxiliary heating may be required to maintain comfort conditions.
The required PCM mass is determined to be 380 kg. To ensure that the PCM can be fully charged within 4–5 h during the night, the PCM tube diameter and length are set at 0.09 m and 1.8 m, respectively. A similar optimization method is followed as outlined in reference [32]. Figure 6 illustrates the heat supply performance of the selected PCM tank size.
At the end of the charging period (4 a.m.), the tank is assumed to be at 65 °C with the PCM fully melted. The discharging performance test begins at 4 a.m. Between 4 a.m. and 5:45 a.m., the heating requirement of the building remains below 1 kW, causing the tank temperature to drop slightly while the PCM remains in a liquid state. However, around 6 a.m., the heating demand increases, and the water temperature begins to decrease rapidly. At this point, the PCM starts to solidify from the outer surfaces of the PCM tubes. For this reason, the average PCM liquid fraction, in addition to the PCM temperature, is provided.
The heating demand ended at 10 p.m., when the charging process started again. Throughout the heating period, the hot water delivery temperature consistently remains above 40 °C. In this case, the PCM storage tank demonstrates its ability to provide sufficient heating for the residence, even under high heating loads, as long as it was properly charged to 65 °C. Therefore, the strategy was to maintain a fully melted PCM tank at 65 °C during the charging period, which was set between 10 p.m. and 4 a.m.

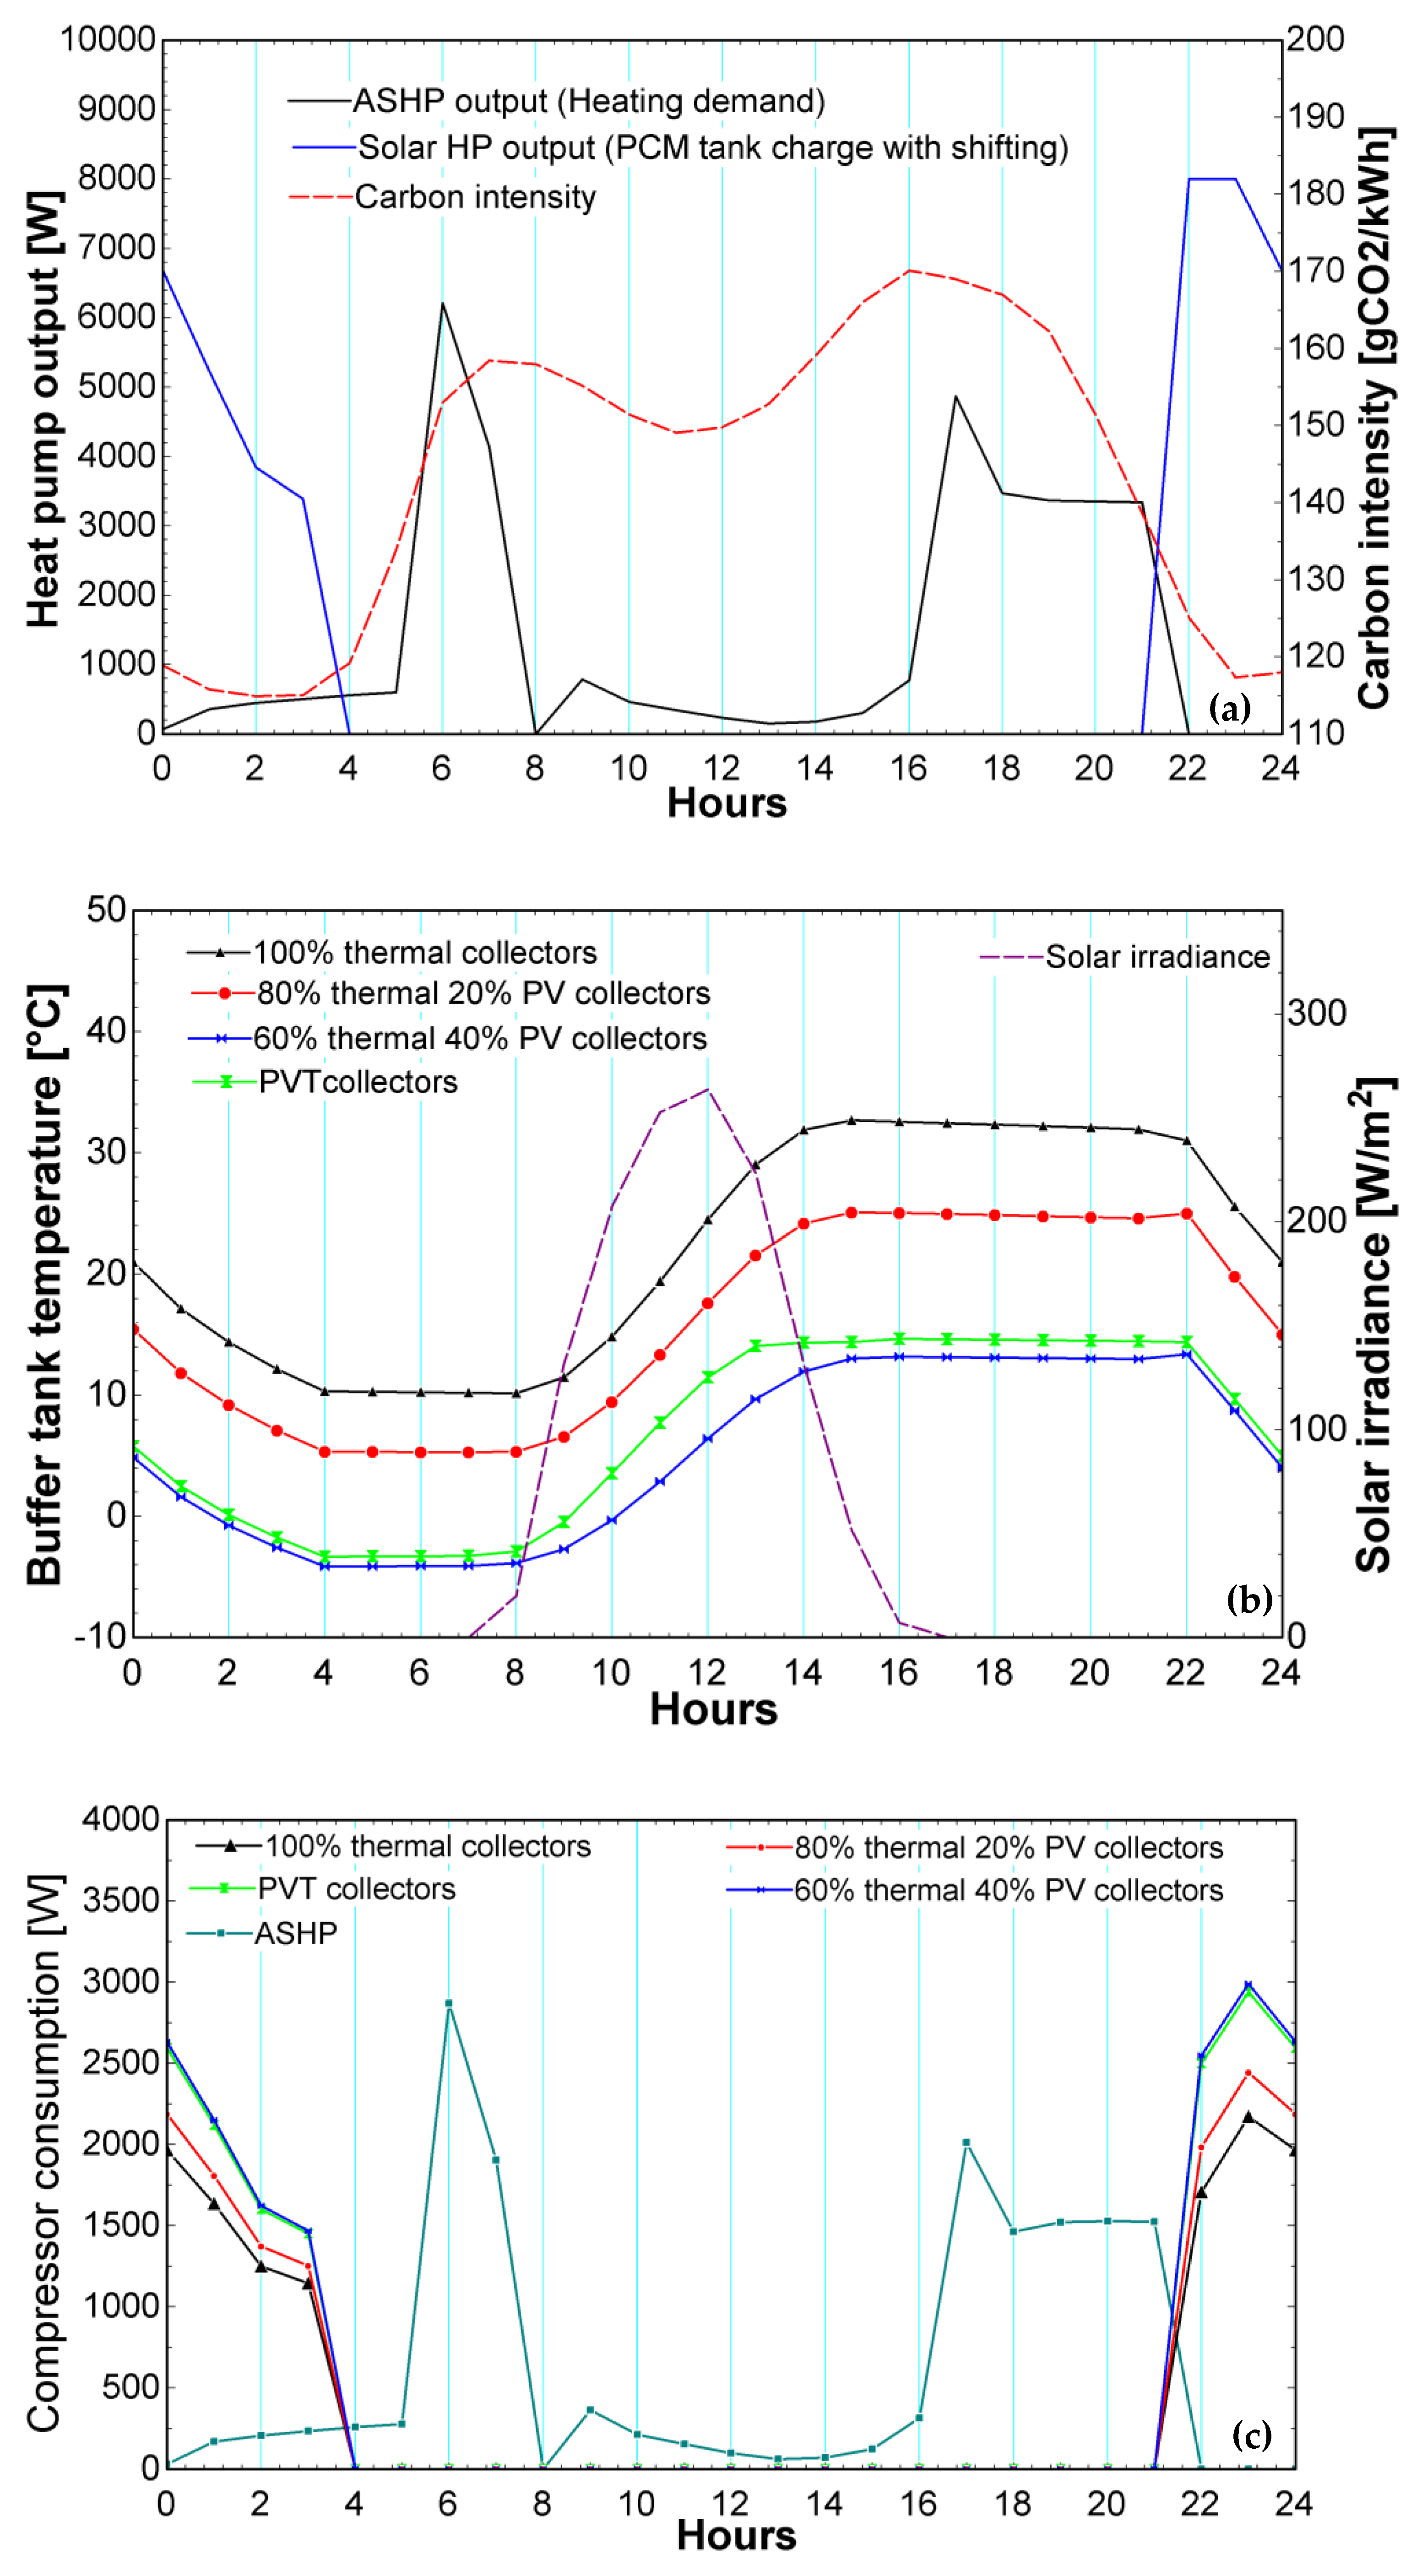
4.2. Heat Pump Operation

After designing the PCM storage tank, this section focuses on the operation of ASHP and SAHP options. In terms of operation, the ASHP directly provides heating to the building, matching the heating demand exactly. However, SAHP systems operate only during low-carbon hours, defined as the period from 10 p.m. to 4 a.m. During the daytime, the solar array collects solar energy and stores it in the buffer tank.
The temperature of the buffer tank depends on the type of solar collector used and the proportion of the hybrid system. These factors also influence the power consumption of the heat pump, as it varies in parallel with the buffer tank’s temperature and the efficiency of the solar energy collection.
Figure 7a presents the heating profiles of the HPs and the carbon intensity profile of the grid. Since the ASHP operates directly in line with the demand profile, its output matches the heating demand profile. The operation of the SAHP begins in the evening and concludes at 4 a.m., as demand shifting is required during this period when the grid’s carbon intensity is low. A key requirement for the SAHP is to fully charge the PCM tank during this period. Considering the maximum heating capacity of 8 kW, the profile shown is obtained. Maximum heating is provided during the first hour, as the water temperature is initially low, resulting in relatively higher sensible heating. Subsequently, the heating output decreases as the circulating water temperature rises. By 4 a.m., the heat pump is able to fully charge the PCM tank, irrespective of the type of solar collector used or the proportions of hybridization.
As the performance of the HPs depends on the buffer tank temperature, Figure 7b is given. The figure shows the buffer tank temperature variation of the examined systems and solar irradiance profile. For all cases, the temperature of the buffer tank falls during the HP operation time. Although the supplied heating profile is identical for all cases, the heat extracted from the buffer tank varies due to differences in the COP of the systems. As expected, the case with 100% thermal collectors collects the maximum heat, resulting in the highest buffer tank temperature. However, as the proportion of thermal collectors in hybrid systems decreases, the maximum buffer tank temperature also decreases. For the examined day, when all collectors are thermal collectors, the buffer tank temperature can exceed 30 °C. In contrast, in the case of 60% thermal and 40% PV collectors, the temperature only reaches 12 °C, leading to a notable performance difference.
An important finding is the performance of the PVT collectors. When PVT collectors are used, the buffer tank temperature slightly exceeds that of the 60% thermal and 40% PV hybrid system. This is attributed to the high thermal efficiency of evacuated flat-plate PV/T collectors, as reported in the literature. The PV area in this type of PV/T collector is 70%, providing a larger PV area compared to this hybrid system, which will further contribute to this improved performance.
Since the instantaneous COP does not hold much significance in this study due to the heating capacity varying over time, the compressor energy consumptions of the systems are compared in Figure 7c. As expected, the ASHP exhibits the highest daily compressor energy consumption, totaling 15.4 kWh. It is also observed that the compressor power is drawn during periods of high grid carbon intensity. The best performance is achieved by the 100% thermal collector SAHP system, as it maximizes solar energy collection and allows demand shift to the low carbon intensity hours. A summary of the energy consumption and daily COP values of the systems is provided in Table 3.
Similar to the buffer tank temperatures, the daily compressor energy consumption of the PV/T collector unit is very close to that of the 60% thermal collector hybrid case. However, the electricity output of these systems could create a significant difference. It should be noted that the calculated COP does not account for the PV electricity outputs. A discussion of the overall energy consumption will be provided in the following sections.

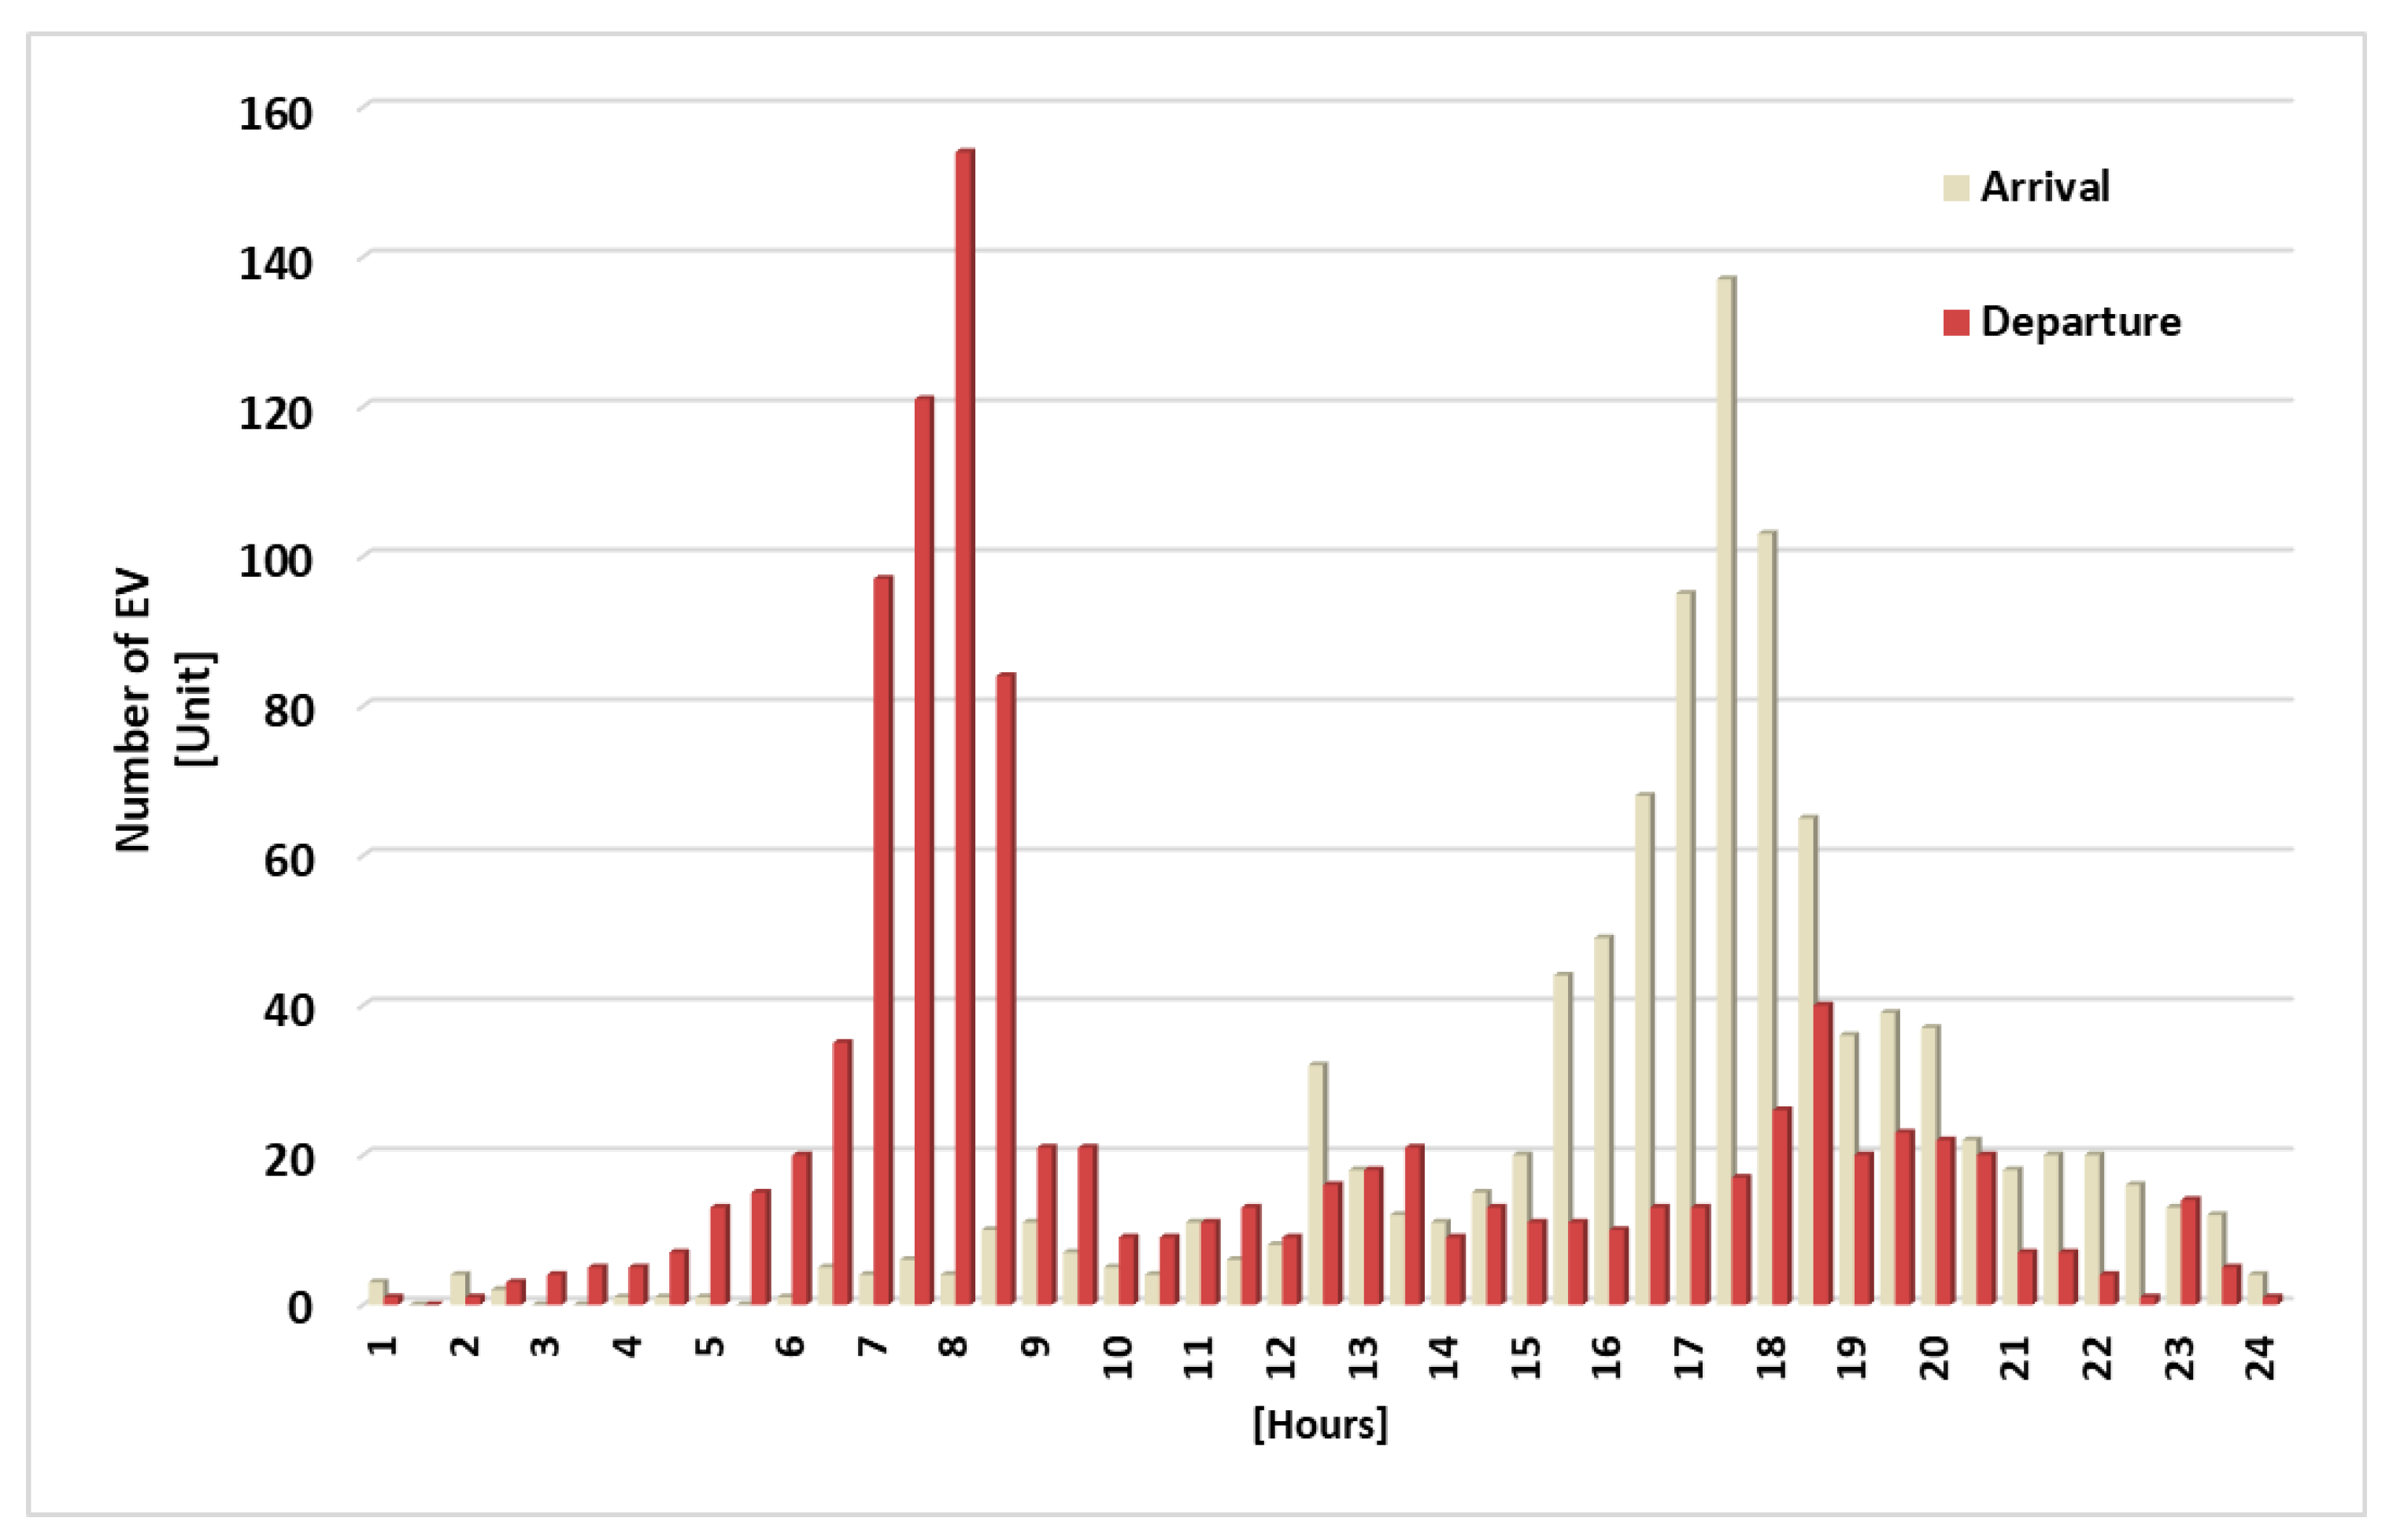
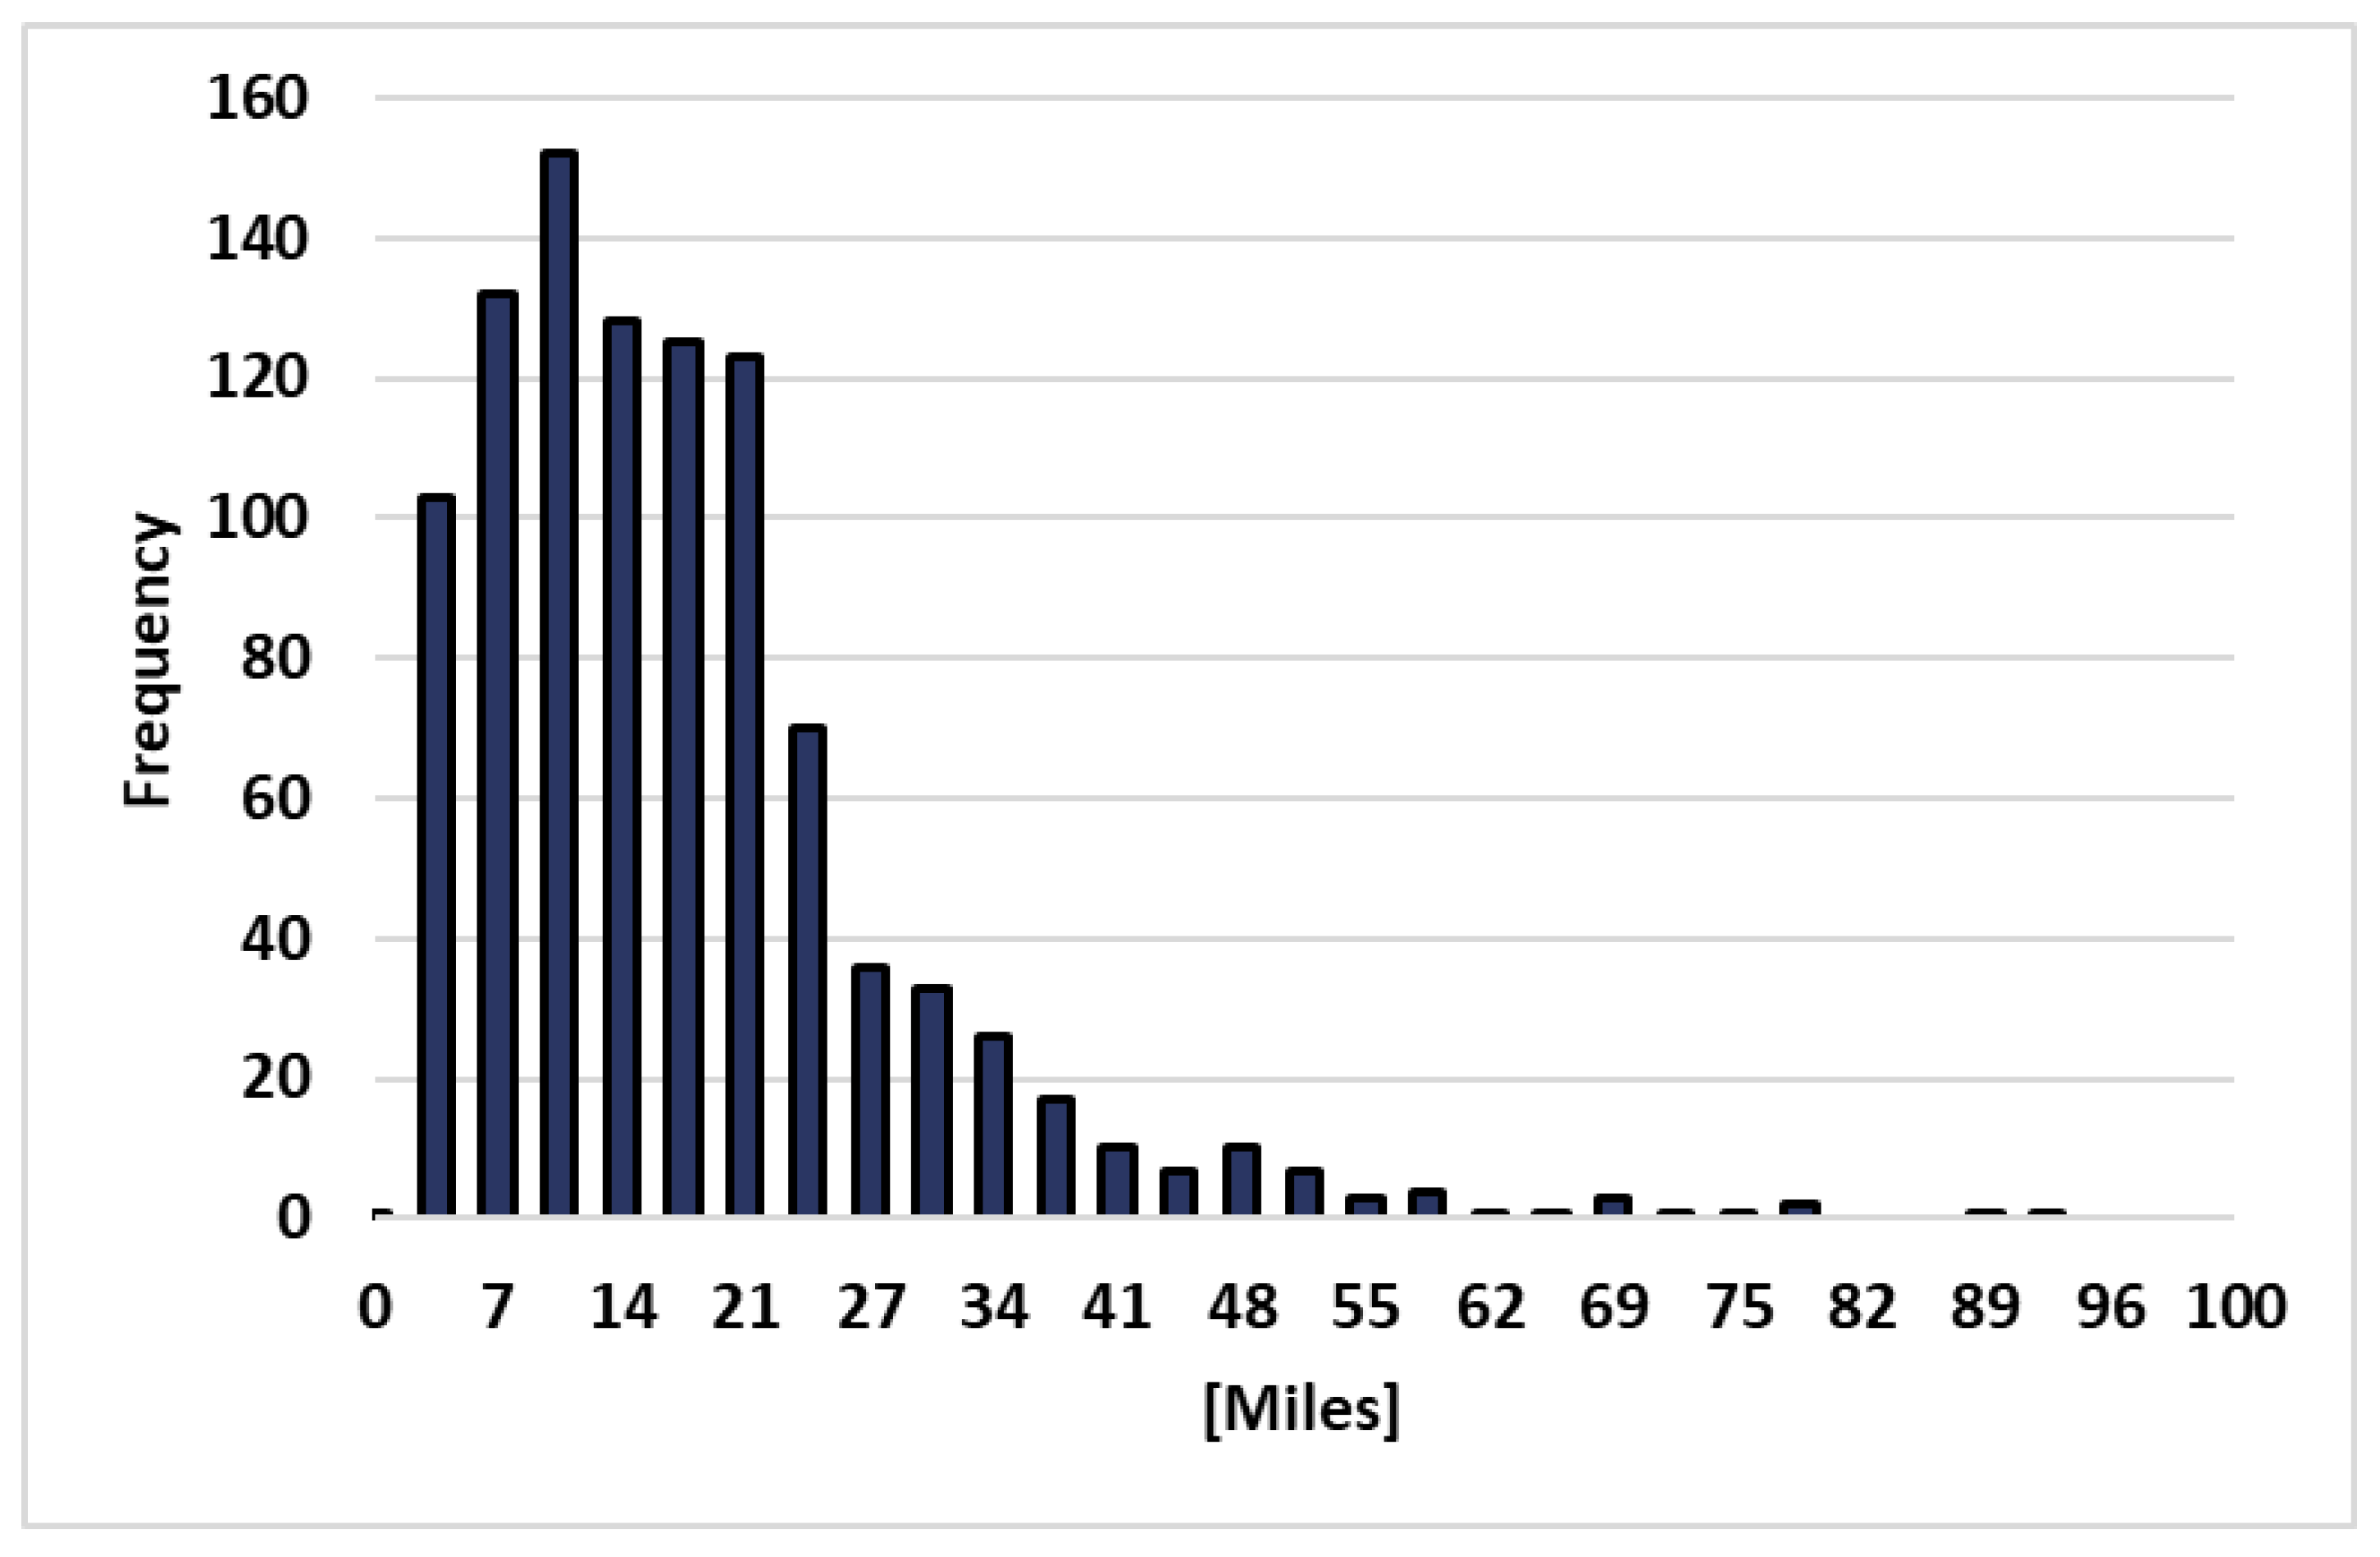
4.3. Analysis of EV Behavior and Travel Patterns

This section presents the findings on EV demand and the potential impacts of V1G applications at the household level. The results provide insights into the variability in energy demand associated with EV use by analyzing key factors such as EV availability (arrival and departure times), daily travel distances, and charging power requirements. Additionally, statistical tests, including the K-S test and Chi-Square goodness-of-fit test, are used to validate the generated data, ensuring that the simulated patterns closely align with real-world conditions.
The generated distributions for EV arrival and departure times, based on the empirical distributions derived from Wang et al.’s [38] analysis of the UK 2000 TUS, are shown in Figure 8. These distributions capture the variability in the times when the EVs arrive at and depart from the household, significantly impacting the grid’s charging demand. To validate the accuracy of these simulated distributions, a K-S test was conducted, producing p-values of 0.96 for the arrival times and 0.83 for the departure times. Since both p-values are greater than the significance level (α = 0.05), it fails to reject the null hypothesis, indicating that the differences between the original and simulated distributions are not statistically significant.
In addition to arrival and departure times, the RBS approach models the daily distance traveled by the EV based on stochastically generated distributions derived from the empirical data provided by NTS [39]. These distributions capture variability in daily travel behavior and are presented in Figure 9. A Chi-Square goodness-of-fit test was conducted on the generated travel distances, with the test generating a p-value of 0.67. This also exceeds the 0.05 threshold, meaning the simulated distances align well with real-world data without significant differences from the original distribution.

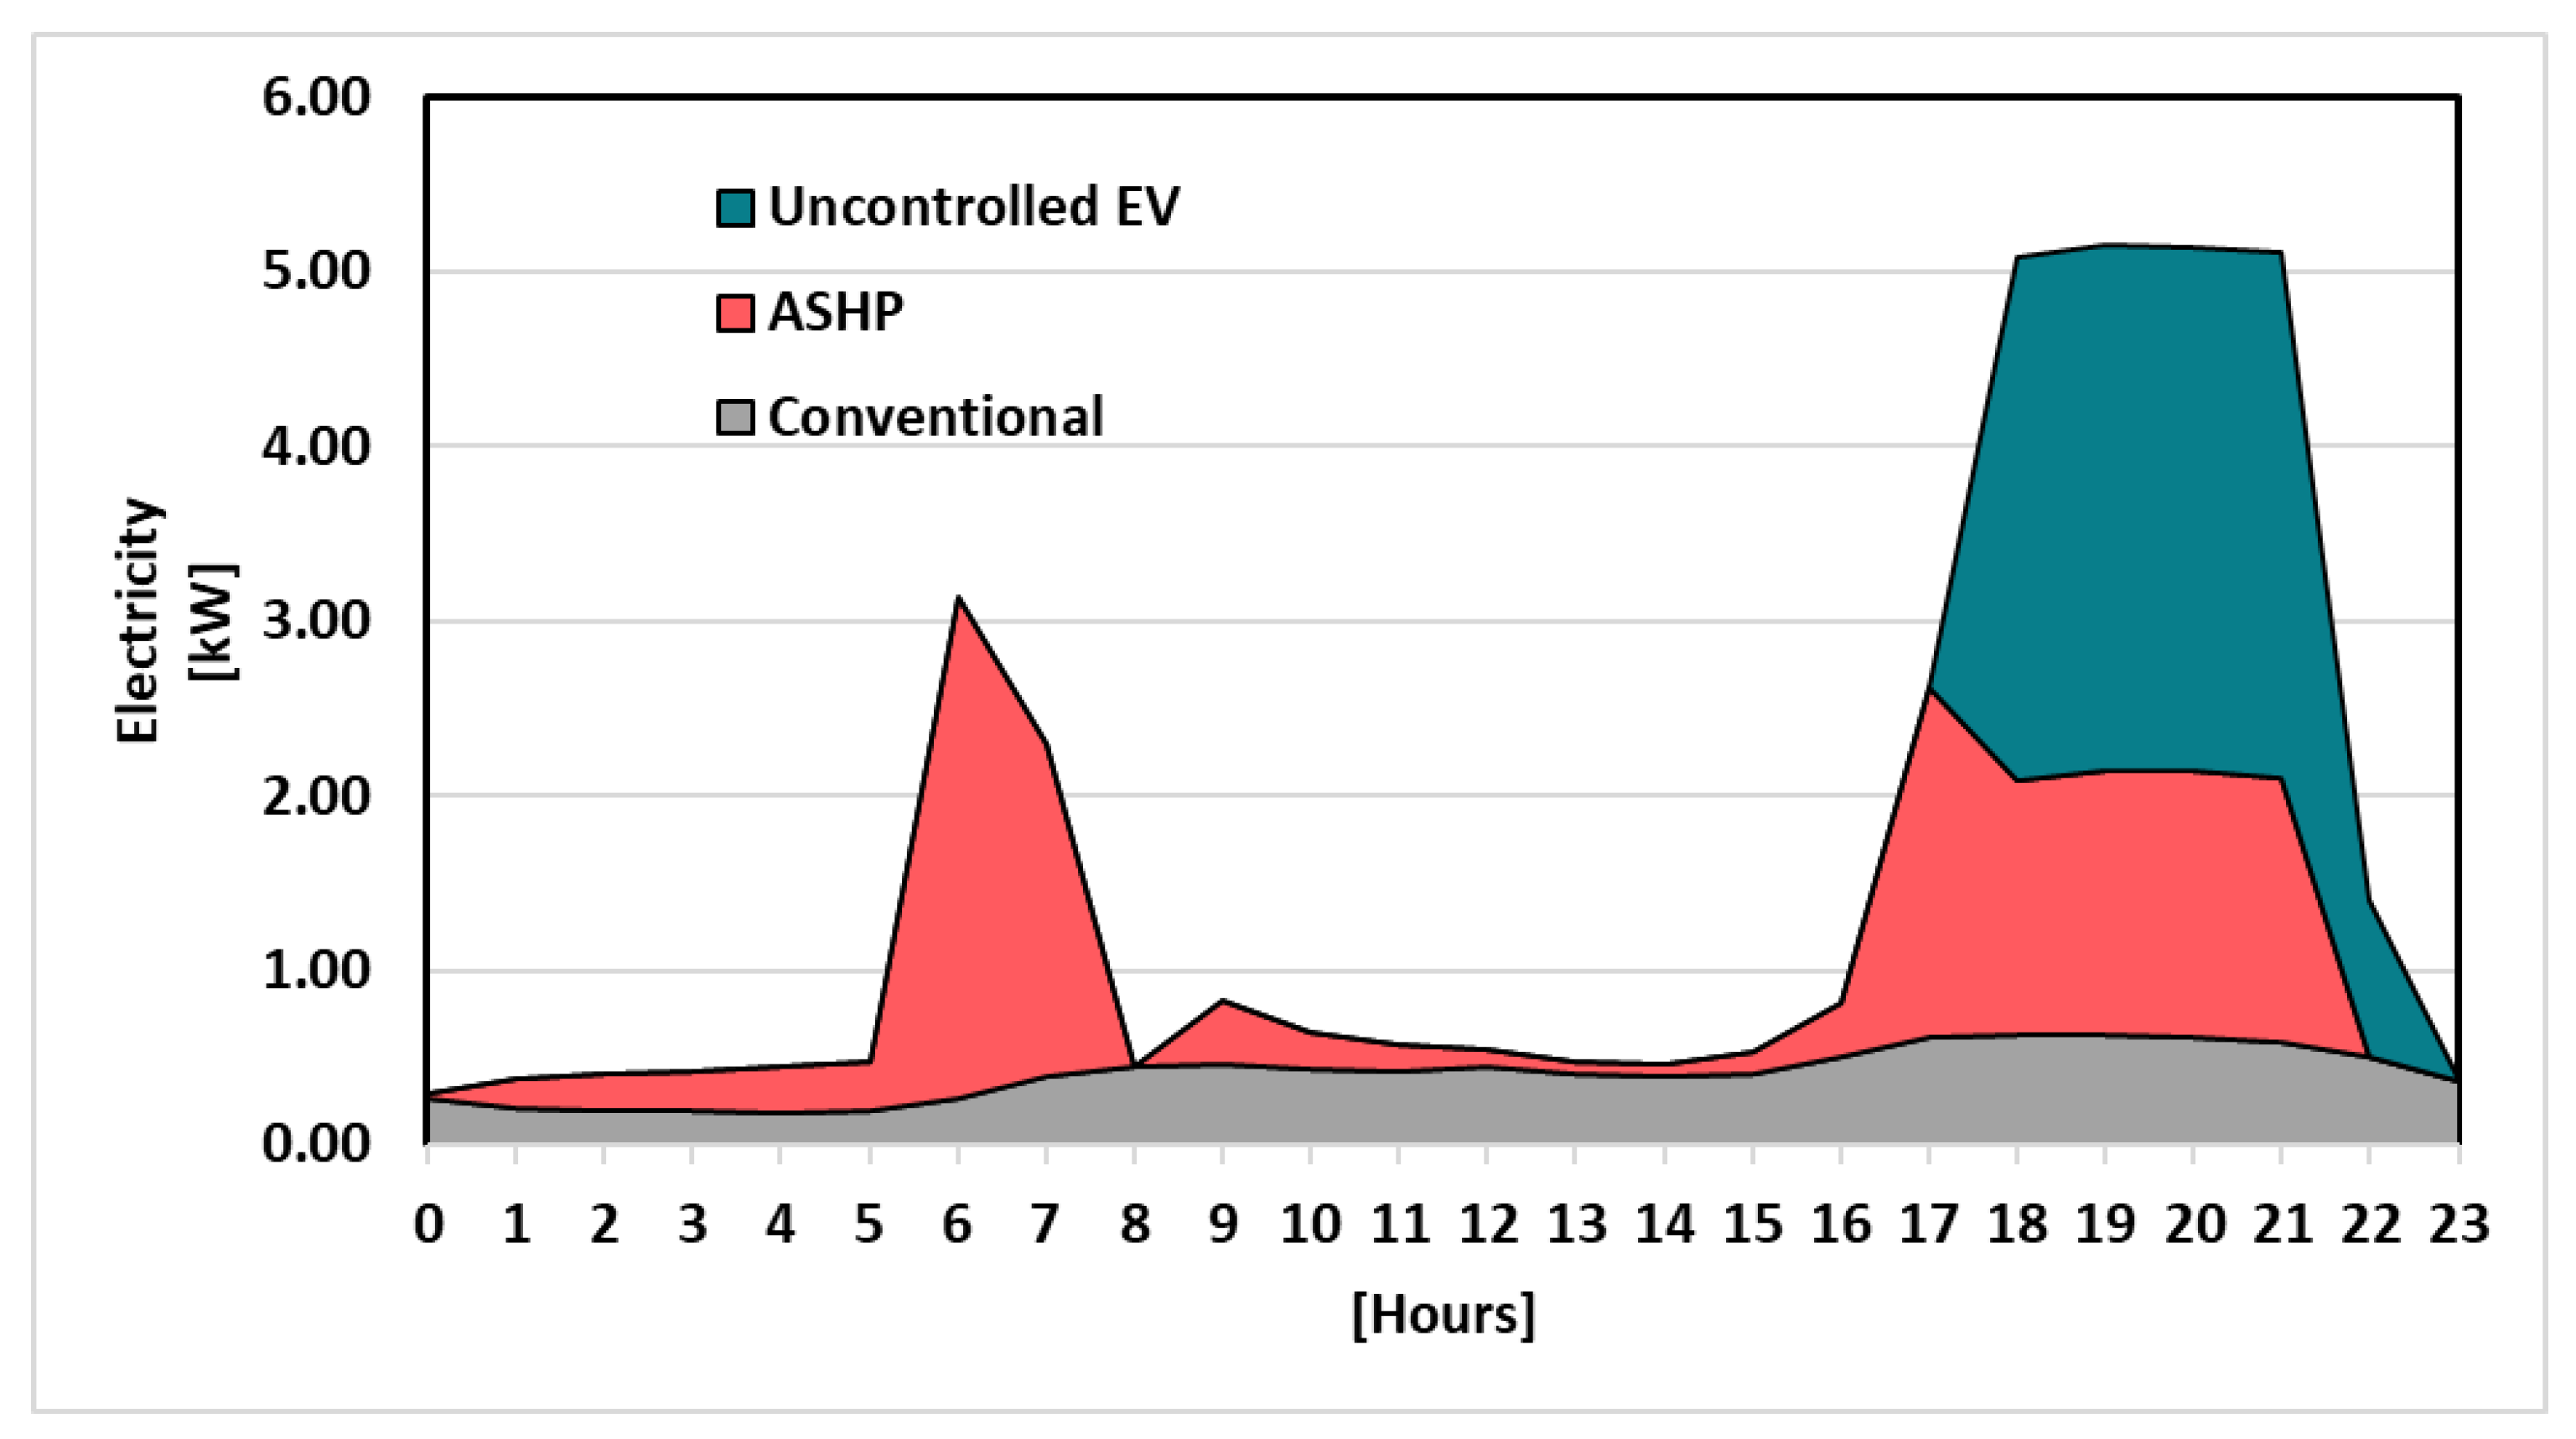
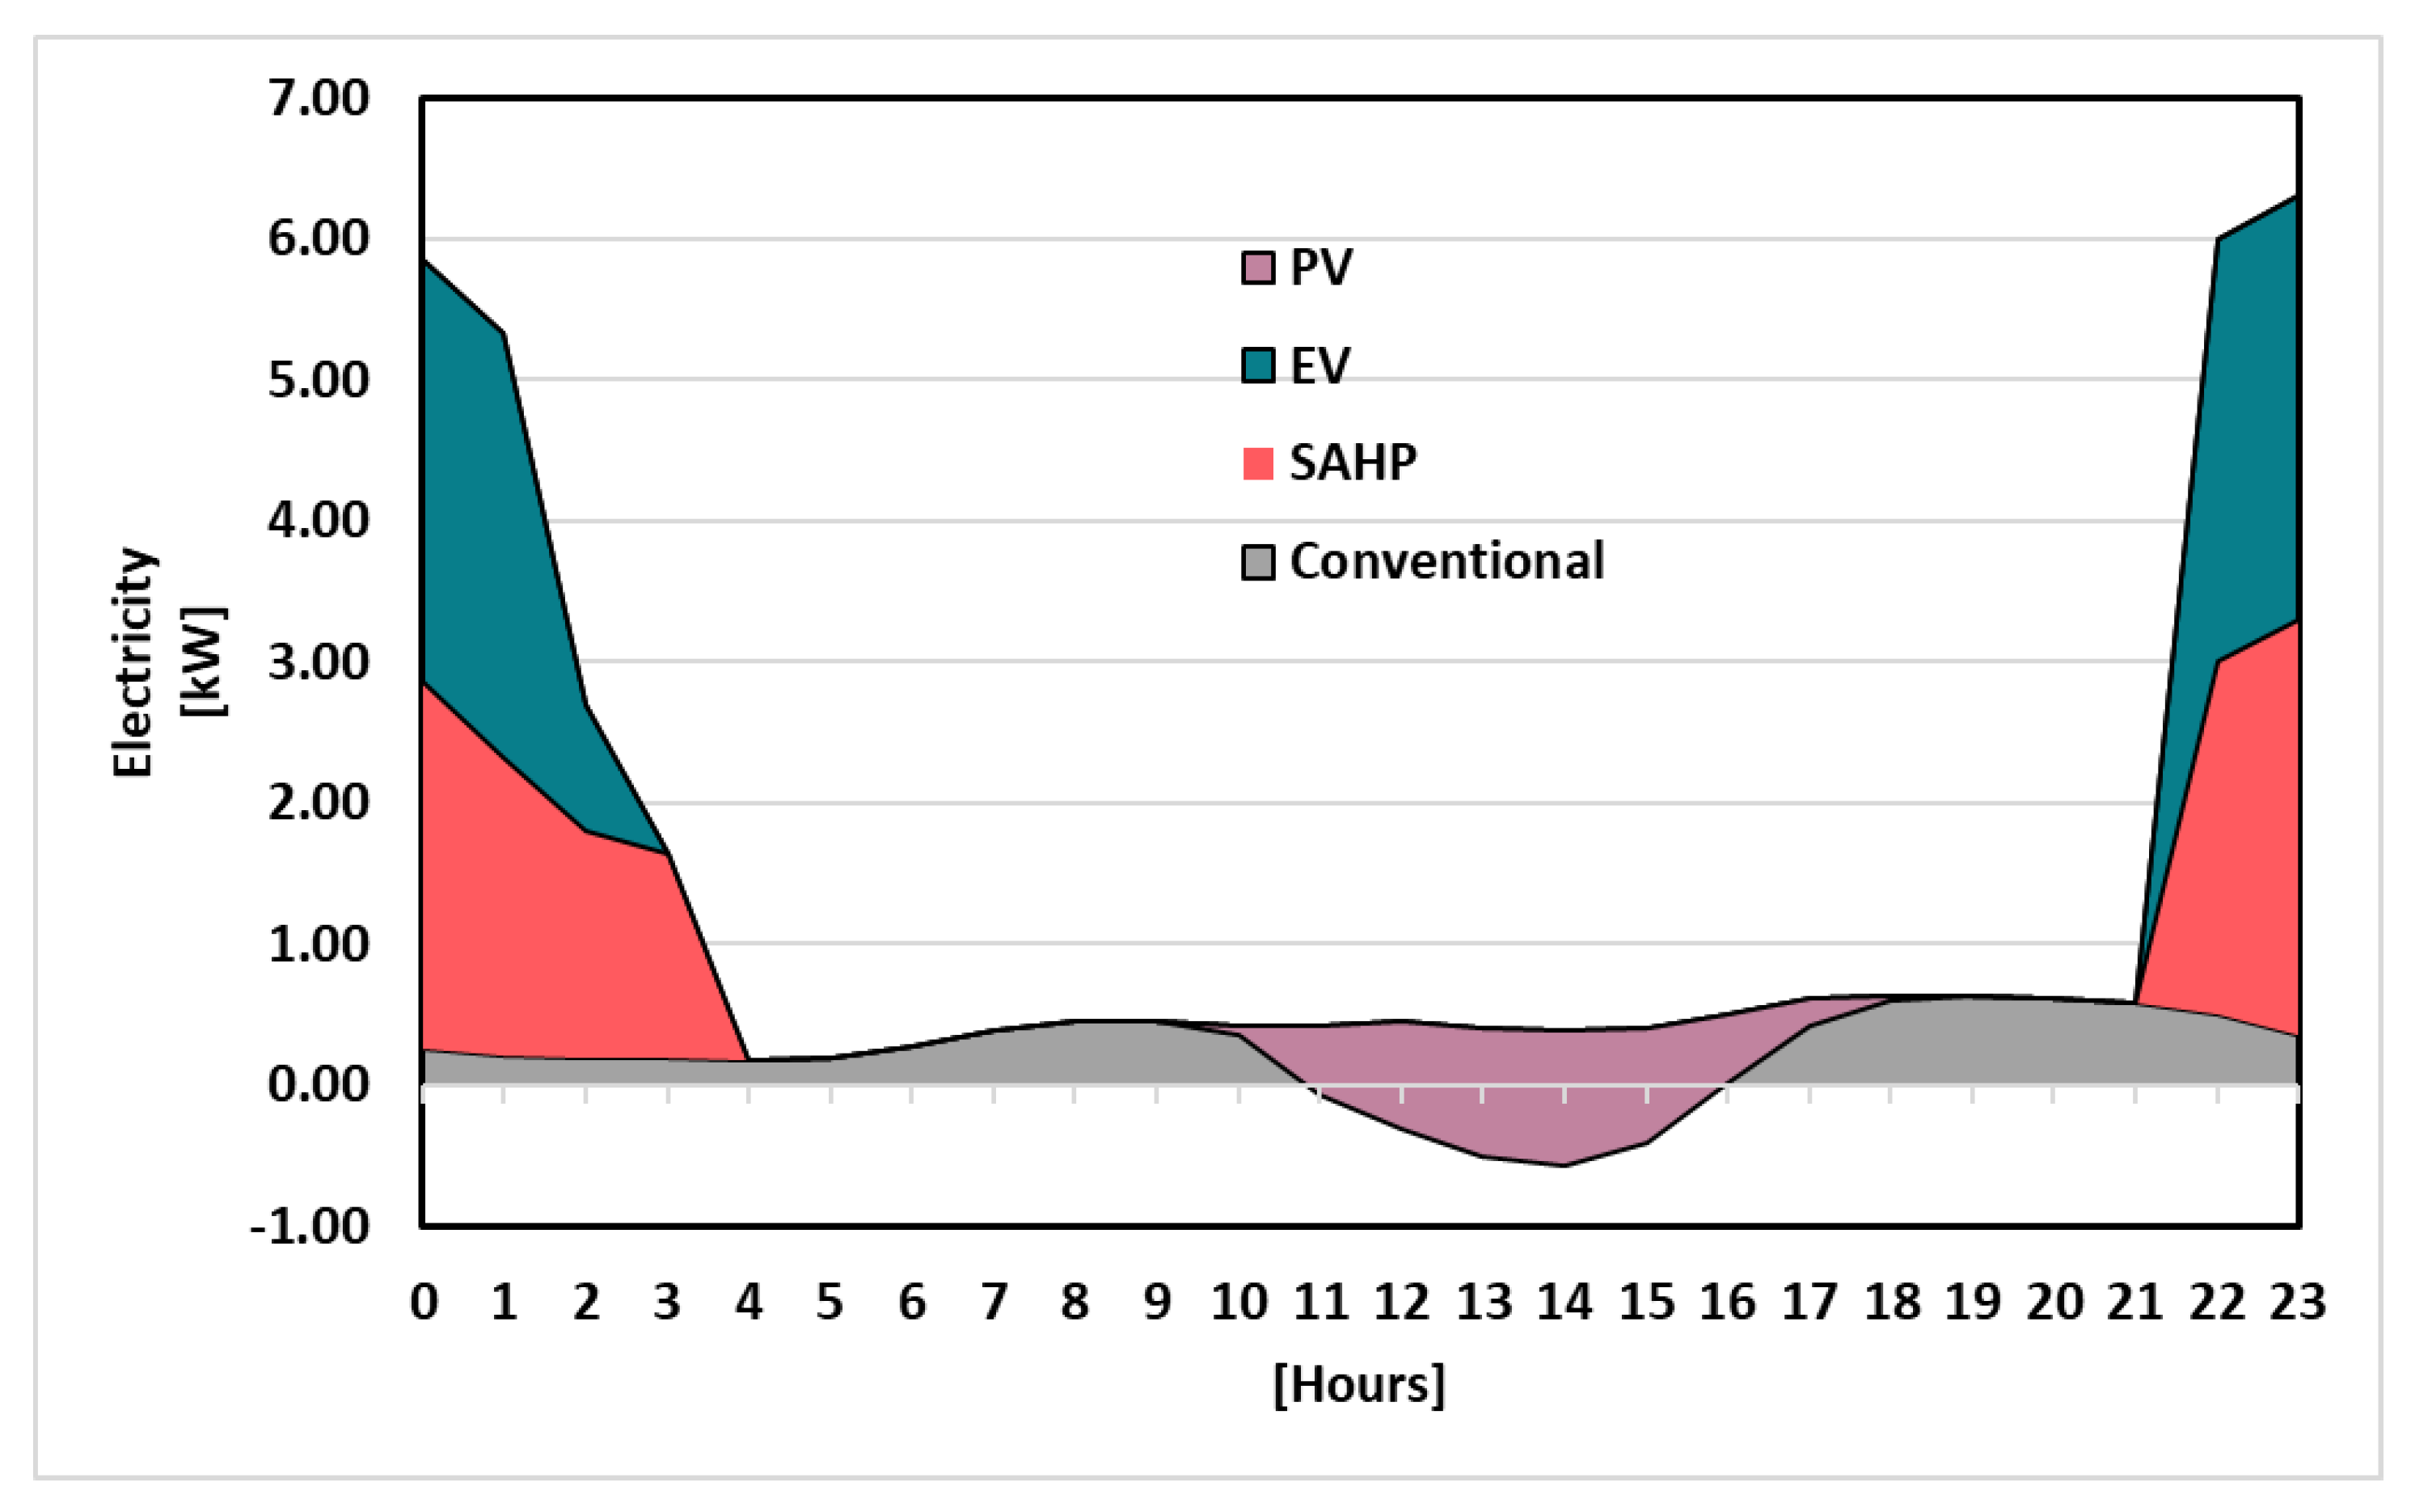
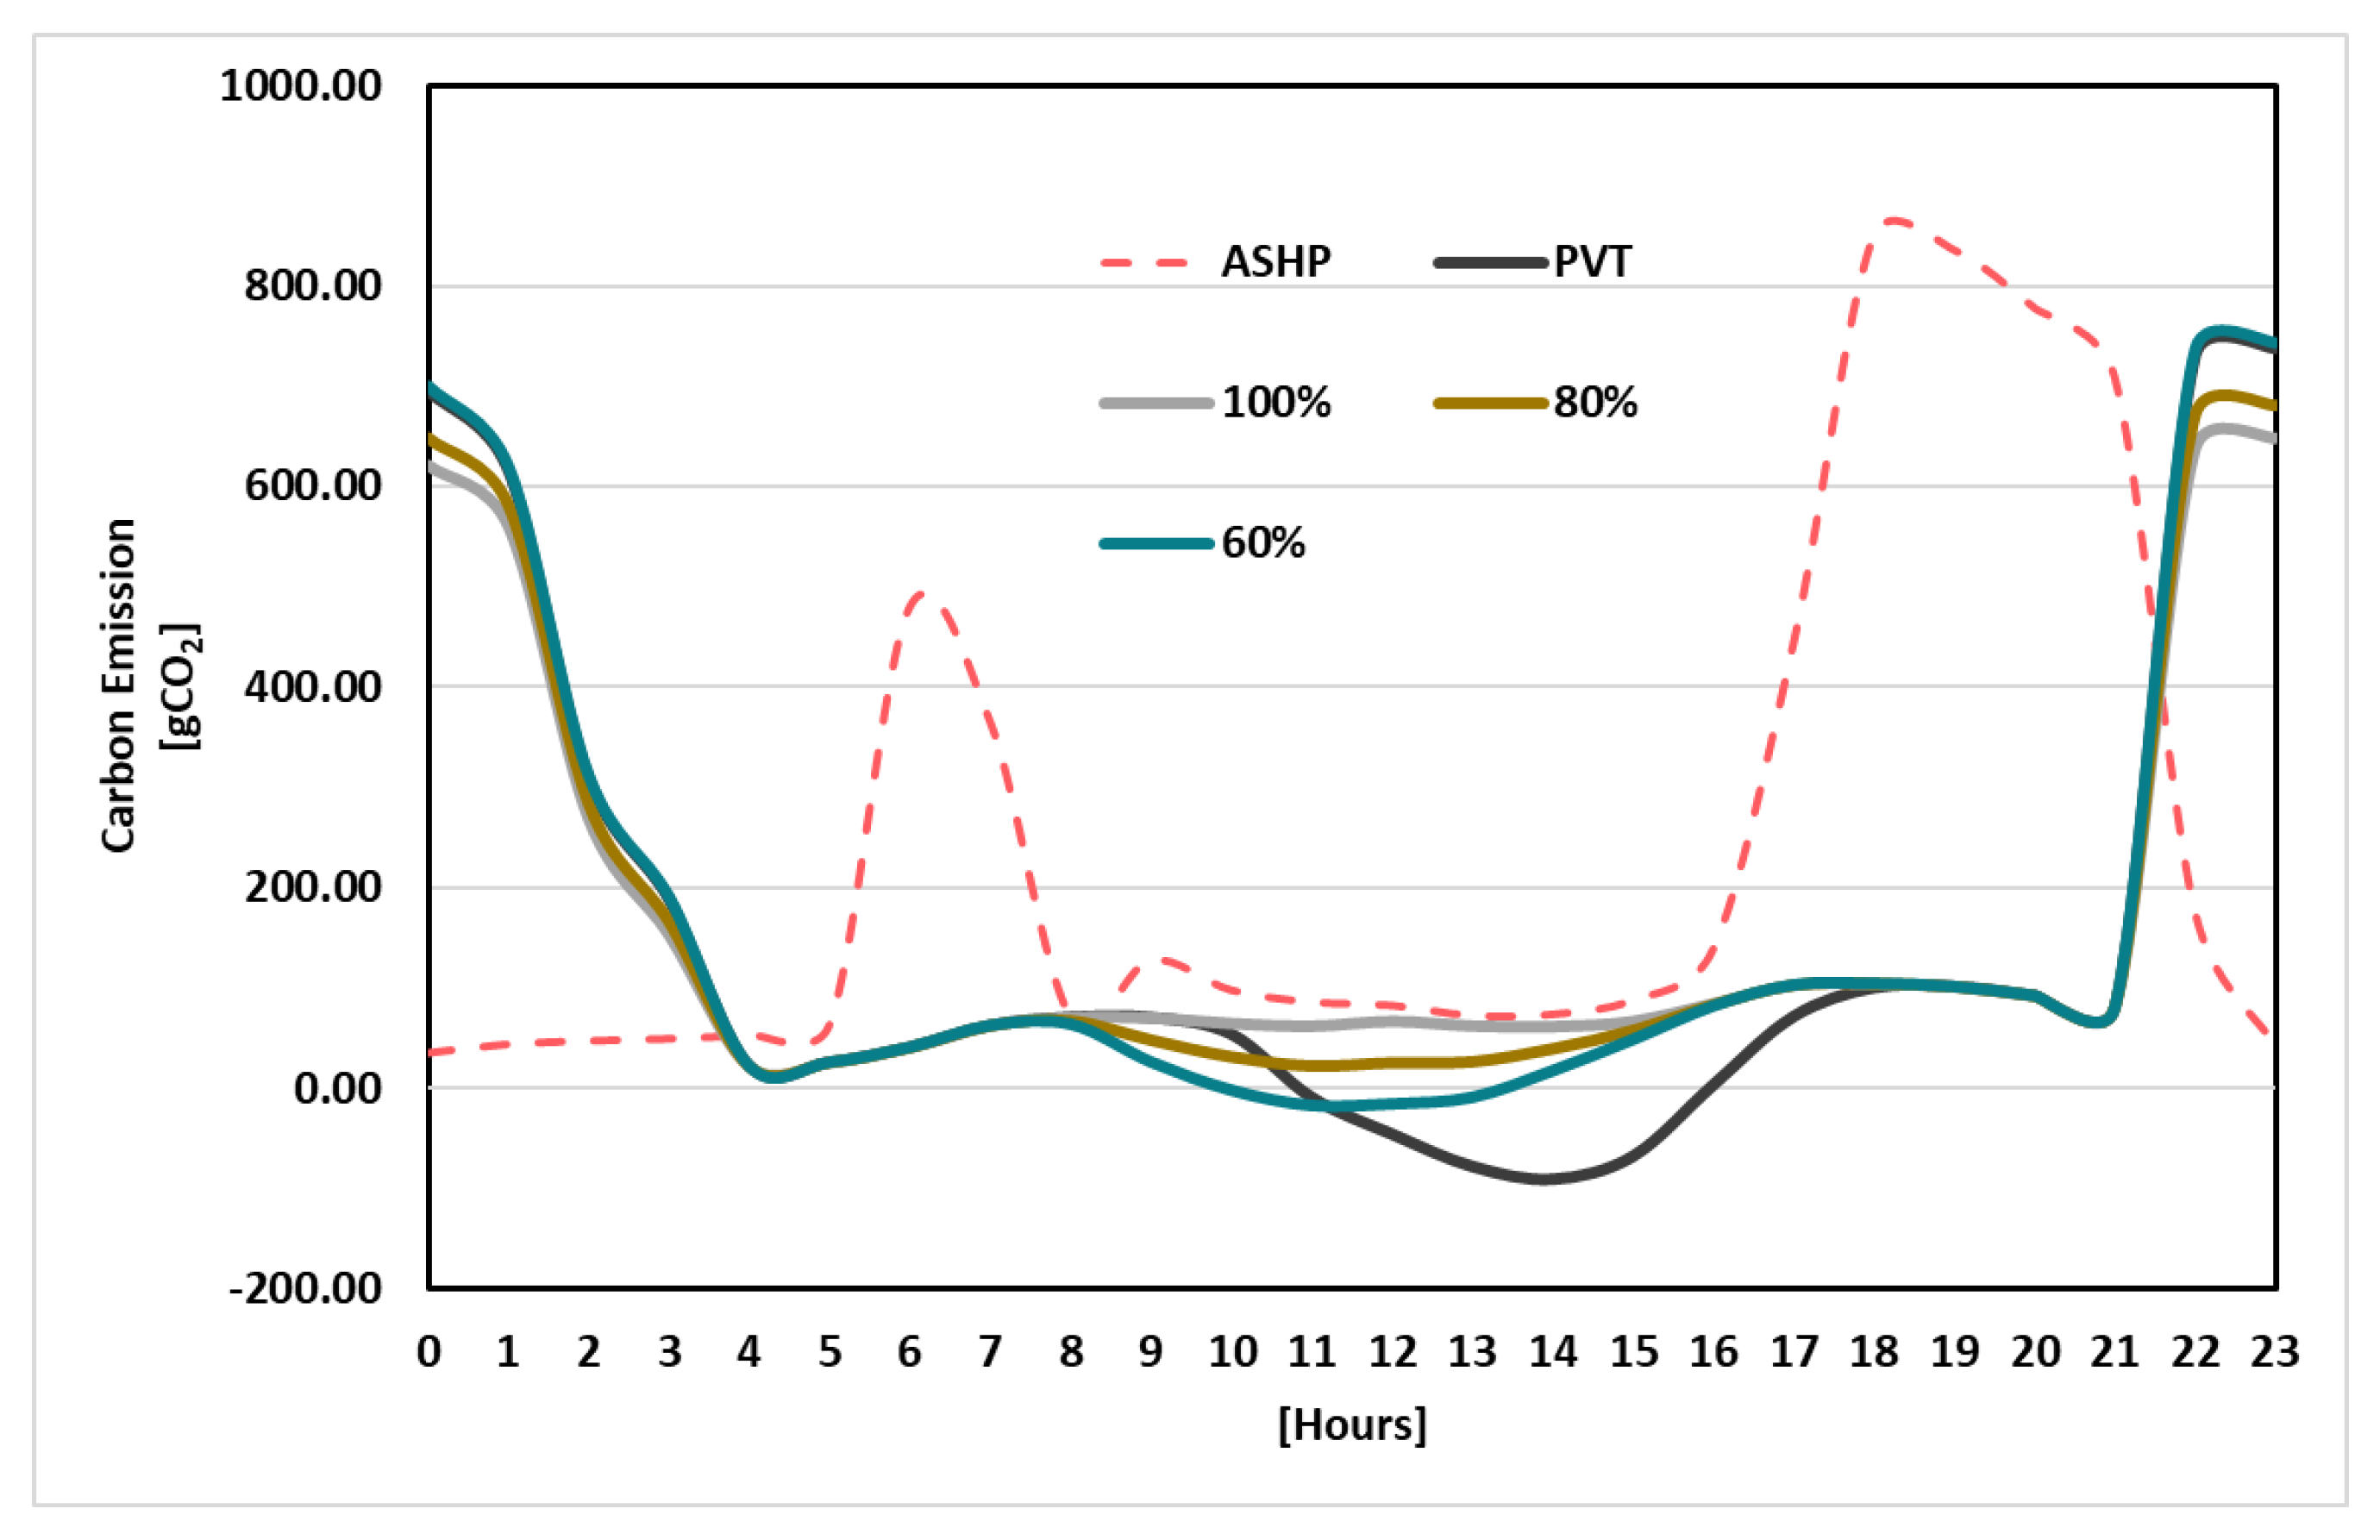
4.4. Overall Energy Consumptions and CO2 Emissions

The energy consumption of the building consists of the conventional electricity load (including lighting and home appliances, with data taken from [43]), space heating, domestic hot water usage, and EV charging load. Figure 10 illustrates the base case when the ASHP is in operation. Since the ASHP supplies both space heating and domestic hot water, the figure presents cumulative energy consumption using a stacked area chart, which combines three distinct profiles: conventional electricity, ASHP, and uncontrolled EV charging.
The trend aligns closely with residential peak periods, with energy consumption exceeding 3 kW during the morning peak and again in the evening. The evening peak consumption begins around 5 p.m. and continues until 10 p.m. This clearly demonstrates the impact of ASHP operation and EV charging on the overall energy demand. To reduce carbon emissions from grid electricity, the figure highlights the importance of demand-shifting strategies for both ASHP operation and EV charging, especially during peak periods.
By integrating solar collectors and a heat storage unit with a scheduled heat pump operation, the heating load can be shifted to periods of low carbon emissions. Similarly, EV charging can follow the same schedule to optimize energy use. Since HP is one of the largest electricity consumers in residential settings, the previous section discussed the performance of SAHP with different solar collector proportions. In this section, the overall consumption profile is evaluated, considering load shifting and PV generation.
Figure 11 illustrates the energy consumption profile for an SAHP system integrated with PV/T collectors, including SAHP operation, controlled EV charging, and conventional consumption. Although thermal collectors can significantly reduce heat pump electricity consumption, this case focuses on the PV/T collector to highlight the impact of PV electricity generation.
The electricity requirements for both the SAHP and EV have been shifted to off-peak periods, from 9 p.m. to 4 a.m., to avoid peak carbon intensity periods. This scheduling helps reduce the environmental impact while ensuring efficient energy usage. However, the drawback of this operation is an increase in the maximum grid electricity demand, which rises to 6.2 kW compared to the previous peak of 5 kW. Despite this increase, it does not pose a significant issue for grid stress, as the operation occurs during off-peak hours.
The PV/T collector generates electricity peaking at 1 kW around 2 p.m., exceeding the conventional electricity requirement at that time. This surplus electricity is transferred to the grid, which is represented as negative consumption in the figure and as negative carbon emissions in the corresponding carbon calculations. This demonstrates the dual benefits of reducing residential electricity demand and contributing renewable energy back to the grid. By integrating an SAHP and controlled load-shifting strategies, the system effectively balances energy demands, minimizes carbon emissions during peak periods, and enhances the contribution of renewable energy.
In the case of instant carbon emissions, Figure 12 provides a comparison between the base case and the examined scenarios. The red dashed line represents the base case using an ASHP without load shifting, while the other lines correspond to scenarios with varying proportions of thermal and PV collector contributions.
The base case shows higher carbon emissions during peak periods, particularly between 5 a.m. and 7 a.m. and again from 5 p.m. to 10 p.m., reflecting the operation of the ASHP during periods of high grid carbon intensity. In contrast, the scenarios with integrated PV/T systems show reduced carbon emissions as the collector proportions increase. The 100% thermal and PV/T collectors scenario achieves the most significant reductions, even reaching net-negative emissions around midday when excess PV electricity is transferred to the grid. The 60% and 80% collector scenarios also demonstrate meaningful reductions compared to the base case.
In order to give a summary of the overall cases, Table 4 is given to present a comparative analysis of the energy performance and carbon emissions of different heat pump system configurations, including the ASHP. The parameters analyzed include PV output, total energy consumption, and associated carbon emissions.
The baseline ASHP configuration, without any solar assistance, demonstrates the highest energy consumption of 25.15 kWh, and carbon emissions of 5800 gCO2. Introducing a 100% thermal collector SAHP significantly reduces the total energy consumption to 19.61 kWh, leading to a 29% reduction in carbon emissions with 4141 gCO2.
Hybrid configurations with a combination of thermal and PV collectors provide further improvements. For instance, the 80% thermal and 20% PV collector SAHP produces a PV output of 1.86 kWh, reducing carbon emissions to 4070 gCO2. However, as the proportion of PV collectors increases, the total energy consumption slightly rises, as observed in the 60% thermal and 40% PV collector SAHP, which achieves a PV output of 2.73 kWh but increases total energy consumption to 20.42 kWh.
The PV/T collector SAHP, with a fully integrated thermal and PV collector system, achieves the best overall performance. It records the lowest energy consumption of 18.25 kWh and the lowest carbon emissions of 3789 g CO2, while generating the highest PV output. This configuration effectively reduces reliance on grid electricity and demonstrates the potential for net-positive electricity generation at certain times of the day.

5. Conclusions

This study conducted a simulation to evaluate the heating performance and carbon reduction potential of different hybrid thermal-PV collector configurations, considering conventional electricity load and EV smart charging adaptation. The findings can be summarised as follows:
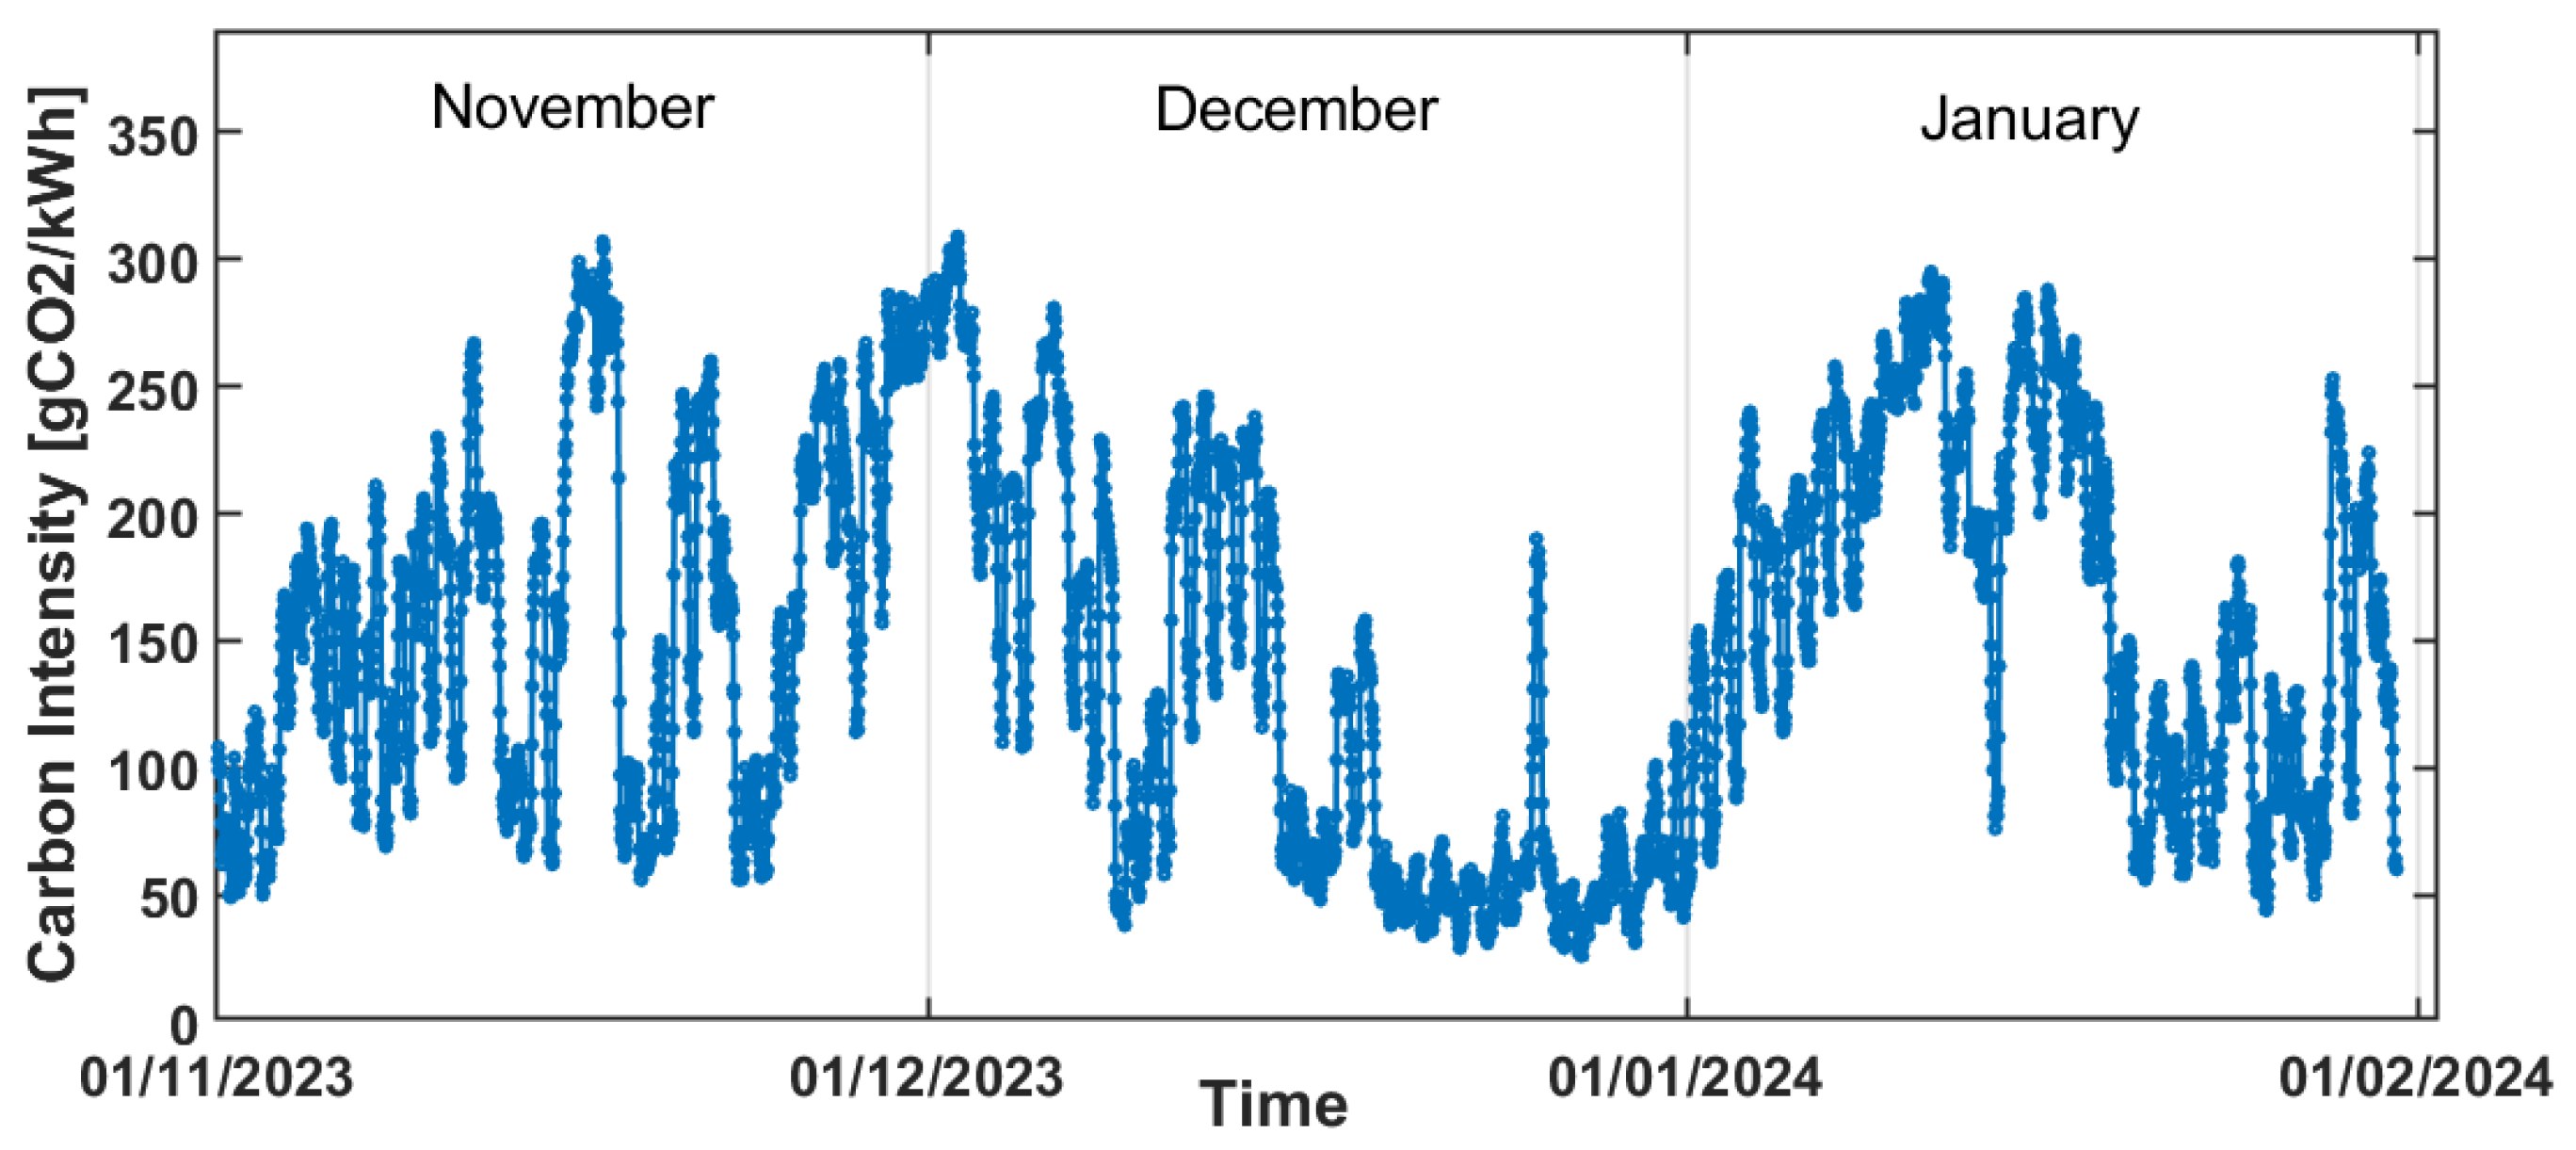
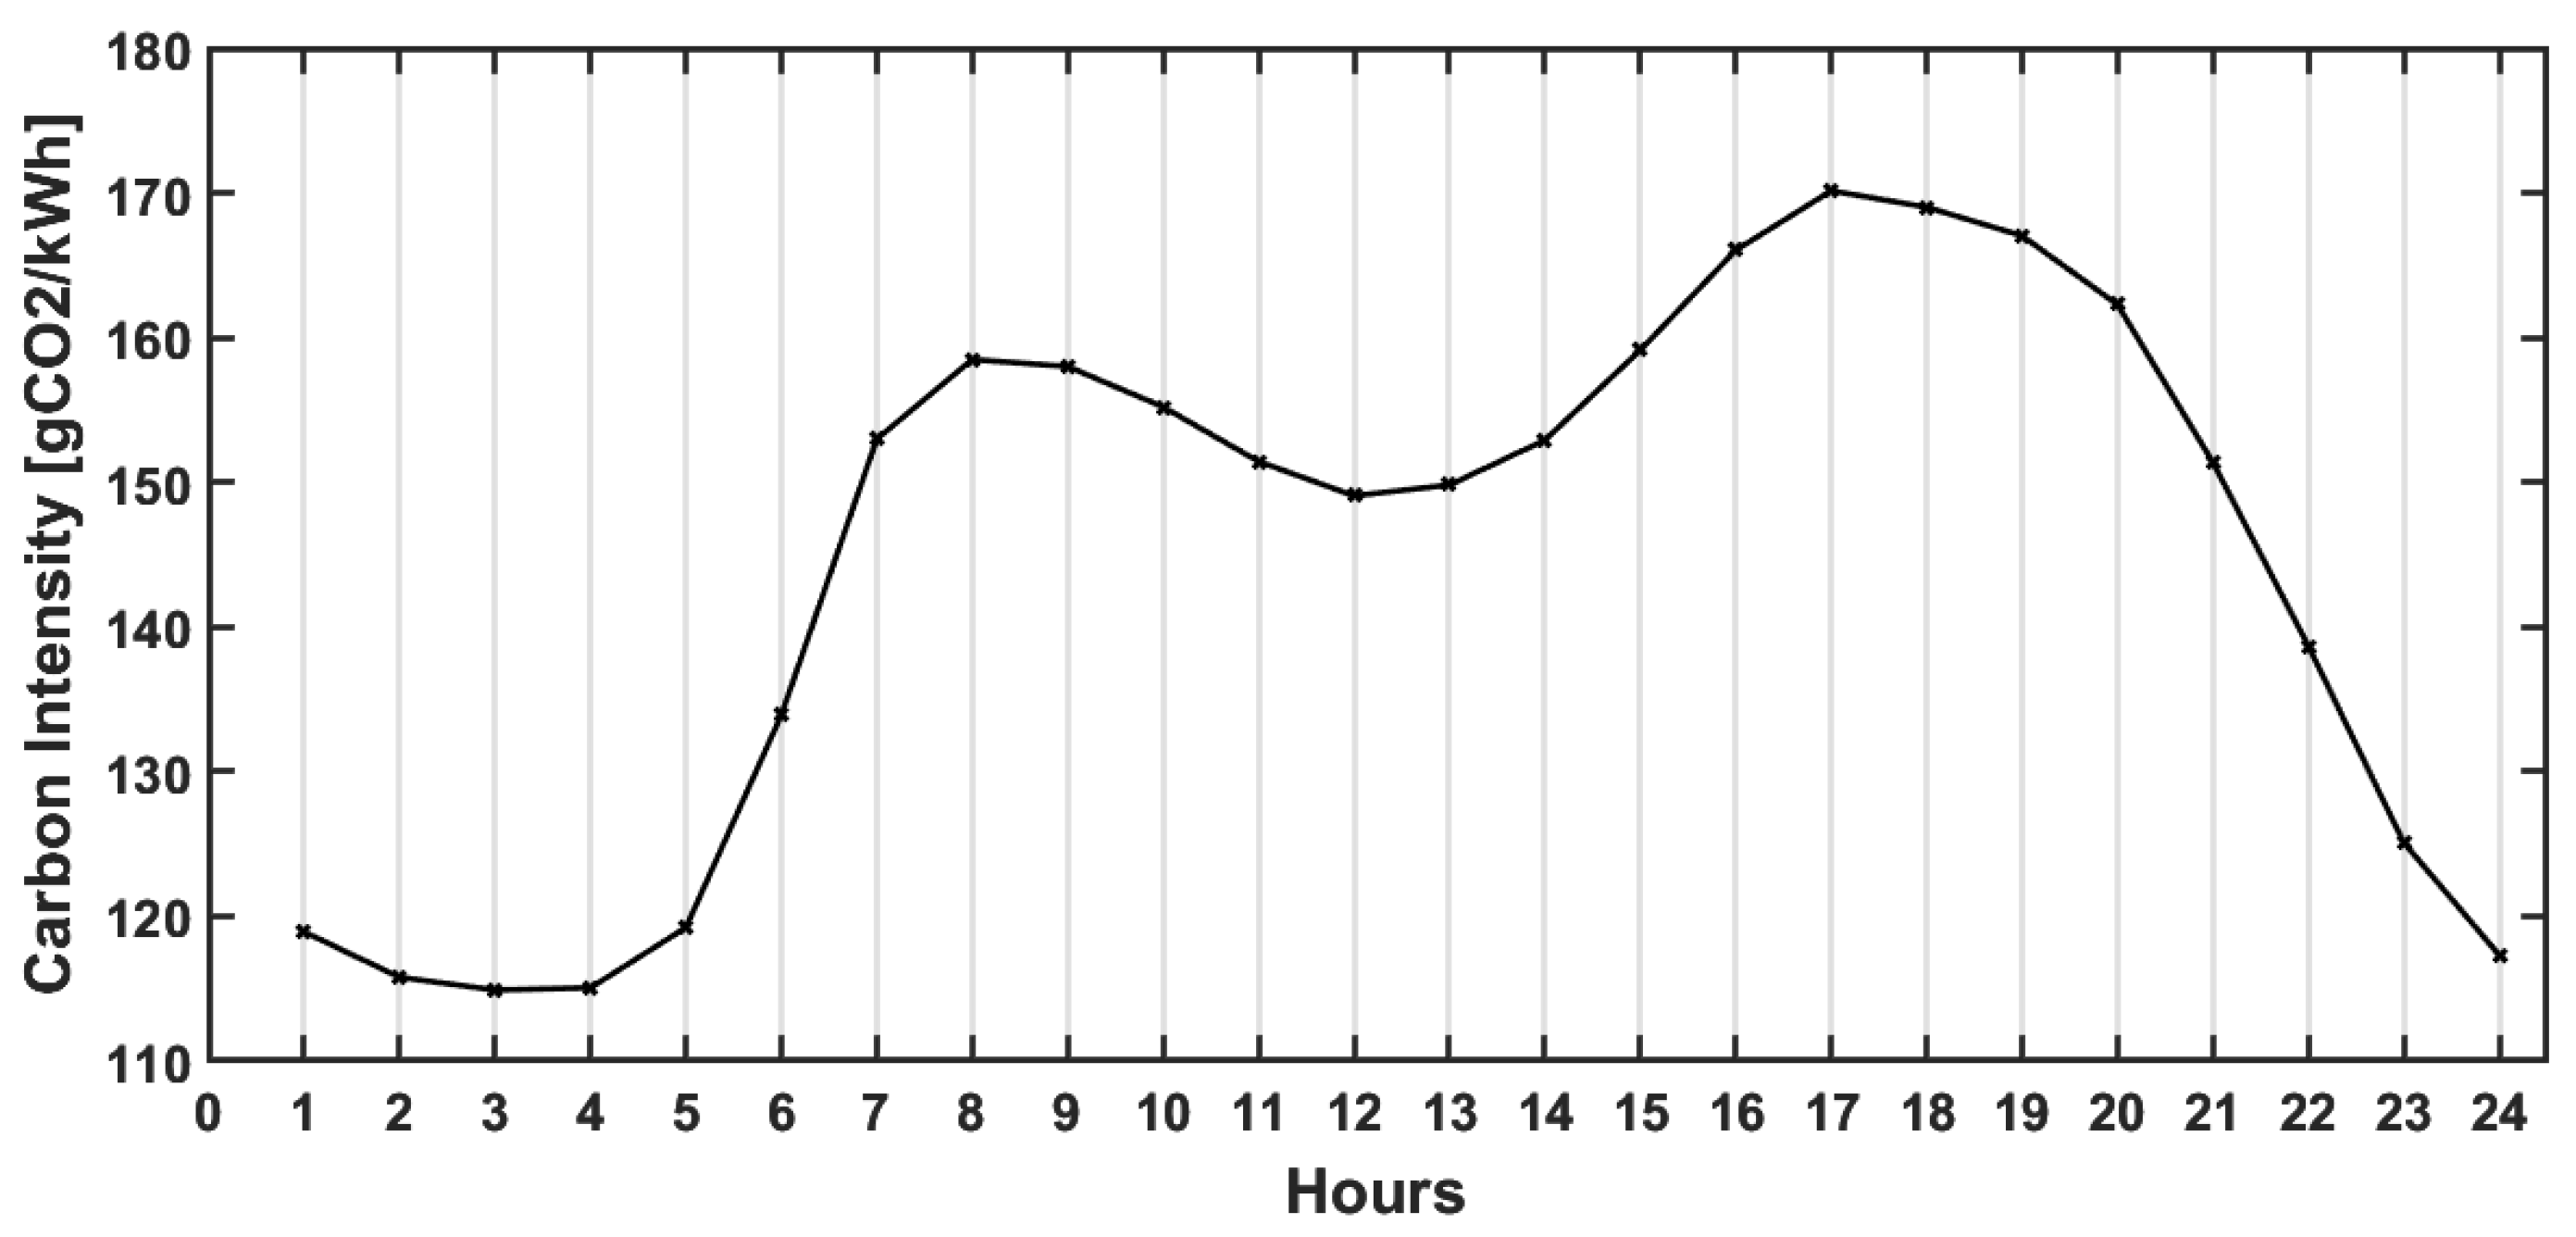
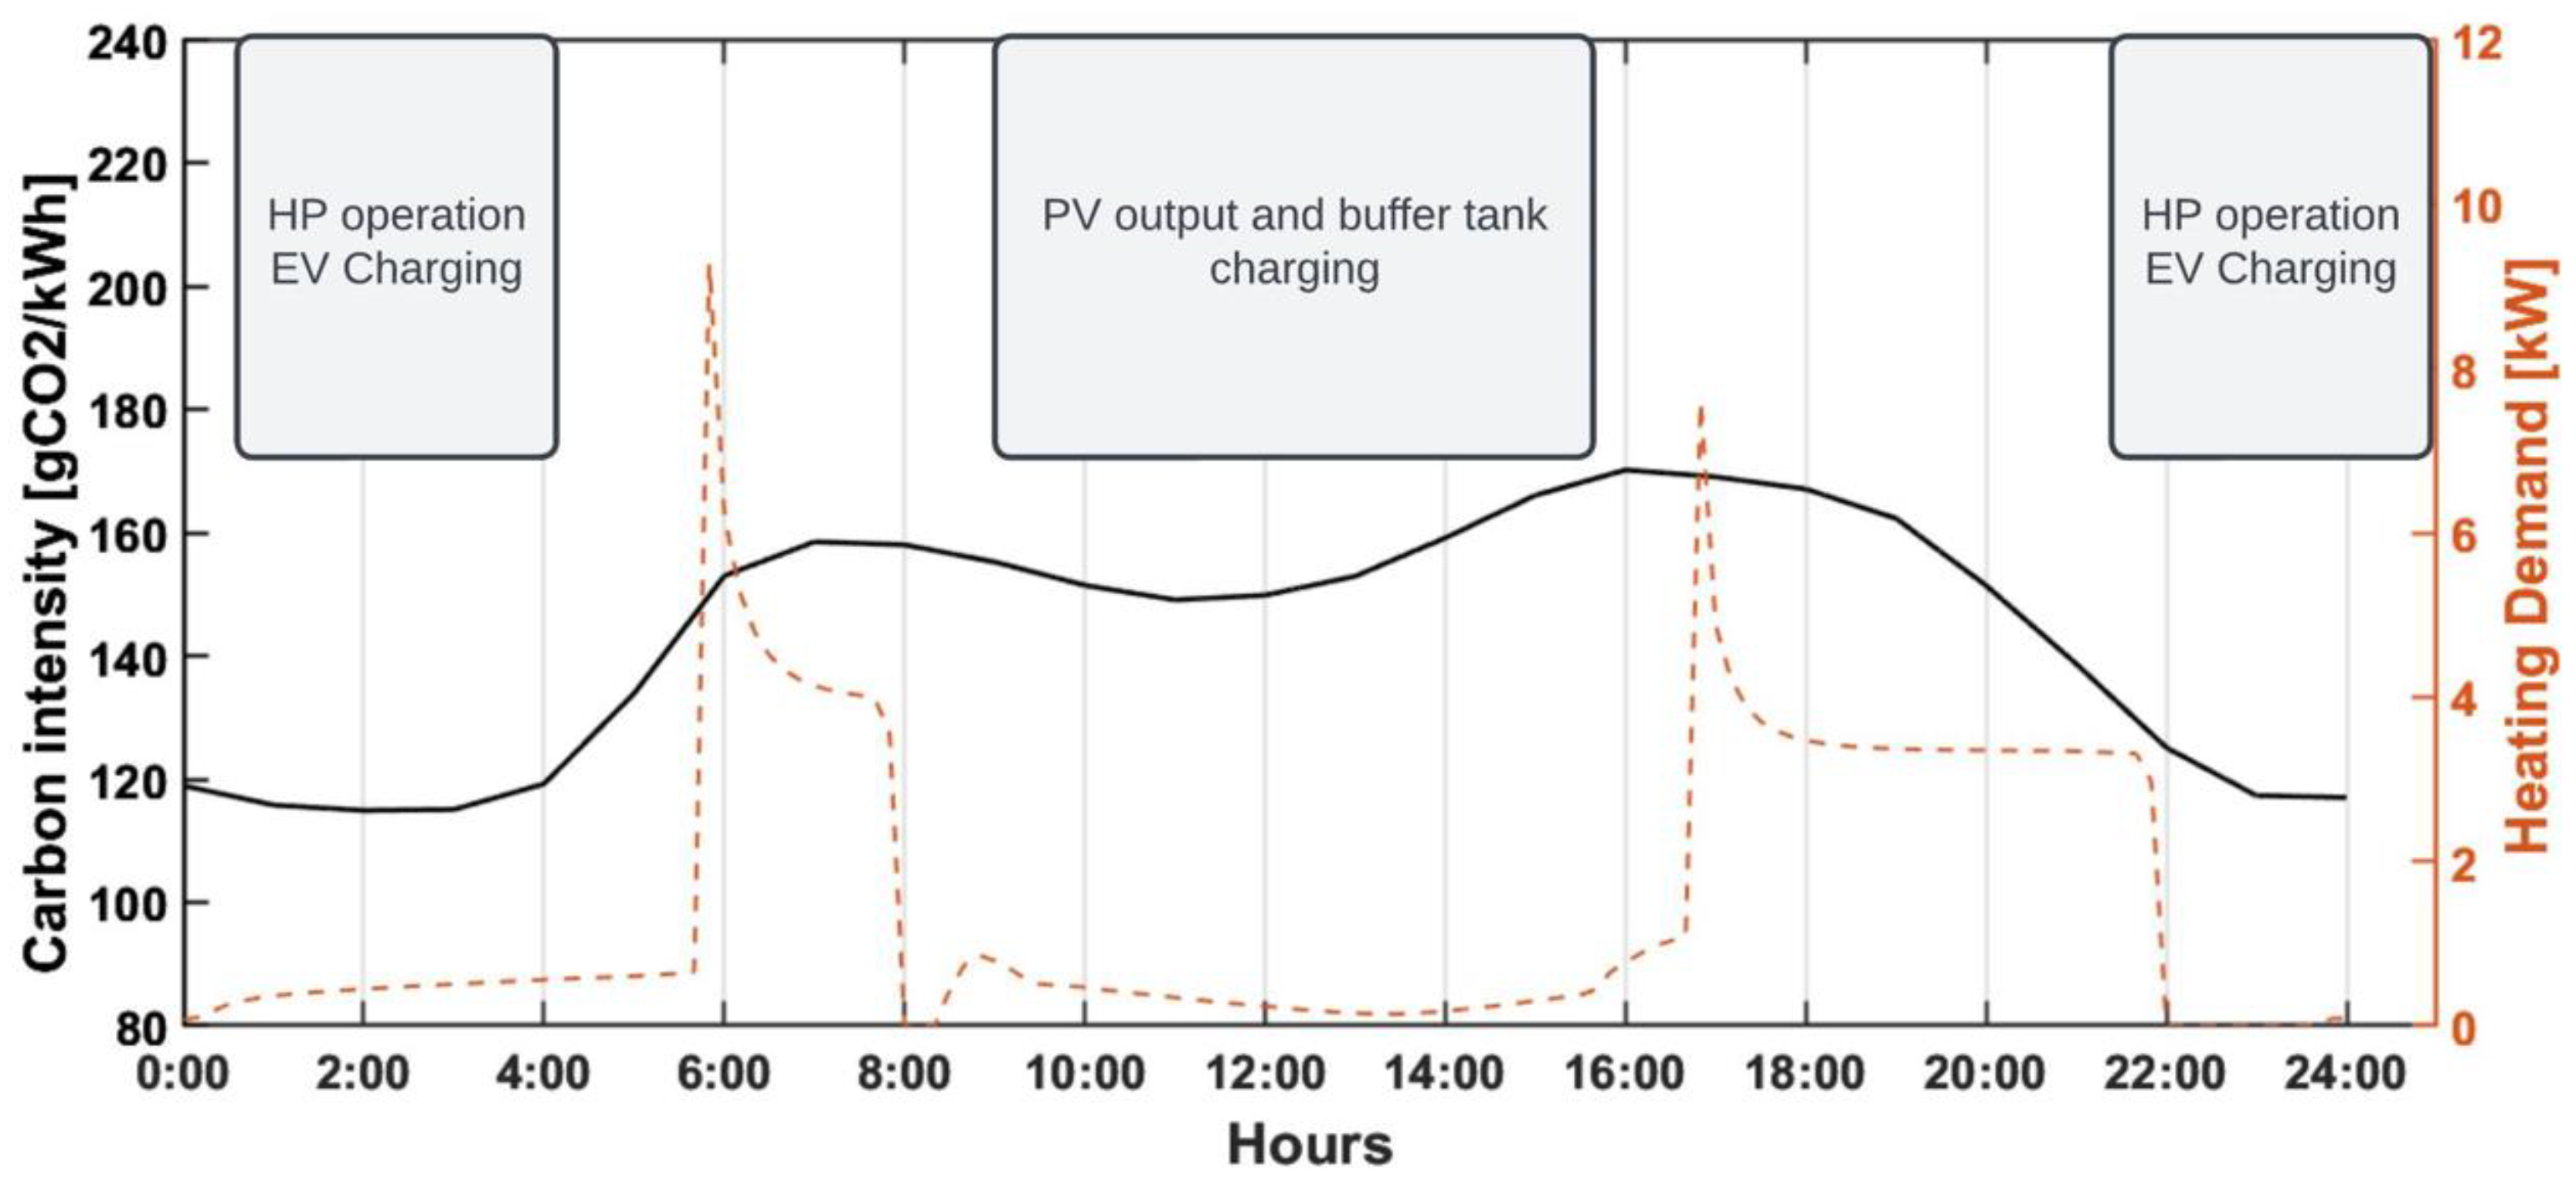
  • Based on published data on carbon emissions from electricity generation in the UK during November, December, and January, the national carbon intensity is lowest between 11 p.m. and 5 a.m. Therefore, demand shifting should be prioritized during this period.
  • To provide 34.5 kWh heating to the building, a storage tank with 380 kg of PCM tubes was selected. The tank is designed to be charged within 5–6 h, aligning with periods of low carbon intensity.
  • The performance of the HP system is directly influenced by the thermal collector area, as it enhances solar energy utilization. For a system with 100% thermal collectors, the SAHP achieves a daily COP of 3.49. When the thermal collectors comprise only 60% of the solar array, the daily COP decreases to 2.57. The SAHP system utilizing PV/T collectors demonstrates a relatively low heating COP of 2.6, although this still represents a 16% improvement over the COP of the ASHP.
  • SAHP systems with thermal collectors achieve significant reductions in total energy consumption and carbon emissions compared to conventional ASHP systems. A 100% thermal collector SAHP reduces total energy consumption by 22% compared to the baseline ASHP configuration.
Regarding carbon emissions, hybrid configurations incorporating PV collectors achieve additional reductions in carbon emissions due to increased generation of electricity. The PV/T collector SAHP achieves the lowest carbon emissions of 3789 g CO2, demonstrating its potential to reduce grid dependency and environmental impact.
A key challenge in integrating the proposed system into existing grid infrastructure is the capacity limitations of local distribution networks. While the smart charging algorithm and demand-shifting strategies optimize energy use, local transformers and distribution lines may struggle with increased simultaneous demand, leading to grid congestion or voltage fluctuations during peak hours. The intermittency of renewable energy further complicates grid stability. Although demand-shifting mitigates this, real-world implementation requires accurate forecasting and real-time grid interaction to prevent power quality issues. Vehicle-to-grid (V2G) integration could offer additional flexibility by allowing EVs to discharge power back into the grid. Another barrier is consumer adoption and upfront costs. Implementing smart charging and thermal storage requires investment in smart meters, communication networks, and control systems. Despite these challenges, the proposed system has strong carbon reduction potential. However, its success depends on technological advancements, policy support, and infrastructure upgrades.
In future studies, yearly simulations will be conducted to cover different months and temperature ranges, evaluating the system’s performance under varying conditions. These simulations will help refine the design and operational strategies, ensuring optimal performance and improved integration with real-world energy grids.

Author Contributions

Conceptualization, C.K.; methodology, C.K. and A.D.; software, C.K. and M.T.E.; investigation, C.K. and A.D.; writing—original draft preparation, C.K., A.D. and M.T.E.; writing—review and editing, A.D., Y.S. and S.R.; visualization, M.T.E.; supervision, S.R. and Y.S. All authors have read and agreed to the published version of the manuscript.

Funding

This research received no external funding.

Data Availability Statement

The original contributions presented in the study are included in the article; further inquiries can be directed to the corresponding author.

Conflicts of Interest

The authors declare no conflicts of interest.

Abbreviations

ASHPair-sourced heat pump
BEVsbattery electric vehicles
CIBSEChartered Institution of Building Services Engineers
COPcoefficient of performance
DfTDepartment for Transport
EVelectric vehicle
HPheat pump
IEAInternational Energy Agency
IES VEIntegrated Environmental Solutions Virtual Environment
ITSinverse transform sampling
NTSNational Travel Survey
PHEVsplug-in hybrid electric vehicles
PV/Tphotovoltaic–thermal
RBSrandomized behavior simulation
SAHPsolar-assisted heat pump
SATsodium acetate trihydrate
SOCstate of charge
URSuniform random sampling
WRSweighted random sampling
Nomenclature
A c o l collector area, m2
c p specific heat, J kg−1K−1
G solar irradiance, W m−2
h specific enthalpy, J/kg
m ˙ mass flow rate, kg s−1
m r ˙ refrigerant mass flow rate, kg s−1
NOCTnormal operating cell temperature
N u s Nusselt number
P r Prandtl number
Q ˙ heat rate, W
R e Reynolds number
T temperature,
W ˙ power, W
Subscripts
a ambient
colcollector
c o m p compressor
c o n condenser
e v a p evaporator
h f t heat transfer fluid
i n inlet
m mean
r reference
t tank
t h thermal

References

  1. Hassan, Q.; Algburi, S.; Sameen, A.Z.; Salman, H.M.; Jaszczur, M. A Review of Hybrid Renewable Energy Systems: Solar and Wind-Powered Solutions: Challenges, Opportunities, and Policy Implications. Results Eng. 2023, 20, 101621. [Google Scholar] [CrossRef]
  2. Herrando, M.; Markides, C.N.; Hellgardt, K. A UK-Based Assessment of Hybrid PV and Solar-Thermal Systems for Domestic Heating and Power: System Performance. Appl. Energy 2014, 122, 288–309. [Google Scholar] [CrossRef]
  3. Herrando, M.; Ramos, A. Photovoltaic-Thermal (PV-T) Systems for Combined Cooling, Heating and Power in Buildings: A Review. Energies 2022, 15, 3021. [Google Scholar] [CrossRef]
  4. Kazem, H.A.; Chaichan, M.T.; Al-Waeli, A.H.A.; Sopian, K. A Systematic Review of Photovoltaic/Thermal Applications in Heat Pumps Systems. Sol. Energy 2024, 269, 112299. [Google Scholar] [CrossRef]
  5. Herrando, M.; Ramos, A.; Freeman, J.; Zabalza, I.; Markides, C.N. Technoeconomic Modelling and Optimisation of Solar Combined Heat and Power Systems Based on Flat-Box PVT Collectors for Domestic Applications. Energy Convers. Manag. 2018, 175, 67–85. [Google Scholar] [CrossRef]
  6. Wang, K.; Herrando, M.; Pantaleo, A.M.; Markides, C.N. Technoeconomic Assessments of Hybrid Photovoltaic-Thermal vs. Conventional Solar-Energy Systems: Case Studies in Heat and Power Provision to Sports Centres. Appl. Energy 2019, 254, 113657. [Google Scholar] [CrossRef]
  7. Le, K.X.; Huang, M.J.; Wilson, C.; Shah, N.N.; Hewitt, N.J. Tariff-Based Load Shifting for Domestic Cascade Heat Pump with Enhanced System Energy Efficiency and Reduced Wind Power Curtailment. Appl. Energy 2020, 257, 113976. [Google Scholar] [CrossRef]
  8. Tyagi, V.V.; Buddhi, D. PCM Thermal Storage in Buildings: A State of Art. Renew. Sustain. Energy Rev. 2007, 11, 1146–1166. [Google Scholar] [CrossRef]
  9. Sinha, R.; Chaudhary, S.K.; Bak-Jensen, B.; Golmohamadi, H. Smart Operation Control of Power and Heat Demands in Active Distribution Grids Leveraging Energy Flexibility. Energies 2024, 17, 2986. [Google Scholar] [CrossRef]
  10. Department for Energy Security and Net Zero (DESNZ). Final UK Greenhouse Gas Emissions National Statistics: 1990 to 2022. Contains Public Sector Information Licensed Under the Open Government Licence v3.0. 2024. Available online: https://www.gov.uk/government/statistics/final-uk-greenhouse-gas-emissions-national-statistics-1990-to-2022 (accessed on 18 December 2024).
  11. Arowolo, W.; Perez, Y. Rapid Decarbonisation of Paris, Lyon and Marseille’s Power, Transport and Building Sectors by Coupling Rooftop Solar PV and Electric Vehicles. Energy Sustain. Dev. 2023, 74, 196–214. [Google Scholar] [CrossRef]
  12. Barman, P.; Dutta, L.; Bordoloi, S.; Kalita, A.; Buragohain, P.; Bharali, S.; Azzopardi, B. Renewable Energy Integration with Electric Vehicle Technology: A Review of the Existing Smart Charging Approaches. Renew. Sustain. Energy Rev. 2023, 183, 113518. [Google Scholar] [CrossRef]
  13. Lauvergne, R.; Perez, Y.; Françon, M.; Tejeda De La Cruz, A. Integration of Electric Vehicles into Transmission Grids: A Case Study on Generation Adequacy in Europe in 2040. Appl. Energy 2022, 326, 120030. [Google Scholar] [CrossRef]
  14. Zap-Map. EV Market Stats 2025: Tracking the Growth in EV Sales in the UK over Time. Available online: https://www.zap-map.com/ev-stats/ev-market (accessed on 10 February 2025).
  15. National Grid ESO (now NESO). Future Energy Scenarios (FES) 2023. Supported by National Energy SO Open Data. Licensed under NESO Open Data Licence v1.0. Available online: https://www.neso.energy/publications/future-energy-scenarios-fes/fes-documents (accessed on 10 February 2025).
  16. Department for Transport (DfT). Taking Charge: The Electric Vehicle Infrastructure Strategy; Contains Public Sector Information Licensed Under the Open Government Licence v3.0.; HM Government: London, UK, 2022. Available online: https://www.gov.uk/government/publications/uk-electric-vehicle-infrastructure-strategy (accessed on 18 December 2024).
  17. Tasnim, M.N.; Akter, S.; Shahjalal, M.; Shams, T.; Davari, P.; Iqbal, A. A Critical Review of the Effect of Light Duty Electric Vehicle Charging on the Power Grid. Energy Rep. 2023, 10, 4126–4147. [Google Scholar] [CrossRef]
  18. Dik, A.; Kutlu, C.; Sun, H.; Calautit, J.K.; Boukhanouf, R.; Omer, S. Towards Sustainable Urban Living: A Holistic Energy Strategy for Electric Vehicle and Heat Pump Adoption in Residential Communities. Sustain. Cities Soc. 2024, 107, 105412. [Google Scholar] [CrossRef]
  19. National Grid ESO (now NESO). National Carbon Intensity Forecast. Supported by National Energy SO Open Data. Licensed under NESO Open Data Licence v1.0. Available online: https://www.nationalgrideso.com/data-portal/national-carbon-intensity-forecast/national_carbon_intensity_forecast (accessed on 1 July 2024).
  20. Hall, M.R.; Casey, S.P.; Loveday, D.L.; Gillott, M. Analysis of UK Domestic Building Retrofit Scenarios Based on the E.ON Retrofit Research House Using Energetic Hygrothermics Simulation—Energy Efficiency, Indoor Air Quality, Occupant Comfort, and Mould Growth Potential. Build Environ. 2013, 70, 48–59. [Google Scholar] [CrossRef]
  21. Chartered Institution of Building Services Engineers (CIBSE). Guide A: Environmental Design; Chartered Institution of Building Services Engineers (CIBSE): London, UK, 2016. [Google Scholar]
  22. Freeman, J.; Guarracino, I.; Kalogirou, S.A.; Markides, C.N. A Small-Scale Solar Organic Rankine Cycle Combined Heat and Power System with Integrated Thermal Energy Storage. Appl. Therm. Eng. 2017, 127, 1543–1554. [Google Scholar] [CrossRef]
  23. Yu, Q.; Chan, S.; Chen, K.; Zhao, B.; Ren, X.; Pei, G. Numerical and Experimental Study of a Novel Vacuum Photovoltaic/Thermal (PV/T) Collector for Efficient Solar Energy Harvesting. Appl. Therm. Eng. 2024, 236, 121580. [Google Scholar] [CrossRef]
  24. Mattei, M.; Notton, G.; Cristofari, C.; Muselli, M.; Poggi, P. Calculation of the Polycrystalline PV Module Temperature Using a Simple Method of Energy Balance. Renew. Energy 2006, 31, 553–567. [Google Scholar] [CrossRef]
  25. Kutlu, C.; Li, J.; Su, Y.; Wang, Y.; Pei, G.; Riffat, S. Investigation of an Innovative PV/T-ORC System Using Amorphous Silicon Cells and Evacuated Flat Plate Solar Collectors. Energy 2020, 203, 117873. [Google Scholar] [CrossRef]
  26. Ungureşan, P.; Petreuş, D.; Pocola, A.; Bălan, M. Potential of Solar ORC and PV Systems to Provide Electricity under Romanian Climatic Conditions. Energy Procedia 2016, 85, 584–593. [Google Scholar] [CrossRef]
  27. Mulcué-Nieto, L.F.; Mora-López, L. A New Model to Predict the Energy Generated by a Photovoltaic System Connected to the Grid in Low Latitude Countries. Solar Energy 2014, 107, 423–442. [Google Scholar] [CrossRef]
  28. Duffie, J.A.; Beckman, W.A. Solar Engineering of Thermal Processes; John Wiley: Hoboken, NJ, USA, 2013. [Google Scholar]
  29. Kutlu, C.; Su, Y.; Lyu, Q.; Riffat, S. Thermal Management of Using Crystallization-Controllable Supercooled PCM in Space Heating Applications for Different Heating Profiles in the UK. Renew. Energy 2023, 206, 848–857. [Google Scholar] [CrossRef]
  30. Kutlu, C.; Erdinc, M.T.; Dik, A.; Chen, Z.; Lyu, Q.; Su, Y.; Riffat, S. A Study on the Combination of Crystallization-Controllable Phase Change Materials and Solar-Assisted Heat Pump for Electricity Demand Shifting in Space Heating. Energy Convers. Manag. 2025, 324, 119260. [Google Scholar] [CrossRef]
  31. Taborek, J. Longitudinal Flow in Tube Bundles with Grid Baffles. AIChE Symp. Ser. 1989, 85, 72–78. [Google Scholar]
  32. Kutlu, C.; Tapia-Brito, E.; Agbonaye, O.; Su, Y.; Smith, S.T.; Hughes, B.; Riffat, S. Incorporation of Controllable Supercooled Phase Change Material Heat Storage with a Solar Assisted Heat Pump: Testing of Crystallization Triggering and Heating Demand-Based Modelling Study. J. Energy Storage 2022, 55, 105744. [Google Scholar] [CrossRef]
  33. International Energy Agency (IEA). Global EV Outlook 2024; Licence: CC BY 4.0; IEA: Paris, France, 2024; Available online: https://www.iea.org/reports/global-ev-outlook-2024 (accessed on 18 December 2024).
  34. Department for Transport (DfT). Licensed Ultra Low Emission Vehicles by Body Type and Propulsion or Fuel Type. Contains Public Sector Information Licensed Under the Open Government Licence v3.0. Available online: https://www.gov.uk/government/statistical-data-sets/vehicle-licensing-statistics-data-tables (accessed on 18 December 2024).
  35. EV-Database. Current and Upcoming Electric Vehicles. Available online: https://ev-database.org/ (accessed on 18 December 2024).
  36. Department for Transport (DfT). Electric Charge Point Analysis 2017: Domestics Report. 2018. Contains Public Sector Information Licensed Under the Open Government Licence v3.0. Available online: https://www.gov.uk/government/statistics/electric-chargepoint-analysis-2017-domestics (accessed on 18 December 2024).
  37. Zap-Map. EV Charging Statistics. 2024. Available online: https://www.zap-map.com/ev-stats/how-many-charging-points (accessed on 18 December 2024).
  38. Wang, Y.; Infield, D. Markov Chain Monte Carlo Simulation of Electric Vehicle Use for Network Integration Studies. Int. J. Electr. Power Energy Syst. 2018, 99, 85–94. [Google Scholar] [CrossRef]
  39. Department for Transport (DfT). Annual Mileage Band of Cars, England: 2002 Onwards (NTS0904). Contains Public Sector Information Licensed Under the Open Government Licence v3.0. Available online: https://www.gov.uk/government/statistical-data-sets/nts09-vehicle-mileage-and-occupancy (accessed on 19 December 2024).
  40. Hao, X.; Wang, H.; Lin, Z.; Ouyang, M. Seasonal Effects on Electric Vehicle Energy Consumption and Driving Range: A Case Study on Personal, Taxi, and Ridesharing Vehicles. J. Clean Prod. 2020, 249, 119403. [Google Scholar] [CrossRef]
  41. Kostopoulos, E.D.; Spyropoulos, G.C.; Kaldellis, J.K. Real-World Study for the Optimal Charging of Electric Vehicles. Energy Rep. 2020, 6, 418–426. [Google Scholar] [CrossRef]
  42. Dik, A.; Kutlu, C.; Omer, S.; Boukhanouf, R.; Su, Y.; Riffat, S. An Approach for Energy Management of Renewable Energy Sources Using Electric Vehicles and Heat Pumps in an Integrated Electricity Grid System. Energy Build. 2023, 294, 113261. [Google Scholar] [CrossRef]
  43. Owen, P.; Foreman, R. Powering the Nation: Household Electricity Using Habits Revealed; Energy Saving Trust/DECC/DEFRA: London, UK, 2012. [Google Scholar]
Figure 1. Schematic of the proposed system.
Energies 18 00920 g001
Figure 2. National carbon intensity data of the UK from 1 November 2023 to 1 February 2024 (data for every half-hour from NESO [19]).
Energies 18 00920 g002
Figure 3. The 24-h average profile of the UK’s national carbon intensity for examined three months.
Energies 18 00920 g003
Figure 4. National carbon intensity and building heating demand profiles to decide system operating periods.
Energies 18 00920 g004
Figure 5. PCM storage tank and PCM tube positions.
Energies 18 00920 g005
Figure 6. Discharging/heat supply performance of the PCM storage unit.
Energies 18 00920 g006
Figure 7. (a) Comparison of heating outputs of the HPs and carbon intensity of the grid, (b) buffer tank temperatures of the SAHP systems, and (c) electricity consumption profiles.
Energies 18 00920 g007
Figure 8. Simulated arrival and departure time distributions (the simulations are based on empirical distributions derived from Wang et al.’s [38] analysis of the UK 2000 TUS).
Energies 18 00920 g008
Figure 9. Distribution of simulated daily travel mileage for EVs (the simulations are based on empirical data from the NTS [39]).
Energies 18 00920 g009
Figure 10. Energy consumption for ASHP and uncontrolled EV charging.
Energies 18 00920 g010
Figure 11. PV/T SAHP and EV charging with shifting.
Energies 18 00920 g011
Figure 12. Overall carbon emissions of the systems.
Energies 18 00920 g012
Table 1. U-values of building envelopes.
Roof
(W/m2K)
Floor
(W/m2K)
External Wall
(W/m2K)
Window
(W/m2K)
Door
(W/m2K)
0.130.120.540.73
Note: U-values in the table are sourced from Hall et al. [20], which analyzed the E.ON Research House.
Table 2. The utilized EV models in the RBS model.
EVsCapacity
[kWh]
Consumption Rate
[kWh/mile]
TESLA MODEL 3600.232
NISSAN LEAF400.269
KIA NIRO680.27
RENAULT ZOE54.70.274
VOLKSWAGEN ID3620.264
JAGUAR I-PACE900.36
TESLA MODEL Y600.267
AUDI E-TRON93.40.34
BMW I342.20.261
HYUNDAI KONA67.50.261
Note: The order of EV models is based on data from the DfT [34]. Battery capacities (kWh) and consumption rates (kWh/mile) were obtained from the EV-Database [35].
Table 3. Summary of the systems’ heat pump performances.
Heat Pump SystemDaily Compressor Consumption
(kWh)
Daily COP
ASHP15.42.24
100% Thermal Collector SAHP9.873.49
80% Thermal 20% PV Collector SAHP113.12
70% Thermal 30% PV Collector SAHP11.982.88
60% Thermal 40% PV Collector SAHP13.412.57
PV/T Collector SAHP13.292.6
Table 4. Summary of systems, including EV and conventional loads, daily consumption, and carbon emissions.
Heat Pump SystemPV OutputTotal ConsumptionCarbon Emission
ASHP-25.15 kWh5800 g
SAHP with 100% thermal collector-19.61 kWh4141 g
SAHP with 80% thermal 20% PV collector 1.86 kWh19.42 kWh4070 g
SAHP with 70% thermal 30% PV collector 1.36 kWh19.66 kWh4073 g
SAHP with 60% thermal 40% PV collector2.73 kWh20.42 kWh4137 g
SAHP with PV/T collector 4.7 kWh18.25 kWh3789 g
Disclaimer/Publisher’s Note: The statements, opinions and data contained in all publications are solely those of the individual author(s) and contributor(s) and not of MDPI and/or the editor(s). MDPI and/or the editor(s) disclaim responsibility for any injury to people or property resulting from any ideas, methods, instructions or products referred to in the content.

