Article

Assessment of the Impact of Direct Water Cooling and Cleaning System Operating Scenarios on PV Panel Performance

Department of Sustainable Energy Development, Faculty of Energy and Fuels, AGH University of Krakow, Mickiewicza Av. 30, 30-059 Krakow, Poland
Energies 2024, 17(17), 4392; https://doi.org/10.3390/en17174392
Submission received: 28 July 2024 / Revised: 20 August 2024 / Accepted: 27 August 2024 / Published: 2 September 2024

Abstract

:
Among the various renewable energy-based technologies, photovoltaic panels are characterized by a high rate of development and application worldwide. Many efforts have been made to study innovative materials to improve the performance of photovoltaic cells. However, the most commonly used crystalline panels also have significant potential to enhance their energy yield by providing cooling and cleaning solutions. This paper discusses the possibility of introducing a dedicated direct-water cooling and cleaning system. As assumed, detailed schedules of the operation of the developed direct water cooling and cleaning system should be fitted to actual weather conditions. In this context, different cooling strategies were proposed and tested, including different intervals of opening and closing water flow. All tests were conducted using a dedicated experimental rig. 70 Wp monocrystalline panels were tested under laboratory conditions and 160 Wp polycrystalline panels were tested under real conditions. The results showed that introducing a scenario with a 1-min cooling and a 5-min break allowed for proving the panel’s surface temperature lower than 40 °C. In comparison, the temperature of the uncooled panel under the same operating conditions was close to 60 °C. Consequently, an increase in power generation was observed. The maximum power increase was observed in July and amounted to 15.3%. On the other hand, considering selected weeks in May, July, and September, the average increase in power generation was 3.63%, 7.48%, and 2.51%, respectively. It was concluded that the division of photovoltaic installation allows reasonable operating conditions for photovoltaic panels with a lower amount of energy consumed to power water pumps.

1. Introduction

Solar energy is a renewable resource, and many technologies can harvest it directly for use in various fields, including the building, public, commercial, e-mobility, and industry sectors. There are different ways of capturing solar radiation and converting it into usable energy. Nowadays, one of the most familiar ways to harness solar energy is photovoltaics (PV), which converts sunlight directly into electricity. The efficiency of PV panels is relatively low (typically 13–25% for the first generation crystalline or thin film solar cell) and depends on the operating conditions such as the intensity of the solar radiation, the ambient temperature, and the wind speed [1,2]. Furthermore, the efficiency of PV panels may be related to other environmental aspects. For example, the accumulation of dust or other contaminants (such as pollen from bird droppings, leaves, soil particles, crop residues, fly ash, carbon black, or construction sites) on the surface of PV panels can reduce energy production and increase their temperature [3]. It can be assumed that each degree of temperature increase causes a decrease in its electrical efficiency of approximately 0.4–0.65% [4]. Moreover, too high an operating temperature causes the PV panels to overheat, reducing not only their efficiency but also their lifetime and reliability [5]. Therefore, cooling and cleaning are important for maintaining the operation of PV panels.
The most common PV panel cooling methods are water cooling, air cooling, and hybrid cooling consisting of, phase change materials (PCM), heat pipes, microchannels, nanofluids, or thermoelectric elements, which in various combinations yield higher or lower efficiency [6]. In general, PV cooling technologies could be categorized into three main groups: passive methods (no requirement for extra energy), active methods (requires extra energy), and a combination of both [7]. In passive cooling systems, heat stored in PV panels is transferred through radiation, natural convection, evaporation, and splitting the spectrum to the ambient without any assistance from electrically powered devices. In contrast, in the case of active cooling systems, the additional costs incurred by the supplementary equipment and the energy consumed by pumps, fans, controllers, etc. should be considered [8]. Taking into account all the advantages and disadvantages of passive and active cooling systems, the combination of them can be considered the most effective way to sustain the electrical efficiency of photovoltaics and utilize thermal energy [9].
On the other hand, PV panel cleaning methods include mainly methods such as natural rainwater cleaning, manual cleaning, electric curtain dust removal, coating cleaning, robotic cleaning, and vehicle-mounted cleaning machines [10]. Each of the above options differs, e.g., in investment costs, operational costs, maintenance costs, water wastage, and cleaning efficiency. The environmental aspects are also important from the point of view of the operation of the PV panel cleaning systems. For example, although manual cleaning can effectively remove contamination from the surface of PV panels, using a lot of water and cleaning products might pollute the environment. Less harmful to the environment is the coating cleaning, but the coating’s performance deteriorates over time. Furthermore, the maintenance costs of this method are high. Electric curtains are also relatively expensive to install and maintain. They can operate automatically but are characterized by low efficiency in cleaning certain persistent contaminants. In the case of large PV panel areas, vehicle-mounted cleaning machines can be considered a good option. However, they require additional energy for operation and cannot work on uneven terrain [11,12,13].
The worldwide literature includes various examples of cooling and cleaning systems dedicated to PV panels. Starting from the cooling systems, the most commonly considered option for the passive air cooling method on PV panels is to attach an aluminum fin heat sink to the rear surface. For example, Al-Amri et al. [14] introduced a dual-function PV panel racking structure that simultaneously serves as a racking structure and heat sink. The results of the numerical simulations showed that the implementation of the modified structure could reduce the panel temperature by up to 6.3 °C, which eventually increased the panel efficiency by 3%. Hernandez-Perez et al. [15] presented a new passive cooling system aimed at reducing operational temperature and preventing a reduction in the electrical efficiency of PV panels in unfavorable environments. The numerical simulation results showed a temperature reduction of up to 9.4 °C. The experimental results were in close agreement, reducing around 10 °C during peak irradiance. Hamed et al. [16] numerically studied the effect of cooling PV panels through the desorption process and water harvesting using a silica gel layer. The model developed by the authors was solved in MATLAB-R2022a and validated. By using a 1 cm silica gel layer, the average PV panel temperature was reduced by approx. 16.2 °C, and an efficiency enhanced by approx. 8.8%. Hussien et al. [17] introduced an active air cooling system for PV panels. The increase in the panels’ efficiency was observed at a level of approx. 2.1% for small backside fans and approx. 1.34% for the blower cooling method. Bevilacqua et al. [18] investigated numerically the spray cooling phenomena on the back surface of PV panels. The PV panel operated with an implemented cooling system was characterized by an electrical performance higher by approx. 7.8% compared to the uncooled one. Furthermore, a reduction of 28.2% of the average panel temperature was observed. Kabeel et al. [19] compared air cooling, water cooling, and combined air and water cooling systems under Egyptian climate conditions. As was concluded, the water cooling method was characterized by, 7%, 18%, and 29% higher efficiency compared to the combined air and water cooling method, air cooling method, and uncooled PV panels. Elavarasan et al. [20] studied the novel PV cooling system equipped with PCM, fins, and still water. The maximum power increase was approx. 20.25%, while on average 8.57% improvement was obtained relative to the reference PV panel. Faheem et al. [21] analyzed the idea of utilizing thermoelectric modules (TEMs) to enhance the efficiency and performance of PV panels. The use of TEMs for the active cooling of the PV panel allowed to increase its efficiency by approx. 9.54%. Furthermore, Choi et al. [22] analyzed the effect of acoustic excitation to enhance the cooling performance of internal channels imprinted with single dimples for solar PV panels. In addition to the cooling methods mentioned above, there are various other ways to increase the efficiency of electricity generation in PV panels, including integration of PV cells with solar thermal collectors (PV/T) [23], integration of PV cells with thermoelectric generators (PV-TEG) [24], the introduction of up-conversion technology (i.e., the absorption of two or more photons resulting in radiative emission at higher energy than the excitation) [25], the use of parabolic dish and parabolic trough solar concentrators [26,27], the use of Fresnel lenses [28], etc. Also, in the case of these systems, the selection of a proper cooling method is important. For example, Micheli et al. [29] investigated micro-finned heat sinks for high-concentration photovoltaics. The effects of the concentrating photovoltaic (CPV) geometry on the thermal performance of the heat sink were experimentally tested in order to design an optimized system for passive cooling. It was concluded that micro-fins are a suitable option for cooling at concentrations up to 500×. Du et al. [30] developed and tested a CPV module and its active water cooling system. The experimental results showed that the operating temperature of the CPV module under water cooling was reduced to under 60 °C and the efficiency of the CPV had increased and produced more electric power output.
Another part of the investigation is related to cleaning PV panel surfaces. Casanova et al. [31] stated that the most durable technique for cleaning PV panels was the use of water. The authors found that in rainfall periods, rainwater cleaned the dirty cells, recovering their normal performance. Even less than 1 mm of light rain was enough to clean the covered glass, reducing daily losses below the average value of 4.4%. However, dust accumulation could cause daily losses exceeding 20% in long periods without rain, such as in summer. It has also been proven that a low amount of rainfall can cause much more contamination of the PV panel surface [32], which can be removed through the use of mechanical cleaning processes [33]. Only much larger rainfall, over 20 mm, can contribute to their full cleaning [34]. Furthermore, Moharram et al. [35] studied the possibility of using water and surfactants to remove contaminants from the PV panel surface. The panels were cleaned for 10 min per day for 45 days. Results showed that this method was insufficient in the desert or high desert areas because the efficiency of the system was decreased by 50% at the end of the investigations. Dahlioui et al. [36] presented a solution for cleaning PV panels based on the use of the dew water formed on the surface of the front glass. The experiments were conducted on glass plates under real outdoor conditions. It was observed that the soiling losses for fixed glass averaged 9.3% during the exposure period, while variable glass only marked 3.3%. Zhao et al. [37] examined the impact of self-cleaning superhydrophobic coating on particle deposition and PV panel performance. A numerical model for particle accumulation was established, and the effect of particle size, wind speed, and tilt angle on particle accumulation was numerically explored. The results showed that dust accumulation on coated modules decreased by 37.4% under a particle size of 30 μm and a tilt angle of 60° compared with deposited dust on uncoated modules. Additionally, the reduction in efficiency is 9.8% for uncoated modules, and 7.9% for coated panels was observed. Singh and Chandra [38] carried out research aimed at developing a system determining the optimal intervals for cleaning PV panels to maximize their efficiency and minimize power loss due to dust accumulation. They developed a new optimization method and employed it to schedule cleaning activities. The proposed approach achieved high time accuracy, precision, sensitivity, and specificity, with values reaching 96.53% for most metrics. On the other hand, Zhang et al. [39] presented a rolling-horizon cleaning recommendation system and proposed prediction and profit models. The two case studies showed that the profit improvement can reach up to 6% and 30%, respectively. Furthermore, You et al. [40] determined the most beneficial cleaning schedules for PV systems in different cities worldwide by maximizing the Net Present Value (NPV), while Rodrigo et al. [41] used the Levelized Cost Of Energy (LCOE) as a metric to identify the optimal cleaning schedule for a PV installation in Mexico.
This study continues the studies described in Refs. [42,43]. In the mentioned papers, initial investigations were performed to assess the reasonableness of cooling PV panels. For this purpose, the first configurations of the experimental rig have been proposed, and the initial measurements have been conducted, giving positive feedback. Based on the conclusions from the previous investigations, this study includes an innovative proposal for the direct water cooling and cleaning system with a partially closed sequential cooling water circuit. Water is sprayed sequentially onto the front surface of PV panels using a header, and then, after receiving heat and removing impurities from the panel’s surfaces, it is captured using a water collector and flows through the filter and heat exchanger into the water tank. Water is pumped back to the supply collector from the water tank and the entire process is repeated. To ensure high efficiency of the entire installation, the proposed system is divided into several parts, and individual PV panels are cooled and cleaned sequentially. In addition, the pump’s performance and operating time per day can be adjusted to suit the specific installation configuration and current operating conditions. If an anomaly is detected (e.g., as a result of contamination), it is possible to automatically adjust the operation of the system in such a way that the detected disturbance is removed. To ensure a low temperature of the cooling water, the water tank is equipped with a heat exchanger through which heat is collected from the cooling water (this heat can be transferred, e.g., to the domestic hot water tank or removed to the environment through the radiator). Rainwater can be used as a cooling and cleaning medium, provided that appropriate filtration and water pH are ensured (for example, the area-averaged sum of atmospheric precipitation in Poland amounted to 534.4 mm in 2022, which was 87.4% of the norm determined based on measurements in 1991–2020 [44]). The general scheme of the developed system is shown in Figure 1.
This study’s contribution to the current state of the art is at least threefold: the original configuration of the water cooling system was developed, the interval operation of the proposed system was introduced and tested, and the practical possibility of using heat collected from the PV panel’s surface was investigated.

2. Materials and Methods

The studies were conducted using internal and external experimental rigs. The first part of the described tests was conducted under laboratory conditions, while the second part was carried out under real conditions.

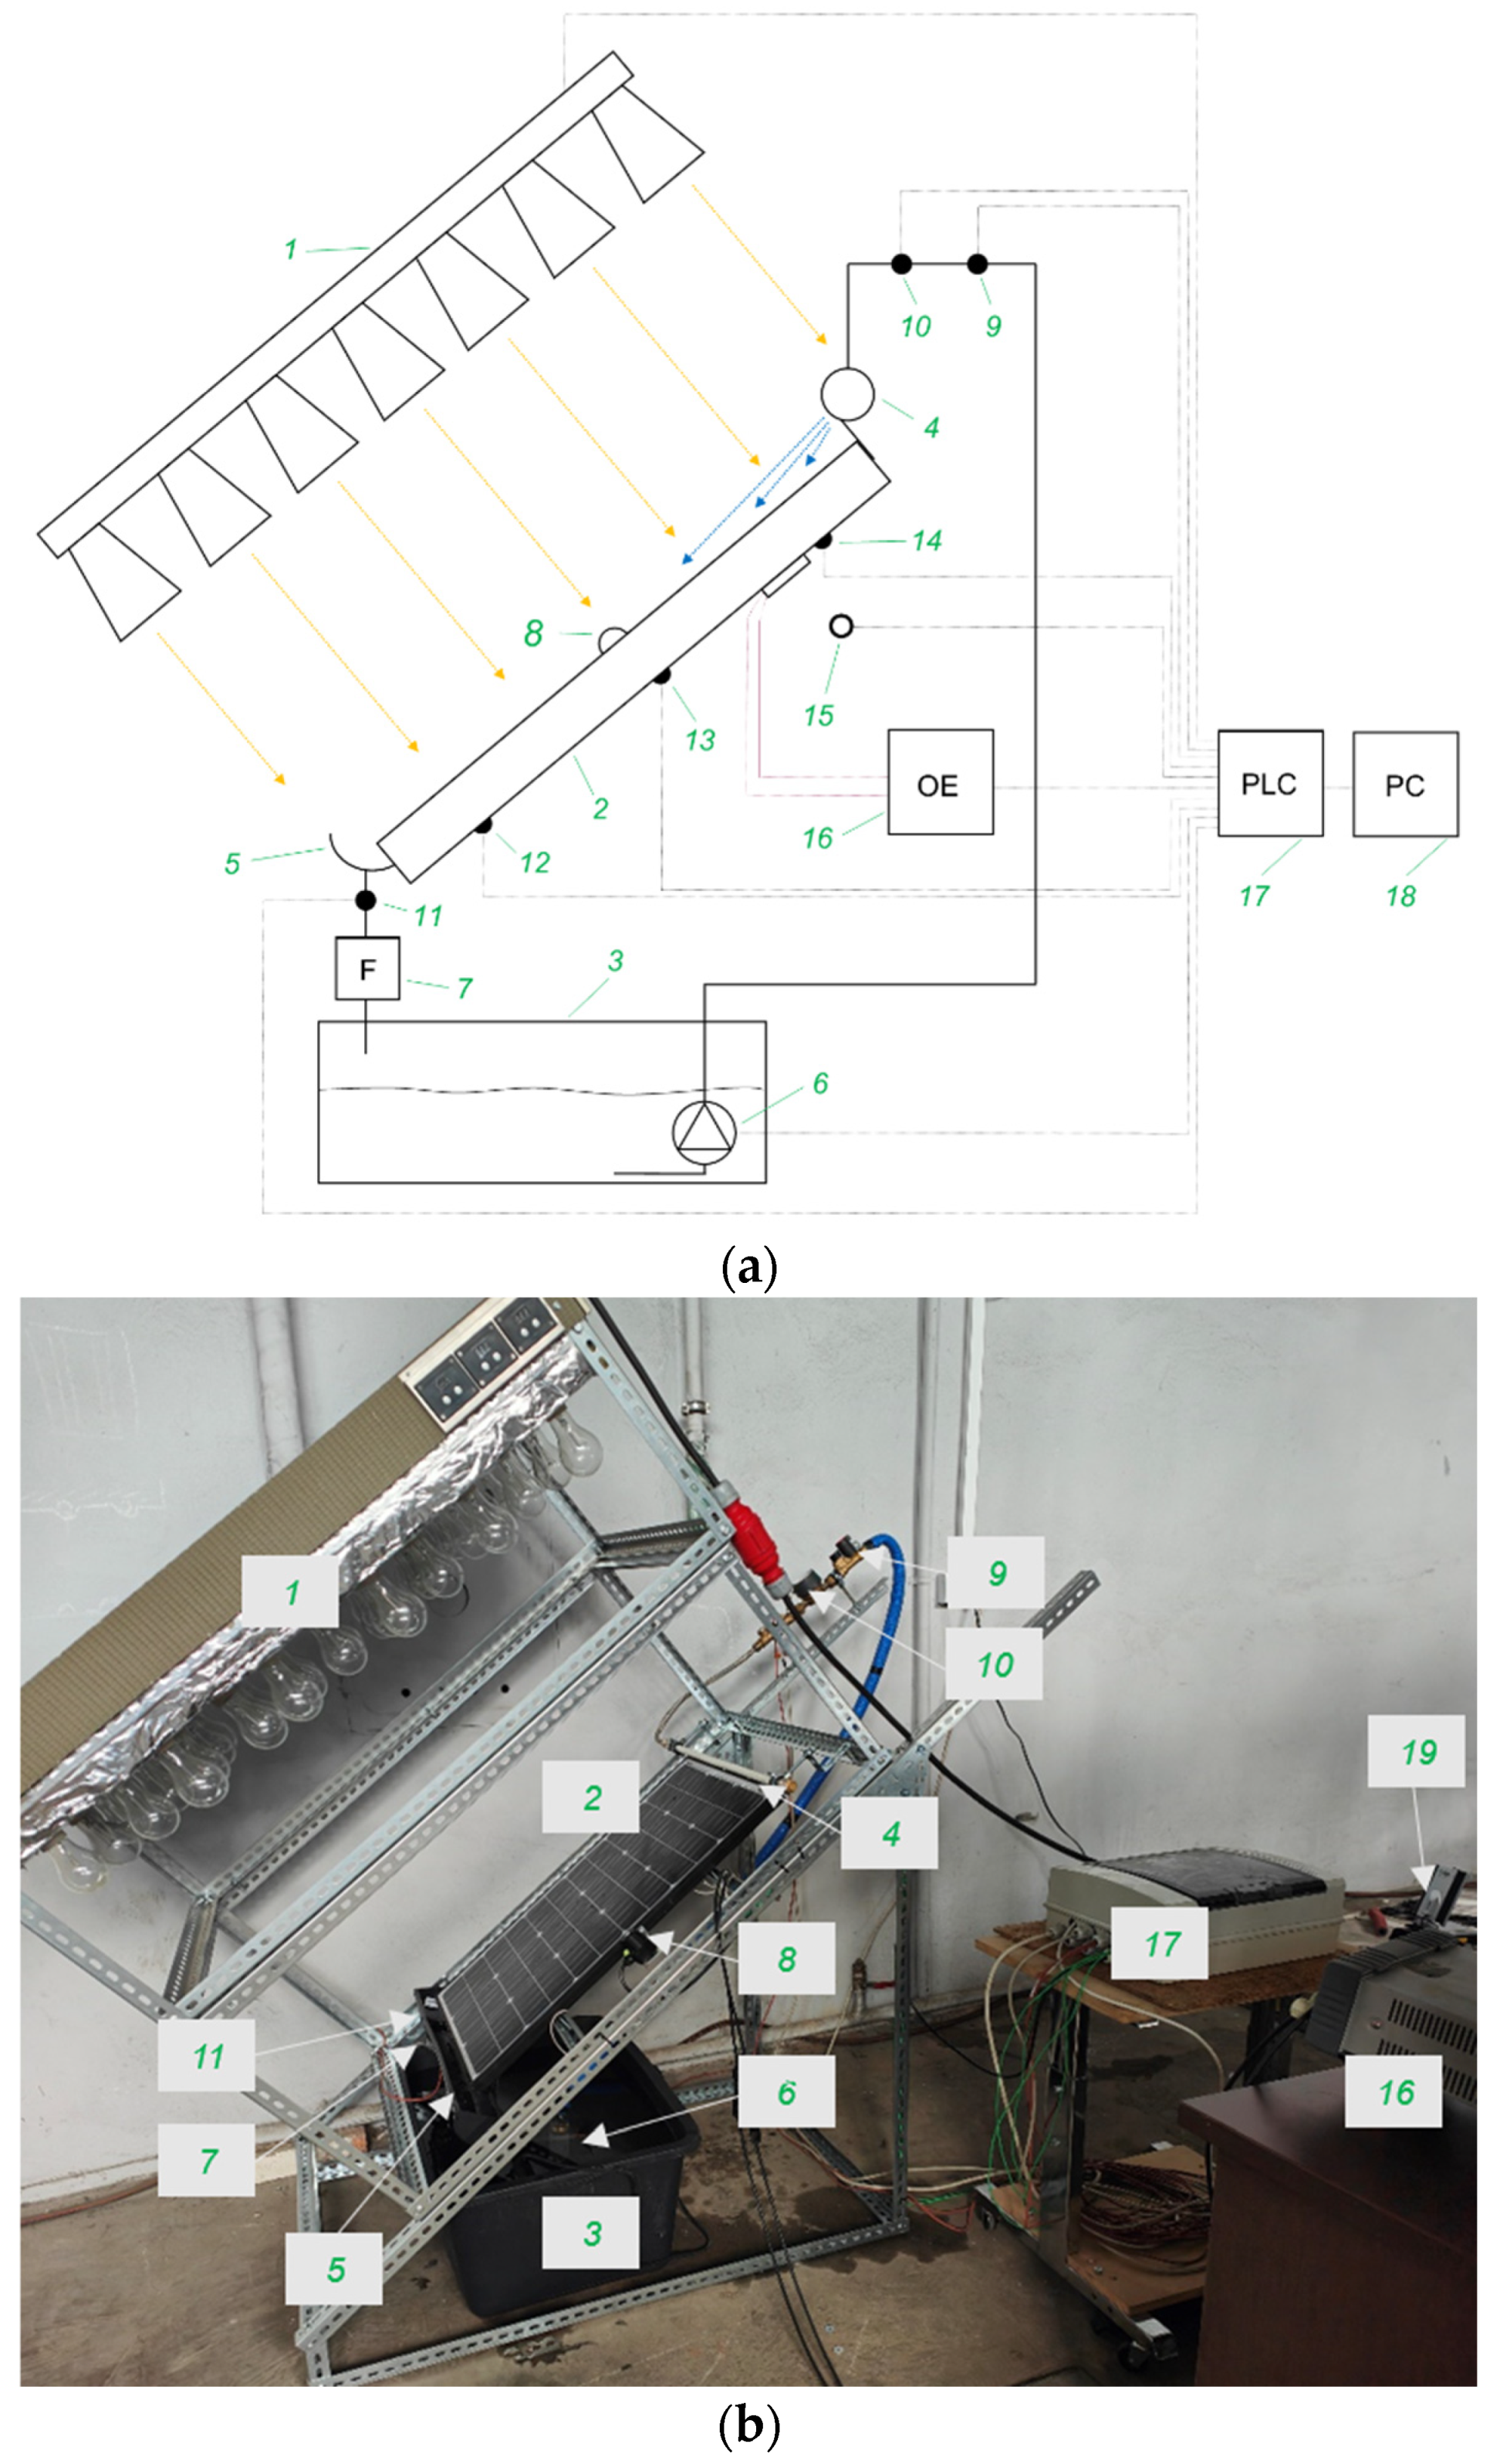
2.1. Internal Experimental Rig

The internal experimental rig was equipped with control and measurement components listed in Table 1.
The configuration of the experimental rig (including the distance between the light source and the PV panel) allowed to provide the temperature of the PV panel surface equal to approx. 55 °C. This value can be considered as the average operating temperature of the PV panels under real conditions (however, during summer, the temperature of the PV panels can exceed 60 °C) [20]. Consequently, the average light intensity was approx. 550 ± 27 W/m2. The inclination of the PV panel was set to 38°, corresponding to the recommended inclination of photovoltaic installations in Poland (38–41°, according to data calculated in the PVGIS tool [45]). The temperature of the PV panel surface was measured using three thermocouple sensors. Furthermore, the uniformity of temperature distribution was measured using an infrared camera. An additional thermocouple sensor was located near the PV panel and was used to measure the ambient temperature. On the other hand, two resistance sensors were used in the cooling water circuit to determine the temperature at the outlet from the header and in the water collector. Moreover, a flowmeter was used in the water circuit. The readings of the flowmeter and temperature sensors allowed us to estimate the amount of heat received by the cooling water from the PV panel surface. Using a specially developed visualization panel, all measured parameters were available via CoDeSys software. The general scheme and real view of the experimental rig are shown in Figure 2.

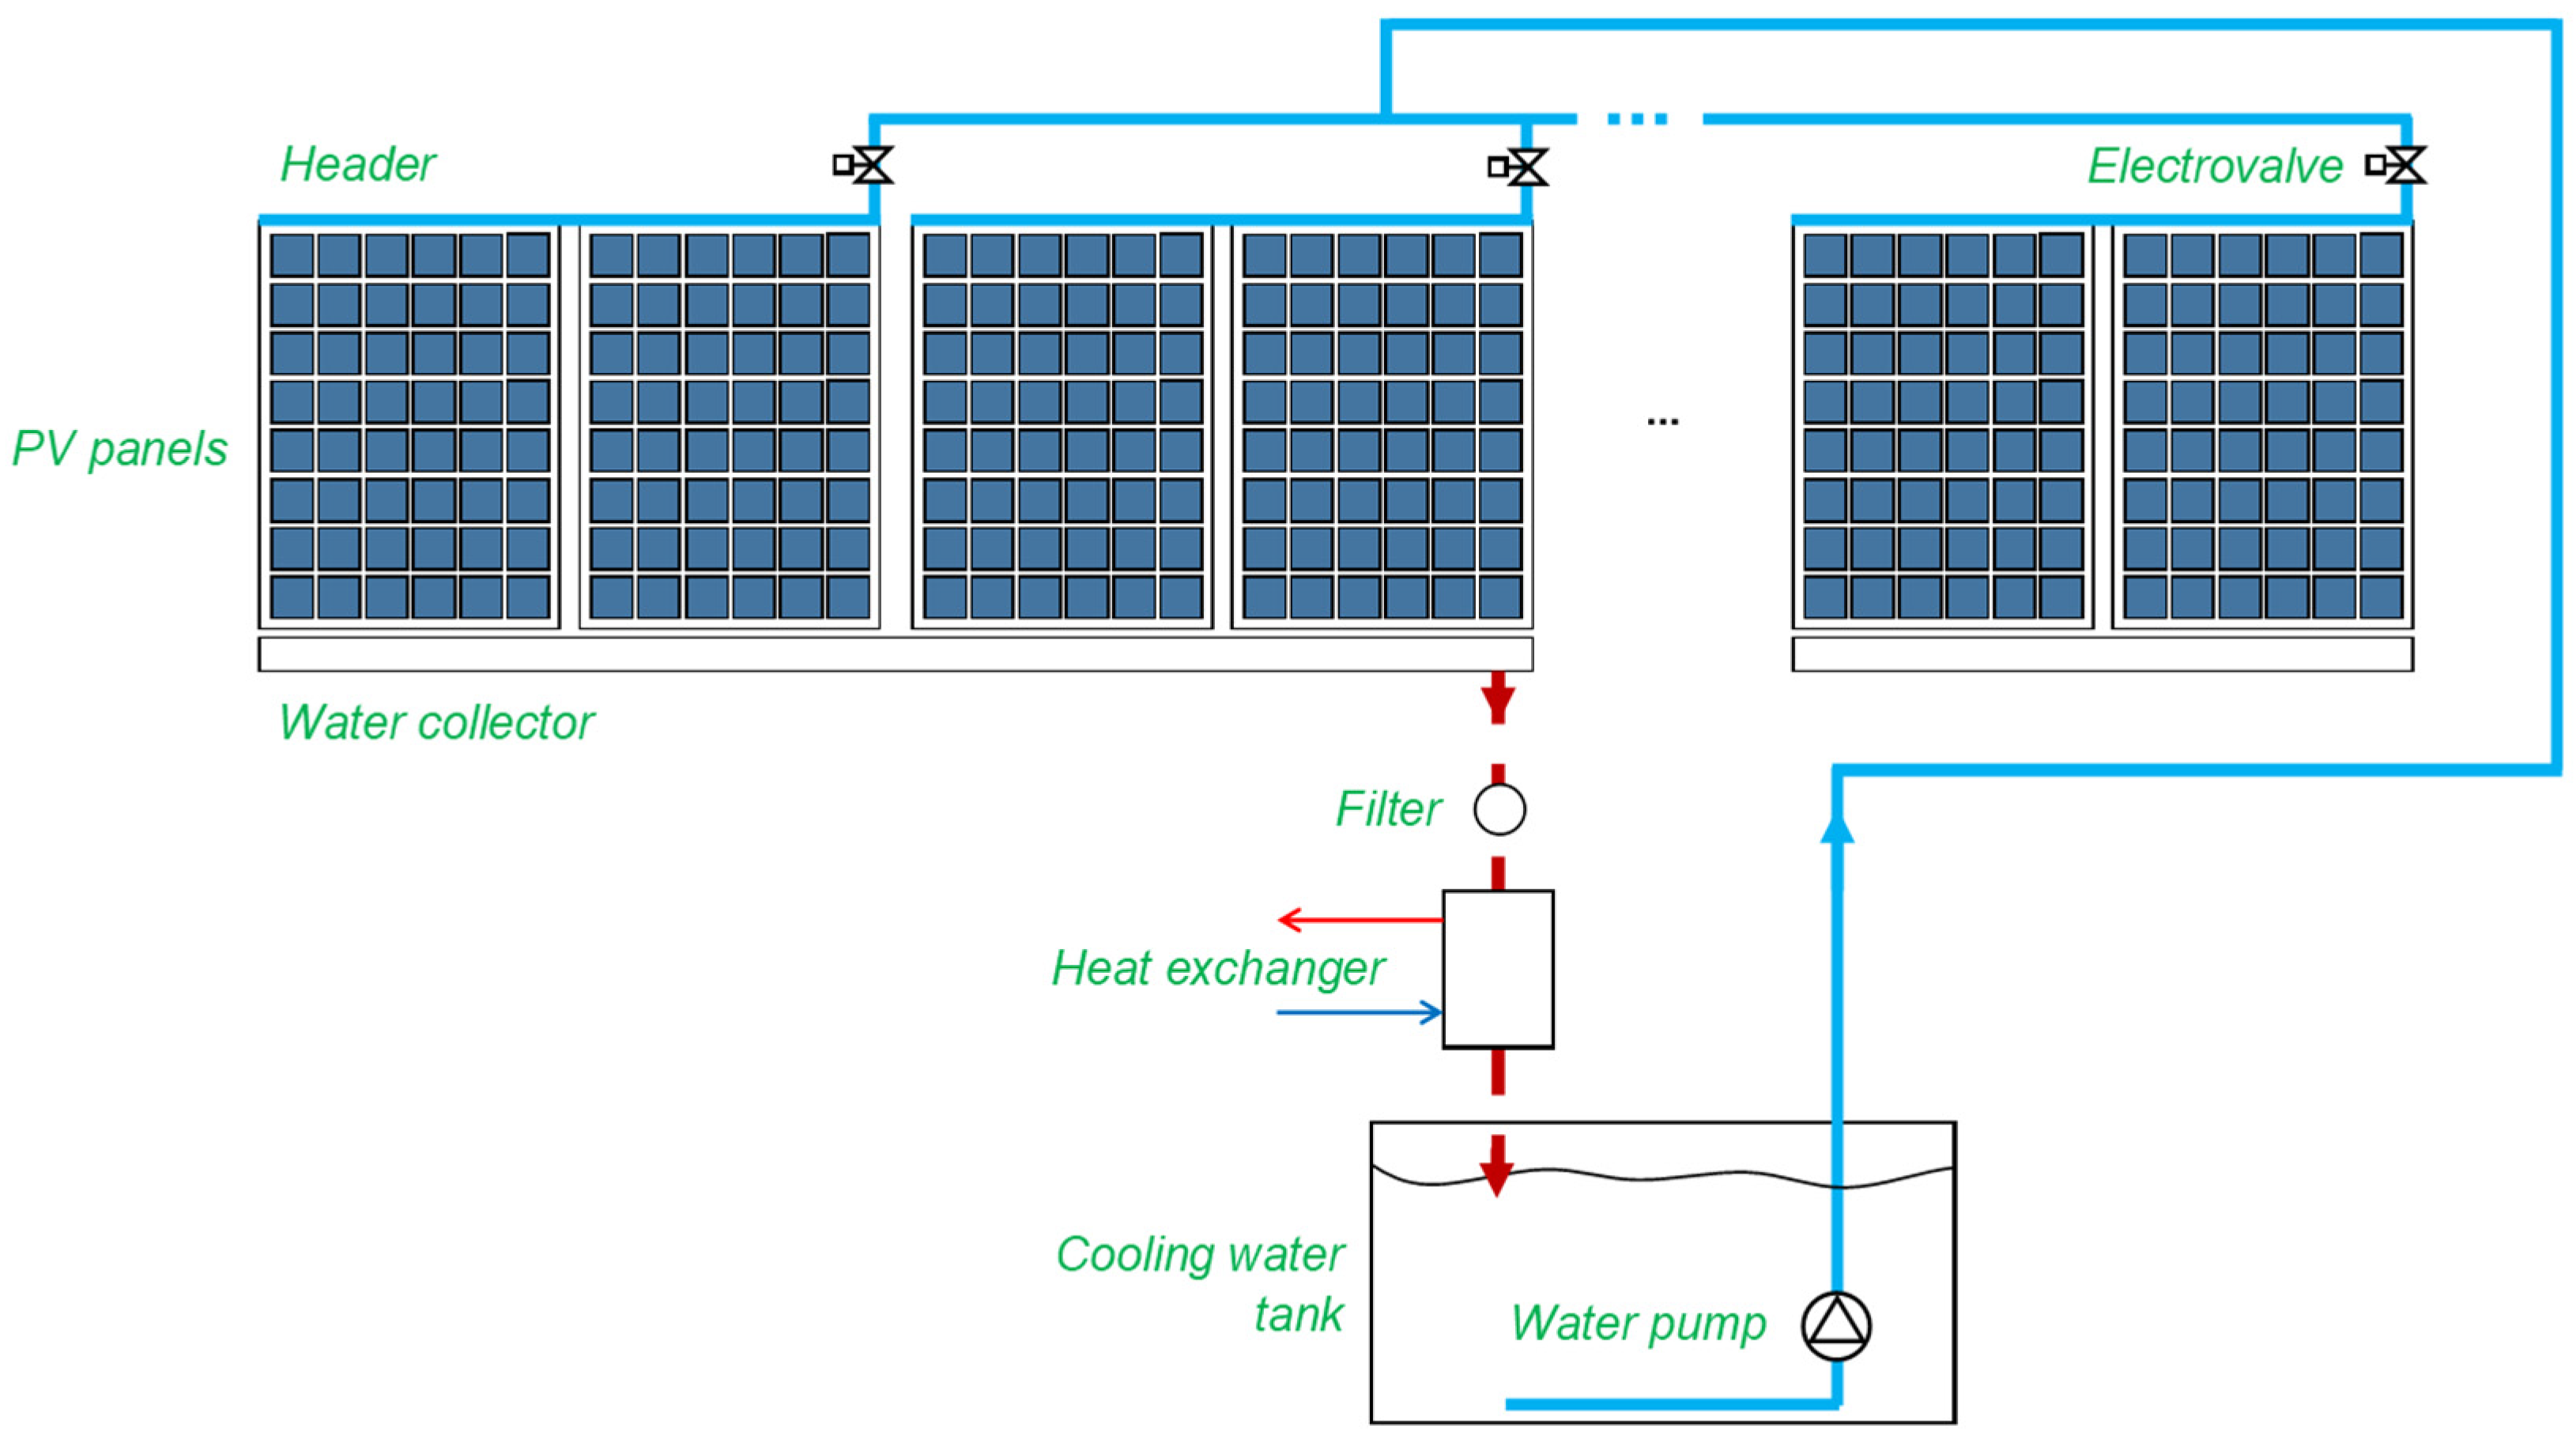
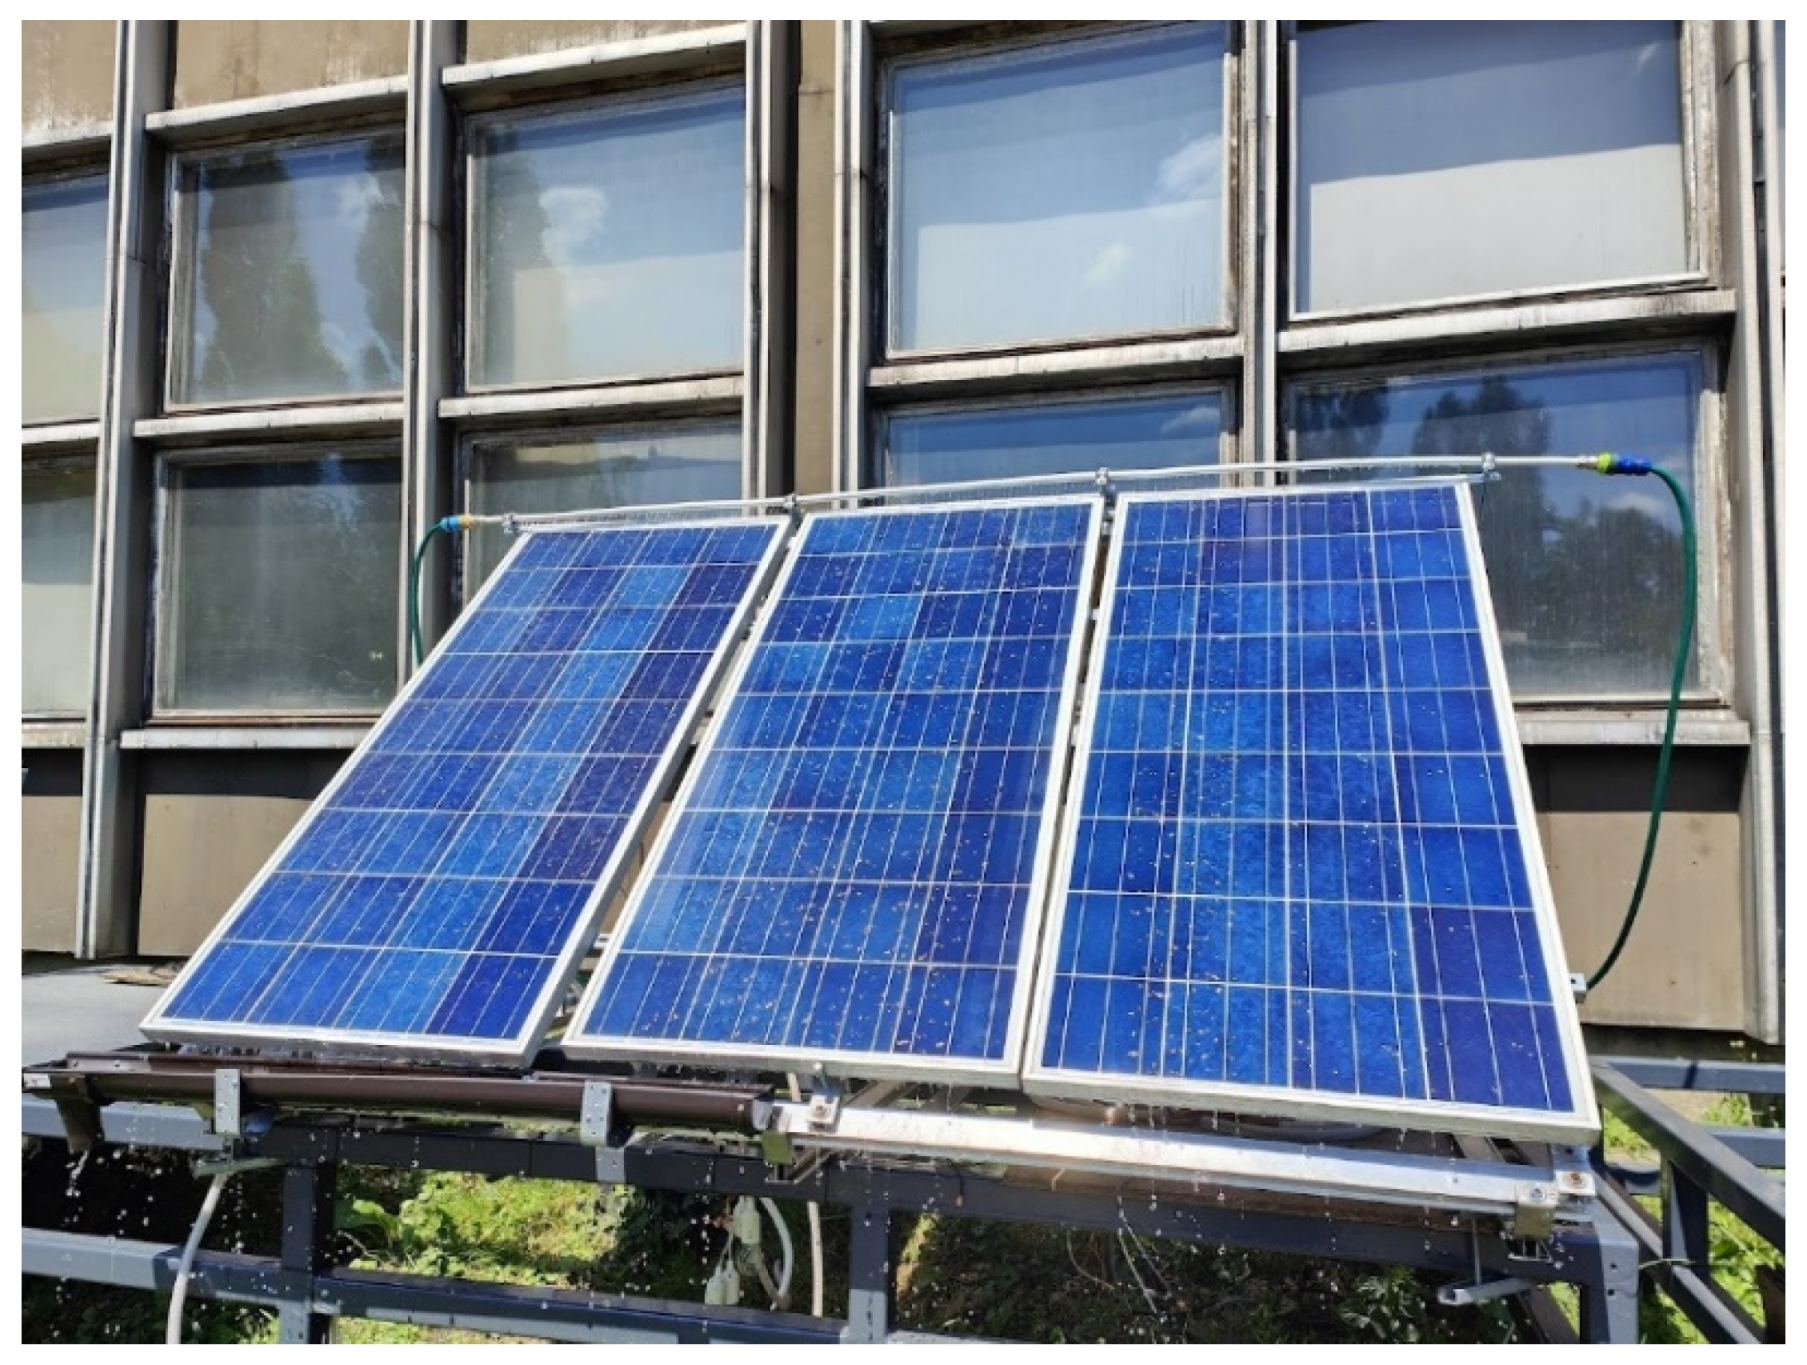
2.2. External Experimental Rig

The external experimental rig was developed using laboratory test experiences. Some elements were rescaled to real conditions (e.g., the size and number of tested PV panels, the length of the header and water collector, the water flow, etc.). The external experimental rig was equipped with the elements listed in Table 2. Furthermore, the real view of the part of the external experimental rig is shown in Figure 3.

2.3. Experimental Procedure

The experiments described in this paper have been divided into measurement series conducted under laboratory and real conditions. During laboratory tests, the operational parameters of the tested PV panel were determined when the average temperature of its surface was approx. 26.5 °C (series S_1A), and when the tested PV panel was heated to approx. 59.8 °C (series S_1B). Then, the effect of contamination on PV panel performance was determined when the PV panel remained cold (measurement series S_2A–S_2C). Contamination was simulated by sand with a grain size of 0.1–0.4 mm. The following variants were considered:
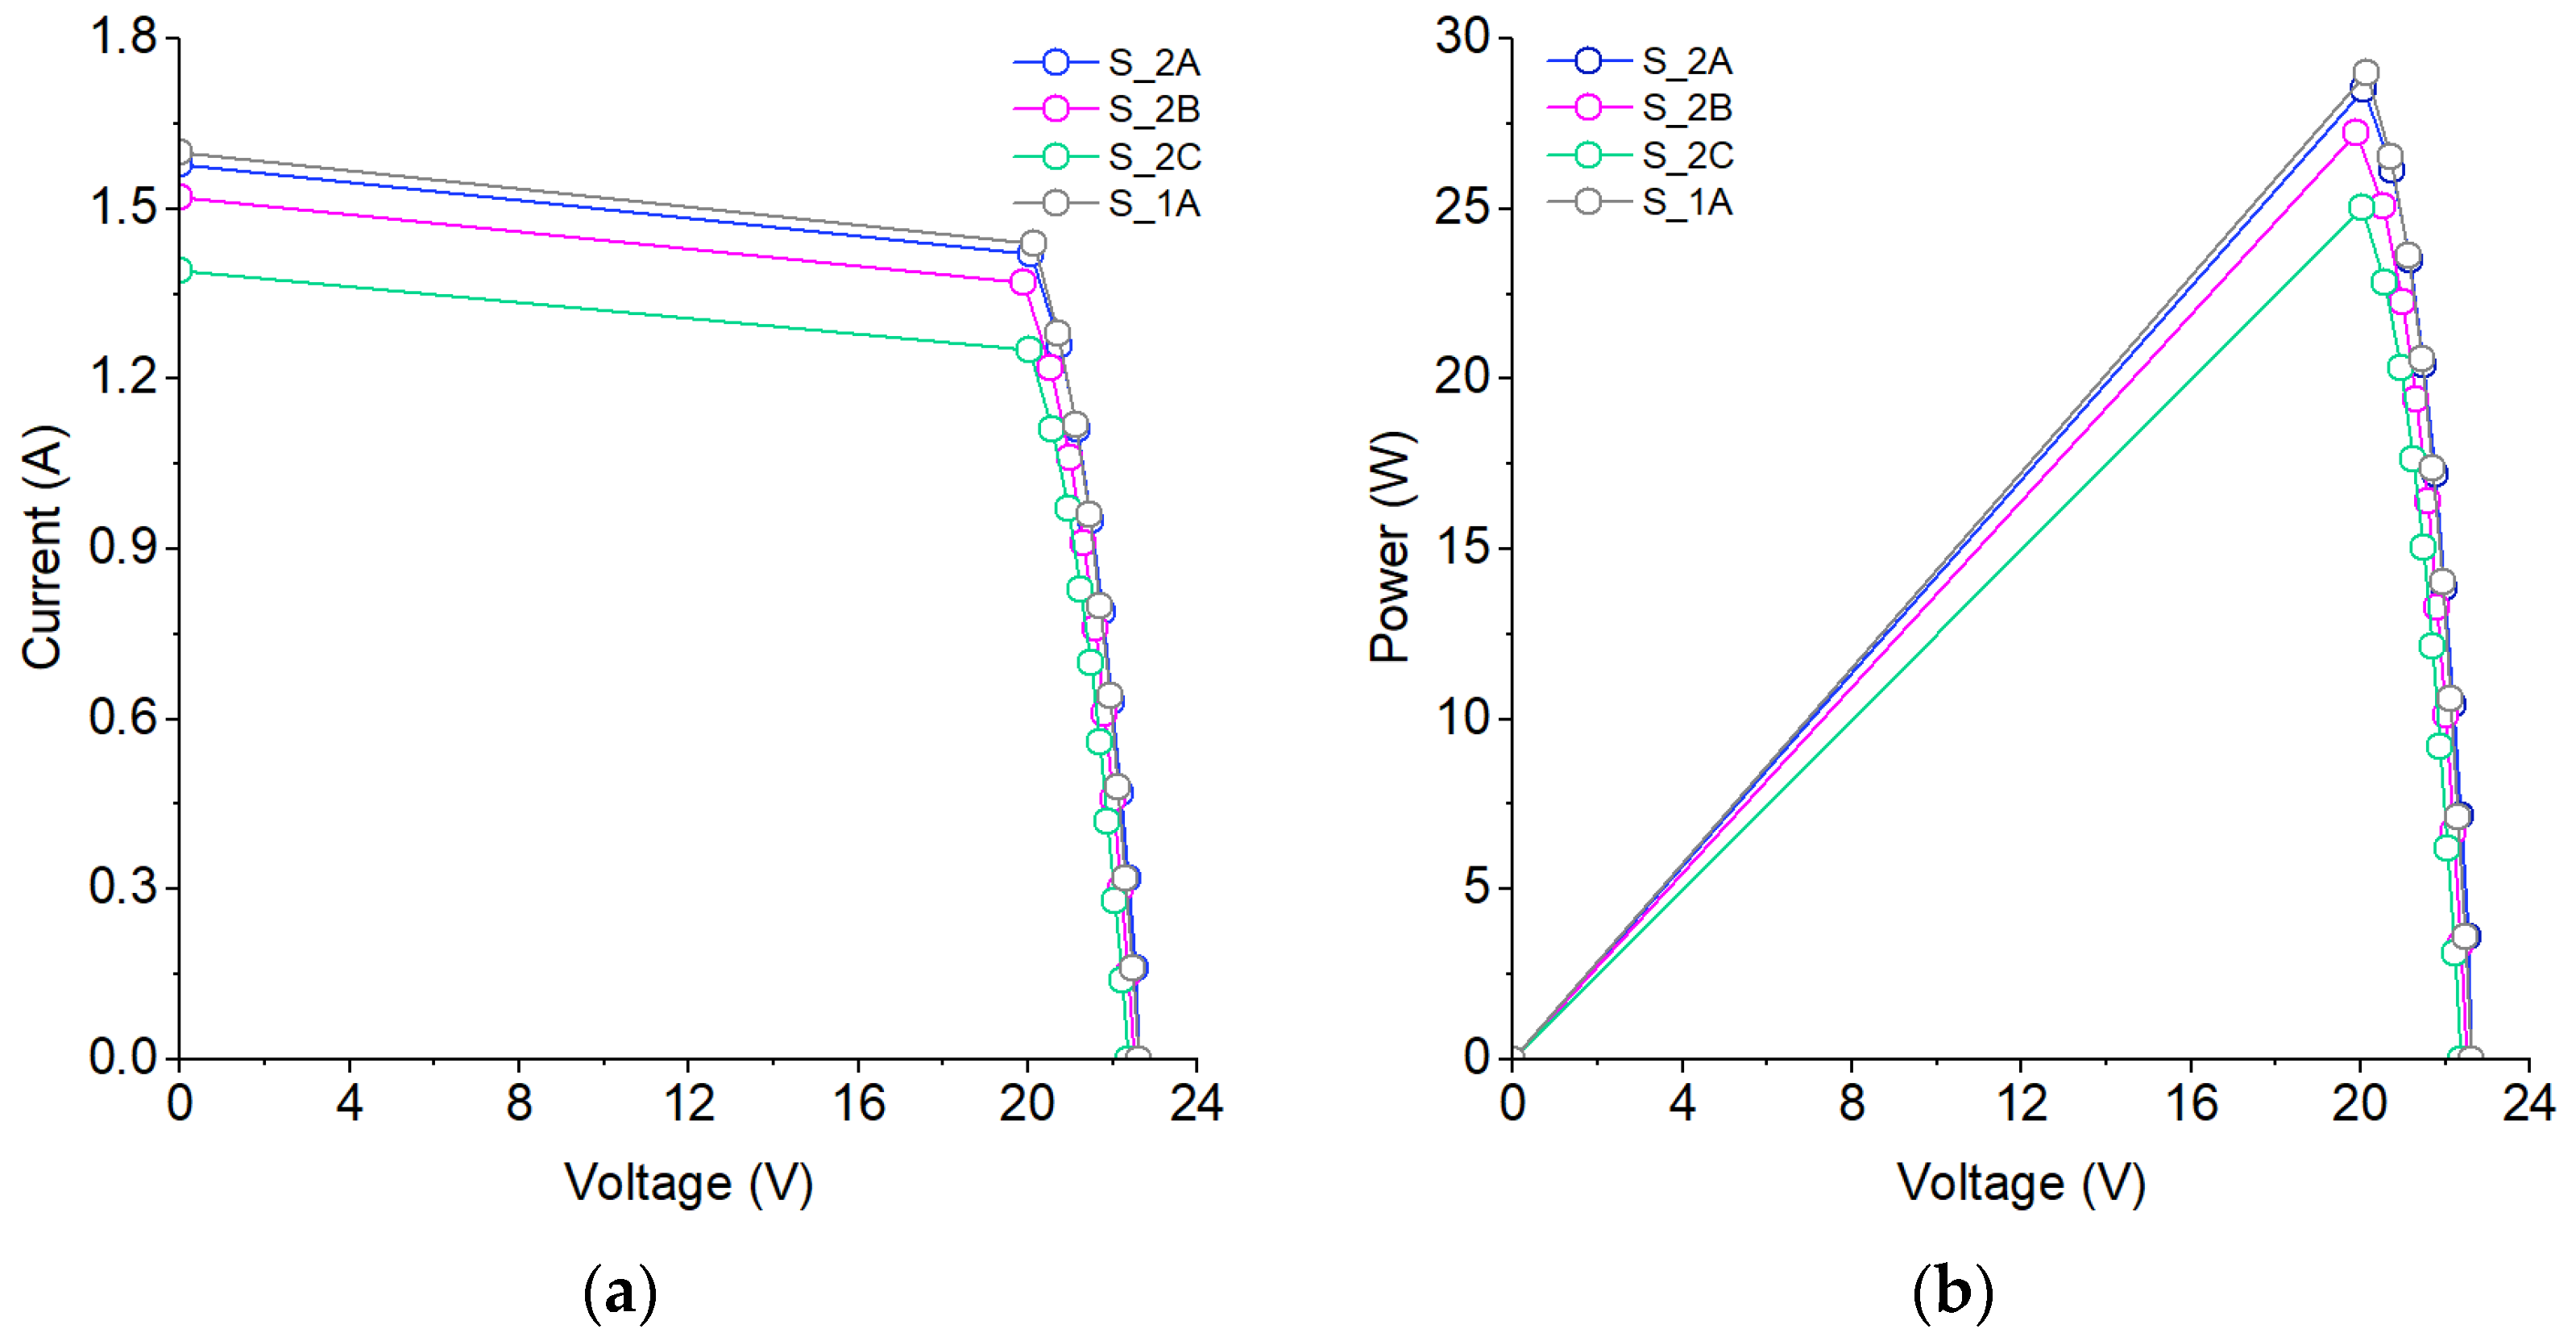
  • random covering of the surface of the PV panel with 15 g sand (series S_2A),
  • random covering of the surface of the PV panel with 30 g sand (series S_2B),
  • random covering of the surface of the PV panel with 50 g sand (series S_2C).
An example of covering the surface of a PV panel with sand (before starting the water flow) is shown in Figure 4.
In the next part of the study, the direct water cooling and cleaning system was introduced. This system was equipped with a header in the form of a pipe with a diameter of 16 mm and 1.5 mm water inlets located every 20 mm (see Figure 5). The water flow was set to:
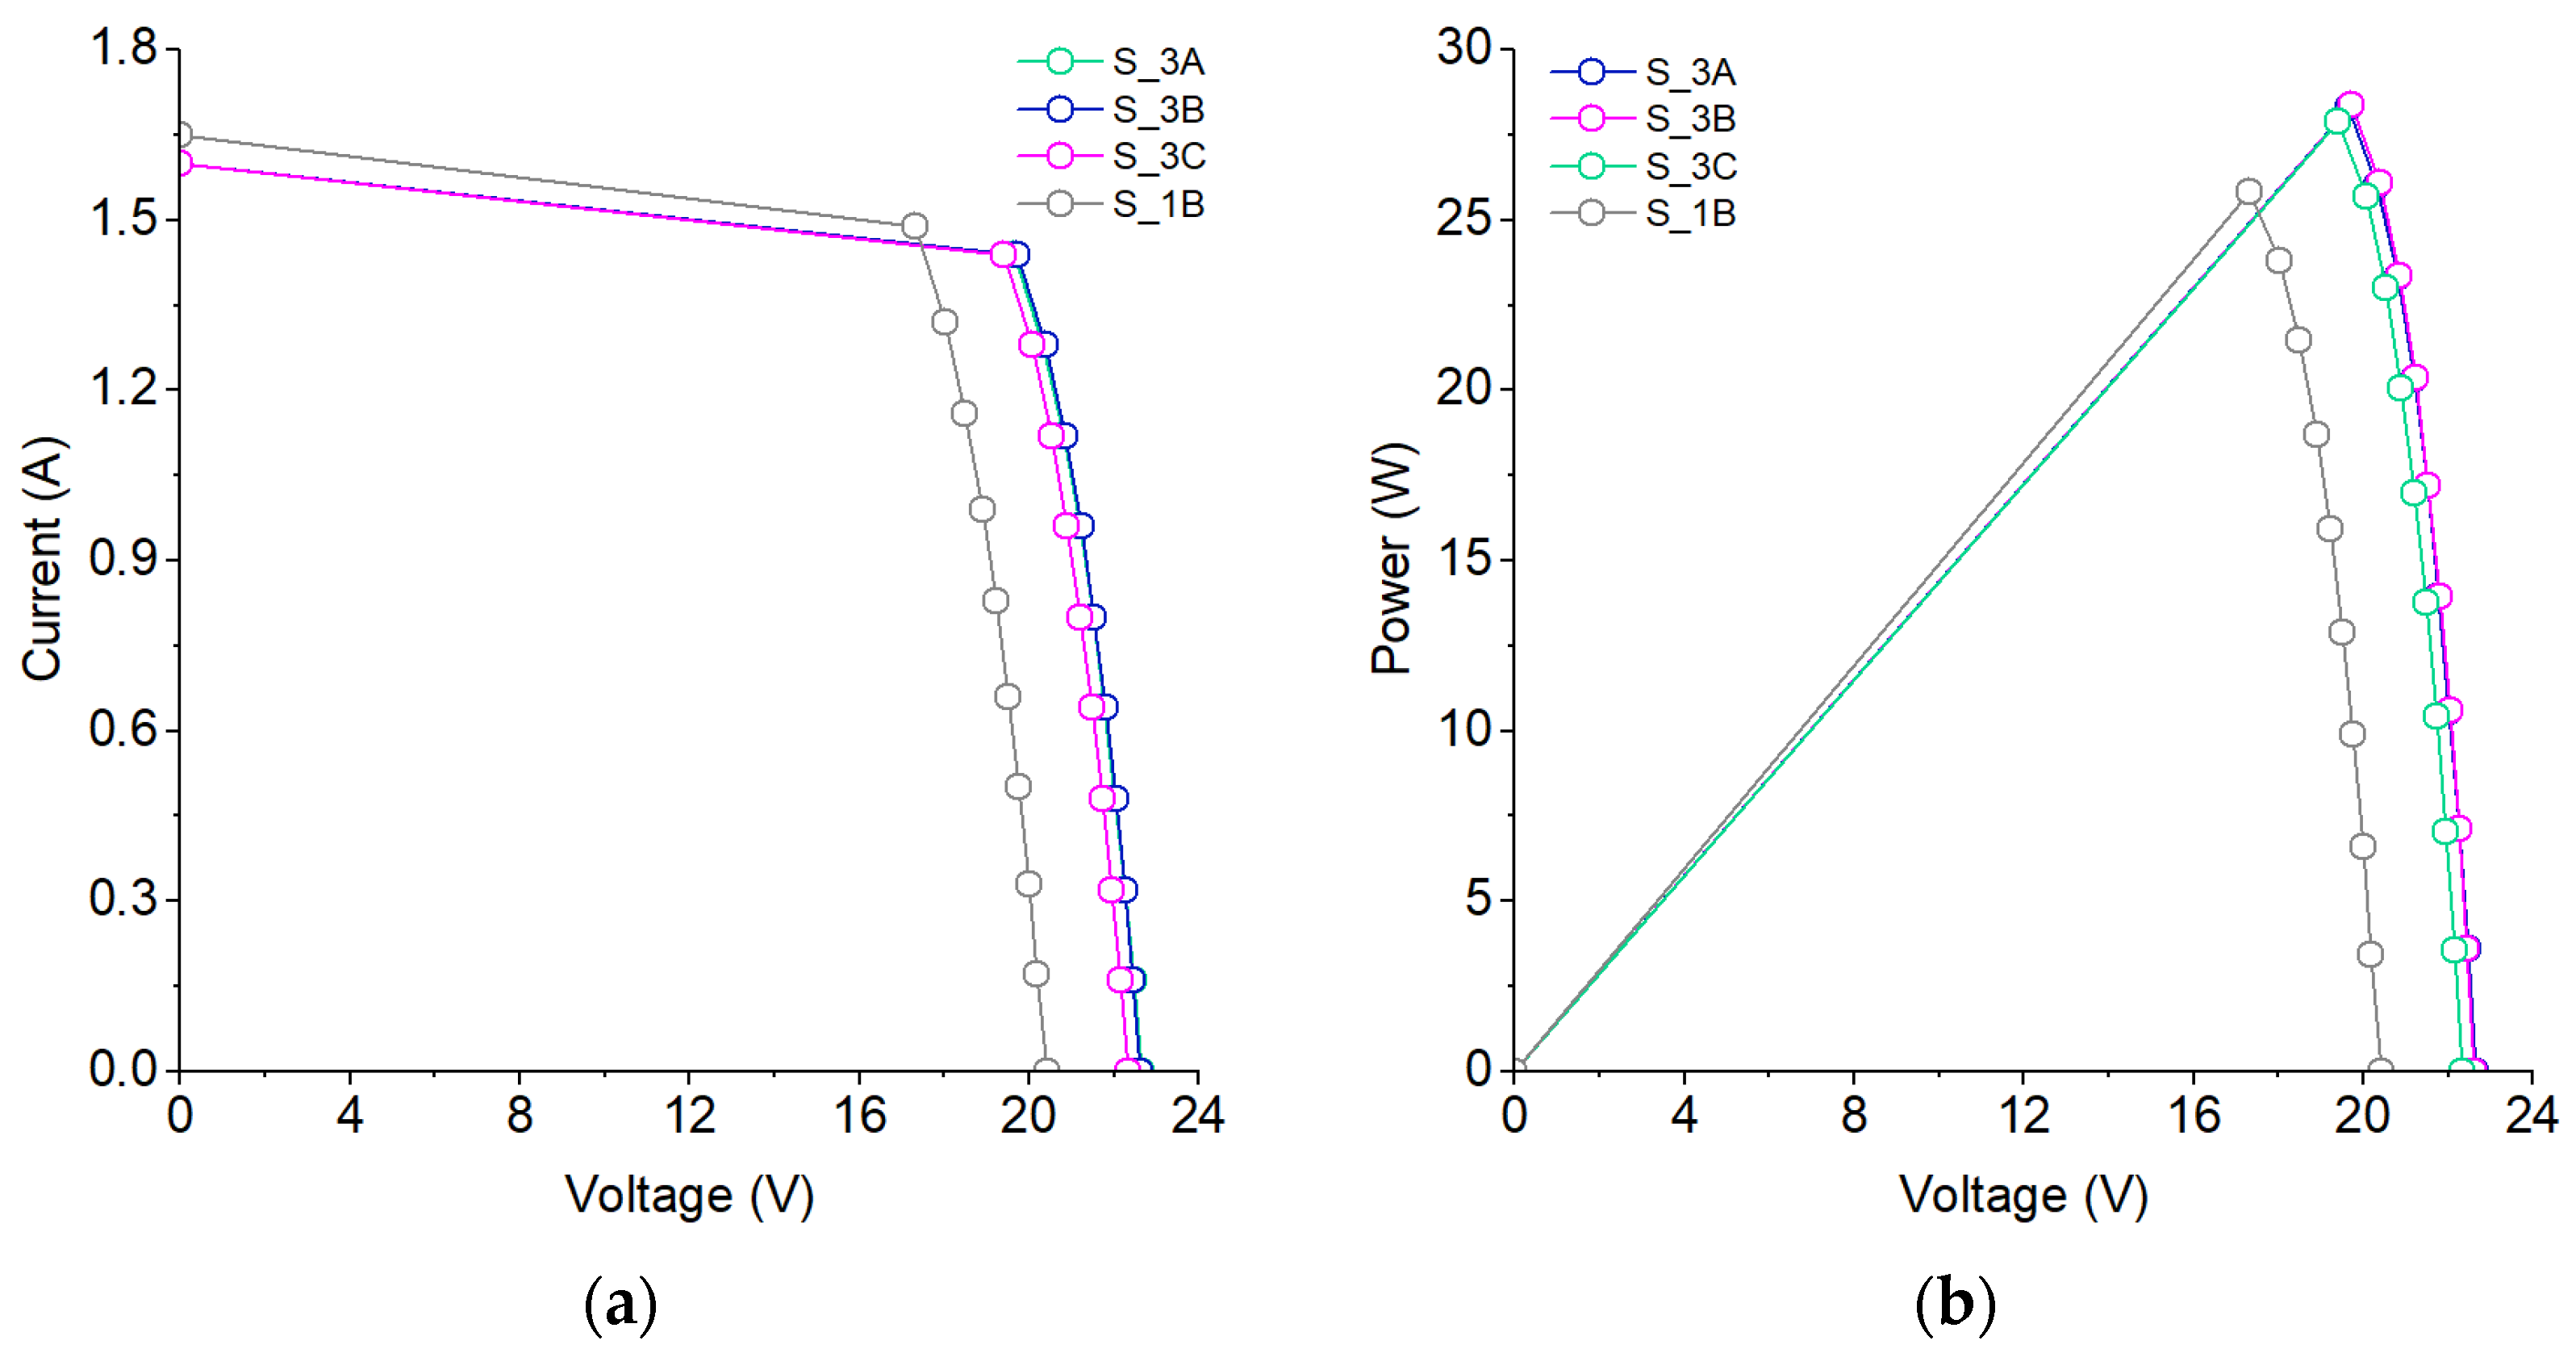
  • 2.0 L/min (series S_3A),
  • 3.0 L/min (series S_3B),
  • 4.0 L/min (series S_3C).
Furthermore, the possibility of interval operation of the cooling system was tested, and the amount of heat received on the PV panel surface was analyzed. Three scenarios were considered:
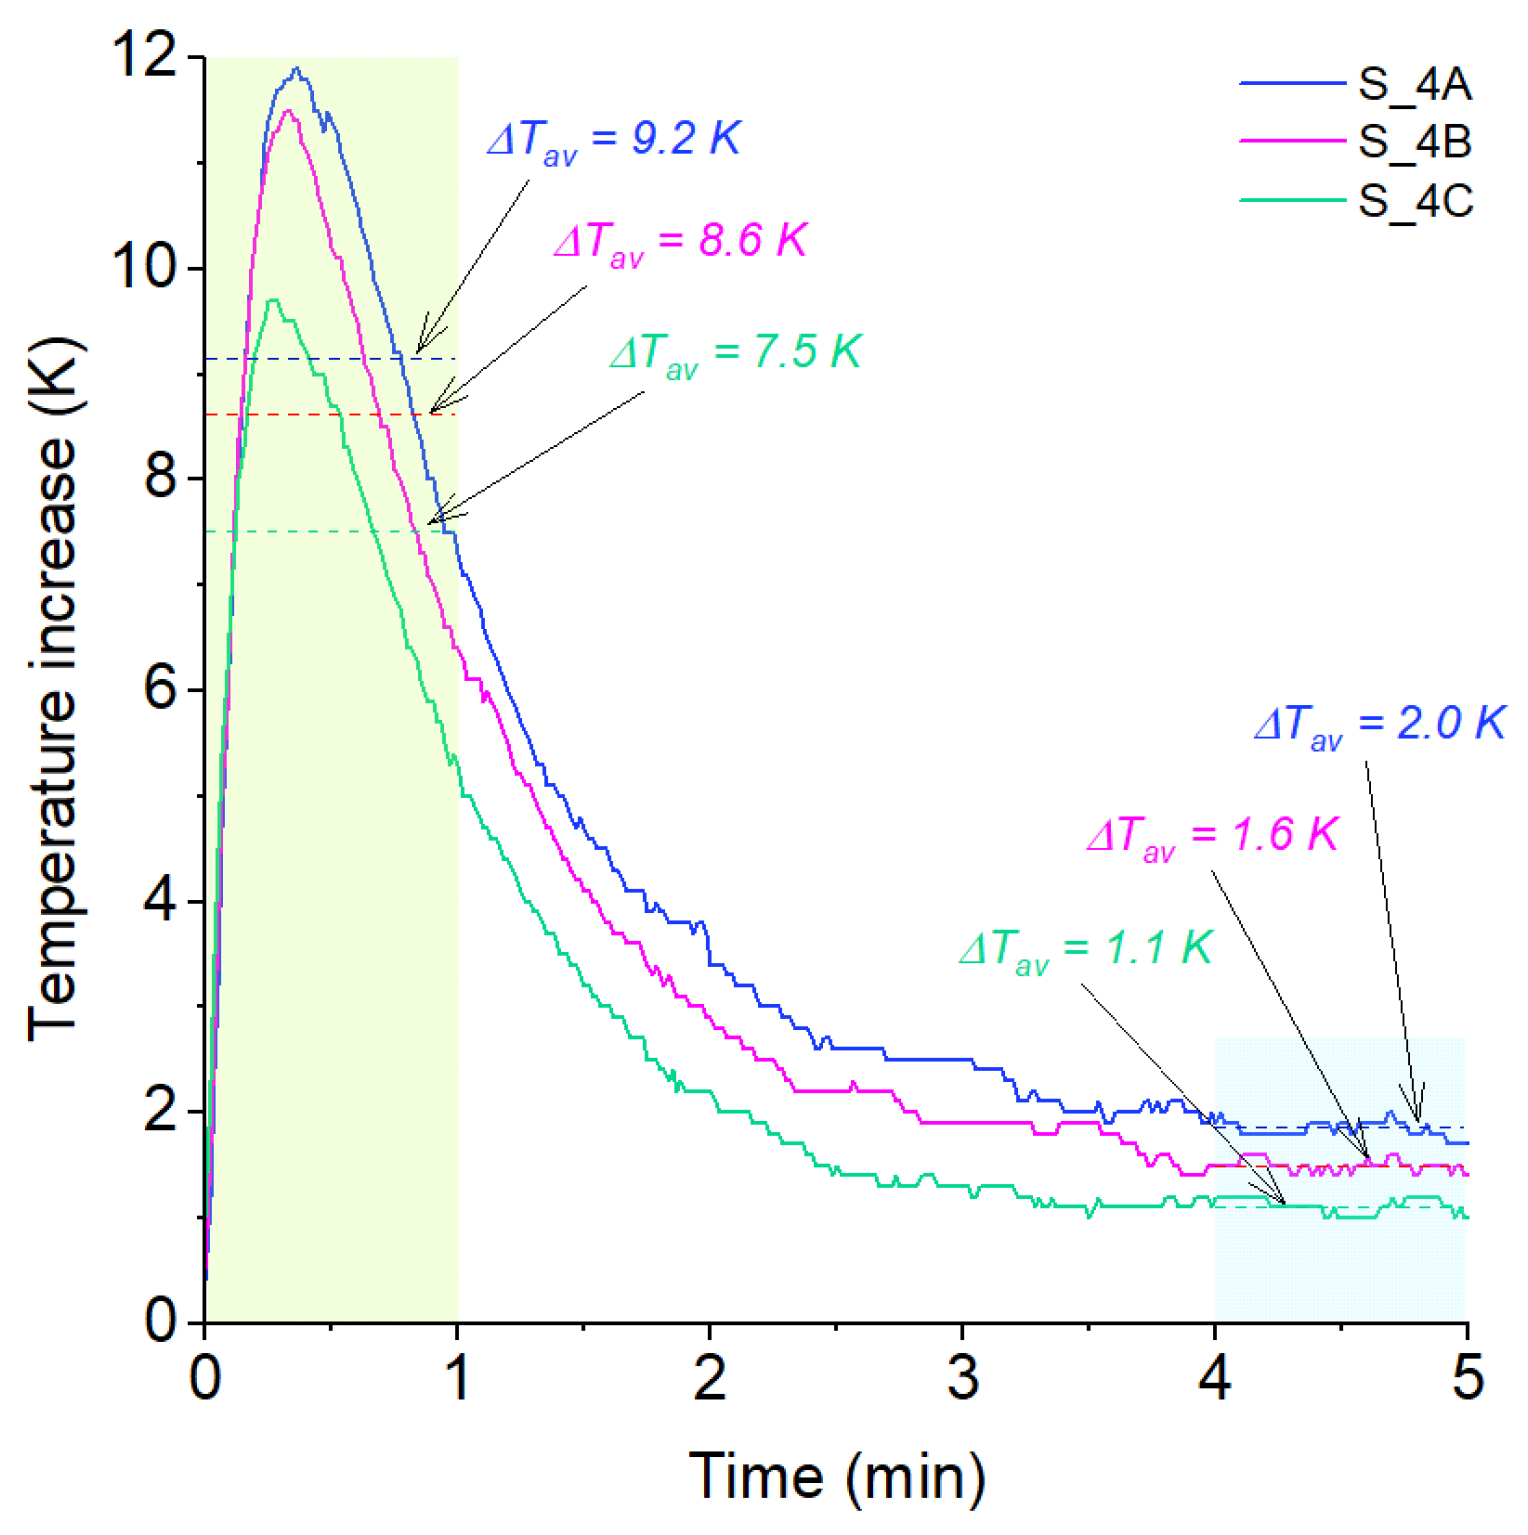
  • a 2 min cooling mode with 5 min interruptions (series S_4A),
  • a 1 min cooling mode with 5 min interruptions (series S_4B),
  • a 1 min cooling mode with 9 min interruptions (series S_4C).
The results obtained under laboratory conditions were used to develop the configuration tested under real conditions. In this part of the test, temperature distribution and operating parameters of the uncooled and cooled PV panels were determined.
The summarization of the measurement series carried out under laboratory conditions is included in Table 3.

2.4. Calculations of Temperature Coefficients of Power, Voltage, and Current

The temperature coefficients of power (αPMPP), voltage (αVOC), and current (αISC) were calculated using the following formulas:
α P m a x = P m a x P m a x , r e f T T r e f
α I s c = I s c I s c , r e f T T r e f
α V o c = V o c V o c , r e f T T r e f
where:
  • Pmax—the maximum power generated in the hot PV panel [W],
  • Pmax,ref—the maximum power generated in the cold PV panel (reference value) [W],
  • Isc—the short-circuit current generated in the hot PV panel [A],
  • Isc,ref—the short-circuit current generated in the cold PV panel (reference value) [A],
  • Voc—the open-circuit voltage generated in the hot PV panel [V],
  • Voc,ref—the open-circuit voltage generated in the cold PV panel (reference value) [V],
  • T—the temperature of the hot PV panel [K],
  • Tref—the reference temperature (the initial temperature of the cold PV panel) [K].

2.5. Economic Analysis

Different PV installations and their components can be economically evaluated based on such figures as the Simple Payback Time (SPBT), the Net Present Value (NPV), the Profitability Index (PI), the capital costs (CAPEX), the operation and maintenance costs (OPEX), and the power generation costs (LCOE) [46,47]. The economic analysis presented in this study includes the first three indicators mentioned above. SPBT was calculated based on the following equation [48]:
SPBT = I C E s ,   years
where:
  • IC—initial costs [EUR],
  • ES—energy savings [EUR/year].
Furthermore, NPV was estimated assuming a discount rate (α) of 8% and considering a period of 15 years (corresponding to the period for which a warranty can currently be obtained for PV panels in terms of mechanical damage, inverters, and mounting structures). NPV was calculated based on the following equation [48]:
NPV = t = 1 n C F t ( 1 + α ) t I C ,   EUR
where:
  • CFt—net cash flow during a single period t [EUR/year],
  • α—discount rate [-],
  • t—number of periods [years].
Finally, PI after 15 years was determined using discount rates (α) of 8% [48]:
PI = t = 1 n C F t ( 1 + α ) t I c .  

3. Results and Discussion

This section presents the main findings resulting from the measurement series conducted (according to the procedure described in Section 2.3, Section 2.4 and Section 2.5).

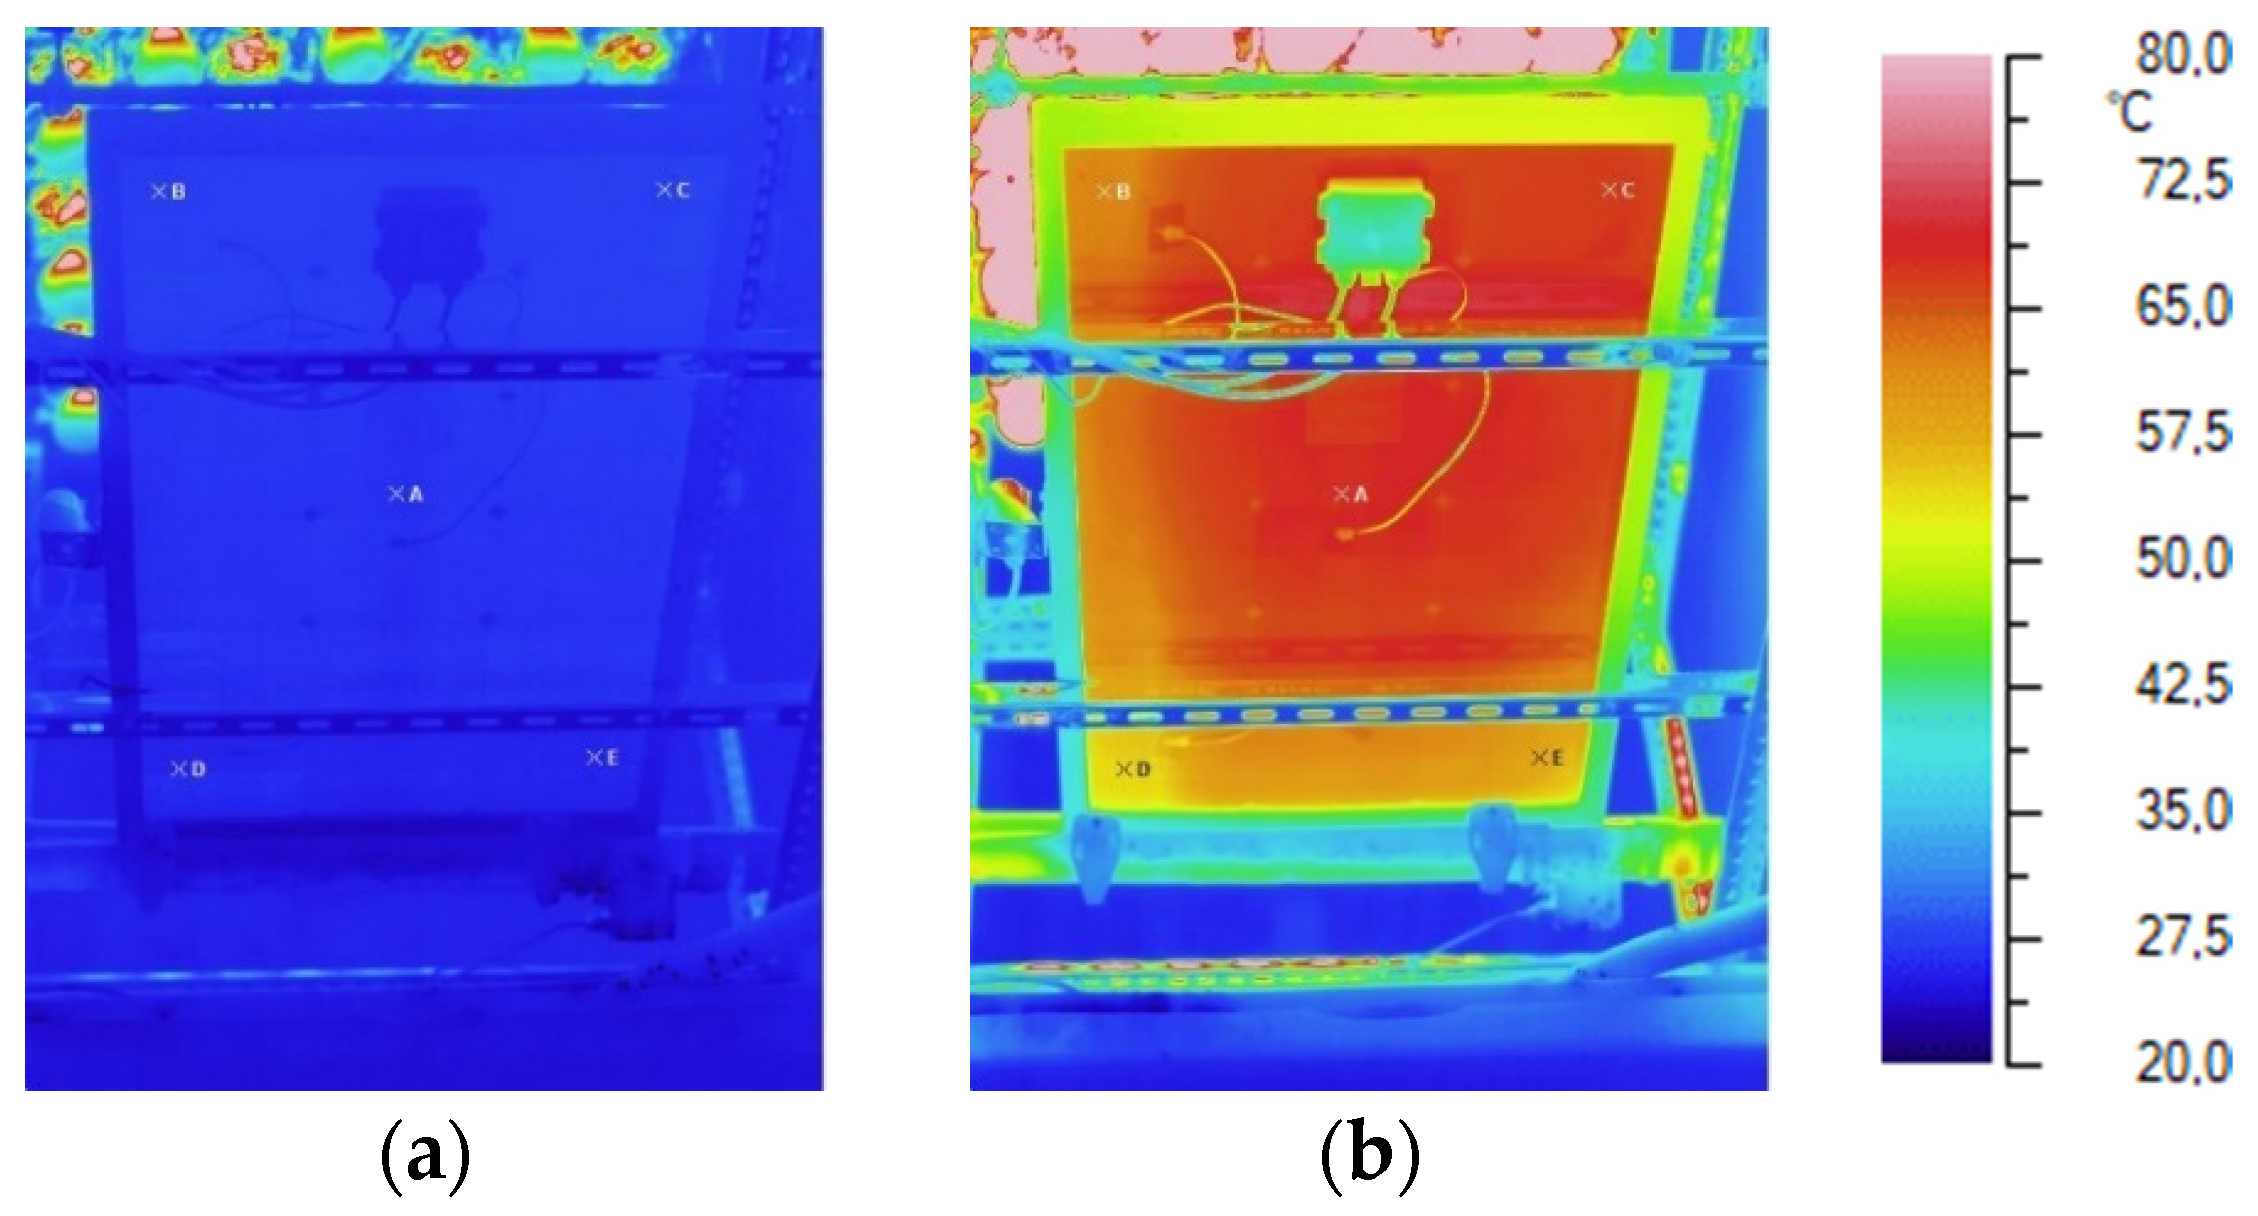
3.1. Assessing the Impact of Temperature on the Performance of the 70 Wp PV Panel

To determine the operating parameters of the tested PV panel under laboratory conditions, series S_1A was conducted when the average temperature of its surface was approx. 26.5 °C (just after the light source was switched on). The next series (series S_1B) was conducted when the tested PV panel was heated to approx. 59.8 °C (the average temperature was determined using three thermocouple sensors mounted on the panel’s rear surface). Furthermore, an infrared camera was used to determine the temperature distribution on the rear surface of the tested PV panel. As shown in Figure 6, the uniformity of temperature distribution is high (no visible fluctuations, hot spots, etc.). However, as a consequence of the temperature increase, the open-circuit voltage generated in the PV panel dropped from 22.62 V (S_1A) to 20.42 V (S_1B), while the short-circuit current increased from 1.60 A to 1.67 A, respectively. This situation results from the way in which temperature affects the silicon. Higher temperatures cause an increased thermal motion of the electrons; consequently, a lower energy threshold for electrons to become mobile charge carriers is observed. Because it takes less energy to create current, the solar panel’s maximum voltage (VOC) decreases as the temperature increases, and the maximum possible current (ISC) increases. Finally, the power generated in the PV panel dropped from 28.99 W to 25.87 W (a decrease of approx. 10.8% was observed). The operating characteristics of the tested PV panel during series S_1A and S_1B are shown in Figure 7, while the main operating parameters are summarized in Table 4. Based on the results obtained, the temperature coefficients of power (PMPP), voltage (VOC), and current (ISC) were determined using Equations (1)–(3). Taking into account the differences in the maximum power generation (i.e., −10.8%), open-circuit voltage generation (i.e., −9.7%), and short-circuit current generation (i.e., +4.4%) in the hot and cold PV panel, the temperature coefficient of power was calculated as −0.32%/°C, the temperature coefficient of voltage as −0.29%/°C, and the temperature coefficient of current as 0.13%/°C, respectively. It can be noted that under laboratory conditions, the power generated in the PV panel was approx. 41% of the maximum power declared by the manufacturer (28.99 W compared to 70 Wp). This situation is connected mainly with the fact that the experimental rig was designed to obtain the appropriate operating temperature, not light irradiation corresponding to STC conditions. Despite the difference in the obtained absolute values of generated power, relative values (in this case, e.g., percentage changes in power related to temperature increase, etc.) can be related to the actual operating conditions of PV panels.

3.2. Assessing the Impact of Soiling on the Performance of the 70 Wp PV Panel

The effect of soiling on the performance of the PV panel was determined during the S_2A–S_2C series. It can be seen that the presence of a small amount of contamination on the surface of the tested panel does not significantly affect its operation—with 15 g of sand, a power loss of only 0.66 W (2.3%) was observed. Contamination at this level could be caused by dust or bird droppings. In the case of more severe contamination, such as leaves or larger amounts of dust, the drop in performance can be more pronounced, reaching values of several percent. In the S_2C series, when the PV panel was covered with a layer of 50 g of sand, the observed power loss was 4.13 W (14.3%). The obtained values were partially affected by the irregular distribution of contamination on the PV panel surface. It should be noted, that the way of soiling distribution can significantly impact the operation of the PV panels. In the most unfavorable scenario, a complete shutdown of the solar cell line can put the entire PV panel out of operation. In this context, the configuration of the bypass diodes plays an important role in providing reliable operation of PV panels in various conditions. However, the introduction of a cleaning system can effectively solve the problem of the presence of contaminants. The operating characteristics of the tested PV panel during series S_2A–S_2C (with reference to series S_1A) are shown in Figure 8, while the main operating parameters are summarized in Table 5.

3.3. Assessing the Impact of Water Flow on the Performance of the 70 Wp PV Panel

To avoid overheating the PV panel during its operation in sunny conditions and the negative impact of contamination, the direct water cooling and cleaning system prototype was introduced to the experimental rig. In the frame of series 2, various levels of water flow were considered. During series 3A, the water flow was set to 2.0 L/min, while during series 2B, it was 3.0 L/min, and during series 3C, it was 4.0 L/min. As can be observed in Figure 9, the proposed configuration of the introduced system provided almost uniform temperature distribution on the panel’s surface in each of the conducted series. The average value of the panel’s temperature ranged from 31.5 to 38.4 °C, depending on the water flow. Consequently, the performance of the cooled PV panel was close to the performance of the cold unit (series S_1A) and higher by 9.63–11.25% compared to the performance of the heated unit (series S_1B). The maximum power obtained in series 3A was 28.36 W, in series 3B, it was 28.56 W, and in series 3C, it was 28.78 W. The operational characteristics of the tested PV panel during series 3A–3C (with reference to series S_1B) are shown in Figure 10, while the main operating parameters are summarized in Table 6.

3.4. Assessing the Amount of Heat Received from the Cooled 70 Wp PV Panel

The proposed direct water cooling and cleaning system increases the electrical performance of PV panels. It allows the heat from the panels’ surfaces to be used to preheat the hot water (or for other purposes). Analyzing the first five minutes of the cooling process, it may be noted that the maximum increase in the cooling water temperature reached 15 K (this value was observed in minute 1). However, four minutes after switching on the pump, the increase in the cooling water temperature stabilized at a significantly lower level (below 3 K). Because in practical applications, the water pump can operate in continuous mode (cooling all modules simultaneously) or sequential mode (cooling different modules alternately), the presented analyses consider both scenarios. As observed during the series 4A–4C, the average temperature increase of the cooling water flowing through the surface of the PV panel in the first minute of the cooling process ranged from 7.5 to 8.4 K (green area in Figure 11). In contrast, in the fifth minute of the process, it ranged from 1.6 to 1.8 K (blue area in Figure 11). Consequently, the average values of thermal power received by the cooling water from the PV panel’s surface ranged from 1461.8 to 1727.2 W (minute 1) and from 307.3 to 342.2 W (minute 5). In practical conditions, if a sequential cooling system for PV panels is used, the thermal power received from the PV panel’s surface can be similar to the values observed at the beginning of the cooling process. Furthermore, relating the discussed values to the area of 1 m2, the thermal power received by the cooling water can be determined at the level of 676.1–946.7 W/m2 (in minute 5) and 3564.5–4380.0 W/m2 (in minute 1). These values refer to the summer period when the temperature of PV panels’ surface can heat up to approx. 60 °C.

3.5. Assessing the Impact of Interval Operation of the Cooling System on the Performance of the 70 Wp PV Panel

The water pump operation in the proposed direct water cooling and cleaning system partially reduces the amount of electricity generated by PV panels. One of the available possibilities to minimize self-consumption is to use the interval mode of the water pump operation. Depending on the current needs, the pump can be turned on for a specific time (e.g., 60 s) with interruptions of several minutes (e.g., 4–5 min). Detailed operation and interruption times should be adjusted to meteorological conditions (sunshine, external air temperature, etc.). Figure 12 shows the variations in PV panel temperature when various operating scenarios of the water pump are considered (represented by series S_4A–S_4C). It may be observed that interval operation of the pump can effectively reduce the PV panel temperature (see Table 7).
It can be concluded that it is necessary to apply appropriate time regimes for the cooling system to achieve an acceptable level of reduction in PV panel temperature. In the analyzed case, implementing a scenario with a 1-min cooling mode with 5-min interruptions (series S_4B) allows for the average PV panel temperature to be kept below 40 °C. This value can be considered well-suited from the standpoint of the power generation in the PV panel and power consumption by the cooling water pump. Furthermore, it is possible to divide the photovoltaic field into several parts and sequentially cool each of them. Electro-valves can control the actual water flow in each section (each section can be cooled sequentially). Consequently, the pump with lower power can be installed compared to the situation when all panels are cooled at the same time (lower water flow and pressure are required). This way, an appropriate balance between the desired operating parameters of PV panels and the self-consumption of electricity may be ensured.

3.6. Assessing the Operation Parameters of the 160 Wp PV Panels Under Real Conditions

The proposed configuration of the direct water cooling and cleaning system was implemented into 160 Wp PV panels installed on the external experimental rig. This rig was then used to conduct a series of measurements under real conditions. The length of the supply collector (and, therefore, the number of outlet nozzles) has been modified and adapted to the dimensions of the PV panels. Figure 13a shows that the uncooled PV panels reached a temperature of approx. 55–60 °C at a solar irradiation of approx. 880 W/m2 and air temperature at a level of approx. 29 °C. The temperature of the cooled modules was significantly lower (25–35 °C). It is worth noting that an insufficient water flow—in this case, 6.0 L/min—resulted in an uneven outflow of cooling water and uneven cooling of the PV panel surfaces (see Figure 13b). On the other hand, if the water flow was 8.0 L/min—uniform cooling of the surfaces of all three modules was ensured (see Figure 13c).
In addition, the proposed cooling and cleaning system was tested during selected weeks in May, July, and September 2022. During this part of the test, two PV panels were used: one operated with the water cooling and cleaning system installed, and the second operated without it. Looking at the weekly data, it can be seen that the average power gain of the cooled module was 2.51%, 3.63%, and 7.48% in the considered weeks of May, July, and September, respectively. It should be noted that the above data refers to the specific conditions prevailing at the time of collecting the results. On the other hand, it is worth noting that the hourly increase in power generated by the cooled PV panel was up to several percent at times of maximum insolation. The maximum power increase was observed in July and amounted to 15.3%. The comparison of energy generated in an uncooled PV panel and a cooled PV panel in selected weeks of the year is shown in Table 8.
Summing up the results, it should be noted that in real conditions, with a large number of locally installed PV systems, the value of the grid voltage on sunny days may exceed the limit value, which is 253 V (according to the EN 60038:2011 standard [49]). If the voltage limit is exceeded, the inverter is disconnected from the grid, and the energy produced by the PV panels is not consumed. This situation can be avoided if there is no overproduction of electricity in the PV panels at the site, if the PV system has a high level of self-consumption, and if hybrid inverters with energy storage of sufficient capacity are used.
Another important aspect to consider is the parameters of the cooling water. The best results are obtained by using demineralized water with a slightly acidic pH and free from gaseous, liquid, and solid impurities. In a considered configuration, this requires the implementation of an appropriate treatment system (filtration), since the rainwater to be used is characterized by a high O2, N, and CO2 content and may also contain soot, pollen, industrial dust, micro-organisms, and mineral salts. The parameters of the cooling and cleaning water can also play an important role in the potential corrosion of the mounting racks. The corrosive properties of water depend, among other things, on the concentration of dissolved oxygen and other oxidants, the degree of mineralization (mainly chloride and sulfate concentrations), the pH value, the alkalinity of the water, and the content of Ca and Mg ions (implying water hardness). In general, soft and acidic waters with dissolved oxygen and high concentrations of dissolved substances are aggressive to metals. These issues should, therefore, be analyzed in detail before implementing the developed solution in commercial applications.

3.7. Assessing the Economic Aspects of Installing the Developed Direct Cooling and Cleaning System to the PV Installation

The economic premises connected with introducing a proposed cooling and cleaning system to the PV panels were calculated. The following assumptions have been introduced:
  • the installed power of the PV system would be 5 kWp (ten 500 Wp PV panels) or 10 kWp (twenty 500 Wp PV panels);
  • the investment cost of implementing the cooling and water cleaning system was assumed to be 1400 EUR (for the 5 kWp installation) and 2100 EUR (for the 10 kWp installation);
  • sequential cooling was assumed—the PV installations were divided into sections of two PV panels each. Each section was assumed to be cooled for 60 s at 5-min intervals, so one water pump was assumed for variant A, and two water pumps were assumed for variant B;
  • the energy required by the cooling pump, cooler, and controller would be covered by PV panels;
  • the cost of water can be omitted because it is possible to use rainwater;
  • PV panels would operate in Polish climatic conditions characterized by insolation of 1000–1100 kWh/(m2·year) [50];
  • the electricity price was assumed at EUR 0.2847/kWh (based on the average price in the EU27 area in the second half of 2023) [51];
  • an annual increase in electricity generation yield of 7 and 10% was assumed.
Equations (4)–(6) were used to calculate the SPBT, NPV, and PI ratios, respectively. The results of the analysis carried out are presented in Table 9.
The economic parameters calculated for the criteria adopted can be favorable for the option involving a 10% increase in the capacity of the PV installation. In this case, the installation of the direct water cooling and cleaning system is profitable in the variant with an installed power of 10 kWp (the positive value of the NPV index and value of the PI index greater than 1 was obtained in this case). Moreover, the increasing cost of electricity must be taken into account, which means that in the future, the savings in operating costs resulting from the installation of a direct water cooling and cleaning system may be higher than indicated in the analysis.

4. Conclusions

This paper discusses the development and operational parameters of the direct water cooling and cleaning system dedicated to PV panels. The proposed system involves direct spraying of water onto the panels’ surface using the header above the panels. The system was designed as a closed system, which can be powered by wastewater. Furthermore, it was assumed that the heat collected from the panels’ surfaces could be recovered and used, for example, for preheating domestic water. Summarizing the experimental study carried out, the following conclusions can be drawn:
  • the power generated in the PV panel dropped from 28.99 W to 25.87 W (a decrease of 10.8% was observed) when the panel’s temperature increased from approx. 26.5 to approx. 59.8 °C;
  • the performance of the cooled PV panel was close to the performance of the cold unit and higher by 9.63–11.25% compared to the performance of the heated unit;
  • the average temperature increase of the cooling water flowing through the PV panel surface in the first minute of the cooling process ranged from 7.5 to 8.4 K, while in the fifth minute of the process, it ranged from 1.6 to 1.8 K. Consequently, the average values of thermal power received by the cooling water from the PV panel’s surface ranged from 1461.8 to 1727.2 W (minute 1) and from 307.3 to 342.2 W (minute 5);
  • to limit the amount of electrical energy consumed by the cooling water pump, the direct cooling and cleaning system can operate in an interval mode;
  • cooling for one minute with interruptions of 4–5 min allowed to obtain the average temperature of the tested PV panel at a level lower than 40 °C. In comparison, the temperature of the uncooled panel in the same operating conditions was close to 60 °C;
  • the results of the experimental study conducted under laboratory conditions were confirmed under real conditions. Tests of the PV panels equipped with the prototype of the direct water cooling and cleaning system showed an increase in their efficiency by up to 15.3% compared to uncooled panels, while the average values were measured at a level of 3.63% in May, 7.48% in July, and 2.51% in September, respectively;
  • the calculated simple payback period varied from 6.9 to 13.1 years, depending on the assumed installed power of the PV system and the potential increase in module efficiency. Calculated for a period of 15 years, the net present value was a maximum of 518.4 EUR, while the corresponding profitability index was 1.247;
  • further research will include, in particular, studies of the seasonal performance of PV panels under real operating conditions. In addition, the research will take into account issues related to the parameters of cooling and cleaning water (e.g., its mineralization, pH, and content of gaseous and solid contaminants). The potential corrosive effect of the water on the PV plant’s structural elements will also be considered, as well as the potential growth of algae and other organisms. Moreover, based on the experimental results, mathematical models describing the operating parameters of PV panels equipped with the direct water cooling and cleaning system will be prepared and introduced to the dynamic simulations.

Funding

This study was carried out under Subvention no. 16.16.210.476 from the Faculty of Energy and Fuels, AGH University of Krakow. The research project was partly supported by the program, “Excellence Initiative—Research University” for AGH University. The infrastructure of the Center of Energy AGH was used in the studies conducted.

Data Availability Statement

The original contributions presented in the study are included in the article; further inquiries can be directed to the corresponding author.

Conflicts of Interest

The author declares no conflicts of interest.

References

  1. Alami, A.H. Effects of Evaporative Cooling on Efficiency of Photovoltaic Modules. Energy Convers. Manag. 2014, 77, 668–679. [Google Scholar] [CrossRef]
  2. Manju, S.; Sagar, N. Progressing towards the Development of Sustainable Energy: A Critical Review on the Current Status, Applications, Developmental Barriers and Prospects of Solar Photovoltaic Systems in India. Renew. Sustain. Energy Rev. 2017, 70, 298–313. [Google Scholar] [CrossRef]
  3. Matusz-Kalász, D.; Bodnár, I. Operation Problems of Solar Panel Caused by the Surface Contamination. Energies 2021, 14, 5461. [Google Scholar] [CrossRef]
  4. Su, D.; Jia, Y.; Alva, G.; Liu, L.; Fang, G. Comparative Analyses on Dynamic Performances of Photovoltaic–Thermal Solar Collectors Integrated with Phase Change Materials. Energy Convers. Manag. 2017, 131, 79–89. [Google Scholar] [CrossRef]
  5. Muneeshwaran, M.; Sajjad, U.; Ahmed, T.; Amer, M.; Ali, H.M.; Wang, C.C. Performance Improvement of Photovoltaic Modules via Temperature Homogeneity Improvement. Energy 2020, 203, 117816. [Google Scholar] [CrossRef]
  6. Kozak-Jagieła, E.; Cisek, P.; Ocłoń, P. Cooling Techniques for PV Panels: A Review. Sci. Radices 2023, 2, 47–68. [Google Scholar] [CrossRef]
  7. Mahdavi, A.; Farhadi, M.; Gorji-Bandpy, M.; Mahmoudi, A. A Review of Passive Cooling of Photovoltaic Devices. Clean. Eng. Technol. 2022, 11, 100579. [Google Scholar] [CrossRef]
  8. Pang, W.; Cui, Y.; Zhang, Q.; Wilson, G.J.; Yan, H. A Comparative Analysis on Performances of Flat Plate Photovoltaic/Thermal Collectors in View of Operating Media, Structural Designs, and Climate Conditions. Renew. Sustain. Energy Rev. 2020, 119, 109599. [Google Scholar] [CrossRef]
  9. Gharzi, M.; Arabhosseini, A.; Gholami, Z.; Rahmati, M.H. Progressive Cooling Technologies of Photovoltaic and Concentrated Photovoltaic Modules: A Review of Fundamentals, Thermal Aspects, Nanotechnology Utilization and Enhancing Performance. Sol. Energy 2020, 211, 117–146. [Google Scholar] [CrossRef]
  10. Zhao, B.; Yang, J.; Cao, S.; Lv, C.; Fan, S.; Sun, T.; Chen, N. Design of a Vacuum-Type PV Module Cleaning Robot Based on an Auxiliary Mobile Frame. Sol. Energy 2024, 275, 112634. [Google Scholar] [CrossRef]
  11. Syafiq, A.; Balakrishnan, V.; Ali, M.S.; Dhoble, S.J.; Rahim, N.A.; Omar, A.; Bakar, A.H.A. Application of Transparent Self-Cleaning Coating for Photovoltaic Panel: A Review. Curr. Opin. Chem. Eng. 2022, 36, 100801. [Google Scholar] [CrossRef]
  12. Aljaghoub, A.; Abumadi, F.; AlMallahi, M.N.; Obaideen, K.; Alami, A.H. Solar PV cleaning techniques contribute to Sustainable Development Goals (SDGs) using Multi-criteria decision-making (MCDM): Assessment and review. Int. J. Thermofluids 2022, 16, 100233. [Google Scholar] [CrossRef]
  13. Antonelli, M.G.; Beomonte Zobel, P.; De Marcellis, A.; Palange, E. Autonomous Robot for Cleaning Photovoltaic Panels in Desert Zones. Mechatronics 2020, 68, 102372. [Google Scholar] [CrossRef]
  14. Al-Amri, F.; Saeed, F.; Mujeebu, M.A. Novel Dual-Function Racking Structure for Passive Cooling of Solar PV Panels –Thermal Performance Analysis. Renew. Energy 2022, 198, 100–113. [Google Scholar] [CrossRef]
  15. Hernandez-Perez, J.G.; Carrillo, J.G.; Bassam, A.; Flota-Banuelos, M.; Patino-Lopez, L.D. A New Passive PV Heatsink Design to Reduce Efficiency Losses: A Computational and Experimental Evaluation. Renew. Energy 2020, 147, 1209–1220. [Google Scholar] [CrossRef]
  16. Hamed, M.H.; Hassan, H.; Ookawara, S.; Nada, S.A. PV Thermal Regulation and Water Harvesting Hybrid System Using Evaporative Cooling of Silica Gel Layer. Process Saf. Environ. Prot. 2024, 181, 243–265. [Google Scholar] [CrossRef]
  17. Hussien, A.; Eltayesh, A.; El-Batsh, H.M. Experimental and Numerical Investigation for PV Cooling by Forced Convection. Alex. Eng. J. 2023, 64, 427–440. [Google Scholar] [CrossRef]
  18. Bevilacqua, P.; Bruno, R.; Rollo, A.; Ferraro, V. A Novel Thermal Model for PV Panels with Back Surface Spray Cooling. Energy 2022, 255, 124401. [Google Scholar] [CrossRef]
  19. Kabeel, A.E.; Abdelgaied, M.; Sathyamurthy, R. A Comprehensive Investigation of the Optimization Cooling Technique for Improving the Performance of PV Module with Reflectors under Egyptian Conditions. Sol. Energy 2019, 186, 257–263. [Google Scholar] [CrossRef]
  20. Madurai Elavarasan, R.; Nadarajah, M.; Pugazhendhi, R.; Gangatharan, S. An Experimental Investigation on Coalescing the Potentiality of PCM, Fins and Water to Achieve Sturdy Cooling Effect on PV Panels. Appl. Energy 2024, 356, 122371. [Google Scholar] [CrossRef]
  21. Faheem, M.; Abu Bakr, M.; Ali, M.; Majeed, M.A.; Haider, Z.M.; Khan, M.O. Evaluation of Efficiency Enhancement in Photovoltaic Panels via Integrated Thermoelectric Cooling and Power Generation. Energies 2024, 17, 2590. [Google Scholar] [CrossRef]
  22. Choi, S.M.; Kwon, H.G.; Kim, T.; Moon, H.K.; Cho, H.H. Active Cooling of Photovoltaic (PV) Cell by Acoustic Excitation in Single-Dimpled Internal Channel. Appl. Energy 2022, 309, 118466. [Google Scholar] [CrossRef]
  23. Yildirim, M.A.; Cebula, A.; Sułowicz, M. A Cooling Design for Photovoltaic Panels—Water-Based PV/T System. Energy 2022, 256, 124654. [Google Scholar] [CrossRef]
  24. Wang, J.; Li, Y.; Yang, B.; Jiang, L. Multi-Optimized Reconfiguration of Hybrid Photovoltaic-Thermoelectric Generation (PV-TEG) System for Performance Enhancement. Energy Convers. Manag. 2024, 307, 118373. [Google Scholar] [CrossRef]
  25. Arnaoutakis, G.E.; Busko, D.; Richards, B.S.; Ivaturi, A.; Gordon, J.M.; Katz, E.A. Ultra-Broadband near-Infrared Upconversion for Solar Energy Harvesting. Sol. Energy Mater. Sol. Cells 2024, 269, 112783. [Google Scholar] [CrossRef]
  26. Papis-Frączek, K.; Żołądek, M.; Filipowicz, M. The Possibilities of Upgrading an Existing Concentrating Solar Thermal System —Case Study. Energy Rep. 2021, 7, 28–32. [Google Scholar] [CrossRef]
  27. Sornek, K.; Żołądek, M.; Papis-Frączek, K.; Szram, M.; Filipowicz, M. Experimental Investigations of the Microscale Concentrated Photovoltaic/Thermal System Based on a Solar Parabolic Trough Concentrator. Energy Rep. 2023, 9, 86–97. [Google Scholar] [CrossRef]
  28. Sornek, K.; Filipowicz, M.; Jasek, J. The Use of Fresnel Lenses to Improve the Efficiency of Photovoltaic Modules for Building-Integrated Concentrating Photovoltaic Systems. J. Sustain. Dev. Energy Water Environ. Syst. 2018, 6, 415–426. [Google Scholar] [CrossRef]
  29. Micheli, L.; Senthilarasu, S.; Reddy, K.S.; Mallick, T.K. Applicability of Silicon Micro-Finned Heat Sinks for 500× Concentrating Photovoltaics Systems. J. Mater. Sci. 2015, 50, 5378–5388. [Google Scholar] [CrossRef]
  30. Du, B.; Hu, E.; Kolhe, M. Performance Analysis of Water Cooled Concentrated Photovoltaic (CPV) System. Renew. Sustain. Energy Rev. 2012, 16, 6732–6736. [Google Scholar] [CrossRef]
  31. Zorrilla-Casanova, J.; Piliougine, M.; Carretero, J.; Bernaola, P.; Carpena, P.; Mora-Lopez, L.; Sidrach-de-Cardona, M. Analysis of Dust Losses in Photovoltaic Modules. In Proceedings of the World Renewable Energy Congress—Sweden, Linköping, Sweden, 8–13 May 2011; Volume 57, pp. 2985–2992. [Google Scholar] [CrossRef]
  32. Tripanagnostopoulos, Y. Aspects and Improvements of Hybrid Photovoltaic/Thermal Solar Energy Systems. Sol. Energy 2007, 81, 1117–1131. [Google Scholar] [CrossRef]
  33. Aste, N.; Del Pero, C.; Leonforte, F.; Manfren, M. Performance Monitoring and Modeling of an Uncovered Photovoltaic-Thermal (PVT) Water Collector. Sol. Energy 2016, 135, 551–568. [Google Scholar] [CrossRef]
  34. Shyam; Tiwari, G.N.; Al-Helal, I.M. Analytical Expression of Temperature Dependent Electrical Efficiency of N-PVT Water Collectors Connected in Series. Sol. Energy 2015, 114, 61–76. [Google Scholar] [CrossRef]
  35. Moharram, K.A.; Abd-Elhady, M.S.; Kandil, H.A.; El-Sherif, H. Influence of Cleaning Using Water and Surfactants on the Performance of Photovoltaic Panels. Energy Convers. Manag. 2013, 68, 266–272. [Google Scholar] [CrossRef]
  36. Dahlioui, D.; Traore, L.; Laarabi, B.; Barhdadi, A. Ecological Cleaning of PV Panels by Exploitation of Dew Water in Morocco. Mater. Today Proc. 2022, 66, 130–134. [Google Scholar] [CrossRef]
  37. Zhao, W.; Lv, Y.; Dong, Z.; Zhao, F.; Lv, F.; Yan, W. Effect of Self-Cleaning Superhydrophobic Coating on Dust Deposition and Performance of PV Modules. Renew. Energy 2024, 227, 120576. [Google Scholar] [CrossRef]
  38. Singh, U.P.; Chandra, S. Optimal Cleaning Schedule in Solar PV Using the Biography-Based Helianthus Optimization Enabled Coupled Deep Network. Sol. Energy 2023, 266, 112138. [Google Scholar] [CrossRef]
  39. Zhang, C.; Ma, Y.; Mi, Z.; Yang, F.; Zhang, L. A Rolling-Horizon Cleaning Recommendation System for Dust Removal of Industrial PV Panels. Appl. Energy 2024, 353, 122168. [Google Scholar] [CrossRef]
  40. You, S.; Lim, Y.J.; Dai, Y.; Wang, C.H. On the Temporal Modelling of Solar Photovoltaic Soiling: Energy and Economic Impacts in Seven Cities. Appl. Energy 2018, 228, 1136–1146. [Google Scholar] [CrossRef]
  41. Rodrigo, P.M.; Gutiérrez, S.; Micheli, L.; Fernández, E.F.; Almonacid, F.M. Optimum Cleaning Schedule of Photovoltaic Systems Based on Levelised Cost of Energy and Case Study in Central Mexico. Sol. Energy 2020, 209, 11–20. [Google Scholar] [CrossRef]
  42. Sornek, K.; Goryl, W.; Głowacka, A. Improving the Performance of Photovoltaic Panels Using a Direct Water Cooling System. J. Sustain. Dev. Energy Water Environ. Syst. 2023, 11, 1–24. [Google Scholar] [CrossRef]
  43. Sornek, K.; Goryl, W.; Figaj, R.; Dąbrowska, G.D.; Brezdeń, J. Development and Tests of the Water Cooling System Dedicated to Photovoltaic Panels. Energies 2022, 15, 5884. [Google Scholar] [CrossRef]
  44. Available online: https://imgw.pl/wydarzenia/charakterystyka-wybranych-elementow-klimatu-w-polsce-w-2022-roku-podsumowanie (accessed on 21 August 2023).
  45. Available online: https://re.jrc.ec.europa.eu/pvg_tools/en/ (accessed on 20 August 2024).
  46. Micheli, L.; Fernández, E.F.; Aguilera, J.T.; Almonacid, F. Economics of Seasonal Photovoltaic Soiling and Cleaning Optimization Scenarios. Energy 2021, 215, 119018. [Google Scholar] [CrossRef]
  47. Tina, G.M.; Bontempo Scavo, F.; Micheli, L.; Rosa-Clot, M. Economic Comparison of Floating Photovoltaic Systems with Tracking Systems and Active Cooling in a Mediterranean Water Basin. Energy Sustain. Dev. 2023, 76, 101283. [Google Scholar] [CrossRef]
  48. Szafranko, E. Assessment of the Economic Efficiency of Energy-Saving Projects, Methodology Based on Simple and Compound Methods. Energy Sci. Eng. 2022, 10, 423–438. [Google Scholar] [CrossRef]
  49. EN 60038; CENELEC Standard Voltages. European Committee for Standards-Electrical: Brussels, Belgium, 2011.
  50. Olczak, P.; Komorowska, A. An Adjustable Mounting Rack or an Additional PV Panel? Cost and Environmental Analysis of a Photovoltaic Installation on a Household: A Case Study in Poland. Sustain. Energy Technol. Assess. 2021, 47, 101496. [Google Scholar] [CrossRef]
  51. Electricity Price Statistics—Statistics Explained. Available online: https://ec.europa.eu/eurostat/statistics-explained/index.php?title=Electricity_price_statistics#Electricity_prices_for_household_consumers (accessed on 27 July 2024).
Figure 1. The general scheme of the developed system.
Energies 17 04392 g001
Figure 2. General scheme (a) and real view of the internal experimental rig (b): 1—light source, 2—PV panel, 3—water tank, 4—header, 5—water collector, 6—pump, 7—filter, 8—pyranometer, 9—water flowmeter, 10–15—temperature sensors (measuring the temperature of PV panel, cooling water, and surrounding air), 16—electronic load, 17—control cabinet, 18—PC with CoDeSys software, 19—IR camera.
Energies 17 04392 g002
Figure 3. The view of the PV panels and the part of the direct water cooling systems mounted in the external experimental rig.
Energies 17 04392 g003
Figure 4. The view of a PV panel covered with sand.
Energies 17 04392 g004
Figure 5. The configuration of the header.
Energies 17 04392 g005
Figure 6. Temperature distribution on the rear surface of the tested PV panel during series 1A (a) and 1B (b).
Energies 17 04392 g006
Figure 7. The current-voltage (a) and power–voltage (b) characteristics of the tested PV panel during series S_1A and S_1B.
Energies 17 04392 g007
Figure 8. The impact of contamination on the operation parameters of the tested PV panel: current-voltage characteristic (a), power–voltage characteristic (b).
Energies 17 04392 g008
Figure 9. Temperature distribution on the surface of the tested PV panel during series 2A (a), series 2B (b), and series 2C (c).
Energies 17 04392 g009
Figure 10. The impact of the cooling water flow on the operation parameters of the tested PV panel: current-voltage characteristic (a), power–voltage characteristic (b).
Energies 17 04392 g010
Figure 11. Increase in cooling water temperature in the first five minutes of the cooling process.
Energies 17 04392 g011
Figure 12. The impact of interval operation of the cooling and cleaning system on the PV panel temperature.
Energies 17 04392 g012
Figure 13. Temperature distribution on the PV panels surface: uncooled PV panel (a), cooled PV panel with flow rate 6 L/min (b), and cooled PV panel with flow rate 8 L/min (c).
Energies 17 04392 g013
Table 1. The main components of the control and measurement system used in the internal experimental rig.
PositionAdditional Information
Photovoltaic panelThe unit 4SUN 70 W Maxx
Artificial light sourceA set of 25 bulbs
Direct water cooling and cleaning systemThe prototype composed of the header, water collector, water tank, and water pump
Programable logic controllerThe modular unit WAGO PFC200 with a set of input and output modules
PC with CoDeSys softwareCoDeSys in version 2.9
Electronic artificial loadThe unit Array 3721A with measuring range from 0 to 400 W for power and accuracy 0.1% +600 mW
PyranometerThe unit UICPAL PYR20 with a measuring range from 0 to 2000 W/m2 and an accuracy of 5%
Pt100 sensorsResistance sensors Termo-Precyzja T-101 with a measuring range from −50 °C to 400 °C and tolerance ±0.3 +0.005 × [t]
PTTK sensorsThermocouple sensors UNI-T UT-T10K with a measuring range from −40 °C to 260 °C and tolerance ±2.0 °C or ±0.0075 × [t]
Infrared cameraThe unit NEC ThermoTracer H2640 with measuring range from −40 to 120 °C, and accuracy ±2 °C or ±2% of reading
Water flowmeterThe unit Apator Powogaz JS 4-NK 1 L/IMP
Table 2. The main components of the control and measurement system used in the external experimental rig.
PositionAdditional Information
Photovoltaic panelsThe units 3P 160 W
Direct water cooling systemThe preliminary unit composed of the header, water collector, water tank, and water pump
Solar charge controllerThe unit Array 3721A with measuring range from 0 to 400 W for power and accuracy 0.1% +600 mW
BatteriesA set of units Volt Polska AGM VRLA 12 V 20 Ah
Programable logic controllerThe modular unit WAGO PFC200 with a set of input and output modules
PC with CoDeSys softwareCoDeSys in version 2.9
PyranometerThe unit UICPAL PYR20 with a measuring range from 0 to 2000 W/m2 and an accuracy of 5%
Pt100 sensorsResistance sensors Termo-Precyzja T-101 with a measuring range from −50 °C to 400 °C and tolerance ±0.3 + 0.005 × [t]
Infrared cameraThe unit NEC ThermoTracer H2640 with measuring range from −40 to 120 °C, and accuracy ±2 °C or ±2% of reading
Water flowmeterThe unit Apator Powogaz JS 4-NK 1 L/IMP
Table 3. The summarization of the measurement series carried out under laboratory conditions.
ConfigurationSeriesOperating Scenario
PV panel without an installed cooling systemS_1ACold PV panel characterized by an average surface temperature of approx. 26.5 °C
S_1BHeated PV panel characterized by an average surface temperature of approx. 59.8 °C
PV panel covered by the sandS_2ACold PV panel covered with approx. 15 g sand
S_2BCold PV panel covered with approx. 30 g sand
S_2CCold PV panel covered with approx. 30 g sand
PV panel with installed cooling systemS_3AThe PV panel cooled continuously when the water flow was set to 2.0 L/min
S_3BThe PV panel cooled continuously when the water flow was set to 3.0 L/min
S_3CThe PV panel cooled continuously when the water flow was set to 4.0 L/min
S_4APV panel cooled intermittently (a 2 min cooling mode with 5-min interruptions)
S_4BPV panel cooled intermittently (a 1 min cooling mode with 5-min interruptions)
S_4CPV panel cooled intermittently (a 1 min cooling mode with 9-min interruptions)
Table 4. The main operating parameters of the tested PV panel determined during the series S_1A and S_1B.
ParameterUnitSeries S_1ASeries S_1B
The average temperature of the PV panel surface, tPV°C26.559.8
The open circuit voltage, VOCV22.6220.42
The short circuit current, ISCA1.601.67
The maximum power, PMPPW28.9925.87
Matched voltage, VMPPV20.1317.36
Matched current, IMPPA1.441.49
Table 5. The main operating parameters of the tested PV panel determined during the series S_2A–S_2C.
ParameterUnitSeries S_2ASeries S_2BSeries S_2C
The open circuit voltage, VOCV22.6022.5222.37
The short circuit current, ISCA1.581.521.39
The maximum power, PMPPW28.3327.4124.86
Matched voltage, VMPPV20.0920.0119.89
Matched current, IMPPA1.411.371.25
Power loss due to the presence of contamination, ΔPMPP%2.285.5514.25
Table 6. The main operating parameters of the tested PV panel determined during the series S_3A–S_3C.
ParameterUnitSeries S_3ASeries S_3BSeries S_3C
The open circuit voltage, VOCV22.8022.5422.61
The short circuit current, ISCA1.581.621.62
The maximum power, PMPPW28.3628.5628.78
Matched voltage, VMPPV19.9719.5619.71
Matched current, IMPPA1.421.461.46
PV panel performance
improvement, ΔPMPP
%9.6310.4011.25
Table 7. The PV panel’s minimum, maximum, and average temperature when different operation scenarios were tested.
SeriesScenario
Description
The Minimum Temperature of the PV Panel, °CThe Maximum Temperature of the PV Panel, °CThe Average Temperature of the PV Panel, °C
S_4A2-min cooling mode with 5-min interruptions29.943.537.2
S_4B1-min cooling mode with 5-min interruptions33.245.139.5
S_4C1-min cooling mode with 9-min interruptions35.550.142.6
Table 8. The comparison of energy generated in an uncooled PV panel and cooled PV panel in selected weeks of the year.
CaseMonthEnergy Generated
in PV Panel, W
The Increase in Energy Generation, %
Uncooled
PV Panel
Cooled
PV Panel
AMay 20227169.67430.33.63
BJuly 202213,370.614,370.07.48
CSeptember 20224553.34667.92.51
Table 9. The comparison of electrical parameters of the tested PV panel depending on the configuration of the direct cooling and cleaning system.
Parameter5.0 kWp PV System10 kWp PV System
The estimated investment costs, EUR1400.02100.0
Estimated annual electricity production (without cooling and water cleaning
system), kWh/a
5373.210,746.3
The estimated annual increase in generated energy, %7.010.07.010.0
Estimated annual electricity production (with cooling and water cleaning
system), kWh/a
5749.35910.511,498.511,820.9
Estimated increase in electricity generated, kWh/a376.1537.3752.21074.6
The estimated economic benefits, EUR/a107.1153.0214.2305.9
SPBT, years13.19.29.86.9
NPV (15 years, α = 8%), EUR−483.3−90.4−266.6518.4
PI (15 years, α = 8%), EUR0.6550.9350.8731.247
Disclaimer/Publisher’s Note: The statements, opinions and data contained in all publications are solely those of the individual author(s) and contributor(s) and not of MDPI and/or the editor(s). MDPI and/or the editor(s) disclaim responsibility for any injury to people or property resulting from any ideas, methods, instructions or products referred to in the content.

