1. Introduction
With the advent of smart appliances, there has been a growing interest in replacing conventional automation with intelligent action recommendations for smart homes [
1]. Accurate action recommendations can enhance the convenience of daily life, such as automatically turning on the dining area lights during meals, closing curtains at night, or turning on the TV/music based on residential habits, especially for the elderly or patients with mobility difficulties [
2]. Since action recommendations are closely related to human activities, the interpretability of the algorithm is important [
3]. However, to our knowledge, no paper currently focuses on interpretable models particularly designed for household appliance action recommendations, which is the aim of this paper.
While making recommendations, with the participation of a flexible load, the household appliances’ demand response can improve power grid efficiency [
4]. Many household appliances, such as fans, washing machines, and ovens, can be considered flexible loads with different power levels, and less energy consumption may lead to discomfort [
5]. In this paper, the demand response means that residents (exchangeable with consumers) can balance comfort and energy consumption by setting the appropriate power level for each appliance, thus improving energy efficiency. Optimizing action recommendations to achieve demand response is another aim of this paper.
Research on household appliance action recommendations is limited and still in the early stages as of September 2024, as summarized in the literature review below.
In 2014, Rasch, Katharina et al. proposed a smart home recommendation system that continuously interpreted the user’s current situation and recommended services that aligned with the user’s habits. However, due to the limitations of the algorithms at that time, the accuracy was only about 60% [
6]. In 2016, Chen et al. proposed a hybrid recommender system based on the Kalman Filter to predict the actions that users wanted to perform next in a smart home environment [
7]. However, the recommendation accuracy was a major concern. In 2016, Belghini, Naouar et al. proposed a smart home recommendation system that offered personalized services using contextual information and physical sensor data; however, this paper only focused on the theoretical framework [
8]. In 2021, Reyes-Campos et al. proposed a method for discovering resident behavior patterns using machine learning techniques and the Internet of Things [
9]. In 2022, Jeon et al. proposed a precise action recommendation method for smart homes [
10], which summarized the device control and temporal context of each action through a self-attention mechanism and extracted patterns related to the query from the sequence using an attention mechanism. Although the recommendation accuracy was good, both [
9,
10] did not consider energy optimization as well as the interpretability of their algorithms. In 2022, Varlamis et al. proposed a recommendation system that integrated sensor data, user habits, and user feedback to provide timely, personalized energy-saving suggestions [
11]. This paper applied only to specific scenarios, such as predicting unnecessary lighting and air conditioning use or whether a room was occupied, which limited its applicability. In 2023, Yao et al. developed a recommendation system using GraphSAGE [
12]. This system created a unique graph for each user based on the specific rules they employed in their smart devices. The system employed a federated training algorithm to ensure user data privacy. Both our approach and [
12] utilized graph-based recommendation algorithms. The difference was that our recommended actions were triggered by electricity usage, leading to demand response-driven optimization. Additionally, our algorithm was based on a knowledge graph incorporating information from the edges, but this was not considered in [
12]. In 2023, Ali et al. presented a method for an adaptive smart home system aimed at developing personalized automation systems that provide smart home services to users [
13]. Similarly, this work did not consider the interpretability of the algorithm and further energy optimization. In 2024, Tahar et al. proposed a dynamic, context-aware recommender system for smart homes [
14] but did not consider the interpretability of the recommendation system.
While the aforementioned recent studies focused on energy optimization to enhance the accuracy of recommendations, none have simultaneously considered both energy optimization and model interpretability during the recommendation process. Our research seeks to address this research gap, primarily focusing on the following aspects:
How to incorporate information to accurately recommend the next action of household appliances?
How to generate the interpretation for the recommended results of household appliance actions?
How to optimize energy consumption and comfort levels by setting the appropriate power for each household appliance?
In response to these questions, this paper establishes a framework ‘DARK’, representing Device Action Recommendations with Knowledge graph that accurately recommends and optimizes the appliances’ next action with interpretive methods considering demand response optimization. Please note that ‘DARK’ is an acronym derived from the initials of ‘Device’, ‘Action’, ‘Recommendations’, and ‘Knowledge’, and it does not have any actual academic meaning. The main contributions of this paper are as follows:
We propose a modified KGAT algorithm by enhancing its sampling and aggregation. This algorithm predicts the next likely actions of appliances using a knowledge graph. We conducted comparative experiments with the traditional KGAT, DNN, CNN, and RNN algorithms, observing that our method demonstrates superior performance.
An interpretation method for the recommended results is proposed. This method utilizes embeddings for reasoning and analyzes the rationale behind each recommendation, enhancing the trustworthiness of our recommendation system.
Demand response optimization is carried out based on the expected recommended actions, taking into account the energy consumption and comfort level of consumers. This approach improves energy efficiency by effectively balancing energy consumption with comfort.
The remaining structure of this paper is as follows:
Section 2 presents the system architecture,
Section 3 introduces the proposed algorithm and method,
Section 4 presents the simulation and results of the system, and
Section 5 provides the conclusion.
2. System Composition
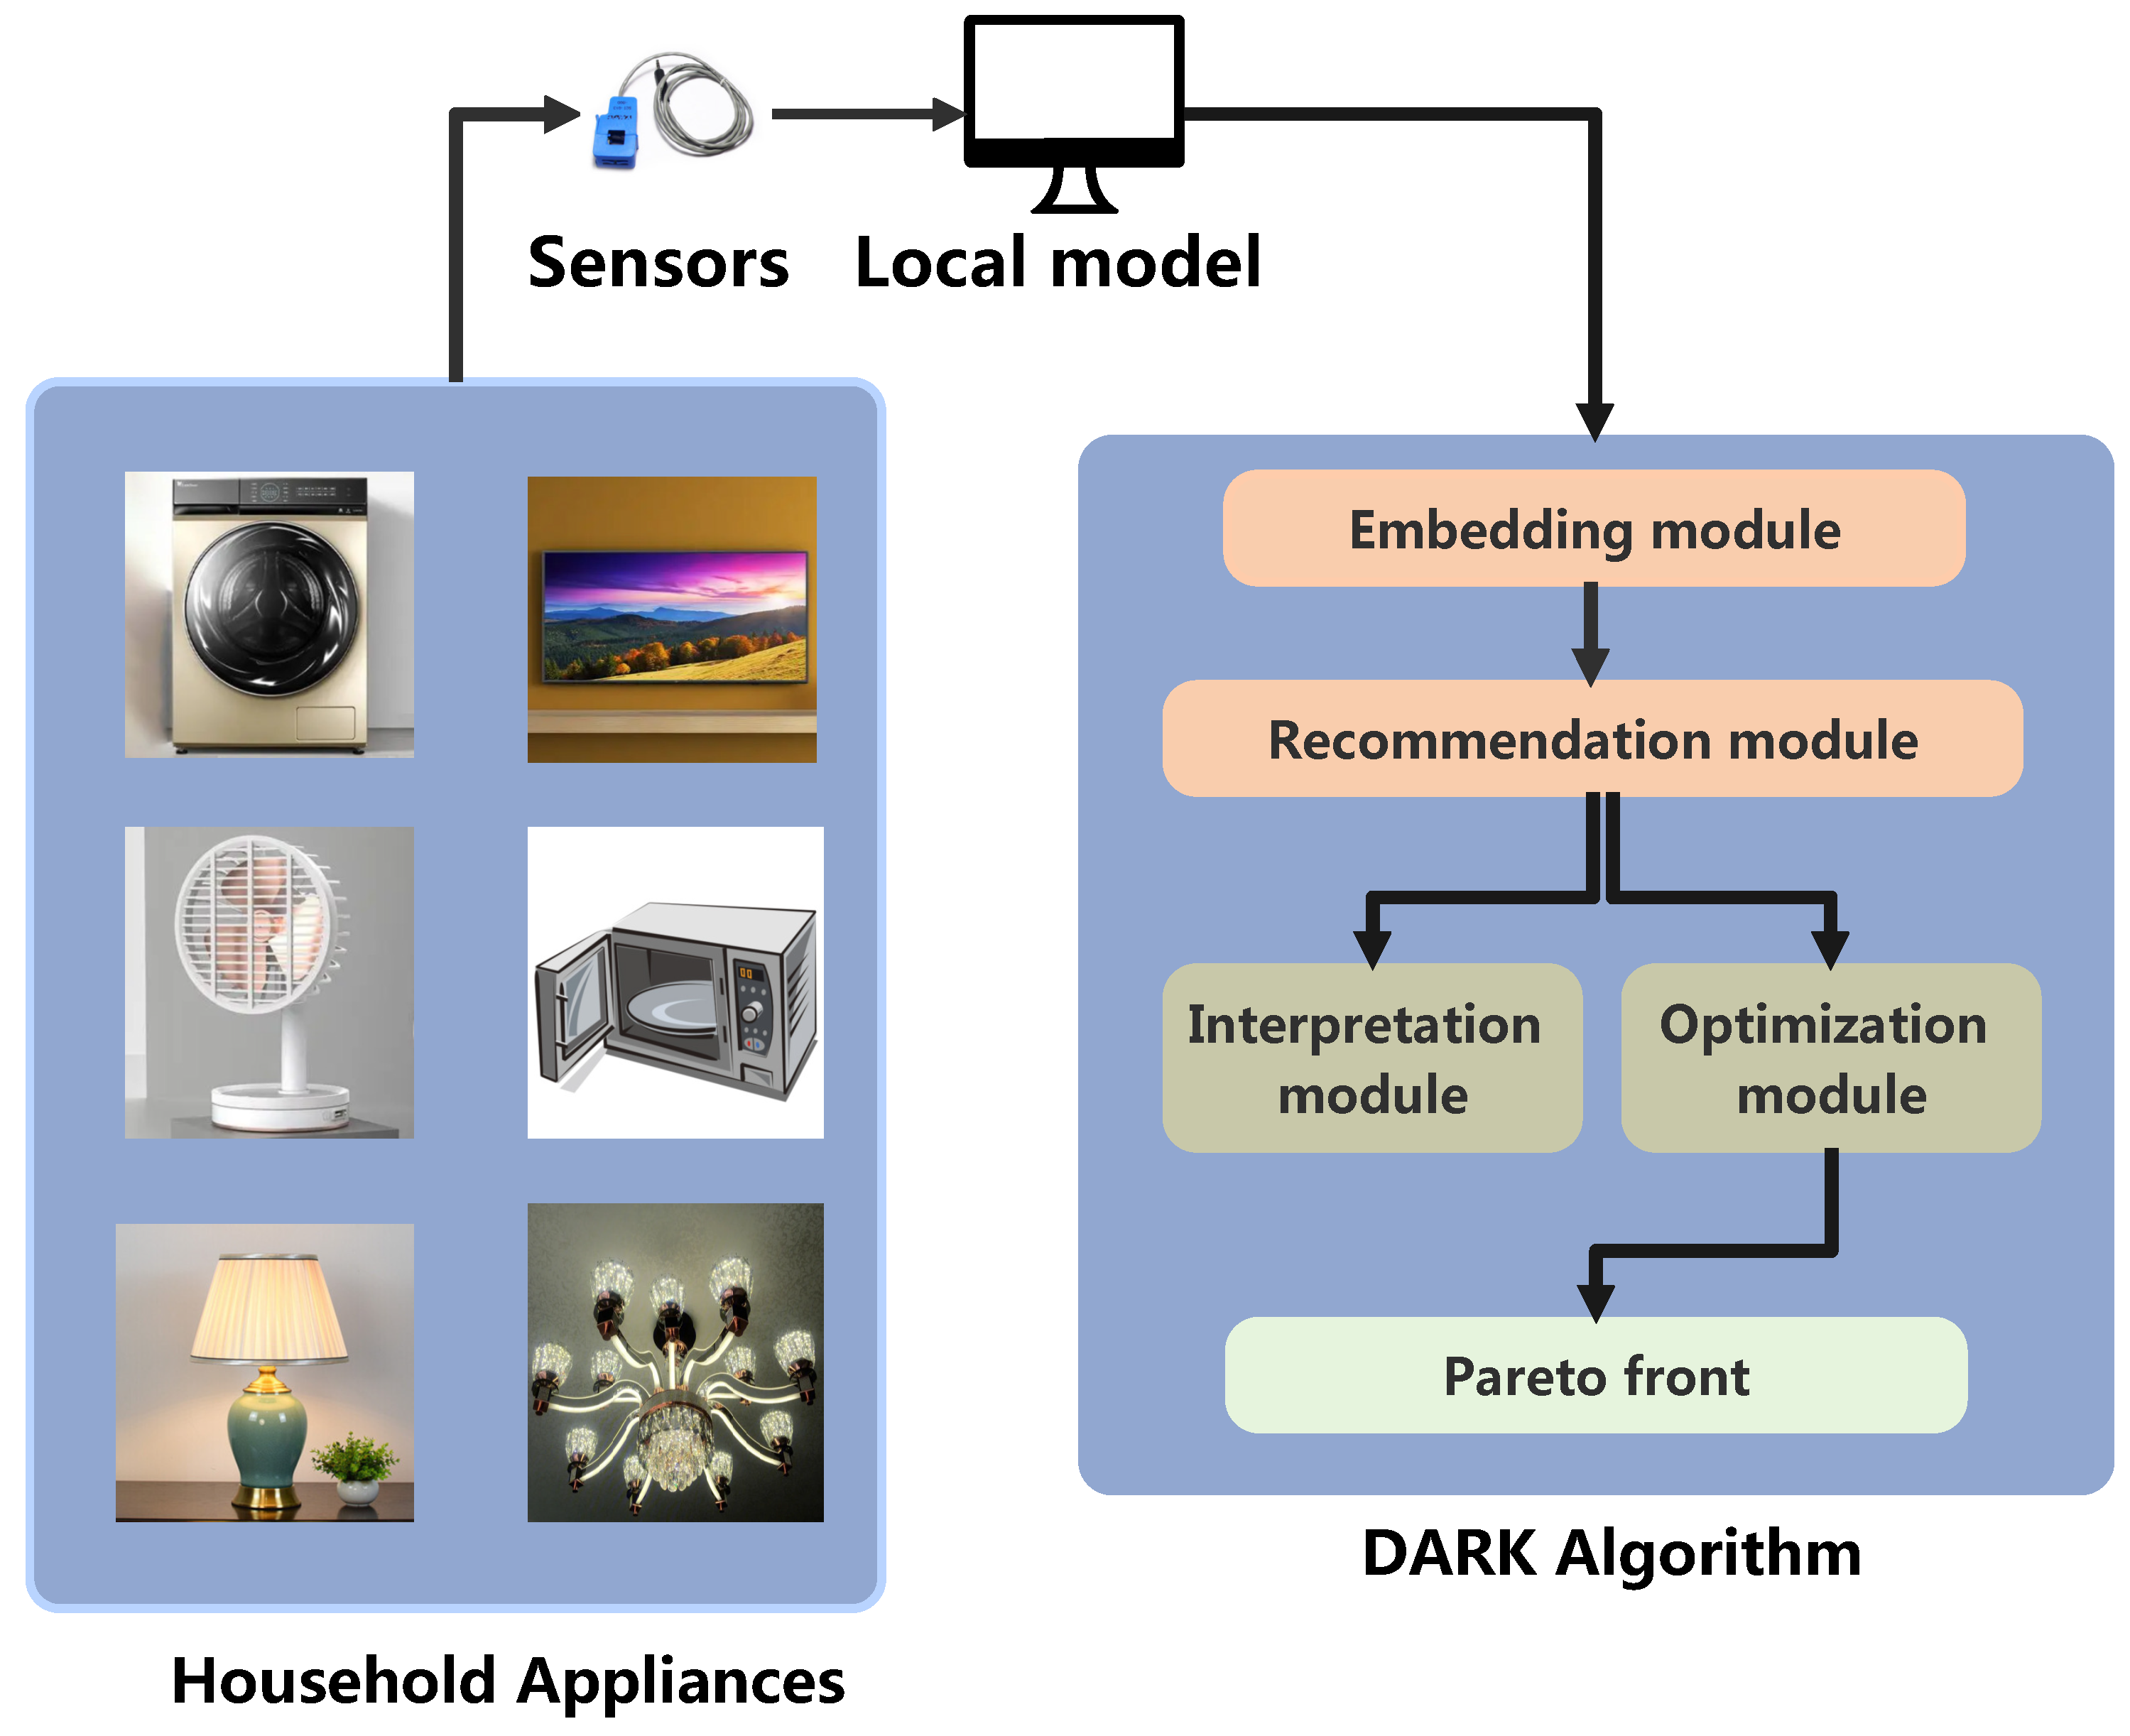
The overall architecture of DARK is built upon a household appliance system, as represented in
Figure 1. The system comprises appliances, sensors, a small-scale database, and a home energy management system. Each appliance possesses the following attributes:
Rated power: Each appliance has its rated power. For example, a toaster has a rated power of 1500 W.
Appliance location: Appliances are distributed across different rooms, including the kitchen, living room, office, bedroom, utility room, children’s room, and undefined locations.
Comfort impact: Each appliance has a different impact on comfort.
Habitual usage time: Each appliance has specific habitual usage times. For example, gas stoves are mostly used during mealtime, while lights are frequently used at night.
Habitual usage sequence: Some appliances have a habitual usage sequence. For instance, the most commonly used appliance following a hair dryer might be a hair straightener.
All the appliances are connected to the home’s local area network, and sensors monitor them to collect energy consumption data. The data are sent to the local database for processing and transformed into embeddings. The data in the database are then used by the home energy management system to create recommendations. The recommended results are sent to the interpretation module to generate interpretations and to the optimization module to generate optimization results, considering both comfort level and energy consumption, assisting consumers in decision-making.
Privacy protection is also essential. User data is considered private and should not be disclosed to third parties. To ensure user privacy, the database data is not shared externally. Instead, federated learning can be employed, only uploading the local model to the server. Federated learning ensures that the data remains only locally stored [
15]; however, this is not the focus of this paper. This paper considers only standalone action recommendation systems without sharing any data, so there are no privacy leakage concerns.
3. Proposed Algorithm
This section introduces the proposed methods for graph building and the algorithms used in DARK’s embedding, recommendation, interpretation, and optimization module.
3.1. Method for Building Knowledge Graph
It is assumed that each appliance has an associated sub-meter, so individual electricity usage data for each appliance can be obtained. If this is not achievable and only a main smart meter exists, non-intrusive load monitoring can be used for power disaggregation to obtain individual appliance electricity data. Then, the next step would be data processing for DARK, involving the following sequence of steps: format conversion, noise filtering, device selection, graph construction from conventional datasets, incorporating other attributes, and finally, negative sampling.
3.1.1. Format Conversion and Noise Filtering
First, the format should be transformed. The system needs to recognize and transform the timestamps into the year-month-day format and aggregate the data into certain intervals. The data may contain a large amount of noise, so filters are implemented to determine the on/off states of appliances as well as filter out momentarily switched-on appliances and electricity leakage. Due to the unique characteristics of each type of electrical appliance, the filtering thresholds for each type of appliance need to be customized according to the rated power. The thresholds (rated power) are shown in
Table 1. The column ‘Comfort Level’ will be introduced later in the
Section 4.4.
3.1.2. Domestic Devices Selection
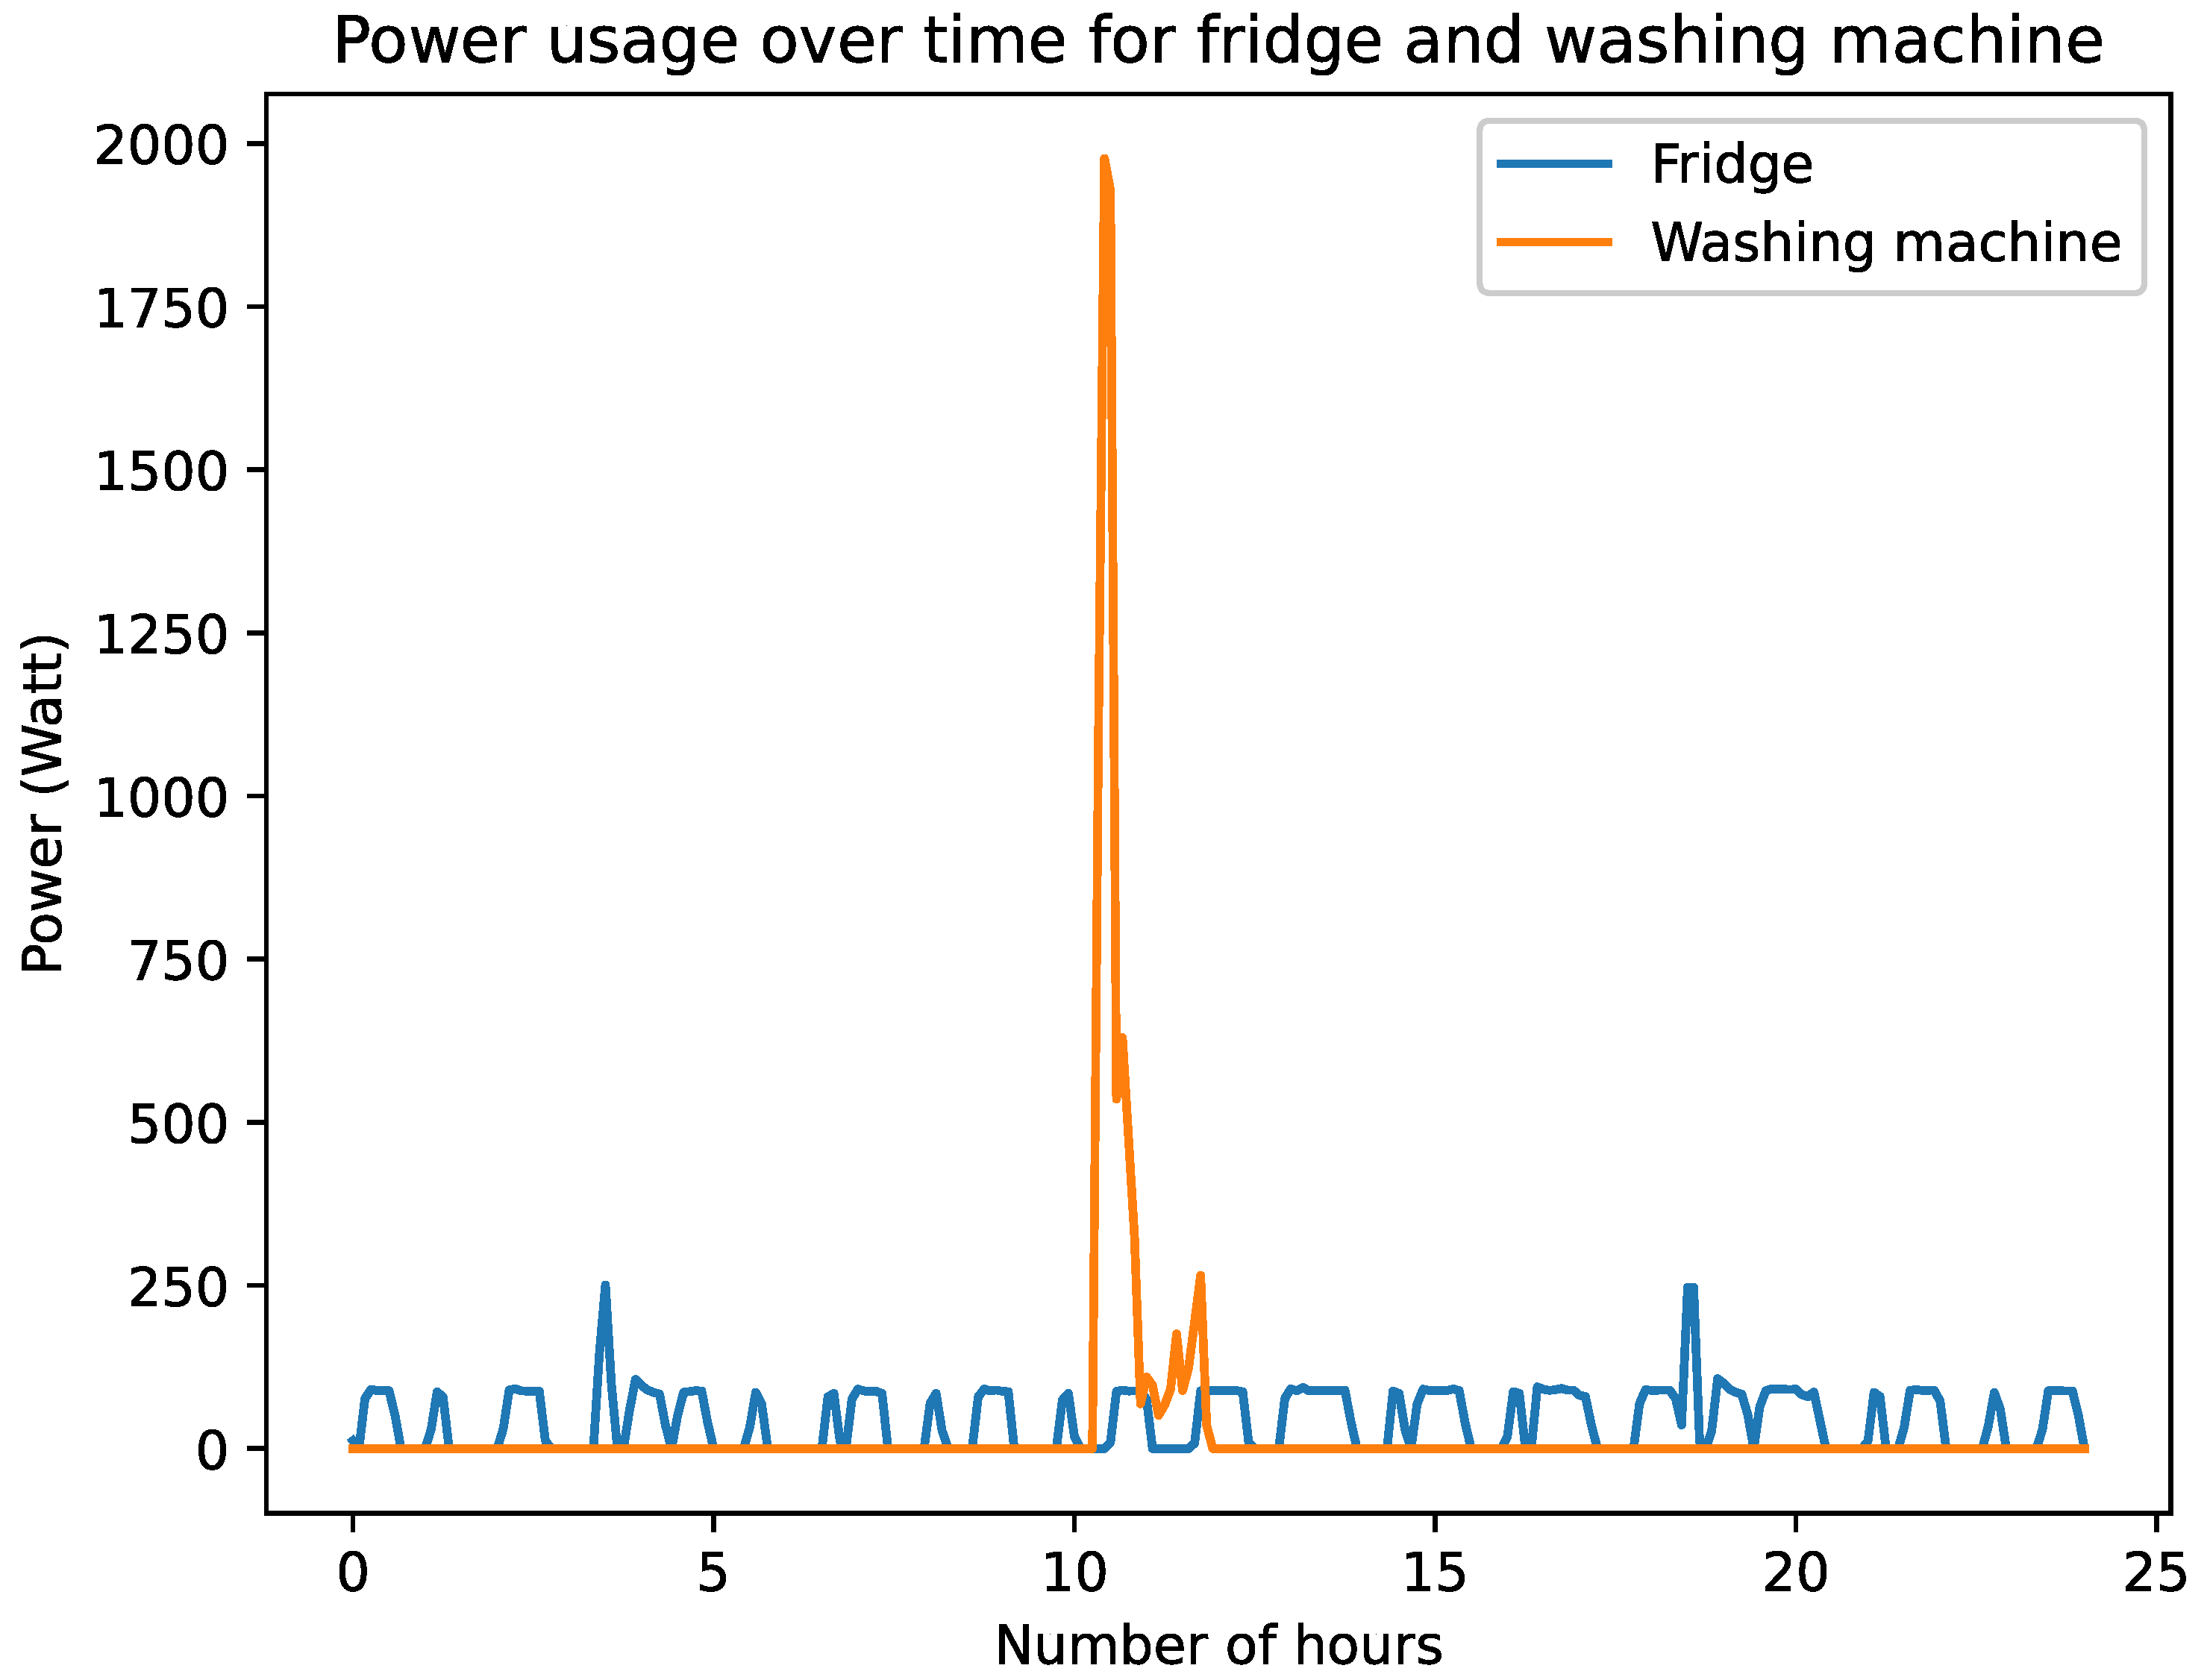
Some appliances are not suitable for inclusion in the recommendation system.
Figure 2 displays the typical power consumption of the fridge and washing machine for a day (24 h) [
16]. The fridge exhibits a characteristic of prolonged operation, making it less suitable for recommendation system data. Please note that even after filtering, the refrigerator still exhibits significant periodic high peaks. These are not detailed in the UK-DALE dataset, but they can be assumed from the opening and closing of the refrigerator or the refrigerator’s periodic defrost function. On the other hand, the washing machine shows distinct triggering patterns, making it a suitable candidate for inclusion in the recommendation system data. So appliances with long-term operation, such as refrigerators, routers, iPad chargers, etc., are excluded. Additionally, some appliances that are not under human control also need to be excluded. For example, the function of boilers is based on a preset automatic control system.
3.1.3. Graph Construction
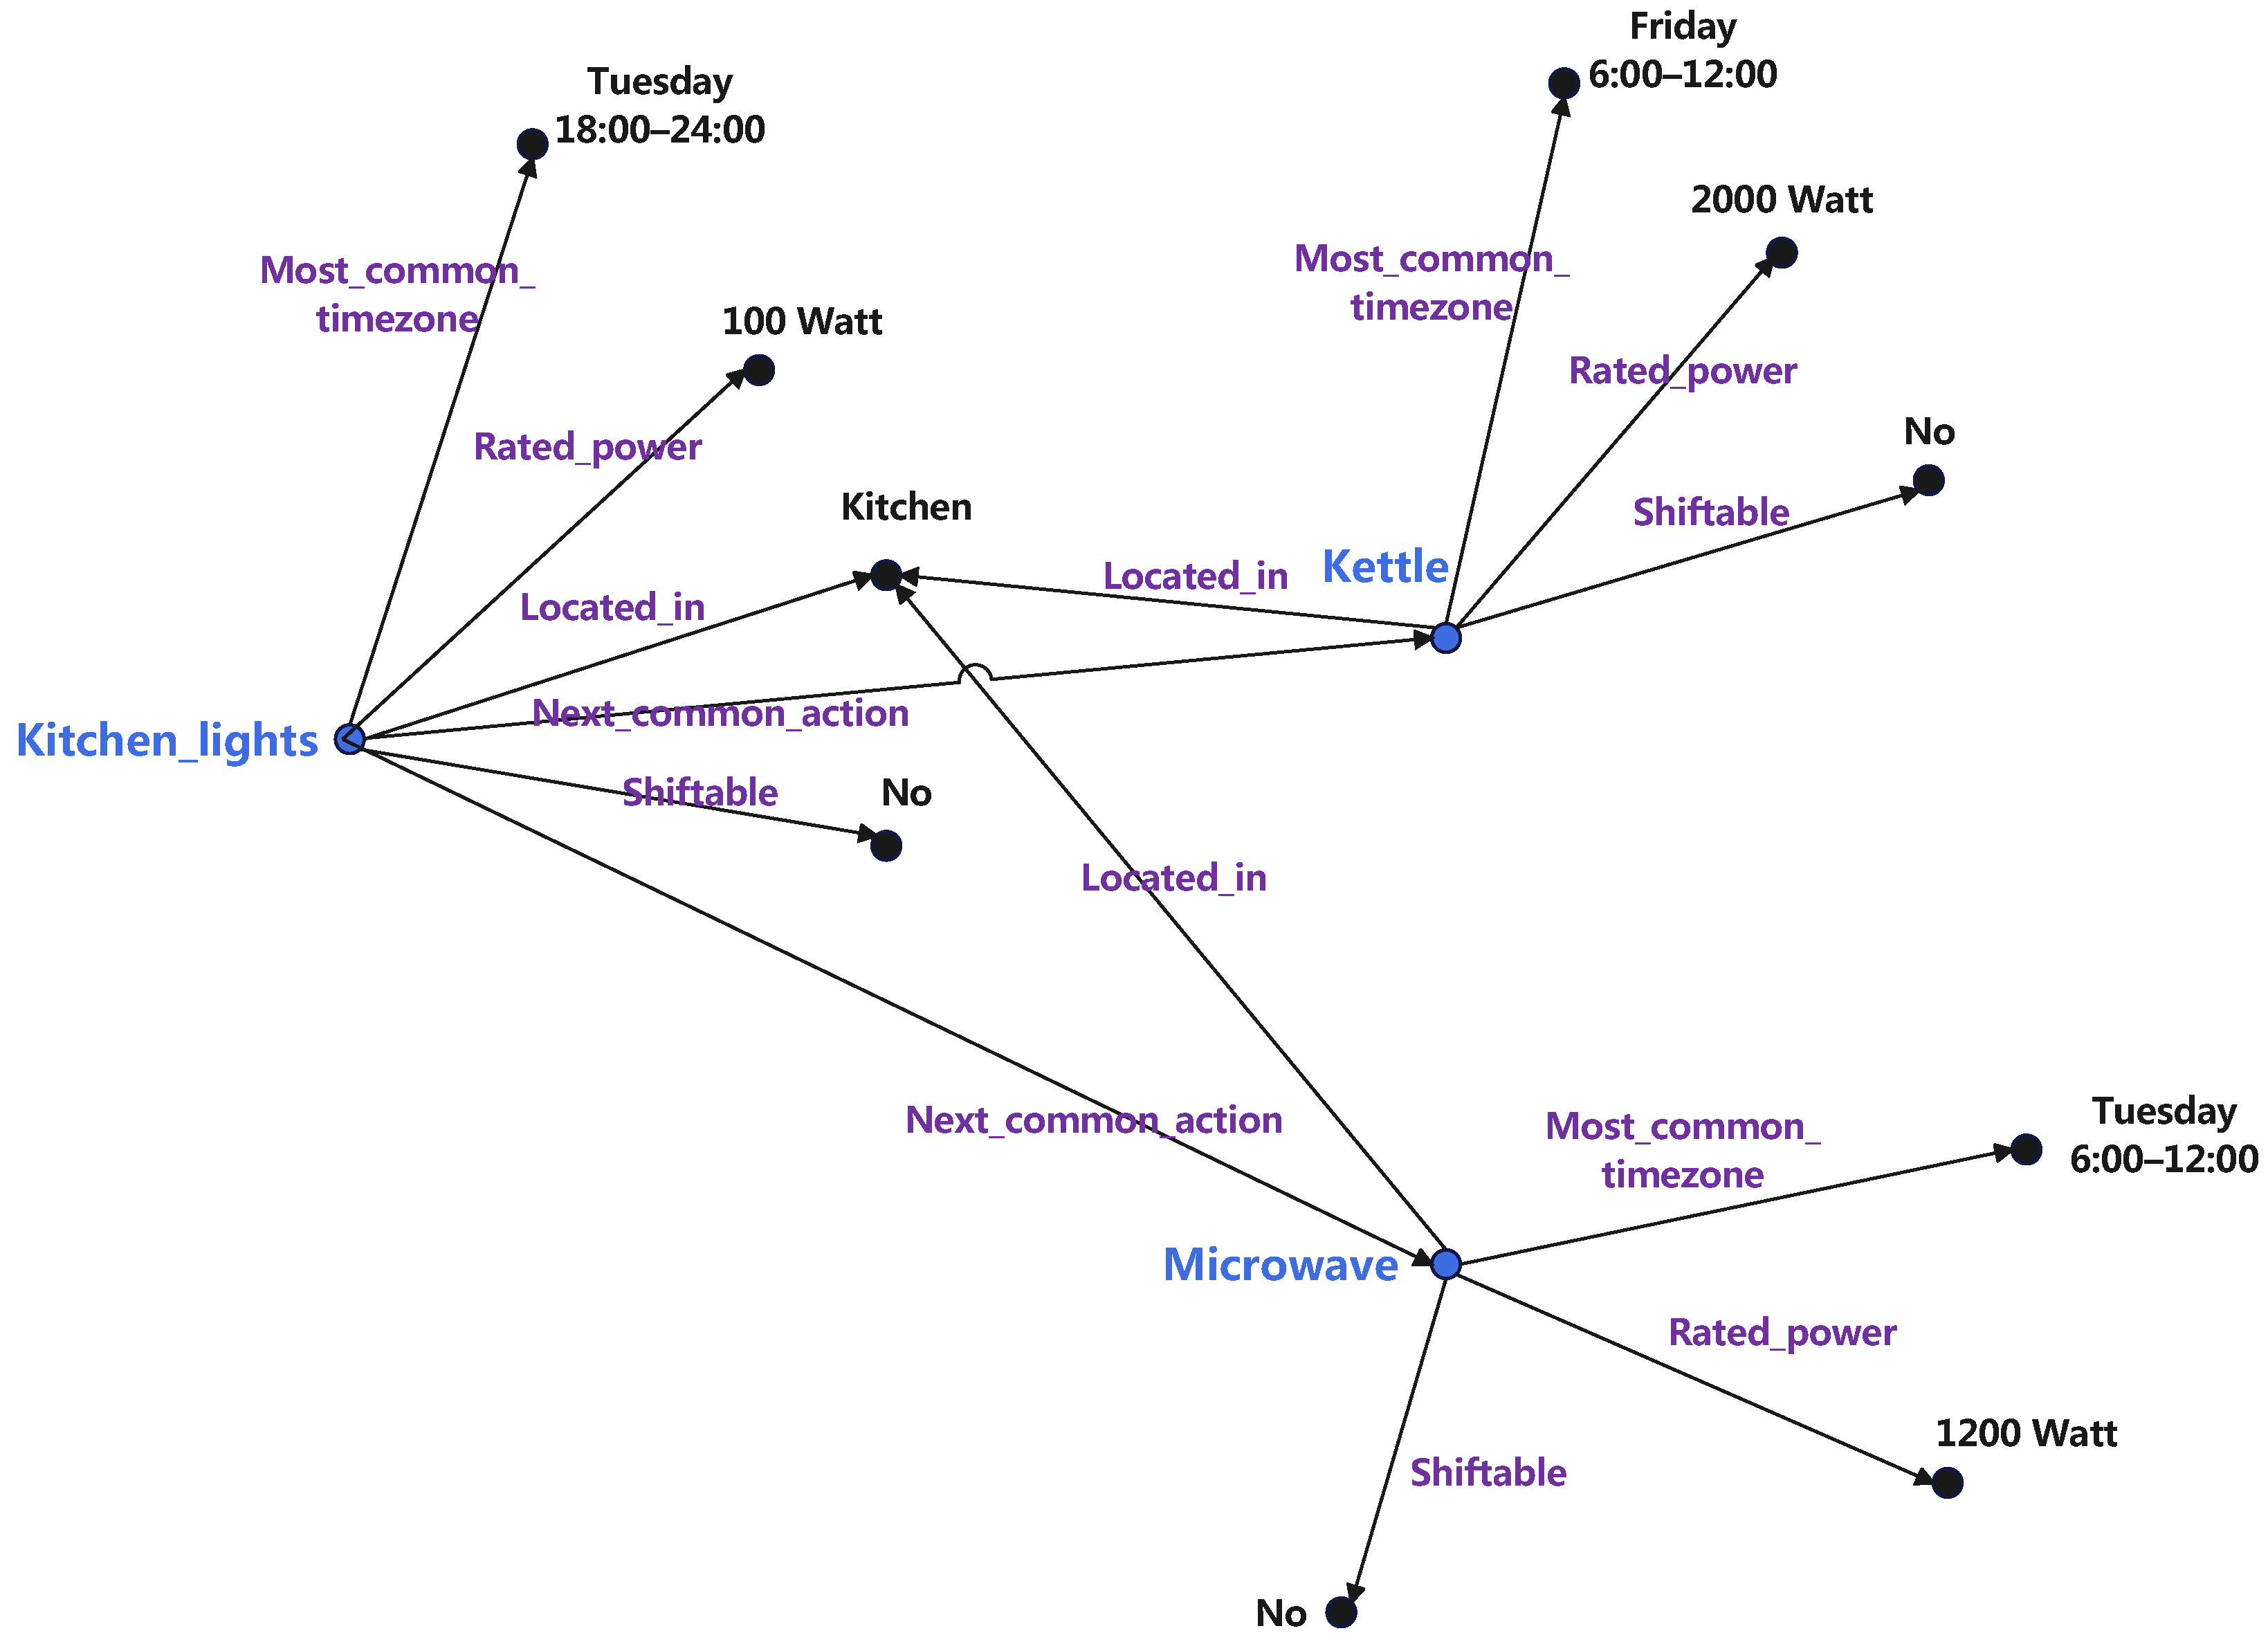
Each appliance is treated as a node and adds an edge between two appliances if the appliances are used one after another, labeled as “used before/after”. A knowledge graph is also established for the time zones where appliances are used, connecting time nodes with appliance nodes. The relationship can be represented as “used during the time period”. Finally, a knowledge graph for the location of appliances can be established, connecting location nodes with appliance nodes and labeling the relationship as “located in the room”. Other attributes, such as the rated power and comfort level, are added for each appliance. This information helps the graph to find the hidden relationships in recommendations and carry out demand response, as they connect the usage information with the energy consumption through a graph.
3.1.4. Negative Sampling
Negative sampling is performed on the dataset to accelerate convergence. For example, a gas oven is often used from 18:00 to 24:00, recorded as ‘gas oven-used during the time-18:00’. This time can be replaced by 2:00 to 4:00 in the morning for producing negative examples, which have never happened, recorded as ‘gas oven-never used during the time-3:00’. This method creates negative examples at a 1:1 ratio in numbers with positive examples. The reason for choosing a 1:1 ratio is that the model does not overly favor either positive or negative samples, which improves training stability and prevents overfitting to one side. This is also an empirical choice commonly adopted in the KGAT algorithm [
17].
Compared to conventional data, by modeling the relationships between nodes in graph data and visualizing the connections between household data nodes and edges, one can intuitively understand how the proposed KGAT model performs reasoning and makes recommendations. This also imparts a structural nature to the model’s decisions, beyond merely relying on the statistical properties of the data, which facilitates data mining [
18].
Figure 3 illustrates the constructed knowledge graph, which is a part of the overall knowledge graph. It depicts a subgraph containing a kitchen light, microwave, and kettle, along with each appliance’s attributes. For instance, the most commonly used time for the microwave is 6:00 to 12:00 on Tuesday. Similarly, the rated power of the kettle is 2000 Watts. There are also associations between appliances. For example, kitchen lights, the kettle, and the microwave are all in the kitchen, so they all point to the ‘kitchen’ point. Actions commonly taken after turning on the kitchen light include using the kettle or microwave, thus establishing relationships (edges on the graph) between appliances.
3.2. Embedding Module
During the data processing, it is necessary to convert the data into embeddings, which use high-dimensional vectors to represent the discrete data. The transformation from data to embeddings facilitates the use of knowledge graph algorithms in subsequent steps. During backpropagation, its parameters are updated based on the gradient of the loss function to minimize the difference between predicted results and true labels. The following data were encoded to embeddings:
Appliances: Each appliance is assigned an embedding, resulting in a set of embeddings for different appliances.
Time zones: The daily time is divided into four time periods: midnight, morning, afternoon, and evening. Thus, a week can be divided into = 28 time zones. These 28 time zones are encoded as a set of embeddings.
Locations: Appliances are distributed across different rooms, and an embedding is created for each room.
Please note that the reason for dividing daytime into four zones is that recommendation systems often have time dependencies. This allows time to be segmented into natural periods, such as late night for rest, morning for waking up and starting work, afternoon for work and study, and evening for entertainment and relaxation. Daily habits vary, as people typically engage in different activities on Mondays, Fridays, and weekends. Therefore, time was divided into = 28 time zones. Compared to hourly segmentation, this approach reduces the computational burden on the recommendation system and lowers complexity. Additionally, merging data into broader time periods facilitates the discovery of potential features.
The embedding layer aims to train the embedding of
such that the embedding of the head
plus the embedding of relation
approaches the embedding of tail
for any positive
in distance (for example, L2 distance), which can be represented as
where
means the squared results of the L2 distance.
represents the positive triples, and the value of
should be close to zero. However, for negative triples, the
h,
r or
t can be replaced by other values that never happened. For example,
is generated by replacing
t with
u arbitrarily, and the value of
should be infinity.
The embedding module converts discrete inputs into continuous embeddings. These embeddings are then fed into the knowledge graph layer as input for training.
3.3. Recommendation Module
After encoding the original data into embeddings, the embeddings can be further used for recommendations. The recommendation module introduces the proposed DARK algorithm, an improved KGAT algorithm in the recommendation area. It also includes a comparison with the traditional KGAT algorithm.
3.3.1. Knowledge Graph Attention Networks
In KGAT, attention mechanisms are utilized to determine the aggregation weights of neighboring node embeddings in [
17]
where the
is the calculated attention for knowledge graph aggregation. Softmax
and tanh
(hyperbolic tangent function) are activation functions.
is the relation transformation matrix.
,
, and
are the head, relation, and tail entity, respectively. Then, it aggregates the embeddings of neighboring nodes based on the weights in [
17]
where
is the aggregated entity, which means how much information the tail entity
is going to pass to the head entity
, which is represented as [
17]
where
is the information aggregation vector, which contains weighted information with the head and tail entities and can then be used for recommendations by embedding the dot product with the aimed user embeddings. LeakyRelu is the activation function.
is the transformation matrix [
17].
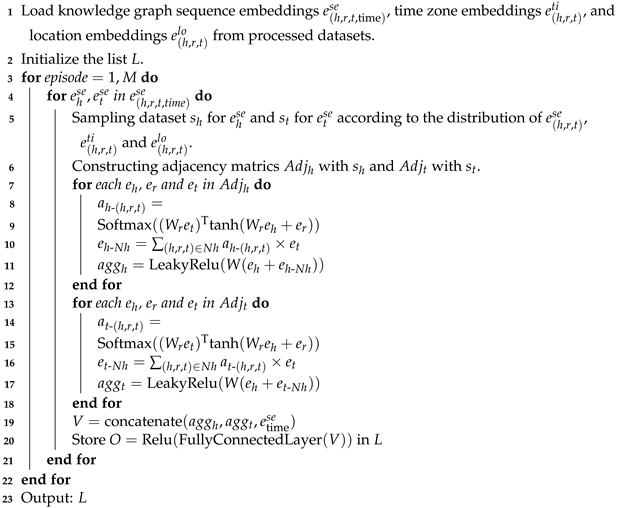
3.3.2. Modified KGAT Algorithm
Different from the traditional KGAT algorithm, some improvements have been made to the action recommendation scenario. The pseudocode is shown as Algorithm 1. Based on the original KGAT algorithm, the proposed algorithm improves (1) the embedding aggregation process and (2) the embedding sampling method. These enhancements help improve recommendation performance. The detailed description is as follows:
| Algorithm 1: The modified KGAT networks in the recommendation module of DARK |
![Energies 18 00833 i001]() |
Firstly, the algorithm aims to predict the next potential appliance to be used based on known residents’ appliance usage habits. In the traditional KGAT recommendation algorithm, only potentially recommended appliances undergo graph embedding aggregation because traditional KGAT treats the recommended appliance as an item and the known appliance as a user. However, in the household device action system, the known appliance usage can also be treated as an item and aggregated. This is expressed in lines 13–18 of Algorithm 1, where the subscript and means that is generated by t or h, similar to the subscripts and .
In addition, each type of attribute, such as timezone, usage sequence, and location, is first collected, ensuring equal chances of different kinds of data. Then, a distribution-based sampling is used in line 5. These samples will inform the knowledge graph algorithms about the studied case and affect the aggregation results. For example, if a particular appliance is most commonly used on Tuesday mornings, the probability of sampling Tuesday mornings for the adjacency matrix will be higher. This is expressed in lines 5–6.
The output L contains aggregated embeddings for head embeddings and for tail embeddings. Then, the embedding L is used as the input for the fully connected layers for training.
3.4. Interpretation Module
After making recommendations in the recommendation module, the results can be sent to the interpretation module for further reasoning.
In recommendation algorithms, interpretability is crucial for making the recommendation results convincing. The purpose of this module is to provide further interpretations of the recommended results. It is known that the trained embeddings in graph neural networks can represent the meaning of the data [
19], and in paper [
20], Ai et al. used that for making interpretations. Based on this characteristic, we generate reasons for the recommended results, which consist of three types of reasons: (1) Habitual usage sequence, which means an appliance is often used after another one. (2) Habitual usage time, which means an appliance is often used at some specific time. (3) Usage at a habitual location, which means an appliance is used because it has location relationships with other appliances.
All the connections between the recommended appliances and the known appliances within two hops are identified in the graph, and we find the embeddings of all the nodes and relationships involved. Using the embedding approach described in the paper [
19], we have
where the head embedding
plus relation embedding
should approach the tail embedding
as much as possible after training. Ideally, they are equal.
Here we propose a new measure as shown in (
6)–(
11) for the recommendation results in the context of household appliance action recommendations. From (
5), the embedding of the reasons can be calculated in (
6)–(
8).
where the superscript
,
, and
refer to different reasons like sequence, timezone, and location. The values
,
, and
are the product values of the embeddings. From the characteristic embedding of TransE [
20], a higher product value means that the reason has a stronger relationship with the answer, where
is the top
N average product of the embedding of the reason timezone.
and
only exist if two household appliances have a sequential relationship or are placed in the same location. In (
9)–(
11), the explanation
R of different reasons is calculated.
Please note that a major drawback of interpretation is that, generally, the correctness of the interpretation cannot be verified; thus, it is usually used as a reference rather than a precise interpretation. In this paper, the verification method only checks whether the interpretations align with common sense. If this is true, the interpretations are considered to be correct. Since interpretations themselves are estimations of the user’s intentions, surveys can be created in the future to further verify the accuracy of these interpretations.
3.5. Optimization Module
Based on the results of the recommendation module, multi-objective optimization can be performed for demand response. This section primarily introduces the objective functions in the optimization module of DARK for optimizing energy consumption and the user’s expected satisfaction.
When solving complex problems with multiple objectives and a large number of parameters, the Genetic Algorithm is a promising method, especially when these objectives involve a non-linear problem [
21].
It is assumed that the power of each appliance is adjustable within a certain range, and the power of an appliance affects the comfort level as given by
where
is a comfort function, and
represents the sum of discomfort scores for
N appliances. The rated power of appliance
i is
with
. Power significantly above or below the rated power can result in discomfort. The average power load of appliances is calculated by
For (
12) and (
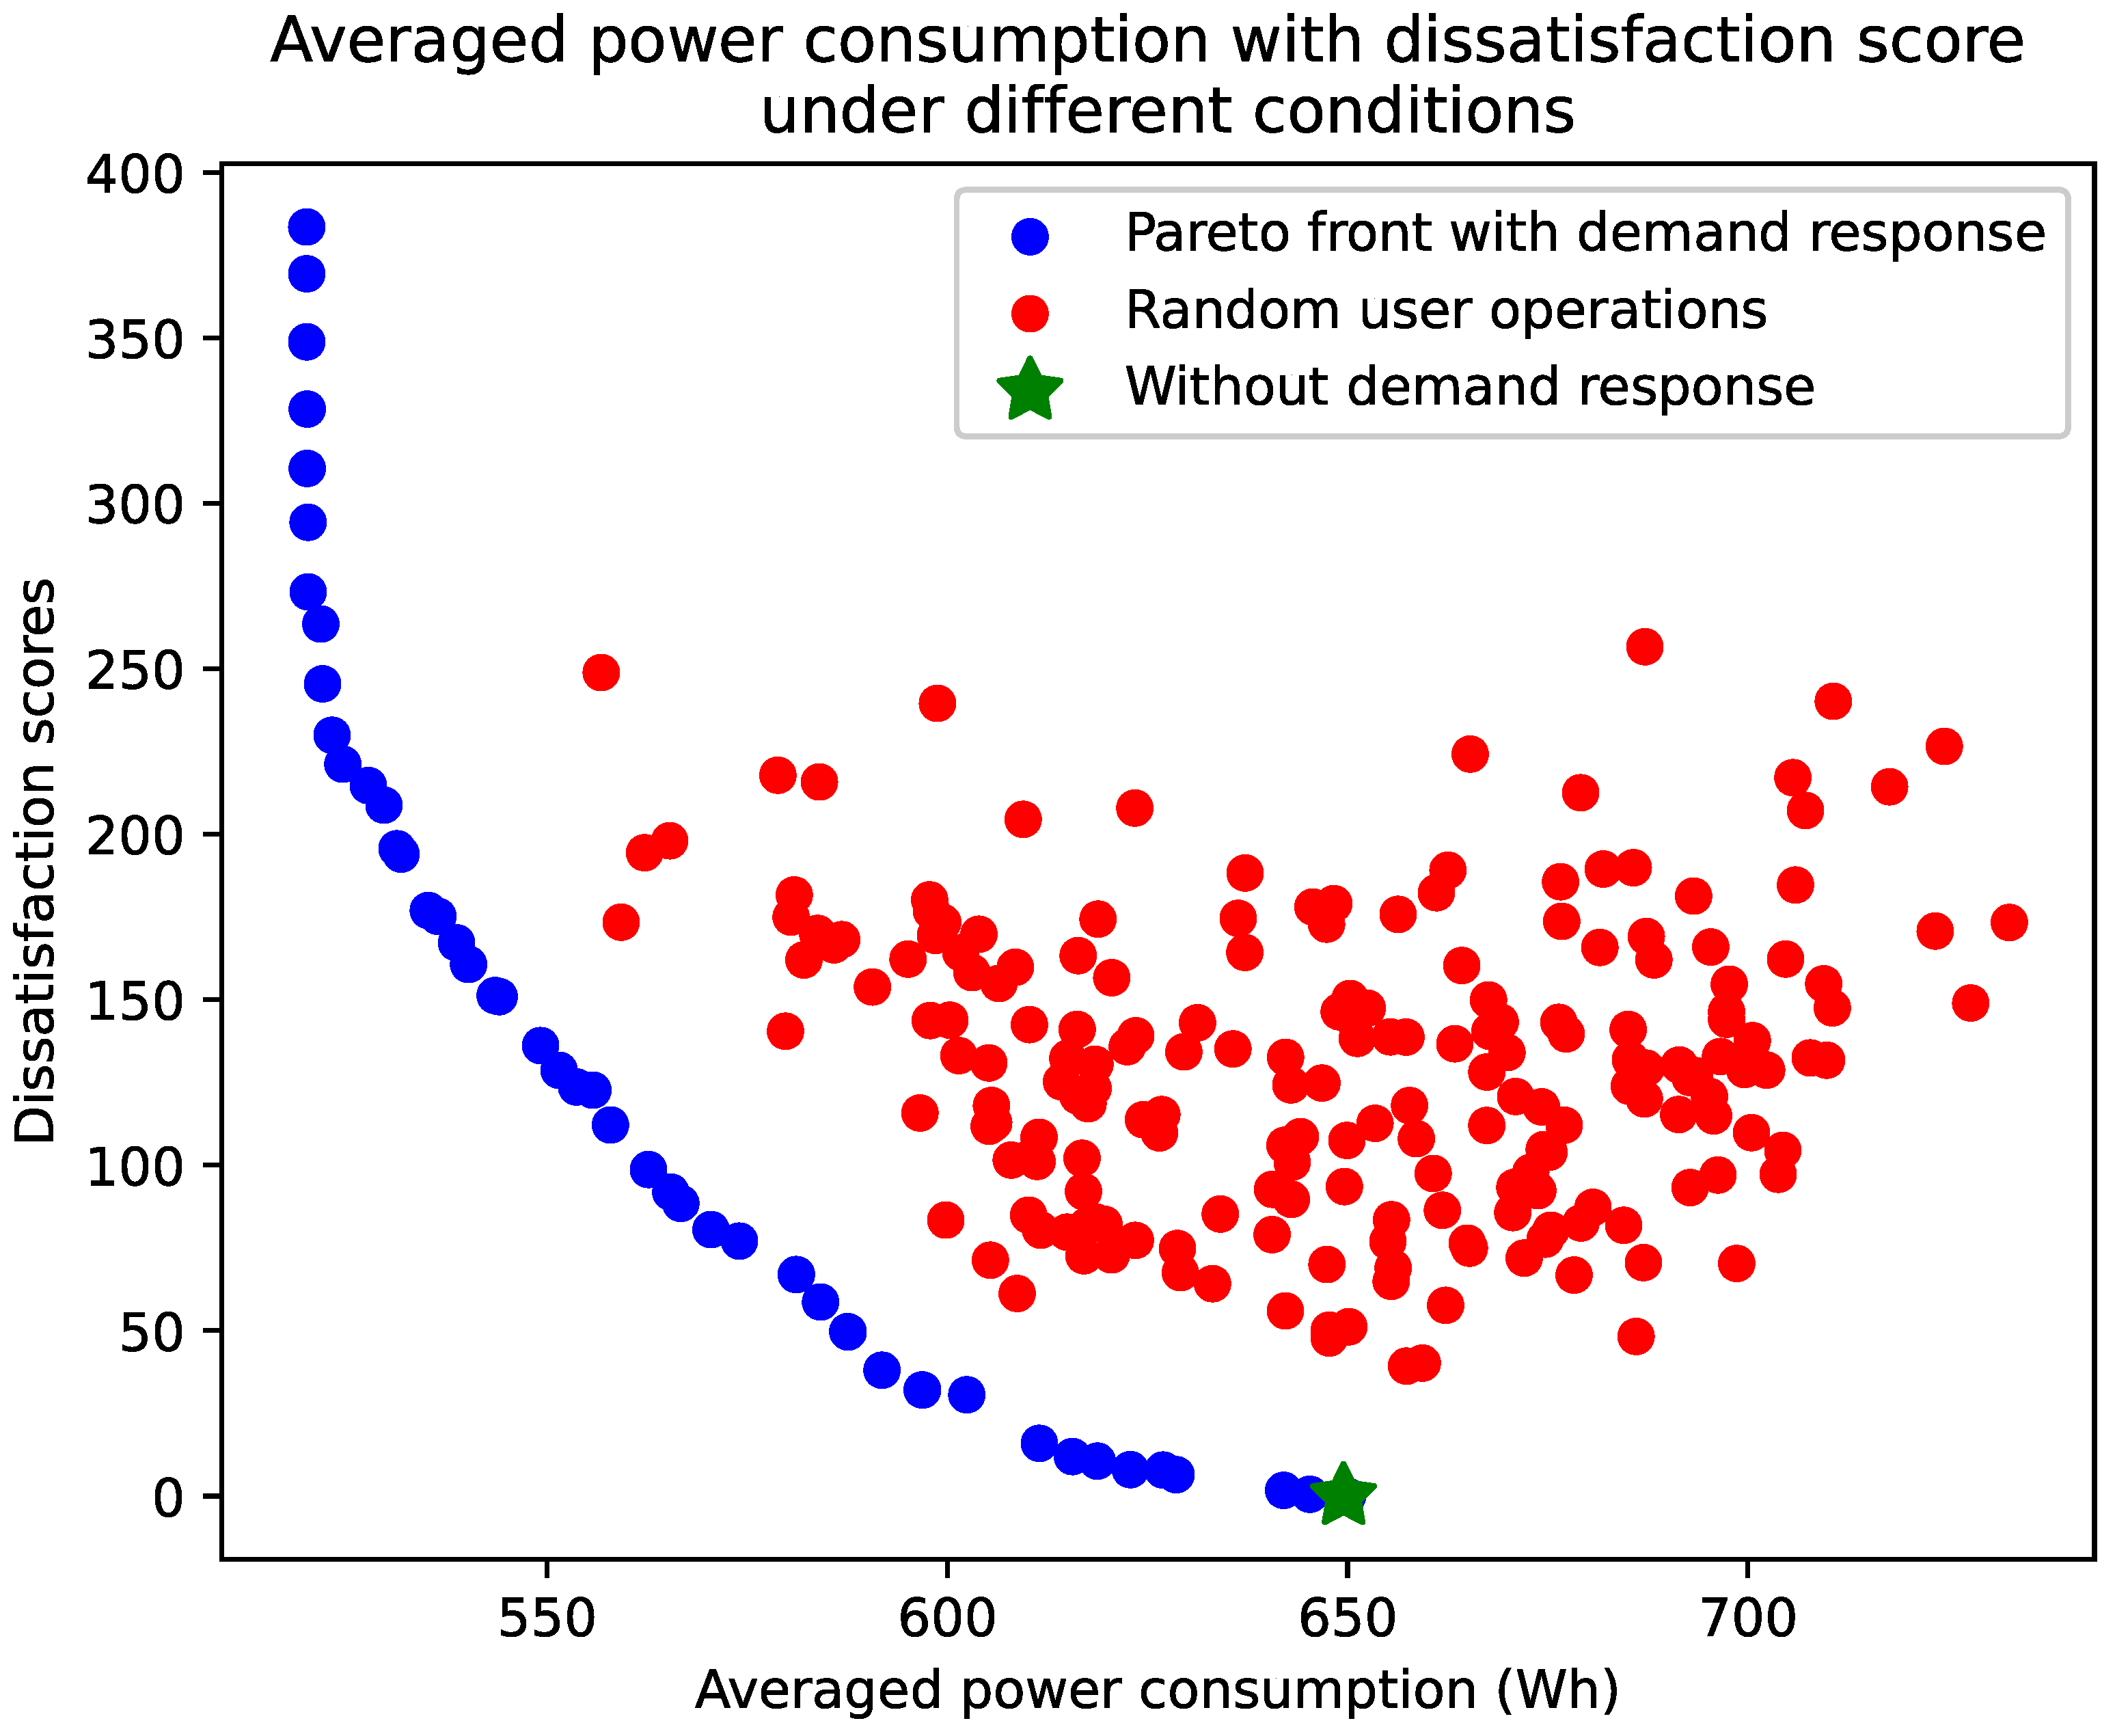
13), we address two competing objectives: maximizing comfort, which represents consumer needs, and minimizing average power load, a consideration crucial for supporting power grid operations. For this type of optimization problem, multi-objective optimization algorithms, such as genetic algorithms, can be used to find the Pareto front. The outcome of the optimization is to set the power level
for appliance
i based on the expectation of the recommendation results. Through the optimization results, multiple feasible solutions between comfort level and average power load can be selected in the Pareto front [
22].
5. Conclusions
The proposed DARK framework integrates a knowledge graph-based recommendation system with interpretative analysis and multi-objective optimization for enabling demand response. Our results indicate that the modified KGAT algorithm effectively predicts the next actions of appliances and provides comprehensible interpretations of these recommendations. By fine-tuning the expected outcomes, we successfully achieve a balance between consumers’ comfort and average power load, represented by a Pareto front.
One limitation of the simulations in this paper is that, due to the constraints of the dataset and the complexity of customizing data, only the UK-DALE dataset was used. This does not demonstrate the broad applicability of the algorithm but serves only as a starting point for future research. To obtain an exact percentage, much more research should be conducted in the future, including studies involving inaccurate data.
Future research will aim to develop more complex recommendation graphs (or use different datasets) and test the robustness of the algorithm in practical applications.


