
Methane Emissions from Mining in the European Union


Abstract
1. Introduction
2. Materials and Methods
2.1. Coal Production
2.2. Methane Emissions from Mining
3. Results and Discussion
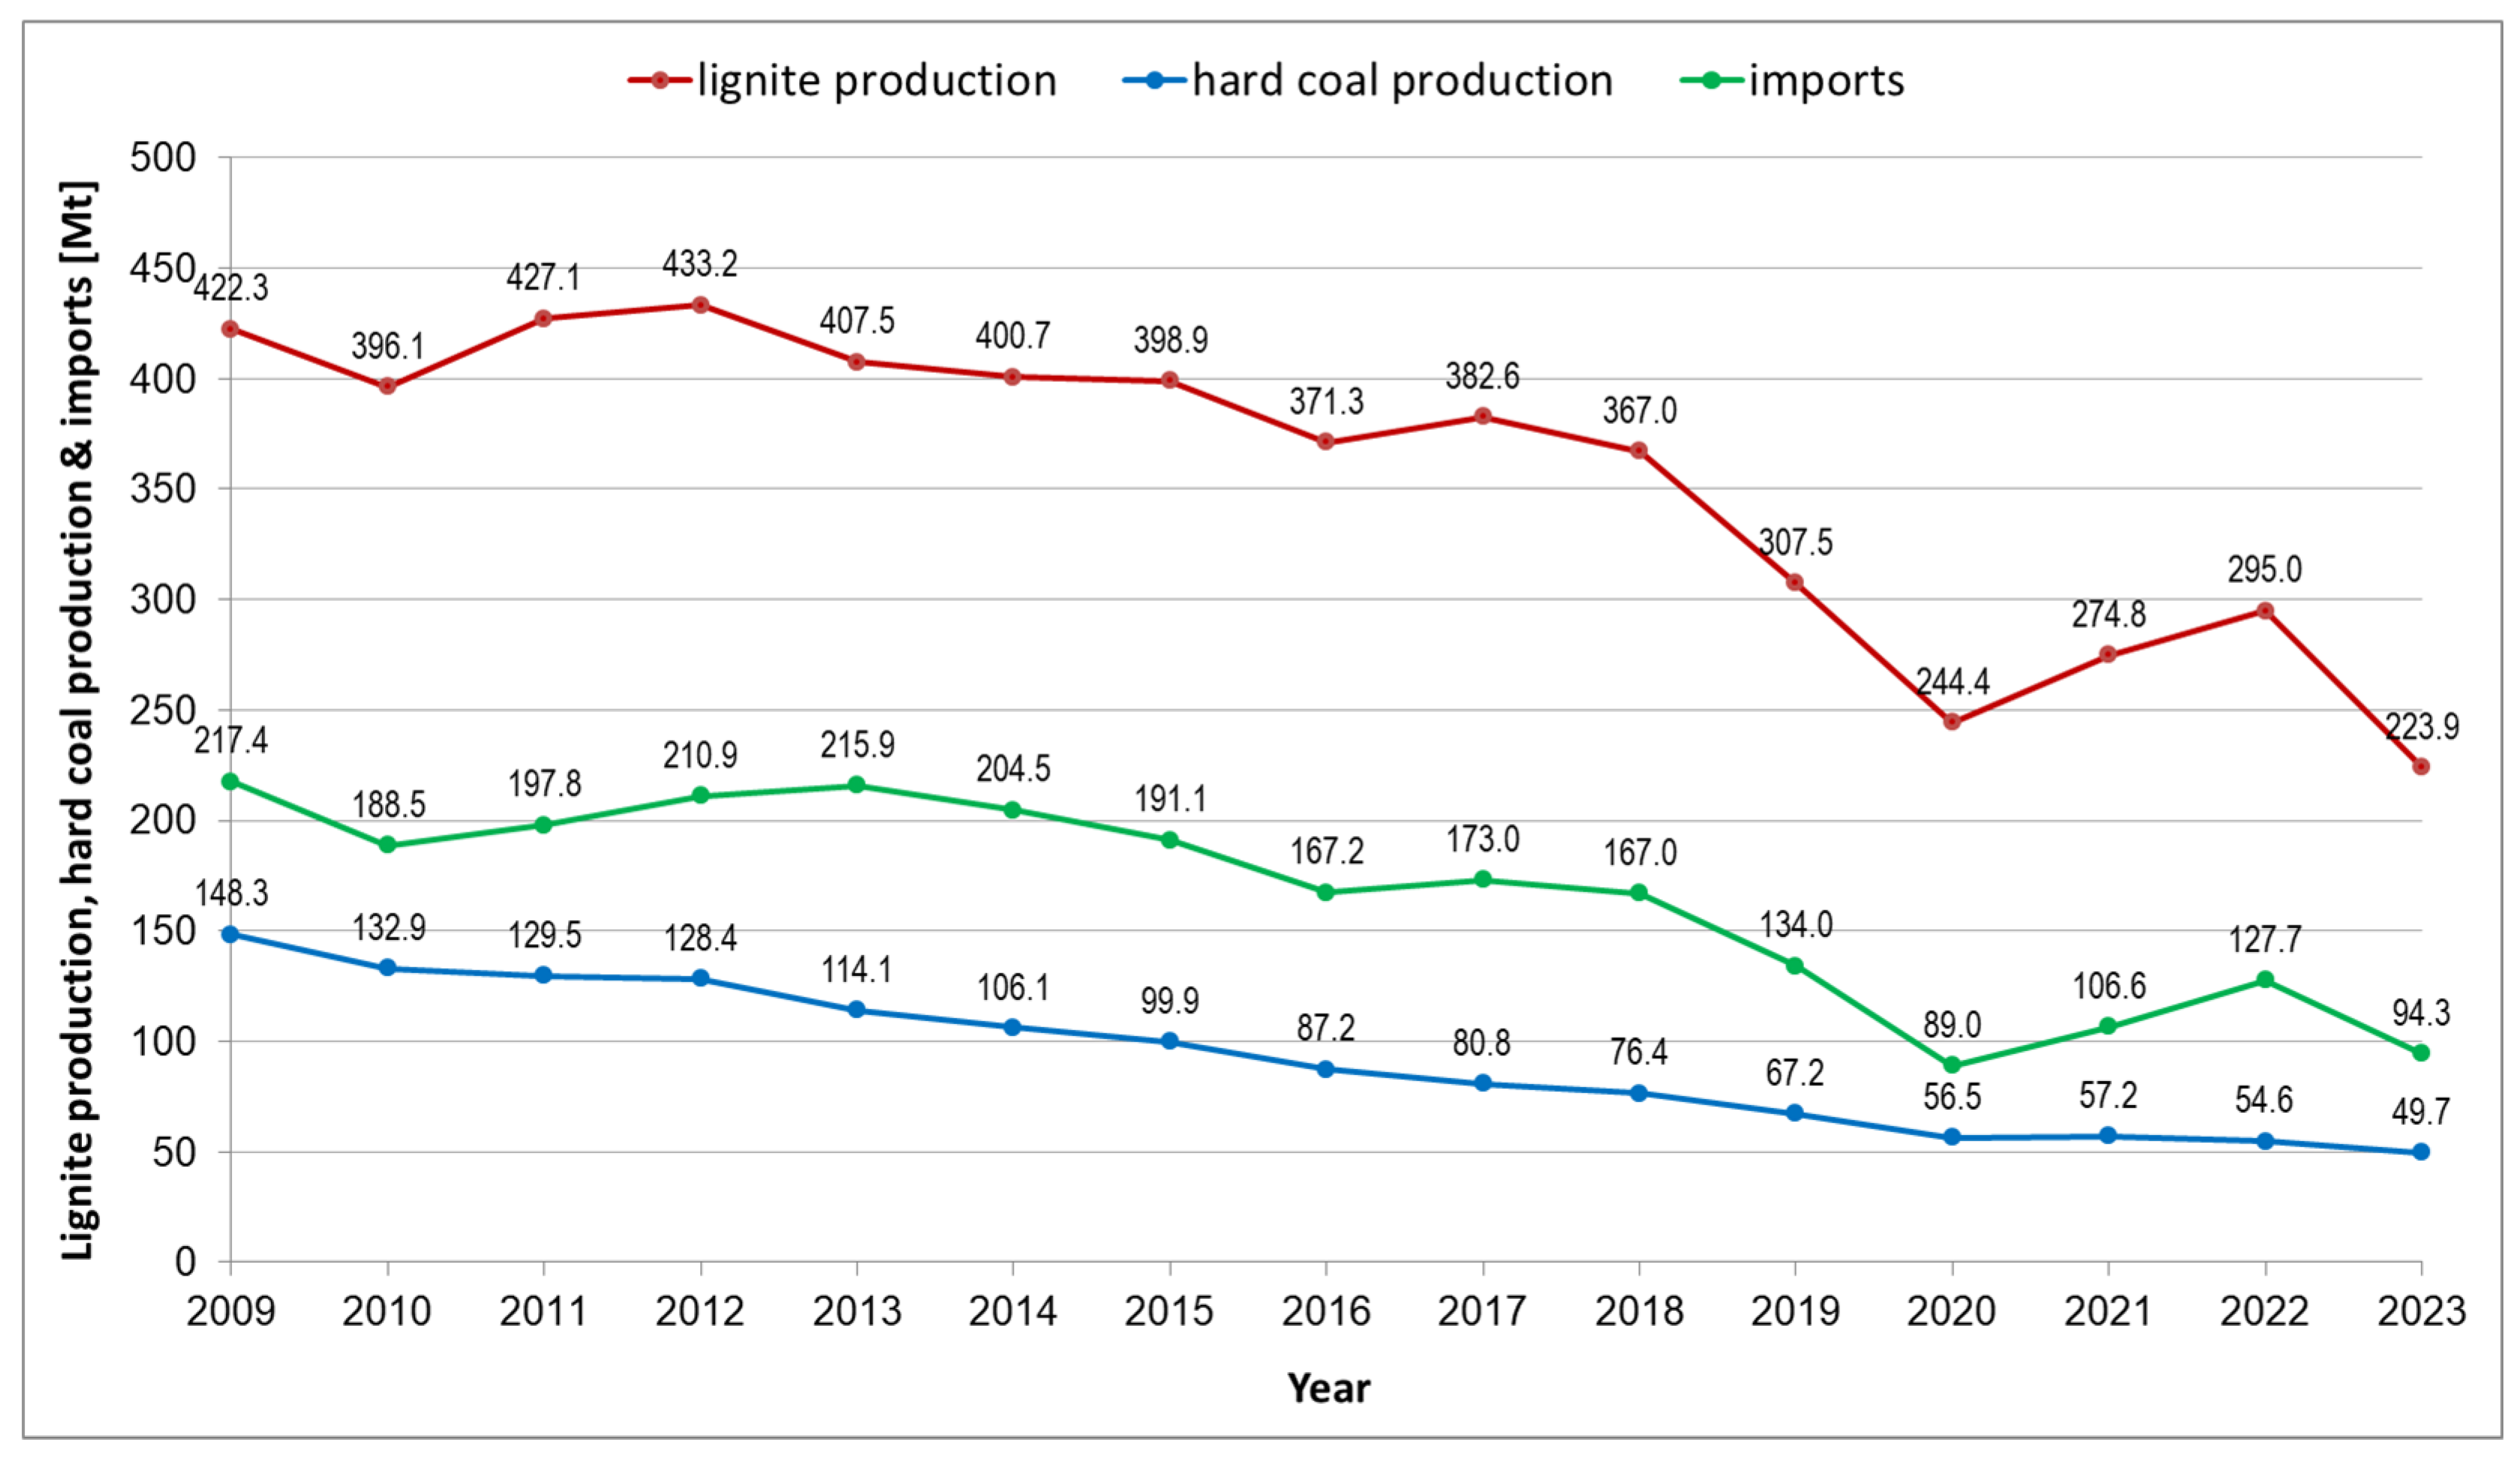
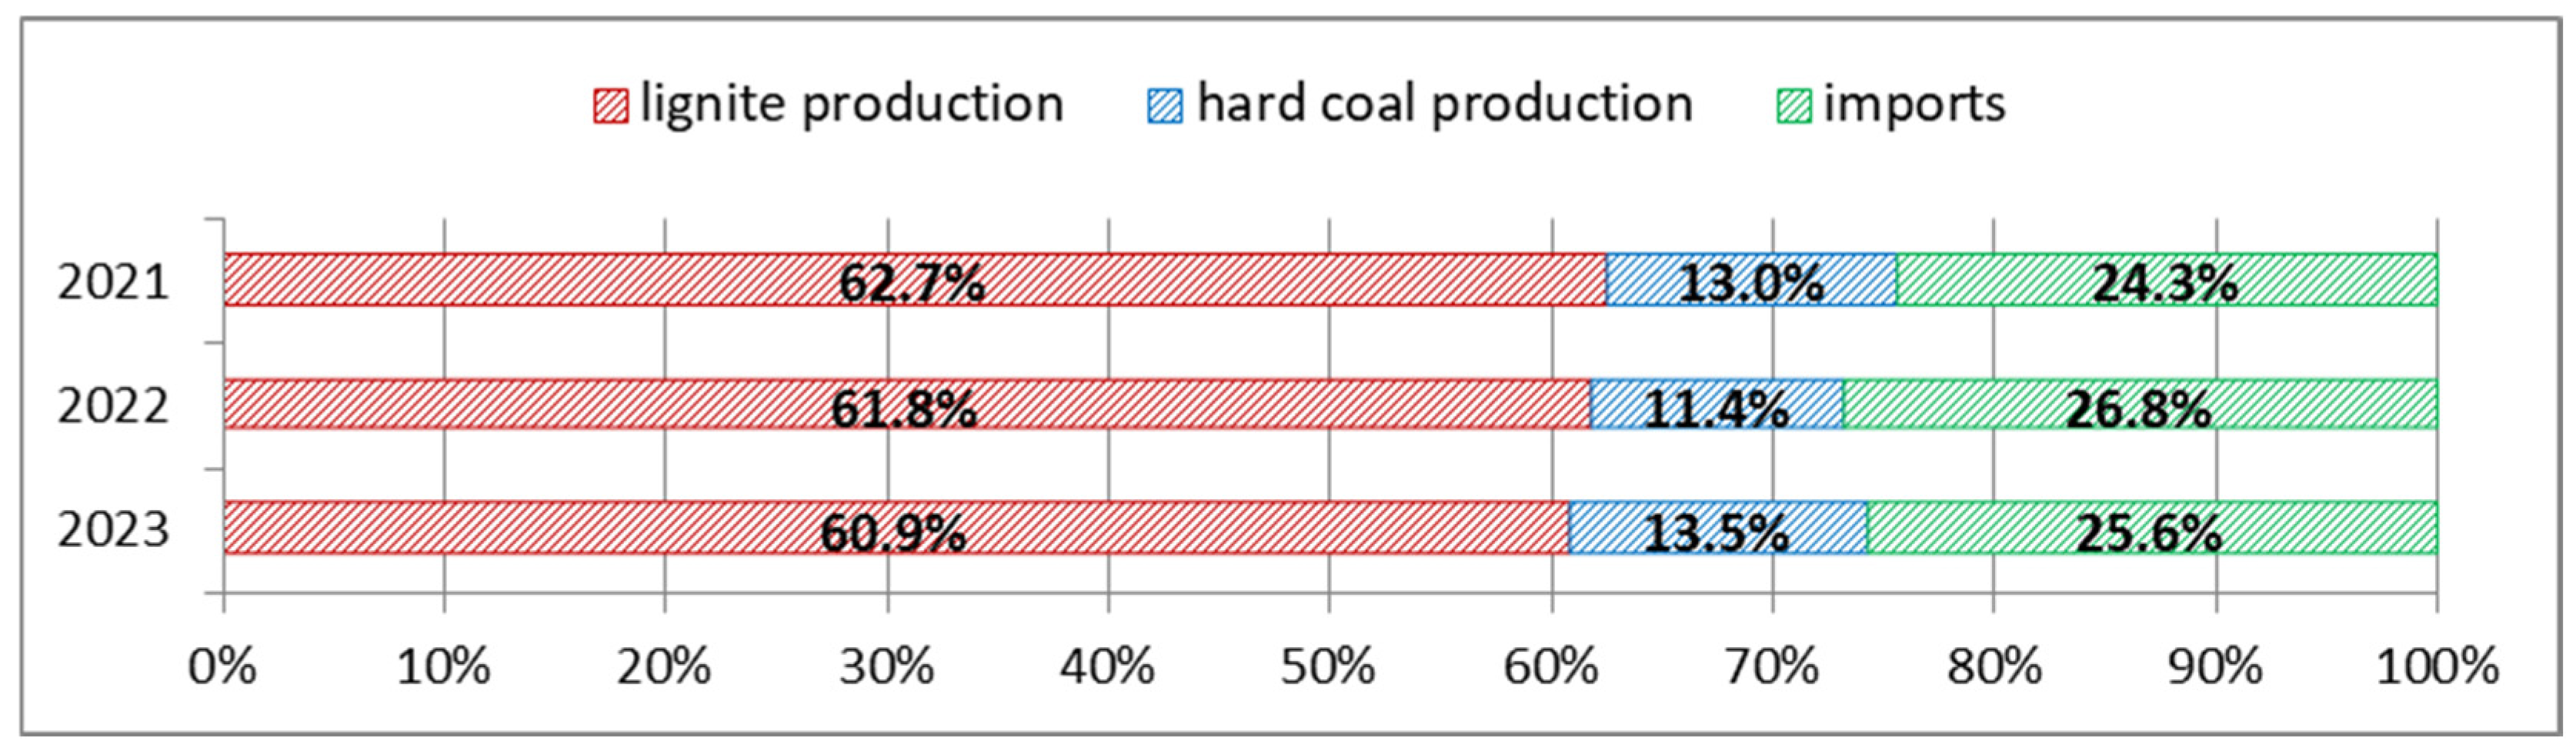
3.1. Coal Production
3.2. Methane Emissions from Mining
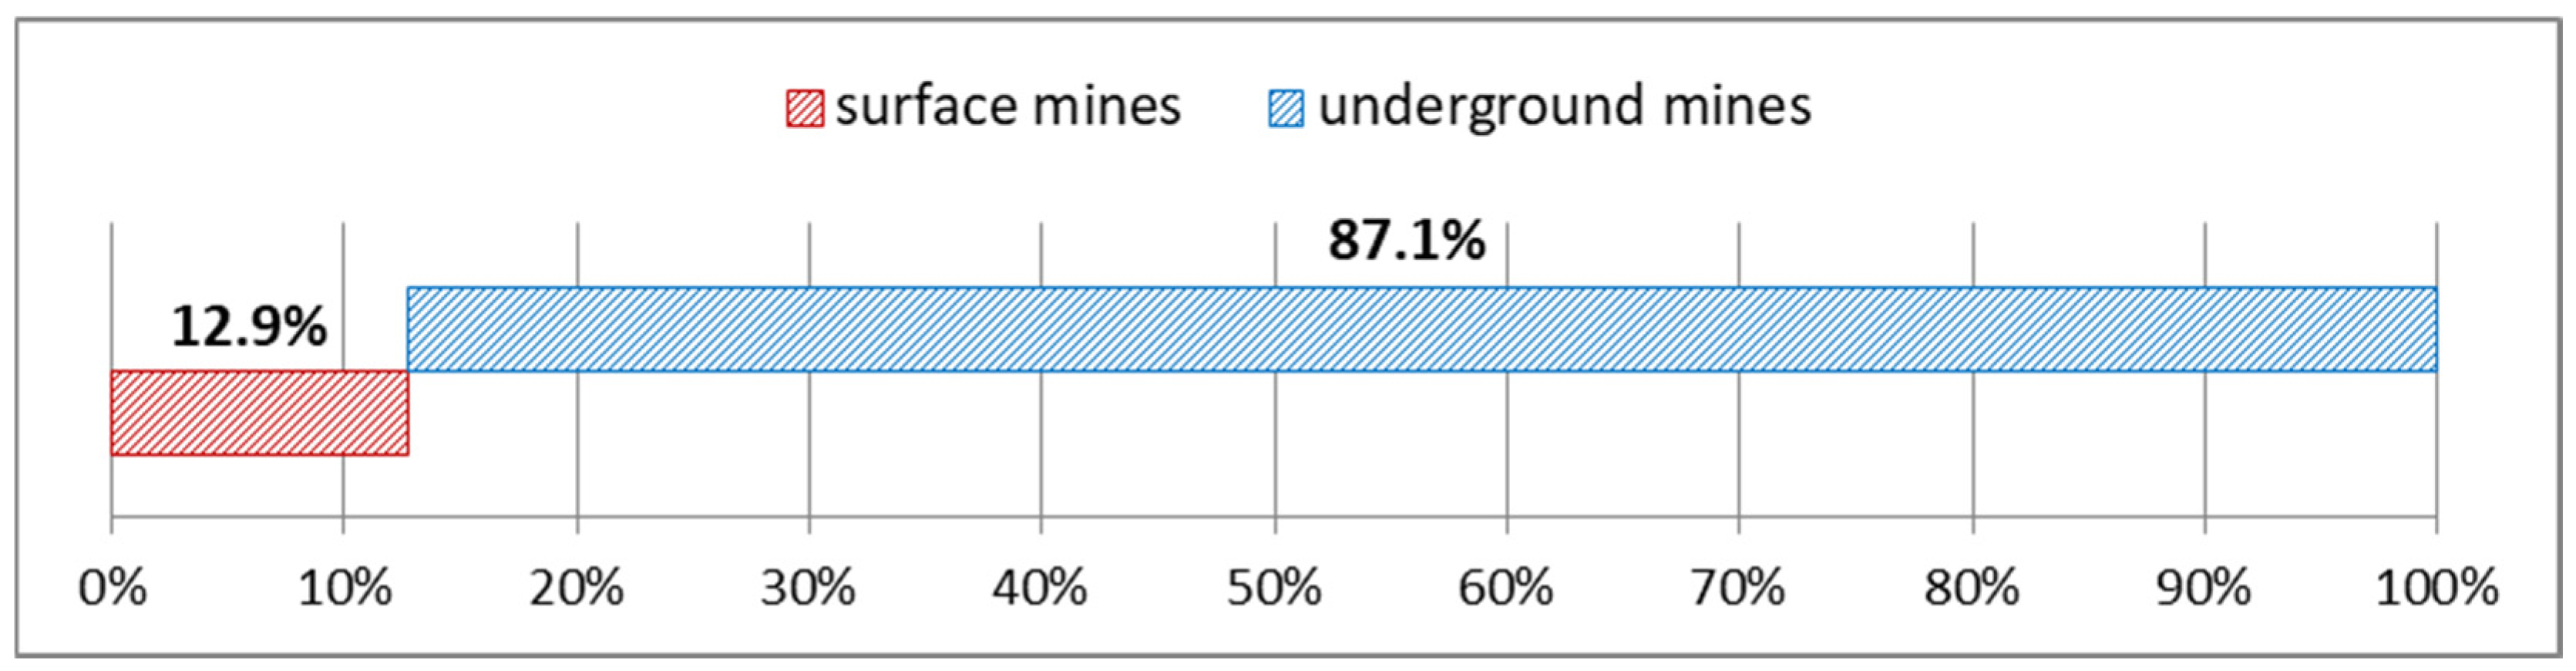
- Surface mining—3887.98 kt CO2 eq. (138.86 kt CH4), or 15.3%;
- Underground mining—21,525.66 kt CO2 eq. (768.77 kt CH4), or 84.7%.
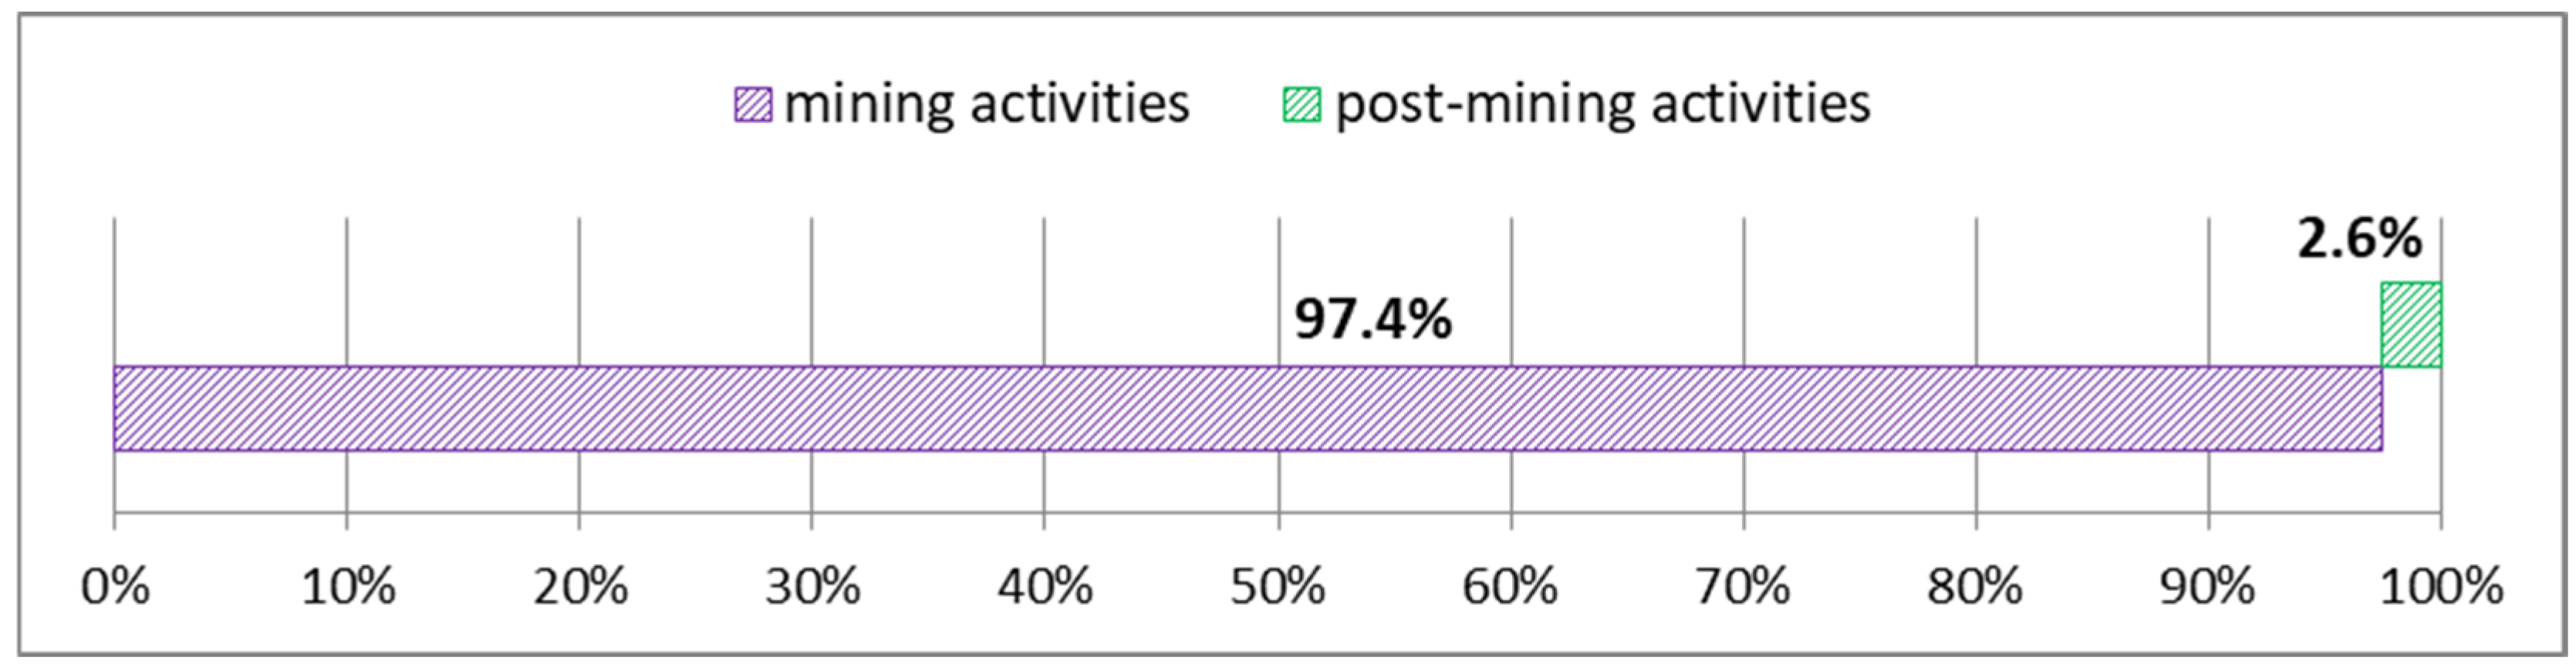
- Mining activities—3648.95 kt CO2 eq. (130.32 kt CH4), or 93.9%;
- Post-mining activities—239.03 kt CO2 eq. (8.54 kt CH4), or 6.1%.
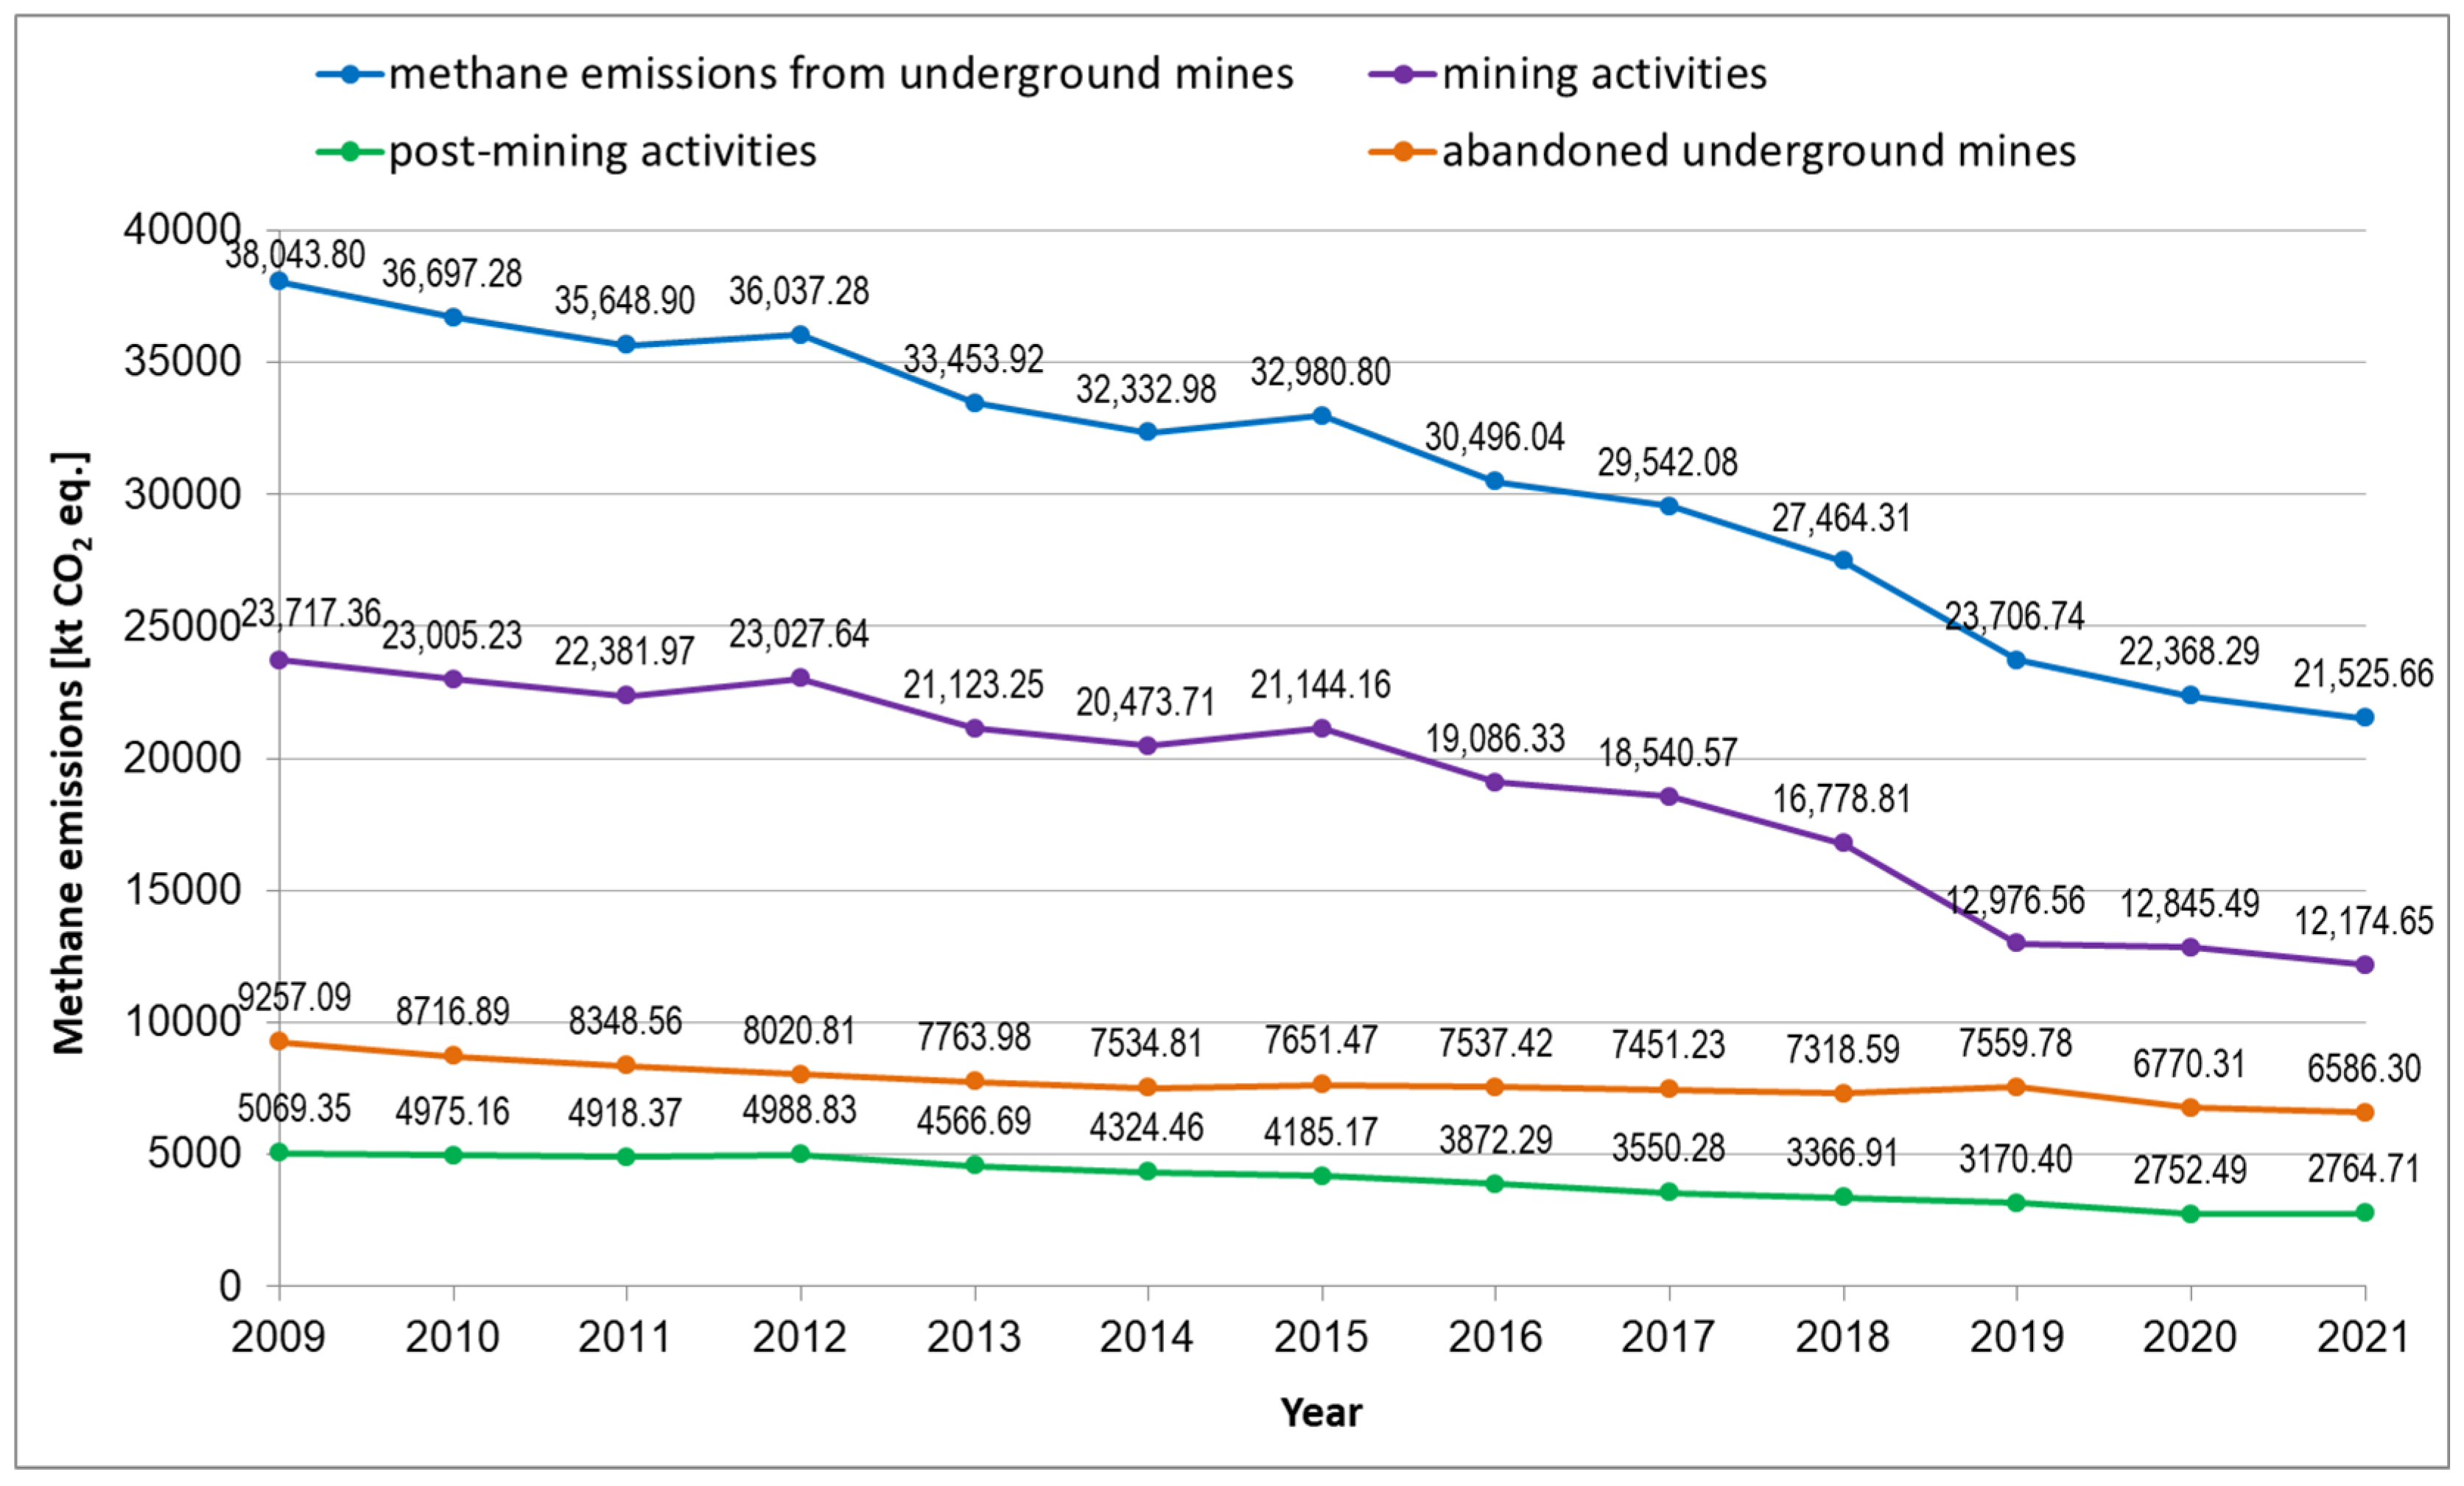
- Mining activities—12,174.65 kt CO2 eq. (434.81 kt CH4), or 56.6%;
- Abandoned underground mines—6586.30 kt CO2 eq. (235.23 CH4), or 30.6%;
- Post-mining activities—2764.71 kt CO2 eq. (98.74 kt CH4), or 12.8%.
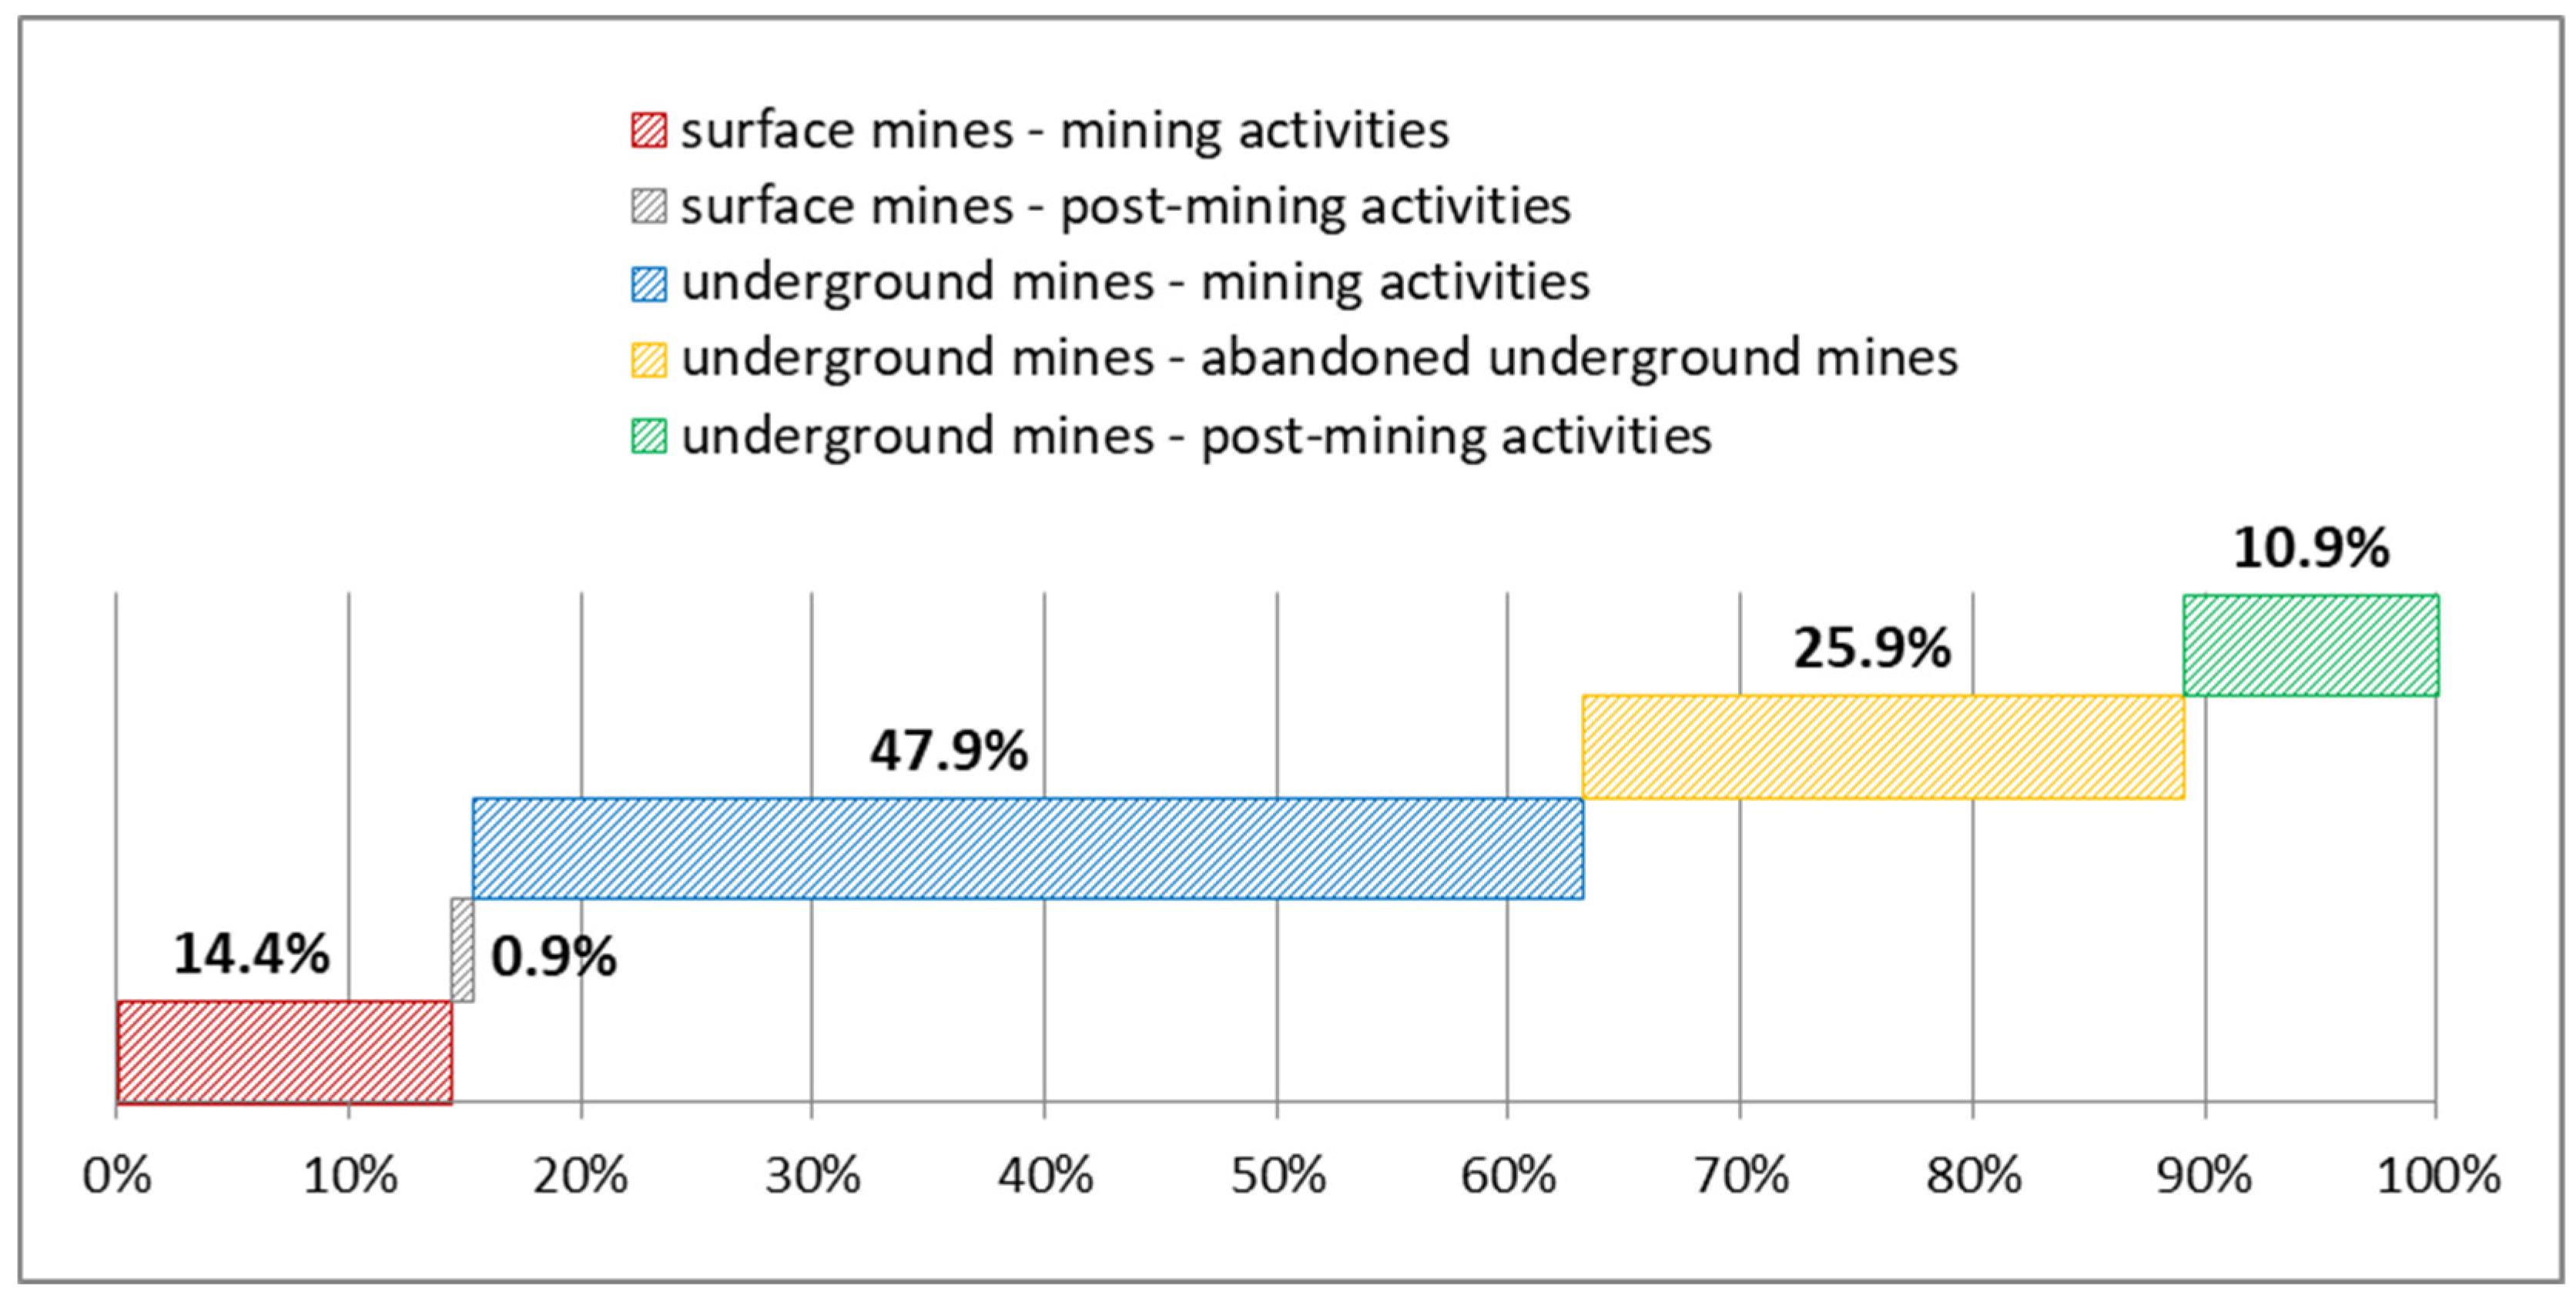
- Surface mining—3887.98 kt CO2 eq. (138.86 kt CH4), or 15.3% of total emissions and including emissions from the following:
- Mining activities—3648.95 kt CO2 eq. (130.32 kt CH4), or 14.4%;
- Post-mining activities—239.03 kt CO2 eq. (8.54 kt CH4), or 0.9%;
- Underground mining—21,525.66 kt CO2 eq. (768.77 kt CH4), or 84.7% of total emissions and including emissions from the following:
- Mining activities—12,174.65 kt CO2 eq. (434.81 kt CH4), or 47.9%;
- Abandoned underground mines—6586.30 kt CO2 eq. (235.23 kt CH4), or 25.9%;
- Post-mining activities—2764.71 kt CO2 eq. (98.74 kt CH4), or 10.9%.
- The ratio of methane emissions from mining activities in coal mines to the amount of coal produced was as follows:
- The highest in Czechia and at a similar level in Bulgaria, Greece, Poland, and Romania;
- Very low in Hungary and Germany compared to the above-mentioned countries; it is possible that the amount of methane emissions from coal production is underestimated;
- For Slovakia and Slovenia, the amount of lignite production was reported; there are no data on the amount of methane emissions from coal mining;
- Romania, Slovakia, and Slovenia reported methane emissions from hard coal mining; the data on coal production are not available.
4. Conclusions
Funding
Conflicts of Interest
References
- Ember. Europe’s Electricity Transition Takes Crucial Strides Forward. 2024. Available online: https://ember-climate.org/insights/research/european-electricity-review-2024/ (accessed on 8 December 2024).
- Bórawski, P.; Bełdycka-Bórawska, A.; Holden, L. Changes in the Polish Coal Sector Economic Situation with the Background of the European Union Energy Security and Eco-Efficiency Policy. Energies 2023, 16, 726. [Google Scholar] [CrossRef]
- Osman, A.I.; Chen, L.; Yang, M.; Msigwa, G.; Farghali, M.; Fawzy, S.; Rooney, D.W.; Yap, P.S. Cost, environmental impact, and resilience of renewable energy under a changing climate: A review. Environ. Chem. Lett. 2023, 21, 741–764. [Google Scholar] [CrossRef]
- European Commission. 2040 Climate Target. 2024. Available online: https://climate.ec.europa.eu/eu-action/climate-strategies-targets/2040-climate-target_en (accessed on 8 December 2024).
- United Nations Framework Convention on Climate Change. The Paris Agreement. 2024. Available online: https://unfccc.int/process-and-meetings/the-paris-agreement (accessed on 8 December 2024).
- European Commission. Proposal for a Regulation of the European Parliament and of the Council on Methane Emissions Reduction in the Energy Sector and Amending Regulation (EU) 2019/942; COM(2021) 805 final; European Commission: Brussels, Belgium, 2021. [Google Scholar]
- The European Parliament and the Council of the European Union. Regulation (EU) 2024/1787 of the European Parliament and of the Council of 13 June 2024 on the Reduction of Methane Emissions in the Energy Sector and Amending Regulation (EU) 2019/942 (Text with EEA Relevance); European Union: Brussels, Belgium, 2024. [Google Scholar]
- Eurostat. Net Electricity Generation by Type of Fuel. 2024. Available online: https://ec.europa.eu/eurostat/databrowser/view/NRG_CB_PEM__custom_5180368/default/table?lang=en (accessed on 8 December 2024).
- European Council. How Is EU Electricity Produced and Sold? 2024. Available online: https://www.consilium.europa.eu/en/infographics/how-is-eu-electricity-produced-and-sold/?utm_source=chatgpt.com (accessed on 8 December 2024).
- Halttunen, K.; Staffell, I.; Slade, R.; Green, R.; Saint-Drenan, Y.-M.; Jansen, M. Global Assessment of the Merit-Order Effect and Revenue Cannibalisation for Variable Renewable Energy. SSRN Electron. J. 2020. [Google Scholar] [CrossRef]
- Sensfuß, F.; Ragwitz, M.; Genoese, M. The merit-order effect: A detailed analysis of the price effect of renewable electricity generation on spot market prices in Germany. Energy Policy 2008, 36, 3086–3094. [Google Scholar] [CrossRef]
- Bloomberg New Energy Finance. Emission Performance Standards. Impacts of Power Plant CO2 Emission Performance Standards in the Context of the European Carbon Market; Bloomberg New Energy Finance: New York, NY, USA, 2011. [Google Scholar]
- Ampudia, M.; Bua, G.; Kapp, D.; Salakhova, D. The Role of Speculation During the Recent Increase in EU Emissions Allowance Prices. Issue 3. 2022. Available online: https://www.ecb.europa.eu/press/economic-bulletin/focus/2022/html/ecb.ebbox202203_06~ca1e9ea13e.en.html?utm_source=chatgpt.com (accessed on 8 December 2024).
- International Energy Agency. World Energy Investment 2024. 2024. Available online: https://www.iea.org/reports/world-energy-investment-2024 (accessed on 8 December 2024).
- United Nations Economic Commission for Europe. Carbon Neutrality in the UNECE Region: Integrated Life-Cycle Assessment of Electricity Sources. 2022. Available online: https://www.un-ilibrary.org/content/books/9789210014854 (accessed on 8 December 2024).
- Gonzalez-Salazar, M.A.; Kirsten, T.; Prchlik, L. Review of the operational flexibility and emissions of gas- and coal-fired power plants in a future with growing renewables. Renew. Sustain. Energy Rev. 2018, 82, 1497–1513. [Google Scholar] [CrossRef]
- European Commission. Communication from the Commission to the European Parliament, the European Council, the Council, the European Economic and Social Committee and the Committee of the Regions; COM/2019/640 final; The European Green Deal: Brussels, Belgium, 2019. [Google Scholar]
- European Commission. The European Green Deal. A Growth Strategy That Protects the Climate. 2024. Available online: https://ec.europa.eu/stories/european-green-deal/ (accessed on 8 December 2024).
- European Commission. Methane Emissions. 2024. Available online: https://energy.ec.europa.eu/topics/carbon-management-and-fossil-fuels/methane-emissions_en (accessed on 8 December 2024).
- Intergovernmental Panel on Climate Change. Global Warming Potential Values. 2024. Available online: https://ghgprotocol.org/sites/default/files/ghgp/Global-Warming-Potential-Values%20(Feb%2016%202016).pdf (accessed on 8 December 2024).
- Intergovernmental Panel on Climate Change. Climate Change 2013. The Physical Science Basis. In Working Group I Contribution to the Fifth Assessment Report of the Intergovernmental Panel on Climate Change; Cambridge University Press: Cambridge, UK; New York, NY, USA, 2013; Available online: https://www.ipcc.ch/report/ar5/wg1/ (accessed on 8 December 2024).
- Macuda, J.; Baran, P.; Wagner, M. Evaluation of the Presence of Methane in Złoczew Lignite: Comparison with Other Lignite Deposits in Poland. Nat. Resour. Res. 2020, 29, 3841–3856. [Google Scholar] [CrossRef]
- United States Environmental Protection Agency. Sources of Coal Mine Methane. 2024. Available online: https://www.epa.gov/cmop/sources-coal-mine-methane (accessed on 8 December 2024).
- Swolkień, J. Polish underground coal mines as point sources of methane emission to the atmosphere. Int. J. Greenh. Gas Control 2020, 94, 102921. [Google Scholar] [CrossRef]
- Kholod, N.; Evans, M.; Pilcher, R.C.; Roshchanka, V.; Ruiz, F.; Coté, M.; Collings, R. Global methane emissions from coal mining to continue growing even with declining coal production. J. Clean. Prod. 2020, 256, 120489. [Google Scholar] [CrossRef]
- Dreger, M.; Kędzior, S. Methane emissions against the background of natural and mining conditions in the Budryk and Pniówek mines in the Upper Silesian Coal Basin (Poland). Environ. Earth Sci. 2021, 80, 746. [Google Scholar] [CrossRef]
- Karacan, C.Ö.; Ruiz, F.A.; Cotè, M.; Phipps, S. Coal mine methane: A review of capture and utilization practices with benefits to mining safety and to greenhouse gas reduction. Int. J. Coal Geol. 2011, 86, 121–156. [Google Scholar] [CrossRef]
- Tutak, M.; Brodny, J. Forecasting methane emissions from hard coal mines including the methane drainage process. Energies 2019, 12, 3840. [Google Scholar] [CrossRef]
- Euracoal. Coal and Lignite Production and Imports in Europe. 2024. Available online: https://euracoal.eu/info/euracoal-eu-statistics/ (accessed on 8 December 2024).
- United Nations Framework Convention on Climate Change. Greenhouse Gas Inventory Data—Comparison by Category. 2024. Available online: https://di.unfccc.int/comparison_by_category (accessed on 8 December 2024).
- European Commission. Emissions Monitoring & Reporting. 2024. Available online: https://climate.ec.europa.eu/eu-action/international-action-climate-change/emissions-monitoring-reporting_en (accessed on 8 December 2024).
- The Coal Hub. European Coal Imports Declined Sharply in 2023. 2024. Available online: https://thecoalhub.com/european-coal-imports-declined-sharply-in-2023.html (accessed on 8 December 2024).
- Global Methane Tracker. Strategies to Reduce Emissions from Coal Supply. 2023. Available online: https://www.iea.org/reports/global-methane-tracker-2023/strategies-to-reduce-emissions-from-coal-supply (accessed on 8 December 2024).
- Olczak, M.; Piebalgs, A.; Balcombe, P. Methane regulation in the EU: Stakeholder perspectives on MRV and emissions reductions. Environ. Sci. Policy 2022, 137, 314–322. [Google Scholar] [CrossRef]
- Zięba, M.; Skiba, J.; Kalisz, P.; Kościarz, R.; Smoliński, A. Coal mines in light of the provisions of the proposed Regulation of the European Parliament and of the Council on the reduction of methane emissions in the energy sector, amending Regulation (EU) 2019/942. J. Sustain. Min. 2024, 23, 407–423. [Google Scholar] [CrossRef]
- Haidai, O.; Ruskykh, V.; Ulanova, N.; Prykhodko, V.; Cabana, E.C.; Dychkovskyi, R.; Howaniec, N.; Smolinski, A. Mine field preparation and coal mining in Western Donbas. Energy security of Ukraine—A case study. Energies 2022, 15, 4653. [Google Scholar] [CrossRef]
- Urych, T.; Chećko, J.; Magdziarczyk, M.; Smolinski, A. Numerical Simulations of Carbon Dioxide Storage in Selected Geological Structures in North-Western Poland. Front. Energy Res. 2022, 10, 827794. [Google Scholar] [CrossRef]
- Krauze, E.; Smoliński, A. Analysis and assessment of parameters shaping methane hazard in longwall areas. J. Sustain. Min. 2013, 12, 13–19. [Google Scholar] [CrossRef]


| 2009 | 2010 | 2011 | 2012 | 2013 | 2014 | 2015 | 2016 | 2017 | 2018 | 2019 | 2020 | 2021 | 2022 | 2023 | |
|---|---|---|---|---|---|---|---|---|---|---|---|---|---|---|---|
| Austria | - | - | - | - | - | - | - | - | - | - | - | - | - | - | - |
| Belgium | - | - | - | - | - | - | - | - | - | - | - | - | - | - | - |
| Bulgaria | 26.1 | 27.2 | 34.5 | 31.0 | 26.4 | 32.6 | 35.9 | 31.2 | 34.4 | 30.3 | 28.0 | 22.3 | 28.3 | 35.5 | 21.0 |
| Croatia | / | / | / | / | - | - | - | - | - | - | - | - | - | - | - |
| Cyprus | - | - | - | - | - | - | - | - | - | - | - | - | - | - | - |
| Czechia | 47.5 | 43.8 | 46.6 | 43.5 | 40.5 | 38.2 | 38.1 | 38.5 | 39.3 | 39.2 | 37.5 | 29.5 | 29.3 | 33.4 | 28.7 |
| Denmark | - | - | - | - | - | - | - | - | - | - | - | - | - | - | - |
| Estonia | - | - | - | - | - | - | - | - | - | - | - | - | - | - | - |
| Finland | - | - | - | - | - | - | - | - | - | - | - | - | - | - | - |
| France | - | - | - | - | - | - | - | - | - | - | - | - | - | - | - |
| Germany | 175.3 | 169.4 | 176.5 | 185.4 | 182.7 | 178.2 | 178.1 | 171.5 | 171.3 | 166.3 | 131.3 | 107.4 | 126.3 | 130.8 | 102.3 |
| Greece | 65.6 | 56.5 | 56.8 | 62.8 | 53.8 | 50.6 | 45.4 | 32.6 | 37.7 | 36.5 | 27.3 | 13.9 | 12.1 | 14.3 | 9.7 |
| Hungary | 9.4 | 9.1 | * 11.0 | 9.2 | 9.5 | 9.5 | 9.3 | 9.2 | 8.0 | 7.9 | 6.8 | 6.1 | 5.0 | 4.9 | 4.1 |
| Ireland | - | - | - | - | - | - | - | - | - | - | - | - | - | - | - |
| Italy | - | - | - | - | - | - | - | - | - | - | - | - | - | - | - |
| Latvia | - | - | - | - | - | - | - | - | - | - | - | - | - | - | - |
| Lithuania | - | - | - | - | - | - | - | - | - | - | - | - | - | - | - |
| Luxembourg | - | - | - | - | - | - | - | - | - | - | - | - | - | - | - |
| Malta | - | - | - | - | - | - | - | - | - | - | - | - | - | - | - |
| Netherlands | - | - | - | - | - | - | - | - | - | - | - | - | - | - | - |
| Poland | 59.4 | 56.3 | 62.8 | 64.2 | 65.5 | 63.7 | 63.1 | 60.2 | 61.0 | 58.6 | 50.3 | 46.0 | 52.4 | 54.6 | 40.1 |
| Portugal | - | - | - | - | - | - | - | - | - | - | - | - | - | - | - |
| Romania | 32.6 | 27.0 | 32.0 | 30.2 | 22.9 | 22.0 | 24.0 | 23.0 | 25.7 | 23.5 | 21.7 | 15.0 | 17.7 | 18.2 | 14.8 |
| Slovakia | 2.4 | 2.4 | 2.4 | 2.4 | 2.3 | 2.2 | 1.8 | 1.8 | 1.8 | 1.5 | 1.5 | 1.0 | 1.1 | 0.9 | 0.8 |
| Slovenia | 4.0 | 4.4 | 4.5 | 4.5 | 3.9 | 3.7 | 3.2 | 3.3 | 3.4 | 3.2 | 3.1 | 3.2 | 2.6 | 2.4 | 2.4 |
| Spain | - | - | - | - | - | - | - | - | - | - | - | - | - | - | - |
| Sweden | - | - | - | - | - | - | - | - | - | - | - | - | - | - | - |
| United Kingdom | - | - | - | - | - | - | - | - | - | - | - | / | / | / | / |
| Σ | 422.3 | 396.1 | 427.1 | 433.2 | 407.5 | 400.7 | 398.9 | 371.3 | 382.6 | 367.0 | 307.5 | 244.4 | 274.8 | 295.0 | 223.9 |
| 2009 | 2010 | 2011 | 2012 | 2013 | 2014 | 2015 | 2016 | 2017 | 2018 | 2019 | 2020 | 2021 | 2022 | 2023 | |
|---|---|---|---|---|---|---|---|---|---|---|---|---|---|---|---|
| Austria | - | - | - | - | - | - | - | - | - | - | - | - | - | - | - |
| Belgium | - | - | - | - | - | - | - | - | - | - | - | - | - | - | - |
| Bulgaria | 2.7 | 3.0 | 2.4 | 2.3 | 2.1 | - | - | - | - | - | - | - | - | - | - |
| Croatia | / | / | / | / | - | - | - | - | - | - | - | - | - | - | - |
| Cyprus | - | - | - | - | - | - | - | - | - | - | - | - | - | - | - |
| Czechia | 12.6 | 11.4 | 11.3 | 11.4 | 8.6 | 8.7 | 8.2 | 6.8 | 5.5 | 4.4 | 3.4 | 2.1 | 2.2 | 1.8 | 1.4 |
| Denmark | - | - | - | - | - | - | - | - | - | - | - | - | - | - | - |
| Estonia | - | - | - | - | - | - | - | - | - | - | - | - | - | - | - |
| Finland | - | - | - | - | - | - | - | - | - | - | - | - | - | - | - |
| France | - | - | - | - | 0.3 | 0.3 | - | - | - | - | - | - | - | - | - |
| Germany | 19.1 | 12.9 | 13.0 | 11.6 | 7.5 | 7.6 | 6.7 | 4.1 | 3.9 | 2.8 | - | - | - | - | - |
| Greece | - | - | - | - | - | - | - | - | - | - | - | - | - | - | - |
| Hungary | - | - | - | - | - | - | - | - | - | - | - | - | - | - | - |
| Ireland | - | - | - | * 0.1 | - | - | - | - | - | - | - | - | - | - | - |
| Italy | - | - | - | * 0.1 | <0.1 | <0.1 | - | - | - | - | - | - | - | - | - |
| Latvia | - | - | - | - | - | - | - | - | - | - | - | - | - | - | - |
| Lithuania | - | - | - | - | - | - | - | - | - | - | - | - | - | - | - |
| Luxembourg | - | - | - | - | - | - | - | - | - | - | - | - | - | - | - |
| Malta | - | - | - | - | - | - | - | - | - | - | - | - | - | - | - |
| Netherlands | - | - | - | - | - | - | - | - | - | - | - | - | - | - | - |
| Poland | 83.4 | 76.6 | 75.7 | 78.1 | 76.5 | 72.5 | 72.2 | 70.4 | 65.6 | 63.4 | 61.6 | 54.4 | 55.0 | 52.8 | 48.3 |
| Portugal | - | - | - | - | - | - | - | - | - | - | - | - | - | - | - |
| Romania | 2.7 | 2.2 | 2.2 | 1.9 | 1.8 | 1.5 | 1.3 | - | - | 0.7 | - | - | - | - | - |
| Slovakia | - | - | - | - | - | - | - | - | - | - | - | - | - | - | - |
| Slovenia | - | - | - | - | - | - | - | - | - | - | - | - | - | - | - |
| Spain | 10.3 | 8.4 | 6.6 | 6.1 | 4.4 | 3.9 | 3.0 | 1.7 | 2.8 | 2.5 | - | - | - | - | - |
| Sweden | - | - | - | - | - | - | - | - | - | - | - | - | - | - | - |
| United Kingdom | 17.5 | 18.4 | 18.3 | 16.8 | 12.8 | 11.5 | 8.5 | 4.2 | 3.0 | 2.6 | 2.2 | / | / | / | / |
| Σ | 148.3 | 132.9 | 129.5 | 128.4 | 114.1 | 106.1 | 99.9 | 87.2 | 80.8 | 76.4 | 67.2 | 56.5 | 57.2 | 54.6 | 49.7 |
| 2009 | 2010 | 2011 | 2012 | 2013 | 2014 | 2015 | 2016 | 2017 | 2018 | 2019 | 2020 | 2021 | 2022 | 2023 | |
|---|---|---|---|---|---|---|---|---|---|---|---|---|---|---|---|
| Austria | 4.2 | 3.0 | 3.8 | 3.2 | 2.7 | 3.2 | 3.0 | 3.6 | 3.6 | 3.5 | 3.6 | 2.6 | 2.8 | 2.5 | 2.5 |
| Belgium | 6.0 | 3.0 | 4.0 | 3.5 | 3.3 | 4.4 | 4.2 | 3.7 | 3.6 | 4.1 | 3.9 | 3.0 | 3.5 | 3.2 | 3.2 |
| Bulgaria | 1.3 | 3.5 | 3.3 | 2.3 | 1.7 | 1.6 | 1.1 | 0.7 | 0.9 | 0.8 | 0.6 | 0.5 | 0.8 | 1.3 | 0.5 |
| Croatia | / | / | / | / | 1.2 | 1.0 | 1.0 | 1.2 | 0.6 | 0.5 | 0.7 | 0.6 | 0.7 | 0.6 | 0.6 |
| Cyprus | 0.1 | - | - | - | - | - | - | - | - | - | - | - | - | - | - |
| Czechia | 2.1 | 1.9 | 2.4 | 1.5 | 2.1 | 2.9 | 2.9 | 3.1 | 3.6 | 3.8 | 3.4 | 3.3 | 4.5 | 4.4 | 3.9 |
| Denmark | 7.7 | 4.5 | 6.1 | 4.0 | 5.6 | 4.5 | 2.8 | 2.9 | 3.1 | 2.8 | 2.4 | 1.1 | 0.8 | 1.9 | 1.3 |
| Estonia | 0.1 | 0.1 | * 0.1 | 0.1 | <0.1 | <0.1 | <0.1 | <0.1 | <0.1 | <0.1 | <0.1 | <0.1 | <0.1 | <0.1 | <0.1 |
| Finland | 4.6 | 5.9 | 7.0 | 4.0 | 5.1 | 5.4 | 3.5 | 3.9 | 3.9 | 4.0 | 3.1 | 2.4 | 2.2 | 4.0 | 1.6 |
| France | 21.4 | 18.5 | 15.3 | 17.6 | 18.9 | 14.3 | 14.3 | 13.5 | 15.7 | 13.5 | 10.4 | 7.9 | 8.7 | 7.8 | 6.4 |
| Germany | 41.8 | 45.1 | 42.6 | 43.0 | 50.1 | 53.6 | 55.5 | 53.1 | 47.9 | 44.5 | 40.3 | 29.7 | 38.7 | 42.3 | 30.1 |
| Greece | 0.8 | 0.6 | 0.6 | 0.1 | 0.2 | 0.2 | 0.3 | 0.3 | 0.4 | 0.4 | 0.4 | 0.3 | 0.3 | 0.1 | <0.1 |
| Hungary | 1.9 | 1.8 | * 0.7 | 1.5 | 1.6 | 1.3 | 1.3 | 1.5 | 1.5 | 1.5 | 1.4 | 1.2 | 1.1 | 0.8 | 0.4 |
| Ireland | 2.3 | 1.6 | 1.9 | 2.1 | 1.2 | 1.8 | 2.4 | 1.8 | 1.4 | 1.3 | 0.3 | 0.3 | 1.6 | 1.5 | 0.6 |
| Italy | 26.7 | 22.7 | 24.0 | 25.9 | 22.8 | 20.0 | 19.6 | 17.9 | 15.3 | 14.1 | 10.8 | 7.2 | 7.9 | 11.8 | 7.2 |
| Latvia | 0.1 | 0.1 | * 0.1 | 0.2 | 0.1 | 0.1 | <0.1 | <0.1 | <0.1 | <0.1 | <0.1 | <0.1 | <0.1 | <0.1 | <0.1 |
| Lithuania | 0.3 | 0.3 | * 0.3 | 0.3 | 0.4 | 0.3 | 0.3 | 0.2 | 0.3 | 0.3 | 0.3 | 0.2 | 0.2 | 0.3 | 0.1 |
| Luxembourg | - | - | - | - | - | - | - | - | - | - | - | - | - | - | - |
| Malta | - | - | - | - | - | - | - | - | - | - | - | - | - | - | - |
| Netherlands | 12.8 | 12.8 | 11.7 | 12.4 | 12.4 | 12.4 | 12.4 | 14.5 | 16.2 | 13.0 | 10.3 | 6.0 | 8.7 | 9.0 | 6.5 |
| Poland | 9.4 | 13.4 | 15.5 | 10.1 | 10.8 | 10.3 | 8.2 | 8.3 | 13.4 | 19.7 | 16.7 | 12.8 | 12.6 | 20.2 | 16.9 |
| Portugal | 3.8 | 2.7 | 3.6 | 5.0 | 4.2 | 4.4 | 5.6 | 5.3 | 5.9 | 4.7 | 2.8 | 0.2 | <0.1 | <0.1 | <0.1 |
| Romania | 3.2 | 1.0 | 1.2 | 1.3 | 0.9 | 0.7 | 1.2 | 1.0 | 0.9 | 0.9 | 1.0 | 0.7 | 0.8 | 0.6 | 0.3 |
| Slovakia | 4.9 | 3.4 | 3.4 | 4.0 | 4.7 | 3.8 | 3.7 | 4.0 | 3.8 | 4.4 | 3.4 | 2.4 | 3.2 | 2.9 | 2.8 |
| Slovenia | - | - | 0.5 | 0.5 | 0.8 | 0.4 | 0.4 | 0.4 | 0.4 | 0.4 | 0.4 | 0.3 | 0.2 | 0.4 | 0.3 |
| Spain | 16.5 | 12.8 | 15.3 | 21.4 | 13.1 | 14.7 | 19.0 | 14.7 | 19.2 | 15.8 | 8.5 | 4.0 | 5.3 | 9.9 | 6.8 |
| Sweden | 2.4 | 3.3 | 2.7 | 2.1 | 2.5 | 2.5 | 2.7 | 3.1 | 2.7 | 2.7 | 2.3 | 2.1 | 1.7 | 1.9 | 2.0 |
| United Kingdom | 43.0 | 26.5 | 31.7 | 44.8 | 49.4 | 40.6 | 25.5 | 8.3 | 8.5 | 10.1 | 6.8 | / | / | / | / |
| Σ | 217.4 | 188.5 | 197.8 | 210.9 | 215.9 | 204.5 | 191.1 | 167.2 | 173.0 | 167.0 | 134.0 | 89.0 | 106.6 | 127.7 | 94.3 |
| 2009 | 2010 | 2011 | 2012 | 2013 | 2014 | 2015 | 2016 | 2017 | 2018 | 2019 | 2020 | 2021 | ||||||||||||||
|---|---|---|---|---|---|---|---|---|---|---|---|---|---|---|---|---|---|---|---|---|---|---|---|---|---|---|
| Mining Activities | Post-Mining Activities | Mining Activities | Post-Mining Activities | Mining Activities | Post-Mining Activities | Mining Activities | Post-Mining Activities | Mining Activities | Post-Mining Activities | Mining Activities | Post-Mining Activities | Mining Activities | Post-Mining Activities | Mining Activities | Post-Mining Activities | Mining Activities | Post-Mining Activities | Mining Activities | Post-Mining Activities | Mining Activities | Post-Mining Activities | Mining Activities | Post-Mining Activities | Mining Activities | Post-Mining Activities | |
| Austria | - | - | - | - | - | - | - | - | - | - | - | - | - | - | - | - | - | - | - | - | - | - | - | - | - | - |
| Belgium | - | - | - | - | - | - | - | - | - | - | - | - | - | - | - | - | - | - | - | - | - | - | - | - | - | - |
| Bulgaria | 596.30 | 49.69 | 644.95 | 53.75 | 816.06 | 68.00 | 736.86 | 61.41 | 631.93 | 52.66 | 693.28 | 57.77 | 797.19 | 66.43 | 696.99 | 58.08 | 768.63 | 64.05 | 680.13 | 56.68 | 630.35 | 52.53 | 501.98 | 41.83 | 636.85 | 53.07 |
| Croatia | / | / | / | / | / | / | / | / | - | - | - | - | - | - | - | - | - | - | - | - | - | - | - | - | - | - |
| Cyprus | - | - | - | - | - | - | - | - | - | - | - | - | - | - | - | - | - | - | - | - | - | - | - | - | - | - |
| Czechia | 1681.80 | 84.09 | 1626.75 | 81.34 | 1736.16 | 86.81 | 1621.24 | 81.06 | 1501.81 | 75.09 | 1414.65 | 70.73 | 1412.37 | 70.62 | 1438.07 | 71.90 | 1467.82 | 73.39 | 1459.18 | 72.96 | 1397.47 | 69.87 | 1101.99 | 55.10 | 1098.56 | 54.93 |
| Denmark | - | - | - | - | - | - | - | - | - | - | - | - | - | - | - | - | - | - | - | - | - | - | - | - | - | - |
| Estonia | - | - | - | - | - | - | - | - | - | - | - | - | - | - | - | - | - | - | - | - | - | - | - | - | - | - |
| Finland | - | - | - | - | - | - | - | - | - | - | - | - | - | - | - | - | - | - | - | - | - | - | - | - | - | - |
| France | - | - | - | - | - | - | - | - | - | - | - | - | - | - | - | - | - | - | - | - | - | - | - | - | - | - |
| Germany | 52.32 | - | 52.18 | - | 54.36 | - | 57.11 | - | 56.27 | - | 54.88 | - | 54.84 | - | 52.84 | - | 52.76 | - | 51.21 | - | 40.44 | - | 33.07 | - | 38.89 | - |
| Greece | 1582.61 | - | 1378.41 | - | 1430.75 | - | 1535.37 | - | 1315.10 | - | 1240.01 | - | 1127.85 | - | 795.98 | - | 920.19 | - | 889.89 | - | 667.63 | - | 342.74 | - | 302.36 | - |
| Hungary | - | - | - | - | - | - | - | - | - | - | - | - | 2.21 | 0.21 | 0.29 | 0.03 | 0.31 | 0.03 | 0.81 | 0.08 | 2.37 | 0.23 | 0.59 | 0.06 | 0.10 | 0.01 |
| Ireland | - | - | - | - | - | - | - | - | - | - | - | - | - | - | - | - | - | - | - | - | - | - | - | - | - | - |
| Italy | - | - | - | - | - | - | - | - | - | - | - | - | - | - | - | - | - | - | - | - | - | - | - | - | - | - |
| Latvia | - | - | - | - | - | - | - | - | - | - | - | - | - | - | - | - | - | - | - | - | - | - | - | - | - | - |
| Lithuania | - | - | - | - | - | - | - | - | - | - | - | - | - | - | - | - | - | - | - | - | - | - | - | - | - | - |
| Luxembourg | - | - | - | - | - | - | - | - | - | - | - | - | - | - | - | - | - | - | - | - | - | - | - | - | - | - |
| Malta | - | - | - | - | - | - | - | - | - | - | - | - | - | - | - | - | - | - | - | - | - | - | - | - | - | - |
| Netherlands | - | - | - | - | - | - | - | - | - | - | - | - | - | - | - | - | - | - | - | - | - | - | - | - | - | - |
| Poland | 1285.62 | 107.13 | 1272.15 | 106.01 | 1414.68 | 117.89 | 1447.07 | 120.59 | 1482.39 | 123.53 | 1438.00 | 119.83 | 1421.14 | 118.43 | 1356.26 | 113.02 | 1376.85 | 114.74 | 1318.55 | 109.88 | 1133.00 | 94.42 | 1035.18 | 86.26 | 1178.63 | 98.22 |
| Portugal | - | - | - | - | - | - | - | - | - | - | - | - | - | - | - | - | - | - | - | - | - | - | - | - | - | - |
| Romania | 692.02 | 57.67 | 636.79 | 53.07 | 735.92 | 61.33 | 706.72 | 58.89 | 504.99 | 42.08 | 487.99 | 40.67 | 545.59 | 45.47 | 494.10 | 41.18 | 562.69 | 46.89 | 520.44 | 43.37 | 478.10 | 39.84 | 328.69 | 27.39 | 393.56 | 32.80 |
| Slovakia | - | - | - | - | - | - | - | - | - | - | - | - | - | - | - | - | - | - | - | - | - | - | - | - | - | - |
| Slovenia | - | - | - | - | - | - | - | - | - | - | - | - | - | - | - | - | - | - | - | - | - | - | - | - | - | - |
| Spain | 13.42 | 4.03 | 14.00 | 4.20 | 5.79 | 1.74 | 5.34 | 1.60 | 6.08 | 1.82 | 3.53 | 1.06 | 2.87 | 0.86 | - | - | 9.05 | 2.71 | 5.31 | 1.59 | - | - | - | - | - | - |
| Sweden | - | - | - | - | - | - | - | - | - | - | - | - | - | - | - | - | - | - | - | - | - | - | - | - | - | |
| United Kingdom | 117.18 | - | 123.98 | - | 125.81 | - | 120.50 | - | 102.07 | - | 94.68 | - | 69.14 | - | 49.42 | - | 35.92 | - | 32.80 | - | 29.64 | - | / | / | / | / |
| Σ | 6021.27 | 302.61 | 5749.21 | 298.37 | 6319.53 | 335.77 | 6230.21 | 323.55 | 5600.64 | 295.18 | 5427.02 | 290.06 | 5433.20 | 302.02 | 4883.95 | 284.21 | 5194.22 | 301.81 | 4958.32 | 284.56 | 4379.00 | 256.89 | 3344.24 | 210.64 | 3648.95 | 239.03 |
| Σ | 6323.88 | 6047.58 | 6655.30 | 6553.76 | 5895.82 | 5717.08 | 5735.22 | 5168.16 | 5496.03 | 5242.88 | 4635.89 | 3554.88 | 3887.98 | |||||||||||||
| 2009 | 2010 | 2011 | 2012 | 2013 | 2014 | 2015 | |||||||||||||||
|---|---|---|---|---|---|---|---|---|---|---|---|---|---|---|---|---|---|---|---|---|---|
| Mining Activities | Post-Mining Activities | Abandoned Underground Mines | Mining Activities | Post-Mining Activities | Abandoned Underground Mines | Mining Activities | Post-Mining Activities | Abandoned Underground Mines | Mining Activities | Post-Mining Activities | Abandoned Underground Mines | Mining Activities | Post-Mining Activities | Abandoned Underground Mines | Mining Activities | Post-Mining Activities | Abandoned Underground Mines | Mining Activities | Post-Mining Activities | Abandoned Underground Mines | |
| Austria | - | - | - | - | - | - | - | - | - | - | - | - | - | - | - | - | - | - | - | - | - |
| Belgium | - | - | 51.25 | - | - | 50.56 | - | - | 49.90 | - | - | 49.25 | - | - | 48.70 | - | - | 48.08 | - | - | 47.58 |
| Bulgaria | 235.70 | 32.74 | 159.15 | 251.23 | 34.89 | 146.31 | 294.46 | 40.90 | 135.41 | 232.32 | 32.27 | 126.05 | 185.72 | 25.80 | 117.90 | 159.38 | 22.14 | 110.76 | 150.94 | 20.96 | 143.06 |
| Croatia | / | / | / | / | / | / | / | / | / | / | / | / | - | - | - | - | - | - | - | - | - |
| Cyprus | - | - | - | - | - | - | - | - | - | - | - | - | - | - | - | - | - | - | - | - | - |
| Czechia | 2701.69 | 538.16 | 158.07 | 2777.22 | 559.36 | 123.08 | 2725.43 | 550.32 | 90.14 | 2758.90 | 558.60 | 88.07 | 2109.85 | 423.62 | 86.13 | 2183.71 | 435.16 | 84.44 | 2072.20 | 412.51 | 82.84 |
| Denmark | - | - | - | - | - | - | - | - | - | - | - | - | - | - | - | - | - | - | - | - | - |
| Estonia | - | - | - | - | - | - | - | - | - | - | - | - | - | - | - | - | - | - | - | - | - |
| Finland | - | - | - | - | - | - | - | - | - | - | - | - | - | - | - | - | - | - | - | - | - |
| France | - | - | 39.40 | - | - | 39.40 | - | - | 30.02 | - | - | 13.13 | - | - | 15.01 | - | - | 11.26 | - | - | 11.26 |
| Germany | 3410.91 | 222.02 | 85.52 | 3433.00 | 208.05 | 76.71 | 3234.24 | 194.49 | 85.57 | 4230.01 | 173.70 | 79.78 | 3687.96 | 122.02 | 77.08 | 2872.88 | 123.22 | 74.28 | 3226.21 | 100.36 | 76.29 |
| Greece | - | - | - | - | - | - | - | - | - | - | - | - | - | - | - | - | - | - | - | - | - |
| Hungary | 15.84 | 1.58 | 50.84 | 14.17 | 1.42 | 49.62 | 11.60 | 1.16 | 38.87 | 13.31 | 1.33 | 38.05 | 10.76 | 1.08 | 37.22 | 10.49 | 1.05 | 36.54 | 0.36 | 0.04 | 35.87 |
| Ireland | - | - | 24.26 | - | - | 23.78 | - | - | 23.37 | - | - | 22.96 | - | - | 22.56 | - | - | 22.22 | - | - | 21.88 |
| Italy | 24.31 | 3.38 | - | 34.11 | 4.74 | - | 31.07 | 4.31 | - | 27.01 | 3.75 | - | 24.65 | 3.42 | - | 29.04 | 4.03 | - | 27.35 | 3.80 | - |
| Latvia | - | - | - | - | - | - | - | - | - | - | - | - | - | - | - | - | - | - | - | - | - |
| Lithuania | - | - | - | - | - | - | - | - | - | - | - | - | - | - | - | - | - | - | - | - | - |
| Luxembourg | - | - | - | - | - | - | - | - | - | - | - | - | - | - | - | - | - | - | - | - | - |
| Malta | - | - | - | - | - | - | - | - | - | - | - | - | - | - | - | - | - | - | - | - | - |
| Netherlands | - | - | - | - | - | - | - | - | - | - | - | - | - | - | - | - | - | - | - | - | - |
| Poland | 13,060.71 | 3633.72 | 554.70 | 12,668.63 | 3572.47 | 523.12 | 12,428.50 | 3548.83 | 495.88 | 12,186.50 | 3716.07 | 472.36 | 12,383.48 | 3586.26 | 451.93 | 12,751.17 | 3402.13 | 433.98 | 13,805.48 | 3385.05 | 481.19 |
| Portugal | - | - | 20.65 | - | - | 20.29 | - | - | 19.96 | - | - | 19.64 | - | - | 19.34 | - | - | 19.06 | - | - | 18.80 |
| Romania | 1061.06 | 151.07 | 7611.21 | 930.64 | 133.21 | 7158.26 | 926.88 | 132.35 | 6845.81 | 840.49 | 119.68 | 6587.91 | 762.58 | 107.36 | 6366.11 | 623.85 | 88.55 | 6171.14 | 409.25 | 58.98 | 6202.21 |
| Slovakia | 430.45 | 43.42 | - | 388.12 | 40.14 | - | 414.23 | 40.12 | - | 408.29 | 38.70 | - | 413.62 | 39.72 | - | 389.28 | 36.94 | - | 317.09 | 32.74 | 7.39 |
| Slovenia | 230.09 | 102.25 | 3.38 | 233.60 | 98.85 | 3.19 | 237.01 | 100.78 | 3.02 | 229.11 | 91.94 | 2.86 | 221.54 | 74.65 | 2.72 | 174.93 | 58.31 | 7.49 | 178.30 | 59.43 | 6.52 |
| Spain | 325.96 | 97.79 | 14.36 | 276.62 | 82.99 | 13.90 | 228.67 | 68.60 | 13.49 | 179.23 | 53.77 | 13.11 | 168.38 | 50.51 | 12.78 | 112.48 | 33.74 | 25.18 | 70.87 | 21.26 | 22.14 |
| Sweden | - | - | - | - | - | - | - | - | - | - | - | - | - | - | - | - | - | - | - | - | - |
| United Kingdom | 2220.64 | 243.22 | 484.30 | 1997.89 | 239.04 | 488.67 | 1849.88 | 236.51 | 517.12 | 1922.47 | 199.02 | 507.64 | 1154.71 | 132.25 | 506.50 | 1166.50 | 119.19 | 490.38 | 886.11 | 90.04 | 494.44 |
| Σ | 23,717.36 | 5069.35 | 9257.09 | 23,005.23 | 4975.16 | 8716.89 | 22,381.97 | 4918.37 | 8348.56 | 23,027.64 | 4988.83 | 8020.81 | 21,123.25 | 4566.69 | 7763.98 | 20,473.71 | 4324.46 | 7534.81 | 21,144.16 | 4185.17 | 7651.47 |
| Σ | 38,043.80 | 36,697.28 | 35,648.90 | 36,037.28 | 33,453.92 | 32,332.98 | 32,980.80 | ||||||||||||||
| 2016 | 2017 | 2018 | 2019 | 2020 | 2021 | |||||||||||||
|---|---|---|---|---|---|---|---|---|---|---|---|---|---|---|---|---|---|---|
| Mining Activities | Post-Mining Activities | Abandoned Underground Mines | Mining Activities | Post-Mining Activities | Abandoned Underground Mines | Mining Activities | Post-Mining Activities | Abandoned Underground Mines | Mining Activities | Post-Mining Activities | Abandoned Underground Mines | Mining Activities | Post-Mining Activities | Abandoned Underground Mines | Mining Activities | Post-Mining Activities | Abandoned Underground Mines | |
| Austria | - | - | - | - | - | - | - | - | - | - | - | - | - | - | - | - | - | - |
| Belgium | - | - | 47.07 | - | - | 46.06 | - | - | 45.59 | - | - | 45.12 | - | - | 44.67 | - | - | 44.22 |
| Bulgaria | 91.17 | 12.66 | 208.55 | 45.38 | 6.30 | 289.28 | 17.22 | 2.39 | 253.96 | - | - | 227.84 | - | - | 207.54 | - | - | 191.19 |
| Croatia | - | - | - | - | - | - | - | - | - | - | - | - | - | - | - | - | - | - |
| Cyprus | - | - | - | - | - | - | - | - | - | - | - | - | - | - | - | - | - | - |
| Czechia | 1662.84 | 336.51 | 84.96 | 1336.21 | 269.62 | 92.30 | 1138.70 | 225.20 | 92.30 | 881.17 | 174.49 | 92.30 | 521.35 | 105.52 | 99.64 | 514.01 | 106.01 | 103.31 |
| Denmark | - | - | - | - | - | - | - | - | - | - | - | - | - | - | - | - | - | - |
| Estonia | - | - | - | - | - | - | - | - | - | - | - | - | - | - | - | - | - | - |
| Finland | - | - | - | - | - | - | - | - | - | - | - | - | - | - | - | - | - | - |
| France | - | - | 11.26 | - | - | 11.26 | - | - | 11.26 | - | - | 11.26 | - | - | 11.26 | - | - | 1.31 |
| Germany | 2581.77 | 62.08 | 82.31 | 2593.82 | 59.17 | 74.28 | 1640.21 | 41.67 | 72.27 | - | - | 72.27 | - | - | 70.27 | - | - | 66.25 |
| Greece | - | - | - | - | - | - | - | - | - | - | - | - | - | - | - | - | - | - |
| Hungary | 0.14 | 0.01 | 35.19 | 0.04 | 0.00 | 32.94 | - | - | 32.42 | - | - | 31.89 | - | - | 31.44 | - | - | 30.99 |
| Ireland | - | - | 21.55 | - | - | 20.57 | - | - | 20.29 | - | - | 20.02 | - | - | 19.78 | - | - | 19.54 |
| Italy | - | - | 27.35 | - | - | 14.25 | - | - | 11.17 | - | - | 9.58 | - | - | 8.56 | - | - | 7.84 |
| Latvia | - | - | - | - | - | - | - | - | - | - | - | - | - | - | - | - | - | - |
| Lithuania | - | - | - | - | - | - | - | - | - | - | - | - | - | - | - | - | - | - |
| Luxembourg | - | - | - | - | - | - | - | - | - | - | - | - | - | - | - | - | - | - |
| Malta | - | - | - | - | - | - | - | - | - | - | - | - | - | - | - | - | - | - |
| Netherlands | - | - | - | - | - | - | - | - | - | - | - | - | - | - | - | - | - | - |
| Poland | 13,859.89 | 3301.06 | 513.72 | 13,816.74 | 3071.01 | 538.19 | 13,375.88 | 2972.71 | 599.34 | 11,526.14 | 2890.14 | 599.34 | 11,850.69 | 2550.70 | 599.34 | 11,276.64 | 2579.80 | 599.34 |
| Portugal | - | - | 18.54 | - | - | 17.84 | - | - | 17.62 | - | - | 17.40 | - | - | 17.20 | - | - | 17.00 |
| Romania | 333.98 | 48.38 | 5947.19 | 244.97 | 35.52 | 5781.37 | 165.63 | 24.80 | 5638.76 | 127.55 | 19.45 | 5920.67 | 133.79 | 20.17 | 5607.32 | 64.18 | 11.76 | 5453.09 |
| Slovakia | 303.66 | 31.19 | 12.24 | 260.01 | 30.97 | 13.94 | 205.59 | 25.37 | 23.44 | 227.52 | 24.16 | 19.97 | 161.00 | 16.55 | 19.25 | 172.82 | 18.14 | 21.69 |
| Slovenia | 188.45 | 62.83 | 5.81 | 188.86 | 62.95 | 5.27 | 181.04 | 60.35 | 4.84 | 176.88 | 58.96 | 4.49 | 178.66 | 59.55 | 4.19 | 147.00 | 49.00 | 3.94 |
| Spain | 56.22 | 16.87 | 20.46 | 46.97 | 14.09 | 19.31 | 45.47 | 13.64 | 18.44 | - | - | 17.74 | - | - | 29.85 | - | - | 26.59 |
| Sweden | - | - | - | - | - | - | - | - | - | - | - | - | - | - | - | - | - | - |
| United Kingdom | 8.21 | 0.70 | 501.22 | 7.57 | 0.65 | 494.37 | 9.07 | 0.78 | 476.89 | 37.30 | 3.20 | 469.89 | / | / | / | / | / | / |
| Σ | 19,086.33 | 3872.29 | 7537.42 | 18,540.57 | 3550.28 | 7451.23 | 16,778.81 | 3366.91 | 7318.59 | 12,976.56 | 3170.40 | 7559.78 | 12,845.49 | 2752.49 | 6770.31 | 12,174.65 | 2764.71 | 6586.30 |
| Σ | 30,496.04 | 29,542.08 | 27,464.31 | 23,706.74 | 22,368.29 | 21,525.66 | ||||||||||||
| 2009 | 2010 | 2011 | 2012 | 2013 | 2014 | 2015 | 2016 | 2017 | 2018 | 2019 | 2020 | 2021 | |
|---|---|---|---|---|---|---|---|---|---|---|---|---|---|
| Lignite production [Mt] | 422.3 | 396.1 | 427.1 | 433.2 | 407.5 | 400.7 | 398.9 | 371.3 | 382.6 | 367.0 | 307.5 | 244.4 | 274.8 |
| Methane emissions from mining activities in surface mines [kt CO2 eq.] | 6021.27 | 5749.21 | 6319.53 | 6230.21 | 5600.64 | 5427.02 | 5433.20 | 4883.95 | 5194.22 | 4958.32 | 4379.00 | 3344.24 | 3648.95 |
| Methane emissions from mining activities in surface mines [kt CH4] | 215.05 | 205.33 | 225.70 | 222.51 | 200.02 | 193.82 | 194.04 | 174.43 | 185.51 | 177.08 | 156.39 | 119.44 | 130.32 |
| Ratio of methane emissions from mining activities in surface mines to the amount of lignite production [kt CO2 eq./Mt] | 14.26 | 14.51 | 14.80 | 14.38 | 13.74 | 13.54 | 13.62 | 13.15 | 13.58 | 13.51 | 14.24 | 13.68 | 13.28 |
| Ratio of methane emissions from mining activities in surface mines to the amount of lignite production [kt CH4/Mt] | 0.51 | 0.52 | 0.53 | 0.51 | 0.49 | 0.48 | 0.49 | 0.47 | 0.48 | 0.48 | 0.51 | 0.49 | 0.47 |
| 2009 | 2010 | 2011 | 2012 | 2013 | 2014 | 2015 | 2016 | 2017 | 2018 | 2019 | 2020 | 2021 | |
|---|---|---|---|---|---|---|---|---|---|---|---|---|---|
| Hard coal production [Mt] | 148.3 | 132.9 | 129.5 | 128.4 | 114.1 | 106.1 | 99.9 | 87.2 | 80.8 | 76.4 | 67.2 | 56.5 | 57.2 |
| Methane emissions from mining activities in underground mines [kt CO2 eq.] | 23,717.36 | 23,005.23 | 22,381.97 | 23,027.64 | 21,123.25 | 20,473.71 | 21,144.16 | 19,086.33 | 18,540.57 | 16,778.81 | 12,976.56 | 12,845.49 | 12,174.65 |
| Methane emissions from mining activities in underground mines [kt CH4] | 847.05 | 821.62 | 799.36 | 822.42 | 754.40 | 731.20 | 755.15 | 681.65 | 662.16 | 599.24 | 463.45 | 458.77 | 434.81 |
| Ratio of methane emissions from mining activities in underground mines to the amount of hard coal production [kt CO2 eq./Mt] | 159.93 | 173.10 | 172.83 | 179.34 | 185.13 | 192.97 | 211.65 | 218.88 | 229.46 | 219.62 | 193.10 | 227.35 | 212.84 |
| Ratio of methane emissions from mining activities in underground mines to the amount of hard coal production [kt CH4/Mt] | 5.71 | 6.18 | 6.17 | 6.41 | 6.61 | 6.89 | 7.56 | 7.82 | 8.20 | 7.84 | 6.90 | 8.12 | 7.60 |
| Lignite Production | Quantities of Methane Emissions from Mining Activities in Surface Mines | Hard Coal Production | Quantities of Methane Emissions from Mining Activities in Underground Mines | Coal Imports | Quantities of Methane Emissions from Coal Imports | |
|---|---|---|---|---|---|---|
| [Mt] | [kt CO2 eq.] | [Mt] | [kt CO2 eq.] | [Mt] | [kt CO2 eq.] | |
| Austria | - | - | - | - | 2.8 | ? |
| Belgium | - | - | - | - | 3.5 | ? |
| Bulgaria | 28.3 | 636.85 | - | - | 0.8 | ? |
| Croatia | - | - | - | - | 0.7 | ? |
| Cyprus | - | - | - | - | - | - |
| Czechia | 29.3 | 1098.56 | 2.2 | 514.01 | 4.5 | ? |
| Denmark | - | - | - | - | 0.8 | ? |
| Estonia | - | - | - | - | <0.1 | ? |
| Finland | - | - | - | - | 2.2 | ? |
| France | - | - | - | - | 8.7 | ? |
| Germany | 126.3 | 38.89 | - | - | 38.7 | ? |
| Greece | 12.1 | 302.36 | - | - | 0.3 | ? |
| Hungary | 5.0 | 0.10 | - | - | 1.1 | ? |
| Ireland | - | - | - | - | 1.6 | ? |
| Italy | - | - | - | - | 7.9 | ? |
| Latvia | - | - | - | - | <0.1 | ? |
| Lithuania | - | - | - | - | 0.2 | ? |
| Luxembourg | - | - | - | - | - | - |
| Malta | - | - | - | - | - | - |
| Netherlands | 8.7 | ? | ||||
| Poland | 52.4 | 1178.63 | 55.0 | 11,276.64 | 12.6 | ? |
| Portugal | - | - | - | - | <0.1 | ? |
| Romania | 17.7 | 393.56 | - | 64.18 | 0.8 | ? |
| Slovakia | 1.1 | - | - | 172.82 | 3.2 | ? |
| Slovenia | 2.6 | - | - | 147.00 | 0.2 | ? |
| Spain | - | - | - | - | 5.3 | ? |
| Sweden | - | - | - | - | 1.7 | ? |
| Σ | 274.8 | 3648.95 | 57.2 | 12174.65 | 106.6 | ? |
Disclaimer/Publisher’s Note: The statements, opinions and data contained in all publications are solely those of the individual author(s) and contributor(s) and not of MDPI and/or the editor(s). MDPI and/or the editor(s) disclaim responsibility for any injury to people or property resulting from any ideas, methods, instructions or products referred to in the content. |
© 2025 by the authors. Licensee MDPI, Basel, Switzerland. This article is an open access article distributed under the terms and conditions of the Creative Commons Attribution (CC BY) license (https://creativecommons.org/licenses/by/4.0/).
Share and Cite
Zięba, M.; Smoliński, A. Methane Emissions from Mining in the European Union. Energies 2025, 18, 791. https://doi.org/10.3390/en18040791
Zięba M, Smoliński A. Methane Emissions from Mining in the European Union. Energies. 2025; 18(4):791. https://doi.org/10.3390/en18040791
Chicago/Turabian StyleZięba, Magdalena, and Adam Smoliński. 2025. "Methane Emissions from Mining in the European Union" Energies 18, no. 4: 791. https://doi.org/10.3390/en18040791
APA StyleZięba, M., & Smoliński, A. (2025). Methane Emissions from Mining in the European Union. Energies, 18(4), 791. https://doi.org/10.3390/en18040791