
Accident Factors Importance Ranking for Intelligent Energy Systems Based on a Novel Data Mining Strategy

Abstract
1. Introduction
- Enhanced text utilization: In this paper, we propose a text-weighted FP-Growth based association rule mining scheme for power accidents that improves the utilisation of text data by incorporating semantic information into the association rule mining process.
- Word vector and classification: The cosine similarity is used to calculate the sub-word weights and quantify the semantic correlation between each word and accident level, thus optimising the classification of accident types and risk levels.
- Mining sparse factors: Sparse factors are introduced to address the challenge that sparse risk factors in power accidents are not easily mined. The experimental results show that this approach improves the identification of uncommon but important risk factors by accurately assessing the importance of accident records.
2. Basic Theory
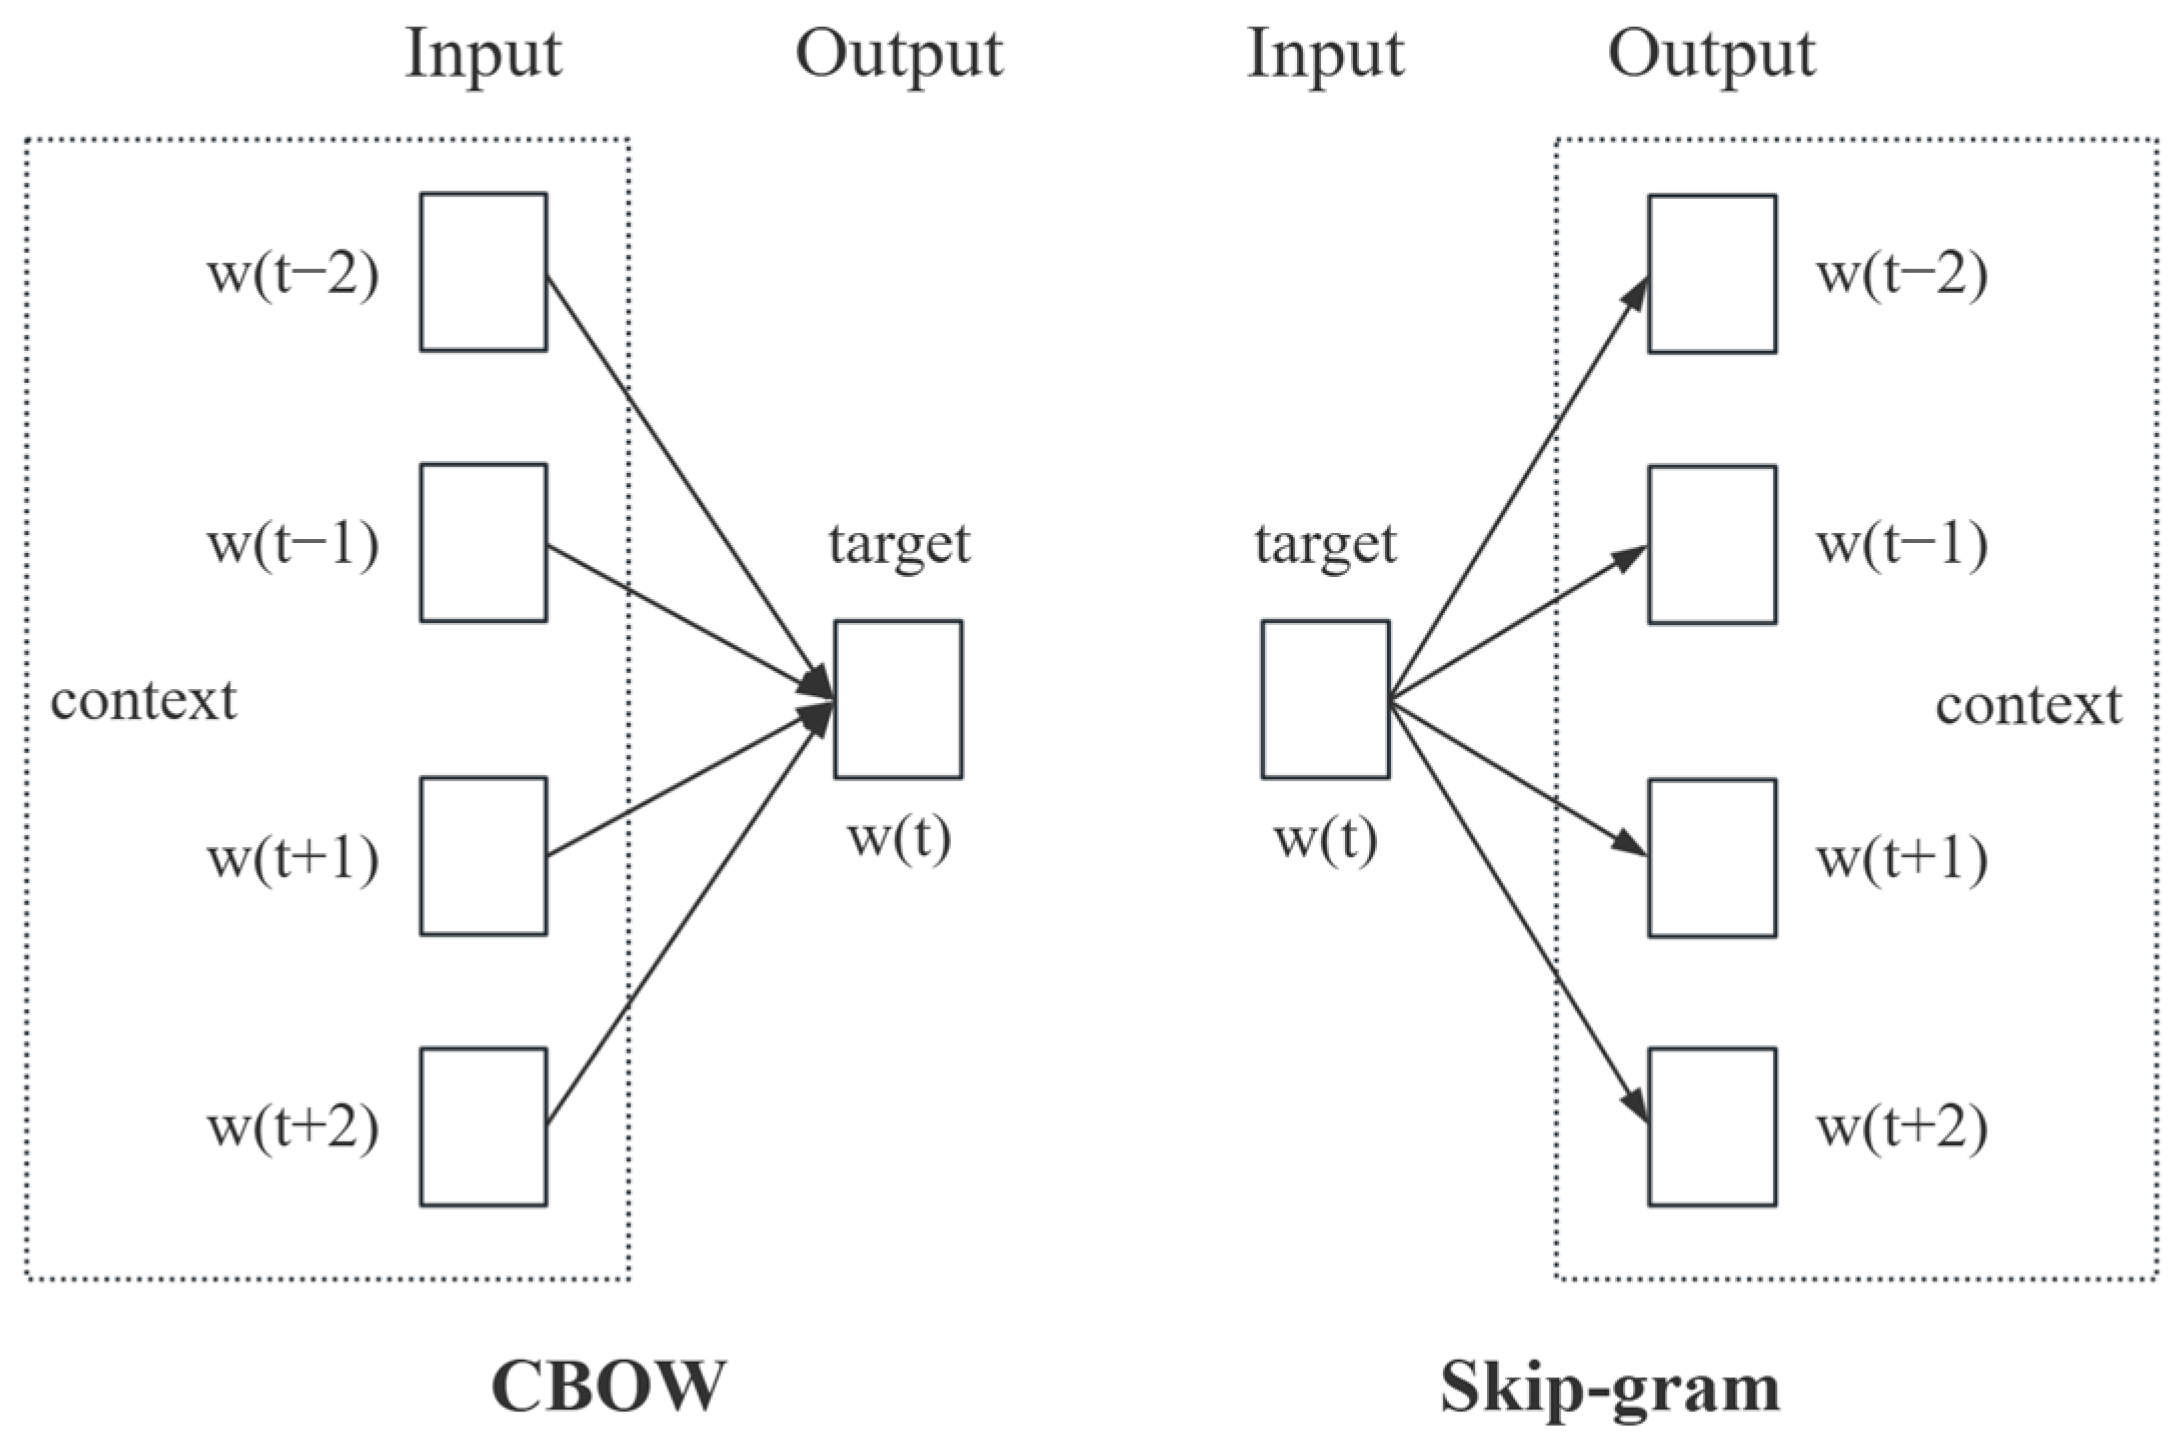
2.1. Word2vec Model
2.2. K-Means Clustering
- (1)
- Initialisation: Four initial centres of mass (centroids) are randomly selected as representatives of each cluster.
- (2)
- Assignment: The Euclidean distance d from each sample point to all centres of mass is computed and the sample point is assigned to the cluster with its closest distance. The Euclidean distance between the sample points and is calculated as follows:
- (3)
- Update: For each cluster, recalculate its centre of mass c (the mean value of all points in the cluster) as follows:where C denotes category, .
- (4)
- Iteration: If there is a change in the centre of mass of the cluster, repeat steps 2 and 3 until the centre of mass no longer changes or the preset maximum number of iterations is reached.
2.3. Cosine Similarity
2.4. FP-Growth
- (1)
- Construct the FP-Tree: Identify all frequent items from each transaction dataset and merge them to form the FP-Tree. In the FP-Tree, each internal node represents a frequent item, and the relationships between nodes reflect the order of item occurrences. The paths of the tree represent transactions with the same prefix. The specific steps are as follows:
- Generate frequent itemset. The original transaction dataset D is scanned for the first time and all items in D are counted. The frequent 1-item set and the frequent item list F-list are filtered according to the minimum support and sorted in descending order.
- Construct the tree structure. The original transaction dataset D is scanned for the second time, the dataset is arranged in the order of the frequent items in the F-list, and the FP-Tree is constructed for compressing and storing the dataset after ordering by frequent items.
- (2)
- Recursively mining FP-Tree: Frequent patterns and corresponding support are generated by scanning the FP-Tree, followed by mining association rules that satisfy the minimum confidence threshold. The specific method is as follows:
3. FP-Growth Algorithm Based on a Text-Weighted Method
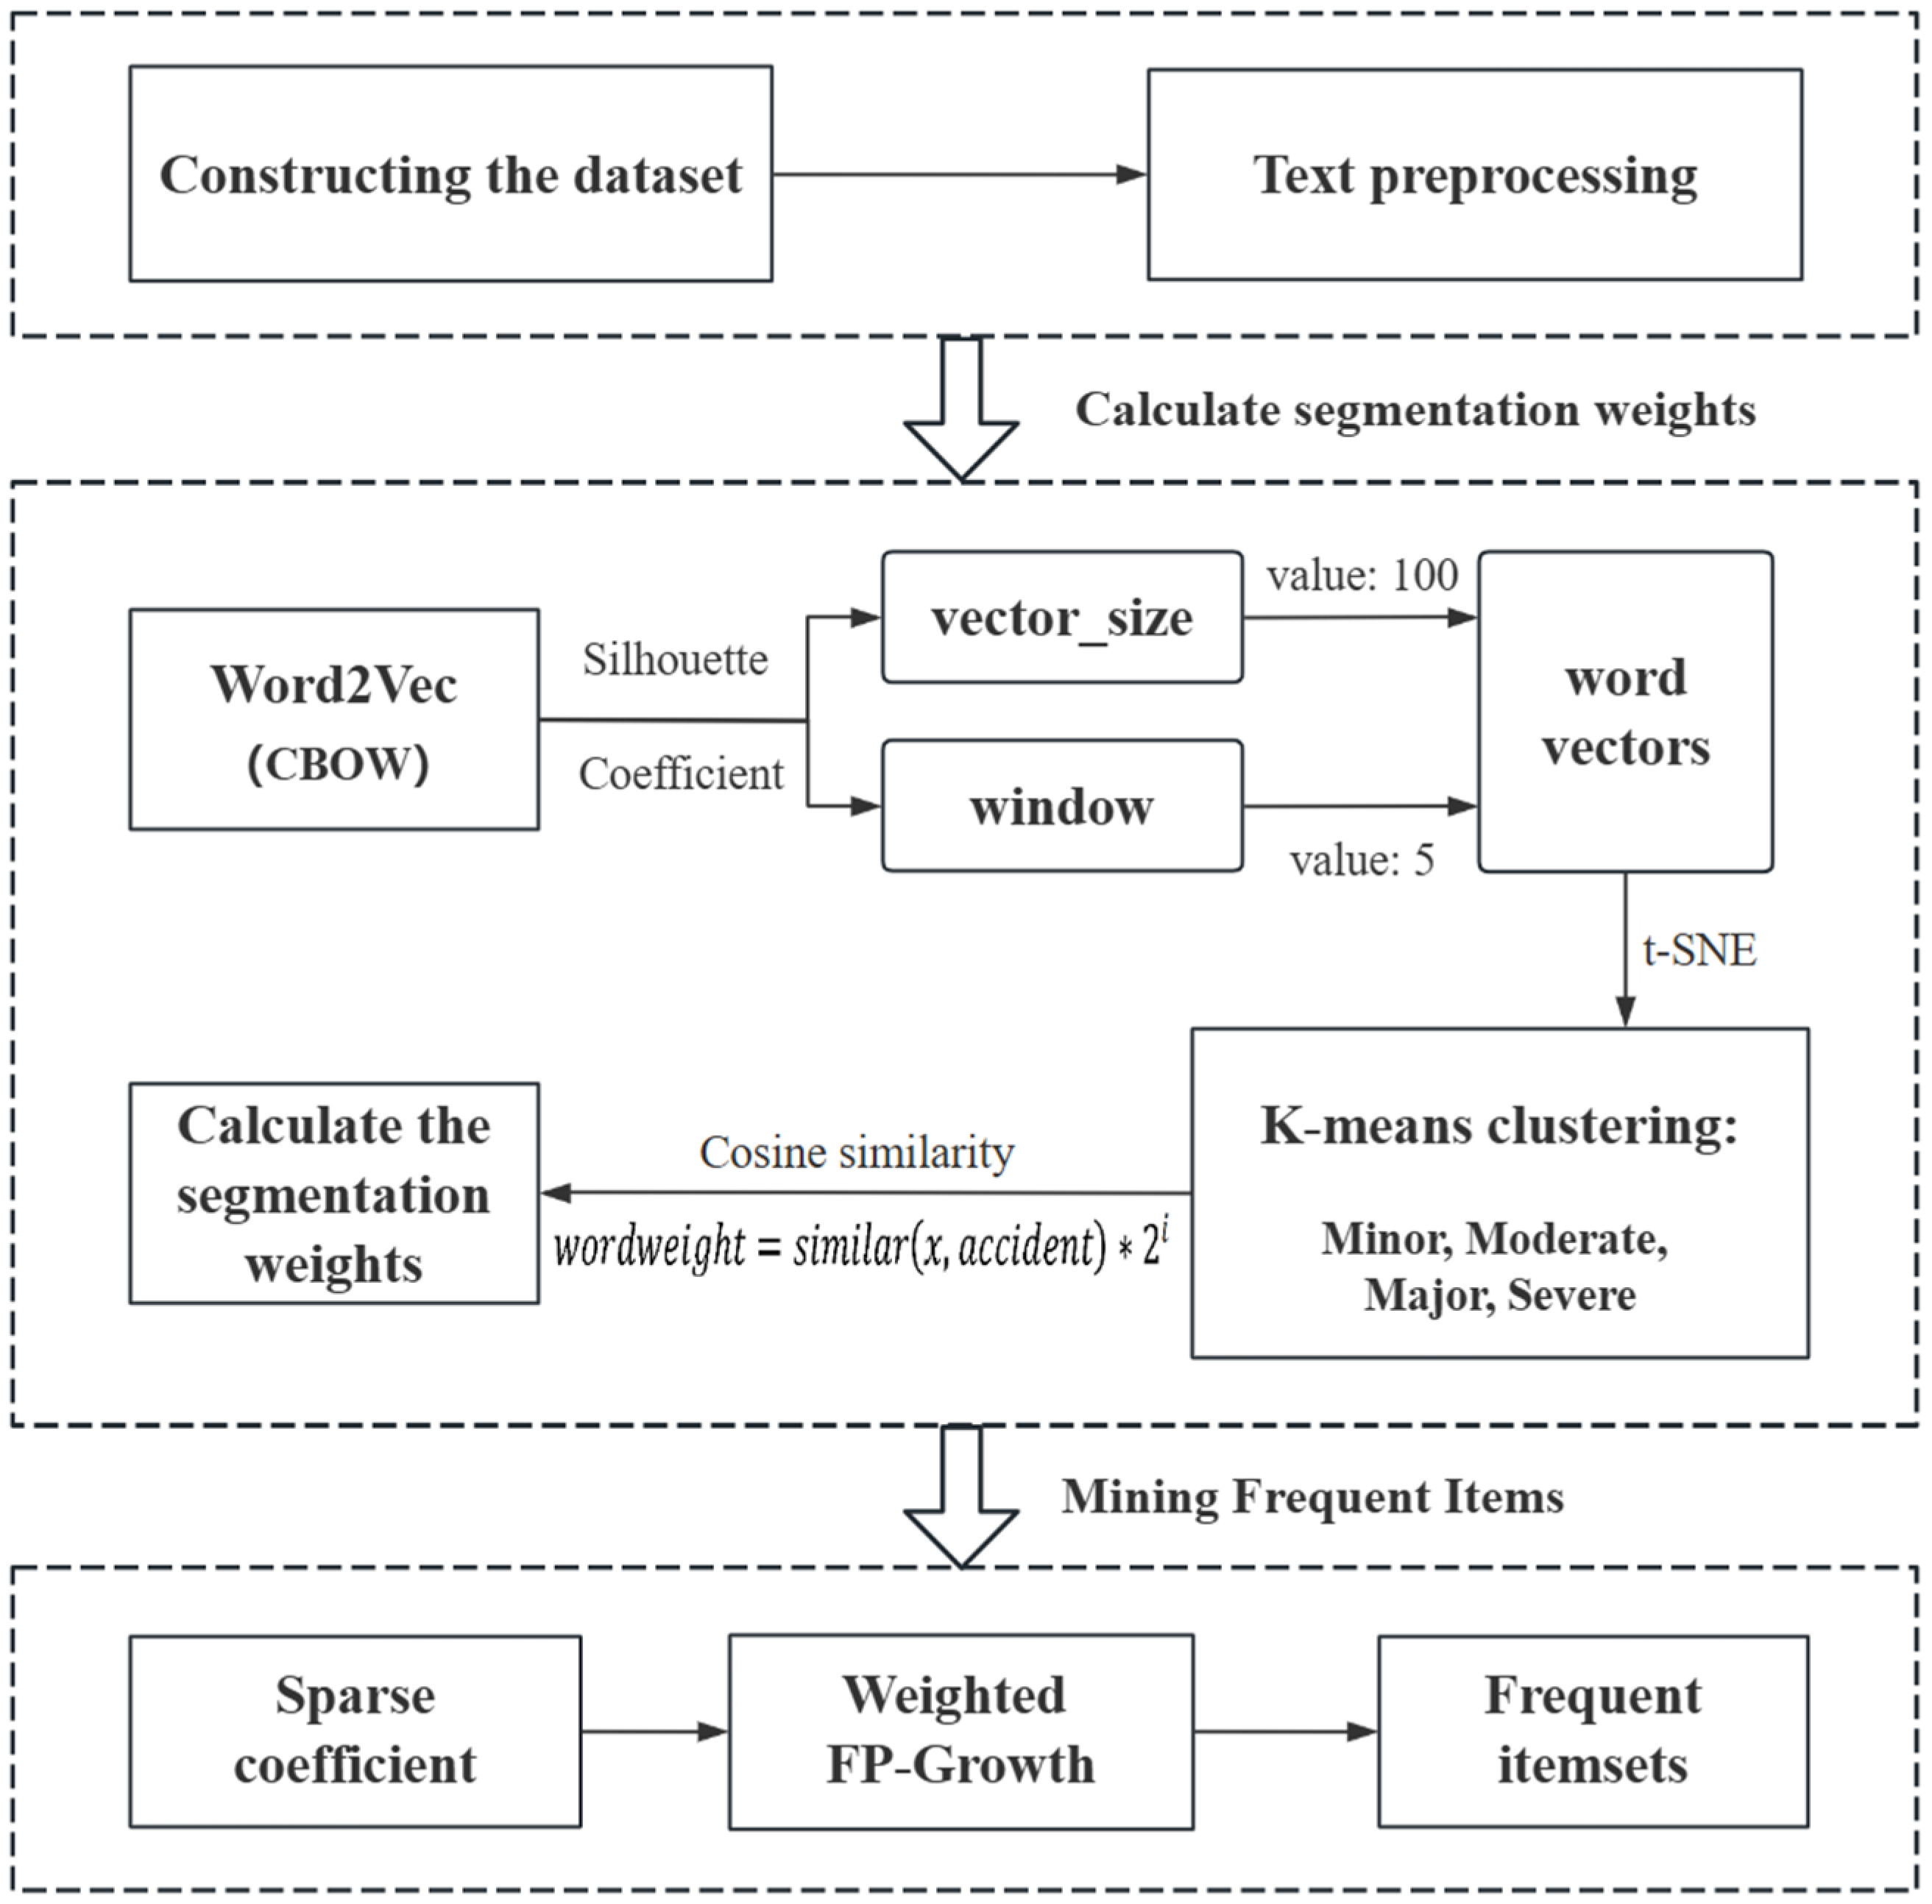
3.1. Design and Calculation of Word Segmentation Weights
3.1.1. Text Preprocessing
3.1.2. Design and Calculation of Weights
3.2. Text-Weighted FP-Growth Algorithm
3.2.1. Sparse Coefficients
3.2.2. Definition of the Weighted FP-Growth Algorithm
| Algorithm 1 Weighted FP-Growth Algorithm |
| Inputs: incident record set R, minimum weight support thresholds |
| Output: frequent item set FIS |
| 1. FP-Growth (R. ϵ) |
| 2. Construct header tableTable: scan R, compute and construct header table in descending order |
| 3. Construct FP-tree: scan R and initialise the root node of the tree as an empty node, i.e., |
| 4. While(): |
| 5. The the feature items in from Root into the FP tree in sorted order |
| 6. If(): Merge node weights together; |
| 7. else: create new node, add node address to Table |
| 8. Iterate over the Table: |
| 9. Constructed The conditional pattern base of the : traverses the indexes the corresponding tree nodes to construct the conditional schema base |
| 10. Recursion: = FP-Growth (, ) |
| 11. Combined: FIS = |
| 12. Return FIS |
3.2.3. Optimisation of Operational Efficiency
4. Experimental Results and Discussions
4.1. Experimental Dataset
4.2. Experiments on Word2Vec-Based Word Vector Generation
4.3. Experiments on the FP-Growth Algorithm Based on Text-Weighting
4.4. Algorithm Running Efficiency Analysis
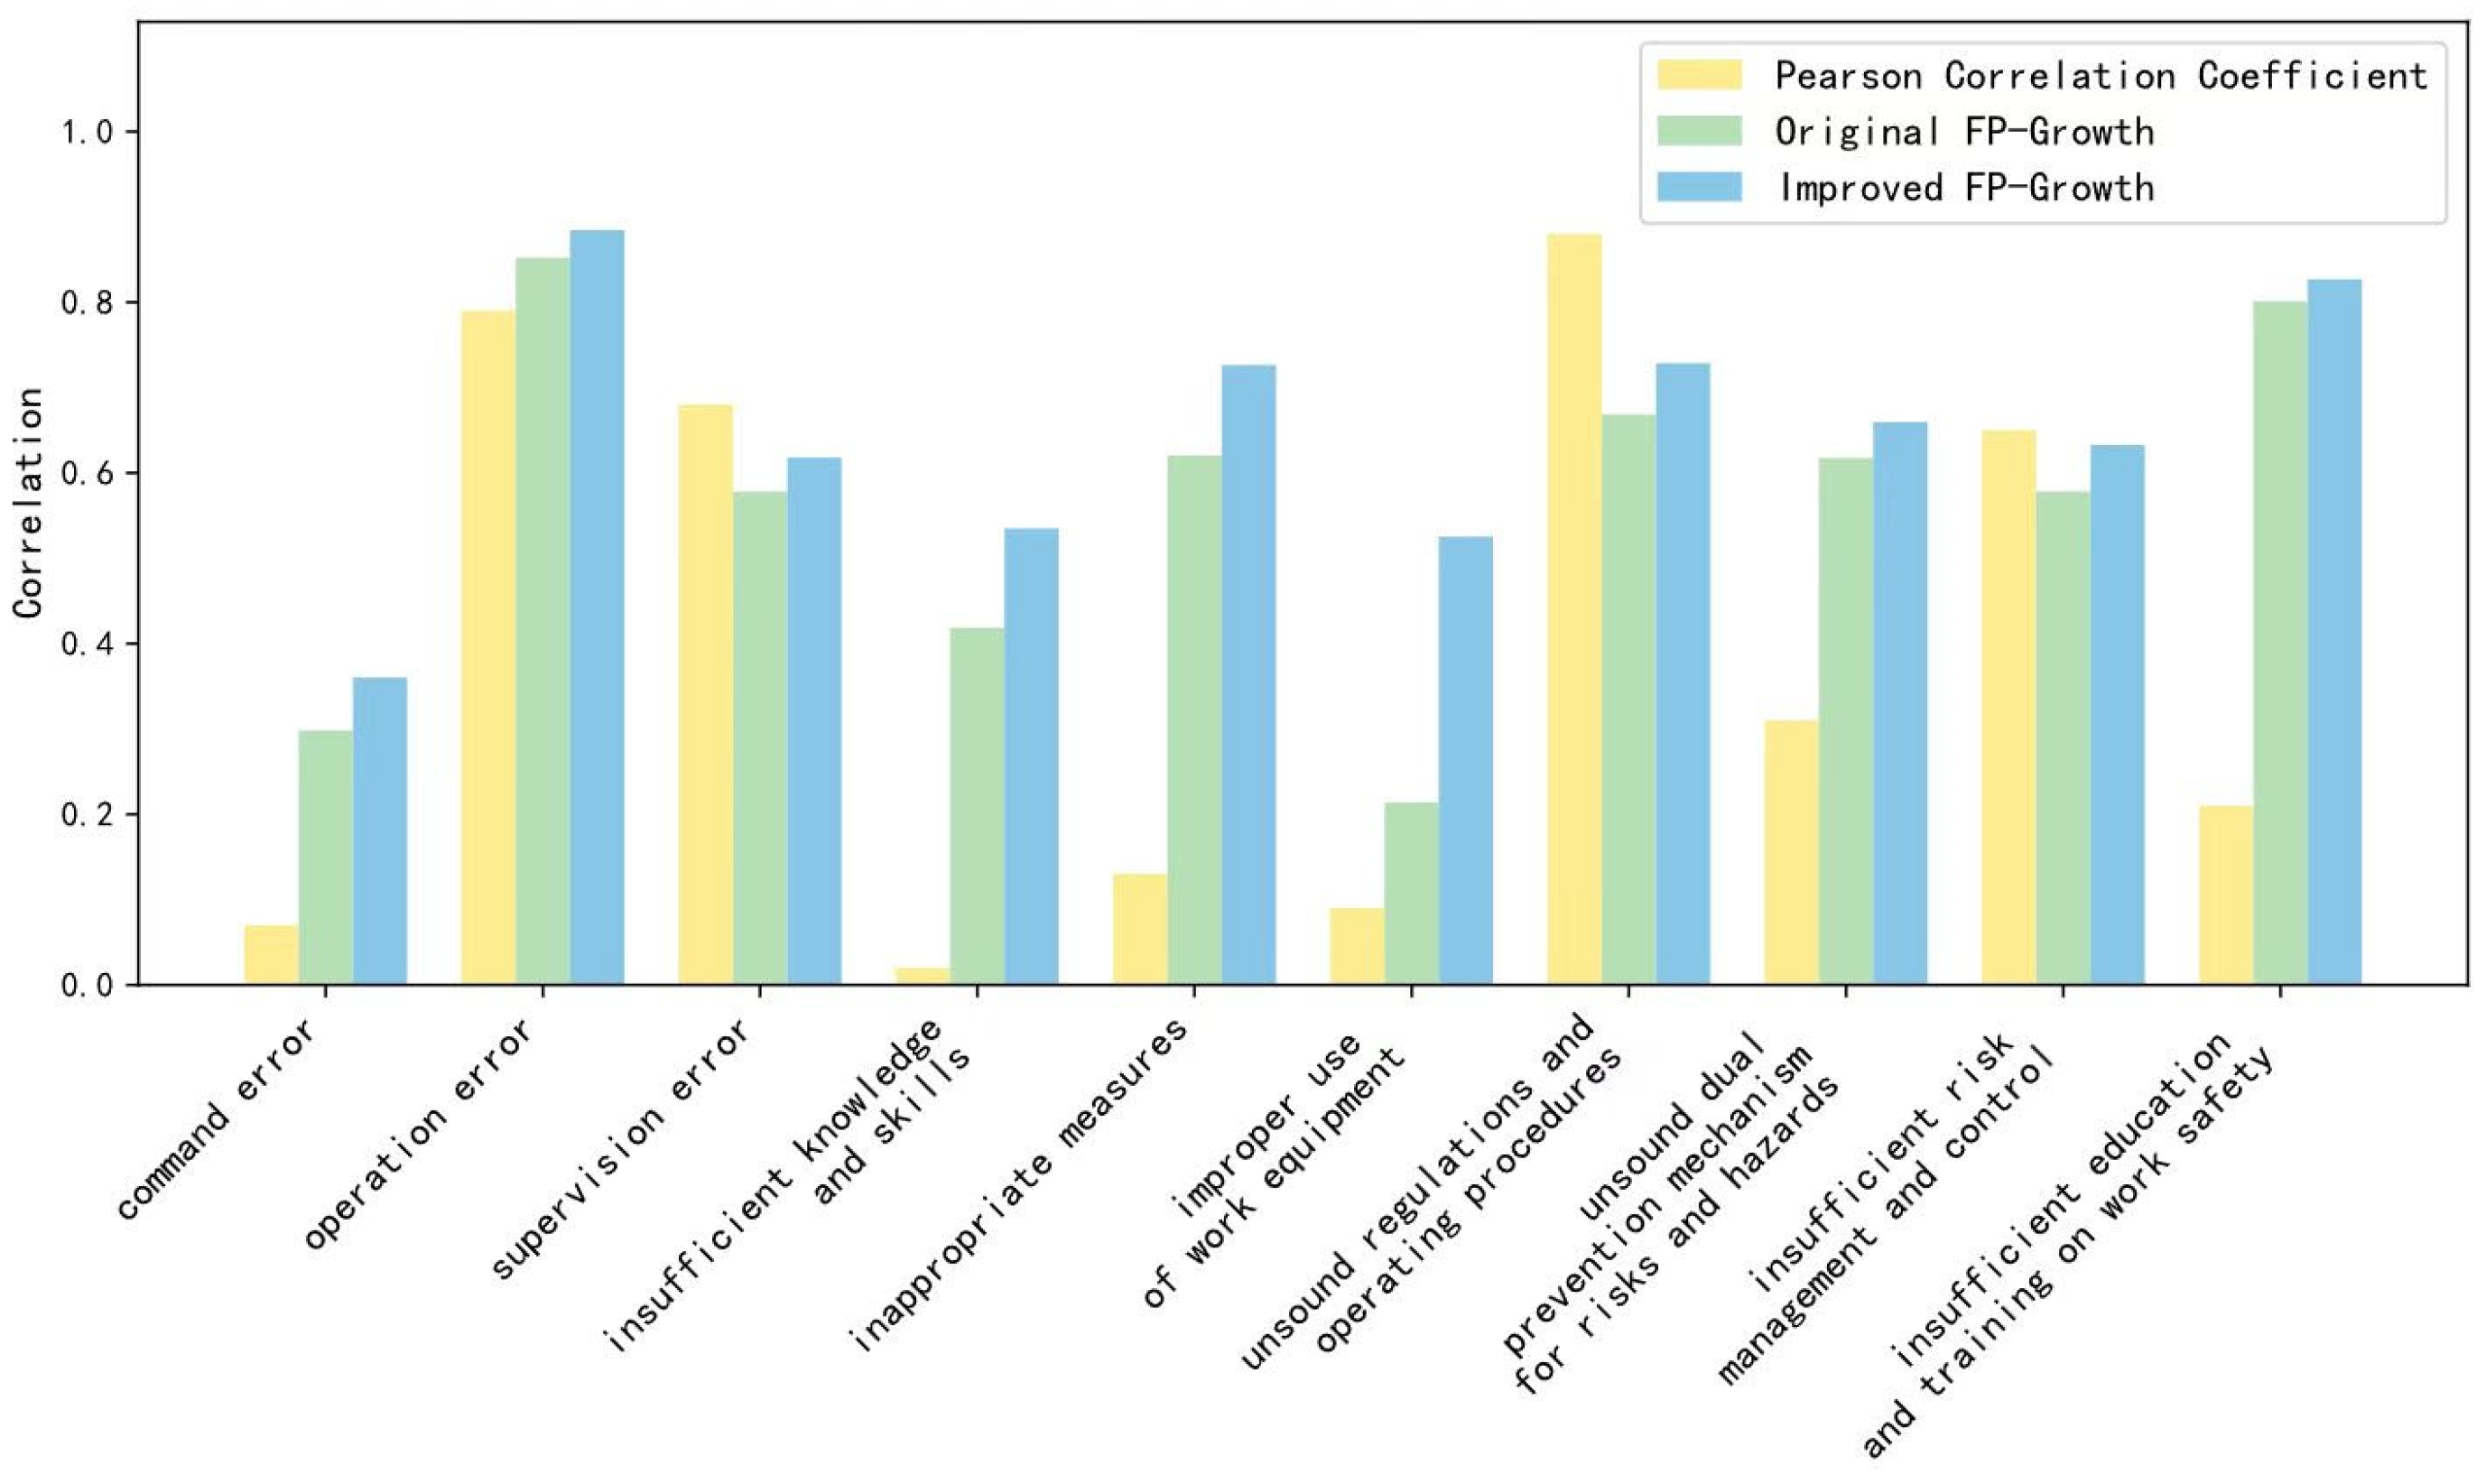
4.5. Analysis of the Correlation Between Accident Risk Levels
4.6. Association Rule Mining Based on the Improved FP-Growth Algorithm
5. Conclusions
Author Contributions
Funding
Data Availability Statement
Conflicts of Interest
References
- Zhang, C.Y. Network-based Infrastructure as Media: Energy, Transportation and Information(ETI) Networks Integration. Glob. J. Media Stud. 2023, 10, 56–70. [Google Scholar] [CrossRef]
- Zhang, K. Research on Key Technologies and Applications of Intelligent Operation and Inspection of Power Grid. Ph.D. Thesis, University of Science and Technology of China, Hefei, China, 2023. [Google Scholar]
- Tang, G.F.; Zhou, J.; Pang, H.; Lin, J.J.; Fan, Z.; Wu, Y.N.; He, Z.Y.; Ma, S.C.; Xue, F.; Zhou, B.R. Strategic Framework for New Electric Power System Development under the Energy Security Pattern. Strateg. Study CAE 2023, 25, 79–88. [Google Scholar]
- Yan, Y.Q.; Zhang, S.; Liang, Z.X.; Sheng, W. Statistics and Analysis of Electric Power Enterprises Personal Accidents in China During 2016–2021. Saf. Secur. 2023, 44, 46–51. [Google Scholar]
- Gholami, A.; Srivastava, A.K. ORCA: Outage Root Cause Analysis in DER-Rich Power Distribution System Using Data Fusion, Hierarchical Clustering and FP-Growth Rule Mining. IEEE Trans. Smart Grid 2024, 15, 667–676. [Google Scholar] [CrossRef]
- Wu, Y.; Du, X.S.; Fu, Y.H. Stable Operation of Power Grid Based on Association Rule Mining Method of Energy Big Data. Opt. Optoelectron. Technol. 2022, 20, 139–144. [Google Scholar]
- Wang, X.H.; Liu, X.X.; Zhong, F.C.; Li, Z.L.; Xuan, K.G.; Zhao, Z.L. A Scenario Generation Method for Typical Operations of Power Systems with PV Integration Considering Weather Factors. Sustainability 2023, 15, 15007. [Google Scholar] [CrossRef]
- Zhou, X.; Ma, L.N.; Ma, X.G.; Hao, Q.; Jia, H.Y.; Liu, H.; Bai, W.X.; Zhang, H.Z.; Li, S.J.; Yang, Q.F. Research on text analysis of hidden dangers of coal mine accidents based on link prediction. J. Saf. Sci. Technol. 2024, 20, 26–34. [Google Scholar]
- Shen, J.H.; Liu, S.P.; Zhang, J. Using Text Mining and Bayesian Network to Identify Key Risk Factors for Safety Accidents in Metro Construction. J. Constr. Eng. Manag. 2024, 150, 04024052. [Google Scholar] [CrossRef]
- Liu, J.F.; Ma, H.Z.; Xie, X.L.; Cheng, J. Short Text Classification for Faults Information of Secondary Equipment Based on Convolutional Neural Networks. Energies 2022, 15, 2400. [Google Scholar] [CrossRef]
- Ruan, G.C.; Xie, F.; Tu, S.W. Application Research Based on Word2vec Diversity in Library Recommender System. Libr. J. 2020, 39, 124–132. [Google Scholar]
- Wang, H.W.; Yin, P.; Duan, Z.T.; Li, Y. Research on power marketing data mining and clustering techniques based on Bert and k-meas. In Proceedings of the International Conference on Power Electronics and Artificial Intelligence (PEAI), Xiamen, China, 19 January 2024. [Google Scholar]
- Kasihmuddin, M.S.M.; Jamaludin, S.Z.M.; Mansor, M.A.; Wahab, H.A.; Ghadzi, S.M.S. Supervised Learning Perspective in Logic Mining. Mathematics 2022, 10, 915. [Google Scholar] [CrossRef]
- Gan, W.S.; Lin, J.C.W.; Yu, P.S. A Survey of Utility-Oriented Pattern Mining. IEEE Trans. Knowl. Data Eng. 2021, 33, 1306–1327. [Google Scholar] [CrossRef]
- Diaz-Garcia, J.A.; Ruiz, M.D.; Martin-Bautista, M.J. A survey on the use of association rules mining techniques in textual social media. Artif. Intell. Rev. 2023, 56, 1175–1200. [Google Scholar] [CrossRef] [PubMed]
- Agrawal, R.; Tomasz, I.; Arun, S. Mining association rules between sets of items in large databases. Proc. 1993 ACM SIGMOD Int. Conf. Manag. Data 1993, 22, 207–216. [Google Scholar] [CrossRef]
- Liu, W.W.; Wang, H.W.; Hou, Z.G. Analysis on risk association rules of civil aviation aircraft maintenance based on BL-Apriori. J. Saf. Sci. Technol. 2024, 20, 27–33. [Google Scholar]
- Han, J.; Pei, J. Mining frequent patterns without candidate generation. ACM 2000, 29, 1–12. [Google Scholar]
- Xiao, Y.; Meng, L.H.; Zhang, Y.R.; Gu, Y.T. An Improved FP-Growth Algorithm with Time Decay Factor and Element Attention Weight. In Proceedings of the 2024 IEEE 4th International Conference on Power, Electronics and Computer Applications (ICPECA), Shenyang, China, 5 August 2024. [Google Scholar]
- Yu, J.B.; Ma, X.Y.; Zhao, Z.Y. Research on association analysis of food risk factors based on the improved FP-growth algorithm. Food Sci. 2024; in press. [Google Scholar]
- Lei, X.; Cheng, G.; Zhang, Y.J.; Guo, L.; Zhang, F.C. Association analysis of alarm information based on power network situation awareness platform. Comput. Eng. Sci. 2023, 45, 1197–1208. [Google Scholar]
- Wu, D.P.; Hua, G. Text Case Classification of Safety Production Accidents Based on Word2Vec Word Embedding and Clustering Model. Comput. Syst. Appl. 2021, 30, 141–145. [Google Scholar]
- Zhong, G.F.; Pang, X.W.; Sui, D. Text Classification Method Based on Word2Vec and AlexNet-2 with Improve Attention Mechanism. Comput. Sci. 2024, 49, 288–293. [Google Scholar]
- Yan, F.X.; Wang, J.H. Sentiment recognition model of Weibo comments based on SVM and Word2vec. Mod. Comput. 2024, 30, 60–64. [Google Scholar]
- Lv, J.; Qiu, X.L. A noisy label deep learning algorithm based on K-means clustering and feature space augmentation. CAAI Trans. Intell. Syst. 2024, 19, 267–277. [Google Scholar]
- Öztürk, M.M. A cosine similarity-based labeling technique for vulnerability type detection using source codes. Comput. Secur. 2024, 146, 104059. [Google Scholar] [CrossRef]
- Gao, P.; Li, F.; Peng, Y.H.; Zhang, C.H.; Peng, H.J. Accurate Classification Method of Power Customers Based on Jieba Chinese Word Segmentation. Hunan Electr. Power 2023, 43, 151–154. [Google Scholar]
- Yagahara, A.; Uesugi, M.; Yokoi, H. t-SNE Visualization of Vector Pairs of Similar and Dissimilar Definition Sentences Created by Word2vec and Doc2vec in Japanese Medical Device Adverse Event Terminology. Stud. Health Technol. Inform. 2022, 290, 1058–1059. [Google Scholar] [PubMed]
- Li, Y.H.; Hu, L.; Gao, W.F. Multi-Label Feature Selection Based on Sparse Coefficient Matrix Reconstruction. Chin. J. Comput. 2022, 45, 1827–1841. [Google Scholar]
- Li, N.; Yang, F.; Wu, H.B.; Zhang, Y.X.; Yin, L. Study on the correlation between dual-control policies on energy consumption and energy use efficiency in energy-consuming industries. High Volt. Eng. 2023, 49, 215–220. [Google Scholar]


| Description of the Incident | Extractable Feature Text |
|---|---|
|
|
| Vector_Size | 60 | 70 | 80 | 90 | 100 | 110 | 120 | |
|---|---|---|---|---|---|---|---|---|
| Window | ||||||||
| 3 | F | F | F | F | F | F | F | |
| 5 | F | F | F | T | T | F | F | |
| 7 | F | F | F | F | F | F | F | |
| 9 | F | F | F | F | F | F | F | |
| Antecedent | Consequent | Confidence |
|---|---|---|
| Insufficient knowledge and skills | moderate accident | 0.90 |
| Unsound dual prevention mechanism for risks and hazards | moderate accident | 0.89 |
| Improper use of work equipment | moderate accident | 0.89 |
Disclaimer/Publisher’s Note: The statements, opinions and data contained in all publications are solely those of the individual author(s) and contributor(s) and not of MDPI and/or the editor(s). MDPI and/or the editor(s) disclaim responsibility for any injury to people or property resulting from any ideas, methods, instructions or products referred to in the content. |
© 2025 by the authors. Licensee MDPI, Basel, Switzerland. This article is an open access article distributed under the terms and conditions of the Creative Commons Attribution (CC BY) license (https://creativecommons.org/licenses/by/4.0/).
Share and Cite
Li, R.; Zhang, J.; Deng, F. Accident Factors Importance Ranking for Intelligent Energy Systems Based on a Novel Data Mining Strategy. Energies 2025, 18, 716. https://doi.org/10.3390/en18030716
Li R, Zhang J, Deng F. Accident Factors Importance Ranking for Intelligent Energy Systems Based on a Novel Data Mining Strategy. Energies. 2025; 18(3):716. https://doi.org/10.3390/en18030716
Chicago/Turabian StyleLi, Rongbin, Jian Zhang, and Fangming Deng. 2025. "Accident Factors Importance Ranking for Intelligent Energy Systems Based on a Novel Data Mining Strategy" Energies 18, no. 3: 716. https://doi.org/10.3390/en18030716
APA StyleLi, R., Zhang, J., & Deng, F. (2025). Accident Factors Importance Ranking for Intelligent Energy Systems Based on a Novel Data Mining Strategy. Energies, 18(3), 716. https://doi.org/10.3390/en18030716