Abstract
The oil content of shale oil reservoirs is a key parameter for reserve evaluation and “sweet spot” selection. However, discrepancies in the oil contents obtained by different methods have led to considerable disparities in the selection of exploration well locations and development strategies for shale oil. This study focuses on low to moderately mature sealed coring samples from the Dongying Depression in the Bohai Bay Basin. Three methods—NMR, Dean–Stark, and Rock-Eval—were employed to measure the oil content of shale. The results indicate that the oil content obtained by NMR is the highest, followed by the Dean–Stark distillation extraction method, while the pyrolysis method yields the lowest value. The study found that (1) the efficiency of the solvent extraction effect on moderately to low-mature shale is low since the occurrence of numerous closed pores leads to a lower yield when using the Dean–Stark method. (2) The exposure of shale samples to the air, sample crushing, and lag time for temperature increase cause a significant loss of light hydrocarbon components, resulting in the lowest oil content when measured by the Rock-Eval method. The NMR method, with its advantages of a short analysis time and non-destructive nature, appears to be the most advantageous method for shale oil content evaluation.
1. Introduction
Oil and gas resources are of great significance to global development. Currently, the exploration and extraction of conventional oil and gas have reached an impasse, while shale oil is the most promising alternative to sustain stable oil and gas production. The successful exploitation of shale oil and gas in North America has led to a significant increase in shale oil and gas exploration globally. According to the U.S. Energy Information Administration [1], China’s technically recoverable shale oil resources are estimated to be approximately 32.2 billion barrels (equivalent to 4.5 billion tons), indicating a significant potential for exploration and development. Since 2010, China has vigorously promoted the exploration and development of shale oil, and it has now entered the stage of shale oil reserve assessment [2]. Two main resource types have been developed in onshore basins: medium-low maturity and medium-high maturity shales [3,4,5,6]. Among them, medium-high maturity shale oil is characterized by light oil quality and good mobility, which is a crucial property for stable shale oil production [3]. Medium-low maturity shale oil, on the other hand, is poorer quality, with a higher density (lower gravity), poor fluidity, and a low movable fraction, making it economically unviable for production by fracturing and horizontal wells. However, China’s medium-low maturity shale oil resources have greater potential [7]. Consequently, the evaluation methods for medium-low maturity shale reservoirs are an important element for effective exploitation of shale oil in the future.
The oil content of shale oil reservoirs is a critical parameter for reserve evaluation and “sweet spot” selection. Currently, there are several methods for evaluating shale oil content, including Rock-Eval pyrolysis, NMR, Dean–Stark distillation/extraction, and shale retorting. Pyrolysis offers advantages such as a mature technology, speed, cost-effectiveness, and minimal sample consumption [8]. Pyrolysis can provide measurements of retained hydrocarbons (S1), hydrocarbons released by kerogen pyrolysis (S2), and the maximum pyrolysis peak temperature (Tmax). When coupled with gas chromatography, pyrolysis can further enable the qualitative and quantitative analysis of shale oil pyrolysates. However, due to temperature changes and pressure release during core collection and storage, significant losses of gaseous hydrocarbons (C1–5) and light hydrocarbons (C6–13) occur from shale samples [9]. The extent of these losses is related to the abundance of organic matter, lithofacies, maturity, and the particle size of the crushed sample as well as storage methods [9,10]. Additionally, the S2 (pyrolysis hydrocarbons) obtained from Rock-Eval pyrolysis can include some previously generated liquid hydrocarbons that have larger molecular weights, do not volatilize below 300 °C, and are either retained in pores or adsorbed on organic matter [11]. It is generally believed that the adsorption capacity of shales for heavy hydrocarbons is related to the compositions of the retained organic matter, content of organic matter, and thermal maturity. Several different adsorption correction coefficients and quantitative corrections for the loss of volatile hydrocarbons have been suggested, but there is no commonly accepted method [11,12,13,14].
The Dean–Stark method utilizes organic solvents (such as toluene) to distill fluids from rocks, calculate the volume of condensed water, and then wash and dry the rocks to determine the mass difference before and after oil washing, thereby obtaining the internal oil mass in the rocks [15]. The selection of extraction solvents is crucial to the effectiveness of the distillation extraction method [16]. In recent years, the transition from single solvents to mixed organic solvents has effectively improved the efficiency of distillation extraction. However, this method requires a long time, especially for shales with small pore throat radii and complex pore structures, which limits its widespread application [17]. Additionally, it has been suggested that organic solvents in this method may alter the original pore structure of shales [18].
Nuclear magnetic resonance (NMR) technology, as an emerging technique, has been used for oil content evaluation in shales, primarily involving the quantification of hydrogen-containing components and the conversion relationship between fluid signal intensity and mass [19]. Unfortunately, due to the differences in the organic matter content, mineral composition, and fluid properties of shales, the classification charts in the literature are not universally applicable [20]. In the past, a known volume of water/D2O was commonly used as a standard sample to establish conversion relationships [21]. However, some scholars argue that the calibration fluid should closely resemble the actual fluid composition within the pores, such as using n-dodecane, crude oil, or formation water [22]. However, the study found that the conversion relationship between NMR signals and fluid volume also exhibits significant differences for crude oils of varying maturity and formation waters with different salinity levels. In addition, this method requires that oil and water fluids in shales remain maximally retained in the pores, making it the optimal method for oil content evaluation in sealed core shale samples.
The shale retorting method, with its mature technology, short analysis time, and ability to directly measure oil and water volumes, has advantages. However, if the shales contain a significant amount of kerogen and solid bitumen, organic components may undergo pyrolysis at higher temperatures [23,24]. Conventional logging and nuclear logging techniques are also commonly used for fluid saturation evaluation in reservoirs. However, due to the complex pore and pore throat structures, small pore and pore throat radii, diverse fluid storage states, and strong heterogeneity of shales, the accuracy of logging evaluation methods is limited [25].
As a result, due to the differences in testing principles, sample states, and testing ranges among various methods, there are significant discrepancies among the results of oil content evaluations. The goal of this study is to compare the effectiveness of these methods by analyzing the same set of shale samples, collected through sealed coring, by the NMR, Dean–Stark, and Rock-Eval methods to determine the oil content of the shales. The experimental results are compared and the advantages and disadvantages of different methods are systematically analyzed in order to further optimize the methods for evaluating shale oil content and provide technical support for the assessment of shale oil resources and reserves.
2. Samples and Experiments
2.1. Geological Setting
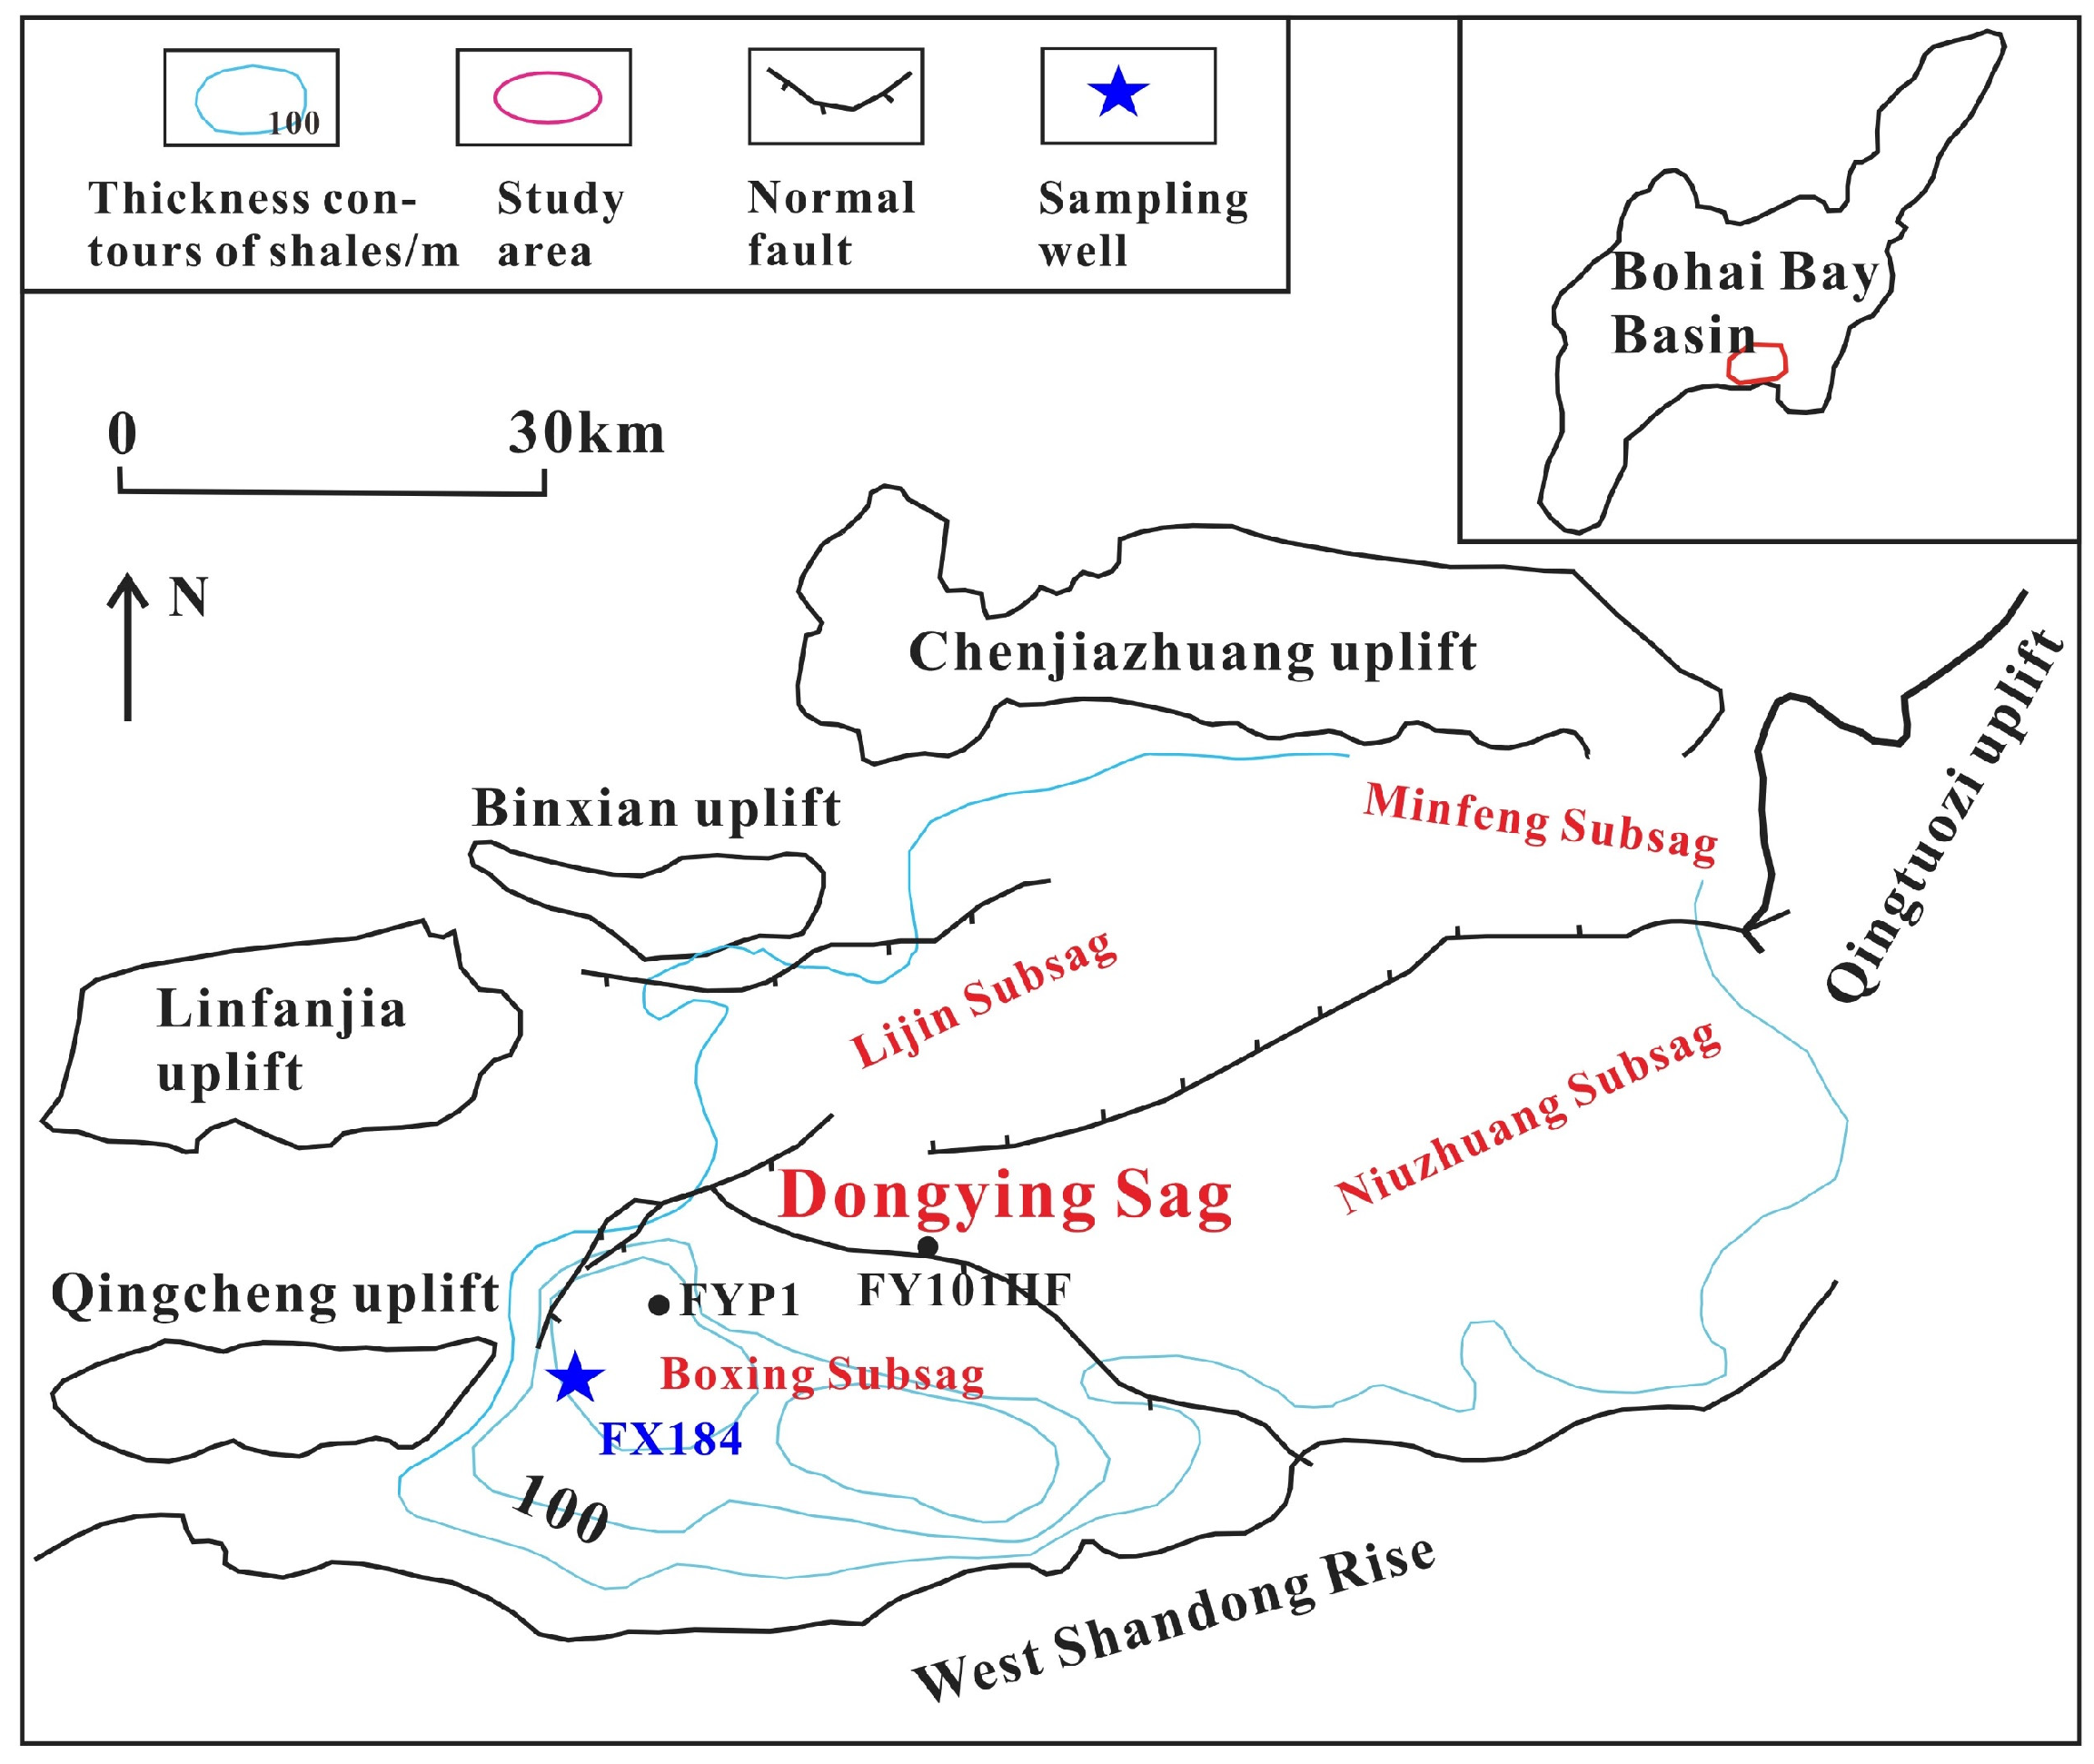
The Dongying Depression is located in the northern part of Shandong Province, situated in the southeastern part of the Jiyang Depression within the Bohai Bay Basin, and is a secondary structural unit of the Jiyang Depression, covering an area of approximately 5700 km2. As shown in Figure 1, it comprises four subordinate structural units: Boxing Subsidence, Niuzhuang Subsidence, Lijin Subsidence, and Minfeng Subsidence. Boxing Subsidence is a secondary subsidence in the southwestern part of Dongying Depression, bounded to the west by the Pingnan-Gaoqing fault, adjacent to the Qingcheng Uplift, bordered to the north and east by the Shicun fault, and with the Boxing fault to the south, presenting a blocky shape within the basin and a triangular planform with an area of about 1320 km2. Boxing Subsidence is a prolific oil-rich subsidence in the southwestern part of Dongying Depression, with complete stratigraphic development and a subsidence zone depth of 2800~4000 m, offering suitable burial conditions. The Paleogene sequence has been drilled from top to bottom as the Dongying Formation, Shahejie Formation, and Kongdian Formation, among which the lower sub-member of the Shahejie Formation (Sha 3) and the upper sub-member of the Shahejie Formation (Sha 4) are primarily composed of organic-rich fine-grained sedimentary rocks, making them a primary interval for shale oil exploration and development in this basin [26,27,28].
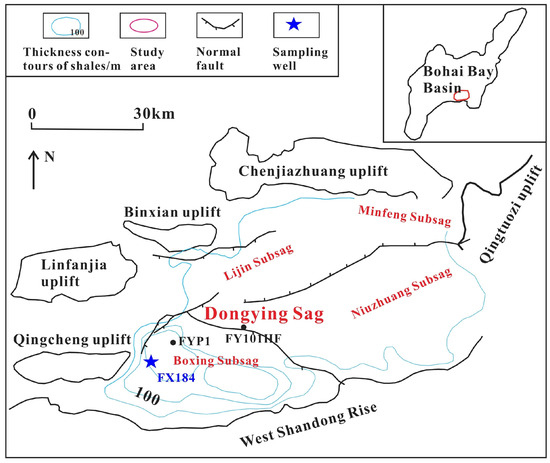
Figure 1.
Geomorphological features of Donying Sag and sampling well locations [29].
2.2. Sample Collection and Processing
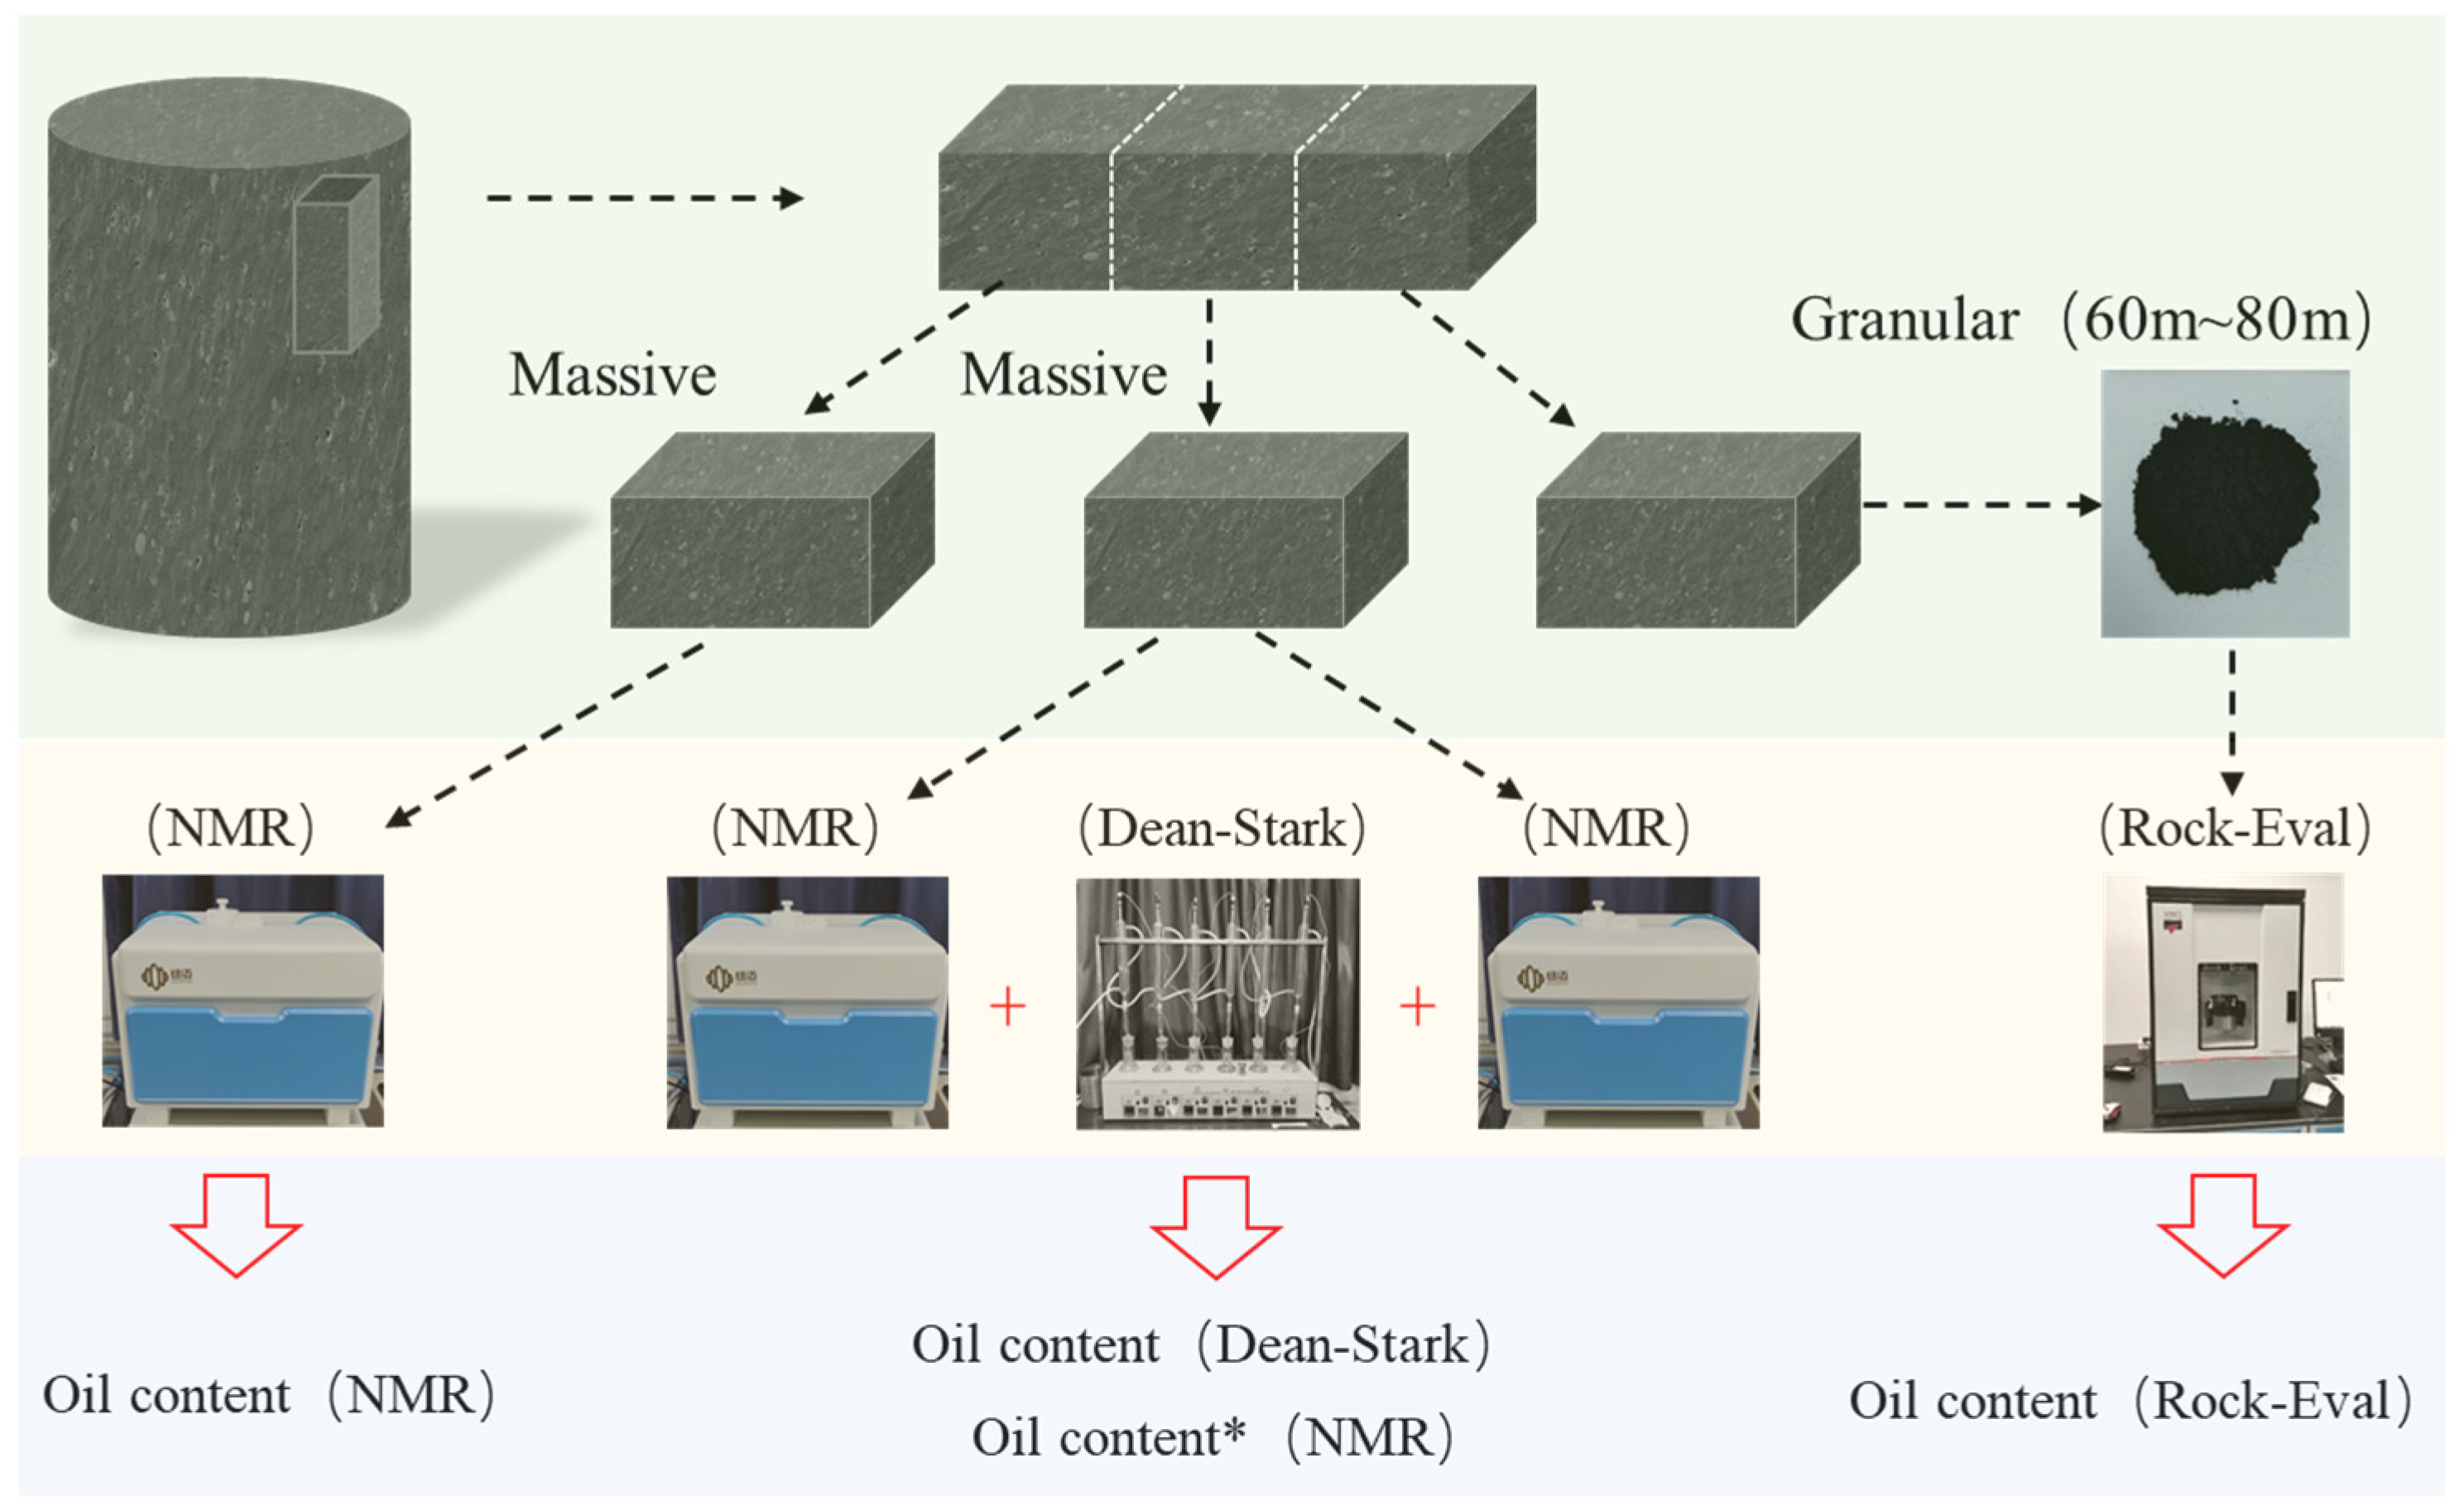
The shale samples were collected from the upper sub-member of the Sha 4 Member, Boqing Sag, Dongying Depression, Bohai Bay Basin, China, through the X shale oil exploration well. The sealed coring technique was employed, which effectively preserves the original fluid components in the shale samples, minimizing the loss of gas, oil, and water. The sealed core samples were stored in liquid nitrogen buckets (temperature maintained at −196 °C) for an extended period, with regular replenishment of liquid nitrogen. Rapid cutting methods were used for sampling the cryogenically frozen cores, with liquid nitrogen sprayed during the cutting process to prevent fluid loss. The samples for T1–T2 NMR and Dean–Stark methods were in block form (approximately 20 g), while those for the Rock-Eval method were in 60-mesh powdered form (approximately 30 mg). Additionally, sample debris collected during the preparation process was used for geochemical parameter analysis. The sample processing and experimental procedures are illustrated in Figure 2.
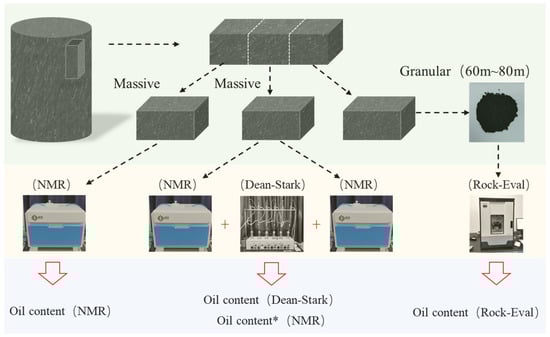
Figure 2.
Shale sample preparation and experimental procedure.
Basic geochemical parameter analyses were conducted on sealed core shale samples. The TOC testing instrument used was the Leco-C-S744 analyzer, with the experimental procedure following the “Determination of Total Organic Carbon in Sedimentary Rocks” [30]. The Rock-Eval 6 analyzer was employed for the pyrolysis of the shale samples, obtaining the standard parameters S1, S2, and Tmax, with the experimental procedure based on the “Rock Pyrolysis Analysis” [31]. The Ultima IV X-ray diffractometer was used for X-ray diffraction analysis to determine the mineral composition types of the shale following the “X-ray Diffraction Analysis Method for Clay Minerals and Common Non-clay Minerals in Sedimentary Rocks” [32].
2.3. NMR Method
Two relaxation mechanisms were observed in the nuclear magnetic resonance (NMR) responses of hydrogen-containing components in shale: longitudinal relaxation (T1), which primarily involves the recovery process of the longitudinal magnetization vector component, and transverse relaxation (T2), which primarily involves the decay process of the transverse magnetization vector component. Unlike conventional reservoirs, shale reservoirs contain high concentrations of hydrogen-containing components, such as kerogen, bitumen, and bound water associated with clay minerals, all of which exhibit significant hydrogen signals. The relaxation of hydrogen protons in these solid, semi-solid, or highly viscous fluids is controlled by intramolecular dipole–dipole coupling interactions. As fluid viscosity and molecular radius increase, the relaxation correlation time and T1 increase while T2 decreases. Conversely, when the viscosity of the fluid is low or the molecular radius within the rock pores is small, T1/T2 ≈ 1. Based on this principle, NMR T1–T2 spectra can effectively distinguish between oil, water, and solid organic matter signals in rock pores. The NMR signal directly reflects the concentrations of hydrogen-containing fluids in the pores and is a key indicator for quantifying fluids in shale [33].
2.3.1. Experimental Procedure
The nuclear magnetic resonance (NMR) instrument used in this experiment was the MicroMR20-025V model from Niumag (Suzhou, China), with a frequency of 20 MHz, a magnetic field strength of 0.5 T, and a coil diameter of 25 mm. A T2 spectrum analysis was conducted using the CPMG sequence; T1–T2 spectrum testing was performed using the IR-CPMG sequence. The system parameters and pulse sequence parameters of the NMR instrument were selected based on the relaxation characteristics of the samples.
- ①
- Before analysis, the main frequency and RF pulse width of the NMR instrument were calibrated using fluid standards.
- ②
- A small, sealed sample, weighing approximately 20 g, was quickly retrieved from a cryogenic freezer, and the surface contaminants and residual sealing fluid were wiped clean.
- ③
- Due to the fluid state in cryogenically frozen samples limiting NMR response, thawing was necessary. After thawing, the sample was repeatedly wiped and placed in a hydrogen-free glass tube for testing. One-dimensional T2 spectra (test duration approximately 10 s) and two-dimensional T1–T2 spectra (test duration approximately 8 min) were measured.
During the NMR testing, the hydrogen nuclei within the sample are in an excited state, which can lead to sample heating. To mitigate this, a circulating cooling device was added around the sample tube, maintaining the sample at a constant temperature of 23 ± 0.1 °C, thereby minimizing fluid loss from the sealed core shale.
2.3.2. Hydrogen-Containing Component Classification Scheme
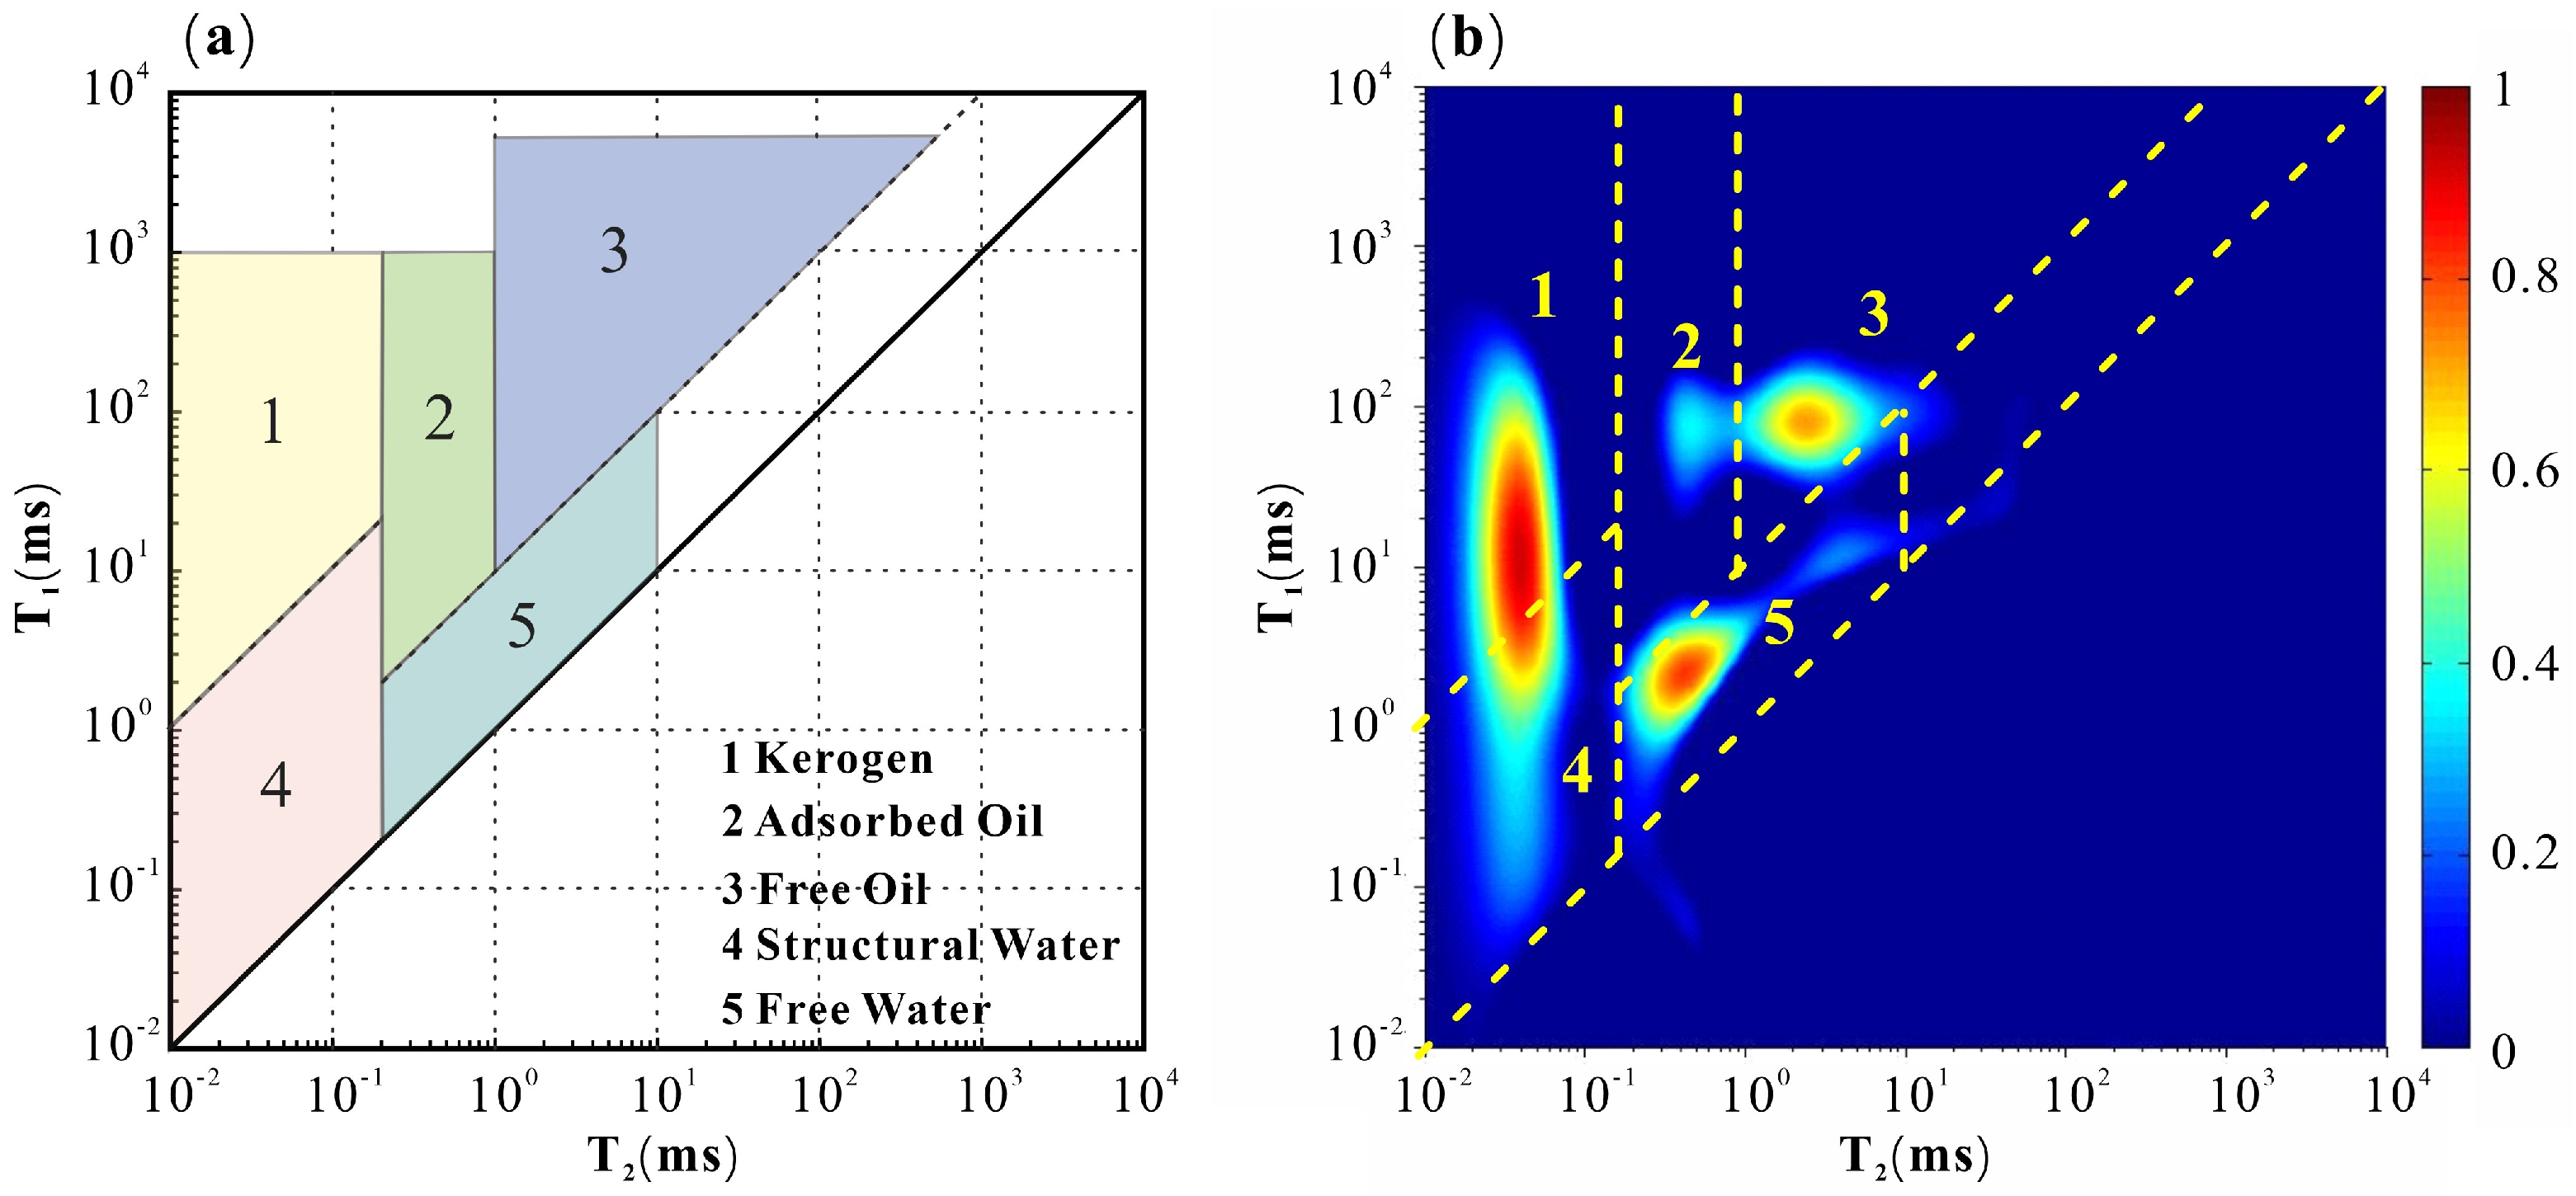
Although several hydrogen-bearing component classification charts for shale have been proposed, there are differences among classification charts from different regions. By comparing the closed coring sample nuclear magnetic T1–T2 spectra with the classification charts, as shown in Figure 3, the hydrogen-bearing component classification chart established by Li et al. was selected as the basis for classifying hydrogen-bearing components in shale [30]. Five signal regions were identified on the nuclear magnetic T1–T2 spectra: Region 1 (T2 < 0.2 ms and T1/T2 > 100); Region 2 (0.2 ms < T2 < 1 ms, T1/T2 > 100); Region 3 (T2 > 1 ms and T1/T2 > 10); Region 4 (T2 < 0.2 ms and T1/T2 < 100); and Region 5 (T2 > 0.2 ms and T1/T2 < 10). Region 1 represents signals from kerogen or solid bitumen, while Regions 2 and 3 correspond to signals from adsorbed oil and free oil, respectively. Region 4 indicates structural water and adsorbed water. Region 5 represents signals from free water in pores. Typically, the positions of Regions 1 and 4 are related to the organic matter (OM) maturity and mineral composition of the shale, and these two regions may overlap. This classification chart effectively divides the hydrogen-bearing components in the T1–T2 spectra of the shale studied.
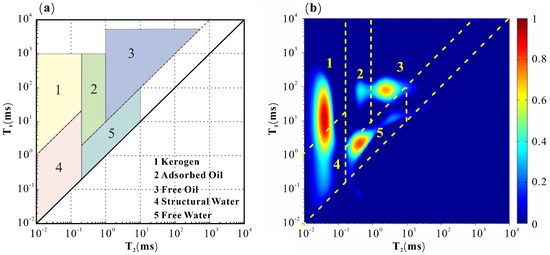
Figure 3.
Signal partitioning method for shale NMR T1–T2 spectra. (a) Shale NMR T1–T2 spectra hydrogen component division chart. (b) Application effect.
2.3.3. Calibration Transformation Relationship
Nuclear magnetic resonance (NMR) signals, as indirect responses to internal fluids in shale, cannot be directly equated to pore fluid volumes and require establishing calibration conversion relationships. Consequently, the accuracy of these conversion relationships directly impacts the quantitative evaluation of shale fluids. This study employs crude oil and formation water as calibration fluids for the conversion relationships. The calibration steps are as follows:
- ①
- Different masses of crude oil and formation water fluids were weighed and analyzed to extract NMR signals.
- ②
- The calibration coefficient f was defined as the ratio of the fluid signal in the shale NMR spectrum to its fluid mass. Formulae (1) and (2) were as follows:
In the formulae, So is the NMR signal quantity of crude oil, a.u.; Sw is the NMR signal quantity of formation water, a.u.; mo is the mass of the calibrated crude oil fluid, g; and mw is the mass of the calibrated formation water fluid, g.
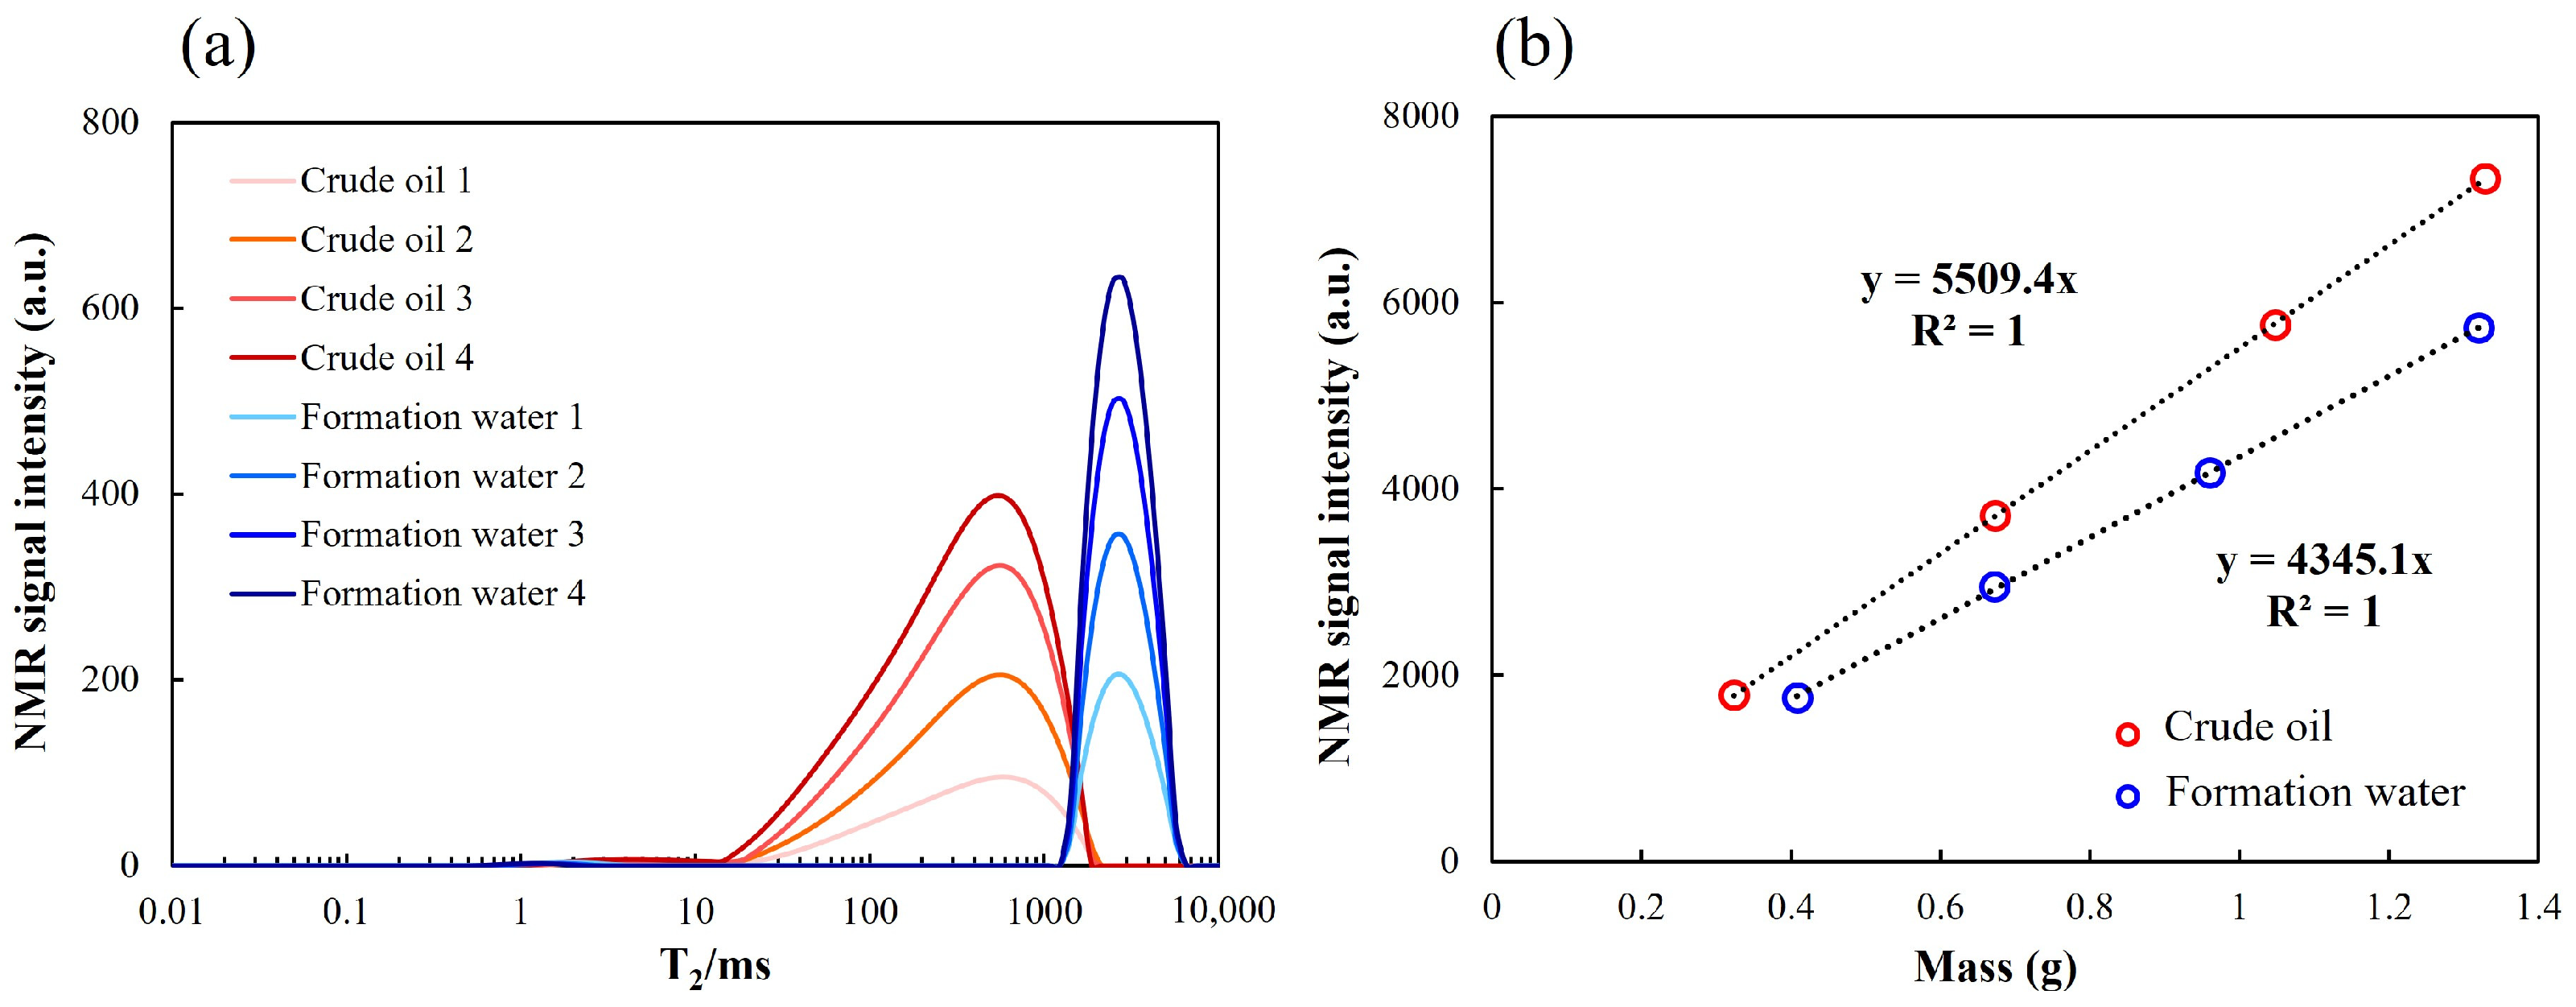
As shown in Figure 4, the above process was used to establish calibration conversion relationships for both crude oil and formation water. It is noteworthy that the conversion relationships for crude oil varied across different regions and types. Based on the transformation relationship, the regional signal of shale oil extracted from 2D NMR spectra was converted into the oil content result of shale.
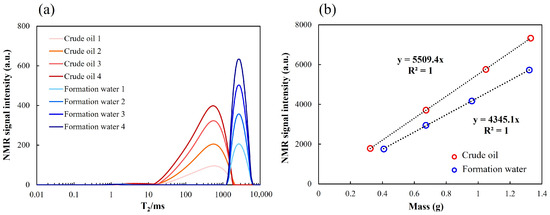
Figure 4.
Calibration of fluid conversion coefficients in shale. (a) NMR T2 spectra of crude oils of different qualities and formation waters. (b) Calibration conversion coefficients for crude oils and formation waters.
2.4. Dean–Stark Method
The distillation extraction method employed the Dean–Stark azeotropic distillation apparatus [34], which consists of a long-necked flask, condenser, and water trap. The principle involved the formation of an azeotrope between the solvent and water in the rock sample under constant temperature. The azeotrope was then condensed in the condenser, allowing the separation of the solvent and water vapor. During boiling, the water vapor formed was removed together with the solvent. Since toluene has a lower density than water, the condensed water droplets were collected at the bottom of the trap. After the experiment, the volume of water in the water trap was measured to calculate the water content of the rock sample. The sample was then washed to remove oil, and the oil content was determined by the mass difference. In this study, toluene was chosen as the distillation solvent with a boiling point of 110.6 °C, and a mixture of dichloromethane/acetone in a 3:1 ratio was selected as the solvent for oil washing. The specific experimental procedure was as follows:
- ①
- Check the instrument for airtightness. After opening the condenser water valve, add distilled solvent to the long-necked flask. Simultaneously, add 0.2 mL of distilled water to moisten the inner walls of the tube.
- ②
- Heat the distilled solvent. Wait until the water volume in the water collector stabilizes, record its scale, and turn off the power.
- ③
- Weigh the sample and record its initial mass. Place it in the distillation apparatus and start the temperature-controlled heating (3~5 days).
- ④
- Wait until the water volume in the moisture trap stabilizes, record its scale, turn off the heating, remove the experimental sample, and weigh it again.
- ⑤
- Place the sample in a rapid oil washing instrument for thorough oil washing (15~20 days). The washing solvent is a mixture of dichloromethane and acetone in a ratio of 3:1. After washing, dry the sample at 110 °C and weigh it again.
- ⑥
- Define Cw as the water content of shale evaluated by the distillation extraction method and Co as the oil content of shale evaluated by the distillation extraction method. Formulae (3) and (4) are as follows:
In the formulae, V1 is the scale reading of the water collector before distillation, mL; V2 is the scale reading of the water collector after distillation, mL; m1 is the mass of the sample before distillation, g; m2 is the mass of the sample after distillation, g; m3 is the mass of the sample after oil washing, g; and ρw is the density of the extracted water, cm3/g.
Nuclear magnetic resonance T1–T2 spectroscopy tests were conducted on shale samples before and after Dean–Stark. The oil content* was calculated based on the quantification of fluids measured using NMR before and after distillation and extraction.
2.5. Pyrolysis Method
Rock-Eval pyrolysis uses a programmed temperature-controlled oven to heat samples, causing the free hydrocarbons and kerogen within the samples to volatilize and pyrolyze at different temperatures. The pyrolysis parameter S1 is the concentration in the rock of hydrocarbons volatilized from the shale at 300 °C and is typically used to characterize the oil content of shales. This organic matter is generally considered to be the free hydrocarbons that were originally present in the shale but had not been expelled. The S2, on the other hand, refers to the hydrocarbons detected during the pyrolysis temperature range of 300 °C to 600 °C, which are the pyrolyzed hydrocarbons (i.e., constituents formed by the thermal cracking of the kerogen and non-volatile bitumen).
The experimental apparatus used in this study was the Rock-Eval 6, with a heating program as follows: the initial pyrolysis temperature of the pyrolysis oven was set at 30 °C, with a heating rate of 50 °C/min until the temperature reached 300 °C, where it was held constant for 3 min. The heating then continued at a programmed rate of 25 °C/min, with the pyrolysis terminating at 600 °C. The carrier gas helium and the fuel gas hydrogen both had a purity of 99.999%. The specific experimental procedures were referenced from “Rock Pyrolysis Analysis” (GB/T 18602-2012) [31].
3. Results
3.1. Characteristics of Studied Shales
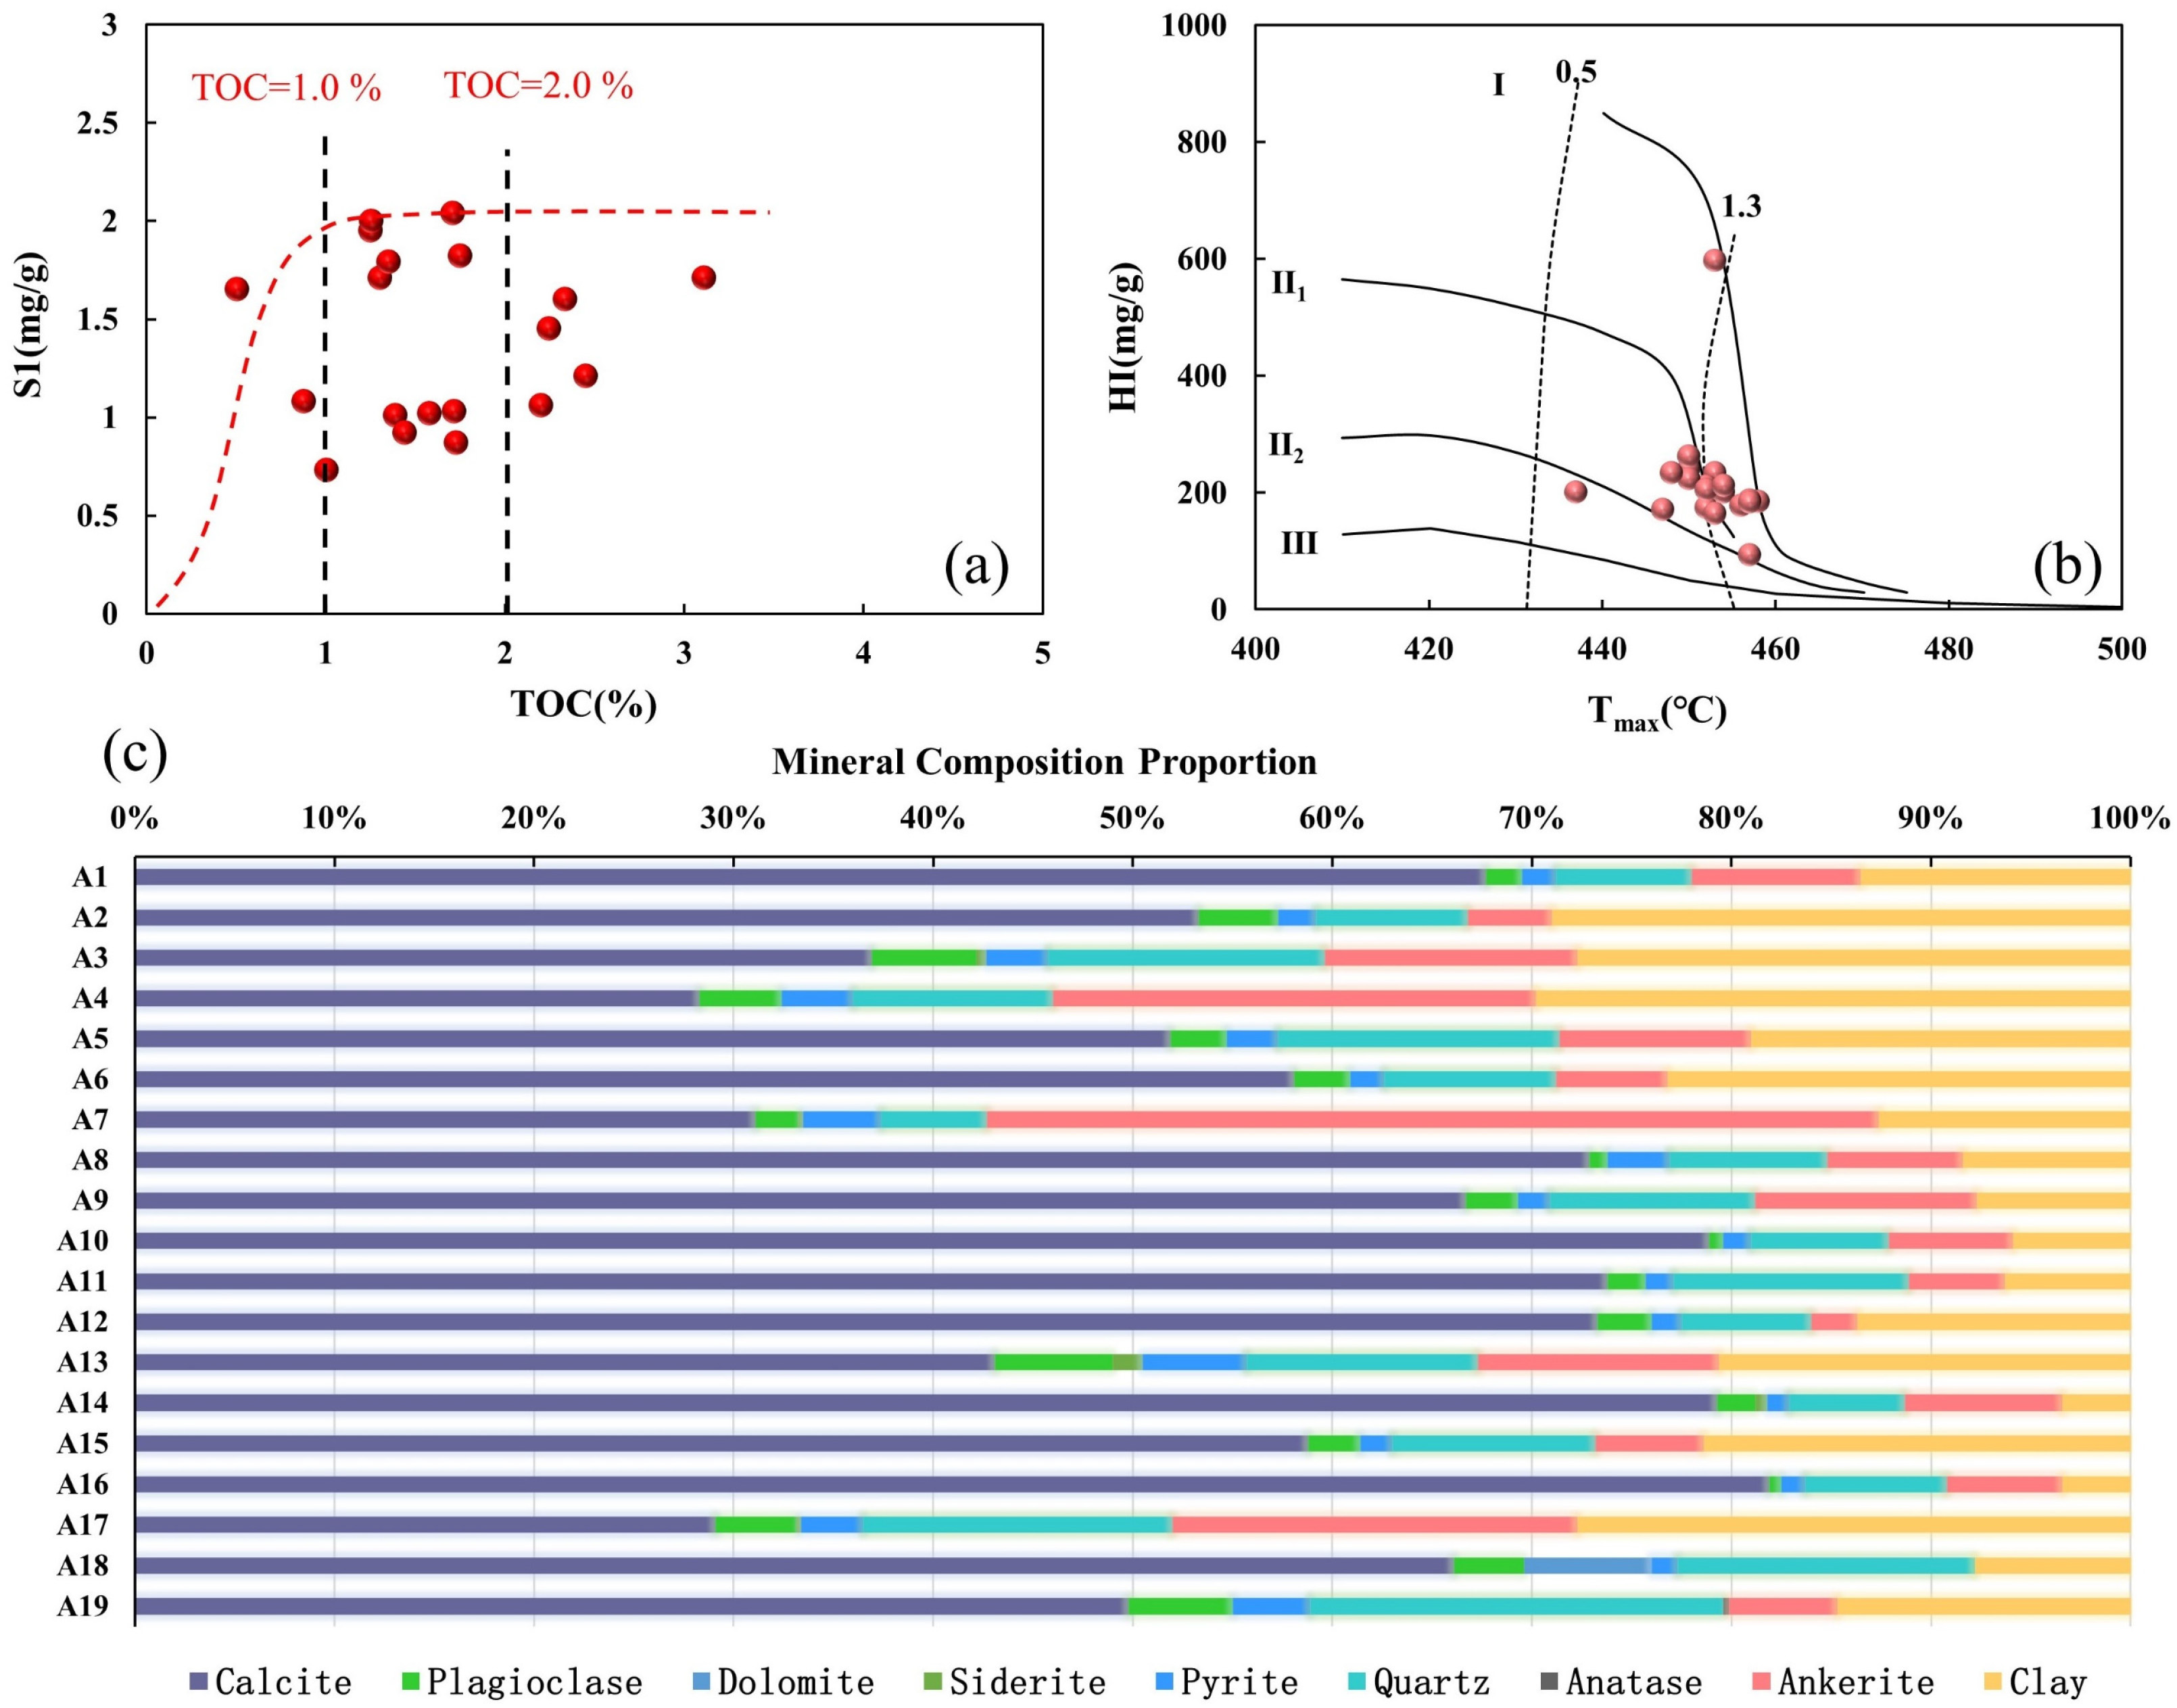
Total organic carbon (TOC) values ranged from 0.50 to 3.10 wt%, with an average of 1.64 wt%. The results indicated that the shale samples contained a generally high abundance of organic matter (Figure 5a), with the organic matter primarily consisting of Type I and Type II1 (Figure 5b). Tmax values ranged from 437 °C to 458 °C, with an average of 442 °C, indicating that the maturity of OM was in the early oil window. The mineral composition of the shale was mainly divided into three categories: carbonates, clay minerals, and feldspathoids (quartz + feldspar) (Figure 5c), characterized by a high content of carbonate minerals.
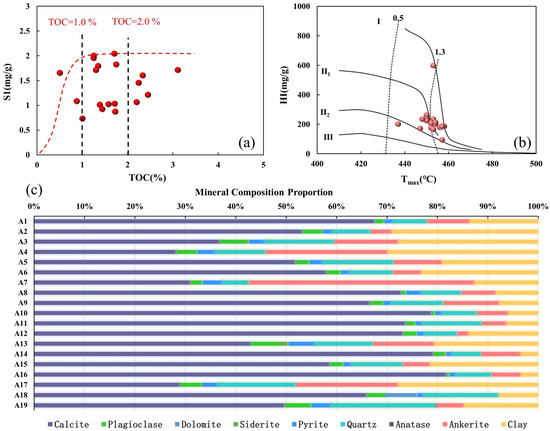
Figure 5.
Baseline geochemical parameters of samples. (a) TOC vs. S1 shows the degree of organic matter enrichment. (b) Hydrogen index vs. Tmax shows the type of organic matter for the shale samples. (c) Mineral composition.
3.2. NMR T1–T2 Maps
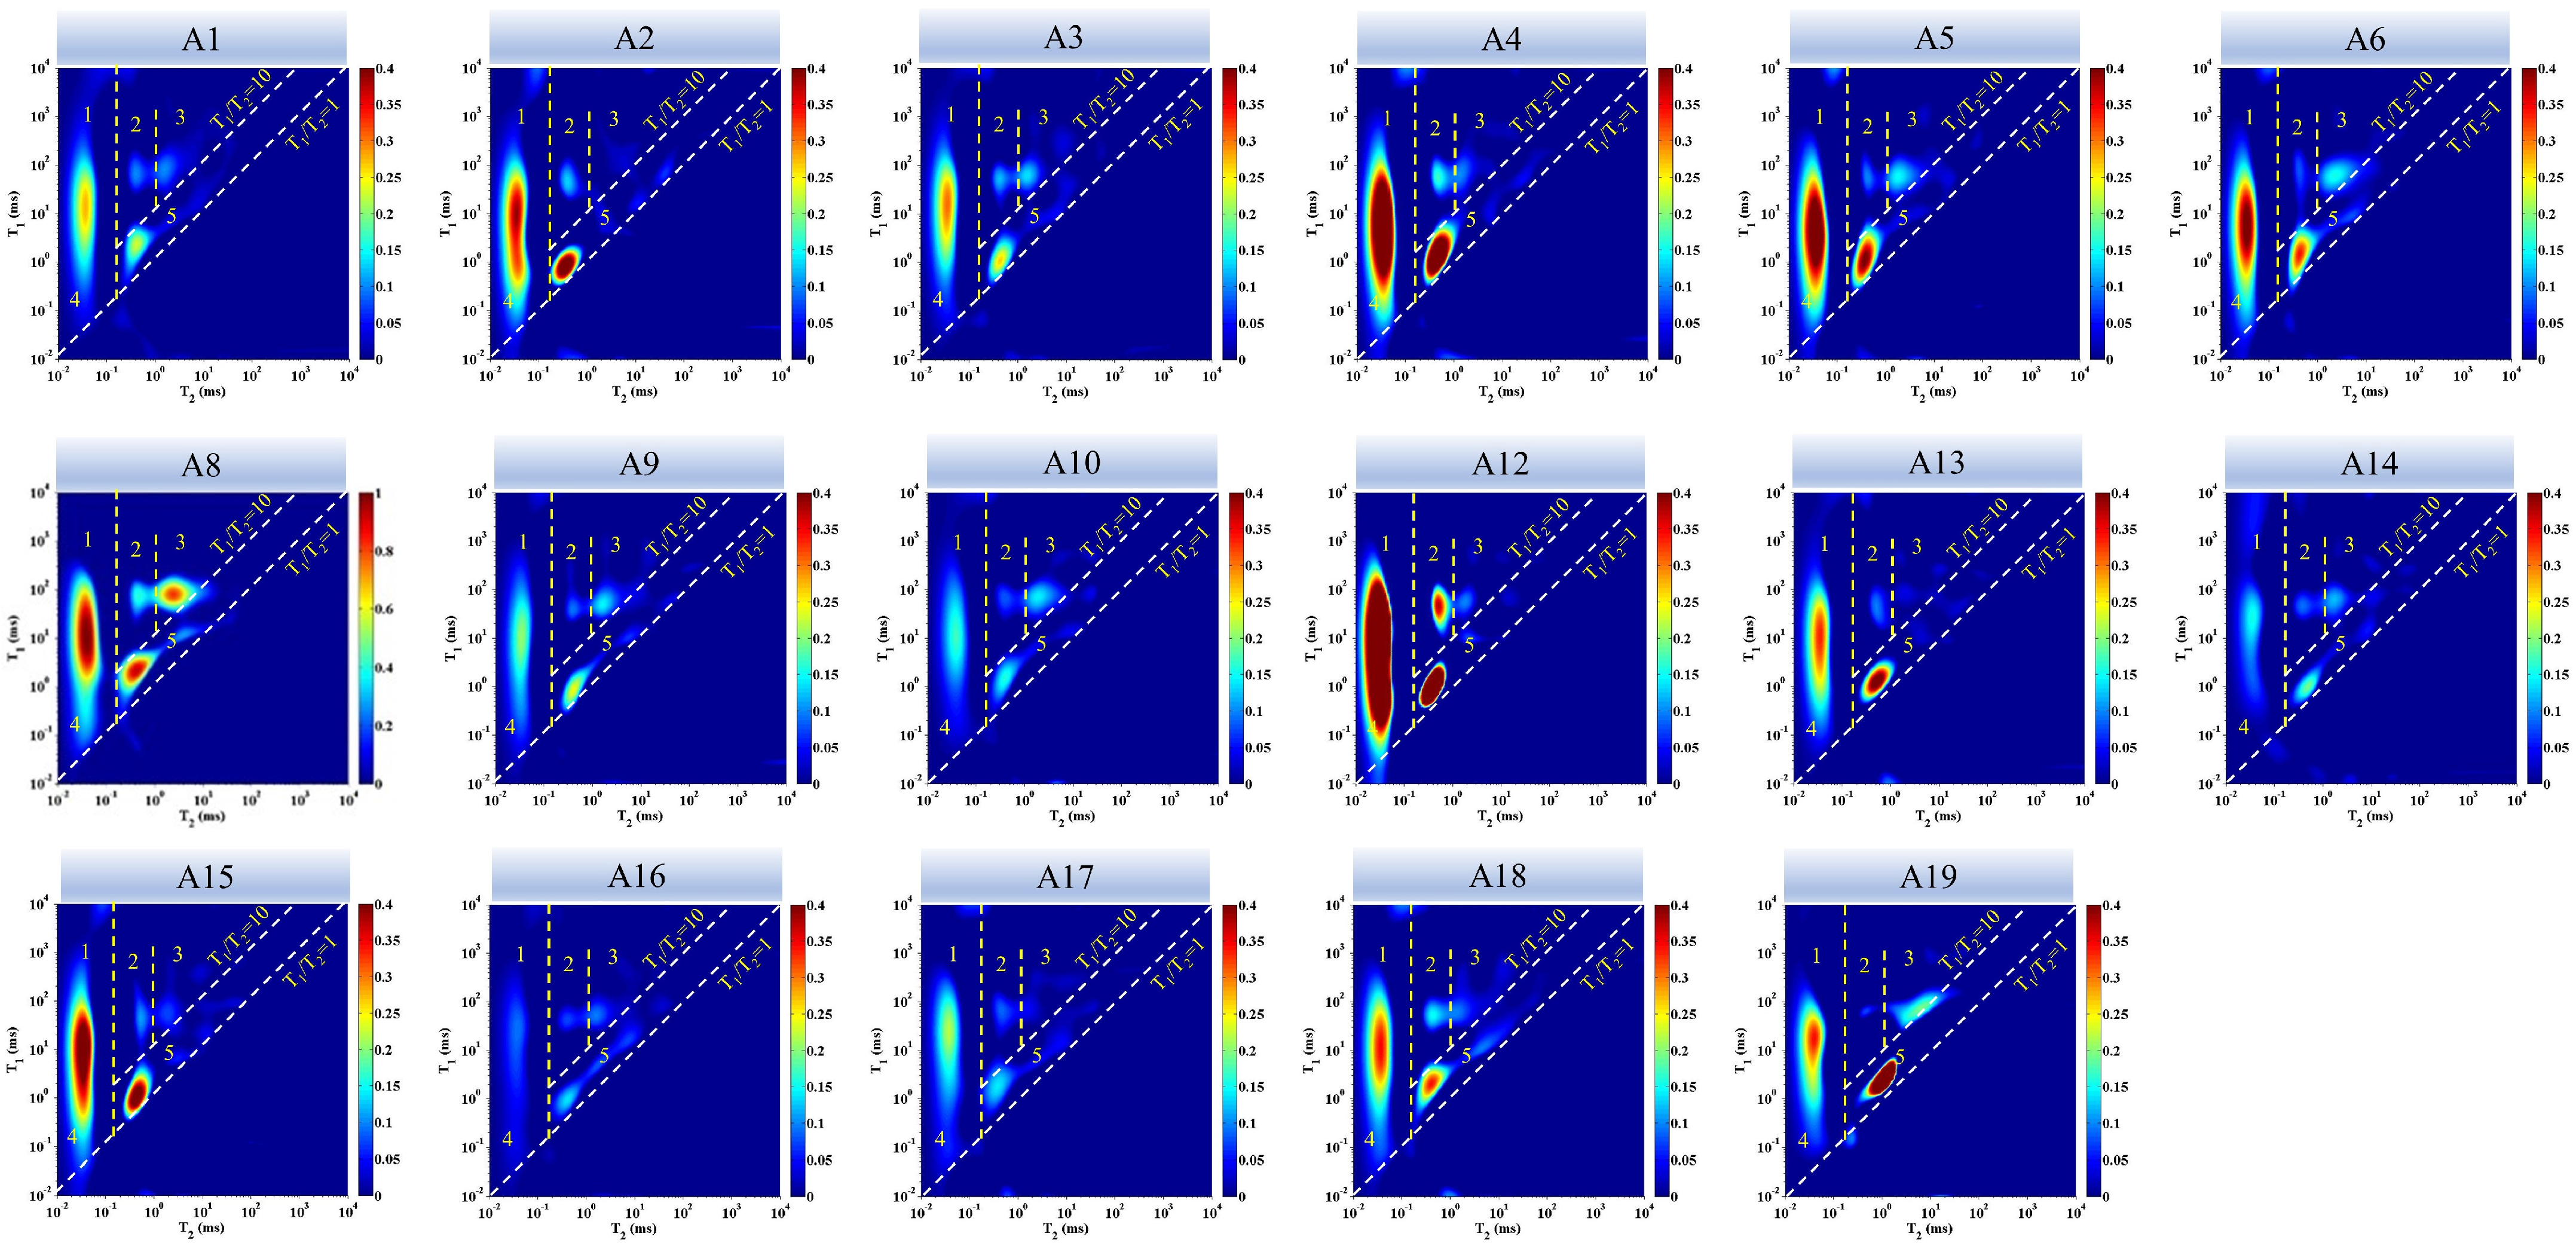
Figure 6 illustrates the T1–T2 spectra of a typical closed-core sample, with signal regions delineated according to the NMR T1–T2 hydrogen-containing identification chart shown earlier. The nuclear magnetic resonance signals (Region 1) of the solid organic matter components in the test samples may be correlated with the abundance of organic matter in the samples. Additionally, the position of kerogen signals on the chart is related to its maturity; as maturity increases, the T1/T2 ratio increases, causing the signal region to shift upwards. The NMR signal intensity of kerogen is directly related to its hydrogen content. In general, a better kerogen type corresponds to a greater potential for hydrocarbon generation and a higher NMR signal intensity. Regions 2 and 3, respectively, represent adsorbed oil components and free oil components in shale, with the signal strength directly reflecting oil content. For instance, samples A4 and A12 exhibited strong signal intensities in Region 2, indicating high adsorbed oil content, while sample A19 showed a significant signal intensity in Region 3, suggesting abundant free oil in the shale sample. It is important to note that a simple judgment of shale fluid content based on NMR spectral signal intensity requires consistent NMR analytical procedures for different samples and normalization by unit mass; otherwise, fluid content comparison based on NMR signal intensity is not feasible.
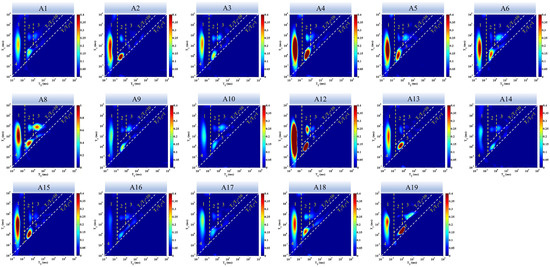
Figure 6.
Comparison of T1–T2 NMR spectra for closed-core shale samples.
3.3. Oil Content Evaluation Results
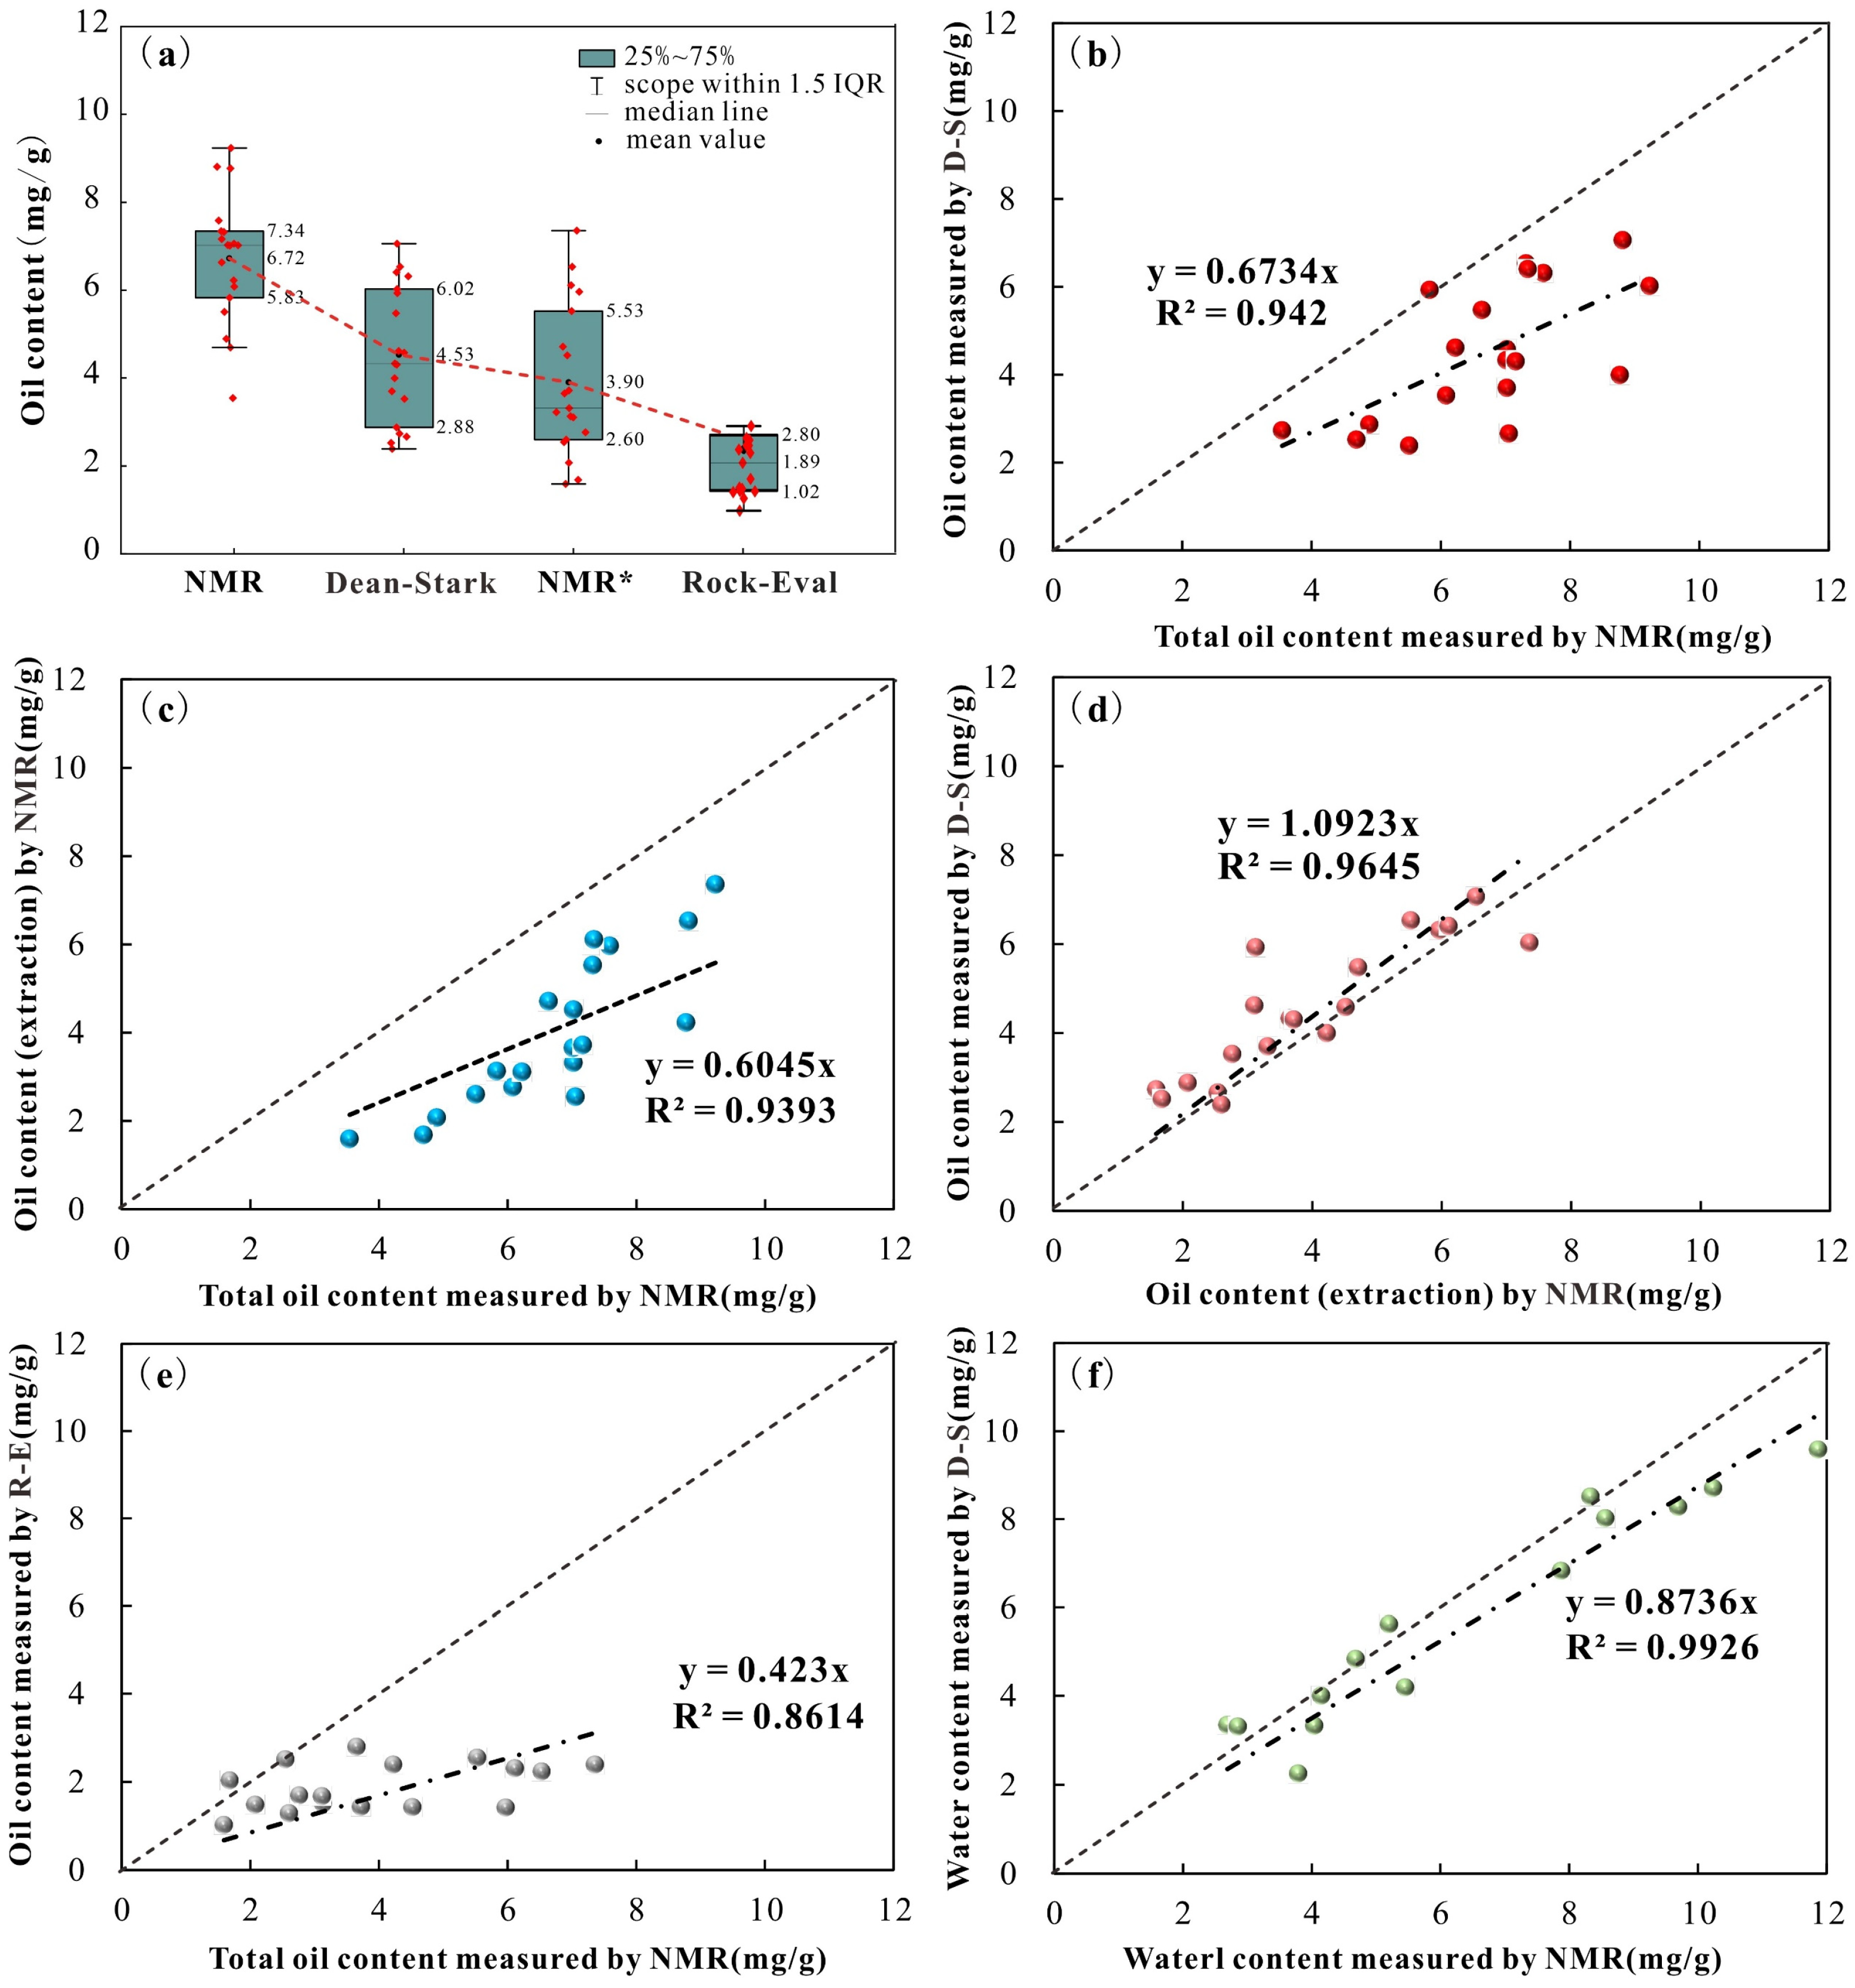
Table 1 illustrates the oil content measurements from sealed core shale samples acquired via three distinct analytical methodologies. Employing the nuclear magnetic resonance (NMR) methodology, the total oil content within the sealed shale ranged from 3.54 to 9.23 mg/g, with a mean value of 6.72 mg/g. The oil content of the samples after Dean–Stark extraction, as measured by NMR, varied from 1.59 to 7.35 mg/g, averaging 4.05 mg/g. The distillation extraction technique yielded oil concentrations ranging from 2.39 to 7.06 mg/g, with an average of 4.53 mg/g. The pyrolysis analyses yielded oil contents (i.e., S1 or free hydrocarbons) ranging from 1.0 to 2.8 mg/g rock, averaging 1.89 mg/g. The distribution of cracked hydrocarbons S2 ranged from 1.65 to 7 mg/g, averaging 3.53 mg/g.

Table 1.
Oil content results of closed-core shale samples obtained by different testing methods.
4. Discussion and Analysis
4.1. Comparison of Analytical Methods
A comparison of the oil content results of the closed-core shale samples analyzed by the three experimental methods is presented in Figure 7. Overall, the oil content results obtained by nuclear magnetic resonance (NMR) were the highest, followed by those from the distillation extraction method, with the pyrolysis method yielding the lowest results. This comparison shows that the oil content measured by the distillation extraction method was 67% of the oil content result obtained by the NMR method (Figure 7b). Additionally, the oil content based on the difference in NMR spectra of the samples before and after Dean–Stark extraction was approximately 60% of the oil content of the closed samples as measured by NMR (Figure 7c). This discrepancy may arise from two aspects: firstly, some of the fluids in the shale were stored in closed pores within the shale, which the distillation extraction method could not access, and secondly, due to the dense and complex pore structure of the shale, some fluids remained trapped in pores even after distillation extraction. Furthermore, the oil content obtained by the distillation extraction method showed a consistent distribution with the NMR-evaluated oil content before and after extraction, both aligning closely with the diagonal line (Figure 7d), indicating that the distillation extraction method had a good quantitative effect on extractable fluids. The oil content evaluated by the Rock-Eval method was only 42% of that evaluated by the NMR method (Figure 7e), suggesting that approximately 58% of the shale oil in the closed-core samples had already dissipated before the Rock-Eval test. The primary reason for this is likely the significant loss of light hydrocarbons during the storage and crushing processes of the shale, leading to an underestimation of the oil content by the Rock-Eval method.
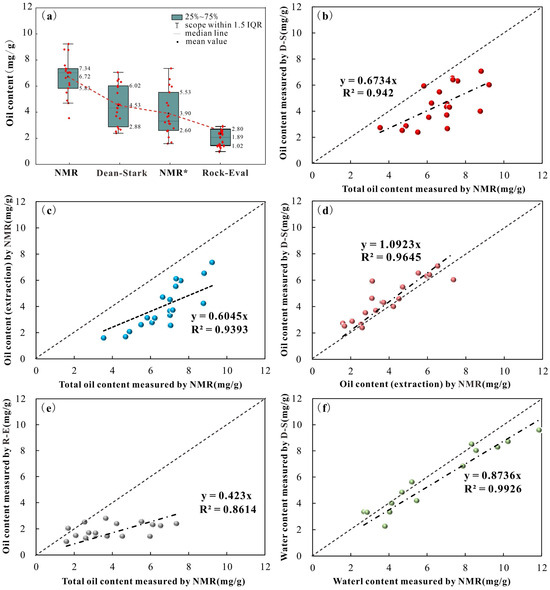
Figure 7.
Comparison of shale oil content determined by different test methods. (a) Comparison of results from four different methods; (b) oil content measured by D-S vs. total oil content measured by NMR; (c) oil content (extraction) by NMR vs. total oil content measured by NMR; (d) oil content measured by D-S vs. oil content (extraction) by NMR; (e) oil content measured by R-E vs. total oil content measured by NMR; (f) water content measured by D-S vs. water content measured by NMR.
Compared to the Rock-Eval method, both the NMR and Dean–Stark methods not only provided the oil content in shale but also measured the water content in shale. As shown in Figure 7f, the water content results obtained by the NMR method were slightly higher than those from the Dean–Stark method, but the overall correlation was good. This similarity to the oil content characterization results can be attributed to the fact that the Dean–Stark method is unable to extract water trapped in closed pores. Additionally, prior to testing, the sealed core shale samples were kept in liquid nitrogen, which may have caused the pore water in the shale to not fully thaw during the NMR testing. The low temperature significantly affected the NMR signal of water [35,36], such as through shielding effects. Furthermore, in some shale samples, the distribution area of water in the NMR T1–T2 spectrum overlapped with that of crystalline water and structural water, and the interpretation of NMR signals was subject to human error, which may have led to inaccuracies [37].
4.2. Shale Oil Volatilization Loss
The complete preservation of fluids in shale samples is a prerequisite for the accurate quantification of oil content. However, the loss of light hydrocarbons in shale is inevitable when the shale is brought from underground to the surface. This is due to the rapid decrease in temperature and pressure, which causes the release of small molecular hydrocarbons [10]. The development of sealed coring technology has significantly mitigated the loss of light hydrocarbons during this process. However, an open analytical testing environment can still result in significant loss of light components, such as during sample storage and pretreatment (e.g., crushing) [9,36].
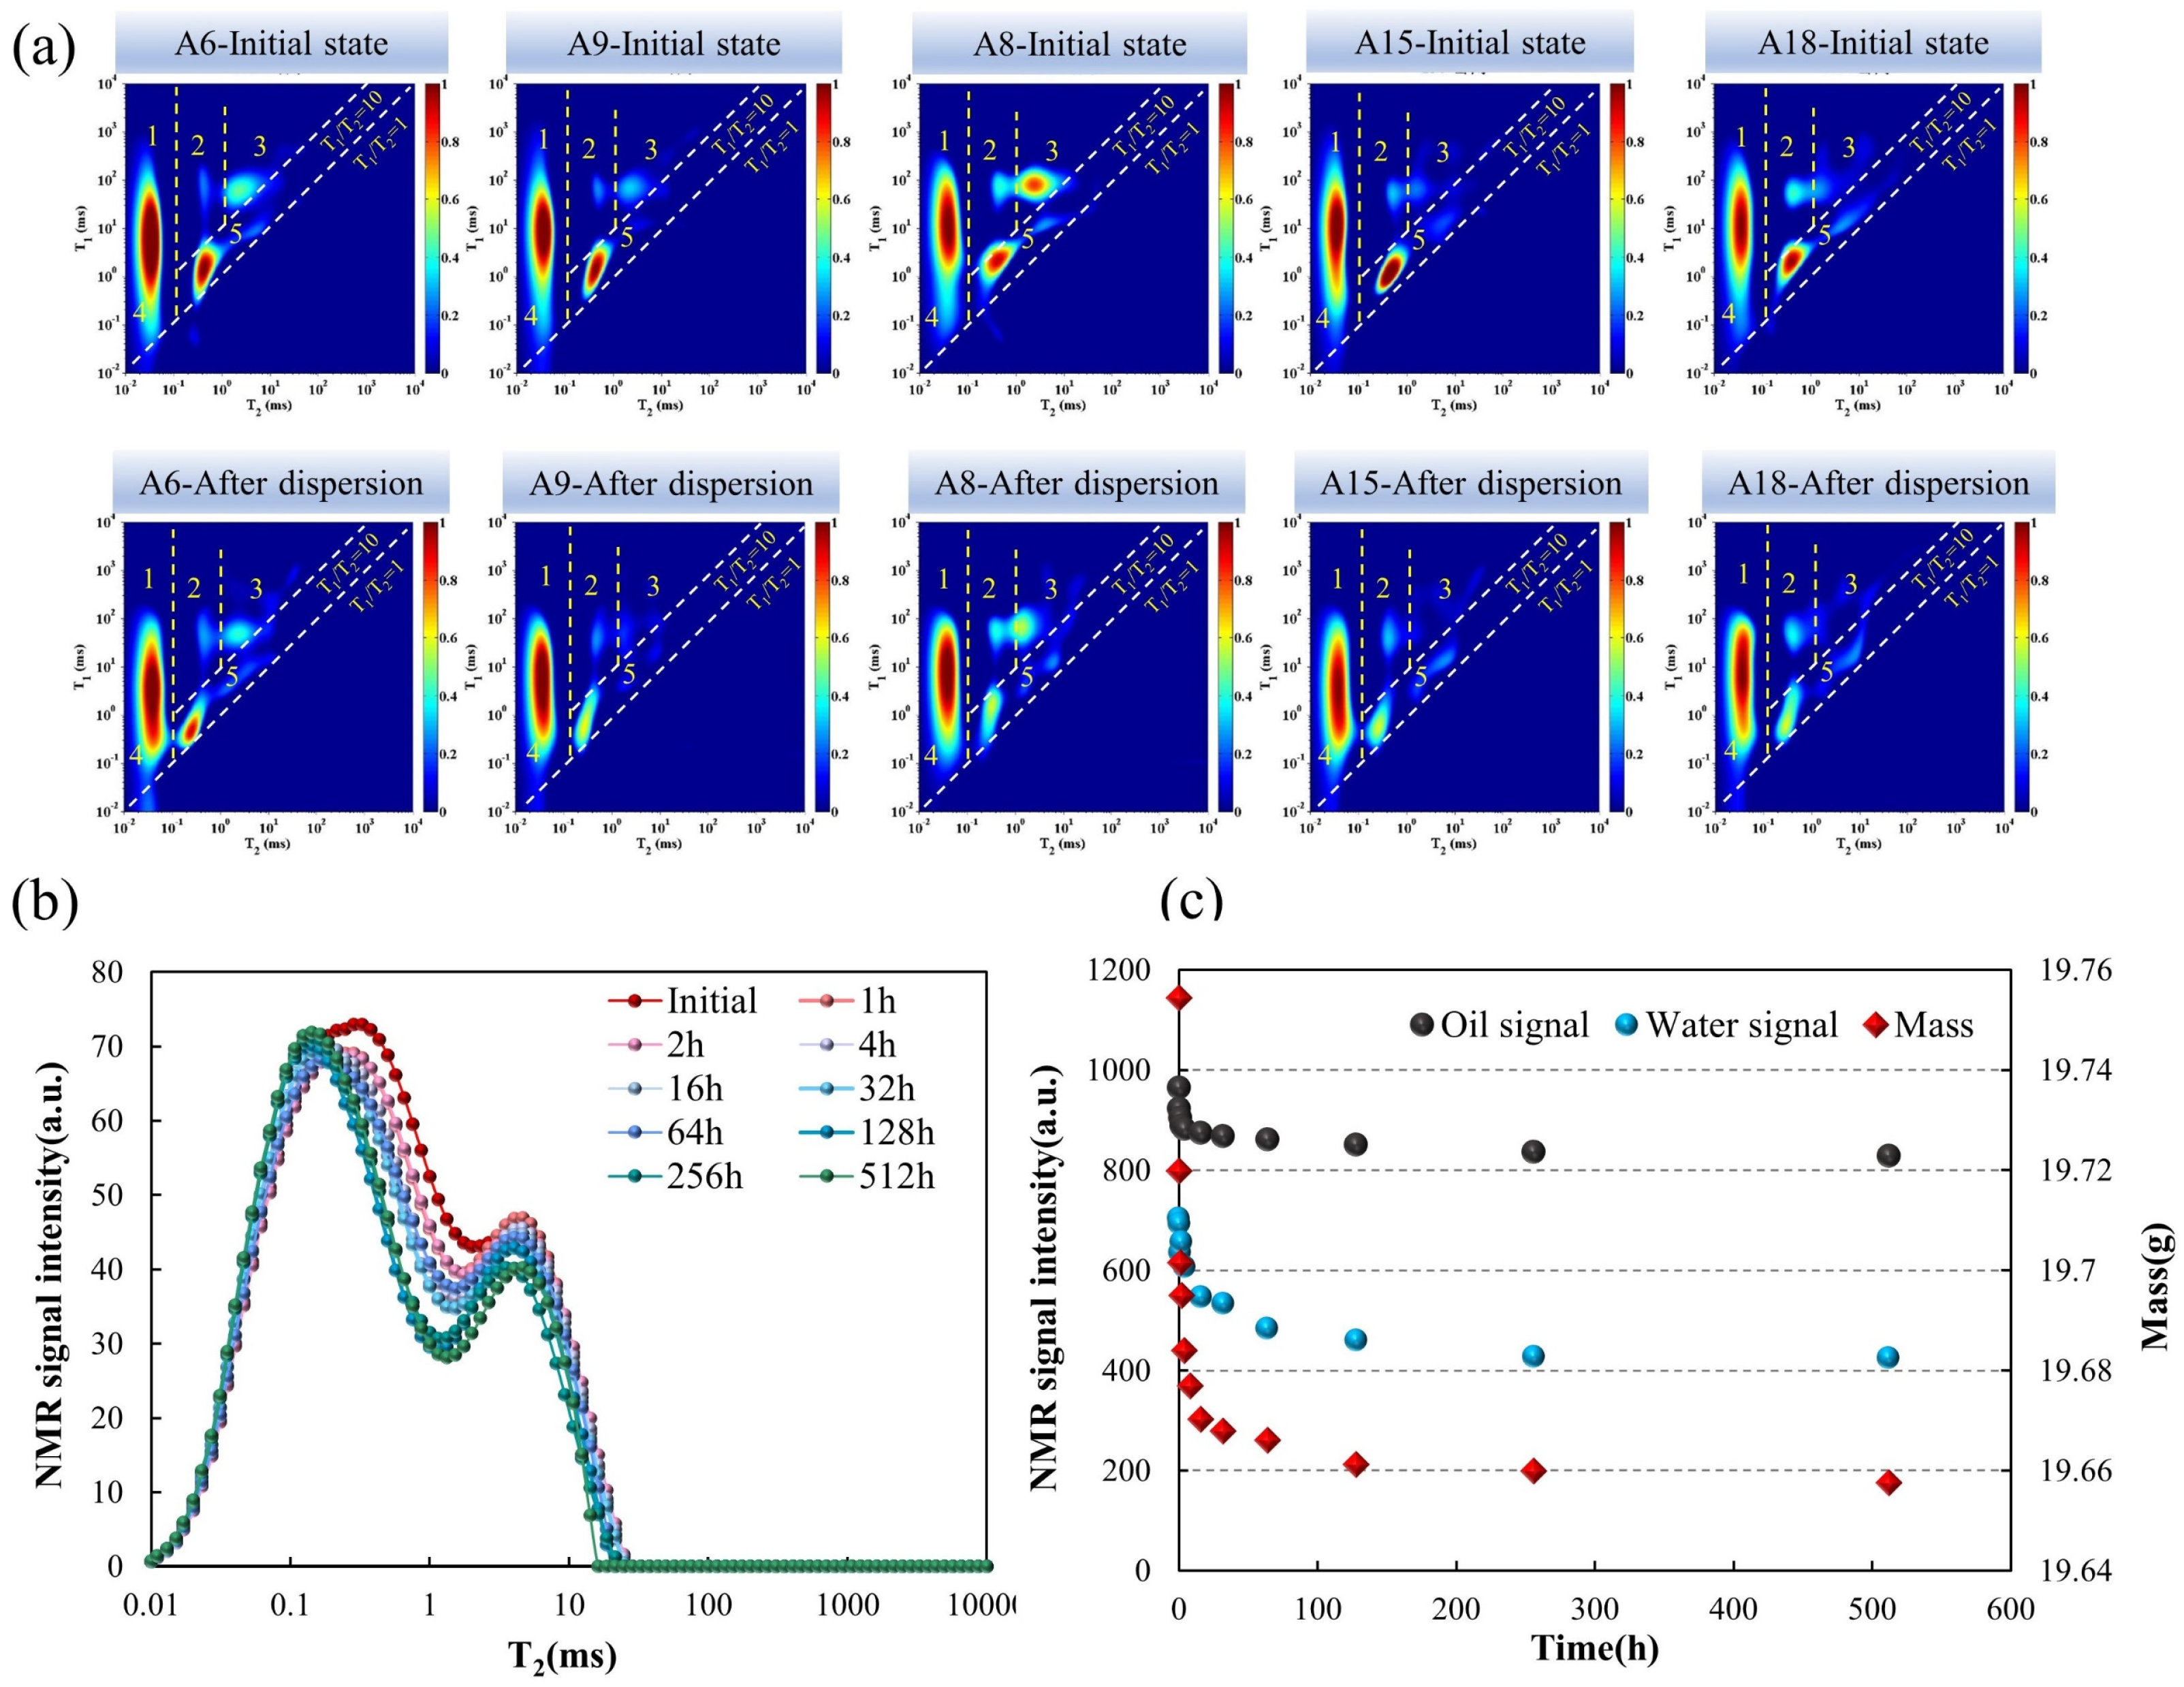
Figure 8a illustrates the changes in the NMR T1–T2 spectra of closed-core shale after different storage times. It can be observed that, compared to the closed state, the signals in regions 2, 3, and 5 of the NMR T1–T2 spectra of the shale showed significant reductions. In other words, when the shale samples were exposed to air, both oil and water were lost. This indirectly indicates that the method of studying in situ oil and water saturation by re-saturating with oil has flaws [38,39]. As shown in Figure 8b, the NMR T2 spectra of the same shale sample tested at different storage times exhibit a noticeable downward trend (A6). As illustrated in Figure 8a–c, further refinement of the loss process reveals that, with the extension of storage time, the shale mass decreased exponentially. After 512 h, the trend stabilized, indicating that the fluid in the pores was no longer lost. Further analysis of the signals shows that the loss ratios of oil and water in the shale were 14.09% and 39.74%, respectively. However, this loss ratio is not absolute. Ma et al. found that by exposing well-preserved samples to an open environment, the loss of hydrocarbons in shale was positively correlated with its maturity, the proportion of C14-, shale pore size, and mobility but negatively correlated with organic richness. In contrast, porosity had no significant effect on hydrocarbon loss [40].
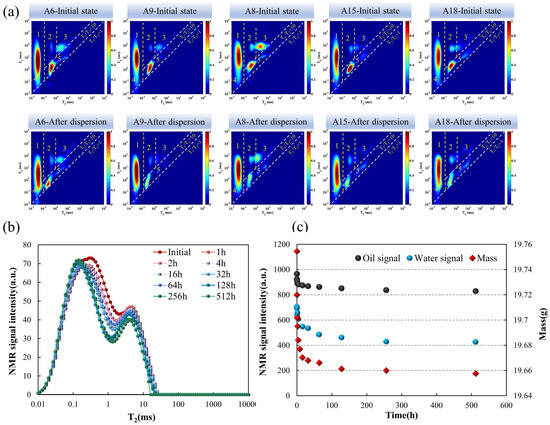
Figure 8.
Trends in fluid loss after core sealing and placement. (a) Comparison of T1–T2 NMR spectra before and after exposure to air for different shale samples (512 h), (b) variation in NMR T2 signal with increasing exposure time (A6), (c) changes in NMR signal and mass changes with different exposure times (A6).
The Rock-Eval method typically requires samples to be crushed to 60 mesh. The process of crushing and grinding shale samples inevitably exposes a larger surface area of the rock to air, thereby increasing the volatilization and loss of shale fluids. Li et al. verified this point by comparing the NMR T1–T2 spectra before and after crushing [36]. They found that the signal intensity of hydrocarbons from the intact rock sample, which was 1.85 pu (~19 mg HCs/g rock), significantly decreased to 1.26 pu (~13 mg HCs/g rock) in the powdered sample, indicating a total hydrocarbon loss of approximately 32% associated with the crushing and grinding of the sample. Additionally, before conducting pyrolysis tests with the Rock-Eval instrument, the sample must be placed in a crucible and left to wait for about 5 min. This waiting period further exacerbates the volatilization and loss of light hydrocarbons in the shale. Li et al. also quantified this process, showing that the 5-min delay in the Rock-Eval analysis results in a 35% loss of total hydrocarbons in the shale [36]. In summary, the Rock-Eval method using powdered samples may severely underestimate the oil content of shale. Consequently, when evaluating shale oil content using the Rock-Eval method, especially for medium- to high-maturity shales, the experimental process should be rapid and timely to minimize hydrocarbon loss during sample preservation and crushing. Additionally, the S2 (pyrolysis hydrocarbons) obtained from rock pyrolysis contains some previously generated liquid hydrocarbons that have higher molecular weights, are not significantly volatilized at 300 °C, and remain in the pores or are adsorbed in the organic matter [41,42].
4.3. Distillation and Extraction Efficiency
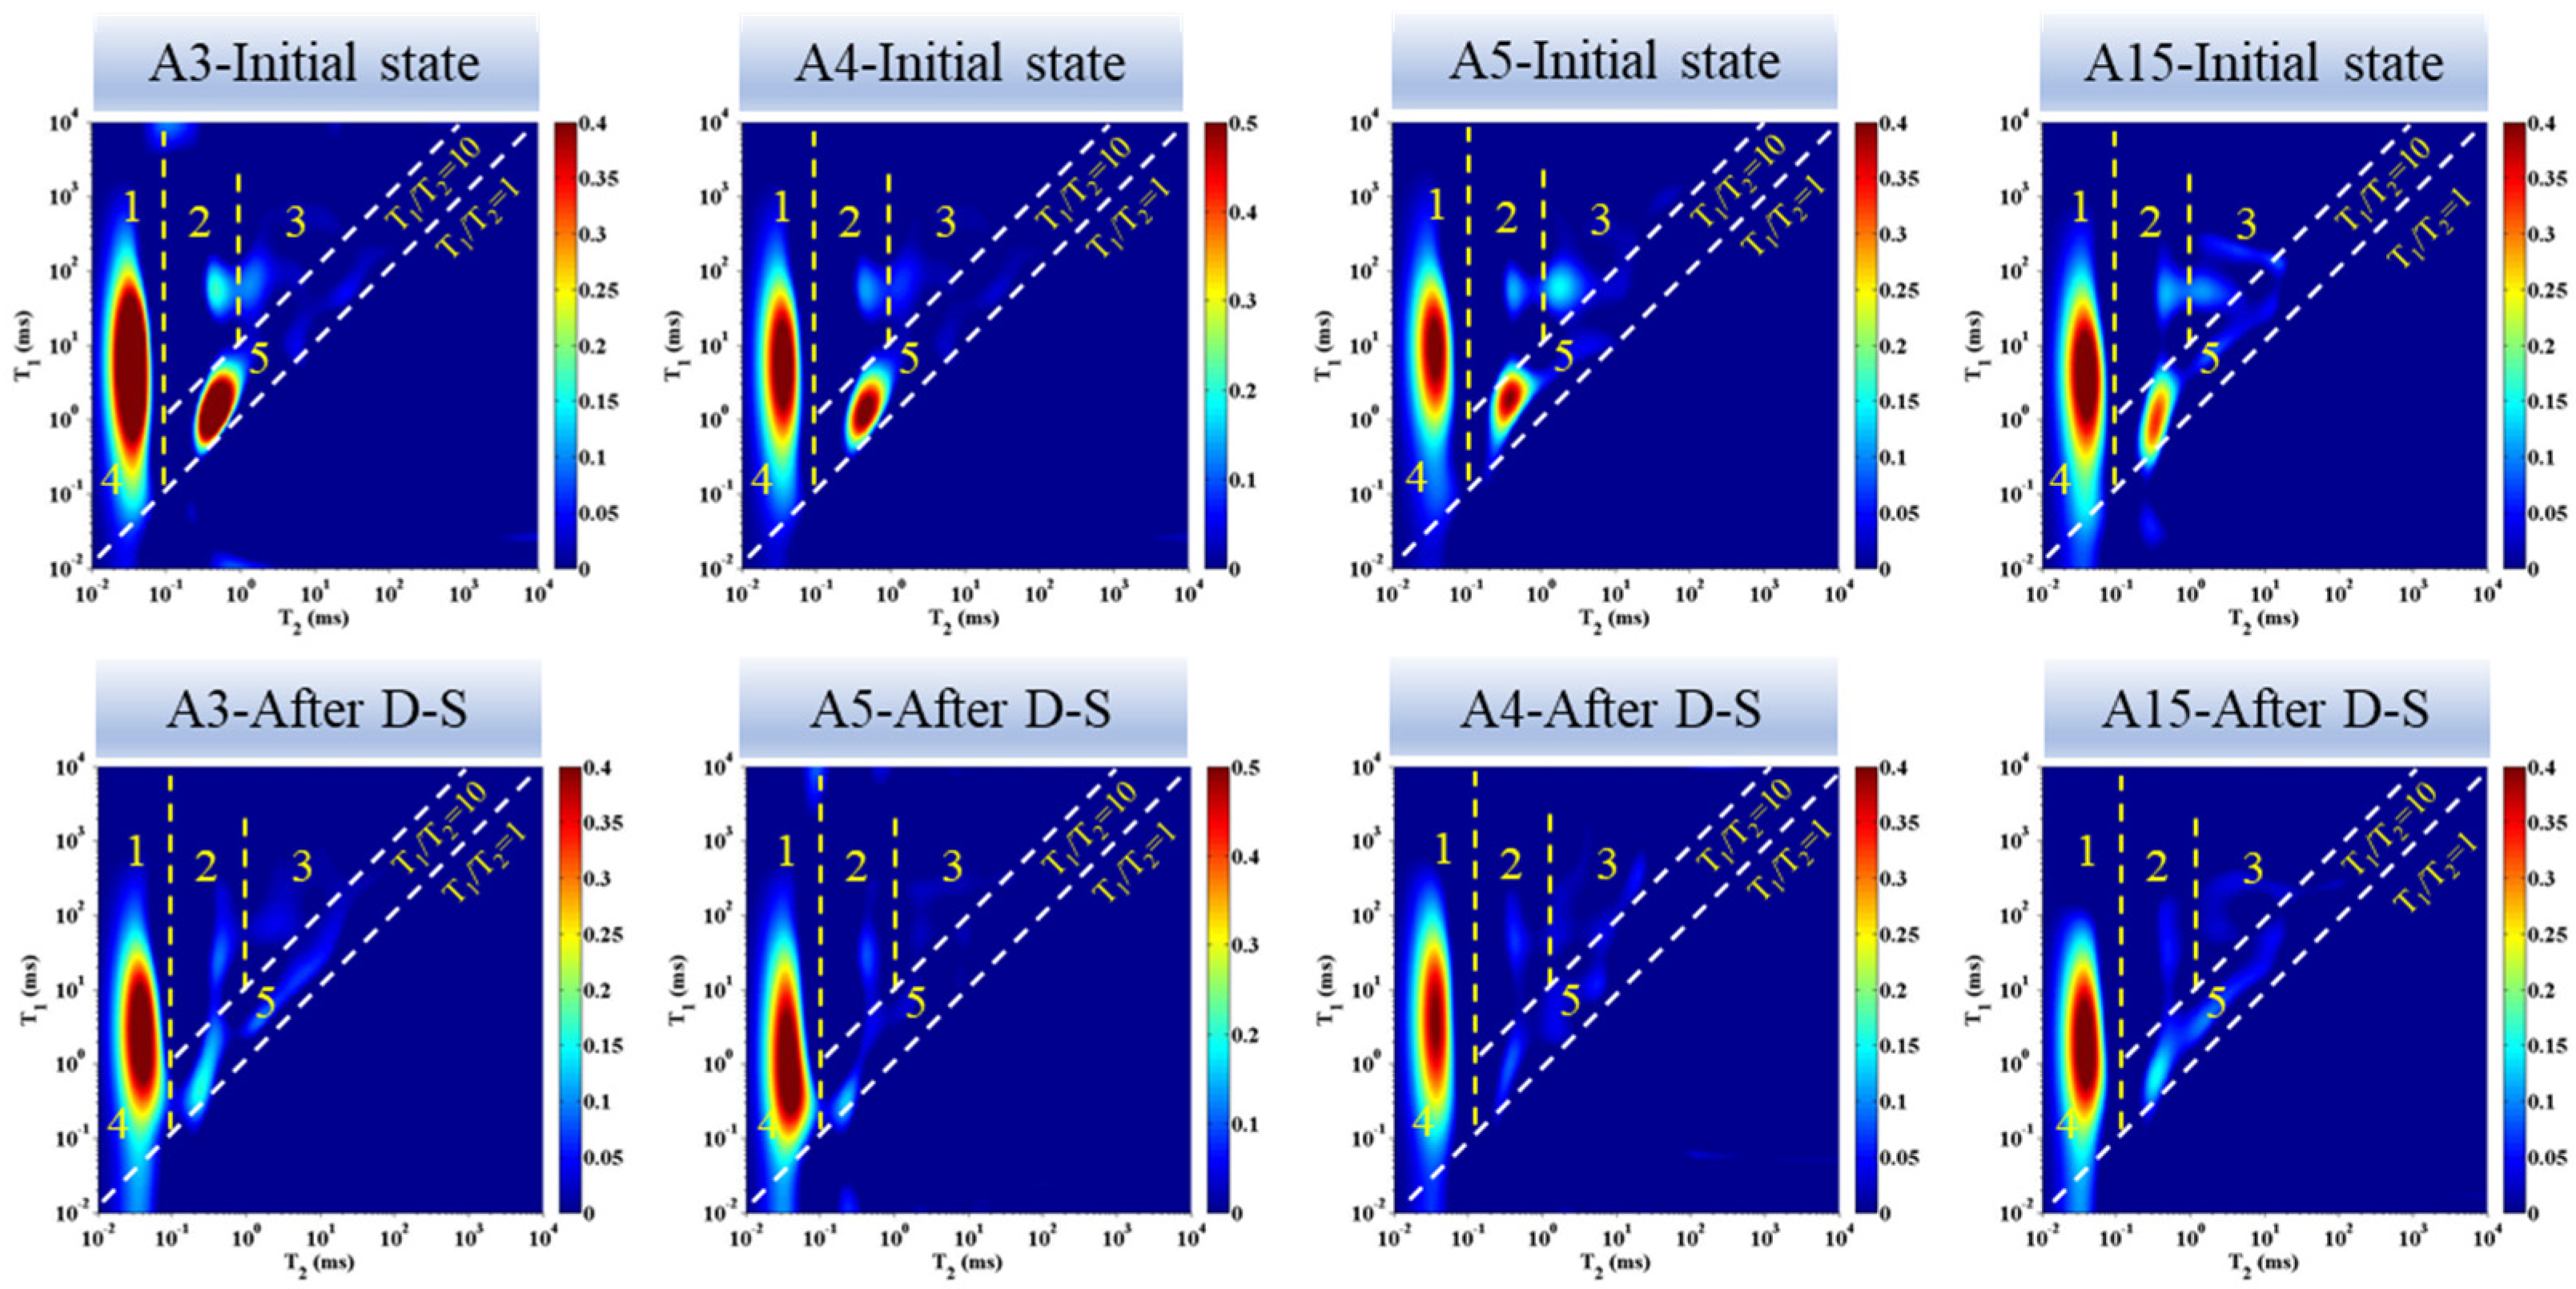
Figure 9 illustrates that there were significant differences between NMR T1–T2 spectra of the same sample before and after distillation extraction for different samples. Specifically, the highest proportion of loss was observed in region 5 (pore-bound water) and region 3 (free oil), while a small amount of residual oil remained in region 2 (adsorbed oil). Regions 1 (solid organic matter) and region 4 (adsorbed water, mineral hydroxyl groups, and structural water) showed no significant changes. This indicates that the distillation extraction method cannot completely remove pore fluids. This is in large part because this method cannot access fluids trapped in closed pores, while NMR analysis can effectively detect these fluids. Additionally, the results obtained from distillation extraction depended on the effectiveness of the organic solvent in dissolving the oil. However, for medium- to low-maturity shales, the oil washing effect is often poor. Li et al. found that after oil washing of medium- to low-maturity shales in the Jiyang Depression, the washing oil effect was generally around 60% [43]. This may be related to various factors such as the properties of the fluids in the shale samples, solvent properties, and experimental duration. The pore structure, size, and connectivity of the shale also play a role in determining the efficiency of fluid extraction as well [18,44].
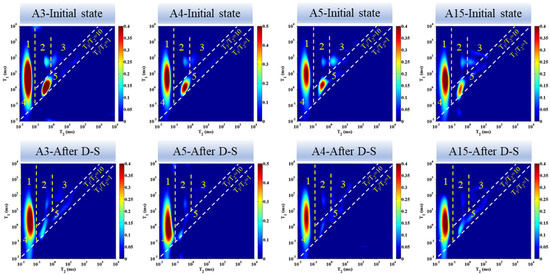
Figure 9.
Comparison of NMR T1–T2 spectra before and after distillation extraction for different shale samples.
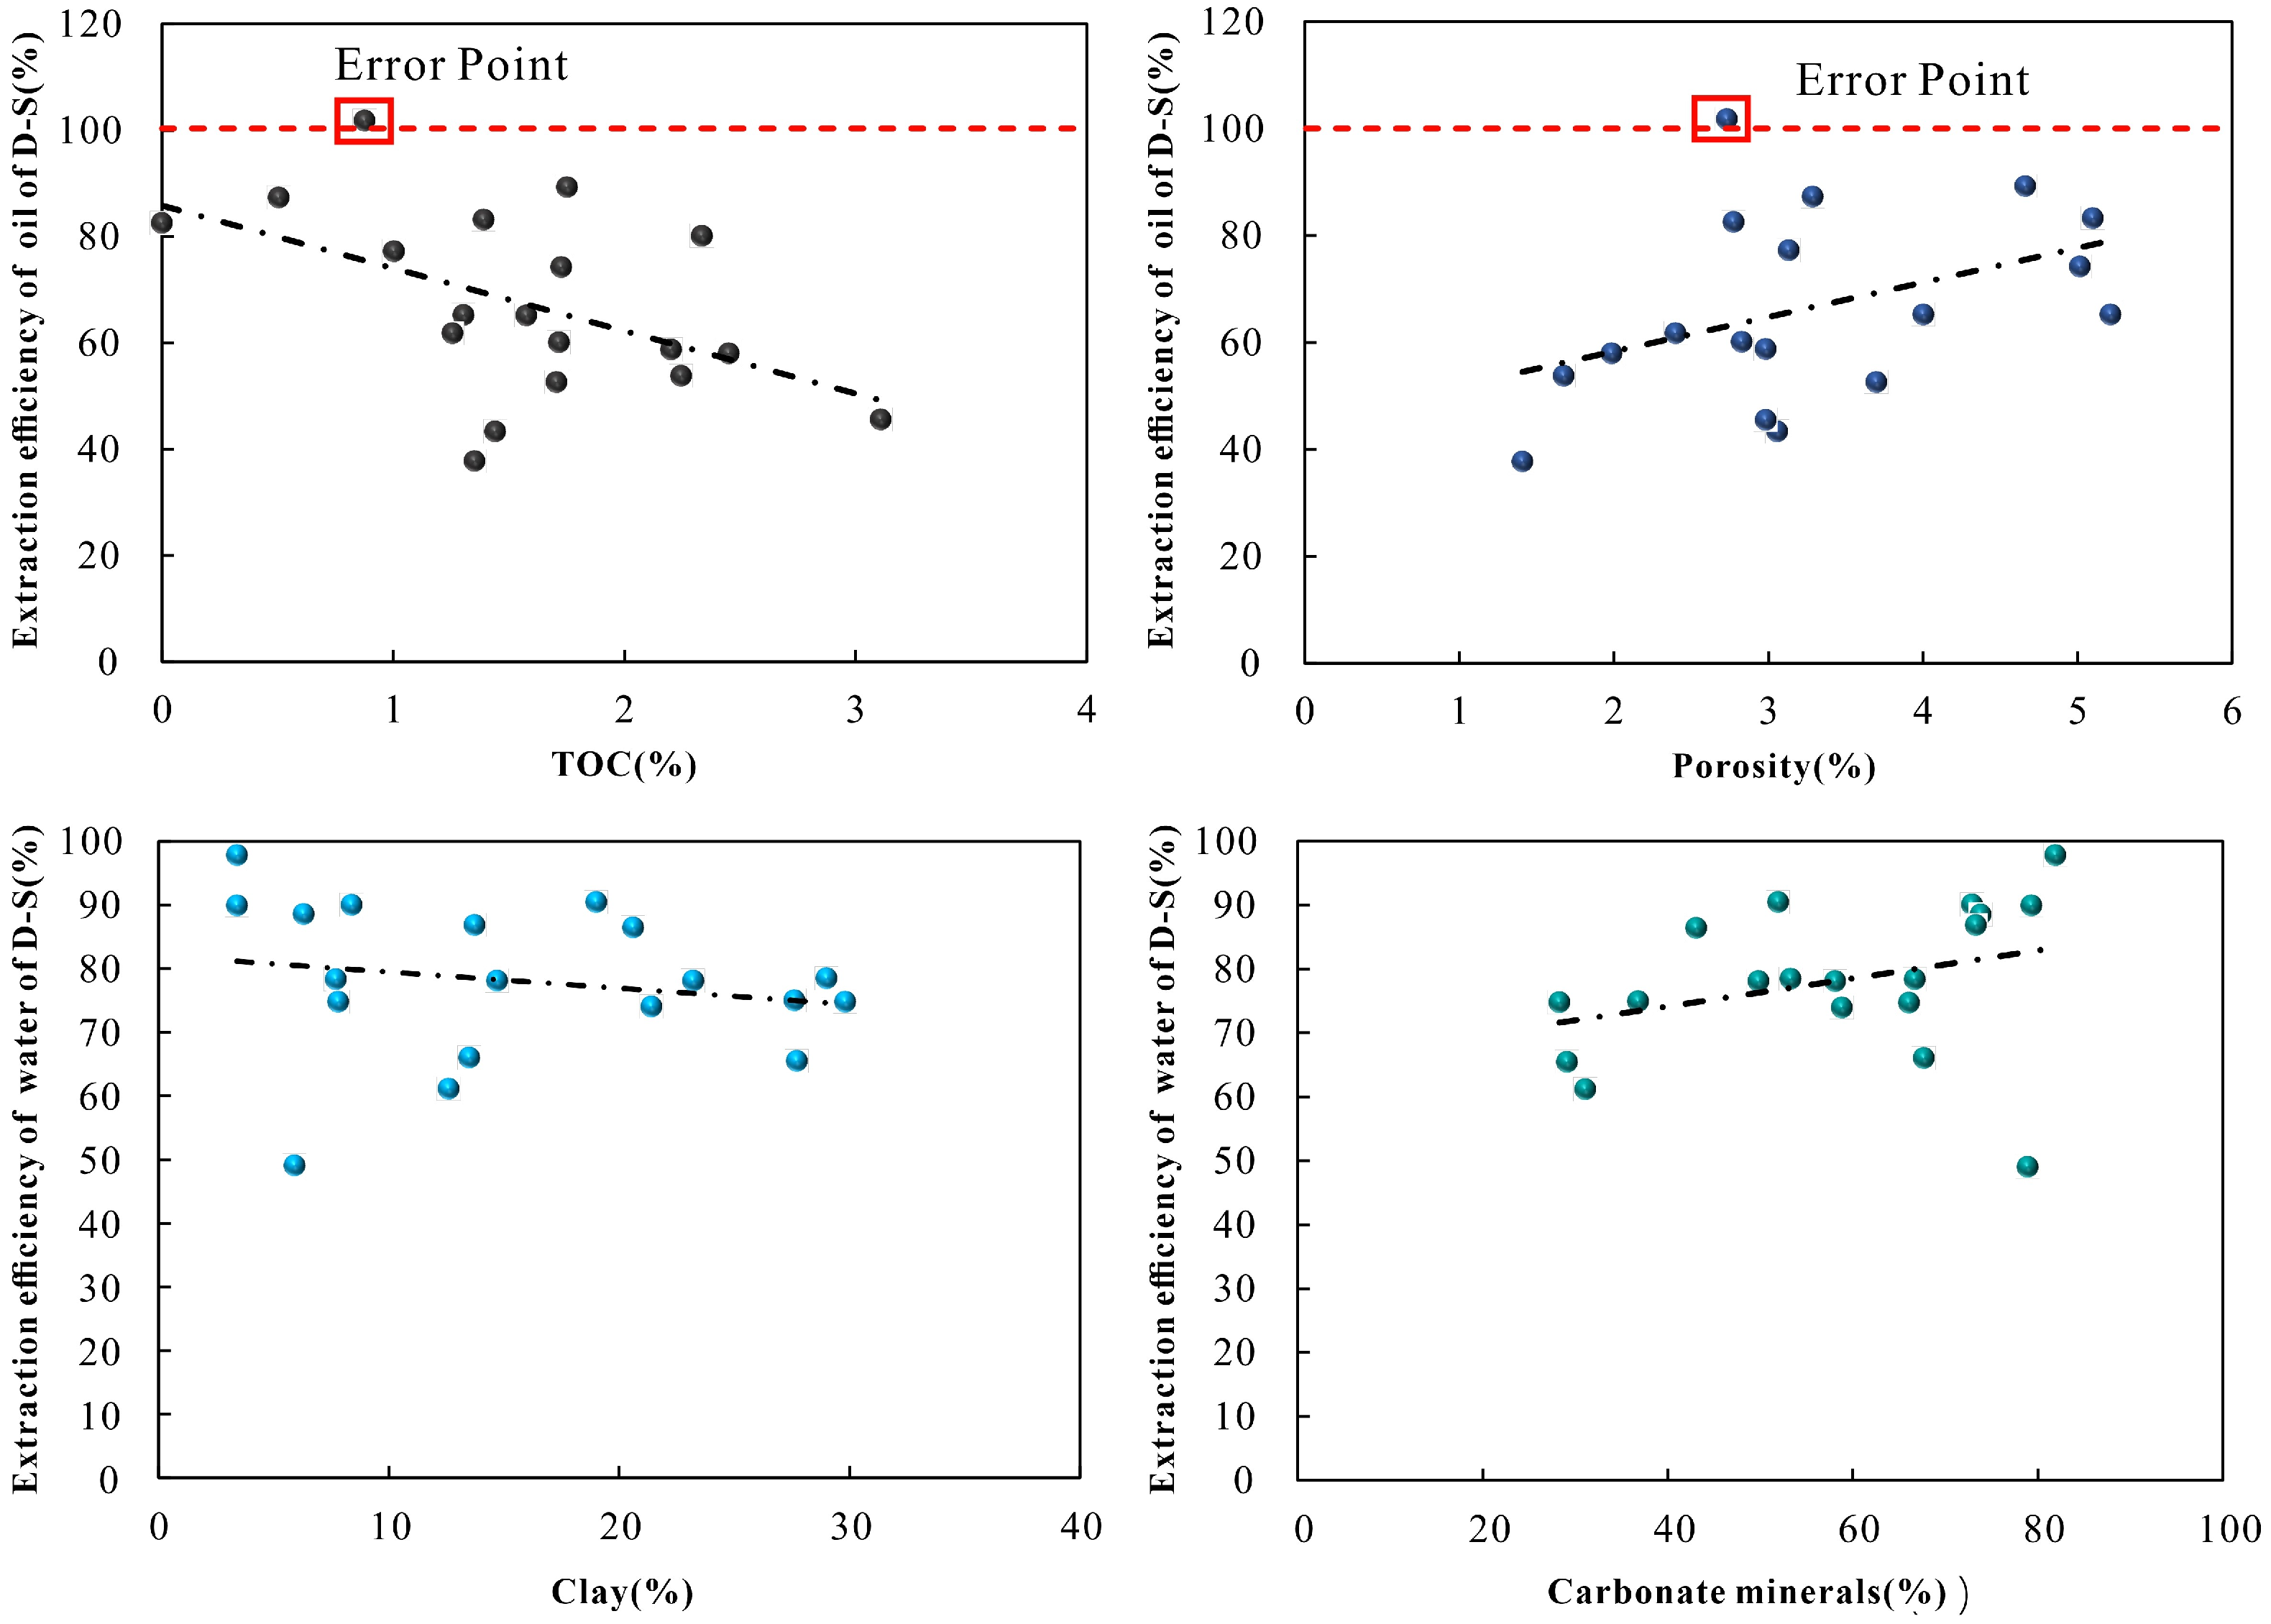
The ratio of the oil content and water content obtained by the Dean–Stark method to the total oil content and water content evaluated by nuclear magnetic resonance is defined as the extraction efficiency of oil and water. The statistical analysis shows that the extraction efficiency of the Dean–Stark method was negatively correlated with the organic matter content of shale samples, as shown in Figure 10. As the TOC increased, the efficiency of extraction of oil from shale gradually decreased. However, this does not necessarily mean a reduction in the total amount of extracted oil since it is possible for the extraction solvent to become saturated with the oil [18,45]. Additionally, porosity has a positive effect on the extraction efficiency of fluids, as larger pores provide better pathways for fluid extraction. The extraction efficiency of water during the distillation and extraction process is negatively correlated with clay content and positively correlated with carbonate minerals. An increase in clay content provides more bound water and closed pores, hindering the extraction of water from shale. In addition, the distillation and extraction yield of some shale samples is equal to or even exceeds the total fluid content, which may be due to the high clay content and well-developed bedding planes in these samples [46]. During the distillation and extraction process, there may be mass loss (chipping, fragmentation) of the shale samples, leading to an overestimation of the extraction yield.
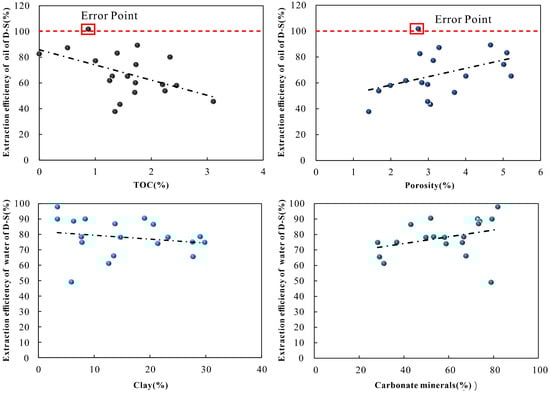
Figure 10.
Analysis of factors influencing distillation extraction efficiency.
4.4. Method Optimization
As illustrated above, the results of shale oil content obtained from different evaluation methods exhibited significant discrepancies. Consequently, the selection of an accurate method is crucial for ensuring the validity of the results. Firstly, regarding pyrolysis, although it has advantages such as mature technology, rapidity, cost-effectiveness, and minimal sample consumption, the loss of light hydrocarbons and the adsorption of heavy hydrocarbons are unavoidable. Moreover, an accepted method for the correction of light hydrocarbon loss and the retention of heavy hydrocarbons is not yet established. However, its results can serve as a reference for the lower limit of oil content. The distillation and extraction method, as a direct quantitative approach for shale fluids, performs well with medium- to high-maturity shales. However, the distillation and oil washing effects for low- to medium-maturity shales are generally poor [43], which may lead to an underestimation of shale oil content. Additionally, the distillation and extraction method requires a considerable amount of time, especially for shales with small pore throat radii and complex pore structures: a standard 2.5 cm diameter core plug can take approximately 20 to 35 days [17], significantly limiting the widespread application of this method. Extraction with organic solvents may also alter the wettability and original pore structure of the shale, hindering subsequent experimental analysis [47]. Furthermore, the Dean–Stark extraction method can only measure the oil and water content in the sample and is unable to determine the pore size and origins of the fluids. Nuclear magnetic resonance (NMR) technology, as an emerging technique, has significant advantages in characterizing fluid content and occurrence states in shale. Key technologies for NMR analysis of oil content include charts differentiating the different types of hydrogen-containing components in NMR and conversion relationships between fluid signals and mass. For sealed coring samples, the optimal method for oil content evaluation is to conduct two-dimensional NMR T1–T2 analyses immediately after thawing. This method provides the most comprehensive characterization of oil content and minimizes fluid loss due to sample storage or handling [36]. the NMR method avoids the issues associated with rock sample cleaning while maintaining the integrity of the core. The experimental procedure is also non-destructive, simple, and rapid, making it a suitable method for rapid assessment of shale oil contents. Additionally, this method can be combined with nuclear magnetic resonance logging to explore the effects of temperature, pressure, and other conditions on the occurrence state, thereby achieving a refined evaluation of shale oil.
5. Conclusions
(1) The comprehensive comparison of the results of the NMR, Dean–Stark, and Rock-Eval methods for evaluating the oil content in a low-mature shale demonstrated that the oil content obtained by the nuclear magnetic resonance method was the highest, followed by the distillation extraction method, while the pyrolysis method was the lowest. The analysis suggests that the nuclear magnetic resonance method can largely preserve the original fluid components of shale, and it has the additional advantages of a short analysis time and being non-destructive to the sample.
(2) Limited by various factors such as the nature of the shale sample, solvent properties, and experimental duration, residual oil and water fluids remain in immature to low-mature shale after distillation extraction, and the occurrence of numerous closed pores further leads to oil content measured by the Dean–Stark method being lower than that determined by NMR techniques.
(3) The degree of preservation of shale samples directly affects the accuracy of oil content determination. The exposure of shale samples to the open air leads to a significant loss of light hydrocarbon components. In addition, the crushing of samples the Rock-Eval analysis, combined with the requirement that the samples be placed in a non-sealed crucible for 5 min before pyrolysis, causes additional volatilization of fluid components. Consequently, the Rock-Eval method results in the lowest measured oil content among the three methods.
Author Contributions
Conceptualization, M.W. (Min Wang 1) and J.L.; methodology, M.W. (Min Wang 1); software, M.T.; validation, M.W. (Min Wang 2), X.Z. and S.Z.; formal analysis, M.W. (Min Wang 1).; investigation, S.Z.; resources, J.L.; data curation, X.Z.; writing—original draft preparation, M.W. (Min Wang 1); writing—review and editing, M.W. (Min Wang 2); visualization, M.T.; supervision, M.W. (Min Wang 2); project administration, J.L.; funding acquisition, J.L. All authors have read and agreed to the published version of the manuscript.
Funding
This research was funded by the Corporate Joint Fund of China (No. U24B6002), the Sinopec Forward-Looking Fundamental Project (No. P24184-2), and National Science and Technology Major Project (No. 2024ZD14001).
Data Availability Statement
The original contributions presented in this study are included in the article. Further inquiries can be directed to the corresponding author.
Acknowledgments
Financial support from the Corporate Joint Fund of China (No. U24B6002), the Sinopec Forward-Looking Fundamental Project (No. P24184-2), and National Science and Technology Major Project (No. 2024ZD14001) is acknowledged.
Conflicts of Interest
Authors Min Wang 1, Junliang Li, Shun Zhang and Min Tian were employed by Exploration and Development Research Institute, Shengli Oifield Company, SINOPEC. The remaining authors declare that the research was conducted in the absence of any commercial or financial relationships that could be construed as a potential conflict of interest.
Abbreviations
The following abbreviations are used in this manuscript:
| NMR | Nuclear magnetic resonance |
References
- U.S Energy Information Administration. World Shale Resource Assessments EB/0L. 24 September 2015. Available online: http://www.eia.gov/analysis/studies/worldshalegas/ (accessed on 18 June 2022).
- Du, J.H.; Hu, S.Y.; Pang, Z.L.; Lin, S.H.; Hou, L.H.; Zhu, R.K. The types, potentials and prospects of continental shale oil in China. China Pet. Explor. 2019, 24, 560–568. [Google Scholar]
- Zhao, W.Z.; Hu, S.Y.; Hou, L.H.; Yang, T.; Li, X.; Guo, B.C.; Yang, Z. Types and resource potential of continental shale oil in China and its boun dary with tight oil. Pet. Explor. Dev. 2020, 47, 1–11. [Google Scholar] [CrossRef]
- Jin, Z.J.; Zhang, Q.; Zhu, R.K.; Dong, L.; Fu, J.H.; Liu, H.M.; Yun, L.; Liu, G.Y.; Li, M.W.; Zhao, X.Z. Classification of lacustrine shale oil reservoirs in China and its significance. Oil Gas Geol. 2023, 4, 801–819. [Google Scholar]
- Huang, L.; Liu, J.; Zhang, F.; Dontsov, E.; Damjanac, B. Exploring the influence of rock inherent heterogeneity and grain size on hydraulic fracturing using discrete element modeling. Int. J. Solids Struct. 2019, 176, 207–220. [Google Scholar] [CrossRef]
- Fu, H.; Huang, L.; Hou, B.; Weng, D.W.; Guan, B.S.; Zhong, T.X.; Zhao, Y.L. Experimental and numerical investigation on interaction mechanism between hydraulic fracture and natural fracture. Rock Mech. Rock Eng. 2024, 57, 10571–10582. [Google Scholar] [CrossRef]
- Liu, H.; Li, J.; Liu, P.; Wang, X.; Wang, Y.; Qiu, Y.B.; Li, Z.; Wang, W.Q. Enrichment conditions and strategic exploration direction of Paleogene shale oil in Jiyang depression. Acta Pet. Sin. 2022, 43, 1717. [Google Scholar]
- Chen, Z.; Jiang, C. A revised method for organic porosity estimation in shale reservoirs using Rock-Eval data: Example from Duvernay Formation in the Western Canada Sedimentary Basin. AAPG Bull. 2016, 100, 405–422. [Google Scholar] [CrossRef]
- Jarvie, D.M. Components and processes affecting producibility and commerciality of shale resource systems. Geol. Acta Int. Earth Sci. J. 2014, 12, 307–325. [Google Scholar]
- Jiang, C.; Chen, Z.; Mort, A.; Milovic, M.; Robinson, R.; Stewart, R.; Lavoie, D. Hydrocarbon evaporative loss from shale core samples as revealed by Rock–Eval and thermal desorption-gas chromatography analysis: Its geochemical and geological implications. Mar. Pet. Geol. 2016, 70, 294–303. [Google Scholar] [CrossRef]
- Cao, H.; Zou, Y.R.; Lei, Y.; Xi, D.P.; Wan, X.Q.; Peng, P.A. Shale oil assessment for the Songliao Basin, northeastern China, using oil generation–sorption method. Energy Fuels 2017, 31, 4826–4842. [Google Scholar] [CrossRef]
- Xue, H.; Tian, S.; Wang, W.; Zhang, W.; Mu, G. Correction of oil content—One key parameter in shale oil resource assessment. Oil Gas Geol. 2016, 37, 15–22. [Google Scholar]
- Li, Z.; Zou, Y.R.; Xu, X.Y.; Sun, J.N.; Li, M. Adsorption of mudstone source rock for shale oil–Experiments, model and a case study. Org. Geochem. 2016, 92, 55–62. [Google Scholar] [CrossRef]
- Li, J.; Wang, M.; Lu, S.; Liu, L.; Li, M.; Zhang, Y.C.; Wang, X.; Zhao, X.B.; Zhang, J.Y.; Zhao, Y. Quantitative evaluation model of shale oil adsorption: A case study of the first member of Cretaceous Qingshankou Formation in northern Songliao Basin, NE China. Pet. Explor. Dev. 2023, 50, 1137–1150. [Google Scholar] [CrossRef]
- Dean, E.W.; Stark, D.D. A Convenient Method for the Determination of Water in Petroleum and Other Organic Emulsions. Ind. Eng. Chem. 1920, 12, 486–490. [Google Scholar] [CrossRef]
- Luffel, D.L.; Guidry, F.K. New core analysis methods for measuring reservoir rock properties of Devonian shale. J. Pet. Technol. 1992, 44, 1184–1190. [Google Scholar] [CrossRef]
- Luffel, D.L. Devonian shale matrix permeability successfully measured on cores and drill cuttings. Gas Shales Technol. Rev. 1993, 8, 46–55. [Google Scholar]
- DiStefano, V.H.; McFarlane, J.; Stack, A.G.; Perfect, E.; Mildner, D.F.; Bleuel, M.; Anovitz, L.M. Solvent-pore interactions in the Eagle Ford shale formation. Fuel 2019, 238, 298–311. [Google Scholar] [CrossRef]
- Liu, B.; Bai, L.; Chi, Y.; Jia, R.; Fu, X.; Yang, L. Geochemical characterization and quantitative evaluation of shale oil reservoir by two-dimensional nuclear magnetic resonance and quantitative grain fluorescence on extract: A case study from the Qingshankou Formation in Southern Songliao Basin, northeast China. Mar. Pet. Geol. 2019, 109, 561–573. [Google Scholar]
- Mukhametdinova, A.; Habina-Skrzyniarz, I.; Krzyżak, A. NMR relaxometry interpretation of source rock liquid saturation—A holistic approach. Mar. Pet. Geol. 2021, 132, 105165. [Google Scholar] [CrossRef]
- Khatibi, S.; Ostadhassan, M.; Xie, Z.H.; Gentzis, T.; Bubach, B.; Gan, Z.; Carvajal-Ortiz, H. NMR relaxometry a new approach to detect geochemical properties of organic matter in tight shales. Fuel 2019, 235, 167–177. [Google Scholar] [CrossRef]
- Tian, W.; Lu, S.; Zhang, J.; Gao, Y.; Huang, W.; Wen, Z.; Li, J. NMR characterization of fluid mobility in low-permeability conglomerates: An experimental investigation of spon-taneous imbibition and flooding. J. Pet. Sci. Eng. 2022, 214, 110483. [Google Scholar] [CrossRef]
- Na, J.G.; Im, C.H.; Chung, S.H.; Lee, K.B. Effect of oil shale retorting temperature on shale oil yield and properties. Fuel 2012, 95, 131–135. [Google Scholar] [CrossRef]
- Handwerger, D.A.; Suarez-Rivera, R.; Vaughn, K.I.; Keller, J.F. Improved petrophysical core measurements on tight shale reservoirs using retort and crushed samples. In Proceedings of the SPE Annual Technical Conference and Exhibition, Denver, CO, USA, 30 October–2 November 2011. [Google Scholar]
- Chen, H.; Firdaus, G.; Heidari, Z. Impact of anisotropic nature of organic-rich source rocks on electrical resistivity measurements. In Proceedings of the SPWLA Annual Logging Symposium, Abu Dhabi, United Arab Emirates, 18–22 May 2014; SPWLA: Houston, TX, USA, 2014. SPWLA-2014-CCC. [Google Scholar]
- Qiu, N.S.; Su, X.G.; LI, Z.Y.; Liu, Z.Q.; Li, Z. The Cenozoic Tectono-Thermal Evolution of Jiyang Depression, Bohai Bay Basin, East China. Chin. J. Geophys. 2006, 49, 1015–1024. [Google Scholar]
- Lin, Z.K.; Zhang, S.L.; Li, C.H.; Wang, M.; Yan, J.P.; Cai, J.G.; Hu, Q.H. Types of shale lithofacies assemblage and its significance for shale oil exploration: A case study of Shahejie Formation in Boxing Sag. Pet. Reserv. Eval. Dev 2023, 13, 39–51. [Google Scholar]
- Wang, M.; Fu, A.B.; Li, J.B.; Du, Z.J. Movable oil saturation determination of shale in Boxing Depression based on 2-D NMR. Geol. Rev. 2021, 67, 265–266. [Google Scholar]
- Zhang, L.Y.; Bao, S.Y.; Li, J.Y.; Li, Z.; Zhu, R.F.; Zhang, J.G. Movability of lacustrine shale oil: A case study of Dongying Sag, Jiyang Depression, Bohai Bay Basin. Pet. Explor. Dev. 2014, 41, 703–711. [Google Scholar] [CrossRef]
- GB/T 19145-2022; Determination for Total Organic Carbon in Sedimentary Rock. State Administration for Market Regulation (SAMR): Beijing, China, 2022.
- GB/T 18602-2012; Rock Pyrolysis Analysis. State Administration for Market Regulation (SAMR): Beijing, China, 2012.
- SY/T 5163-2018; Analysis Method for Clay Minerals and Ordinary Non-Clay Minerals in Sedimentary Rocks by the X-Ray Diffraction. National Energy Administration: Beijing, China, 2019.
- Li, J.; Jiang, C.; Wang, M.; Lu, S.; Chen, Z.; Chen, G.; Lu, S. Adsorbed and free hydrocarbons in unconventional shale reservoir: A new insight from NMR T1-T2 maps. Mar. Pet. Geol. 2020, 116, 104311. [Google Scholar] [CrossRef]
- GB/T 29172-2012; Practices for Core Analysis. State Administration for Market Regulation (SAMR): Beijing, China, 2012.
- Xiong, C.; Ding, B.; Geng, X.; Guan, B.; Pan, J.; Dong, J.; Yan, Y. Quantitative analysis on distribution of microcosmic residual oil in reservoirs by frozen phase and nuclear magnetic resonance (NMR) technology. J. Pet. Sci. Eng. 2020, 192, 107256. [Google Scholar] [CrossRef]
- Li, J.; Wang, M.; Fei, J.; Xu, L.; Shao, H.; Li, M.; Lu, S. Determination of in situ hydrocarbon contents in shale oil plays. Part 2: Two-dimensional nuclear magnetic resonance (2D NMR) as a potential approach to characterize preserved cores. Mar. Pet. Geol. 2022, 145, 105890. [Google Scholar] [CrossRef]
- Li, J.; Huang, W.; Lu, S.; Wang, M.; Chen, G.; Tian, W.; Guo, Z. Nuclear magnetic resonance T 1–T 2 map division method for hydrogen-bearing components in continental shale. Energy Fuels 2018, 32, 9043–9054. [Google Scholar] [CrossRef]
- Song, Y.Q.; Kausik, R. NMR application in unconventional shale reservoirs–A new porous media research frontier. Prog. Nucl. Magn. Reson. Spectrosc. 2019, 112, 17–33. [Google Scholar] [CrossRef] [PubMed]
- Wang, M.; Guo, Z.; Jiao, C.; Lu, S.; Li, J.; Xue, H.; Chen, G. Exploration progress and geochemical features of lacustrine shale oils in China. J. Pet. Sci. Eng. 2019, 178, 975–986. [Google Scholar] [CrossRef]
- Ma, W.; Li, J.; Wang, M. Determination of in situ hydrocarbon contents in shale oil plays: Part 3: Quantification of light hydrocarbon evaporative loss in old cores based on preserved shales. Mar. Pet. Geol. 2024, 160, 106574. [Google Scholar] [CrossRef]
- Zhu, R.; Zhang, L.; Li, J.; Liu, Q.; Li, Z.; Wang, R.; Zhang, L. Quantitative evaluation of residual liquid hydrocarbons in shale. Acta Pet. Sin. 2015, 36, 13. [Google Scholar]
- Javie, D.M. Shale resource systems for oil and gas: Part I—Shale gas resource systems. Part II—Shale oil resource systems. Shale reservoirs-giant resources for the 21st century. AAPG Mem. 2012, 97, 69–87. [Google Scholar]
- Li, J.; Wang, M.; Li, J.; Zhao, X.; Hu, X.; Fu, A. Shale primary porosimetry based on 2D nuclear magnetic resonance of T1-T2. Energy Geosci. 2024, 5, 100270. [Google Scholar] [CrossRef]
- Lin, X.; Huang, M.; Chen, H.; Wang, J.; Wang, R. Influence of different polar solvent extraction on pore structure in shale. Acta Pet. Sin. 2019, 40, 1485. [Google Scholar]
- Mohnhoff, D.; Littke, R.; Krooss, B.M.; Weniger, P. Show more Flow-through extraction of oil and gas shales under controlled stress using organic solvents: Implications for organic matter-related porosity and permeability changes with thermal maturity. Int. J. Coal Geol. 2016, 157, 84–99. [Google Scholar] [CrossRef]
- Handwerger, D.A.; Willberg, D.; Pagels, M.; Rowland, B.; Keller, J.F. Reconciling retort versus Dean Stark measurements on tight shales. In Proceedings of the SPE Annual Technical Conference and Exhibition, San Antonio, TX, USA, 8–10 October 2012; SPE: Richardson, TX, USA, 2012. SPE-159976-MS. [Google Scholar]
- Sun, J.; Dong, X.; Wang, J.; Schmitt, D.R.; Xu, C.; Mohammed, T.; Chen, D. Measurement of total porosity for gas shales by gas injection porosimetry (GIP) method. Fuel 2016, 186, 694–707. [Google Scholar] [CrossRef]
Disclaimer/Publisher’s Note: The statements, opinions and data contained in all publications are solely those of the individual author(s) and contributor(s) and not of MDPI and/or the editor(s). MDPI and/or the editor(s) disclaim responsibility for any injury to people or property resulting from any ideas, methods, instructions or products referred to in the content. |
© 2025 by the authors. Licensee MDPI, Basel, Switzerland. This article is an open access article distributed under the terms and conditions of the Creative Commons Attribution (CC BY) license (https://creativecommons.org/licenses/by/4.0/).