Article

Improved Multi-Objective Strategy Diversity Chaotic Particle Swarm Optimization of Ordered Charging Strategy for Electric Vehicles Considering User Behavior

1
Sydney Smart Technology College, Northeastern University, Qinhuangdao 066004, China
2
School of Accounting and Finance, Taylor’s University, Selangor 47500, Malaysia
3
School of Electronics Science, National University of Defense Technology, Changsha 410073, China
4
School of Intelligent Transportation Engineering, Guangdong Communication Polytechnic, Guangzhou 510800, China
*
Author to whom correspondence should be addressed.
Energies 2025, 18(3), 690; https://doi.org/10.3390/en18030690
Submission received: 25 December 2024 / Revised: 28 January 2025 / Accepted: 31 January 2025 / Published: 2 February 2025

Abstract

:
With the development of the EV industry, the number of EVs is increasing, and the random charging and discharging causes a great burden on the power grid. Meanwhile, the increasing electricity bills reduce user satisfaction. This article proposes an algorithm that considers user satisfaction to solve the charging and discharging scheduling problem of EVs. This article adds an objective function to quantify user satisfaction and addresses the issues of premature local optima and insufficient diversity in the MOPSO algorithm. Based on the performance of different particles, the algorithm assigns elite particle, general particle, and learning particle roles to the particles and assigns strategies for maintaining search, developing search, and learning search, respectively. In order to avoid falling into local optima, chaotic sequence perturbations are added during each iteration process avoiding premature falling into local optima. Finally, case studies are implemented and the comparison analysis is performed in terms of the use and benefit of each design feature of the algorithm. The results show that the proposed algorithm is capable of achieving up to 23% microgrid load reduction and up to 20% improvement in convergence speed compared to other algorithms. It is superior to other algorithms in solving the problem of orderly charging and discharging of electric vehicles and has strong usability and feasibility.

1. Introduction

Electric vehicles (EVs) are a new type of environmentally friendly transportation that utilizes clean energy, significantly reducing carbon emissions and energy waste. EVs not only serve as a means of transportation but also function as temporary energy storage devices [1]. Against the backdrop of rapid EV development, this paper aims to reduce the dependence on fossil fuels in the energy system [2,3,4]. EVs are connected to microgrids to establish a fundamental vehicle-to-grid (V2G) network. In this manner, EVs serve as decentralized power sources for supplying charging demand [5]. In the meantime, there exist distributed energy sources that are integrated with buildings, homes, and EVs, among others [6,7,8,9]. At present, rooftop photovoltaic power generation represents an important means of the requirements of V2G [10,11].
Furthermore, the model construction incorporates users’ satisfaction as one of the objective functions. For users, the primary influencing factors are the economic viability and convenience of accessing microgrids [12,13]. The economic satisfaction can typically be gauged by the profitability that users derive from their use of EVs, while convenience satisfaction can be measured by the inconvenience that users experience when implementing scheduling measures for their travels [14,15,16].
To address the nonlinear and multi-objective optimization problem arising from the integration of EVs into the network, numerous classical optimization algorithms have been proposed [17,18,19,20,21,22,23,24,25,26,27,28,29], including particle swarm optimization [17,18,19], genetic algorithm [20,21,22], artificial bee colony algorithm [23,24], ant colony algorithm [25,26] and simulated annealing algorithm [27,28,29]. Salman proposed an improved PSO algorithm to obtain the economic dispatch compared with the traditional genetic algorithm (GA) output for a microgrid, EVs are considered one of the dispatchable energy sources [30]. Wang proposed a dual-population-based co-evolutionary algorithm (DPCA) to optimize the charging decisions of EVs and the routing strategies of EVs at the same time [31]. Luo proposed a two-stage heuristic algorithm driven by a dynamic programming process to minimize the travel and total recharging costs of EVs in microgrids [32]. Although the above algorithms are easy to operate, it has been reported that these algorithms exhibit limited search capabilities, suboptimal convergence performance, and a tendency to become trapped in local optima. To address the aforementioned issues, a plethora of enhanced algorithms targeting these heuristic algorithms have emerged. Eltamaly proposed a NESTPSO algorithm, which used two nested PSO searching loops, the inner one contained the original objective function, and the outer one used the inner PSO as a fitness function. The control parameters and the swarm size acted as the optimization variables for the outer loop with regard to the limited search capability and suboptimal results of the GA [33]. Kanpur et al. proposed an improved algorithm called NSGA2 [34,35]. Unlike NSGA, which utilizes an elite strategy to select the optimal solution, NSGA2 expands the dimensionality of the objective space and adds multiple objectives. This algorithm employs a non-dominated sorting approach, which involves an initial sorting of the candidate solutions followed by the selection of winners based on a crowding strategy. This strategy yields a set of non-dominated solutions compared to the elite strategy. Additionally, NSGA2 enhances the crowding strategy by incorporating neighborhood factors to evaluate and select solutions based on population sparsity and uniformity, resulting in improved convergence and efficiency. Due to the introduction of EVs, numerous nonlinear constraints arise, making the optimization results of traditional particle swarm algorithms unsatisfactory. Furthermore, the stochastic nature of EV users’ travel patterns poses challenges in modeling. To address these issues, Zhang et al. proposed the utilization of Monte Carlo simulation to model user travels and construct the required models [36]. Alatas et al. proposed a method of incorporating chaotic perturbations into the particle swarm algorithm [37,38], which can improve the quality of initial solutions, enhance population diversity, and improve the search and exploration performance of the algorithm, thus avoiding local optima.
As intelligent algorithms are more advantageous in solving complex nonlinear problems, an increasing amount of research is focused on utilizing evolutionary algorithms and swarm intelligence algorithms to address the orderly charging and discharging problems of EVs. Examples of these algorithms include differential evolution (DE) [39,40], Grey Wolf Optimization (GWO) [41,42], and sparrow search algorithms [43], etc.
Although the aforementioned intelligent algorithms have made progress in addressing the issue of ordered charging and discharging of EVs, there still exist challenges such as insufficient population diversity and local optima. To tackle these challenges, the concept of multi-role and multi-strategy is proposed, where particles are categorized and assigned different search strategies to effectively explore the solution space and enhance population diversity. However, there is room for further improvement in terms of addressing local optima for these algorithms. For instance, Xu et al. proposed dividing particles into multiple subgroups to execute different search strategies and evaluated the performance of each subgroup using the DE algorithm to obtain the best-diversified search strategy [44]. Li et al. divided the population into four groups and allocated the best strategies to the top-ranked groups based on a ranking scheme [45]. Ali et al. automatically divided the population of the solution space into cells of cellular automata units, with each unit maintaining a certain number of particles, and utilized the exploring capability of quantum particles to find local optima [46].
However, despite the significant improvements achieved by the aforementioned multi-role and multi-strategy algorithms through grouping particles and executing different search strategies, there is still a need to enhance the quality of initial solutions and accelerate convergence speed. To address this issue, an improved multi-objective strategy diversity chaotic particle swarm optimization (IMSDC-PSO) is proposed, which makes two contributions compared to existing studies:
(1)
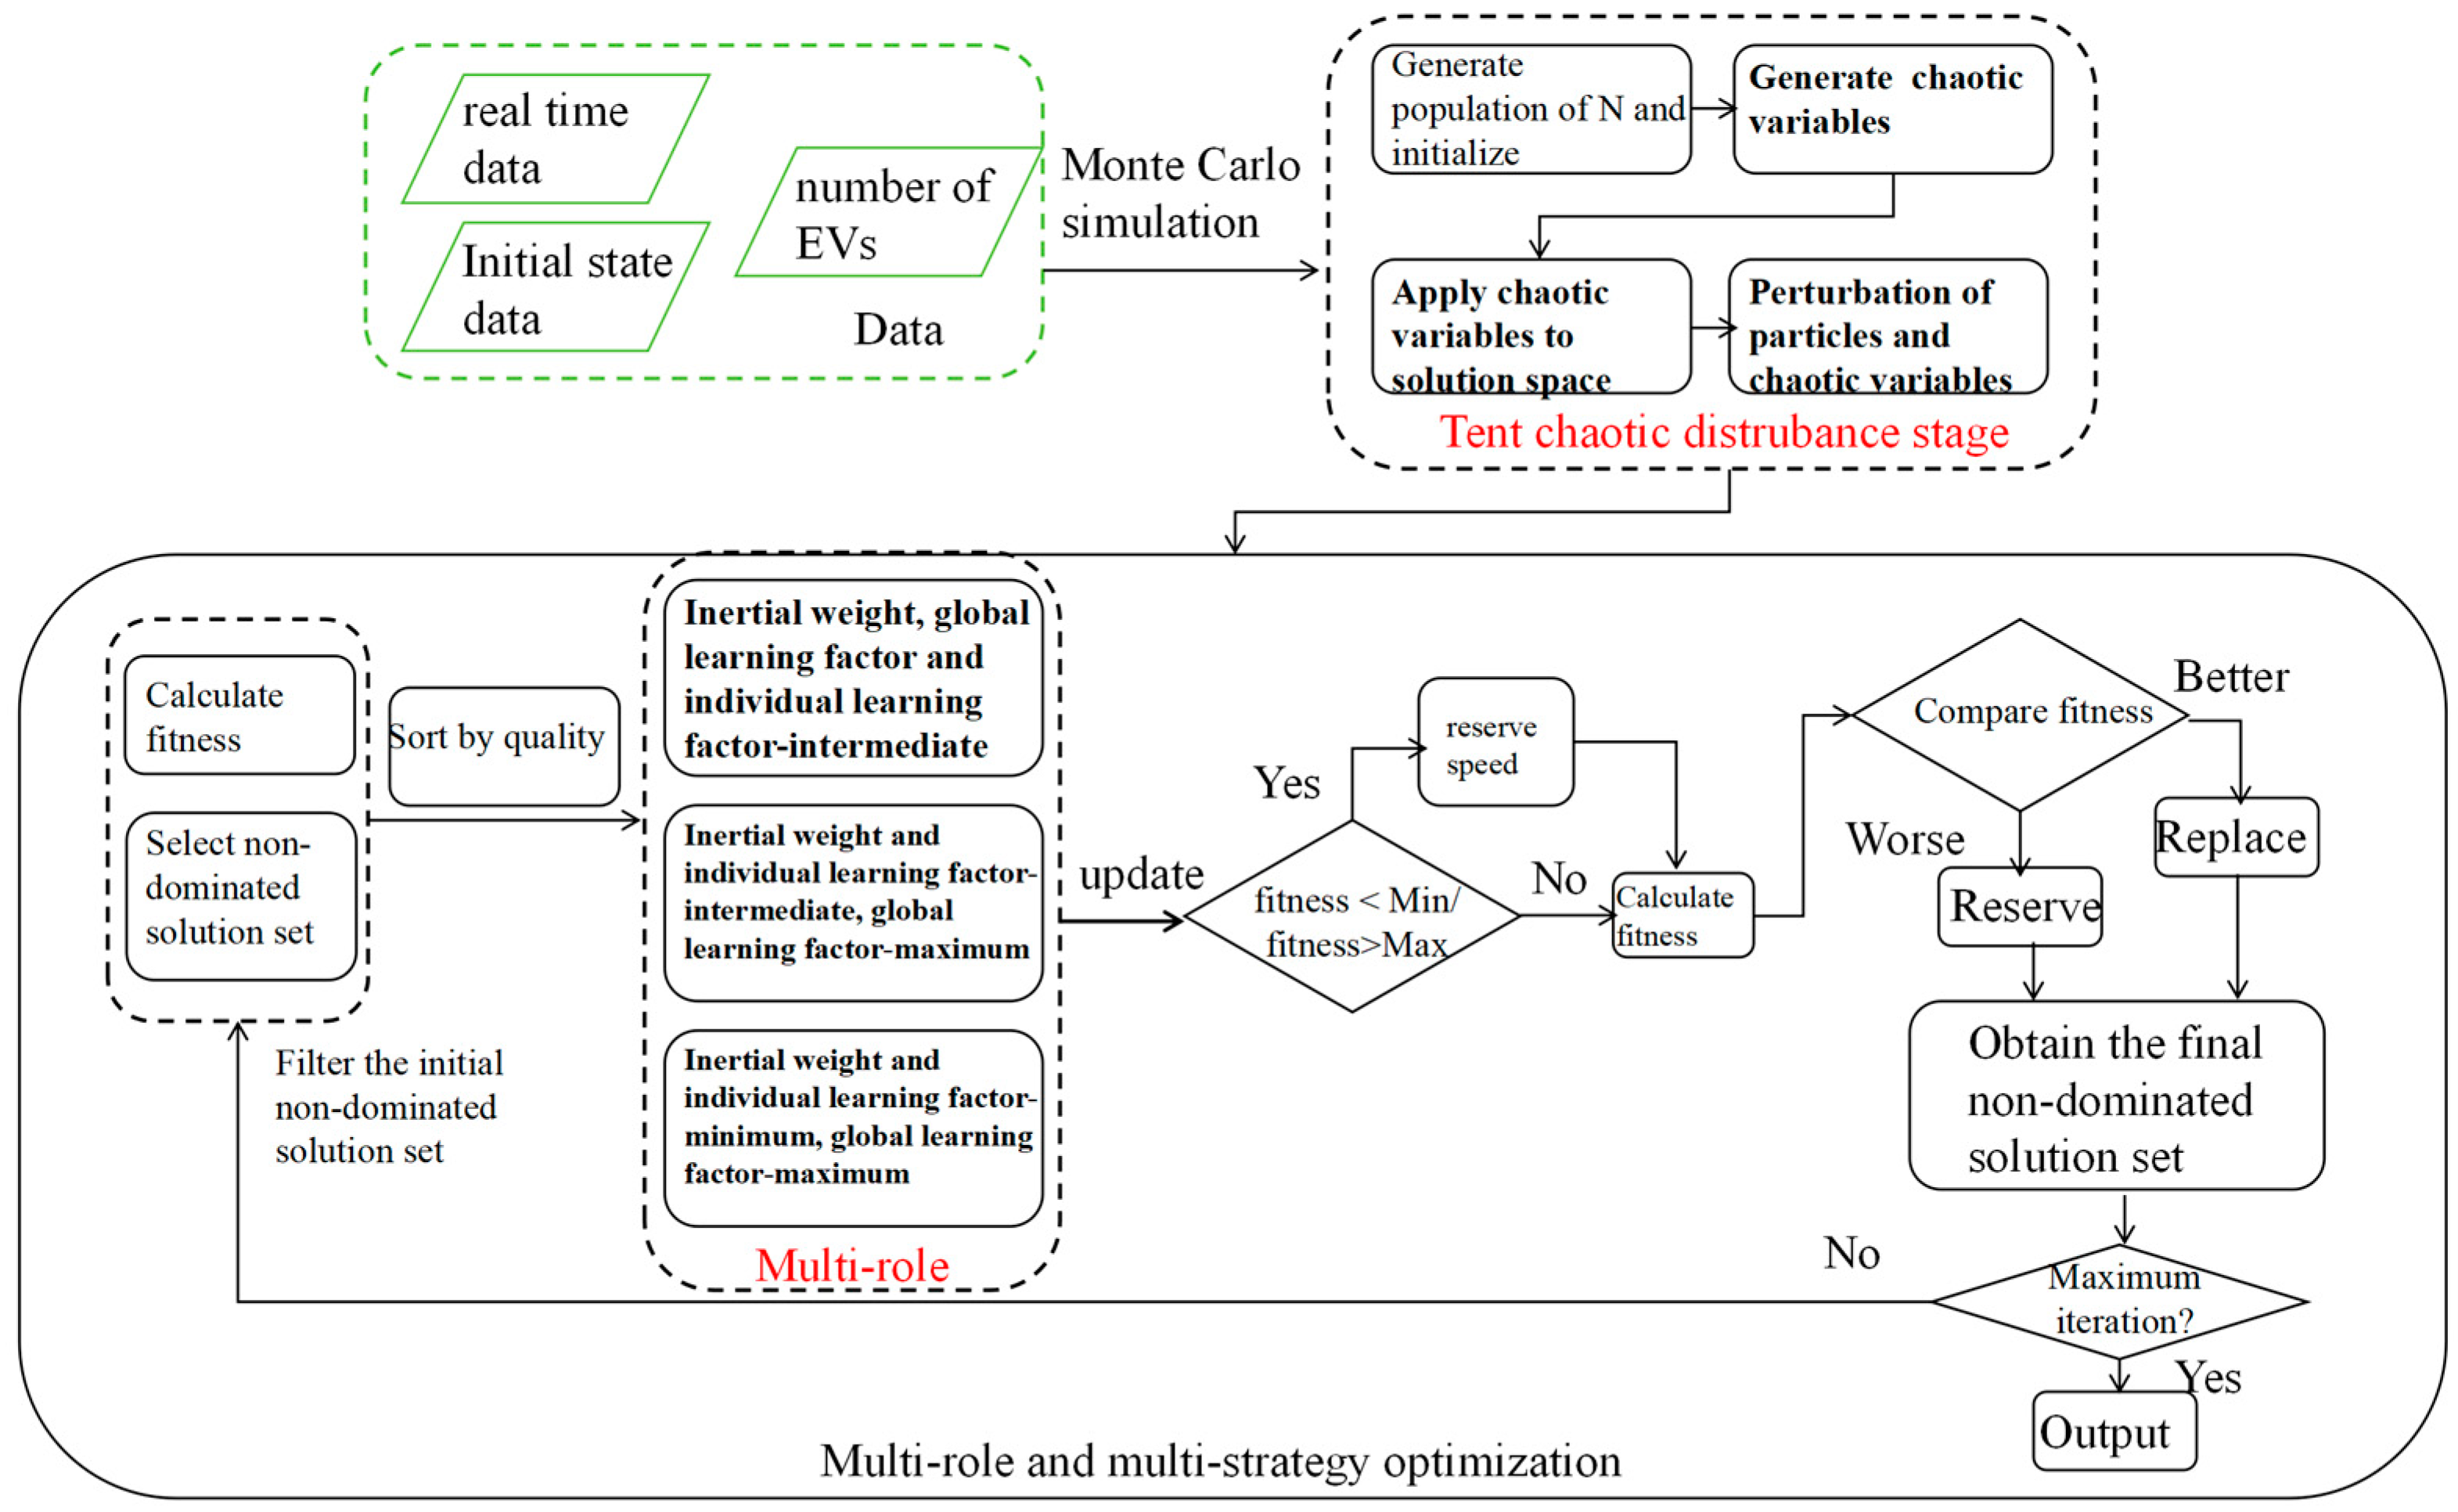
Multi-role multi-strategy optimization mechanism: The particles are first sorted using the non-dominated sorting method to obtain their hierarchy. Then, different search strategies are applied to particles based on their hierarchy and density. Specifically, particles with great diversity and convergence are categorized as elite particles, which are closest to the global optimum. They are assigned intermediate values of the learning factor and inertia weight. General particles have slightly lower performance but still need to converge towards the global optimum at a faster rate. They are assigned larger global learning factors, while their personal learning factors and inertia weights are set to intermediate values. Poor-performing particles adopt the maximum global learning factor smaller personal learning factors and inertia weights to improve their search capability;
(2)
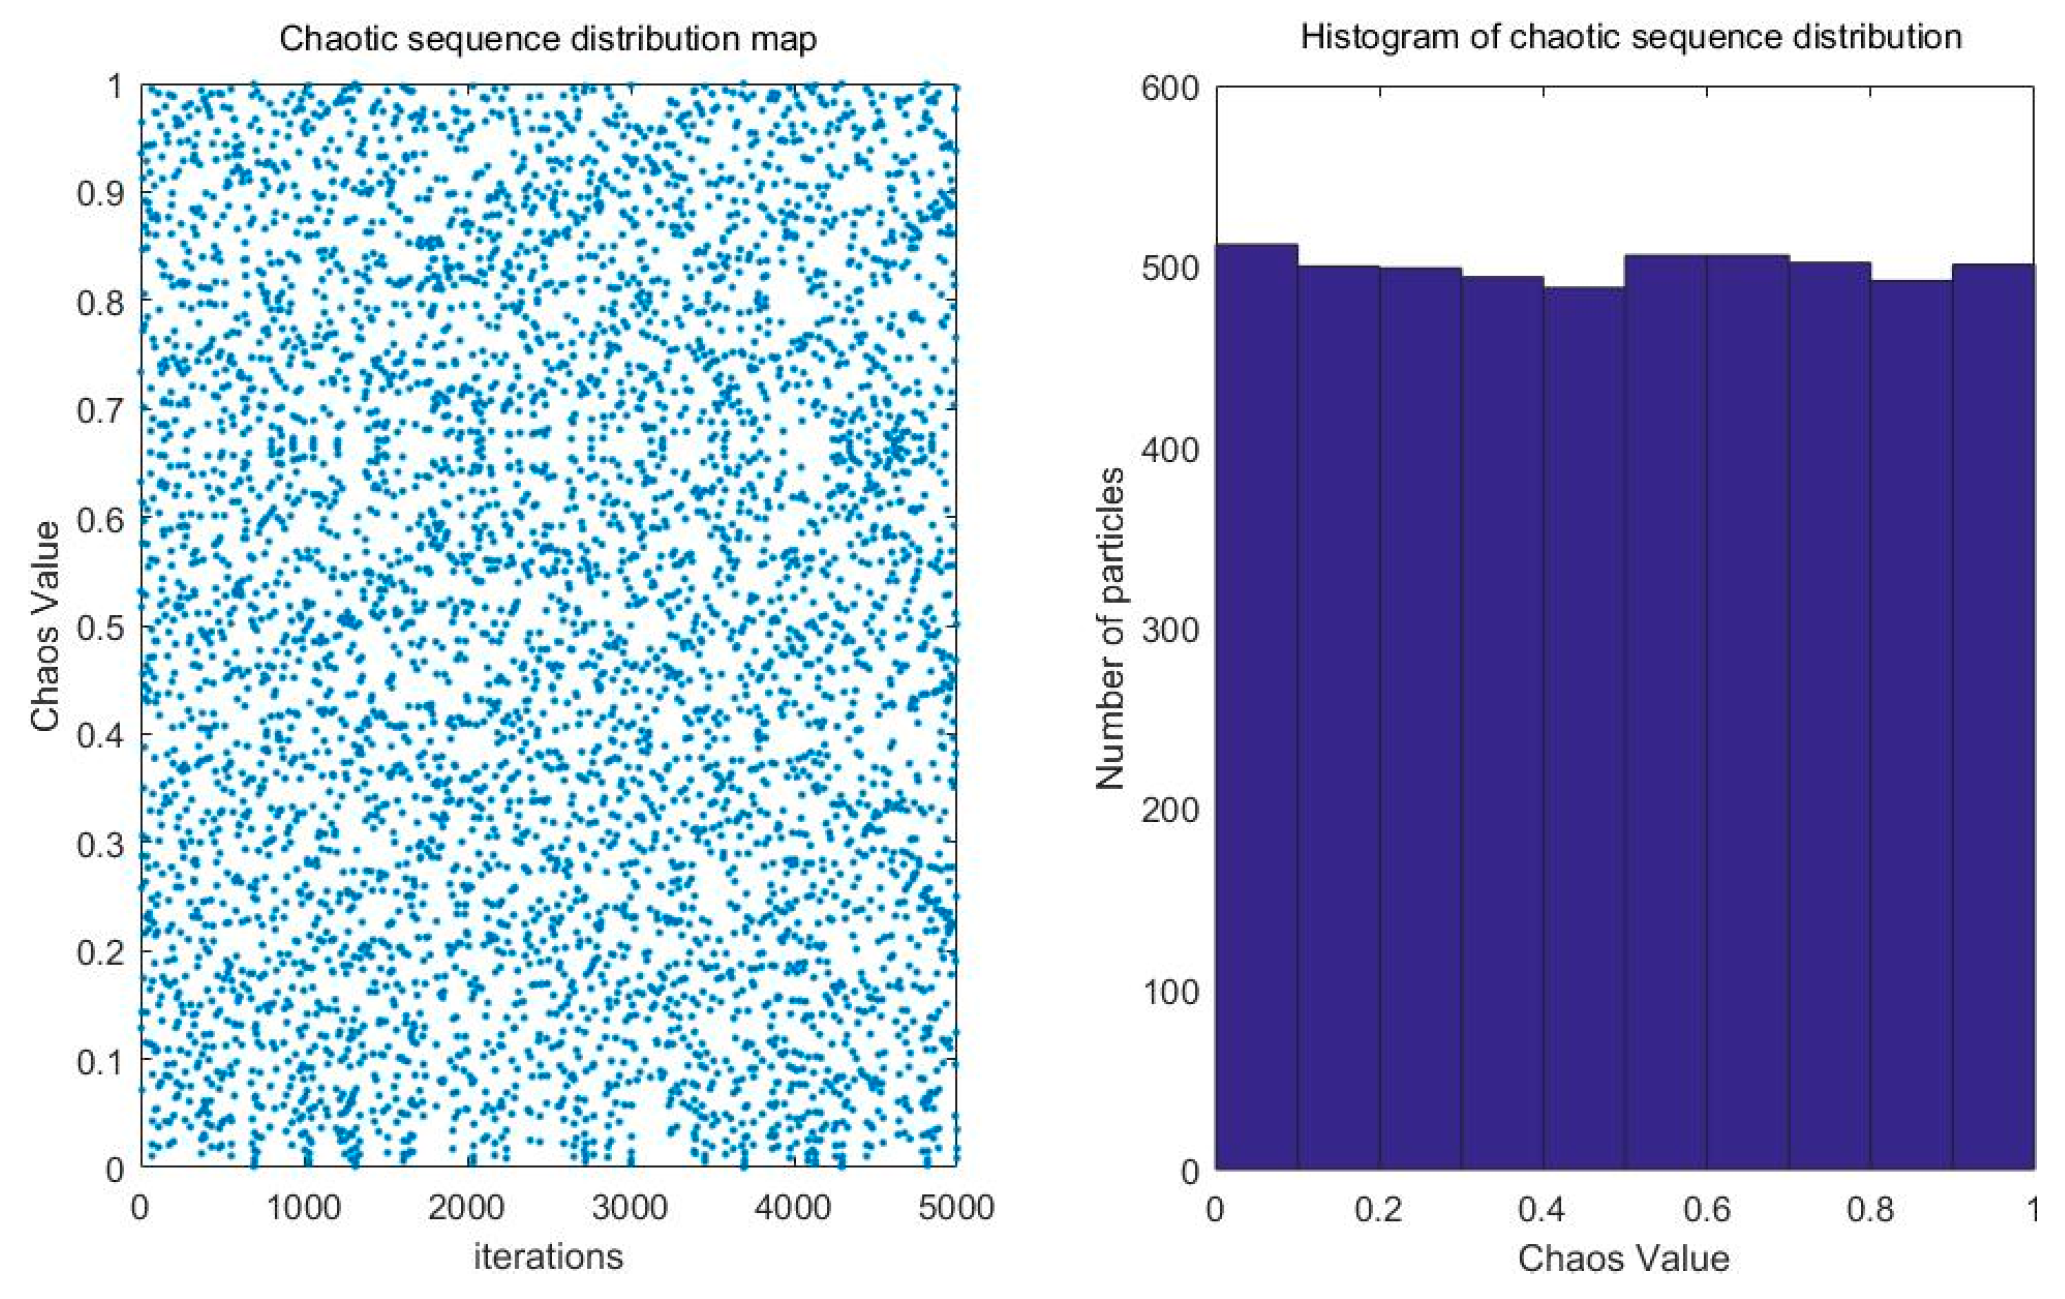
Tent chaotic sequence perturbation: To improve the quality of the initial solutions, Tent chaotic sequence perturbation is introduced during the population initialization stage in the algorithm. In each iteration, Tent chaotic sequence perturbation is executed to update the population particles and maintain their diversity throughout the algorithm iteration process.
The paper is structured as follows: Section 2 provides a detailed description of the multi-objective, multi-role, and multi-strategy chaotic perturbation algorithm with an optimal model, its main advantages, control strategy, and evaluation methods. This section is subdivided into related subsections. In Section 3, case studies are presented that analyze the impact of load on different EVs connected to microgrids. Furthermore, test case comparisons are carried out, results are analyzed, and conclusions are drawn. The contributions of the paper are outlined in Section 4, followed by the references.

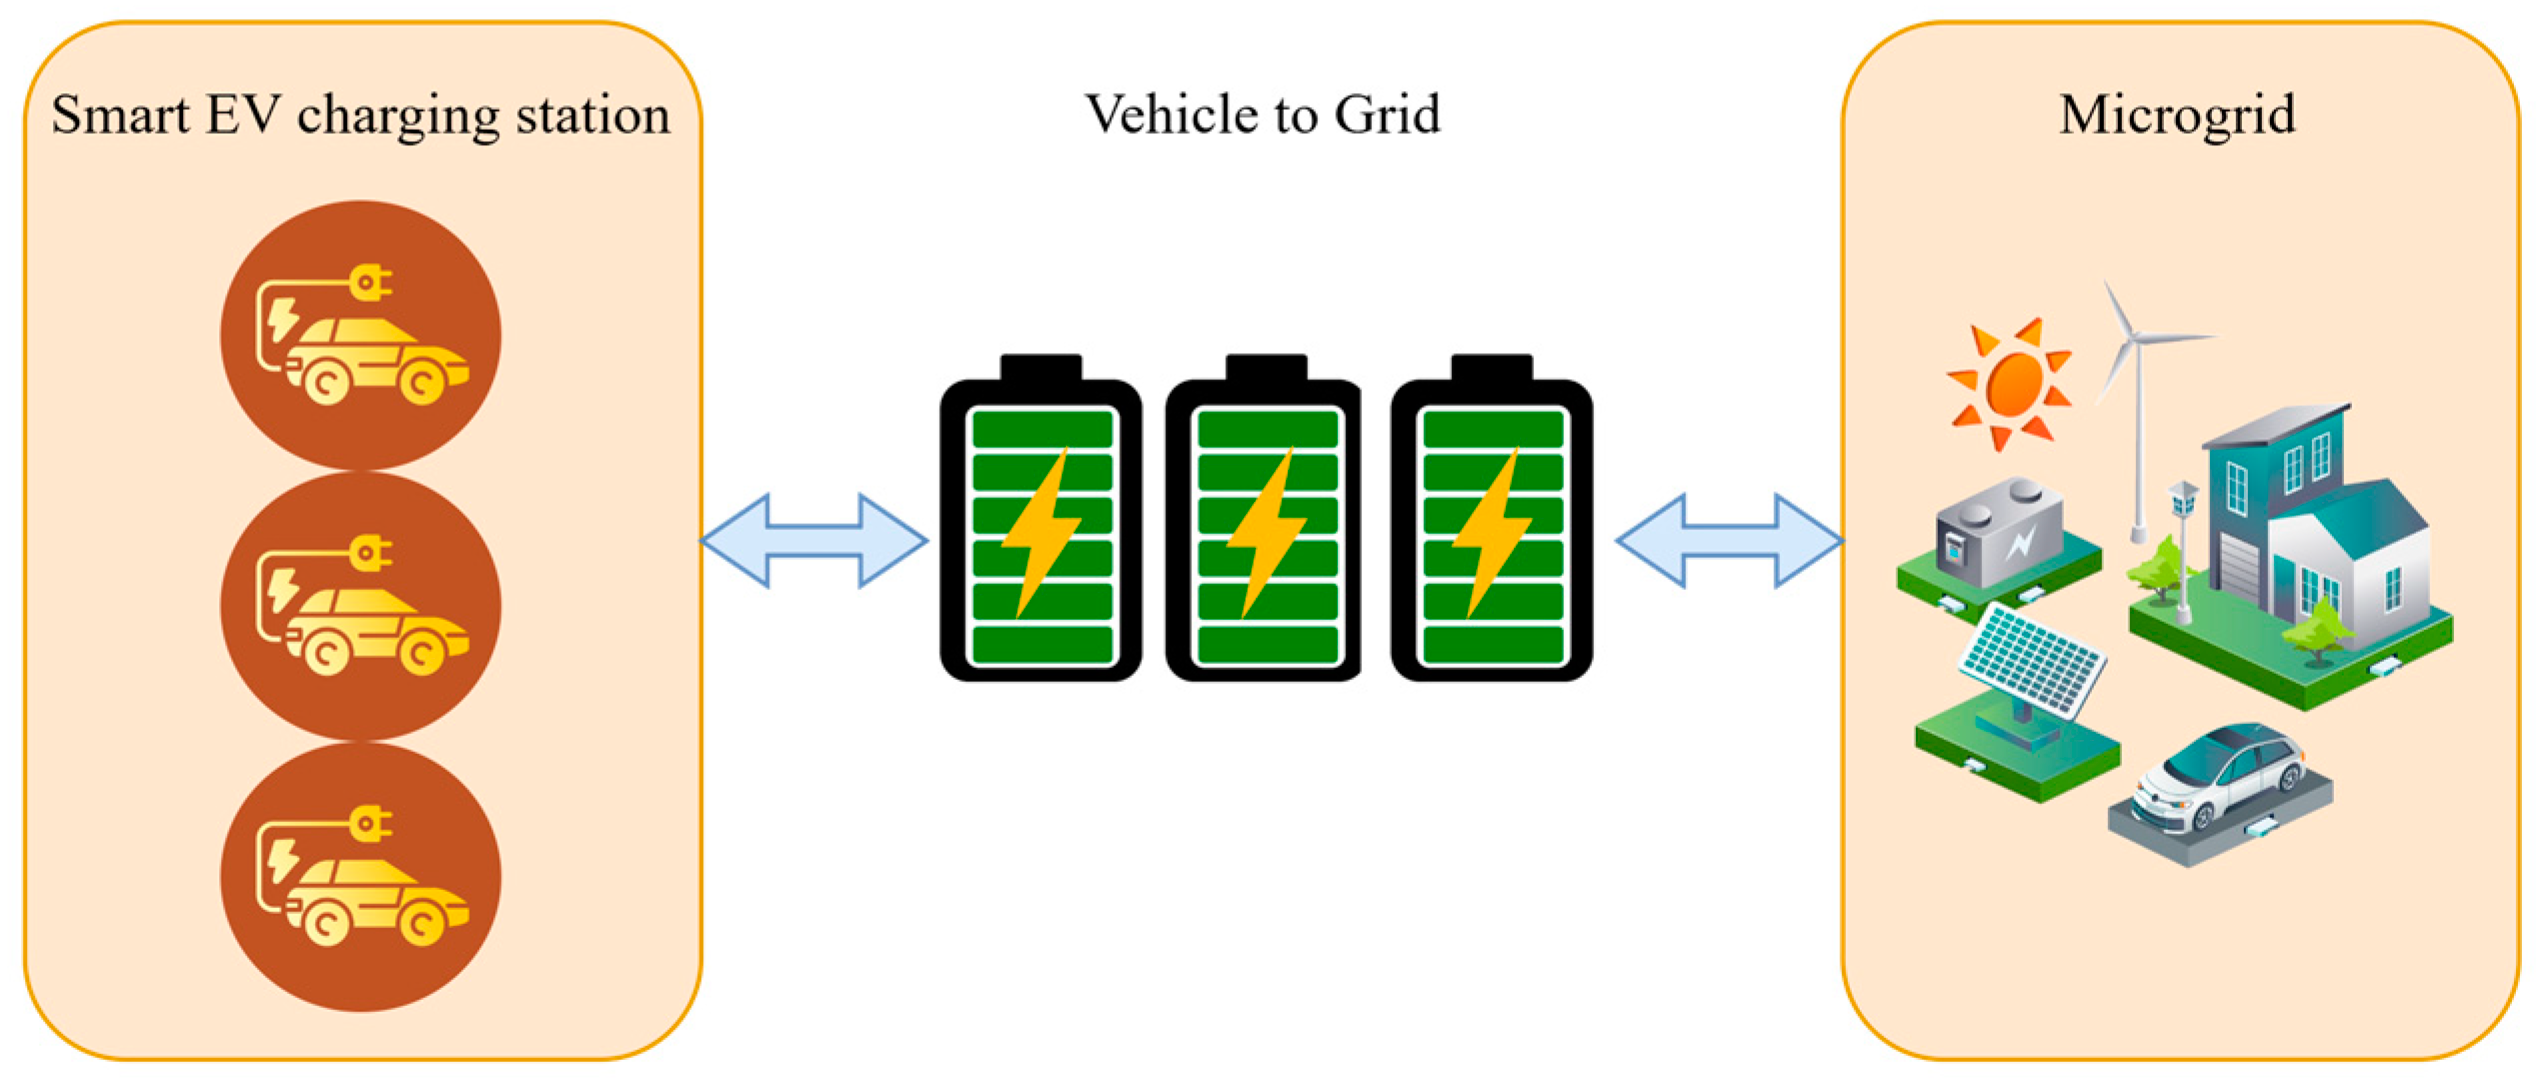
2. Microgrid Modeling and Control Algorithm

As illustrated in Figure 1, it presents a simplified V2G network where EVs have the capability to acquire power resources from the microgrid and trade electricity with the microgrid for financial gain. The specific focus of this research is urban residents; hence, the typical trajectory of EVs tends to be residential to commercial and back to residential areas. To address the economic and convenience considerations of this user group, satisfaction is integrated as the objective function during the model development process.
At the algorithmic level, the particle swarm optimization algorithm is a collective evolutionary algorithm inspired by the collective behavior of social animals [47]. The multi-objective particle swarm algorithm utilizes the non-dominated solution set within the particle swarm as the search direction to approximate the optimal values along the Pareto boundary [48]. However, traditional particle swarm optimization algorithms suffer from limitations such as premature convergence, lack of population diversity, and a decrease in particle generalization ability due to the adoption of a single search pattern for all particles [49]. In this paper, we propose an improved algorithm that considers the variations in particle density and hierarchy, enhancing the search mode.

2.1. Microgrid Modeling

When addressing the issue of ordered charging and discharging, it becomes imperative to meet a set of equation and inequality constraints. In this paper, the minimum fluctuation of power grid load and user satisfaction are chosen as multiple optimization objectives. The capacity, charging and discharging rates, balance, and operational range of EV batteries are governed by their consumption relationship [50,51].
(1) For each EV balance between consumed electric charge during driving and the remaining electricity of the EV,
S O C t , i = S O C t 1 , i D i D m a x
where S O C t , i is the battery status at t, D i is the distance traveled by the i-th vehicle, D m a x is the farthest distance a vehicle can travel in one go.
(2) For each battery capacity balance after charging and discharging,
S O C t , i = ( S O C t 1 , i θ T ( C h r a t e / D c h r a t e ) )
where θ T is the unit time period length, C h r a t e and D c h r a t e are the charge and discharge rates of EVs.
(3) For each EV′s total electricity consumption when connected to the power grid,
E a g g , i = i = 1 T C i t , i S O C t , i
where C i is the battery capacity of the i-th EV, t , i indicates whether the car is connected to the microgrid during time t. If it is 1, it indicates that it has been connected to the microgrid; if it is 0, it indicates that there is no access to the microgrid.
(4) For each EV battery status, charging and discharging rate,
S O C m i n S O C i 1
C h m i n , r a t e C h r a t e C h m a x , r a t e
D c h m i n , r a t e D c h r a t e D c h m a x , r a t e
where S O C m i n is the minimum amount of electricity that ensures that users can return home from the company; in residential parking lots, this parameter is limited by the minimum electricity consumption for the next day. C h m i n , r a t e and D c h m i n , r a t e are minimum charging and discharging rates of EVs; C h m a x , r a t e and D c h m a x , r a t e are maximum charging and discharging of EVs.
One of the objectives of this article is to minimize the fluctuation of microgrid load, with the variance of the daily load curve as the manifestation of the objective function:
J = var L o a d s = t = 1 T 1 T ( L o a d s T Mean L o a d s 2
where T is 24 h one day, J is the daily load variance, Loads is the load at a certain time, Mean is the calculated mean function, and var is the variance of the load.
This article takes the economic satisfaction and convenience satisfaction of users as quantitative goals, and the economic satisfaction is as follows:
U 1 , i = 1 e c e x , i c
where U 1 , i is the economic satisfaction of the i-th user, c e x , i is the expected electricity price of the i-th user, and c is the electricity price per time period after adopting orderly charging and discharging.
The convenience satisfaction is as follows:
U 2 , i = 1 k 1 a T k a T L s c h , t , i L t , i 1 T a l l L t , i
where U 2 , i is the convenience satisfaction for the i-th user, L s c h , t , i is the load value of the i-th vehicle during t after implementing scheduling, L t , i is the i-th user’s load value per time period before implementing scheduling, and T a l l is the time periods in one day.
By using Formula (10), combine the two satisfaction indicators to form the objective function. The comprehensive satisfaction is as follows:
U i = 1 α U 1 , i + 1 α U 2 , i
where α represents the user’s preference coefficient for two types of satisfaction. Take the reciprocal of the satisfaction value, convert the maximum value to the minimum value, and optimize the solution.
In order to overcome the challenge posed by the significant difference in scale between the two objectives, this article employs a normalization technique and transforms multi-objective functions into a single-objective function simulation. This approach allows for avoiding drawing the Pareto boundary.

2.2. Tent Chaotic Perturbation Sequence

Conventional particle swarm optimization algorithms are susceptible to local optima due to their high sensitivity to initial solutions. In order to enhance the quality of the initialization method, this study incorporates the Tent chaotic sequence. By introducing perturbations to the position of the original solution, the diversity of the solution set is increased, thereby facilitating the algorithm’s ability to escape local optima and enhance the global search capability [52]. Ultimately, this approach improves the quality of the initial solution and enhances the effectiveness of the algorithm. The mapping expression for Tent chaotic perturbation is as follows:
X i + 1 = 2 X i , X i [ 0 , 0.5 ] 2 1 X i , X i [ 0.5 , 1 ]
The initialization formula is as follows:
X n e w = X + X / 2
where X is the initialization of the population, X is the amount of disturbance generated, X n e w is the individual after chaotic disturbance.
The carrier formula for movement is as follows:
X n e w = D m i n + D m a x D m i n X d
where D m i n , D m a x are minimum and maximum values of each dimension.
According to Equation (11), the chaotic variable X d is obtained. Equation (13) is employed to map the carrying X d to the solution space, ensuring that the perturbation variables are confined within the range of [−0.4, 0.99]. Finally, by substituting Equation (12), the particles go through perturbation, leading to solution fluctuation within the neighborhood of [−0.36, 0.3], consequently enhancing the global search capability. The algorithm logic is shown in Algorithm 1. From Figure 2, it can be concluded that the distribution of points in the Tent chaotic sequence is very uniform, resulting in better performance.
Algorithm 1 Tent chaotic sequence algorithm
Input: particle.position
Output: adjusted particle.position
procedure Tent
1. Input
2. Initialize x,N
3.  for i = 1:N
4.       If xi < 0.5
5.           xi = 2 × i
6.       else
7.            xi = 2 × (1 − i)
8.        end if
9.    end for

2.3. Multi-Role and Multi-Strategy Optimization

In order to mitigate the limitations of traditional PSO, where all particles follow one single search strategy [53], the article proposes a novel approach that involves dividing the particles into three distinct groups, namely, elite particles, general particles, and learning particles. The criteria for categorizing particles comprise density and hierarchy, while the comprehensive indicator is employed to evaluate the performance of particles:
(1) The quality index is calculated using Formula (15), which incorporates the Euclidean distance between the two closest particles of the particle, along with hierarchical measurement and a non-dominated sorting method;
(2) The density index is determined by the sparsity of particles in the vicinity of the particle, as computed by Formula (16);
(3) The comprehensive index is evaluated using Formula (17). A smaller numerical value is assigned to elite particles with better particle diversity. The number of elite particles constitutes 20% of the population, while the other 60% are designated as general particles. The remaining particles are allocated to learning factors.
For the partitioning of particles, this article employs a diverse search strategy:
(1) The elite particle refers to the particle that best fits the optimal value and is closest to the global optimal value. The next step is likely to yield a non-dominated solution, and changes should be minimized. Therefore, an intermediate value should be chosen for the parameters;
(2) General particles are second to elite particles, with a certain distance from the non-dominated solution set and poor diversity. To approach the global optimal value, select the maximum value of the global learning factor and choose the intermediate value for the inertia weight and individual learning factor;
(3) Learning particles have poor convergence and require adjustments to smaller inertia weights, individual learning factors, and larger global learning factors to ensure convergence towards the global optimal value.
In addition to the aforementioned diversity strategy, this article is also inspired by reference [54] and incorporates the concept of outliers to identify whether a particle is an extreme solution. This is achieved by calculating the outlier factor using the following formula:
ρ i = 2 d i 1 + d i 2
O L i = ρ j 1 ρ i + ρ j 2 ρ i 2
where d i 1 , d i 2 refers to the nearest and second nearest Euclidean space distances to the i-th particle, ρ i is the local reachable density of the i-th particle, ρ j 1 , ρ j 2 represent the local reachable density of the two particles closest to and next to the i-th particle. If outlier O L i 1 , it indicates that the particle deviates from other particles. If outlier O L i > 1 , it indicates that the particle lies in the same cluster. If the O L i is smaller, it indicates a higher probability of the particle being an extreme solution.
The non-dominated sorting method is a widely used approach for evaluating the quality of particles in academic research [55]. This method sorts and assigns different levels to all particles based on their solutions [56], where particles with lower levels are closer to optimal values. Nevertheless, there may be instances where extreme solutions with poor convergence arise during the application of the non-dominated sorting method [54]. To address this issue, introducing an outlier factor can effectively tackle the problem. By considering both the number of layers and outlier factors of the solutions, the quality index can be derived as follows:
E Q i = C L i + 1 , O L i 1 C L i , O L i > 1
Maintaining population diversity during the evolution process is crucial, and it can be achieved by ensuring that particles are located in sparse regions of the target space [54]. The density index formula used for this purpose is as follows:
S D i = 1 d i 2 + 2
where S D i reflects the sparsity of the region where particles are located. If S D i is smaller, density index would indicate a sparser neighborhood of the particle, while a larger value implies a denser one. Particles located in sparse regions play a crucial role in expanding the exploration space. Extreme solutions may be sparse in this layer and can be located in dense or sparse regions within the population. However, solely relying on quality indicators may overlook the potential benefits of extreme solutions. Therefore, it is essential to combine density indicators as well. In this regard, two indicators are integrated to form a comprehensive indicator, and the calculation procedure is as follows:
R i = E Q i N + S D i N
where N denotes the population size. A smaller indicator indicates better particle diversity, which in turn implies that the particle is closer to the optimal value. Conversely, a larger indicator denotes poorer particle diversity, implying that the particle is far from the optimal value.
The particles are sorted in ascending order based on the value, and their rankings are determined using non-dominated sorting. The particles are then classified into three categories: elite particles, general particles, and learning particles. The classification indicators RO for these three types of particles are defined as follows:
R O = 1 , R K i [ 0 , 0.2 N ] 2 , R K i [ 0.2 N , 0.8 N ] 3 , R K i [ 0.8 N , N ]
where 1 is the elite particle, 2 is the general particle, and 3 is the learning particle.
In the particle swarm optimization algorithm, different strategies are employed for the three types of particles to achieve a more comprehensive search of the solution space.
(1) For elite particles, their inherent advantages are maintained and then continue to explore the solution space based on their current positions;
(2) For general particles, the focus is exploring the target space in proximity to the elite particles. This helps facilitate a more thorough search in the neighboring regions;
(3) As learning particles are relatively distant from the optimal solution, a maximum global learning factor is applied to guide them towards approaching the optimal solution.
By appropriately adjusting three parameters for each type of particle, their search strategies can be modified, resulting in a more comprehensive exploration of the spatial search. The basic process of the algorithm is shown in Algorithm 2.
Algorithm 2 Non-dominated particles sorting algorithm
Input: position,N,obj1,obj2,di1,di2
Output: adjusted sorting
procedure MMMO
1. Input
2. for i = 1:N
3.     midu(i) = 2/(di1 + di2)
4.      lfi = (midu(j1)/midu(i) + midu(j2)/midu(i)) + 2
5.      Di = 1/(di2 + 2)
6. end for
7. frontvalue = non-dominated(position,obj1,obj2)
8. for i = 1:N
9.      if lf(i) > 1
10.      frontvalue(i) = frontvalue(i) + 1
11.    end if
12.    adjusted sorting = power(frontvalue(i,1)) + power(Di,1)
13. end for
14. adjustedsorting = sortrows(adjusted sorting,1);

2.4. Control Strategy

To address the challenge of achieving both load balance and user satisfaction in the charging and discharging scheduling problem of EVs, it is essential to adopt multi-objective algorithms for optimization. Unlike single-objective algorithms optimizing one single-objective function, multi-objective algorithms can optimize multiple objective functions and generate a set of non-dominated solutions. Furthermore, they display the results of non-dominated solution sets by drawing Pareto curves. However, the algorithm circumvents the need for drawing Pareto boundary curves by normalizing the values of the two objective functions and combining them into a single-objective function for optimization. Linear normalization (min-max normalization method), which is a common normalization method used in data processing, assuming that the original data are x , whose maximum value is x m a x and minimum value is x m i n , and the normalized data are x n o r m , the normalization formula is as follows:
x n o r m = x x m i n x m a x x m i n
Thus, the original data are mapped to the interval [0, 1]. After normalizing the magnitude of both optimization objectives to [0, 1], we use the common linear weighting method to transform the two optimization objectives into one optimization objective, i.e., assigning a weight to each optimization objective after normalization; then, the new optimization objective is as follows:
F x = ω 1 f x 1 + ω 2 f x 2
The selection of the weight determines the importance of each optimization objective, and in the optimization process of this paper, the weights are all 0.5.
By using the above normalization and linear weighting methods, the two optimization objectives in this paper can be unified into one optimization objective.
All the above-mentioned innovations are considered in the control scheme to best match the real situation. All the control strategy is shown in Figure 3. The algorithm is briefly presented as Algorithm 3.
The specific optimization process is shown as follows:
Step 1: Monte Carlo Simulation generates the initial population;
Step 2: Generate chaotic variables and apply them to solution space;
Step 3: Obtain perturbation of particles and chaotic variables;
Step 4: Calculate the initial fitness of particles and sort by quality;
Step 5: Obtain the elite particle, general particle, and learning particle, apply multi-strategy to different type particles;
Step 6: Update the fitness of newly obtained particles, compare the fitness with current optimal solutions, and reserve or replace the solution according to the fitness;
Step 7: If achieve the maximum iteration number, output the solution, or back to Step 4.
Algorithm 3 Multi-role Multi-strategy PSO algorithm
Input: number of EVs, load, average electricity price
Output: adjusted electricity price and load
1. Input
2. obtain parameters using Monte Carlo simulation method
procedure MOPSO
3. for each particle i
4.      Initialize velocity Vi and position Xi for particle i
5.      Particle.position = Tent(postion)
6.      Evaluate particle i and set pBesti = Xi
7. end for
8. gBest = min{pBesti}
9. particle.sorting = MMMO(npop,position,obj1,obj2)
10. while not stop
11.    for i = 1 to N
12.        update the velocity and position of particle i
13.        Evaluate particle i
14.        if fit(Xi) better than fit(pBesti)
15.            pBesti = Xi;
16.        if fit(pBesti) < fit(gBest)
17.            gBest = pBesti;
18.        end for
19. end while
20. print gBest
end procedure

3. Simulation and Case Study Results

To verify the effectiveness of the proposed multi-role and multi-strategy algorithm (IMSDC-PSO), simulation analysis was conducted on a microgrid with large-scale integration of EVs in a specific area. Case studies were performed by considering the number of EVs in specific regions within the United States, along with the maximum number of EVs that can be accommodated in the microgrids [57]. The scenarios tested involved setting the number of EVs to 50, 100, and 150 while taking into account the impact of EVs and the integration of EVs into microgrids [58]. Additionally, the proposed algorithm will be compared to the results obtained from other algorithms to further demonstrate its effectiveness.
The case study is operated on Matlab R2016b platform with a Core I7-6700, 3.40 GHz, 16 GB RAM personal computer, involved conducting experiments on 50, 100, and 150 EVs. The particle size for this study was 26 individuals, with a maximum of 200 iterations. The inertia weight of the proposed IMSDC-PSO and other PSO algorithms are ω m a x = 0.9 and ω m i n = 0.4 ; the learning factors are c 1 = 2 and c 2 = 2 . The crossover probability and mutation probability of NSGA2 are 0.9 and 0.02, respectively. Additionally, this article will compare the proposed algorithm with the outcomes achieved by multi-objective particle swarm optimization (MOPSO) [18], multi-objective chaotic perturbation particle swarm optimization (TMOPSO) [37], multi-objective multi-role multi-strategy particle swarm optimization (MOPSO_RS) [51], genetic algorithm (NSGA2) [34], chaotic perturbation genetic algorithm (C-NSGA2), artificial bee colony (ABC) algorithm [23], and chaotic perturbation artificial bee colony algorithm (C-ABC).

3.1. Analysis of the Impact of the Number of EVs on Microgrids

Table 1, Table 2 and Table 3 display the results of implementing an orderly charging and discharging strategy for 50/100/150 EVs in a microgrid, as well as the daily load and quantified comprehensive user satisfaction indicators of the microgrid. The proposed algorithm in this article is highlighted in bold in the table.
The results obtained from implementing an ordered charging and discharging strategy for 50 EVs in the microgrid, as well as the quantified load and user satisfaction of the microgrid, are presented in Table 1. From Table 1, it can be observed that the load for IMSDC-PSO is 204.555 kW, while for TMOPSO, it is 204.457 kW. TMOPSO exhibits a 0.05% reduction. Furthermore, IMSDC-PSO achieves the highest user satisfaction with a score of 5.21, whereas MOPSO_RS yields a score of 5.23. IMSDC-PSO demonstrates a 0.38% decrease in comprehensive performance, indicating that IMSDC-PSO outperforms MOPSO_RS.
Based on the data presented in Table 1, it can be observed that IMSDC-PSO, NSGA2, and TMOPSO have achieved optimal results in the first tier with regard to load optimization. IMSDC-PSO has a relatively fast convergence speed, and also great load results and users’ satisfaction. Conversely, MOPSO, MOPSO_RS, and MOPSO belong to the second tier, and ABC is classified as a third-tier algorithm. Notably, the average load optimization results of the first tier are approximately 6 kW better than those of the second tier, with a relatively small difference of less than 100 W between the algorithms of the first tier; if the average electricity tariff is utilized to convert this to a cost, the proposed algorithm can save up to 60.4 dollars. Regarding user satisfaction, it is evident that IMSDC-PSO outperforms other algorithms when the number of connected EVs is low, indicating better optimization results in terms of user satisfaction under such conditions.
The results of implementing an orderly charging and discharging strategy for 100 EVs in the microgrid, along with the load and user satisfaction, are shown in Table 2. The algorithm proposed in this study is highlighted in the table. As the number of EVs increases, the microgrid’s load also increases, and user satisfaction increases. This phenomenon can be attributed to the fact that user satisfaction is influenced by both convenience and economic factors. By applying Formula (10) and taking the reciprocal of user satisfaction, it becomes evident that smaller values indicate higher levels of user satisfaction. In scenarios where the number of EVs increases while the number of available charging ports remains constant, users may experience queues for charging, leading to reduced convenience and subsequently impacting their overall satisfaction. Also, the algorithm needs more time to converge, as shown in the table. IMSDC-PSO still has great convergence speed and results compared to the other algorithms. In Table 2, the load result for IMSDC-PSO is 210.787 kW, while for TMOPSO it is 210.926 kW, indicating a 0.2% decrease in load. The user satisfaction for IMSDC-PSO is 5.24, while MOPSO_RS and TMOPSO have 5.26 and 5.28, respectively. Compared to MOPSO_RS and TMOPSO, IMSDC-PSO shows the best overall result.
Similarly, when the number of participating EVs increases to 100, a more distinct three-tier performance is observed, and the algorithms employed remain relatively consistent. However, it is worth noting that the results obtained from the NSGA2 significantly differ from those of TMOPSO and IMSDC-PSO, with a noticeable gap of approximately 4 kW. The average electricity tariff is utilized to convert this to a cost, the proposed algorithm can save up to 120.9 dollars. In terms of user satisfaction, IMSDC-PSO continues to exhibit a comparatively higher performance compared to other algorithms. Analyzing Table 1 and Table 2, it becomes evident that MOPSO_RS consistently outperforms the other four algorithms in terms of user satisfaction optimization results.
Table 3 shows the results of implementing an orderly charging and discharging strategy for 150 EVs in the microgrid, along with the load and user satisfaction. It is evident from Table 3 that the microgrid load and users’ satisfaction have increased further. The convergence time of different algorithms also increased, compared to other algorithms, the proposed IMSDC-PSO algorithm is able to achieve an increase in convergence speed of up to 20%. This can be attributed to the convenience benefit of user satisfaction. The load result for IMSDC-PSO is 214.377 kW, while for TMOPSO it is 217.492 kW, indicating a 1.4% decrease in load. Compared with the other algorithms, the average electricity tariff is utilized to convert this to a cost, the proposed algorithm can save up to 171.8 dollars. The user satisfaction score for IMSDC-PSO is 5.29, while for MOPSO_RS, it is 5.29. IMSDC-PSO performs better in both load optimization and user satisfaction.
According to the results obtained from the IMSDC-PSO in the three cases, it can be observed that for 50 EVs, the result shows 204.555 kW; for 100 EVs, the result is 210.787 kW; and for 150 EVs, the result is 214.377 kW. It is evident that the best outcome is achieved when optimizing an orderly charging and discharging strategy for all EVs. In terms of user satisfaction, the IMSDC-PSO yields comprehensive satisfaction scores of 5.21, 5.24, and 5.29 for the respective cases. The data suggest that the IMSDC-PSO algorithm is suitable for scenarios with a small number of EVs connected to the grid. Given that the area covered by the microgrid is roughly equivalent to that of several small communities, the number of EVs tested was selected based on the microgrid’s capacity to support charging infrastructure. Specifically, the experiments were conducted using 50, 100, and 150 EVs to ensure that the number of EVs tested fell within the scope of the microgrid’s coverage capabilities. Based on the above considerations, we will proceed with the optimization process using 110 EVs.

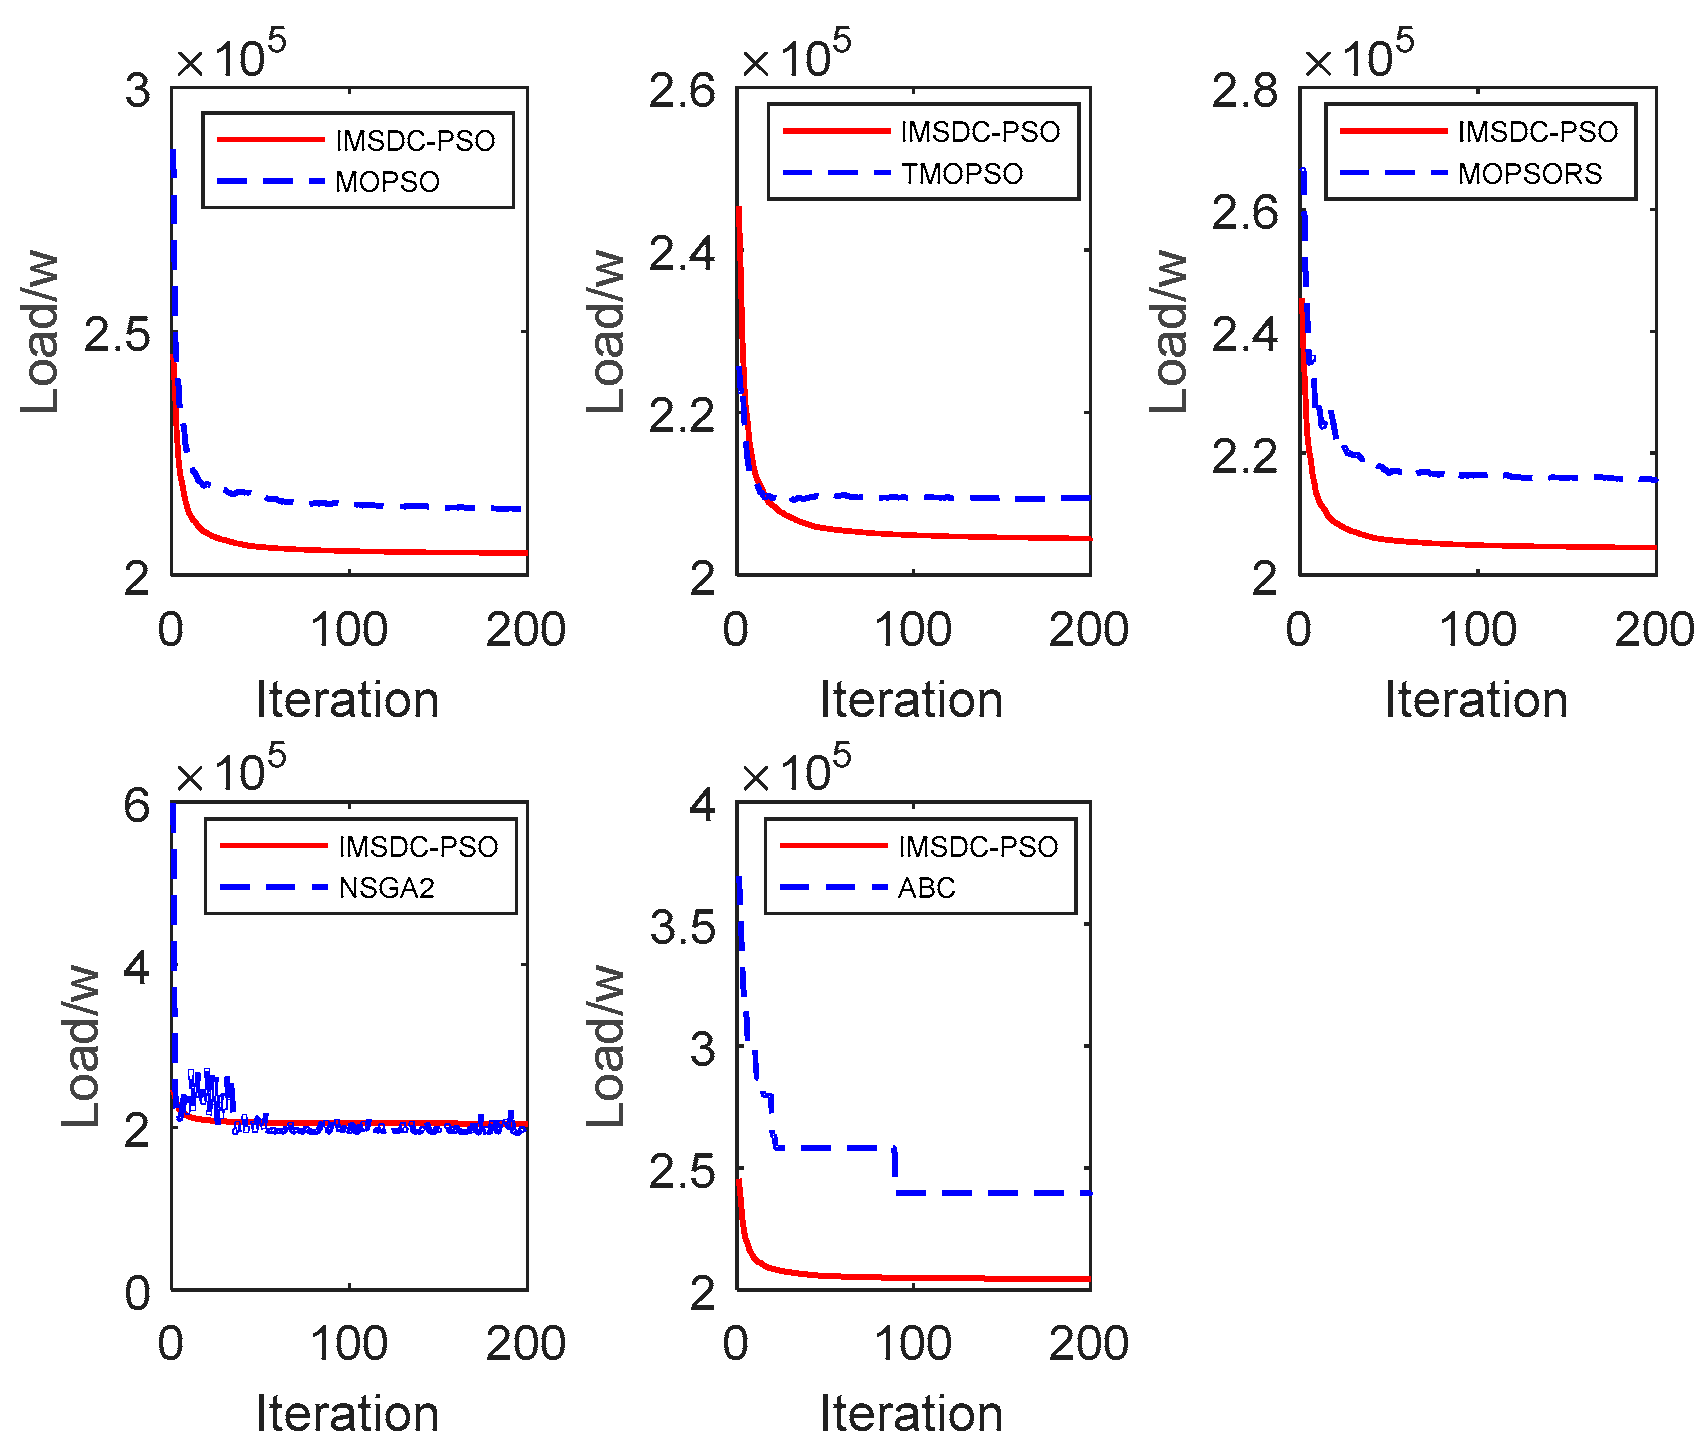
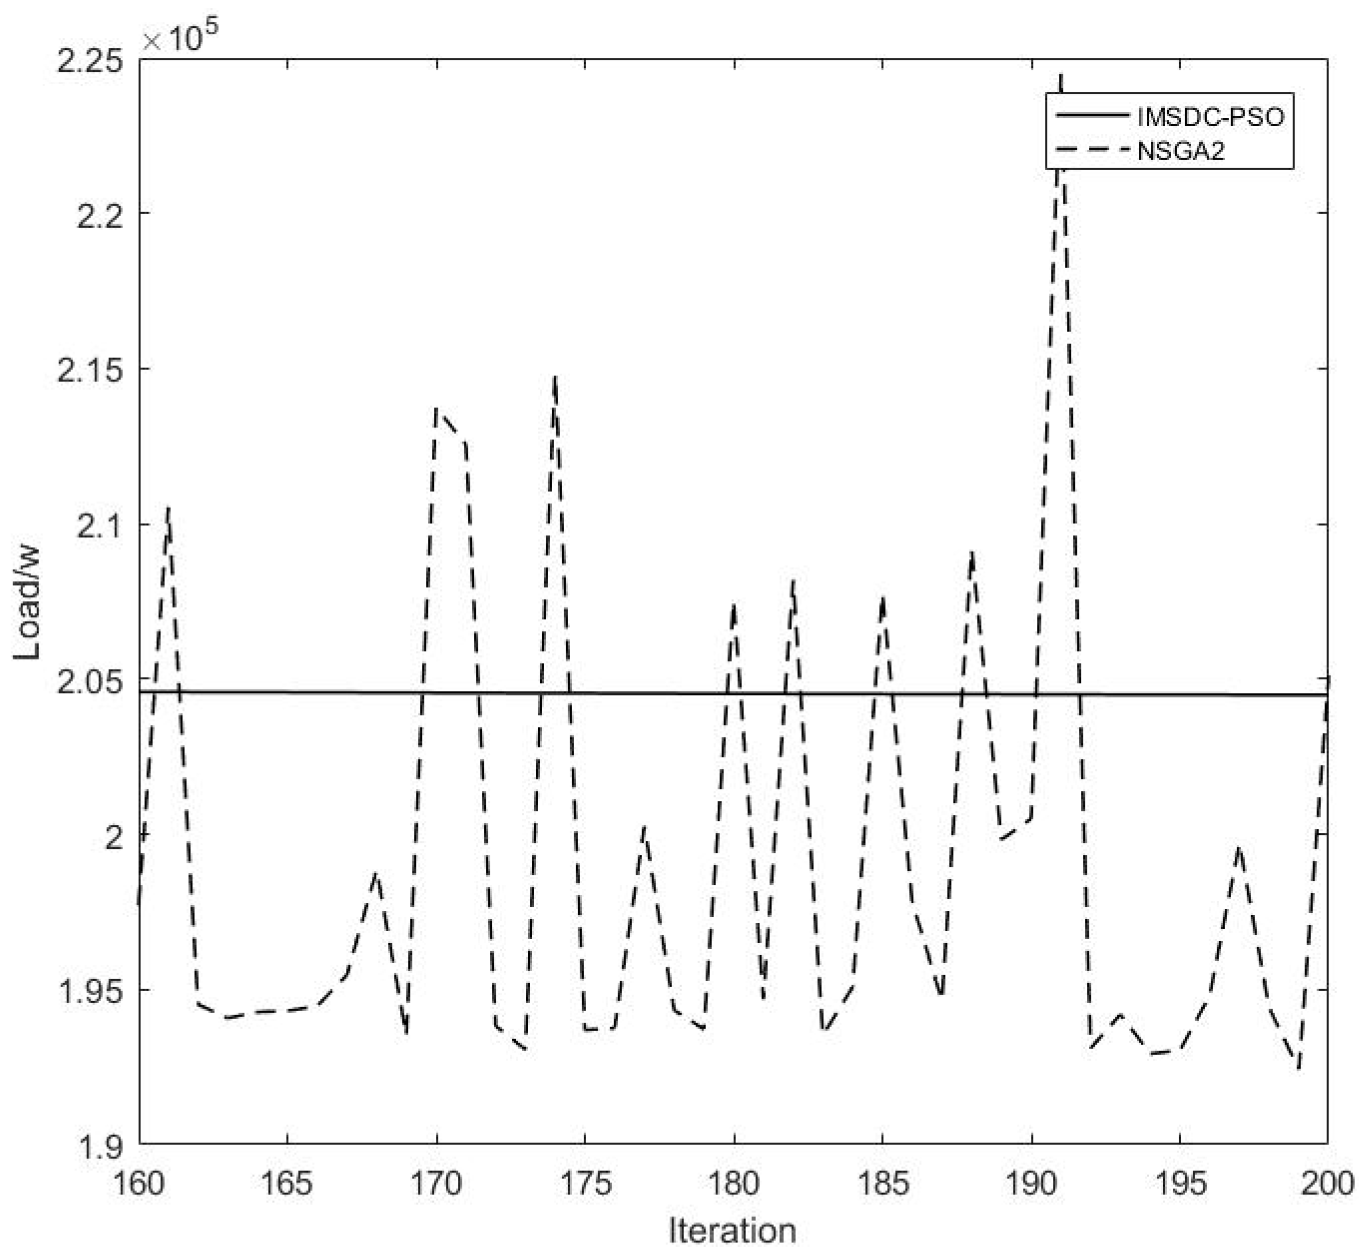
3.2. Load Optimization

The load values and user satisfaction scores optimized by various algorithms were analyzed for 110 EVs. The particle count was set to 26, and the number of iterations was set to 200. The optimization results of the six algorithms are presented in Figure 4, indicating that the IMSDC-PSO algorithm achieved minimal and stable load values and drew a significant gap compared to other algorithms. From Figure 5, the NSGA2 algorithm exhibited better load values than the IMSDC-PSO algorithm in some iterations, it lacked stability and fluctuated within a certain range after about 50 iterations. This demonstrates the poor stability of the NSGA2 algorithm and suggests that IMSDC-PSO and TMOPSO are more suitable for practical applications.
Table 4 shows that IMSDC-PSO and TMOPSO outperformed other algorithms significantly in enhancing search ability during the early stages of iteration from initial value. Notably, the NSGA2 algorithm exhibited extremely weak early search ability, generating results inferior to those of other algorithms by approximately 300 kW. Analysis of the final values in Table 4 reveals that IMSDC-PSO and NSGA2 generated desirable outcomes, indicating excellent global search ability and diversity for both algorithms. While TMOPSO’s initial value was superior to that of IMSDC-PSO, the latter demonstrated notably better searchability, resulting in better final results. Moreover, the mean value of IMSDC-PSO in Table 4 is proximate to the final value, indicating fast convergence speed.

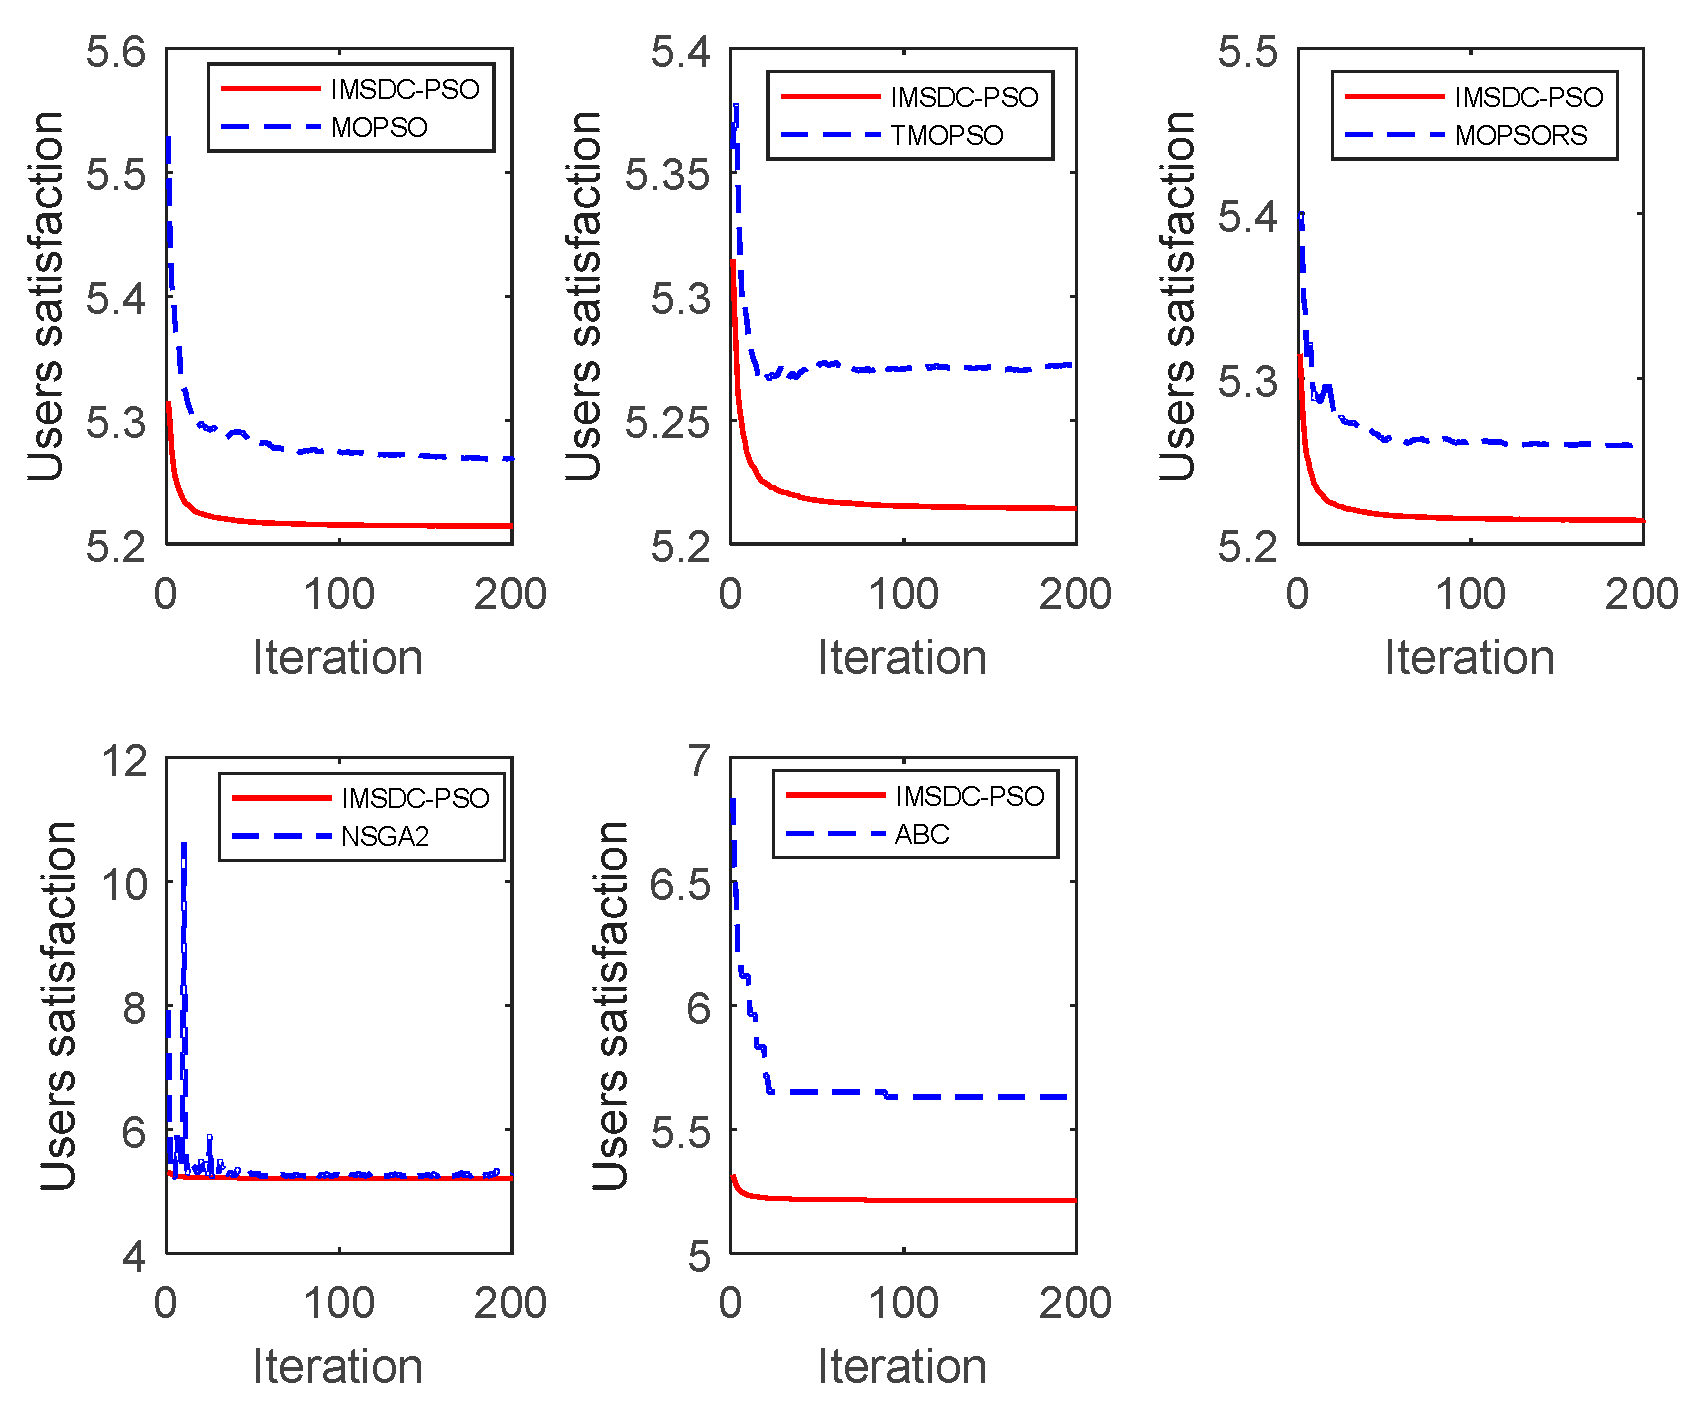
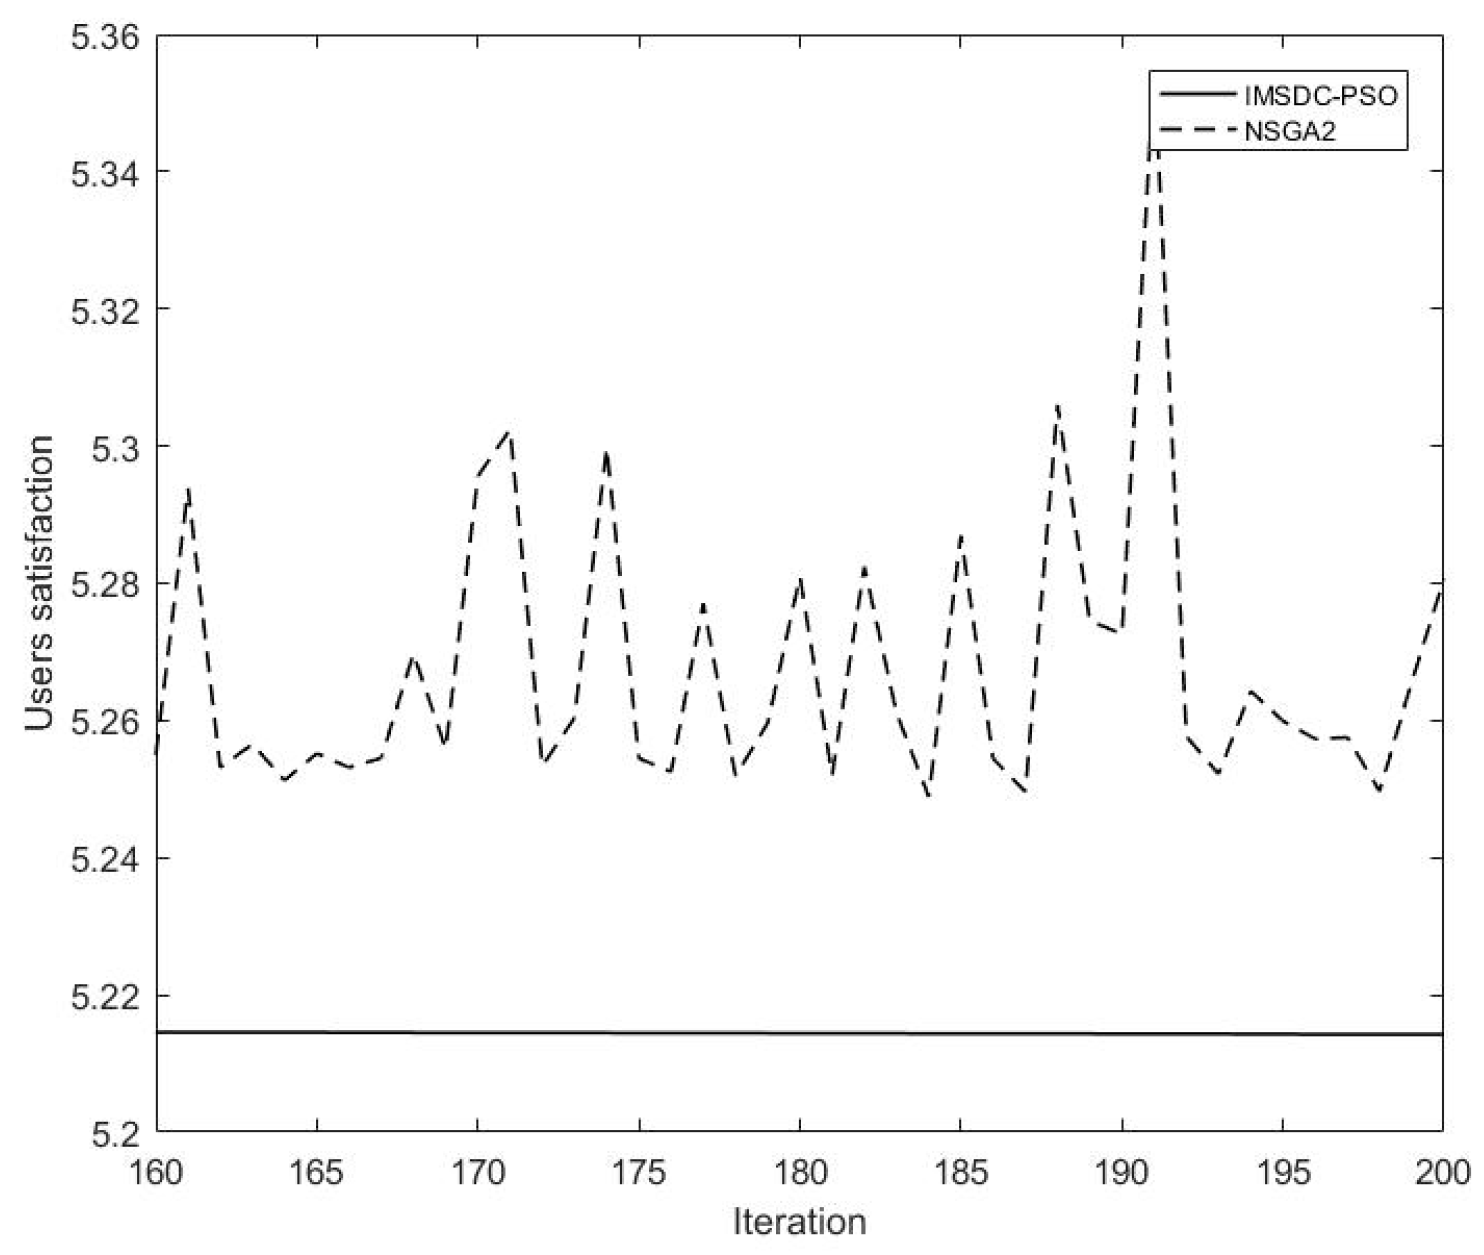
3.3. User Satisfaction Optimization

The paper evaluates user satisfaction with an orderly charging and discharging strategy for EVs and treats it as a variable to be optimized. From Figure 6, The results indicate that the IMSDC-PSO has the best performance, while the ABC algorithm performs poorly. The NSGA2 algorithm exhibits unstable results in the early stages of iteration, showing little convergence before 20 iterations. The fluctuation range narrows between 20 and 40 iterations, but the algorithm tends to converge locally after 40 iterations. However, a closer examination of Figure 7 reveals that the NSGA2 algorithm remains unstable, fluctuating between 5.2 and 5.4. This is due to the algorithm’s tendency to converge locally, resulting in a lack of convergence in the final result.
Figure 7 demonstrates that, in terms of user satisfaction, the result obtained by IMSDC-PSO is even lower than the minimum value achieved by NSGA2. Comparing it with Figure 5, the result obtained by IMSDC-PSO is only equivalent to the average value of NSGA2. This indicates that IMSDC-PSO has a better optimization effect on user satisfaction than NSGA2. Table 5 reveals that, unlike load optimization, IMSDC-PSO outperforms TMOPSO in initial value, while NSGA2 and ABC exhibit weaker early search capabilities. The final values in Table 5 show that IMSDC-PSO significantly surpasses other algorithms, and the mean value further highlights the fast convergence speed and strong convergence characteristics of IMSDC-PSO.

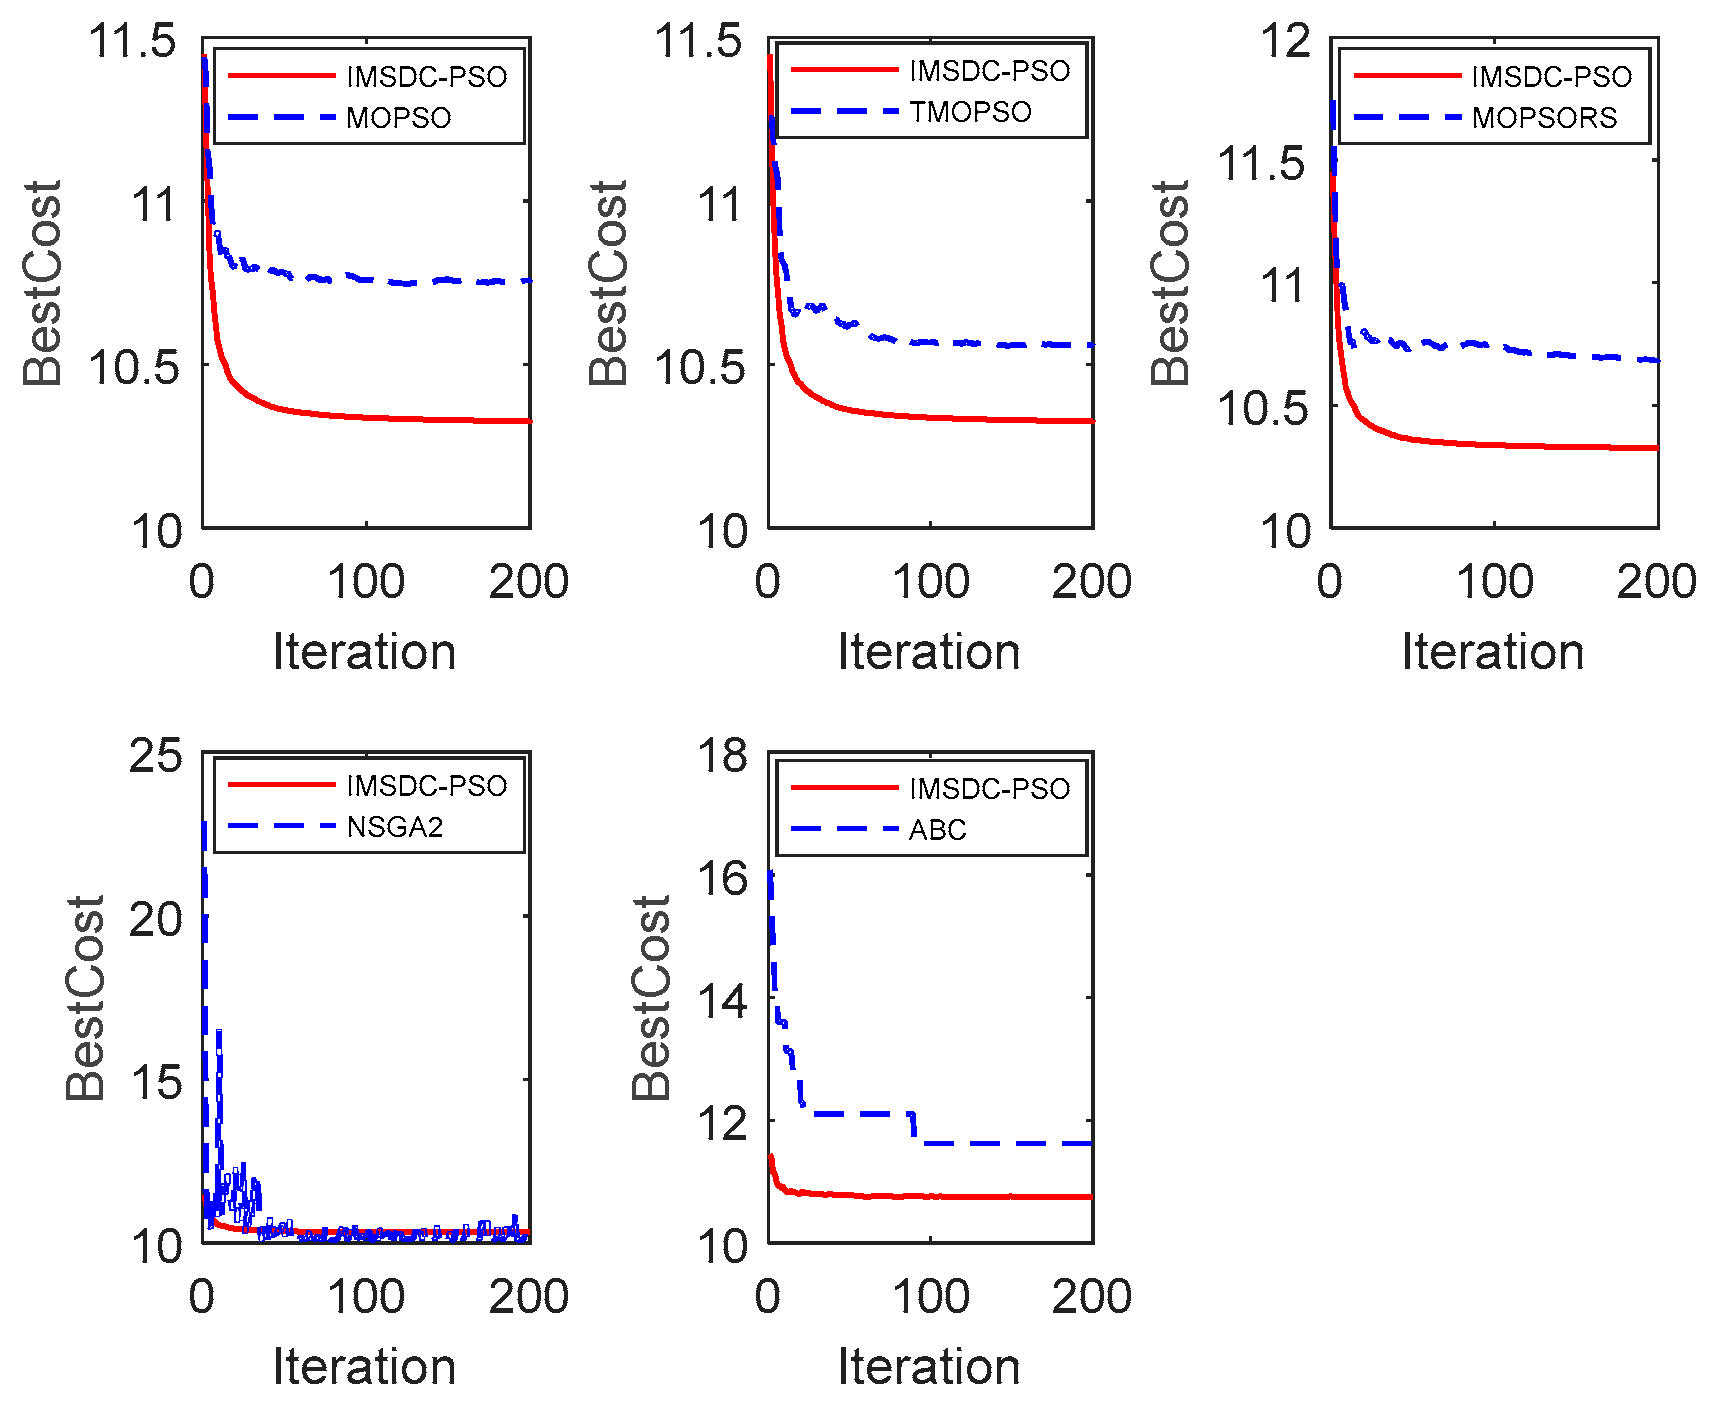
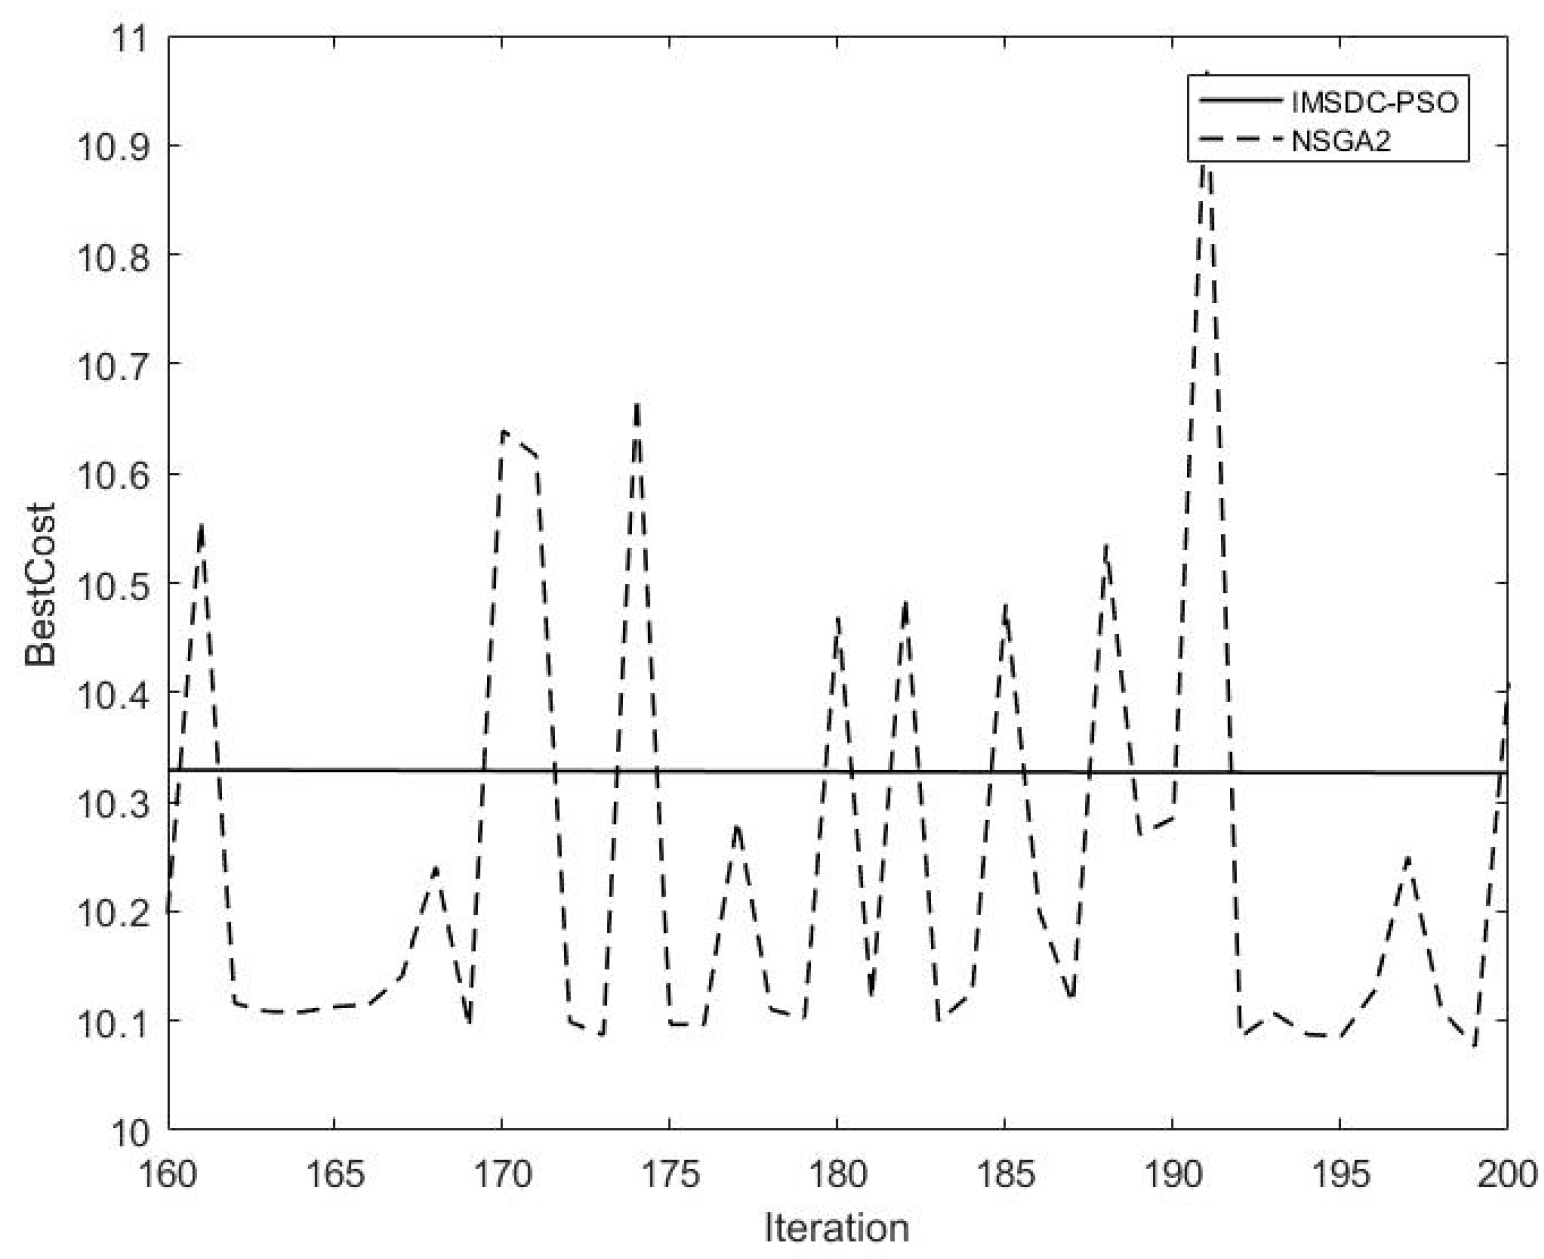
3.4. Normalization Objective Optimization

This article converts two variables into a single variable. Since the load magnitude is significantly larger than the satisfaction magnitude, the two indicators are first adjusted to the same order of magnitude and then multiplied by 0.5 to obtain the final variable result. The resulting performance is illustrated in Figure 8.
Figure 8 demonstrates that IMSDC-PSO slightly outperforms TMOPSO. The results of MOPSO and MOPSO_RS are similar, showing weaker optimization outcomes compared to IMSDC-PSO and TMOPSO. The ABC algorithm exhibits limited search capability and performs worse than the four particle swarm optimization algorithms in terms of the final result. Although the NSGA2 algorithm performs well in some iterations, it lacks convergence ability, constantly fluctuating within a certain interval without reaching a final convergence result.
Regarding convergence speed and stability, MOPSO, MOPSO_RS, TMOPSO, and IMSDC-PSO demonstrate fast convergence, stabilizing after early iterations. On the other hand, the ABC algorithm reaches stability after medium iterations, while the NSGA2 algorithm continues to fluctuate within an interval after early iterations without achieving convergence.
After converting the two variables into one variable, it is represented as Bestcost. Table 6 shows the initial results of IMSDC-PSO and TMOPSO as 11.45 and 11.25, respectively. Both algorithms employ Tent chaotic perturbation, which enhances their initial search capability, resulting in good initial results and faster convergence. The initial values for MOPSO_RS and MOPSO are 11.74 and 11.44, respectively, indicating slower convergence in the initial iteration stage for these two algorithms. However, as indicated in Table 6, the initial results for the ABC and NSGA2 iterations are 16.08 and 22.86, respectively. These values highlight the poor stability and convergence of the NSGA2 algorithm, while the ABC algorithm exhibits weak searchability.
Table 6 indicates that the final value achieved by IMSDC-PSO is 10.33, which differs significantly from the results of other algorithms, except for NSGA2 with a value of 10.41. However, it should be noted that the NSGA2 exhibits weak convergence and poor initial solution quality, rendering it unsuitable for practical applications, as shown in Figure 9. Therefore, IMSDC-PSO not only yields the best results but also demonstrates superior performance compared to the other algorithms.

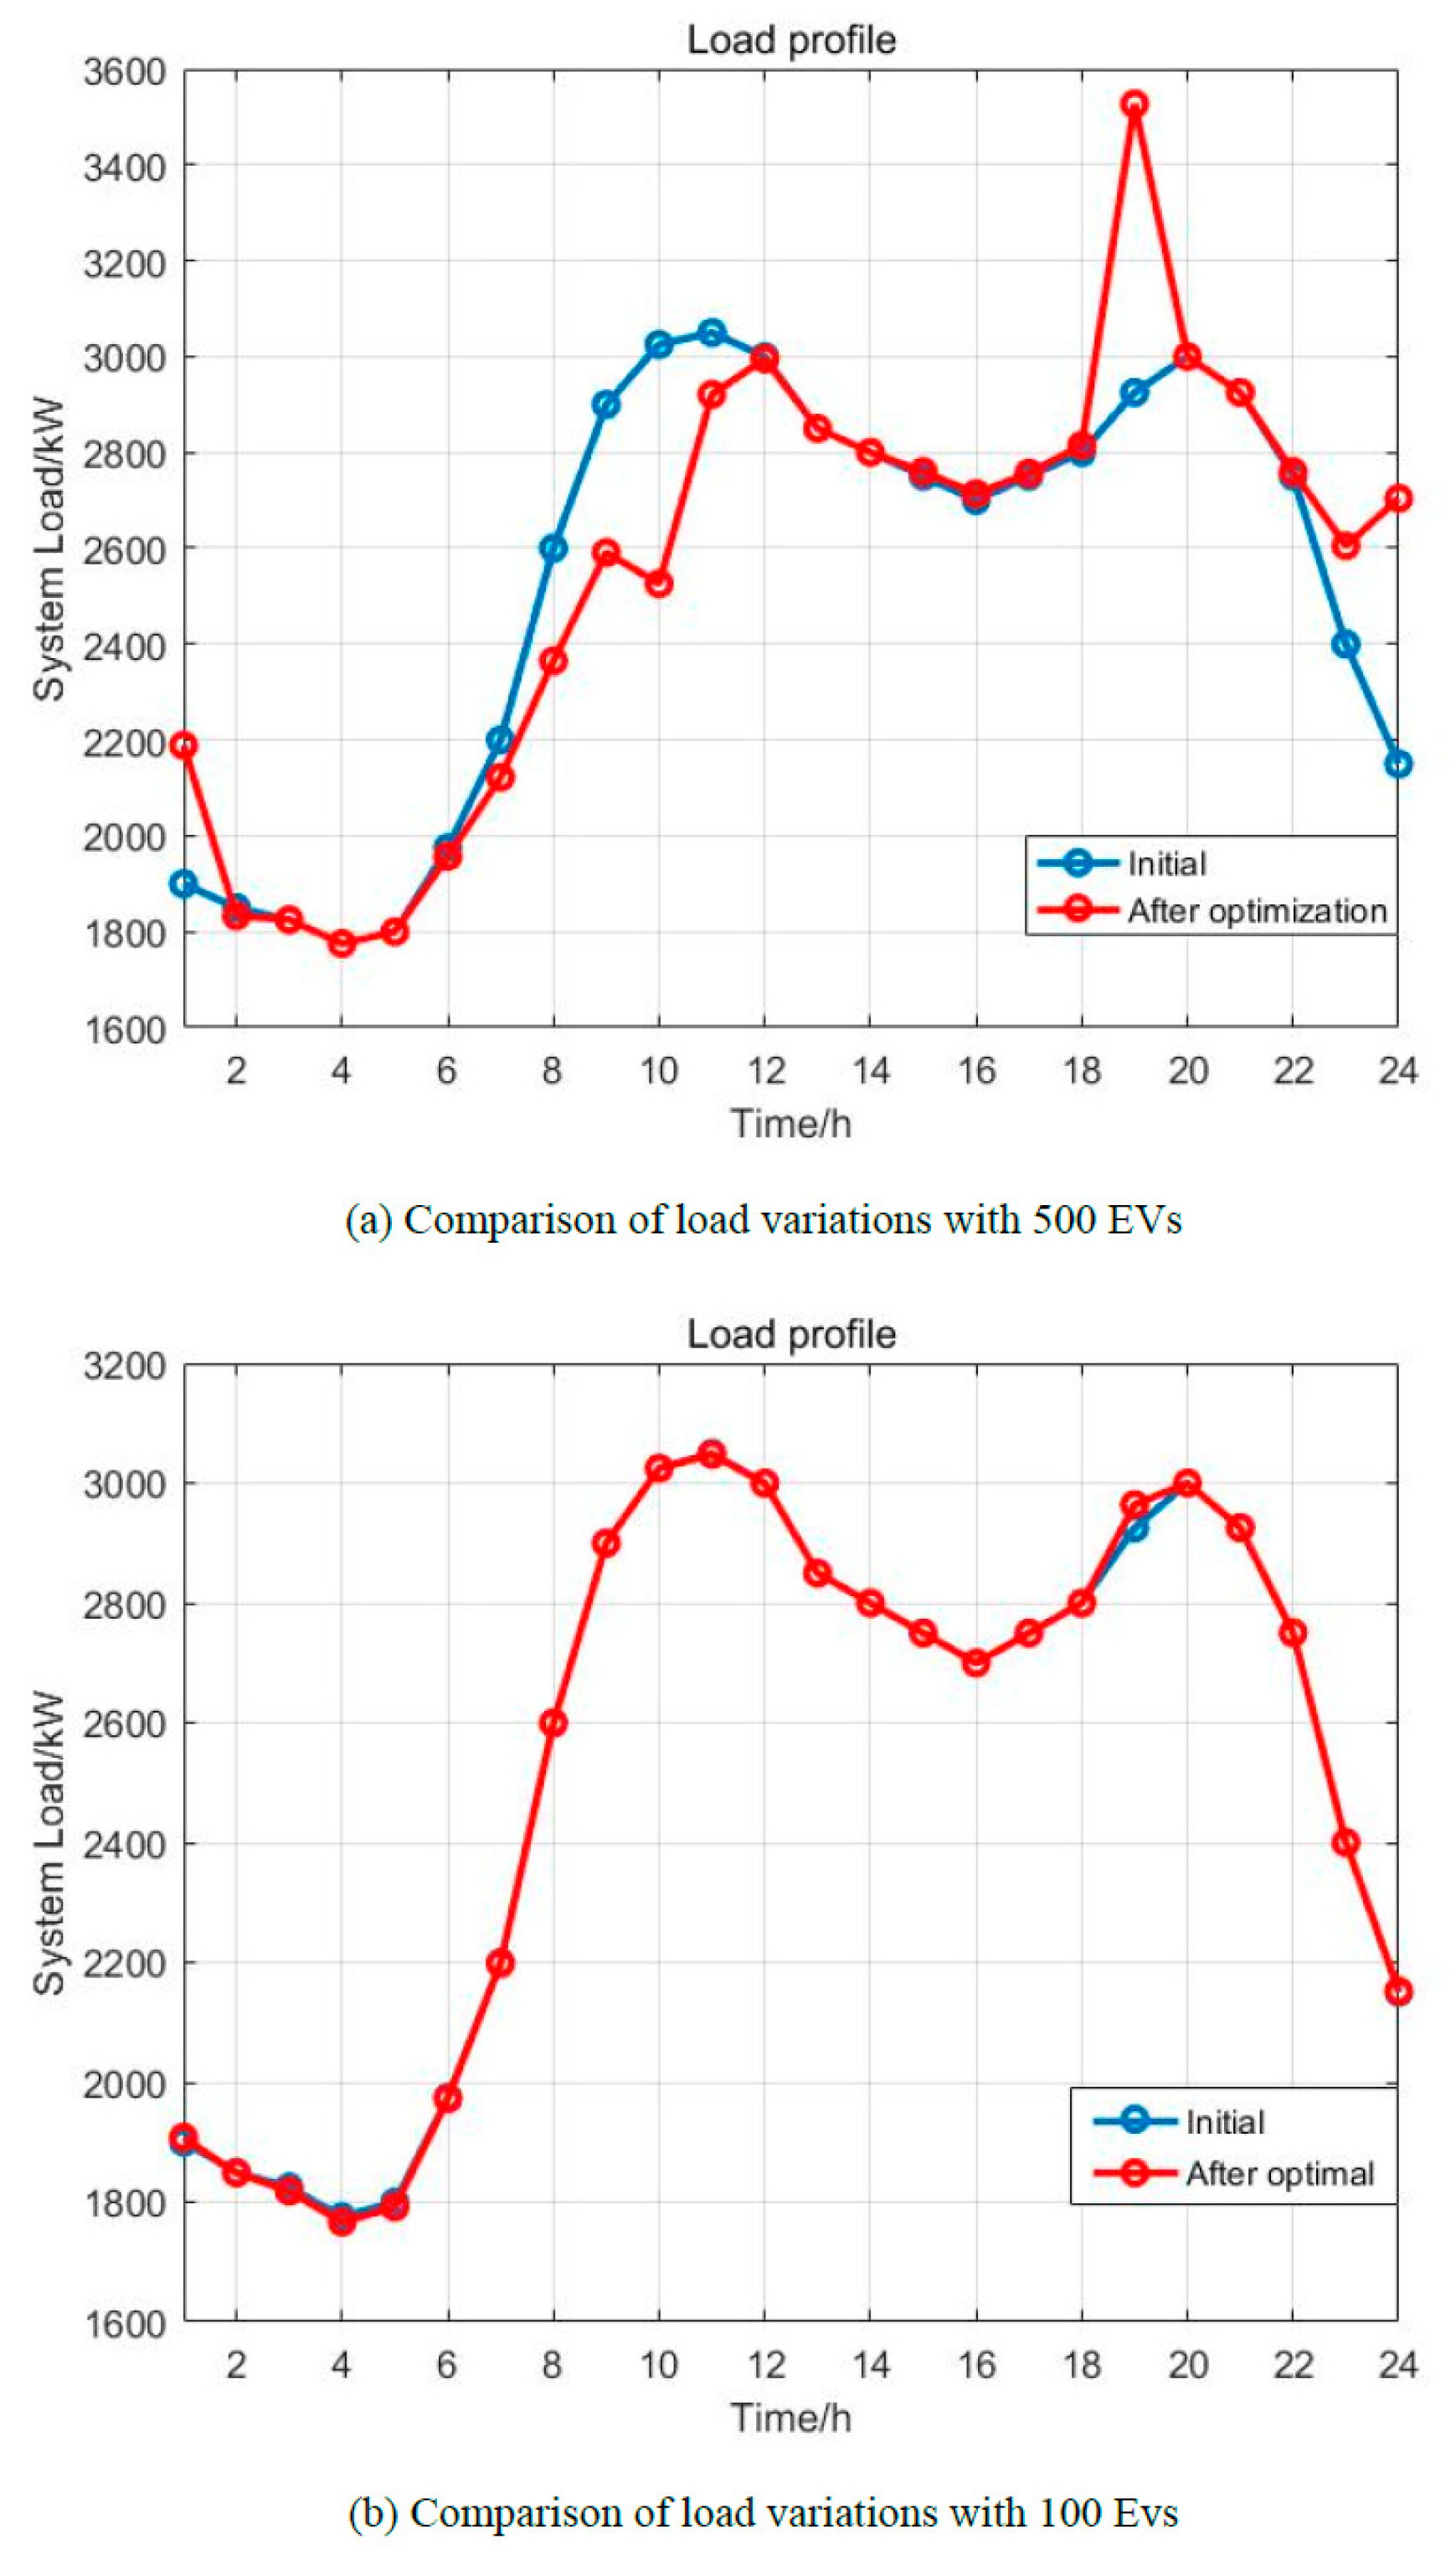
3.5. 24 h Load Optimization

Figure 10a demonstrates that algorithm optimization effectively resolves the peak-valley effect when the number of EVs is large, successfully achieving the objective of peak shaving and valley filling. During the period between 24 h, load levels vary depending on EV usage by the users. Specifically, from 22 PM to 2 AM, users return home from work to charge EVs, resulting in increased load levels compared to initialization. Between 7 AM and 12 AM, users drive their EVs from home to work, leading to a decrease in load levels compared to initialization. Finally, at 7 PM, a considerable number of users returned home from work, resulting in a significant increase in load levels due to the large number of EVs connected to the microgrid. From Figure 10b, it is observed that the 24 h load optimization results are not significant when there are only a few EVs. There is only a slight change at 19 PM. Hence, we can deduce that with a small number of EVs connected to the microgrid, their presence has minimal impact on the load within the microgrid. By comparing Figure 10a,b, it can be inferred that the results of 24 h load optimization can effectively demonstrate peak shaving and valley filling effects when the number of EVs exceeds a certain critical value. Therefore, the algorithm is better suited for optimizing load in large residential areas that can accommodate multiple charging stations.

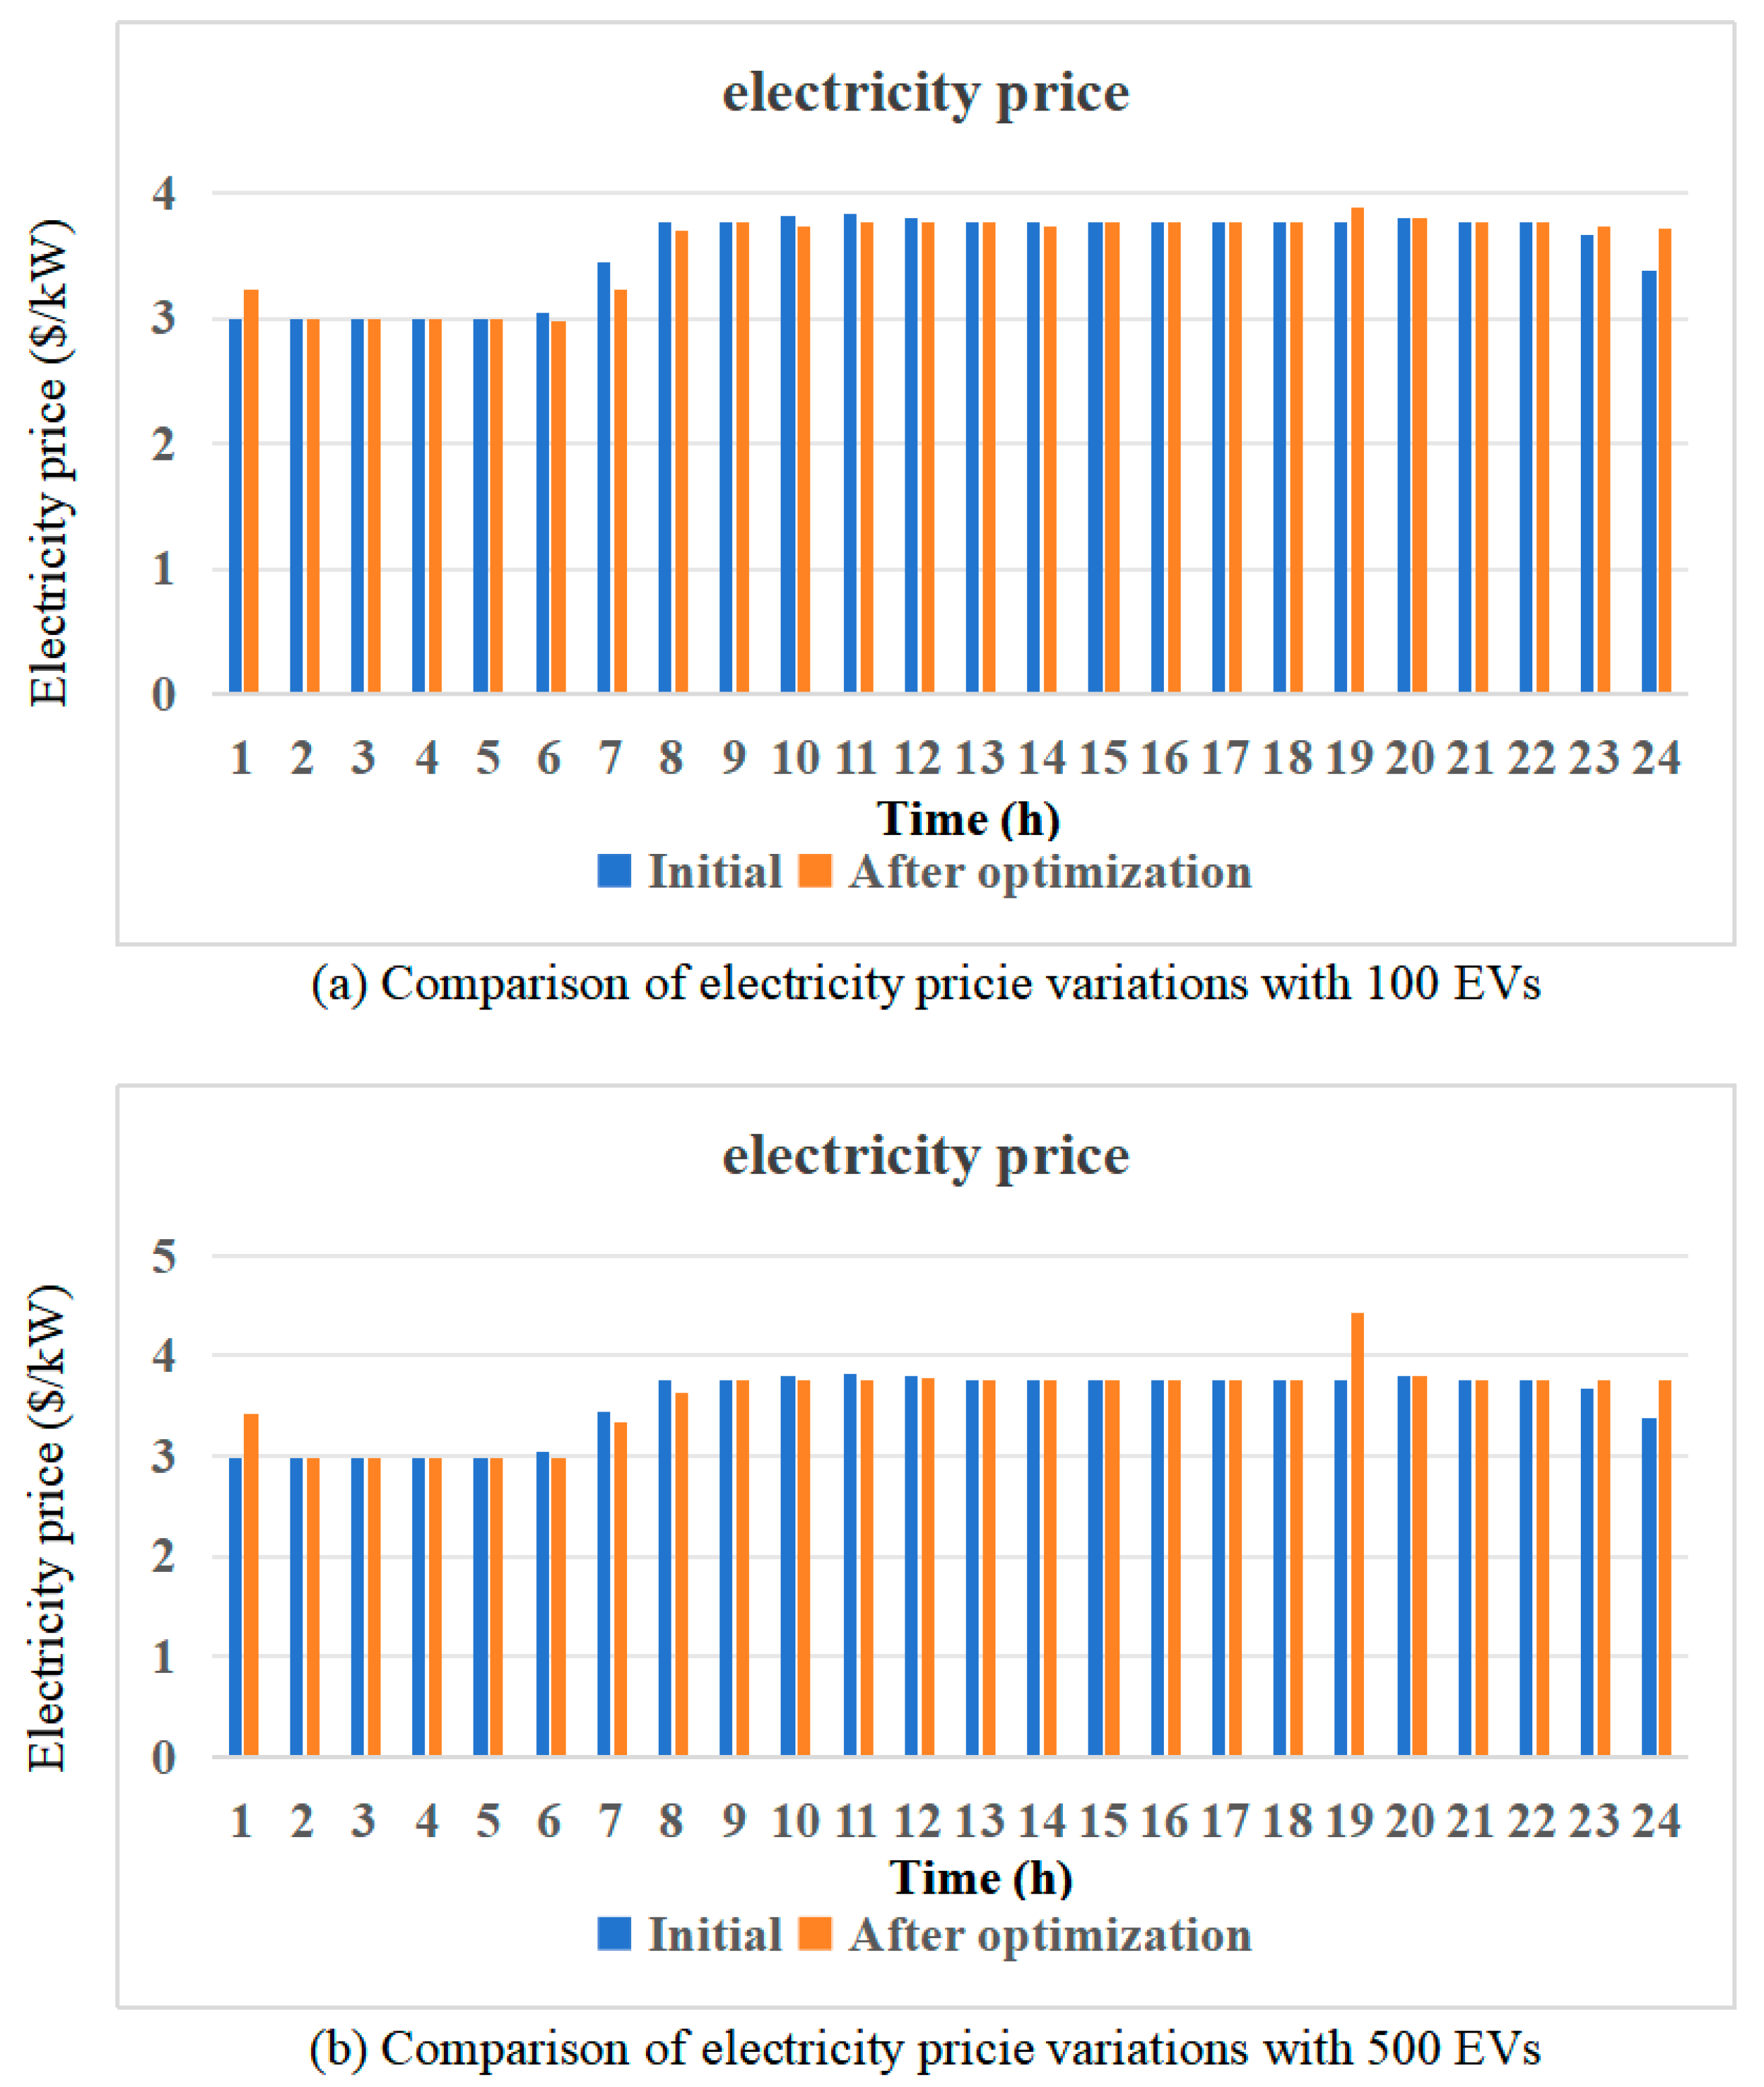
3.6. 24 h Electricity Price Optimization

This article obtains electricity price data based on the concept of fuzzy logic [59]. Figure 11 illustrates the electricity price data before and after optimization. The yellow block represents the optimized results, while the blue block represents the pre-optimized results and corresponding graphs are plotted for different numbers of EVs. When a large number of EVs are connected with microgrids, the load exhibits significant fluctuations, and the electricity price is primarily influenced by the real-time load over the 24 h period. Consequently, changes occur in the electricity price. If the load increases, the electricity price also increases significantly, and vice versa. Simultaneously, the fluctuation in electricity prices impacts economic satisfaction. An increase in electricity prices inevitably leads to a decrease in economic satisfaction, thereby lowering user satisfaction. However, after optimization, the algorithm reduces the value of user satisfaction, creating a negative feedback loop. As depicted in Figure 11a, due to the influence of the 24 h load, the electricity price increases significantly during periods of increased load and decreases with a decrease in load. From Figure 10b and Figure 11b, it can be observed that when the number of EVs is small and the load fluctuation is insignificant, the impact on electricity prices caused by load fluctuations is also not significant.

4. Conclusions

This paper investigated the physical and equipment limitations that EVs encounter when connected to the power grid. To address this problem, an improved multi-objective role partitioning chaotic particle swarm optimization algorithm (IMSDC-PSO) is proposed. This algorithm takes into account user satisfaction when scheduling EV grid connections. To tackle the nonlinear and multi-objective issues inherent in the model, this study employs the IMSDC-PSO algorithm, which integrates the concepts of multi-role partitioning and chaotic disturbance to effectively manage the orderly charging and discharging of EVs. Simulation experiments were conducted, comparing the IMSDC-PSO algorithm to five other algorithms. The results show that the proposed algorithm is capable of achieving up to 23% microgrid load reduction and up to 20% improvement in convergence speed compared to other algorithms. It is superior to other algorithms in solving the problem of orderly charging and discharging of electric vehicles and has strong usability and feasibility. The effectiveness of the algorithm is validated, providing an effective approach to solving the problem of orderly charging and discharging scheduling of EVs.
Based on this research, the scalability of the algorithm and a more efficient scheduling algorithm are seen as future research directions. We intend to extend the proposed algorithm to the environment of cooperative optimization of multiple microgrids to maximize the use of the energy schedulable characteristics of EVs, and to improve and enhance the scalability of the proposed algorithm. In addition, optimization algorithms based on deep learning are also one of the future research focuses, where deep learning networks are trained by obtaining real-time data of EVs and their users; taking advantage of the increasing EV charging stations, this information or these data can be obtained in practice. If we can share all these data in the scope of a specific microgrid, the network of deep learning methods can be trained and the trained networks can be used to achieve real-time optimal scheduling of EVs.

Author Contributions

Conceptualization, S.Z. and C.M.; methodology, S.Z.; software, S.Z.; validation, S.Z., C.M. and Z.C.; formal analysis, Z.C.; investigation, S.Z.; resources, C.M.; data curation, S.Z.; writing—original draft preparation, S.Z.; writing—review and editing, C.M. and Z.C.; visualization, Z.C.; supervision, Z.C.; project administration, C.M.; funding acquisition, Z.C. All authors have read and agreed to the published version of the manuscript.

Funding

This work was supported by the Support Research Funds of Northeastern University at Qinhuangdao (9060311812201).

Data Availability Statement

The original contributions presented in the study are included in the article, further inquiries can be directed to the corresponding author.

Conflicts of Interest

The authors declare no conflicts of interest.

References

  1. Kou, P.; Liang, D.; Gao, L.; Gao, F. Stochastic coordination of plug-in electric vehicles and wind turbines in microgrid: A model predictive control approach. IEEE Trans. Smart Grid 2016, 7, 1537–1551. [Google Scholar] [CrossRef]
  2. Pure Power—Wind Energy Targets for 2020 and 2030. European Wind Energy Association. Available online: https://www.osti.gov/etdeweb/biblio/21514309 (accessed on 1 January 2025).
  3. Economics of Wind Energy. European Wind Energy Association. Available online: https://www.ewea.org/fileadmin/files/library/publications/reports/Economics_of_Wind_Energy.pdf (accessed on 1 January 2025).
  4. Shared Solar: Current Landscape, Market Potential, and the Impact of Federal Securities Regulation. U.S. Department of Energy. Available online: http://www.nrel.gov/docs/fy15osti/63892.pdf (accessed on 1 January 2025).
  5. Lund, H.; Kempton, W. Integration of renewable energy into the transport and electricity sectors through V2G. Energ Policy 2008, 36, 3578–3587. [Google Scholar] [CrossRef]
  6. Nguyen, H.K.; Song, J.B. Optimal charging and discharging for multiple PHEVs with demand side management in vehicle-to-building. J. Commun. Netw. 2012, 14, 662–671. [Google Scholar] [CrossRef]
  7. Cardoso, G.; Stadler, M.; Chehreghani Bozchalui, M.; Sharma, R.; Marnay, C.; Barbosa-Povoa, A.; Ferrao, P. Stochastic programming of vehicle to building interactions with uncertainty in PEVs driving for a medium office building. In Proceedings of the 39th Annual Conference of the IEEE Industrial Electronics Society (IECON), Vienna, Austria, 10–13 November 2013; pp. 7648–7653. [Google Scholar]
  8. Harding, J.; Powell, G.; Yoon, R.; Fikentscher, J.; Doyle, C.; Sade, D.; Wang, J. Vehicle-to-Vehicle Communications: Readiness of V2V Technology for Application; Report No. DOT HS 812 014; National Highway Traffic Safety Administration: Washington, DC, USA, 2014. [Google Scholar]
  9. Vadi, S.; Bayindir, R.; Colak, A.M.; Hossain, E. A review on communication standards and charging topologies of V2G and V2H operation strategies. Energies 2019, 12, 3748. [Google Scholar] [CrossRef]
  10. Sun, F.; Hou, W.; Yin, B.; Xi, H. Preliminary studies on the linking of building hybrid energy system and distributed power generation system. In Proceedings of the International Conference on Sustainable Power Generation and Supply, Nanjing, China, 6–7 April 2009; pp. 1–6. [Google Scholar]
  11. Huang, H.; Cai, Y.; Xu, H.; Yu, H. A multiagent minority-game based demand-response management of smart buildings toward peak load reduction. IEEE Trans. Comput. Aided Des. Integr. Circuits Syst. 2017, 36, 573–585. [Google Scholar] [CrossRef]
  12. Van Heuveln, K.; Ghotge, R.; Annema, J.A.; van Bergen, E.; van Wee, B.; Pesch, U. Factors influencing consumer acceptance of vehicle-to-grid by electric vehicle drivers in the Netherlands. Travel Behav. Soc. 2021, 24, 34–45. [Google Scholar] [CrossRef]
  13. Kester, J.; de Rubens, G.Z.; Sovacool, B.K.; Noel, L. Public perceptions of electric vehicles and vehicle-to-grid (V2G): Insights from a Nordic focus group study. Transp. Res. D Transp. Environ. 2019, 74, 277–293. [Google Scholar] [CrossRef]
  14. Kwon, Y.; Son, S.; Jang, K. User satisfaction with battery electric vehicles in South Korea. Transp. Res. D Transp. Environ. 2020, 82, 102306. [Google Scholar] [CrossRef]
  15. Ghotge, R.; Nijssen, K.P.; Annema, J.A.; and Lukszo, Z. Use before you choose: What do EV drivers think about V2G after experiencing it? Energies 2022, 15, 4907. [Google Scholar] [CrossRef]
  16. Chai, Y.T.; Che, H.S.; Tan, C.; Tan, W.N.; Yip, S.C.; Gan, M.T. A two-stage optimization method for Vehicle to Grid coordination considering building and Electric Vehicle user expectations. Int. J. Electr. Power Energy Syst. 2023, 148, 108984. [Google Scholar] [CrossRef]
  17. Saber, A.Y.; Venayagamoorthy, G.K. Unit commitment with vehicle-to-grid using particle swarm optimization. In Proceedings of the 2009 IEEE Bucharest PowerTech, Bucharest, Romania, 28 June–2 July 2009; pp. 1–8. [Google Scholar]
  18. Borges, N.; Soares, J.; Vale, Z. Multi-objective particle swarm optimization to solve energy scheduling with vehicle-to-grid in office buildings considering uncertainties. IFAC Pap. 2017, 50, 3356–3361. [Google Scholar] [CrossRef]
  19. Zhang, Y.; Wang, S.; Ji, G. A comprehensive survey on particle swarm optimization algorithm and its applications. Math. Probl. 2015, 2015, 1–38. [Google Scholar] [CrossRef]
  20. Alegre, S.; Míguez, J.V.; Carpio, J. Modelling of electric and parallel-hybrid electric vehicle using Matlab/Simulink environment and planning of charging stations through a geographic information system and genetic algorithms. Renew. Sustain. Energy Rev. 2017, 74, 1020–1027. [Google Scholar] [CrossRef]
  21. Korotunov, S.; Tabunshchyk, G.; Okhmak, V. Genetic algorithms as an optimization approach for managing electric vehicles charging in the smart grid. In Proceedings of the Third International Workshop on Computer Modeling and Intelligent Systems, CEUR, Zaporizhzhia, Ukraine, 27 April–1 May 2020; pp. 184–198. [Google Scholar]
  22. Abdullah-Al-Nahid, S.; Khan, T.A.; Taseen, M.A.; Jamal, T.; Aziz, T. A novel consumer-friendly electric vehicle charging scheme with vehicle to grid provision supported by genetic algorithm based optimization. J. Energy Storage 2022, 50, 104655. [Google Scholar] [CrossRef]
  23. Habib, H.U.R.; Subramaniam, U.; Waqar, A.; Farhan, B.S.; Kotb, K.M.; Wang, S. Energy cost optimization of hybrid renewables based V2G microgrid considering multi objective function by using artificial bee colony optimization. IEEE Access. 2020, 8, 62076–62093. [Google Scholar] [CrossRef]
  24. Chandrasekaran, K.; Hemamalini, S.; Simon, S.P.; Padhy, N.P. Thermal unit commitment using binary/real coded artificial bee colony algorithm. Electr. Power Syst. Res. 2012, 84, 109–119. [Google Scholar] [CrossRef]
  25. Zhang, S.; Luo, Y.; Li, K. Multi-objective route search for electric vehicles using ant colony optimization. In Proceedings of the 2016 American Control Conference (ACC), Boston, MA, USA, 6–8 July 2016. [Google Scholar]
  26. Tangrand, K.; Bremdal, B.A. Using Ant Colony Optimization to determine influx of EVs and charging station capacities. In Proceedings of the 2016 IEEE International Energy Conference (ENERGYCON), Leuven, Belgium, 4–8 April 2016; pp. 1–6. [Google Scholar]
  27. Van Laarhoven, P.J.; Aarts, E.H. Simulated Annealing; Springer Netherlands: Dordrecht, The Netherlands, 1987; pp. 7–15. [Google Scholar]
  28. Sousa, T.; Soares, T.; Morals, H.; Castro, R.; Vale, Z. Simulated annealing to handle energy and ancillary services joint management considering electric vehicles. Electr. Power Syst. Res. 2016, 136, 383–397. [Google Scholar] [CrossRef]
  29. Wang, B.; Xu, J.; Cao, B.; Xu, D.; Zou, Z. Optimization of energy management system for hybrid power sources of electric vehicles using simulated annealing algorithm. J. Xi’an Jiaotong Univ. 2015, 49, 90–96. [Google Scholar]
  30. Salman, S.S.; Islam, M.M. Optimal Dispatch for A Microgrid with Distributed Generations and EV Charging Load. In Proceedings of the 2023 IEEE Power & Energy Society Innovative Smart Grid Technologies Conference (ISGT), Washington, DC, USA, 16–19 January 2023. [Google Scholar]
  31. Wang, C.; Qin, F.; Xiang, X.S.; Jiang, H.; Zhang, X.Y. A Dual-Population-Based Co-Evolutionary Algorithm for Capacitated Electric Vehicle Routing Problems. IEEE Trans. Transp. Electrification 2024, 10, 2663–2676. [Google Scholar] [CrossRef]
  32. Luo, T.Y.; Heng, Y.; Xing, L.N.; Ren, T.; Li, Q.; Qin, H. A Two-Stage Approach for Electric Vehicle Routing Problem with Time Windows and Heterogeneous Recharging Stations. Tsinghua Sci. Technol. 2024, 29, 1300–1322. [Google Scholar] [CrossRef]
  33. Eltamaly, A.M. A Novel Strategy for Optimal PSO Control Parameters Determination for PV Energy Systems. Sustainability 2021, 13, 1008. [Google Scholar] [CrossRef]
  34. Deb, K.; Agrawal, S.; Pratap, A.; Meyarivan, T. A fast elitist non-dominated sorting genetic algorithm for multi-objective optimization: NSGA-II. In Parallel Problem Solving from Nature PPSN VI, Proceedings of the 6th International Conference, Paris, France, 18–20 September 2000; Springer: Berlin/Heidelberg, Germany, 2000; Volume 6, pp. 849–858. [Google Scholar]
  35. Deb, K.; Pratap, A.; Agarwal, S.; Meyarivan, T.A.M.T. A Fast and Elitist Multiobjective Genetic Algorithm: NSGA-II. IEEE Trans. Evol. 2002, 6, 182–197. [Google Scholar] [CrossRef]
  36. Zhang, T.; Chen, X.; Yu, Z.; Zhu, X.; Shi, D. A Monte Carlo Simulation Approach to Evaluate Service Capacities of EV Charging and Battery Swapping Stations. IEEE Trans Ind. Inform. 2018, 14, 3914–3923. [Google Scholar] [CrossRef]
  37. Alatas, B.; Akin, E.; Ozer, A.B. Chaos Embedded Particle Swarm Optimization Algorithms. Chaos Solitons Fractals 2009, 40, 1715–1734. [Google Scholar] [CrossRef]
  38. Wei, Y.Q.; Dai, Y.S.; Zhang, Y.N.; Chen, J.; Ding, J.J. Adaptive Chaotic Embedded Particle Swarm Optimization Based on Tent Mapping. J. Comput. Eng. Appl. 2013, 49, 45–49. [Google Scholar]
  39. Moradi, M.H.; Abedini, M.; Tousi, S.R.; Hosseinian, S.M. Optimal siting and sizing of renewable energy sources and charging stations simultaneously based on differential evolution algorithm. Int. J. Electr. Power Energy Syst. 2015, 73, 1015–1024. [Google Scholar] [CrossRef]
  40. Qiao, B.; Liu, J. Multi-objective dynamic economic emission dispatch based on electric vehicles and wind power integrated system using differential evolution algorithm. Renew Energ. 2020, 154, 316–336. [Google Scholar] [CrossRef]
  41. Shang, X.; Li, Y.; Huang, R. A charging and discharging model for electric vehicles based on consortium blockchain using multi-objective gray wolf algorithm. Recent Adv. Electr. Electron. Eng. 2022, 15, 640–652. [Google Scholar]
  42. Liu, B.; Pan, Z.; Tan, Z.; Wang, D.; Yu, T. A real-time schedule optimization of massive electric vehicles and energy storage system based on grey wolf optimizer. In Proceedings of the 2018 IEEE 8th Annual International Conference on CYBER Technology in Automation, Control, and Intelligent Systems (CYBER), Tianjin, China, 19–23 July 2018; pp. 1160–1165. [Google Scholar]
  43. Zhuang, Z.; Jin, T. Capacity configuration and control strategy of EV charging station with integrated wind power and energy storage based on SSA. In Proceedings of the 2021 IEEE 5th Conference on Energy Internet and Energy System Integration (EI2), Taiyuan, China, 22–24 October 2021; pp. 4316–4322. [Google Scholar]
  44. Xu, H.Q.; Gu, S.; Fan, Y.C.; Li, X.S.; Zhao, Y.F.; Zhao, J.; Wang, J.J. A strategy learning framework for particle swarm optimization algorithm. Inf. Sci. 2023, 619, 126–152. [Google Scholar] [CrossRef]
  45. Li, X.; Wang, L.; Jiang, Q.; Li, N. Differential evolution algorithm with multi-population cooperation and multi-strategy integration. Neurocomputing 2021, 421, 285–302. [Google Scholar] [CrossRef]
  46. Hashemi, A.B.; Meybodi, M.R. A multi-role cellular PSO for dynamic environments. In Proceedings of the 2009 14th International CSI Computer Conference, Tehran, Iran, 20–21 October 2009; pp. 412–417. [Google Scholar]
  47. Marini, F.; Walczak, B. Particle swarm optimization (PSO). A tutorial. Chemom. Intell Lab Syst. 2015, 149, 153–165. [Google Scholar] [CrossRef]
  48. Coello, C.A.C.; Lechuga, M.S. MOPSO: A proposal for multiple objective particle swarm optimization. In Proceedings of the 2002 Congress on Evolutionary Computation CEC’02 (Cat. No. 02TH8600), Honolulu, HI, USA, 12–17 May 2002; Volume 2, pp. 1051–1056. [Google Scholar]
  49. Breunig, M.M.; Kriegel, H.P.; Ng, R.T.; Sander, J. LOF: Identifying density-based local outliers. In Proceedings of the 2000 ACM SIGMOD International Conference on Management of Data, Dallas, TX, USA, 15–18 May 2000; pp. 93–104. [Google Scholar]
  50. Zhang, Q.; Hu, Y.; Tan, W.; Li, C.; Ding, Z. Dynamic time-of-use pricing strategy for electric vehicle charging considering user satisfaction degree. Appl. Sci. 2020, 10, 3247. [Google Scholar] [CrossRef]
  51. Ahmadi, S.; Arabani, H.P.; Haghighi, D.A.; Beheshtaein, M.H. Optimal use of vehicle-to-grid technology to modify the load profile of the distribution system. J. Energy Storage 2020, 31, 101627. [Google Scholar] [CrossRef]
  52. Yu, X.L.; Xiaodong, M.; Jun, Z.A.H.N.G.; Zhen, W. Chaos sparrow search optimization algorithm. J. Beijing Univ. Aeronaut. Astronautics 2021, 47, 1712–1720. [Google Scholar]
  53. Couceiro, M.; Ghamisi, P.; Couceiro, M.; Ghamisi, P. Particle swarm optimization. In Proceedings of the 2016 International Conference on Swarm Intelligence; Springer International Publishing: Berlin/Heidelberg, Germany, 2016; pp. 1–10. [Google Scholar]
  54. Liang, W.W.; Jin, Y.W.; Chen, J.C.; Li, G.Q.; Hu, M.Z.; Dong, J.H. Multi-objective particle swarm optimization algorithm with multi-role and multi-strategy. J. Zhejiang Univ. (Eng. Sci.) 2022, 56, 531–541. [Google Scholar]
  55. Long, Q.; Wu, X.; Wu, C. Non-dominated sorting methods for multi-objective optimization: Review and numerical comparison. J. Ind. Manag. Optim. 2021, 17, 1001–1023. [Google Scholar] [CrossRef]
  56. Seada, H.; Deb, K. Non-dominated sorting based multi/many-objective optimization: Two decades of research and application. In Multi-Objective Optimization: Evolutionary to Hybrid Framework; Springer: Berlin/Heidelberg, Germany, 2018; pp. 1–24. [Google Scholar]
  57. Becker, T.A.; Sidhu, I.; Tenderich, B. Electric Vehicles in the United States: A New Model with Forecasts to 2030; Center for Entrepreneurship and Technology, University of California: Berkeley, CA, USA, 2009; pp. 1–24. [Google Scholar]
  58. Soltani-Sobh, A.; Heaslip, K.; Stevanovic, A.; Bosworth, R.; Radivojevic, D. Analysis of the electric vehicles adoption over the United States. Transp. Res. Procedia 2017, 22, 203–212. [Google Scholar] [CrossRef]
  59. Li, G.; Liu, C.C.; Mattson, C.; Lawarrée, J. Day-ahead electricity price forecasting in a grid environment. IEEE Trans. Power Syst. 2007, 22, 266–274. [Google Scholar] [CrossRef]
Figure 1. Network of V2G.
Energies 18 00690 g001
Figure 2. Distribution of Tent chaotic sequences.
Energies 18 00690 g002
Figure 3. Flowchart of the control strategy.
Energies 18 00690 g003
Figure 4. Comparison of load optimization between IMSDC-PSO and other algorithms.
Energies 18 00690 g004
Figure 5. Comparison of IMSDC-PSO and NSGA2 in load optimization between iteration 160 and 200.
Energies 18 00690 g005
Figure 6. Comparison of user satisfaction between IMSDC-PSO and other algorithms.
Energies 18 00690 g006
Figure 7. Comparison of IMSDC-PSO and NSGA2 in user satisfaction between iteration 160 and 200.
Energies 18 00690 g007
Figure 8. Comparison of BestCost between IMSDC-PSO and other algorithms.
Energies 18 00690 g008
Figure 9. Comparison of IMSDC-PSO and NSGA2 in BestCost between iteration 160 and 200.
Energies 18 00690 g009
Figure 10. Comparison of load variations with different numbers of EVs.
Energies 18 00690 g010
Figure 11. Comparison of electricity price variations with different numbers of EVs.
Energies 18 00690 g011
Table 1. Comparison of 50 EVs in load and user satisfaction.
MethodLoad (kW)Users’ SatisfactionConvergence Speed
IMSDC-PSO204.5555.2112.3 min
MOPSO210.9705.2611.6 min
TMOPSO204.4575.2413.5 min
MOPSO_RS209.8205.2317.4 min
NSGA2204.6215.2522.3 min
C-NSGA2204.5355.2424.1 min
ABC225.1915.3927.4 min
C-ABC221.5735.2830.7 min
Table 2. Comparison of 100 EVs in load and user satisfaction.
MethodLoad (kW)Users’ SatisfactionConvergence Speed
IMSDC-PSO210.7875.2425.3 min
MOPSO218.8845.3024.1 min
TMOPSO210.9265.2826.4 min
MOPSO_RS218.9915.2628.2 min
NSGA2215.0145.2928.7 min
C-NSGA2214.8915.2830.4 min
ABC243.6355.6131.4 min
C-ABC244.8325.5832.1 min
Table 3. Comparison of 150 EVs in load and user satisfaction.
MethodLoad (kW)Users’ SatisfactionConvergence Speed
IMSDC-PSO214.3775.2935.4 min
MOPSO222.0465.3533.7 min
TMOPSO217.4925.3436.8 min
MOPSO_RS227.2595.2938.6 min
NSGA2228.7005.3039.2 min
C-NSGA2228.9435.3140.1 min
ABC263.8825.7341.1 min
C-ABC262.7835.6842.5 min
Table 4. Comparison of 110 EVs in load.
MethodInitial Value
(kW)
Mean Value
(kW)
Final Value
(kW)
IMSDC-PSO245.327206.294204.485
MOPSO281.317216.228213.650
TMOPSO225.686209.916209.461
MOPSO_RS266.238218.387215.618
NSGA2597.771206.875205.119
C-NSGA2596.624207.248206.754
ABC369.592252.034239.652
C-ABC370.237253.849241.873
Table 5. Comparison of 110 EVs in user satisfaction.
MethodInitial Value
(kW)
Mean Value
(kW)
Final Value
(kW)
IMSDC-PSO5.315.225.21
MOPSO5.535.285.27
TMOPSO5.365.275.27
MOPSO_RS5.405.275.26
NSGA27.925.335.28
C-NSGA28.015.475.34
ABC6.845.685.63
C-ABC6.885.625.57
Table 6. Comparison of 110 EVs in normalization objective.
MethodInitial Value
(kW)
Mean Value
(kW)
Final Value
(kW)
IMSDC-PSO11.4510.3810.33
MOPSO11.4410.7810.76
TMOPSO11.2510.6110.56
MOPSO_RS11.7410.7510.68
NSGA222.8610.5010.41
C-NSGA223.7211.7211.27
ABC16.0811.9811.62
C-ABC17.1712.7111.25
Disclaimer/Publisher’s Note: The statements, opinions and data contained in all publications are solely those of the individual author(s) and contributor(s) and not of MDPI and/or the editor(s). MDPI and/or the editor(s) disclaim responsibility for any injury to people or property resulting from any ideas, methods, instructions or products referred to in the content.

