1. Introduction
Recently, solar energy has garnered significant attention due to its increasing availability and the rapid decline in the cost of photovoltaic (PV) cells [
1]. This growing interest highlights the potential of solar power as a sustainable energy source. However, its integration into existing power grids presents significant challenges, including voltage and frequency fluctuations, energy losses, and power quality issues [
2,
3]. These challenges are often exacerbated by the level of solar energy penetration into the grid, which can lead to operational issues or even outages [
4]. Conversely, hybrid energy systems, combined with energy storage solutions, have the potential to enhance the quality and reliability of power supplies [
3]. While these challenges have been extensively studied in developed countries, where electrical infrastructures are robust and regulatory frameworks are better established, the situation is markedly different in Least Developed Countries (LDCs) and developing countries. In these regions, the complexity of energy issues is compounded by structural limitations, economic constraints, and a rapidly growing demand for energy. Therefore, addressing the integration of solar PV in these contexts is crucial for achieving sustainable energy solutions.
LDCs and developing countries are among the most vulnerable regions to modern energy challenges. These countries, often grappling with the consequences of climate change, exhibit limited or outdated energy infrastructures, low electrification rates, and excessive reliance on fossil fuels. Moreover, energy demand continues to rise, driven by rapid population growth and accelerated urbanization. In this context, renewable solutions, such as PV energy, emerge as strategic alternatives. Indeed, they offer advantages such as installation flexibility, relatively low initial costs, and rapid deployment, making them particularly attractive for meeting the urgent energy needs of these regions. However, integrating renewable energies into fragile or undersized networks represents a major technical challenge, requiring tailored approaches to ensure the stability of the electrical system [
5,
6].
The Democratic Republic of Congo (DRC), listed among the LDCs by the United Nations (UN) [
7], exemplifies the challenges faced by many LDCs and developing countries in achieving reliable and sustainable energy access. Despite its abundant natural resources, the DRC suffers from a chronic energy deficit that significantly hampers its economic and social development. Although the electricity sector has been liberalized, the development of solar energy remains limited due to the absence of a coherent strategy aimed at promoting its adoption and ensuring sustainable energy access. Furthermore, the correlation between the development of the electricity sector and the availability of a skilled workforce highlights structural obstacles that hinder the industrialization efforts of the country [
8].
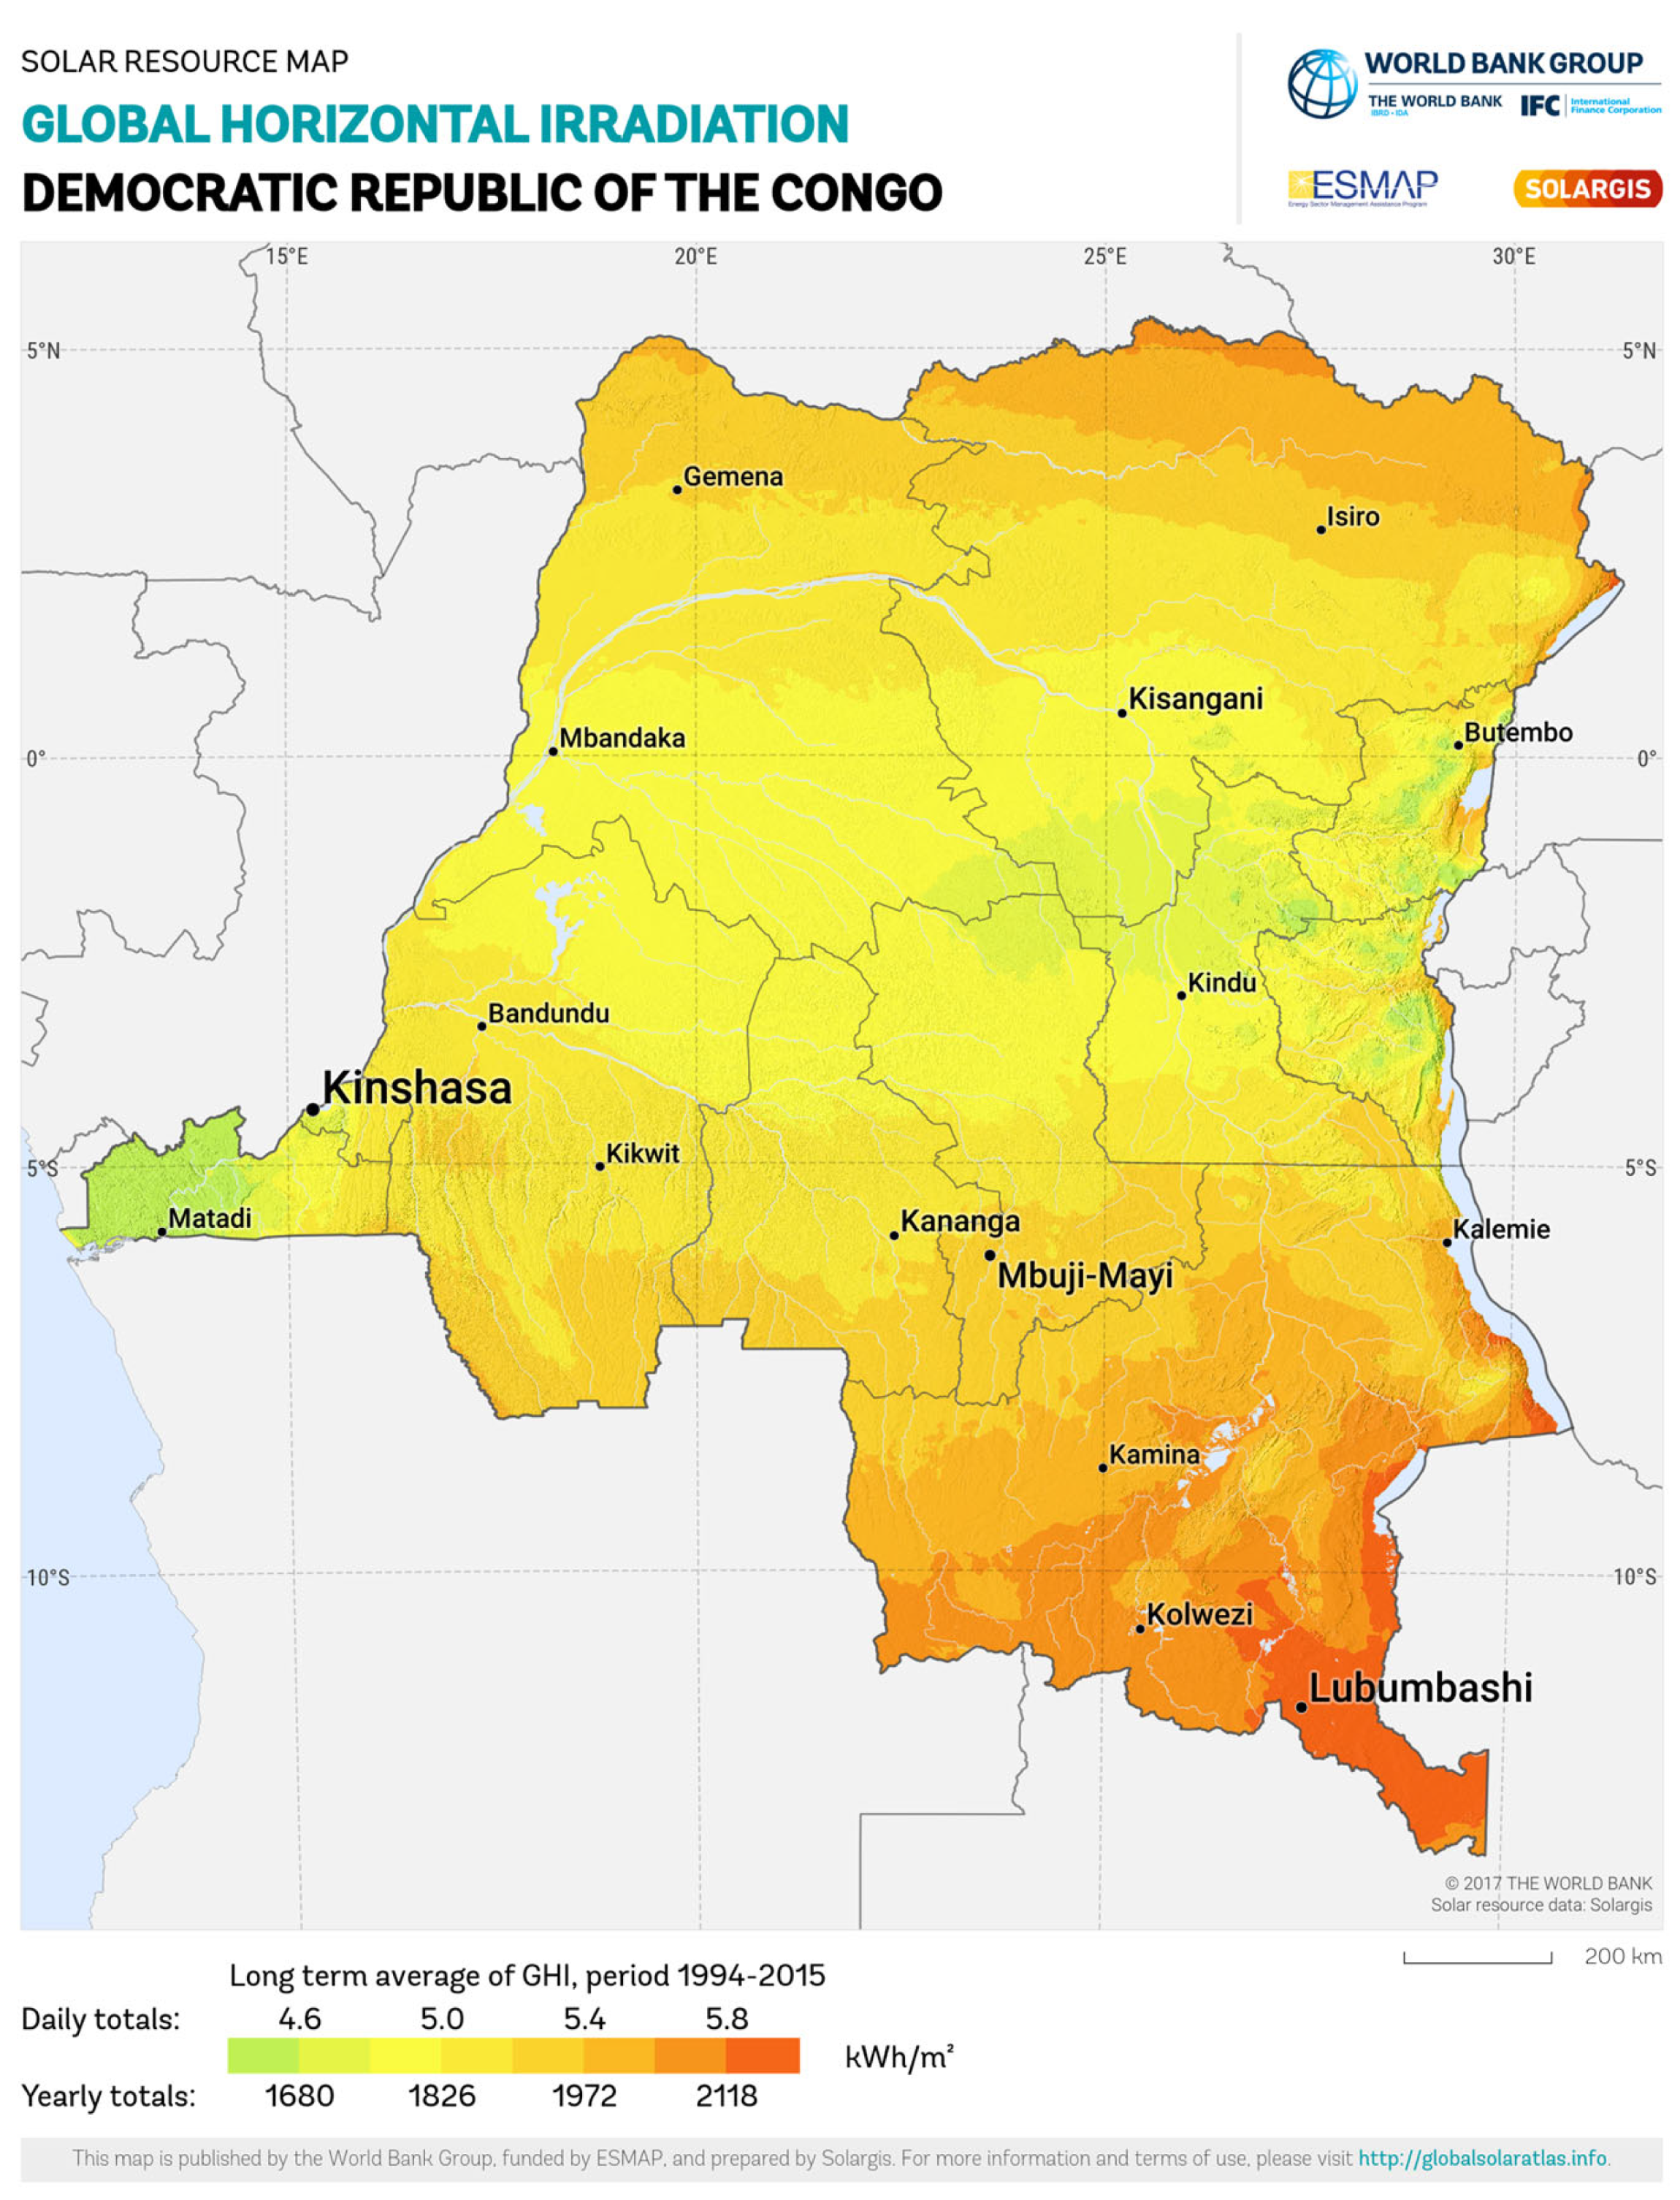
Nevertheless, the DRC possesses exceptional solar potential, with an average solar irradiation ranging from 3.5 to 6.75 kWh/m
2 [
9], as illustrated in
Figure 1. Harnessing this resource could help bridge a portion of the energy deficit, diversify the national energy mix, and reduce dependence on fossil fuels. However, to fully harness this solar potential, it is essential to implement an adapted strategic planning framework. This framework must account for the specific characteristics and constraints of the national electrical grid, which is marked by structural fragility and limited capacity, to accommodate new sources of intermittent energy. Such planning would maximize both economic and environmental benefits while ensuring the stability and reliability of the grid.
This work aims to evaluate the impacts of integrating PV energy into the power grid of the DRC to compensate for its energy deficit. The objectives are to assess the effects of different PV penetration levels at a strategic point in the network and to propose mitigation solutions for the identified issues. This study is based on a detailed analysis of the western transmission network of the Société Nationale d’Électricité S.A. (SNEL)—the national electricity company in the DRC—using simulations with DIgSILENT PowerFactory 2021 SP2 software to quantify the impact of PV integration on line losses, voltage profiles, harmonic distortion rates, short-circuit currents, and grid stability.
This paper is organized as follows.
Section 2 provides an overview of the key challenges and potential solutions related to the integration of PV plants into power grids.
Section 3 outlines the methodological approach adopted for this study, describing the western transmission network of the SNEL, with all necessary considerations for simulation, along with the associated theoretical formulations used in simulations.
Section 4 presents the simulation results, and
Section 5 discusses them, specifically examining the impact of this integration on line losses, voltage profiles, harmonic distortion rates, short-circuit currents at various network nodes, and overall grid stability.
Section 6 suggests recommendations to address the issues highlighted during the results discussion. Finally,
Section 7 concludes the paper and suggests future directions on the topic.
2. Literature Review
The rapid growth of solar technologies has driven a major energy transition, with PV module production increasing 13-fold in the past decade, 95% of modules being produced in Asia, and 80% in China, where the world’s largest PV plant is located, with a capacity of 5000 MW [
11,
12]. In 2022, PV systems prevented around 1399 million tons of CO
2 emissions, and accounted for approximately 14.4% of electricity production in Germany in 2023 [
13,
14,
15]. This diversification supports energy security in the renewable energy sector, with significant growth in solar-related employment projected by 2050 [
16,
17].
Large-scale PV integration poses technical challenges, mainly due to intermittent energy production. This variability, driven by weather, demands rapid grid adjustments, often relying on fossil fuel plants, potentially increasing emissions. [
18,
19]. Traditional grids are built for one-way power flow—medium-voltage (MV) to low-voltage (LV)—but excess PV production can reverse this, sending power from LV to MV networks. Such bidirectional power flow challenges grids designed for one-way flow, leading to feeder overloads, power losses, and overvoltages, especially with solar penetration above 30% [
20,
21]. This can overwhelm standard circuit breakers, raising fault current risks and potentially increasing fault magnitudes by around 7%, heightening system failure risks [
22].
High PV integration can cause Total Harmonic Distortion (THD) to reach up to 15%, well above the 5% limit recommended by the IEEE 519-2014 standards for LV networks [
23,
24]. In MV networks, 30–40% penetration can worsen distortions, degrading power quality [
25]. High-voltage (HV) networks can handle higher PV penetration, but THD levels above 5% harm grid reliability. Centralized PV at 20% caused flicker and voltage violations, while distributed PV avoided violations even at 50% penetration [
20,
26]. In addition, high PV penetration raises concerns about frequency regulation and rotor angle stability. Reduced synchronous generators complicate frequency control, with studies showing a 10% PV penetration requiring a 2.5% increase in frequency control, and 30% needing a 10% increase [
27,
28]. Frequency stability is notably impacted at 20% penetration, with significant deviations at 50%, highlighting the need for solutions like virtual inertia and demand-side management to ensure grid stability [
29].
Enhancing power quality in grid-connected PV systems requires innovative solutions like the Dynamic Voltage Restorer (DVR), which mitigates voltage sags and swells at the Point of Common Coupling (PCC) using multi-level inverters for precise regulation [
30]. Technologies such as On-Load Tap Changers (OLTCs) and Static Synchronous Compensators (STATCOMs) also stabilize voltage at up to 50% PV penetration [
22,
31,
32,
33]. Battery Energy Storage Systems (BESSs) further support grid integration by absorbing excess solar energy, aiding voltage regulation [
34,
35].
Frequency regulation and rotor angle stability are worsened by fewer synchronous generators in high PV penetration [
27]. Solutions like virtual inertia and demand-side management (DSM) help maintain stability [
1,
36,
37]. Addressing harmonics and equipment overloads is also crucial, necessitating advanced filters, inverters, and infrastructure upgrades to support increased renewable energy [
38,
39].
To date, most of the work focusing on the integration of PV systems into electrical grids focused on the case of developed countries with robust power infrastructure. Weak electrical networks, particularly in LDCs and developing countries, are characterized by aging grid infrastructure, inefficient network management, lack of qualified staff, obsolete control systems, low inertia, low short-circuit ratios (SCRs), high impedance values, and inadequate reactive power support [
40]. In addition, technical and non-technical losses—due, among other things, to fraud and illegal connections—are high, exceeding 15% of the energy produced [
41]. These characteristics pose critical challenges for the integration of renewable energy sources into these grids.
Few studies have explored the impact of PV integration in such fragile networks, where technical and structural challenges are much more pronounced. In [
42], the application of centralized and distributed large-scale solar PV (LSPV) systems for the improvement of voltage stability in weak national grids was investigated. The study simulated the behavior of the northern Nigerian power grid when using LSPV to enhance voltage stability and as an effective alternative to the aged shut reactors being used in the grid under study to mitigate overvoltage issues. The findings indicate that in the case of weak national grids, distributed PV systems help mitigate voltage instability while centralized PV installations offer superior reactive power support. However, the study lacked dynamic analysis, harmonic assessment, and mitigation strategies.
Authors in [
43] investigated the frequency stability of the simulated Tunisian grid with moderate PV integration (10–20%) using Power System Simulator for Engineering (PSS/E), and confirmed the role of production group reserves as a crucial solution for maintaining frequency within reasonable limits. However, harmonic distortions and SCRs, which are critical for understanding the implications of integrating renewable energy into fragile networks, were not considered in the study.
In [
44], the optimum location and hosting capacity of distributed solar PV was assessed in the southern interconnected grid of Cameroon. The study primarily focused on static analysis, such as power losses and voltage profiles, and included a transient stability analysis only to validate the results of static analysis. Results revealed that the grid remained stable at 30% penetration level. Rotor angle and frequency oscillations stabilized after a disturbance, but showed critical instability at an attempt of 50% penetration, where oscillations became uncontrollable. Therefore, the limitation of the study to 30% penetration level does not allow an evaluation of technical challenges at higher levels. Additionally, the transient stability analysis did not deeply explore the long-term dynamic impact of PV penetration into the grid.
Addressing the above-mentioned gaps is essential for developing effective strategies for PV integration into weak grids. This study aims to fill these gaps by assessing the impact of PV integration into the electrical grid of the DRC, which is characterized by a fragile infrastructure and faces the same challenges as other LDCs and developing countries. The main contributions of this study include a detailed analysis of power losses, grid stability, and harmonic distortions at various levels of PV penetration, as well as practical recommendations for enhancing grid resilience. By combining insights from the related studies, a more comprehensive framework is established in this work to enhance the resilience and performance of electrical networks in LDCs and developing countries.
3. Methodology
3.1. Study Framework
This study focuses on a selection of strategic network nodes chosen based on their importance in energy transit to major consumption centers and their voltage levels. This methodology enables the observation of PV system integration effects on these critical nodes, which are most likely to be influenced by this energy transition.
Our analysis begins with the establishment of a baseline scenario without PV integration, assuming that all generators in the network are operational and functioning at 90% of their installed capacity, with one generator designated as the reference node at the Inga 2 power station. This scenario is essential to determine acceptable PV penetration levels without compromising grid stability. It serves as a reference point to evaluate the impacts of PV system integration by providing a clear comparison of network performance before and after the addition of solar PV generation.
Subsequent scenarios involve the integration of PV systems, with simulations of various penetration levels, while maintaining constant load conditions and applying faults at the selected nodes. These simulations enable the observation of the direct effects of solar generation on network dynamics. This approach evaluates the interaction of PV system integration with load variations and identifies its impacts on network performance.
Simulation results are thoroughly analyzed to assess the overall impact of PV power plant integration. Key aspects evaluated include voltage profiles, power losses, short-circuit currents, frequency stability, rotor angle stability, and harmonic distortion levels. This detailed analysis provides valuable insights into the maximum PV integration capacity of the network and informs strategic recommendations to optimize the use of solar resources within similar transmission networks for future integration projects.
3.2. Overview of the Network Under Study
The current Western Transmission Network of SNEL comprises a 220 kV, 132 kV, and 70 kV system with 116 nodes, including 4 generator nodes, and 83 transmission lines. There is a 400 kV line operating at 220 kV, a 500 kV direct current line of 1774 km connected to the Southern Transmission Network, and an interconnection with the Republic of Congo at 220 kV. Data provided by SNEL, regarding the transmission expansion plan, indicate that the total gross installed power generation capacity of this network is approximately 2012 MW, supported by a generation fleet comprising 28 hydroelectric units [
45], as shown in
Figure 2.
Issues within the Congolese power grid include outdated and inefficient equipment, low load capacity, and insufficient generation. Due to the long 220 kV transmission lines built to supply the northwestern regions, overvoltage problems occur at one of the network nodes (Bandundu Substation). To address these overvoltage issues, shunt reactors are used to absorb excess reactive power, which is the root cause of the problem.
The injection of power from a PV solar plant at the 220 kV Kimwenza (KMZ) substation, the largest injection substation supporting the power demand of Kinshasa city and surroundings, is justified by several technical and strategic reasons. First, integrating PV power at this voltage level minimizes transmission losses as higher voltages reduce line losses due to resistance, facilitating efficient long-distance power transmission. Solar generation can support industrial activity during peak demand, which typically occurs during the day, while conventional power plants can take over at night when demand decreases. This complementarity between renewable and conventional energy sources contributes to a more stable and efficient management of the electrical grid, ensuring a continuous and reliable power supply.
Additionally, injecting PV power at KMZ could promote regional economic development by creating a favorable investment environment. By securing the electricity supply, local industries can be encouraged to grow, generating jobs and increasing wealth in the city’s periphery. Finally, this approach aligns with a broader strategy of sustainable development and renewable energy promotion, in line with the objectives of SNEL and local authorities, thus strengthening the resilience of the electrical system of Kinshasa to future challenges.
3.3. PV Penetration Level
The level of solar power penetration
is the ratio of generated active power of the solar power plant to the total active power generated by the grid. It is calculated as follows [
46]:
where
is the PV penetration rate,
is the total active power generated by the PV system, and
is the total active power produced by synchronous generators.
The definition of PV penetration used in this work is based on the available generation in the 2012 MW baseline scenario. Although other methods exist to define PV penetration levels, such as those based on the peak load of the system or the amount of energy supplied [
47], these approaches are not adopted in this study. Based on current practice in the literature [
20,
31,
48,
49], we have chosen to evaluate the network under study for PV penetration levels of 10%, 20%, 30%, 40%, and 50%. The equivalent active power for each PV integration scenario is shown in
Table 1.
Available PV generation is chosen as the basis for defining penetration levels because it directly reflects the solar energy integration capacity into the grid, thus enabling the evaluation of the actual impact of different PV penetration levels on network parameters, such as losses, voltage profiles, and stability. On the other hand, defining penetration levels based on peak load may be more relevant for analyzing the impact on grid management and supply–demand balance. This method allows for studying how solar energy can contribute to reducing peak consumption [
48].
The primary design of the system will be based on the generated power. The production voltage is 0.8 kV and will be stepped up to 220 kV. This voltage escalation is performed in two stages: the first stage raises the voltage from 0.8 kV to 15 kV using distribution transformers, while the second stage increases the voltage from 15 kV to 220 kV through power transformers.
3.4. Short-Circuit Ratio (SCR)
The SCR is a key indicator for evaluating the robustness of an electrical system, particularly when integrating renewable energy sources. It is defined as the ratio between the available short-circuit capacity at the connection point and the nominal capacity of wind or PV installations. The SCR is calculated using the following expression [
49]:
where
SSC is the is apparent short-circuit power at the interconnection point and
PN is the nominal power of the power electronic equipment, expressed in MW or MVA.
According to IEEE Std 1204-1997 [
50], an arbitrary point in an AC system is classified as weak if its SCR is between 2 and 3. An AC system is categorized as very weak if the SCR value is less than 2. Conversely, if the SCR exceeds 3, the system is considered strong. This highlights the importance of a thorough assessment of the SCR to ensure the stability and reliability of renewable energy systems.
3.5. Load Flow Analysis
The load flow analysis aims to evaluate the operational efficiency and performance of the electrical system under specific production conditions, focusing on power flow variations around the interconnection point before and after integrating a PV plant. This study targets system conditions during peak daytime loads when PV generation is at its maximum. We conduct simulations using DIgSILENT PowerFactory 2021 SP2, which is a powerful tool for assessing system performance, particularly with renewable energy sources [
2].
Load flow analysis results are presented for distinct scenarios: without PV interconnection and with penetration levels of 10%, 20%, 30%, 40%, and 50%. Each scenario evaluates the performance of the network under peak load conditions, offering insights into the effects of incremental PV integration on the power system while ensuring that the voltage level remains within the following range [
51]:
3.6. Short-Circuit Level Analysis
Short-circuit analysis is of the utmost importance in the planning, construction, and development of electrical systems. It provides essential data for configuring protection relays and selecting circuit breakers (CBs). Circuit breakers must be chosen not only based on their normal operating current but also by considering the peak current that may briefly occur during a fault [
52,
53]. This study assesses the impact of integrating the PV plant on short-circuit levels at substations near the interconnection point, ensuring that the capacity limits of existing circuit breakers are not exceeded. The substations considered include the Dispersion Substations of Inga (PDI), Kwilu (KWL), Lingwala (LGL), Liminga (LMG), and Maluku (MLK), under peak daytime load conditions.
Using the IEC 60909 [
54] method, particularly for three-phase short-circuit faults, we calculate the initial short-circuit current
Ik”, initial short-circuit power
Sk”, peak short-circuit current
ip, breaking current
Ib, short-circuit breaking power
Sb, steady-state short-circuit current
Ik, and equivalent thermal short-circuit current
Itℎ [
52,
55].
3.7. Harmonic Distorsion Analysis
The integration of PV systems into the grid impacts harmonic levels, as these systems contain harmonic sources such as inverters. Therefore, a harmonic analysis will be conducted at the point of connection at the 220 kV KMZ substation to evaluate the Total Harmonic Distortion of Voltage (THDv) and compare the THD values obtained before and after the injection of PV power at each PV penetration level. The results will be assessed against the recommended voltage distortion limits as specified in IEC 61000-3-6:2008 [
56].
Table 2 presents the voltage THD limits and individual voltage harmonics specified in the IEC 61000-3-6:2008 standard for HV and extra-high-voltage (EHV) transmission lines. For the 220 kV point of connection in the network under study, the voltage THD is limited to 3%.
3.8. Transcient Grid Stability Analysis
The integration of a PV plant into the grid raises critical concerns about transient grid stability, especially during sudden disconnections. For instance, if the PV plant disconnects due to a fault on the interconnection line with the 220 kV substation, solar power generation can drop abruptly, significantly impacting the behavior of the system.
Unlike conventional synchronous generators, which provide essential rotational inertia to stabilize the grid, PV systems lack inertia due to their absence of moving parts [
35]. This lack of inertia reduces the overall system inertia as PV penetration increases, potentially compromising transient stability, particularly during severe faults, causing large-scale PV disconnections [
57].
This study will analyze the impacts of two scenarios: the sudden disconnection of the PV plant caused by a short-circuit on the interconnection line with the 220 kV substation, and a 30% load increase in the grid followed by the disconnection of the PV Plant. Key parameters for assessing transient stability include system frequency, voltage levels at the 220 kV substation, and the rotor angle of the reference synchronous machine. Mitigation measures will be proposed to address any stability violations, ensuring compliance with grid code requirements.
Regarding transient stability analysis, the Congolese Grid Code specifies that system frequency deviations must remain within the range of 49.5 Hz ≤
f ≤ 50.5 Hz, where
f denotes the system frequency [
51]. This range is defined as suitable for continuous operation, ensuring stable grid performance. Frequency variations are influenced by the balance between the power output of generators and load demand. Consequently, maintaining frequency within this specified range requires precise regulation of power generation and consumption.
4. Simulation Results
The impact of PV penetration on active power losses (in MW) and on reactive power losses (in MVAR) is shown in
Figure 3 and
Figure 4, respectively, for penetration levels ranging from 0% to 50%, with a tick interval of 5% penetration, to better observe the evolution of losses.
The impact of increasing PV penetration levels from 0% to 50% on the voltage profile of the KMZ substation, and the five substations directly connected to it (PDI, KWL, LGL, LMG, and MLK), is presented in
Figure 5.
Table 3 presents the short-circuit current levels at the six substations under study before and after all levels of PV integration, and
Table 4 shows the SCR for different values of PV penetration levels at the KMZ substation.
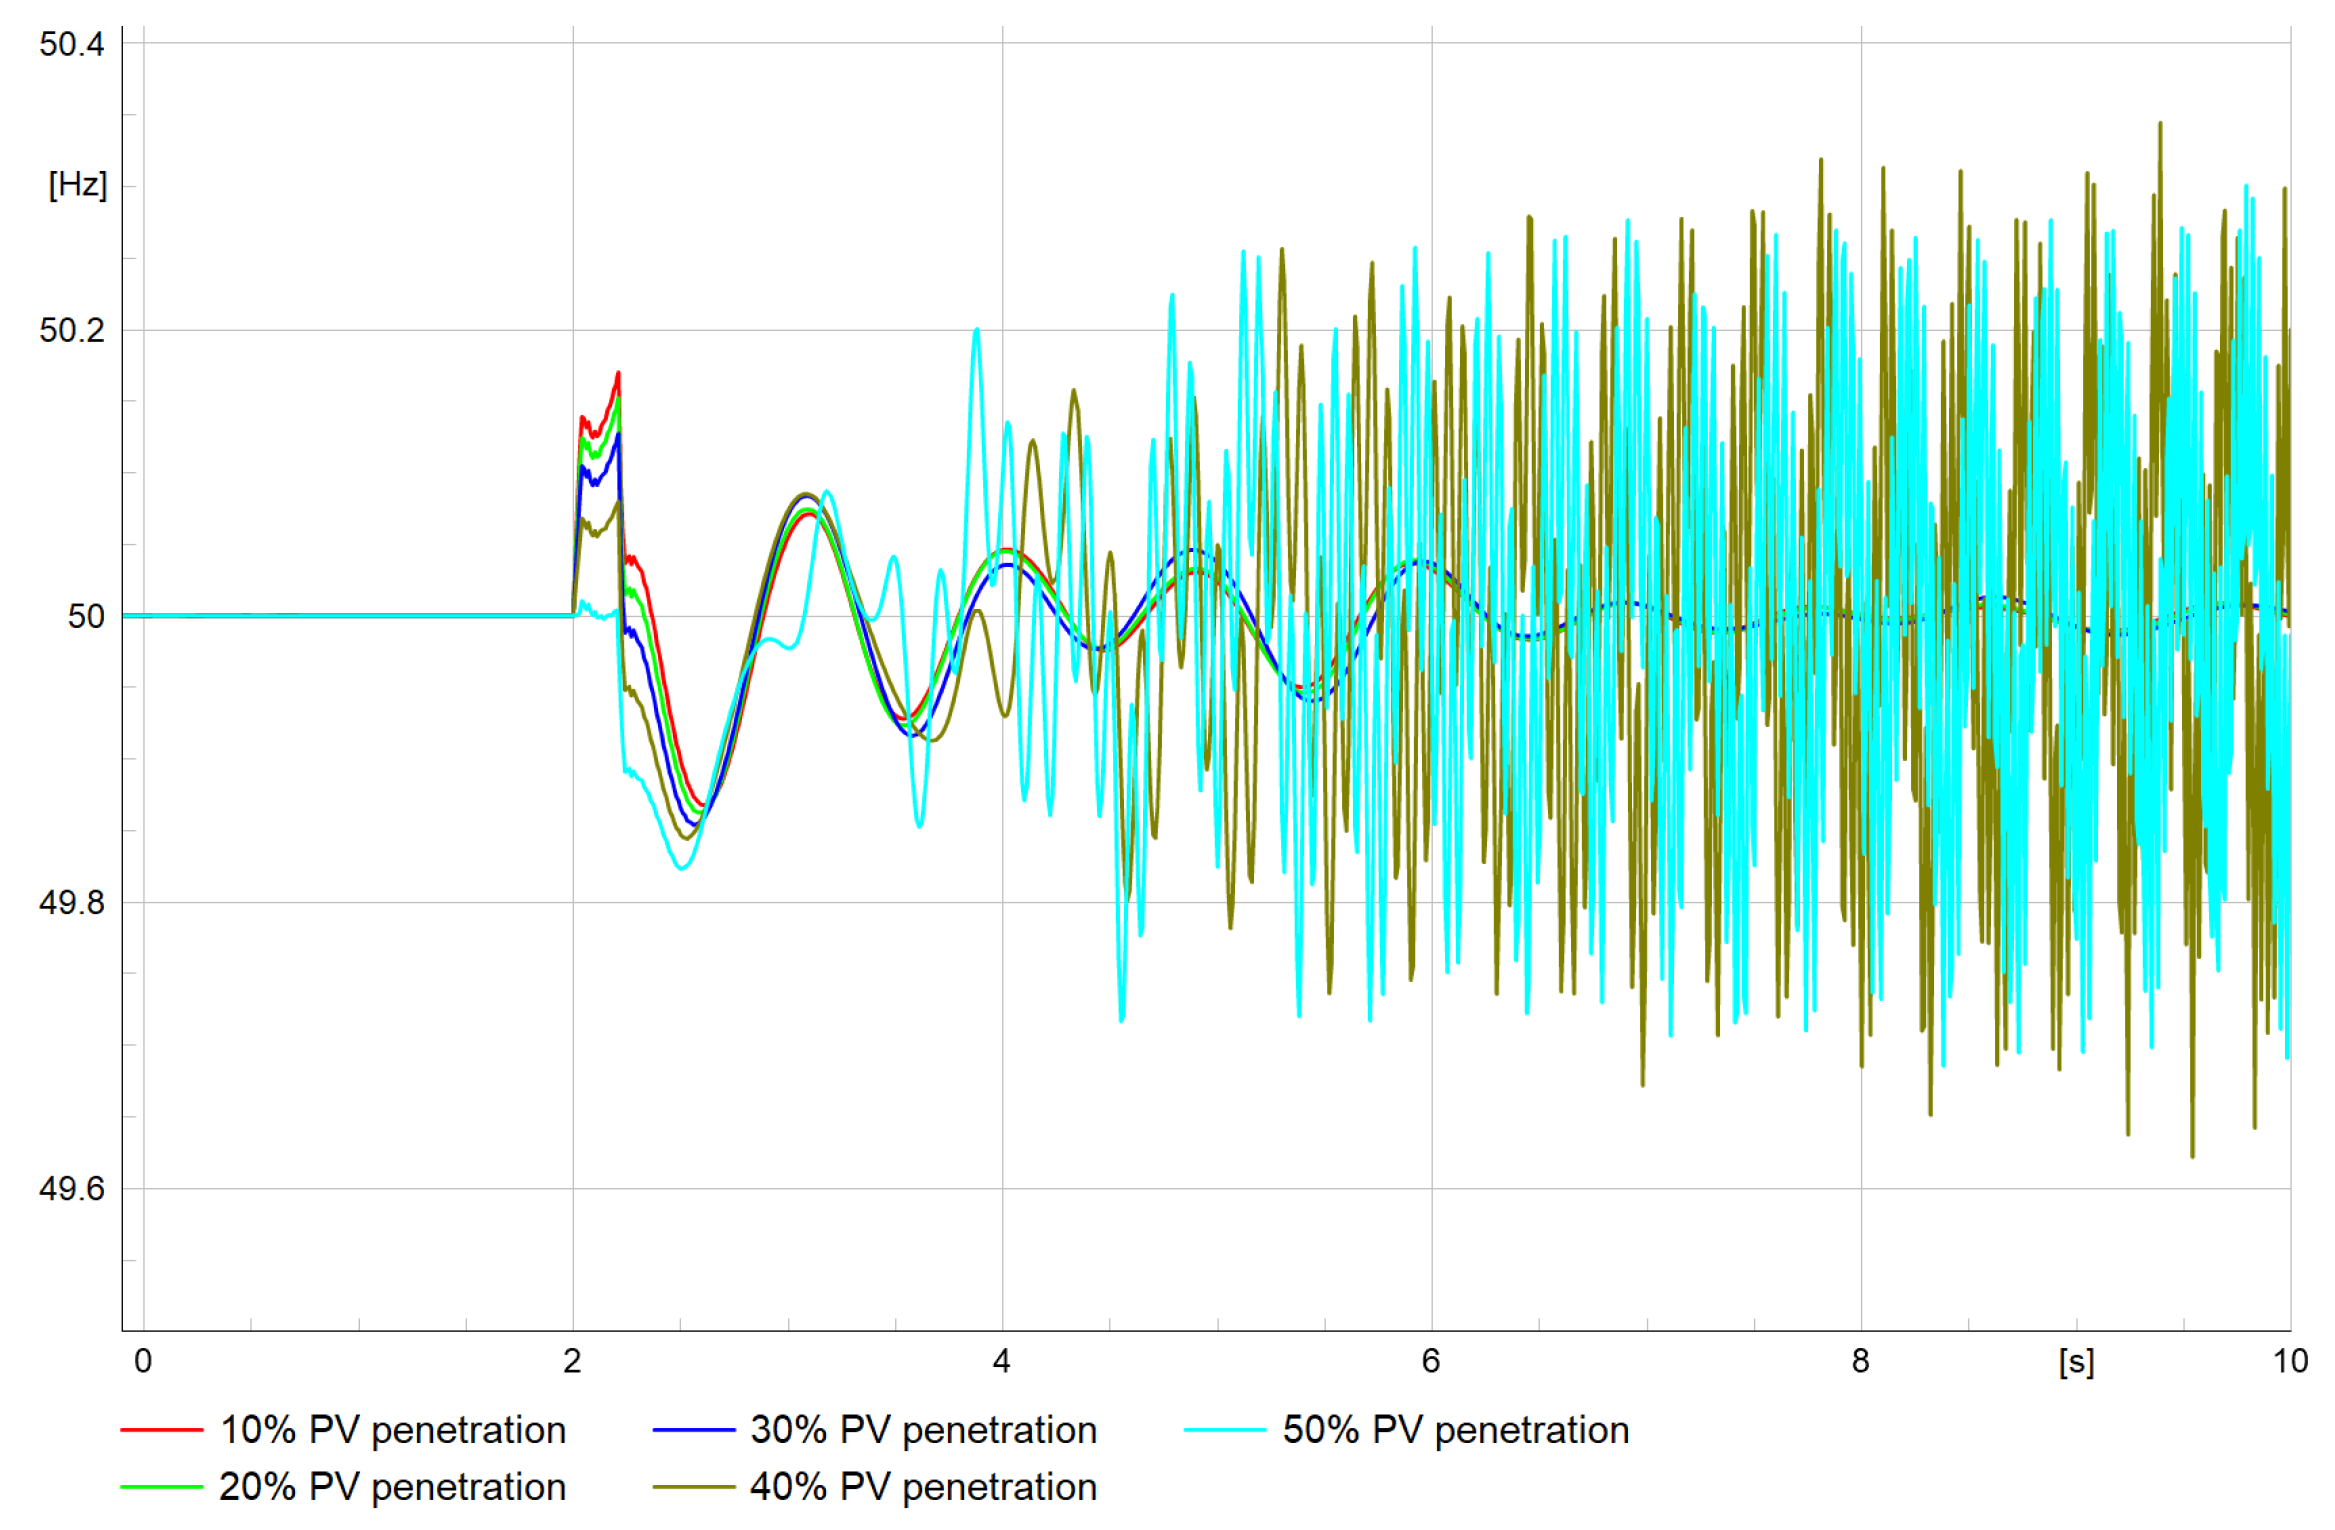
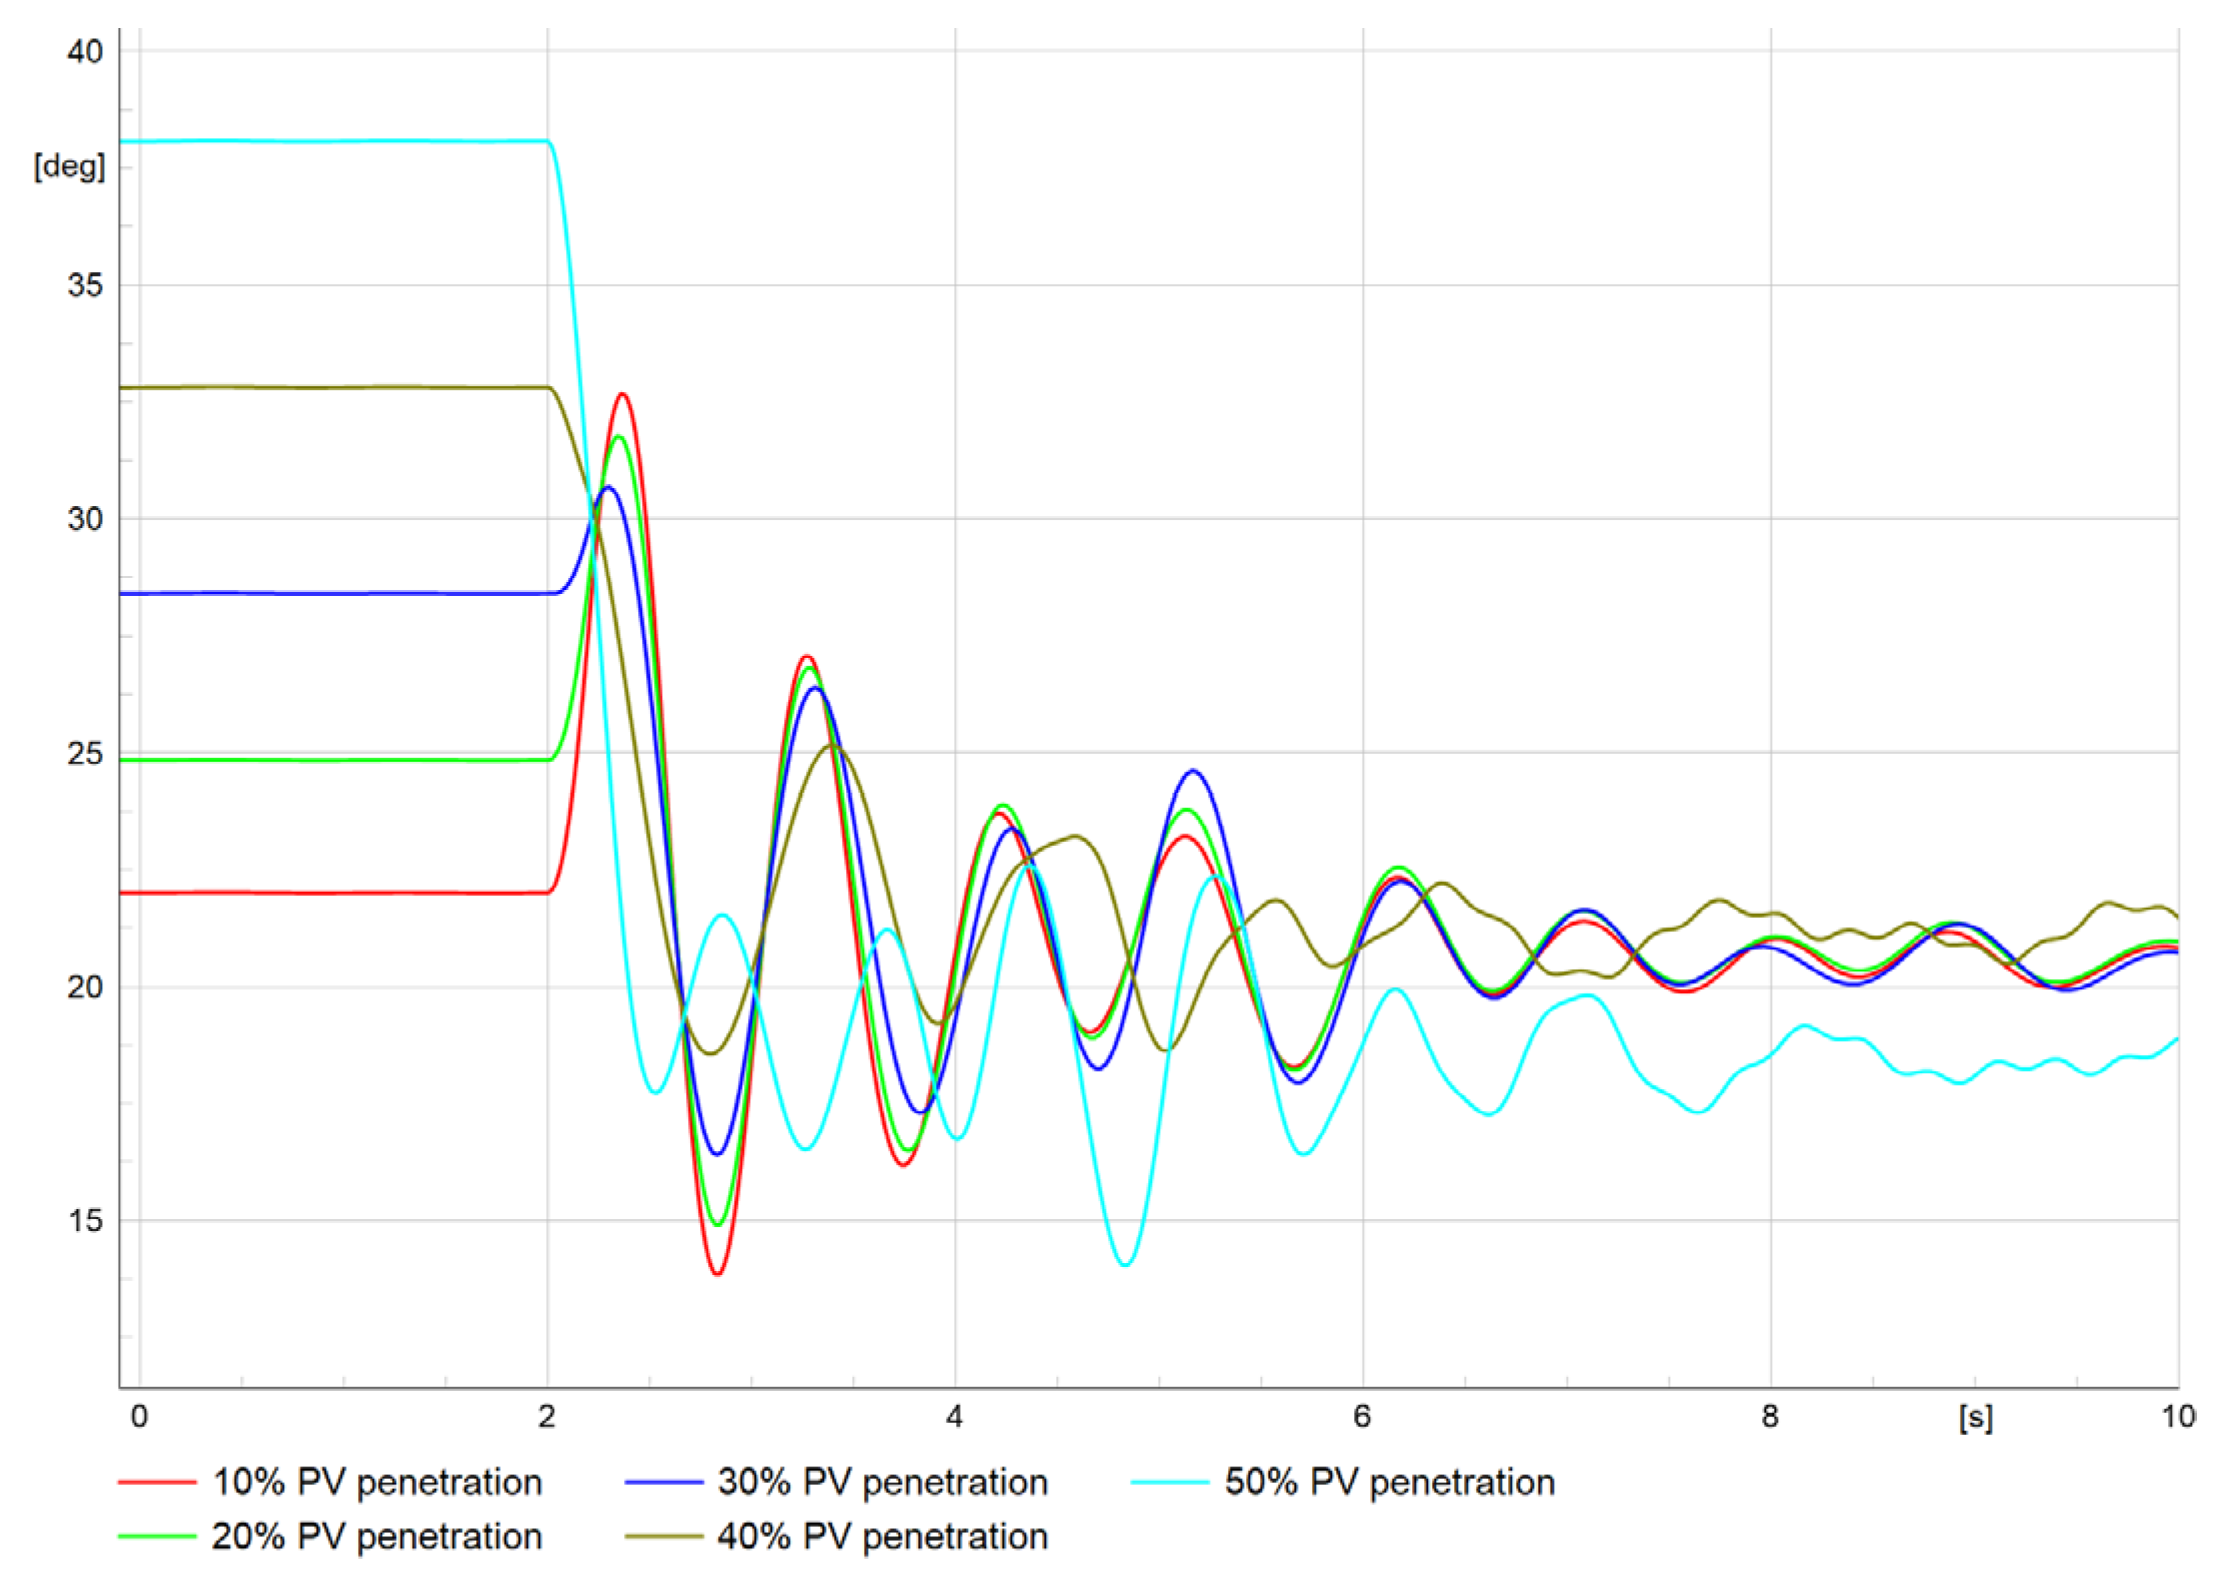
The impact of PV penetration on grid stability after a sudden disconnection due to short-circuit perturbation on the interconnection line between the PV plant and the 220 kV KMZ substation is presented in
Figure 16 on the voltage, in
Figure 17 on the frequency, and in
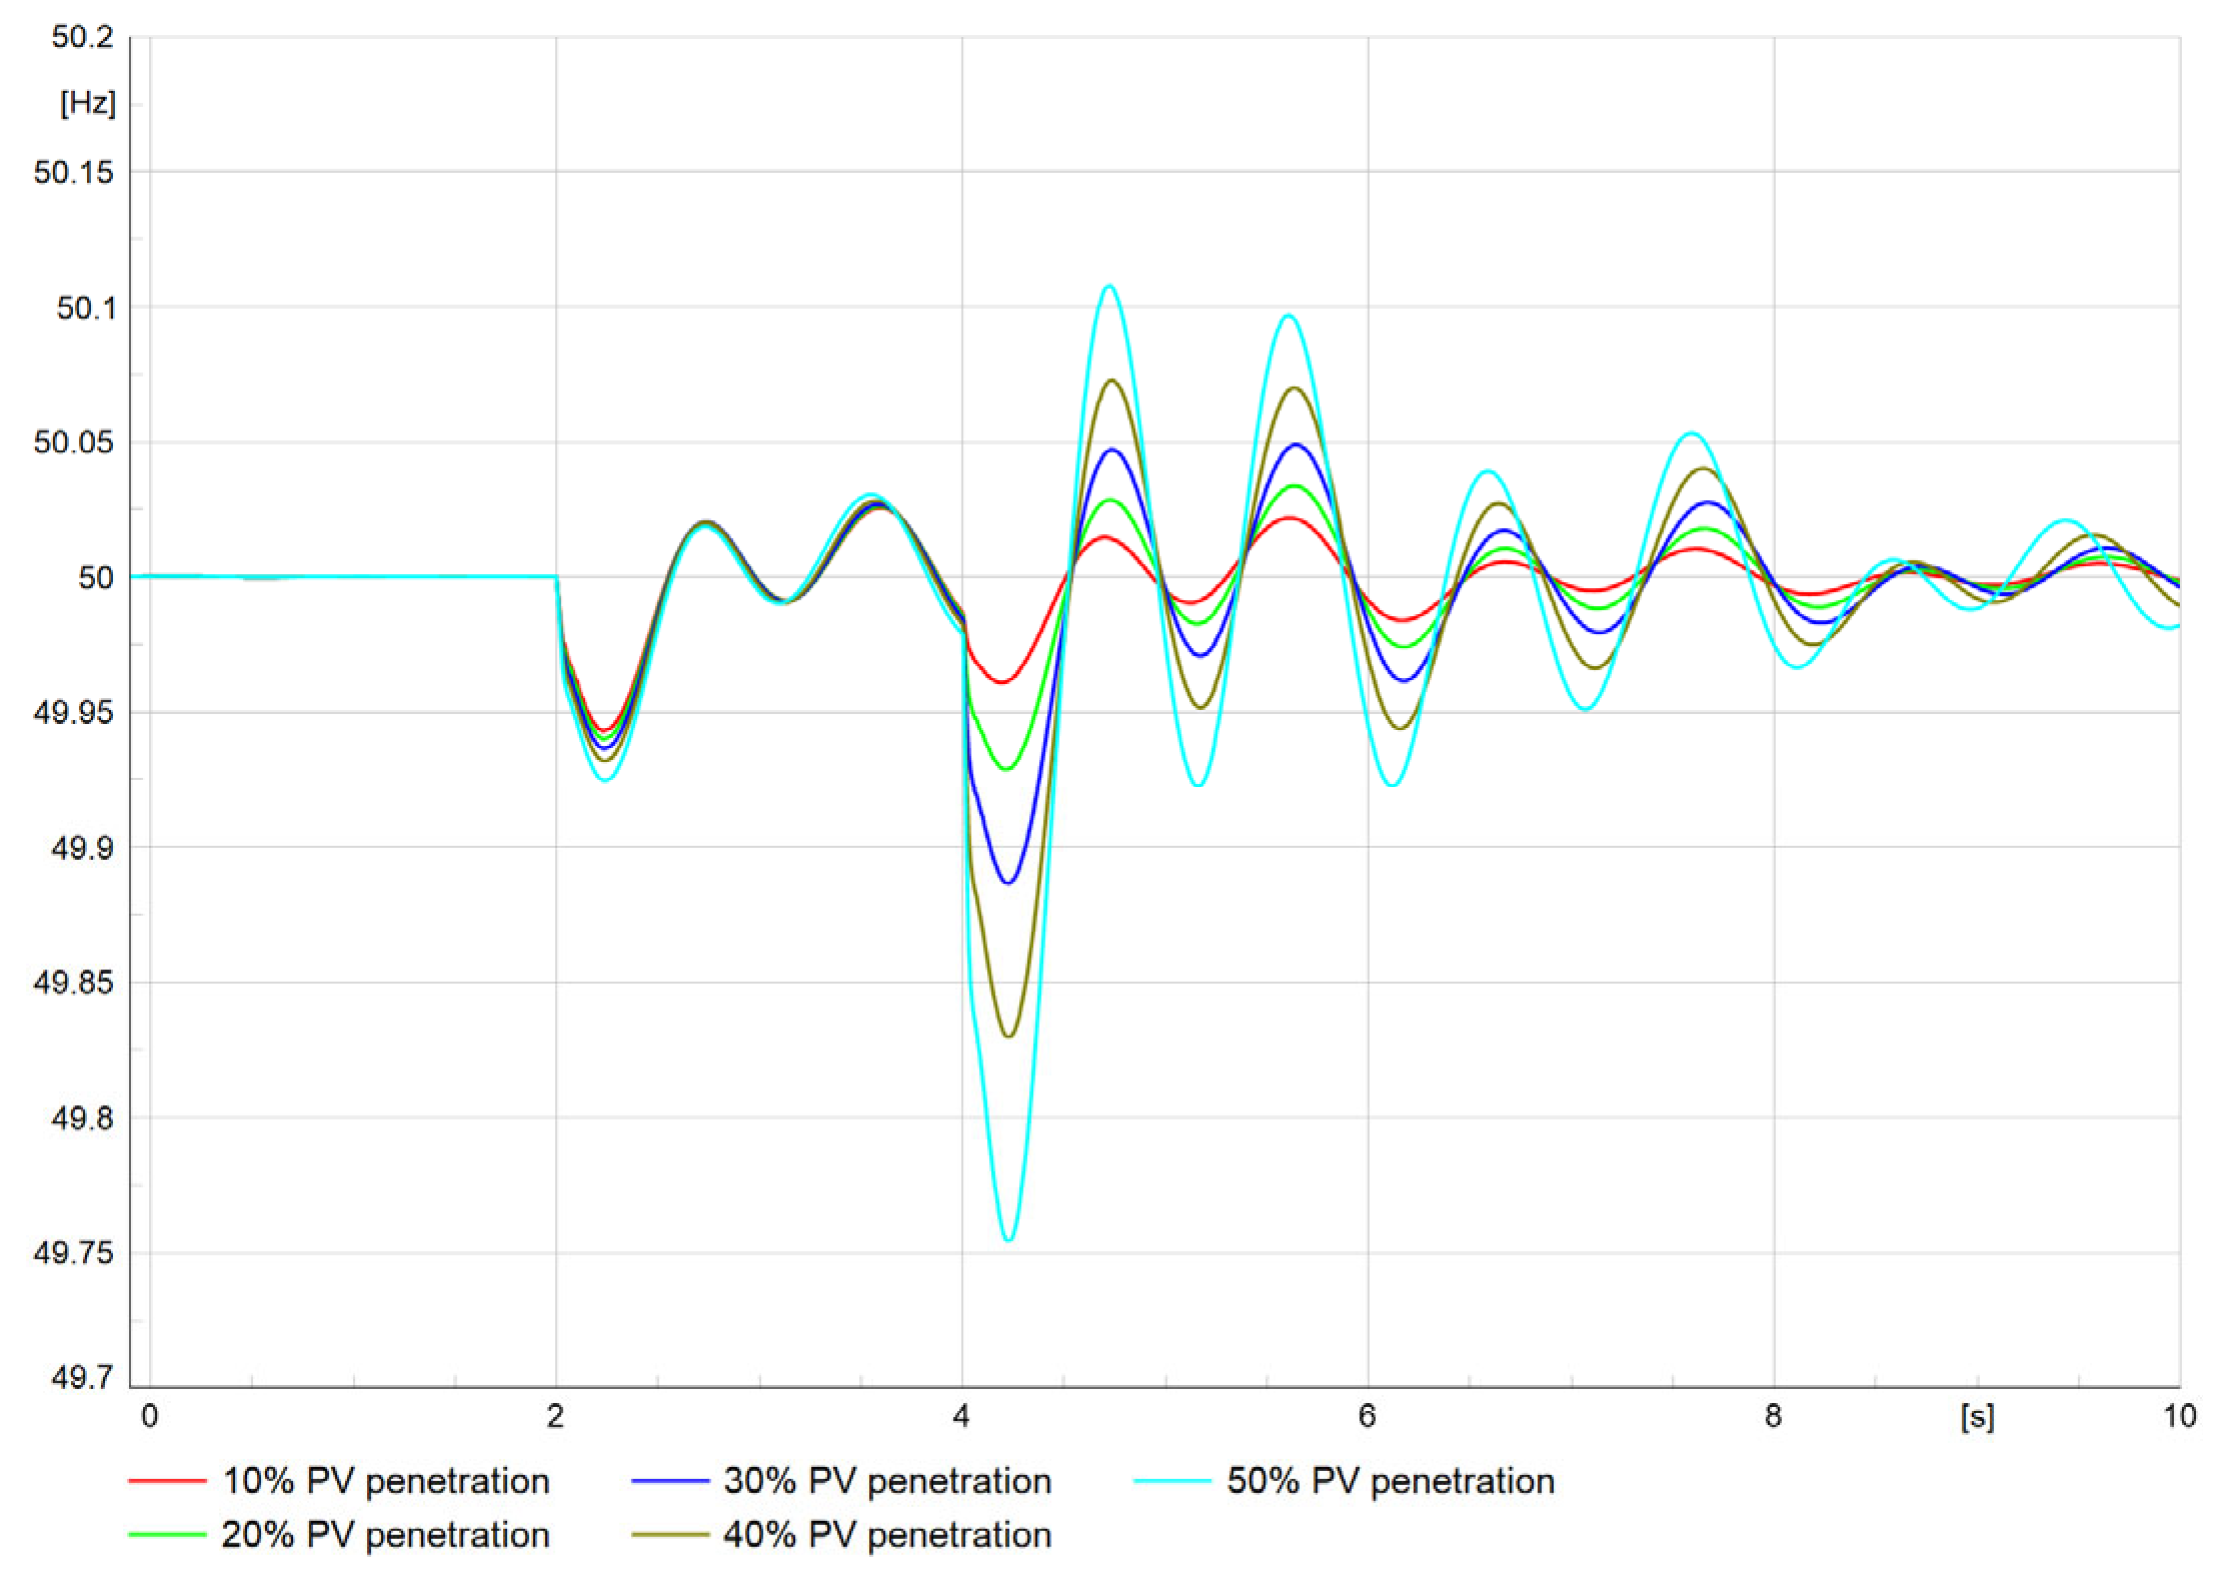
Figure 18 on the rotor angle. Grid stability after a 30% load increase at 2 s followed by the disconnection of the PV plant at 4 s, is shown in
Figure 19 for the voltage, in
Figure 20 for the frequency, and in
Figure 21 for the rotor angle.
5. Discussion
5.1. Impact of PV Penetration on Active and Reactive Power Losses
From
Figure 3 and
Figure 4, we observe that both active and reactive power losses increase as PV penetration rises. The analysis of active power losses in the network, as a function of PV penetration levels, reveals contrasting dynamics. At low to moderate penetration levels (10% to 30%), losses initially decrease due to the ability of PV systems to supply energy locally, reducing reliance on conventional generators and minimizing transmission losses over long distances [
58]. A PV penetration level of 10% reduces active losses by nearly 20%, while a 20% penetration achieves a 25% reduction. At 30%, active power losses continue to decrease, albeit more moderately, reaching a maximum reduction of 5%. This phase demonstrates that PV integration enhances overall network efficiency, as indicated by moderate increases in active power losses. This improvement is attributed to better energy flow redistribution and optimized local supply facilitated by PV generation.
However, beyond 30% penetration, a reverse trend emerges. Active power losses increase rapidly, exceeding 100% of baseline level at 0% PV penetration, reflecting growing technical challenges such as reverse power flows and line overloads. When the level of PV penetration exceeds 30%, the total power injected into the grid (synchronous generators and PV injection) exceeds the absorption capacity of the grid, creating a reverse power flow from load to generation, i.e., from distribution networks to transmission networks. Before the reference synchronous generator switches to motor mode, the other generators adjust their output in an attempt to balance the grid, but the excess PV power persists. As a result, the reference synchronous generator ends up operating in motor mode, absorbing active power to avoid overproduction and simultaneously producing reactive power to stabilize the voltage. Power lines become overloaded, as they have to carry both the excess PV generation absorbed by the reference synchronous generator and the power produced by the other synchronous generators into the grid, resulting in increased active and reactive losses.
Regarding reactive power losses, significant reductions are observed at low PV penetration levels. At 10%, they decrease by 40%, and at 20%, the reduction reaches 45%, reflecting improved grid capacity to supply and regulate reactive power locally. However, from 30% penetration onwards, a gradual increase in reactive power losses is observed, reaching 11%, marking a shift in trend and an increased demand for reactive compensation, reaching critical levels at 40% and 50% penetration.
The rise in active power losses highlights the necessity for improved energy resource management to reduce losses and sustain network efficiency as PV penetration grows. It also reveals the limitations of PV systems, which struggle to deliver adequate reactive power compensation at higher penetration levels [
31,
59].
5.2. Impact of PV Penetration on Voltage Profile
Figure 5 depicts the voltage profile at the point of interconnection before and after PV integration. The results demonstrate that PV generation integration significantly impacts voltage profiles within the network. At low to moderate penetration levels (10% to 30%), a noticeable improvement in voltage profiles is observed. This improvement arises from the ability of PV systems to locally supply reactive power, thereby reducing the load on transmission lines and stabilizing voltages in remote areas [
58]. By injecting reactive power, PV systems help compensate for voltage drops that may occur due to the distance between generation and consumption points [
31]. Such moderate integration enhances voltage quality while complying with grid code requirements, reflecting effective management of renewable energy resources within the network [
18].
However, at higher penetration levels (40% to 50%), challenges emerge as voltages decrease significantly. These variations are primarily attributed to overloading effects and reverse power flows in certain sections of the network [
29]. Although voltages generally remain within an acceptable range, these findings emphasize the need for tailored solutions, such as smart inverters and regulation systems, to mitigate overvoltages in some cases and maintain network efficiency [
25]. These observations highlight the growing difficulty for the grid to sustain adequate voltage levels with the increase in PV penetration.
5.3. Impact of PV Penetration on Short-Circuit Current Levels
Short-circuit simulation results using DIgSILENT PowerFactory 2021 SP2 provide detailed insights into the fault level contributions of PV systems. This analysis indicates that three-phase short-circuit current levels, at substations connected to the point of interconnection, increase by 21% across all PV penetration levels (10%, 20%, 30%, 40%, and 50%) compared to baseline values before PV integration, as shown in
Table 3.
Simulation results highlight the impact of PV systems on short-circuit current levels in the grid, with a specific focus on substations connected to points of interconnection. As PV penetration increases (10%, 20%, 30%, 40%, and 50%), initial short-circuit currents (Ik′′), peak currents (ip), and steady-state currents (Ib) experience significant growth. For instance, at the PDI substation, breaking current rises from 21.38 kA before PV integration to 36.46 kA after PV interconnection, representing a 63% increase. Similarly, the KWL substation experiences an increase in breaking current from 8.84 kA to 11.07 kA, a 25% rise. These changes reflect the growing contributions of PV systems, particularly in substations located near PV generators.
The short-circuit current increases after 10% PV integration, but remains constant beyond this threshold, regardless of additional PV penetration. This limitation is attributed to the design of power grids, which are built to handle high short-circuit currents, and to PV inverters equipped with integrated mechanisms to limit short-circuit currents and protect electronic components [
60]. However, the bidirectional power flows between PV plants and substations, combined with the increase in fault currents, impose new requirements on protection systems to effectively isolate faults from both conventional and PV sources [
61]. The findings emphasize the importance of adaptive protection strategies, particularly for substations like PDI and KWL, where the impacts are most significant.
Increases in short-circuit currents necessitate upgrades to protection systems, ensuring they can isolate faults efficiently without compromising the safety of the grid. This may involve upgrading protection relays and fault detection devices to handle higher current levels. Furthermore, an adaptive protection strategy, tailored to the specific characteristics of the most affected substations, could be implemented to ensure the safe and efficient integration of PV systems while maintaining grid reliability.
5.4. Impact of PV Penetration on Short-Circuit Ratio
Simulation results reveal a significant decrease in the SCR as PV penetration levels increase, as shown in
Table 4. With an initial short-circuit power of 2926 MVA before PV integration, the SCR decreases from 14.5 at a 10% penetration level to 1.62 at a 50% penetration level. This decline indicates that as more PV systems replace synchronous generators, the grid’s stiffness diminishes due to the reduction in short-circuit power contributions from conventional generators. The loss of robust short-circuit power impacts the ability of the grid to manage fault currents, increasing the risk of voltage instability and harmonic distortion [
49].
The reduced SCR particularly affects substations near the point of PV interconnection. For instance, the peak fault current at the KMZ substation rises by 21% across all penetration levels, reflecting the growing contributions of PV inverters to fault levels. While PV inverters include current-limiting mechanisms, their bidirectional power flow capability introduces complexity to protection schemes. The findings emphasize that the increasing penetration of PV necessitates upgrades to protection devices to effectively isolate faults and avoid cascading failures.
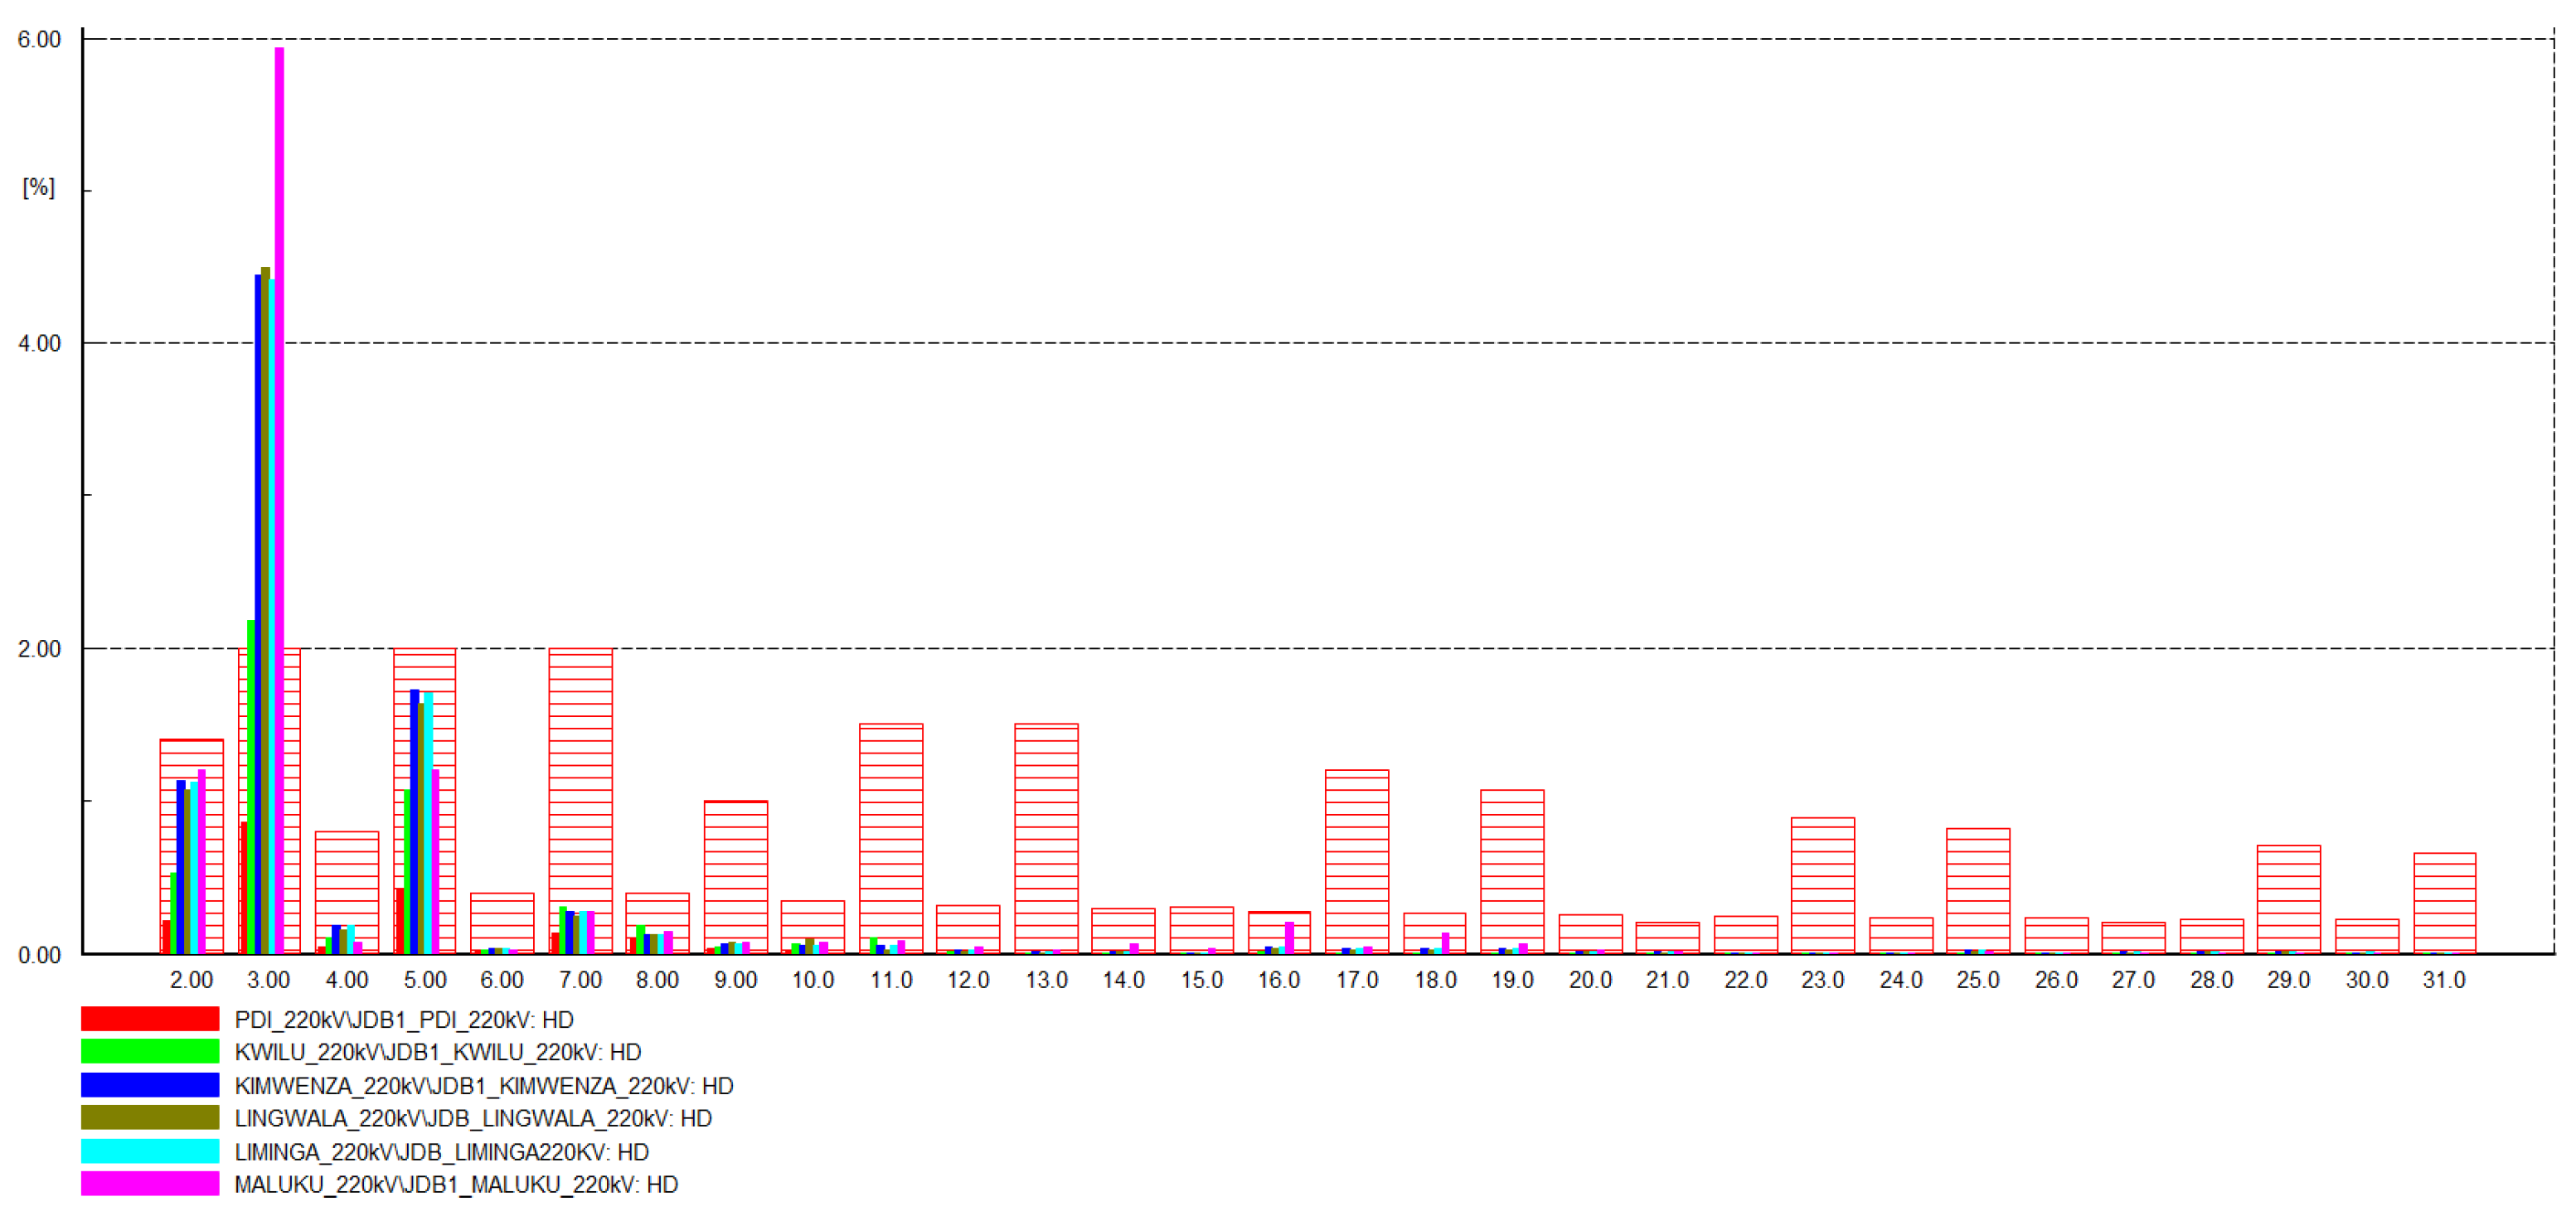
5.5. Impact of PV Penetration on Harmonic Distortion Levels
The analysis of harmonic distortion during PV integration into the grid at the 220 kV KMZ substation reveals significant variations in relation to solar energy penetration levels. The scenarios studied include penetration levels of 10%, 20%, 30%, 40%, and 50%.
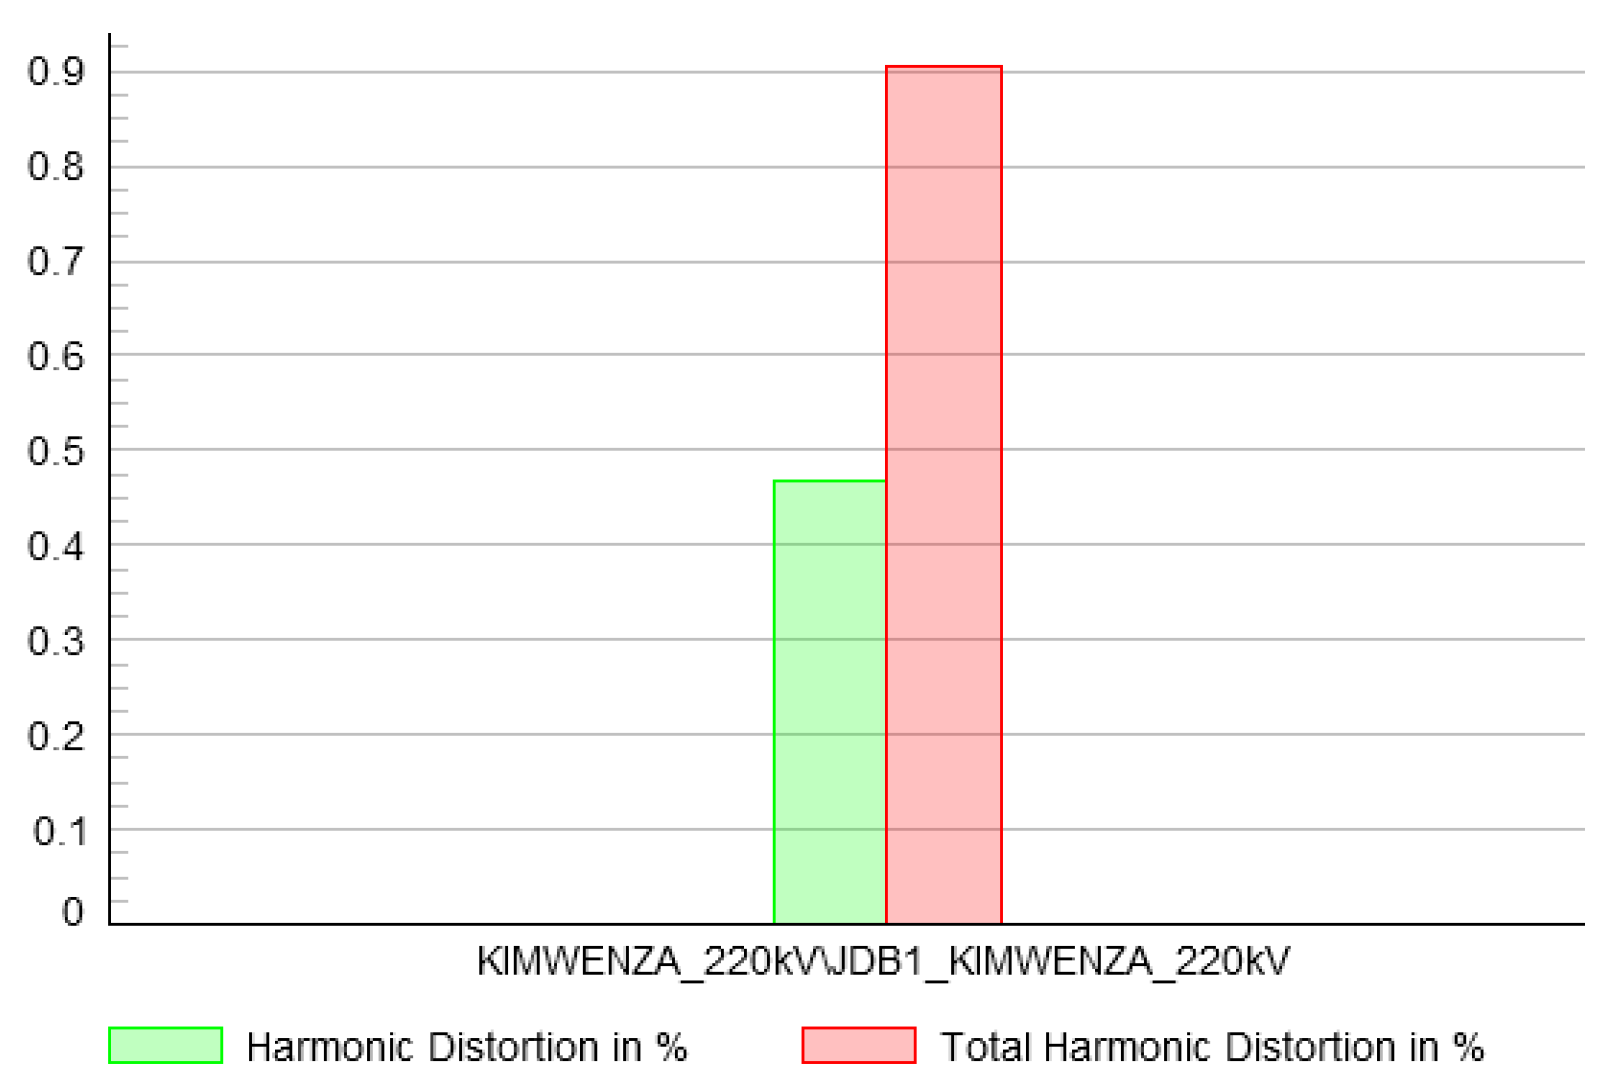
At 10% penetration level, harmonic distortion values are relatively low, with 0.5% harmonic distortion and 0.9% THD, as shown in
Figure 6 and
Figure 7. These results indicate that integrating the PV plant at this level does not significantly impact power quality. The observed values remain well below the recommended limits set by power quality standards, suggesting that the grid can accommodate this level of renewable energy without compromising stability or equipment performance.
With 20% penetration level, harmonic distortion slightly increases to 0.8%, and the THD reaches 1.9%, as illustrated in
Figure 8 and
Figure 9. Although these values remain within the acceptable range, they highlight an upward trend that could indicate more complex interactions between PV inverters and other grid equipment. Continuous monitoring of these levels is essential to prevent potential negative impacts on power quality, particularly for sensitive equipment that might be affected by fluctuations.
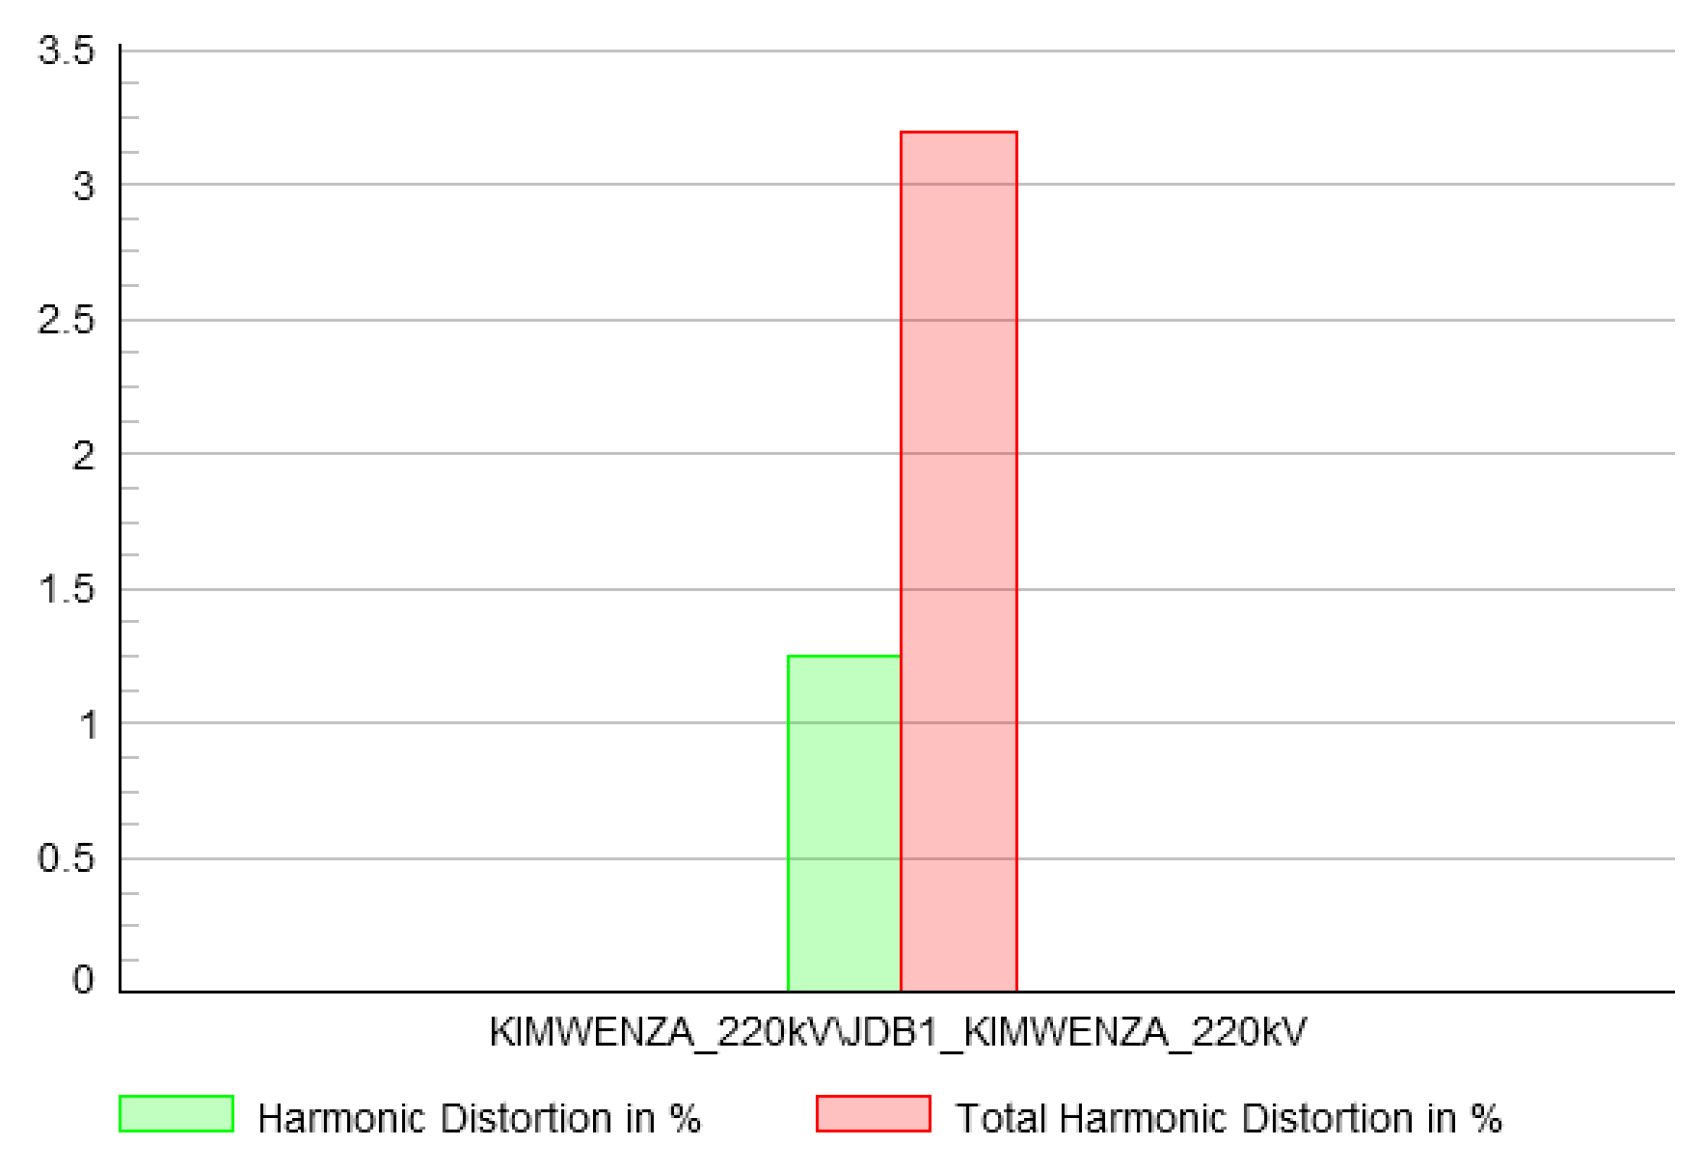
At 30% penetration, harmonic distortion values show a more pronounced increase, reaching 1.3% and a THD of 3.2%, as shown in
Figure 10 and
Figure 11. This level of distortion begins to pose power quality issues, exceeding the IEC 61000-3-6 recommendations for THD. Simulations indicate that PV inverters contribute significantly to the increase in harmonics within the grid, potentially affecting the operation of electrical equipment, especially those sensitive to power quality variations. At this stage, harmonic management measures may be required to ensure compliance with the standard.
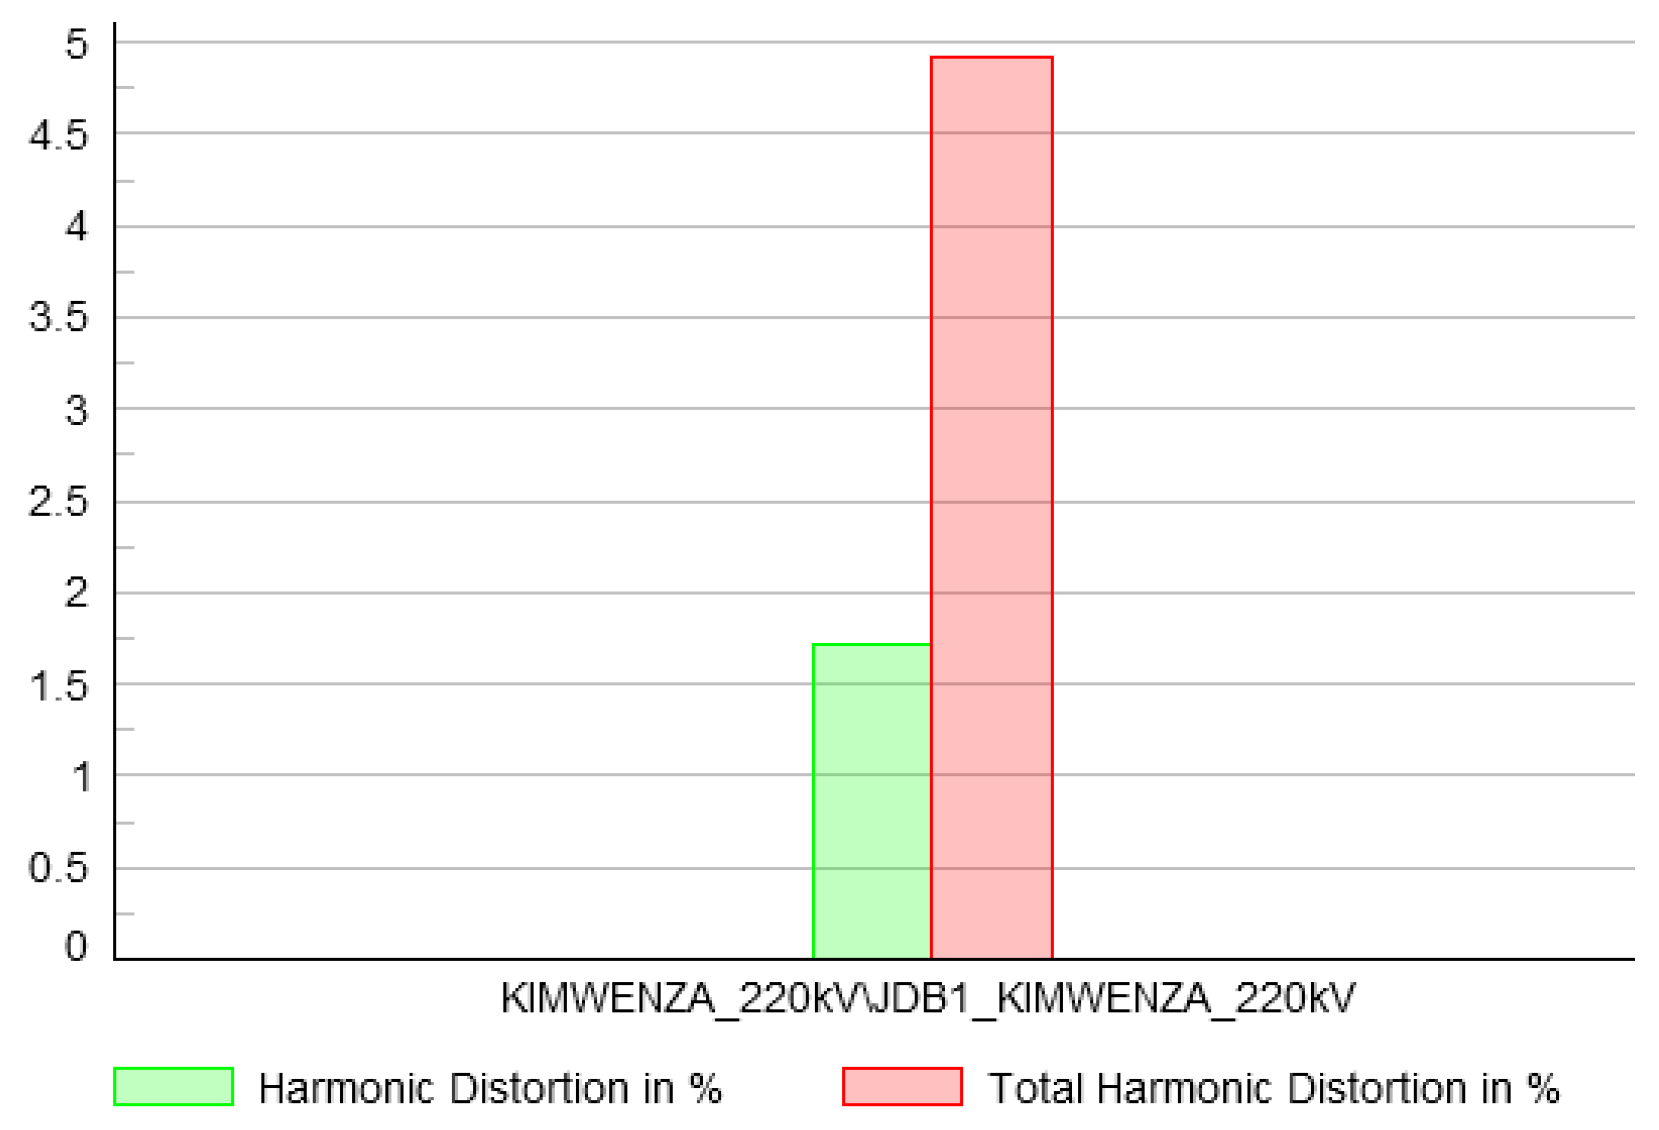
When PV penetration exceeds 30%, the SCR falls below the minimum recommended value of 3, grid impedance rises, thus reducing the ability of the grid to absorb disturbances and amplifying harmonic distortion. The interaction between inverter-generated harmonics and the increased grid impedance leads to resonant conditions. These conditions amplify specific harmonic frequencies, causing distorted voltage and current waveforms. This is evident in the rise of THD to 4.9% at 40% penetration (
Figure 12 and
Figure 13) and a critical 7.4% at 50% penetration (
Figure 14 and
Figure 15), far exceeding the IEC 61000-3-6 recommended limit of 3%. Such high distortion levels compromise power quality, disrupt equipment operation, and increase the risk of instability.
5.6. Impact of PV Penetration on Transient Grid Stability
5.6.1. Sudden Disconnection of the PV Plant Due to a Short Circuit on the Interconnection Line
The fault occurs at 2 s as shown in
Figure 16,
Figure 17 and
Figure 18, and the circuit breaker opens at 2.2 s. From the results, we observe that at 10% PV penetration, the voltage experiences only a slight drop following the disturbance, remaining close to 1 p.u. and stabilizing quickly, which indicates strong grid resilience. The frequency exhibits minor variations, remaining within the stability range of around 50 Hz. The oscillations dampen rapidly, and the rotor angle shows minimal deviations before stabilizing promptly, suggesting that the system maintains stable synchronization. These observations demonstrate that the grid effectively manages disturbances under this level of PV penetration.
Under 20% penetration, a more significant voltage drop is observed, reaching values lower than those recorded with 10%. However, the voltage recovers to levels close to 1 p.u. after a brief delay. Frequency fluctuations are slightly more pronounced but remain well-controlled and stabilize quickly. The rotor angle shows more noticeable oscillations, taking longer to stabilize. This indicates the onset of stress on the system, although the grid maintains an acceptable level of stability. With 30% penetration, the voltage drop becomes more pronounced and takes longer to stabilize, fluctuating between 0.9 and 1 p.u. Frequency oscillations become more significant, though still within acceptable limits. Rotor angle oscillations are clearly amplified, with an extended stabilization time. This reflects reduced grid robustness in response to the disturbance, suggesting that mitigation measures may be required to maintain stability.
At 40% penetration, the voltage experiences a substantial drop, reaching approximately 0.89 p.u., and requires more time to stabilize. This penetration level highlights increased grid fragility. Frequency variations are notable, with prolonged oscillations, indicating elevated risks to system stability. Rotor angle oscillations become significant, pointing to an imminent loss of synchronism if the disturbance persists. Finally, with 50% penetration, the voltage drops to critical levels, sometimes falling below 0.8 p.u., which signals severe grid instability. Frequency oscillations become uncontrolled, with significant deviations from 50 Hz, indicating a loss of stability. The rotor angle shows major oscillations that fail to stabilize, signaling compromised synchronization and the system’s inability to maintain stable operation
5.6.2. A 30% Load Increase in the Grid Followed by the Disconnection of the PV Plant
From
Figure 19,
Figure 20 and
Figure 21, we observe the transient responses of the network at the KMZ interconnection point in terms of frequency and rotor angle of the reference synchronous generator. At a PV penetration of 10%, the voltage remains relatively stable with a slight initial drop and quick recovery. This reflects a robust grid with a low PV contribution. The frequency stays at around 49.95 Hz, with rapid stabilization. The high inertia of the grid minimizes fluctuations. The rotor angle decrease is moderate, with quick stabilization after a few oscillations, indicating good generator synchronization.
For penetration levels of 20% and 30%, fluctuations become more pronounced, with oscillations following the initial drop. Recovery is slower compared to the 10% scenario. A more significant decrease in frequency is observed, but it remains within the acceptable range (49.85–49.95 Hz). The rotor angle shows moderate variations at 20%, but at 30%, oscillations become more pronounced, with a prolonged stabilization time. This dynamic reflects more complex interactions between synchronous generators, although the grid still manages to maintain acceptable stability. At penetration levels of 40% and 50%, the voltage drop is more significant, and the oscillations are more pronounced. The stabilization time is also extended, showing a significant impact of line loss on a grid with high PV penetration. The frequency drops to 49.75 Hz, with significant oscillations before stabilization. Simultaneously, the rotor angle exhibits high-amplitude oscillations at 40%, with a much longer stabilization time. At 50%, these oscillations reach their peak, indicating a significant degradation of synchronicity and an increased risk of grid instability. At these levels, advanced regulation mechanisms are essential to prevent severe desynchronization and ensure dynamic stability.
6. Recommendations
The findings of this study show that integrating PV systems into the western transmission network of the SNEL in the DRC presents both opportunities and challenges. To ensure successful PV integration, while maintaining grid stability and power quality, we propose the following recommendations that could be implemented in similar context of fragile power grids.
6.1. Integration of Advanced Grid-Support Technologies
The deployment of STATCOMs is essential for grids with high PV penetration levels. STATCOMs enhance grid stiffness by dynamically injecting or absorbing reactive power, which stabilizes voltage during sudden load increases or drops in PV production. This prevents voltage collapse and maintains grid stability. Their advanced control algorithms allow for real-time adjustments, ensuring dynamic stabilization, even during rapid PV fluctuations [
32,
33]. For optimal performance, STATCOMs should be installed at critical nodes—such as the 220 kV KMZ substation in this study—to support voltage stability and reduce rotor angle oscillations. The benefits of STATCOMs include improved voltage profiles, reduced active and reactive power losses, and enhanced synchronization of synchronous generators.
Additionally, BESSs could be integrated to address the intermittency of PV power generation. BESSs can store excess energy during peak PV production and release it during periods of high demand or low PV power generation, thereby stabilizing frequency and voltage [
33,
62]. Strategically placing BESSs near high PV penetration areas will provide rapid frequency regulation and voltage support. The benefits of BESSs include reduced frequency fluctuations, improved grid resilience, and enhanced energy management during peak demand.
The economic feasibility of deploying STATCOMs and BESSs in the DRC must con-sider the financial constraints of the country. While both technologies offer significant grid stability benefits, their high upfront costs are a challenge. However, their long-term benefits—reduced energy losses, improved reliability, and enhanced renewable integration—could justify the investment, especially with international funding or phased implementation. By leveraging external support and prioritizing strategic projects, the DRC can make these technologies economically viable, supporting a stable and sustainable energy transition.
6.2. Harmonic Distortion Mitigation
To mitigate harmonic distortions caused by PV inverters, a combination of active and passive filters could be implemented. Passive filters are cost-effective and can target specific harmonic frequencies, while active filters provide dynamic compensation for a broader range of harmonics [
63,
64]. Passive filters should be installed at substations with high harmonic distortion levels, while active filters should be deployed at critical interconnection points. This hybrid approach could help reduce THD, improve power quality, and protect sensitive equipment.
Optimized inverter design could act as an effective solution to address harmonic distortions. Modern multi-level inverters with advanced modulation techniques should be adopted to minimize harmonic injection into the grid. These inverters produce a sinusoidal output waveform, reducing THD and enhancing grid compatibility [
65]. Encouraging the use of advanced inverters in new PV installations, and retrofitting existing systems when feasible, will lower harmonic distortion, improve grid stability, and ensure compliance with power quality standards.
Regarding the economic and technical feasibility of active and passive filters for weak grids like the DRC national grid, passive filters are particularly suitable due to their low cost and simplicity. They consist of passive components such as inductors, capacitors, and resistors, which are tuned to specific harmonic frequencies. This makes them economically viable for weak grids with limited financial resources. However, their effectiveness is limited to specific harmonic frequencies depending on their design, and improper design can lead to resonance issues. Active filters, while more expensive, offer greater flexibility by dynamically compensating for a wide range of harmonics [
64]. They are technically feasible but require skilled personnel for installation and maintenance. For the DRC, a hybrid approach, combining both passive and active filters, could provide a balanced solution, leveraging the cost-effectiveness of passive filters and the dynamic capabilities of active filters.
6.3. Adaptive Protection Strategies
As PV penetration increases, fault currents rise, necessitating the recalibration of protection relays and the replacement of circuit breakers to handle higher current levels. Adaptive protection strategies should be implemented to dynamically adjust relay settings based on real-time grid conditions. Upgrading protection systems at substations like PDI and KWL, where fault currents increase significantly, will enhance fault isolation, reduce recovery times, and improve grid reliability.
To restore grid inertia and short-circuit power, synchronous condensers could be deployed. These devices provide reactive power support and improve the ability of the grid to absorb disturbances, particularly at high PV penetration levels [
66]. Installing synchronous condensers at key substations will enhance grid stiffness and stability, improving the SCR, reducing voltage fluctuations, and enhancing dynamic stability.
6.4. Long-Term Monitoring and Management
Implementing advanced control systems that continuously monitor power quality and adjust the operational parameters of inverters, filters, and grid-support devices is crucial. These systems should be capable of real-time adjustments to prevent power quality issues before they become critical [
56]. Deploying control systems at major substations and interconnection points will enable proactive harmonic management and improve grid stability.
Training and capacity building programs for network operators’ staffs are essential to ensure the effective use of advanced technologies such as STATCOMs, BESSs, and active filters. Collaborating with technical institutions and industry experts to provide hands-on training and workshops will enhance operational efficiency, reduce downtime, and improve grid management.
6.5. Policy and Strategic Planning
Developing and implementing reactive power management strategies, tailored to the specific characteristics of the DRC grid, is essential. These strategies should consider the environmental and economic implications of proposed solutions, such as capacitor banks and STATCOMs. Conducting detailed studies to identify optimal locations for reactive power compensation devices will reduce active and reactive power losses, improve voltage profiles, and enhance grid efficiency.
Introducing policies and incentives to promote the adoption of advanced grid-support technologies and renewable energy integration is also critical. Financial support for BESSs, STATCOMs, and harmonic filters can accelerate the transition to a sustainable energy system [
33]. Collaborating with government agencies and international organizations to secure funding and technical assistance will increase renewable energy penetration, reduce carbon emissions, and improve energy security.
6.6. Future Research Directions
Future research should explore the impact of distributed PV systems on grid stability and power quality. Decentralized production could offer additional benefits in terms of resilience and efficiency, particularly in weak grids like the DRC [
42]. Conducting pilot projects to evaluate the performance of distributed PV systems in different regions of the DRC will enhance grid resilience, reduce transmission losses, and improve energy access.
Further research should also investigate the economic and environmental implications of large-scale PV integration, including cost–benefit analyses of proposed technical solutions, such as BESSs and STATCOMs. Developing models to assess the long-term economic and environmental impacts of PV integration will enable informed decision-making, optimized resource allocation, and sustainable energy development.
By implementing these recommendations, the DRC and other LDCs in a similar context can harness their solar potential while ensuring the stability, reliability, and efficiency of their national power grids. These measures will not only address the technical challenges associated with high PV penetration but also contribute to sustainable energy transition.
7. Conclusions
This paper provides a comprehensive evaluation of PV system integration into the western transmission network of the fragile power grid of the DRC, providing critical insights for LDCs and developing countries. This work conducts a detailed simulation of five PV penetration scenarios (10%, 20%, 30%, 40%, and 50%) using DIgSILENT PowerFactory, to quantify the impact of varying PV penetration levels on power losses, voltage profiles, short-circuit ratio, harmonic distortions, and transient grid stability, considering 2012 MW as baseline production capacity.
The results demonstrate that the grid can support up to 30% PV penetration without significant disruptions, with active power losses being reduced by 25% at 20% penetration. Beyond this threshold, this study identifies the need for advanced technical solutions, such as BESS, STATCOM, and harmonic filters, to maintain grid reliability.
By focusing on the case of the DRC power grid, this work provides a robust evaluation framework for the integration of PV energy in regions with aged or fragile grid infrastructure, contributing to bridging the gap of limited studies dedicated to fragile power grids in the current literature. Our findings underscore the importance of modernizing grid infrastructure and adopting adaptive management strategies to facilitate the transition to renewable energy in similar contexts.
Future work should aim to explore the impact of distributed PV systems on grid stability and power quality, as decentralized generation could offer additional benefits in terms of resilience and efficiency. Additionally, further research could investigate the economic and environmental implications of large-scale PV integration, including in-context cost–benefit analyses of proposed technical solutions such as BESS and STATCOM. Finally, the development of advanced grid management strategies, tailored to the specific needs of fragile networks, could enhance the integration of renewable energy sources while ensuring grid stability and reliability.


 ,
, 


