Article

Methane Production, Microbial Community, and Volatile Fatty Acids Profiling During Anaerobic Digestion Under Different Organic Loading

1
Department of Environmental Engineering, University of Warmia and Mazury in Olsztyn, Warszawska 117, 10-950 Olsztyn, Poland
2
Department of Botany and Nature Protection, Faculty of Biology and Biotechnology, University of Warmia and Mazury in Olsztyn, Plac Łódzki 1, 10-721 Olsztyn, Poland
*
Author to whom correspondence should be addressed.
Energies 2025, 18(3), 575; https://doi.org/10.3390/en18030575
Submission received: 14 January 2025 / Revised: 22 January 2025 / Accepted: 24 January 2025 / Published: 25 January 2025
(This article belongs to the Section A4: Bio-Energy)

Abstract

:
The organic loading rate (OLR) is a crucial parameter in the anaerobic digestion of lignocellulosic biomass. Optimizing the OLR ensures a balanced substrate release for gradual hydrolysis, thereby preventing the accumulation of inhibitors that can disrupt methanogenesis. Its significance lies in its direct impact on the stability, efficiency, and overall performance of the digestion process. This study investigated the long-term anaerobic co-digestion of lignocellulosic biomass (Sida hermaphrodita) and cattle manure under varying organic loading rates (S1: 2 kgVS/m3·d, S2: 3 kgVS/m3·d, and S3: 4 kgVS/m3·d). Methane production, microbial community dynamics, and volatile fatty acid (VFA) profiles were analyzed. During S1 and S2, methane production was stable, achieving 446.3 ± 153.7 NL/kgVS and 773.4 ± 107.8 NL/kgVS, respectively. However, at S3, methane production declined, accompanied by a pH drop from 7.68 to 6.11, an increase in the FOS/TAC ratio from 0.272 to 0.35, and the accumulation of acetic and propionic acids at the end of the digestion cycle. Microbial analysis revealed that the abundance of Firmicutes increased with higher OLRs, reaching 93.6% in S3, while the Bacteroidota abundance decreased, reaching 3.0% in S3. During S1, methane production occurred through both acetoclastic and hydrogenotrophic pathways.

1. Introduction

Anaerobic digestion is a vital technology for sustainable energy generation. Lignocellulosic biomass has garnered significant interest as a bioenergy feedstock due to its renewable, abundant, and cost-effective nature. Utilizing lignocellulosic biomass for bioenergy production is a cornerstone of the bioeconomy as it enhances energy security while simultaneously supporting climate protection efforts. Sida hermaphrodita L. Rusby is a promising perennial energy crop that has been sustainably cultivated in European trials, demonstrating harvested yields comparable to other energy grasses. However, studies on methane production from Sida hermaphrodita biomass have been limited to laboratory-scale digesters, primarily focusing on biomethane potential tests and various biomass pretreatment methods [1,2,3,4].
The organic loading rate (OLR) is a critical operating parameter in anaerobic digestion that must be optimized to facilitate the effective uptake of organic molecules by microbial cells. Overloading the digester can lead to a pH reduction and the inhibition of methanogens, adversely affecting the digestion process. The OLR plays a pivotal role in shaping the diversity and abundance of microbial communities and serves as a functional tool to regulate volatile fatty acid (VFA) accumulation and biogas production. VFAs are key intermediates in anaerobic digestion, and their concentration and composition are critical indicators of methane production efficiency. The primary VFAs include acetic acid, butyric acid, and propionic acid, each exerting distinct effects on microbial populations. Among these, propionic acid has a stronger inhibitory effect compared to butyric acid [5]. However, the influence of VFAs on anaerobic digestion should be evaluated in conjunction with other process parameters, such as alkalinity, to ensure optimal system performance.
Several studies have explored the composition and role of microbial communities in the anaerobic digestion of lignocellulosic biomass [6,7]. Understanding microbial community dynamics is fundamental to optimizing anaerobic digestion and maximizing the organic loading rate (OLR). Furthermore, studying microbial populations that exhibit stress resistance or re-emerge after adverse conditions can provide valuable insights for biotechnological advancements. Certain microbial groups could serve as indicators for process control, while others might be utilized for bioaugmentation to restore microbial balance and re-establish the optimal process conditions. Bacterial adaptation to OLR fluctuations during digestion can enhance process stability, either through changes in community structure or physiological modifications. Notably, the evaluation of microbial communities during the anaerobic digestion of Sida hermaphrodita lignocellulosic biomass has yet to be investigated, presenting an opportunity for further research.
The study aimed to evaluate the effectiveness of anaerobic digestion by examining the relationship between the microbial composition and process parameters under varying organic loading rates (OLRs) in a long-term semicontinuous digester. The concentration and profiles of volatile fatty acids (VFAs), along with the associated bacterial and methanogenic community structures, were analyzed and discussed in relation to process stability and yield.

2. Materials and Methods

2.1. Substrate and Inoculum

The substrate used in this study was Sida hermaphrodita silage. The silage was prepared from perennial plantations harvested in spring in the second half of May. The plant material was ensiled without the addition of chemicals in bales weighing approximately 0.9 mg fresh weight. The detailed characteristics of this silage are presented in Zieliński et al. [8]. The silage was mixed with cattle manure and water at a weight ratio of 2:1:1 (Table 1), resulting in a moisture content of the substrate of about 90%. In the substrate, the content of organic matter from silage was 10 times higher than that from cattle manure. The inoculum was anaerobic sludge from an agricultural biogas plant in which the substrate consisted mostly of maize silage and pig manure.

2.2. Anaerobic Digestion Performance

The experiment was conducted on a semi-technical scale. The experiments were performed in a fully mixed reactor with an active volume of 300 L. The reactor had a tubular tank with an internal diameter of 1.2 m and a height of 0.4 m. The reactor was equipped with a low-speed mechanical agitator and systems for discharging/loading, temperature control, and biogas collection. The study was divided into three series, which differed in terms of the OLR of the reactor (Table 1). In the first series (S1), the experiment lasted 100 days, enabling the hydraulic volume of the reactor to be exchanged twice, which eliminated the influence of the inoculum on the results [9]. The second series (S2) lasted 87 days, during which the hydraulic volume of the reactor was also exchanged twice. The third series (S3) lasted 32 days, during which the hydraulic volume of the reactor was exchanged once; in this series, the reactor became overloaded, resulting in an accumulation of volatile fatty acids (VFAs; see Results for details), which indicated that it was pointless to continue research with this variant. Once a day, the reactor was fed with 6 kg, 9 kg, or 12 kg of the substrate (S1, S2, and S3, respectively), and the same amount of post-fermentation sludge was simultaneously removed. Anaerobic digestion was performed under mesophilic conditions (38 °C ± 2 °C). The samples for the determination of process indicators were collected every second day.
Additionally, at the end of each series, to investigate the changes in process indicators, samples were taken from the reactor at intervals of at least two hours during the reactor operation cycle. The samples were analyzed as follows: biogas volume and quality, FOS/TAC ratio (the TAC value is an estimation of the buffer capacity of the sample, and the FOS value indicates the volatile fatty acid content), total organic carbon (TOC), total nitrogen (TN), VFAs, total solids (TSs), volatile solids (VSs), and pH.

2.3. Analytical Methods

The total organic carbon (TOC) in the filtrate was measured with a TOC analyzer (Shimadzu-L, Kyoto, Japan). VFAs in the samples were subjected to qualitative and quantitative assessments using a gas chromatograph GC-FID (Brüker, 450-GC, Billerica, MA, USA). The chromatograph parameters and sample preparation was described by Kisielewska et al. [10]. The temporary flow rate and the total production of biogas were measured with an Allborg mass flow analyzer. Before measuring the volume, the biogas was dried by cooling it below the dew point. The quality of biogas produced was measured with a gas chromatograph connected to a thermal conductivity detector (GC-TCD) (Agillent 7890 A, Santa Clara, CA, USA). The chromatograph parameters were described by Kisielewska et al. [10] The TS and VS were measured using the gravimetric method. The content of volatile fatty acids (FOS value) and the buffer capacity (TAC value) were measured with a TitraLab AT1000 Series Titrator (Hatch, Mississauga, ON, Canada) to calculate the FOS/TAC ratio. The pH was measured with a VWR 1000L pH meter. Each indicator was measured in three replicates. All graphs and statistical analyses were conducted using GraphPad Prism software version 10.0 for Windows (GraphPad Software, La Jolla, CA, USA) [11]. The verification of the hypothesis concerning the distribution of each tested variable was determined on the basis of the W Shapiro–Wilk test. The homogeneity of variance were tested with Levene’s test. In order to determine the significance of differences between variables, a t-test and a two-way analysis of variance (ANOVA) were carried out.

2.4. Illumina MiSeq Sequencing

DNA isolation was conducted using a FastDNA® SPIN Kit for Soil (MP Biomedicals, Santa Ana, CA, USA). The purity and concentration of the isolated DNA were measured with a NanoDrop One spectrometer (Thermo Scientific, Waltham, MA, USA). Metagenomic analysis was conducted based on the amplification and next sequencing of the V3–V4 region, located in a range of 16S rRNA. Amplification and library preparation were carried out by specific primers (341F and 785 R). The PCR reaction was prepared using Q5 Hotstart High-Fidelity DNA Polymerase (NEBNext, Ipswich, MA, USA) under conditions consistent with the manufacturer’s recommendations. The sequencing procedure was conducted with MiSeq Reagent Kit v2. The good quality DNA libraries were sequenced as 2 × 250 base pair paired-end reads on the Illumina MiSeq platform. The demultiplex libraries were obtained directly after the sequencing procedure. During the quality control process, adapters and disturbing sequences were removed using the filter and trim function, as a part of the DADA2 library within the R v4.2.0 Bioconductor [12]. The next filtrating steps assumed the calculation of the error rate and the elimination of chimeric reads using the remove BimeraDenovo R function. The taxonomy assignment was obtained using the DADA2 approach and the Silva 138 database [13]. All filtrated sequences were tagged by alternative sequence variants (ASVs) during the DADA2 pipeline. Clear reads were evaluated by bioinformatic pipeline to obtain the operational taxonomic unit (OTU) clustering for each sample. The phyloseq [14] R library was implemented to calculate diversity (Shannon and Simpson methods) and NMDS clustering metrics. The most abundant taxa (OTU classification) were visualized for phylum, family, and genus level using phyloseq and ggplot2 [15] R libraries.

3. Results and Discussion

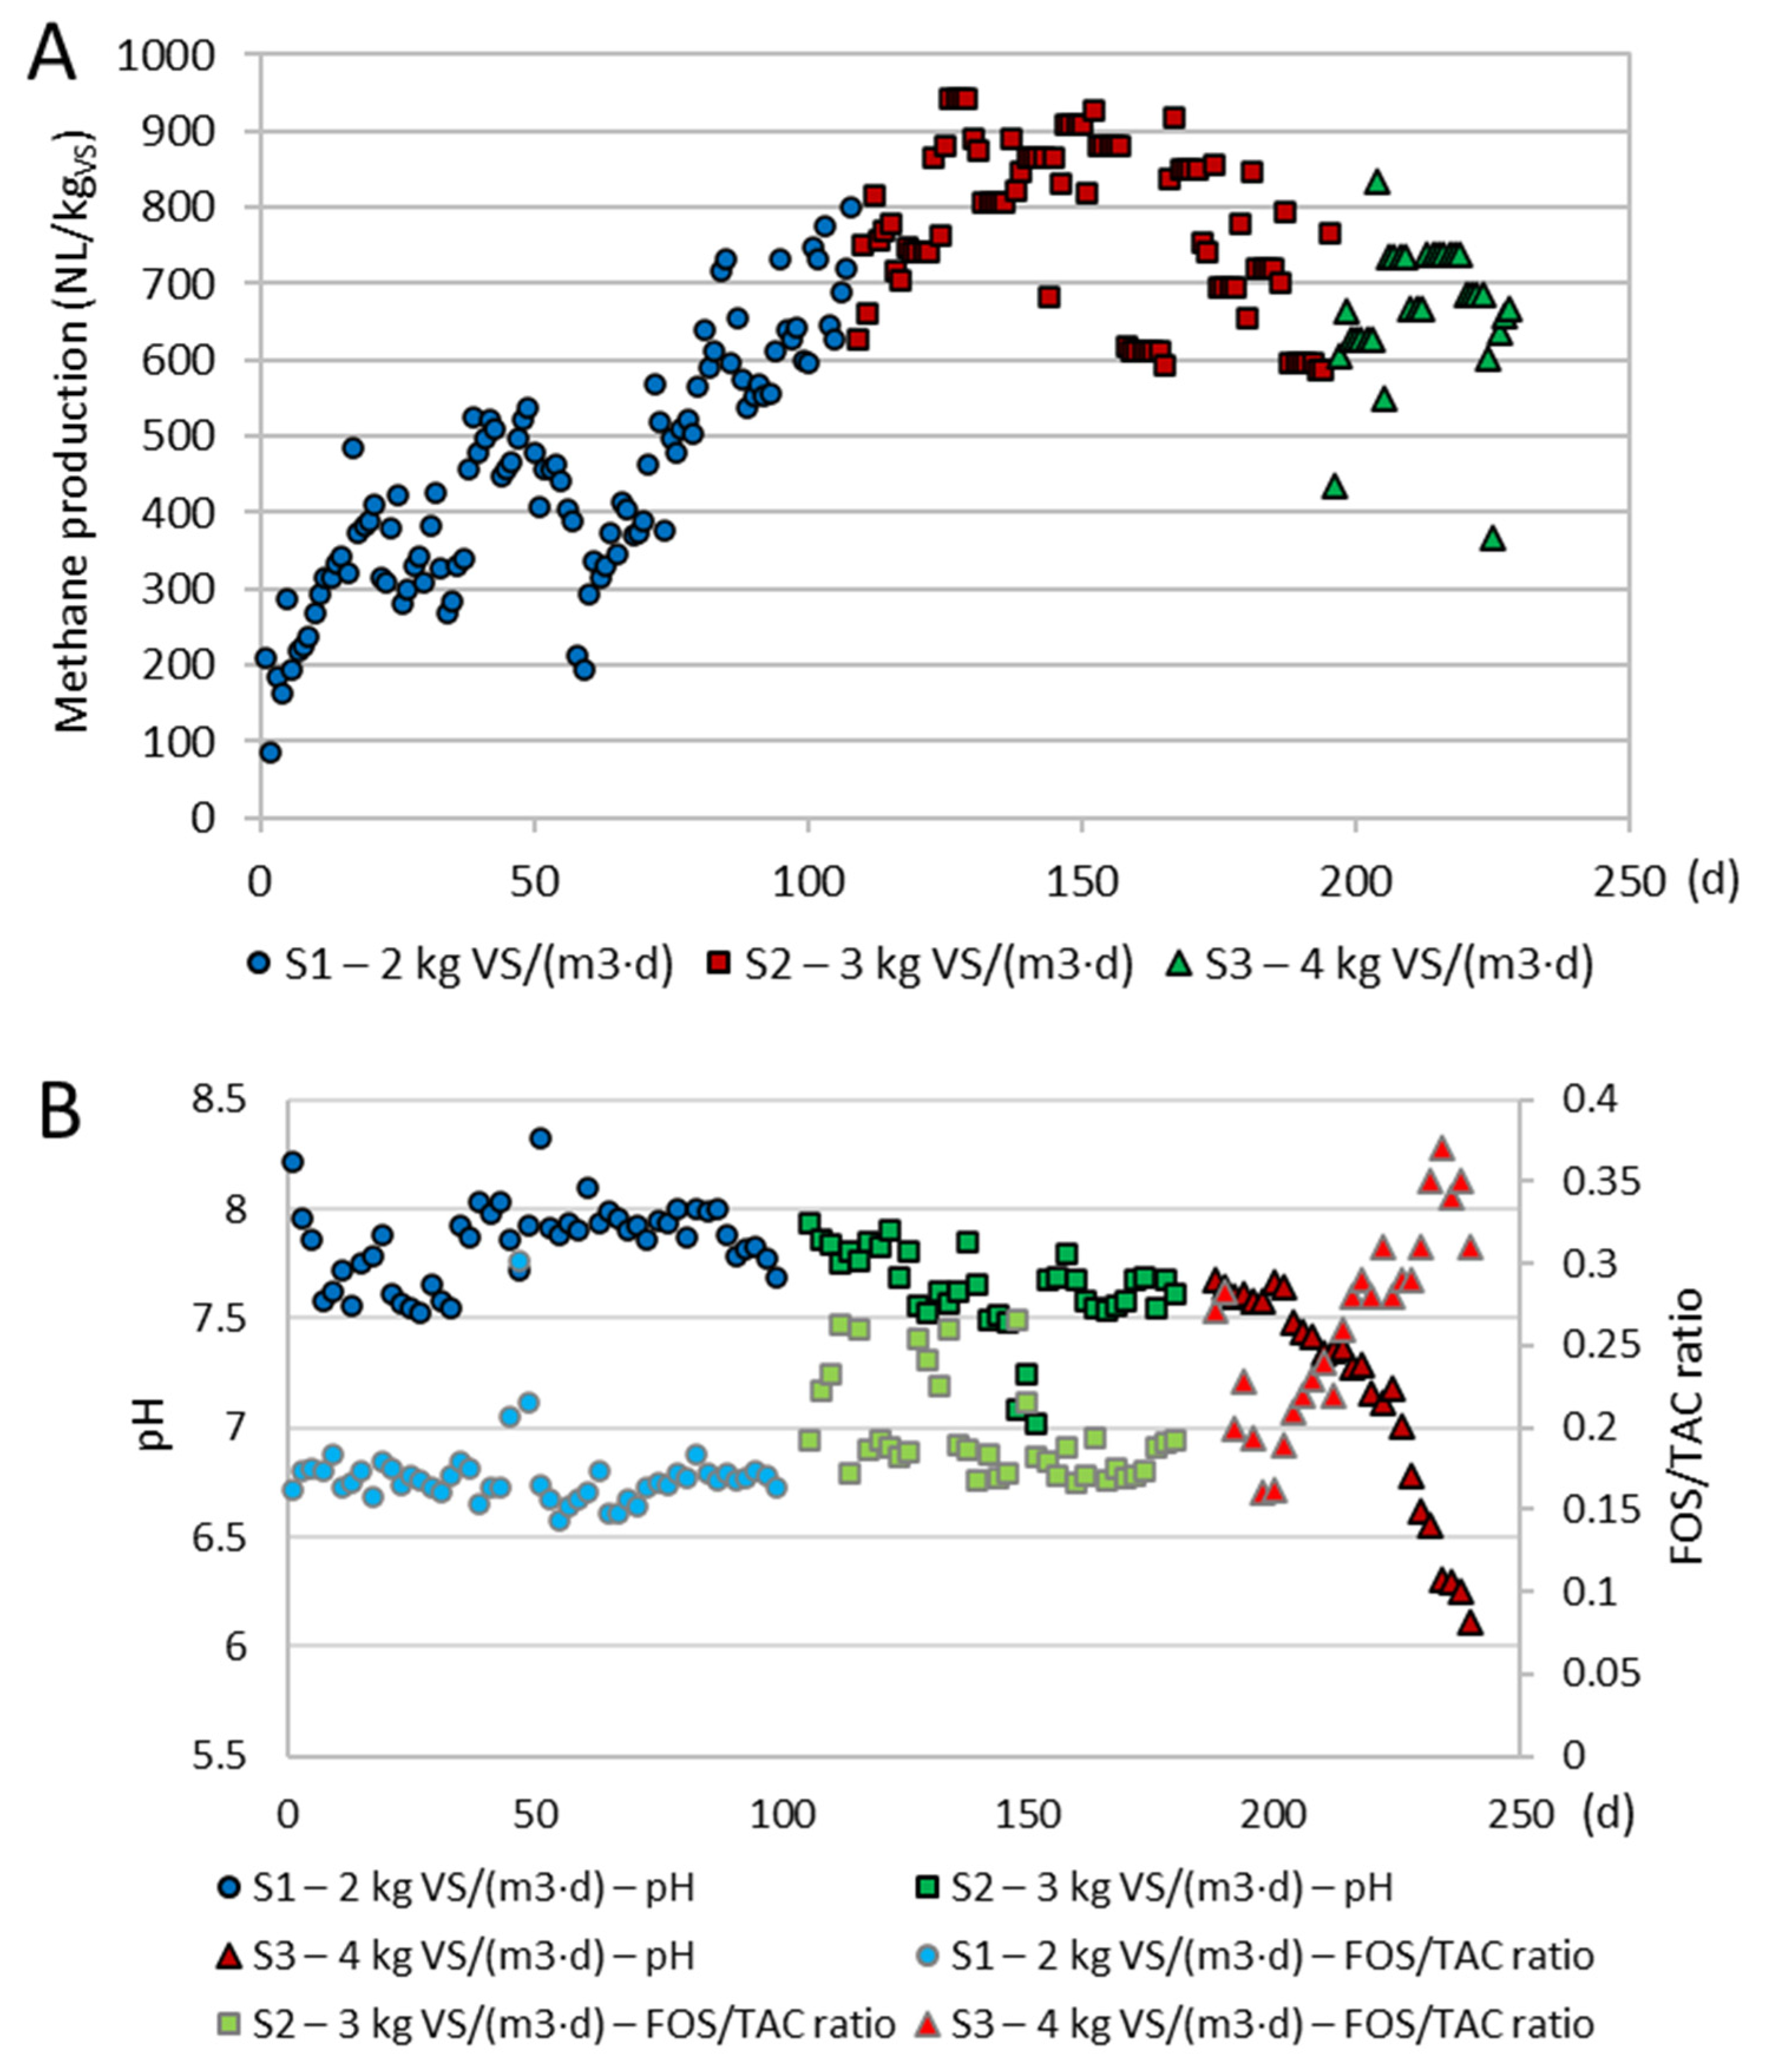
3.1. Long-Term Anaerobic Digestion

The OLR determined anaerobic digestion performance. In S1, the average methane production was 446.3 ± 153.7 NL/kgVS (Figure 1A). During S1, the methane production increased from 200 NL/kgVS to 750 NL/kgVS. In S2, the average methane production was higher than in S1 and reached 773.4 ± 107.8 NL/kgVS (Figure 1A). The methane production increased until day 45 of S2 (150 day of the entire experiment), at which it reached 926.9 NL/kgVS. Next, until the end of S2, the biogas production steadily decreased to 765.8 NL/kgVS. In S3, the average methane production was 666.7 ± 91.2 NL/kgVS. The lowest value noted in this series was 365.9 NL/kgVS. The observations noted in the present study were similar to those in the literature. Methane production is influenced by the OLR; increasing the OLR finally led to a decrease in the methane yield. Similar values of the OLR to the present study were applied during the co-digestion of alfalfa with manure [16] and the co-digestion of manure with grass [17]. In these studies, methane production was inhibited at an OLR of 3 g VS/(L·d). The methane production during the co-digestion of manure and grass decreased by 7% when the OLR was increased from 2 to 3 g VS/(L·d), and by 16–24% when the OLR was further increased to 4 g VS/(L·d).
The pH and FOS/TAC ratio were stable during S1 and S2 and were on average 7.85 ± 0.18 and 0.171 ± 0.02, and 7.63 ± 0.2 and 0.197 ± 0.03, respectively (Figure 1B). In S3, these process parameters indicated the inhibition of methane production. The pH decreased steadily from 7.68 to 6.11, and the FOS/TAC ratio increased steadily from 0.272 to 0.35. Methanogens prefer growth at a pH of 6.5–7.2. Krishna and Kalamdhad reported that the highest methanogenic activity was noted at the pH of 7 [18]. In the present study, the biomass was acidified by organic acids that resulted from accumulated VS in the digester. The substrate was characterized by 83.7 ± 4.3% of organic matter in the TS. In S1, the digestate was characterized by on average 65.8 ± 3.9% of organic matter in the TS, which increased steadily during S1 from about 62% to 70%. In S2, the digestate was characterized by 73.1 ± 2.2% of organic matter in the TS, and was higher than in S1. In S3, the content of organic matter in the TS further increased and reached 77.4 ± 1.0%.

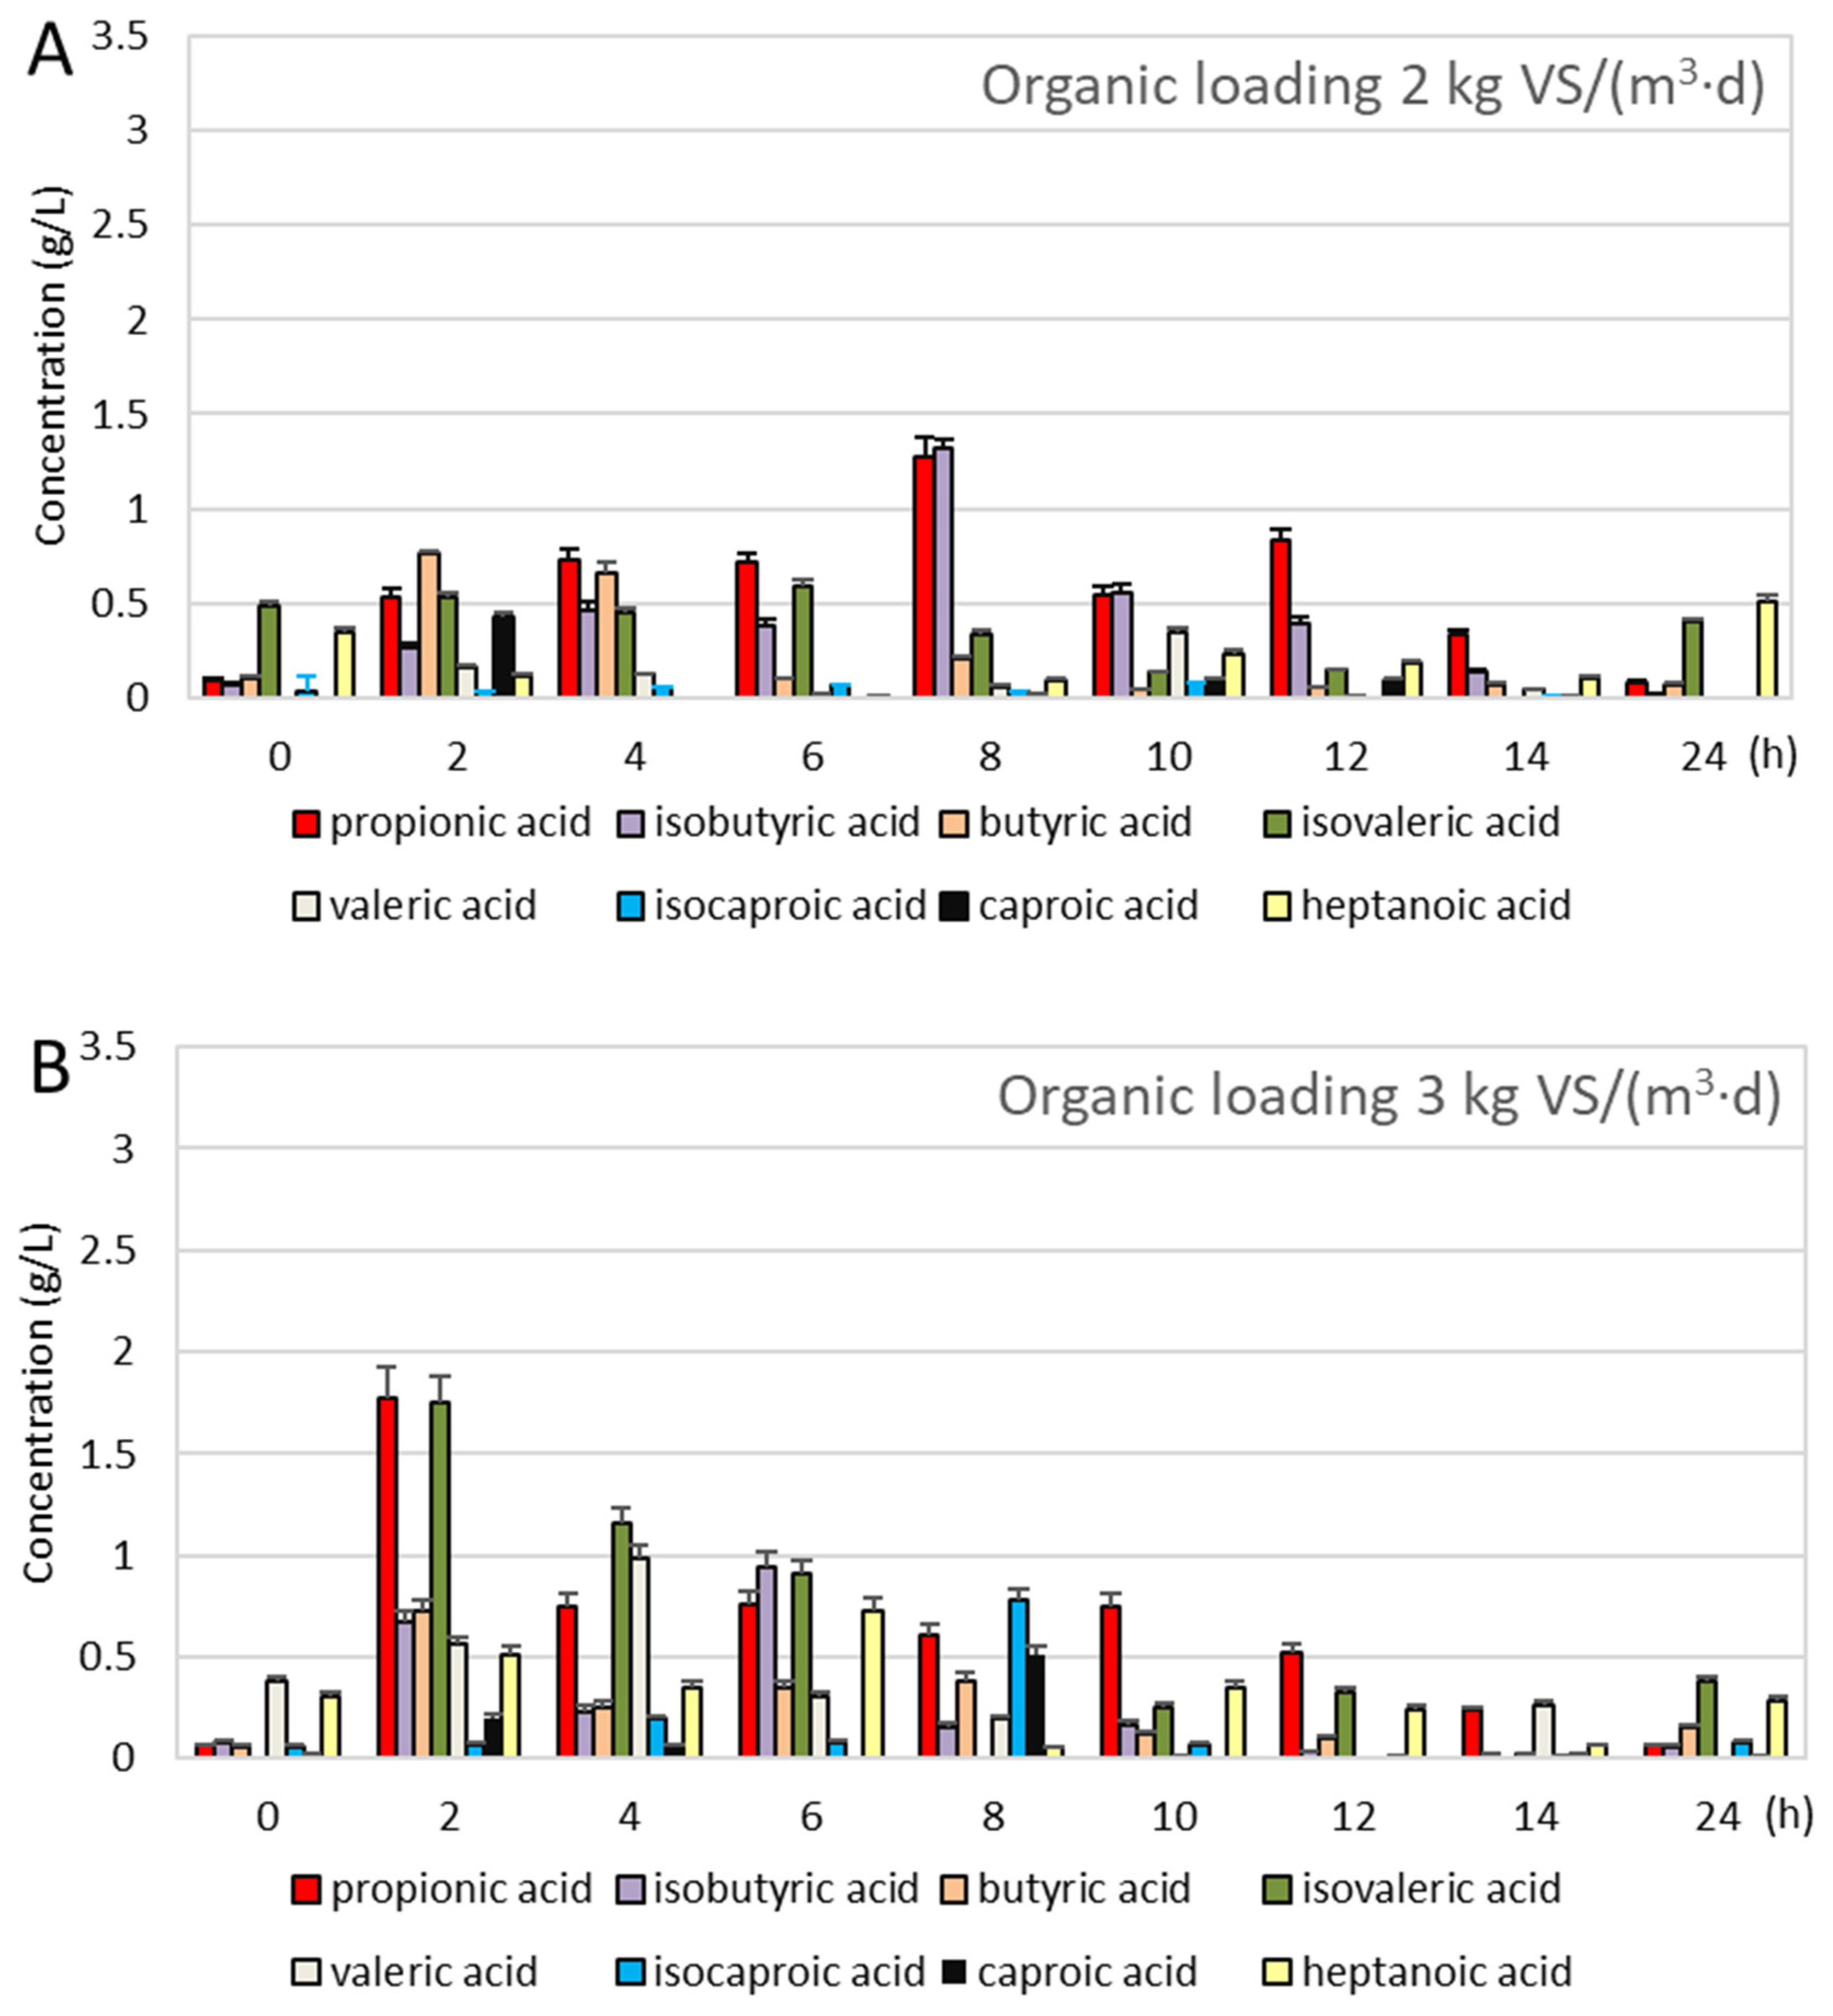
3.2. Anaerobic Digestion During the Operation Cycle

In S1, the VFA concentration during the 24 h of digester operation at the beginning was 3.09 ± 0.5 mM; after 8 h of digester operation, it reached a maximum (8.35 ± 0.4 mM), and later decreased to 1.75 ± 0.3 mM. The highest content among the VFAs was acetic acid, which had an initial concentration of 0.68 ± 0.4 g/L; after 8 h of digester operation, it reached 2.62 ±0.3 g/L (p < 0.05), and at the end, it decreased to 0.46 ± 0.1 g/L (Figure S1). The concentration of propionic acid and isobutyric acid was also the highest after 8 h of digester operation (about 1.3 g/L) (Figure 2A). The concentration of butyric acid was the highest after 2 and 4 h of digester operation, and reached 0.77 ± 0.01 g/L and 0.66 ± 0.05 g/L, respectively.
In S2, the VFA concentration at the beginning of digester operation was 1.97 ± 0.8 mM; after 2 h of digester operation, it reached a maximum (21.25 ± 2.4 mM) and then decreased to 1.79 ± 0.5 mM. The highest concentration of VFAs was noted faster than in S1 and was almost three times higher. After 2 h of digester operation, the highest content among the VFAs was acetic acid (8.63 ± 0.6 g/L) (p < 0.05), propionic acid (1.78 ± 0.14 g/L) (p < 0.05), and isovaleric acid (1.76 ± 0.12 g/L) (p < 0.05) (Figure S1 and Figure 2B).
In S3, the VFA concentration at the beginning of digester operation was 9.11 ± 1.9 mM; after 6 h of digester operation, it reached its maximum (34.97 ± 3.8 mM). Among the VFAs, the highest content was acetic acid (12.78 ± 0.96 g/L), propionic acid (2.94 ± 0.26 g/L), isobutyric acid (2.43 ± 0.19 g/L), butyric acid (1.40 ± 0.13 g/L), and isovaleric acid (1.82 ± 0.15 g/L). At the end of the digester cycle, the highest concentration was acetic acid (4.95 ± 0.5 g/L) and propionic acid (1.21 ± 0.08 g/L) (p < 0.05) (Figure S1 and Figure 2C). Ren et al. observed that the substrate conversion velocity of bacteria in the digester was as follows: acetic acid, then ethanol, butyric acid, and propionic acid [19]. Therefore, propionic acid accumulates easily and inhibits the production of methane. Wang et al. observed that an inhibition in the growth and activity of methanogens was noted when the concentration of propionic acid was more than 900 mg/L [20]. Marchaim and Krause also pointed out the propionic acid to acetic acid ratio, which indicates an impending failure when it is greater than 1:1.4 [21]. In the present study, the concentration of VFAs explained the observations of methane production. The accumulation of acetic acid and propionic acid in S3 decreased the pH and increased the FOS/TAC ratio. The methane production had not yet been markedly inhibited (it was 14% lower than in S2), however, the experiment was stopped because the above-mentioned process indicators had changed, pointing to process failure (the continuation would have probably further inhibited methane production). Stable anaerobic digestion might be ensured by controlling the production of VFAs [18,22]. A concentration of VFAs higher than 2 g/L decreases microbial activity and a concentration of VFAs higher than 4 g/L inhibits fermentation [23]. The VFAs can diffuse through hydrophilic layers of the bacterial cell wall and then dissociate into anions, which cannot diffuse out of the cell. The accumulated anions cause an intracellular pH drop [24].
In S1, the TOC concentration increased from 3000 mg/L to 4500 mg/L in the first 2 h of digester operation during S1 (Figure S2A). Then, it decreased to about 3000 mg/L after 3 h of digester operation and remained at this level until the end of the digester operation. The TN concentration slightly decreased from 3211 ± 198 mg/L to 2966 ± 121 mg/L during the 24 h of digester operation (Figure S2B). The FOS/TAC ratio increased after 2 h of digester operation from 0.182 ± 0.01 to 0.244 ± 0.02, then decreased and reached 0.190 ± 0.01 at the end of digester operation (Figure S2C).
In S2, the TOC concentration increased from 4403 mg/L to 6377 mg/L after 4 h of digester operation during S2 (Figure S2A). The TN concentration increased from 3132 ± 198 mg/L to 4964 ± 121 mg/L after 4 h of digester operation; after the next 2 h, it sharply decreased to 3437 mg/L, and then it slowly decreased to 2670 mg/L (Figure S2B). The FOS/TAC ratio increased after 2 h of digester operation from 0.171 ± 0.01 to 0.28 ± 0.01, then decreased and reached 0.200 ± 0.01 at the end of digester operation (Figure S2C).
In S3, the TOC concentration increased from 5688 mg/L to 7331 mg/L after 4 h of digester operation (Figure S2A). The TN concentration increased from 3600 to 5215 mg/L after 4 h of digester operation (Figure S2B). The FOS/TAC ratio increased after 4 h of digester operation from 0.26 ± 0.02 to 0.36 ± 0.01 (Figure S2C). The increase in the OLR resulted in increased TOC concentration in the liquid phase in the digester, even at the beginning of the cycle. The substrate in the present study was lignocellulose biomass, and the increase in the TOC concentration after several hours after feeding was a result of biomass hydrolysis. Lignocellulose is composed of complex polymers including cellulose, hemicellulose, and lignin. During hydrolysis, these polymers are broken down into simpler, soluble organic compounds, leading to an increase in TOC in the liquid phase. This increase reflects the conversion of complex polymers into soluble forms, making the organic carbon more bioavailable for subsequent biological processes such as anaerobic digestion. This observation highlights the hydrolysis phase as a key step in releasing bioavailable organic matter from lignocellulosic biomass [25].

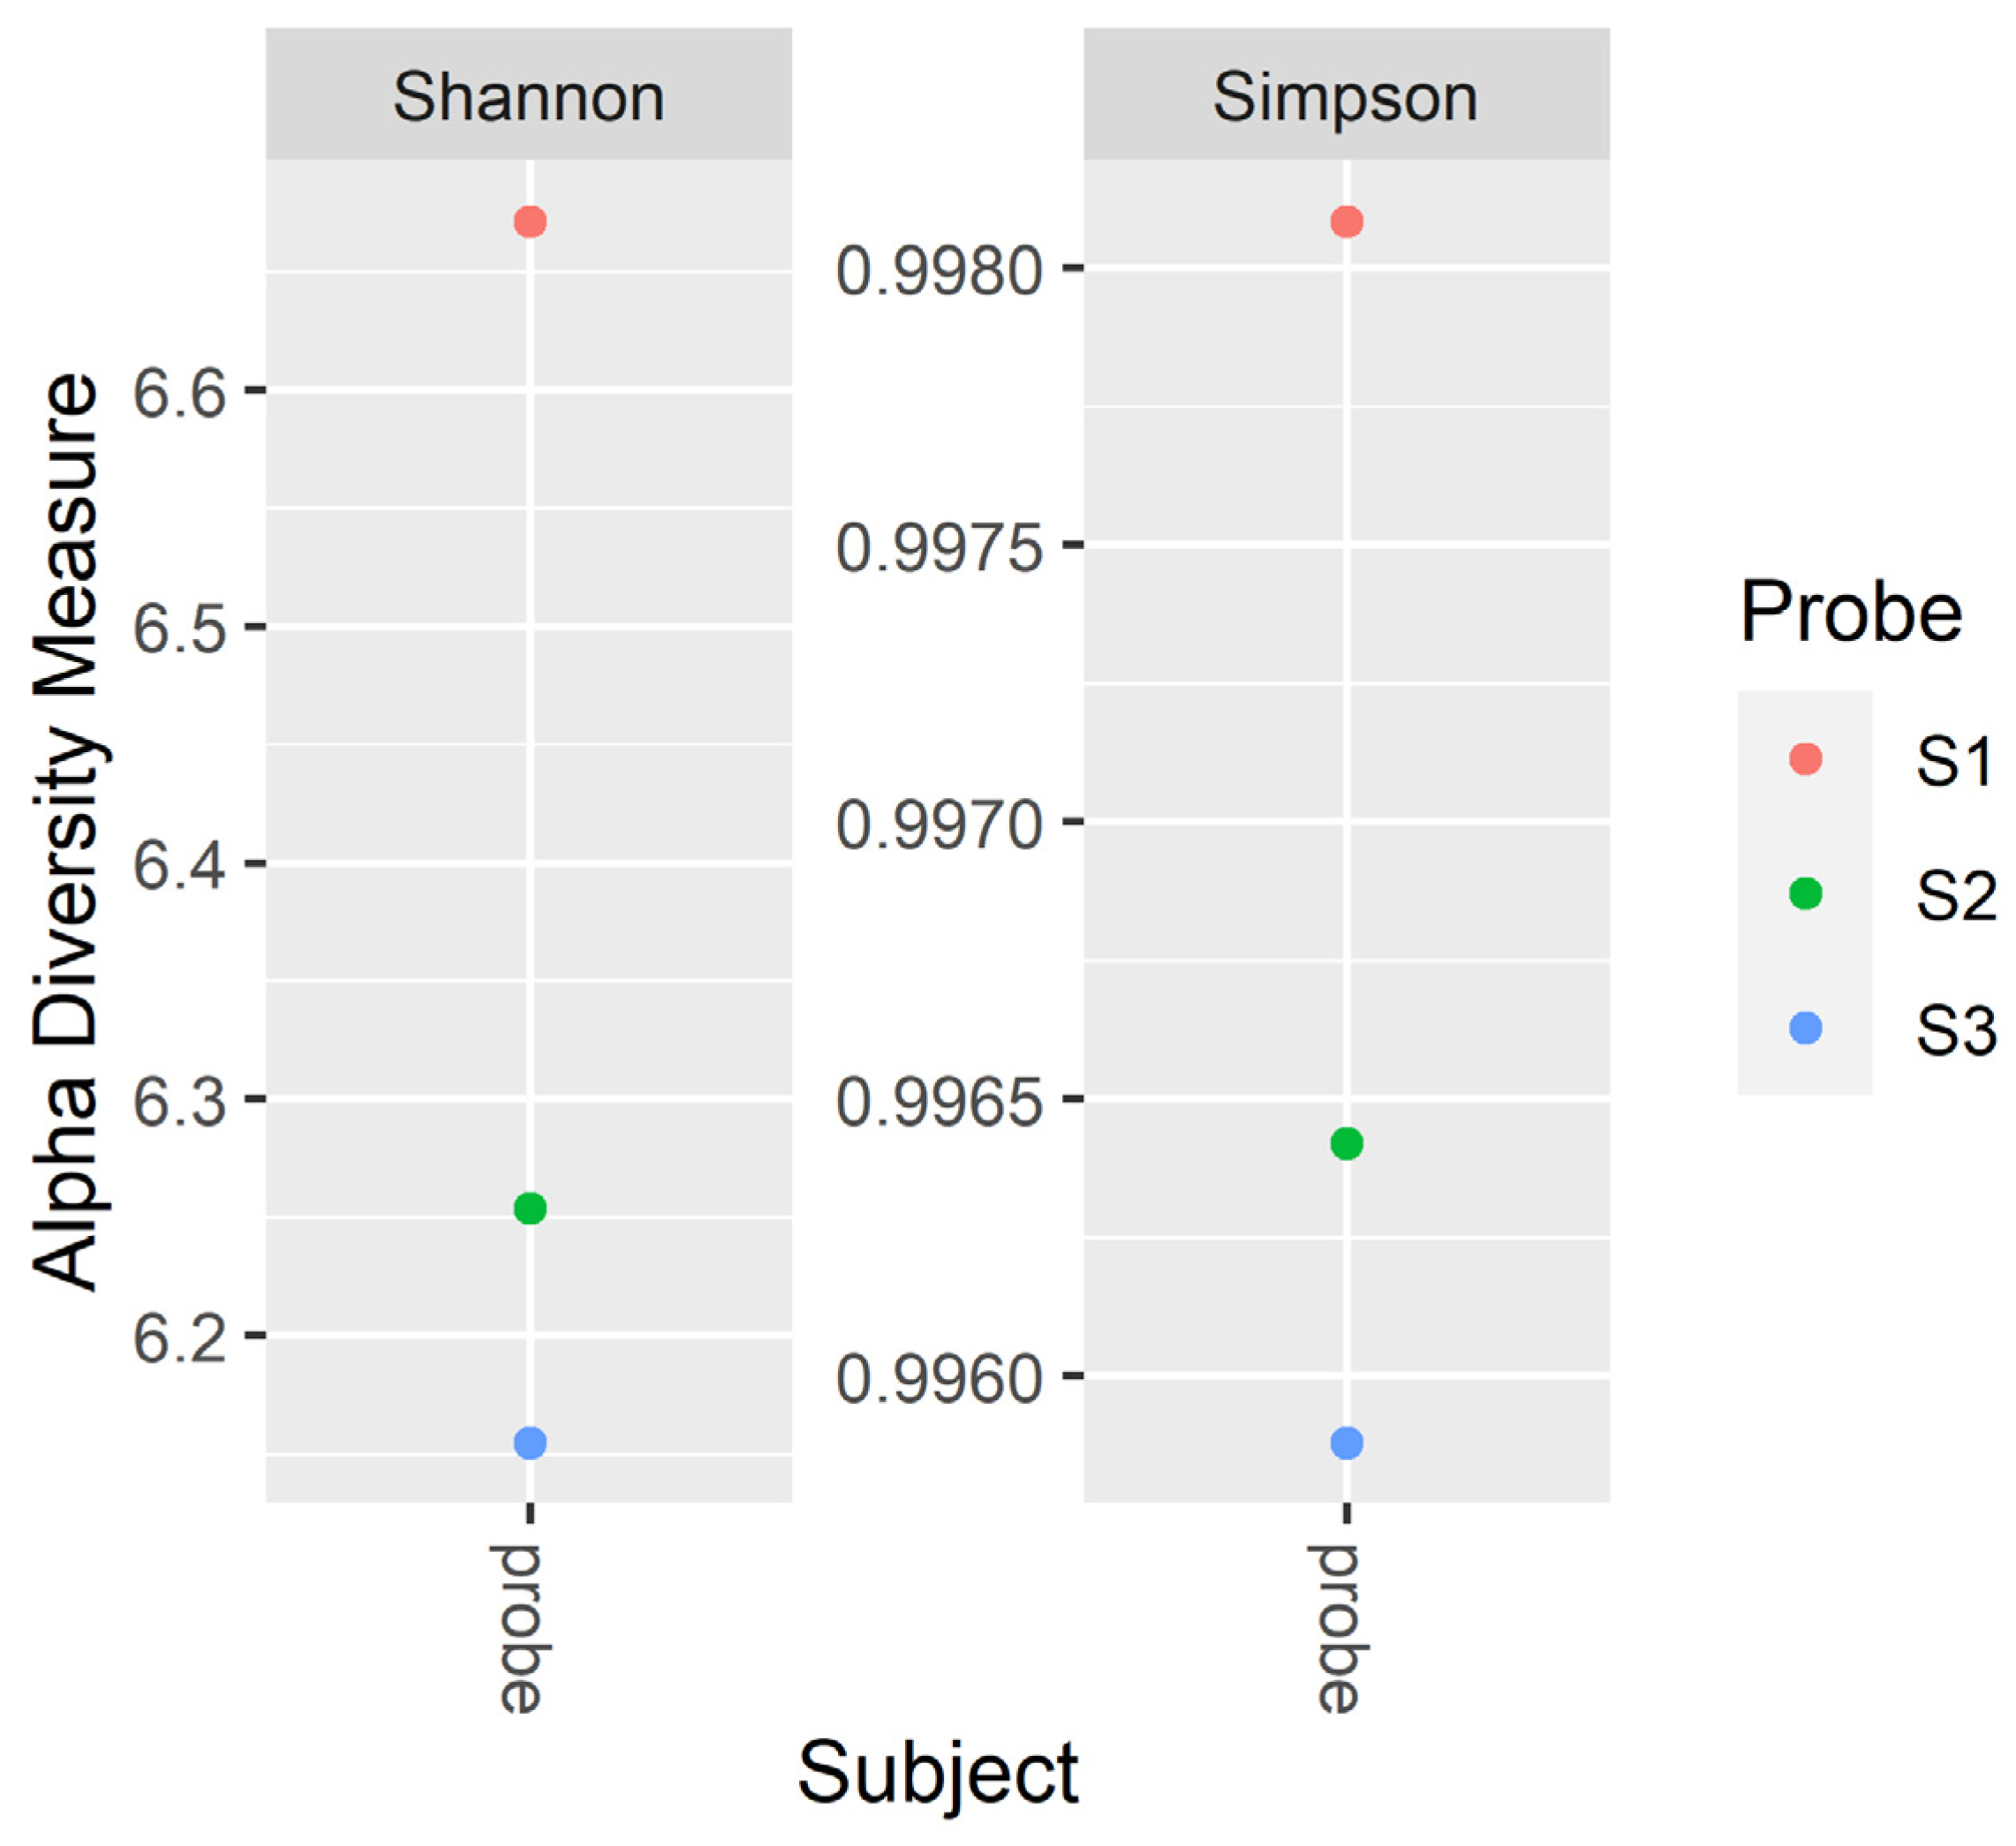
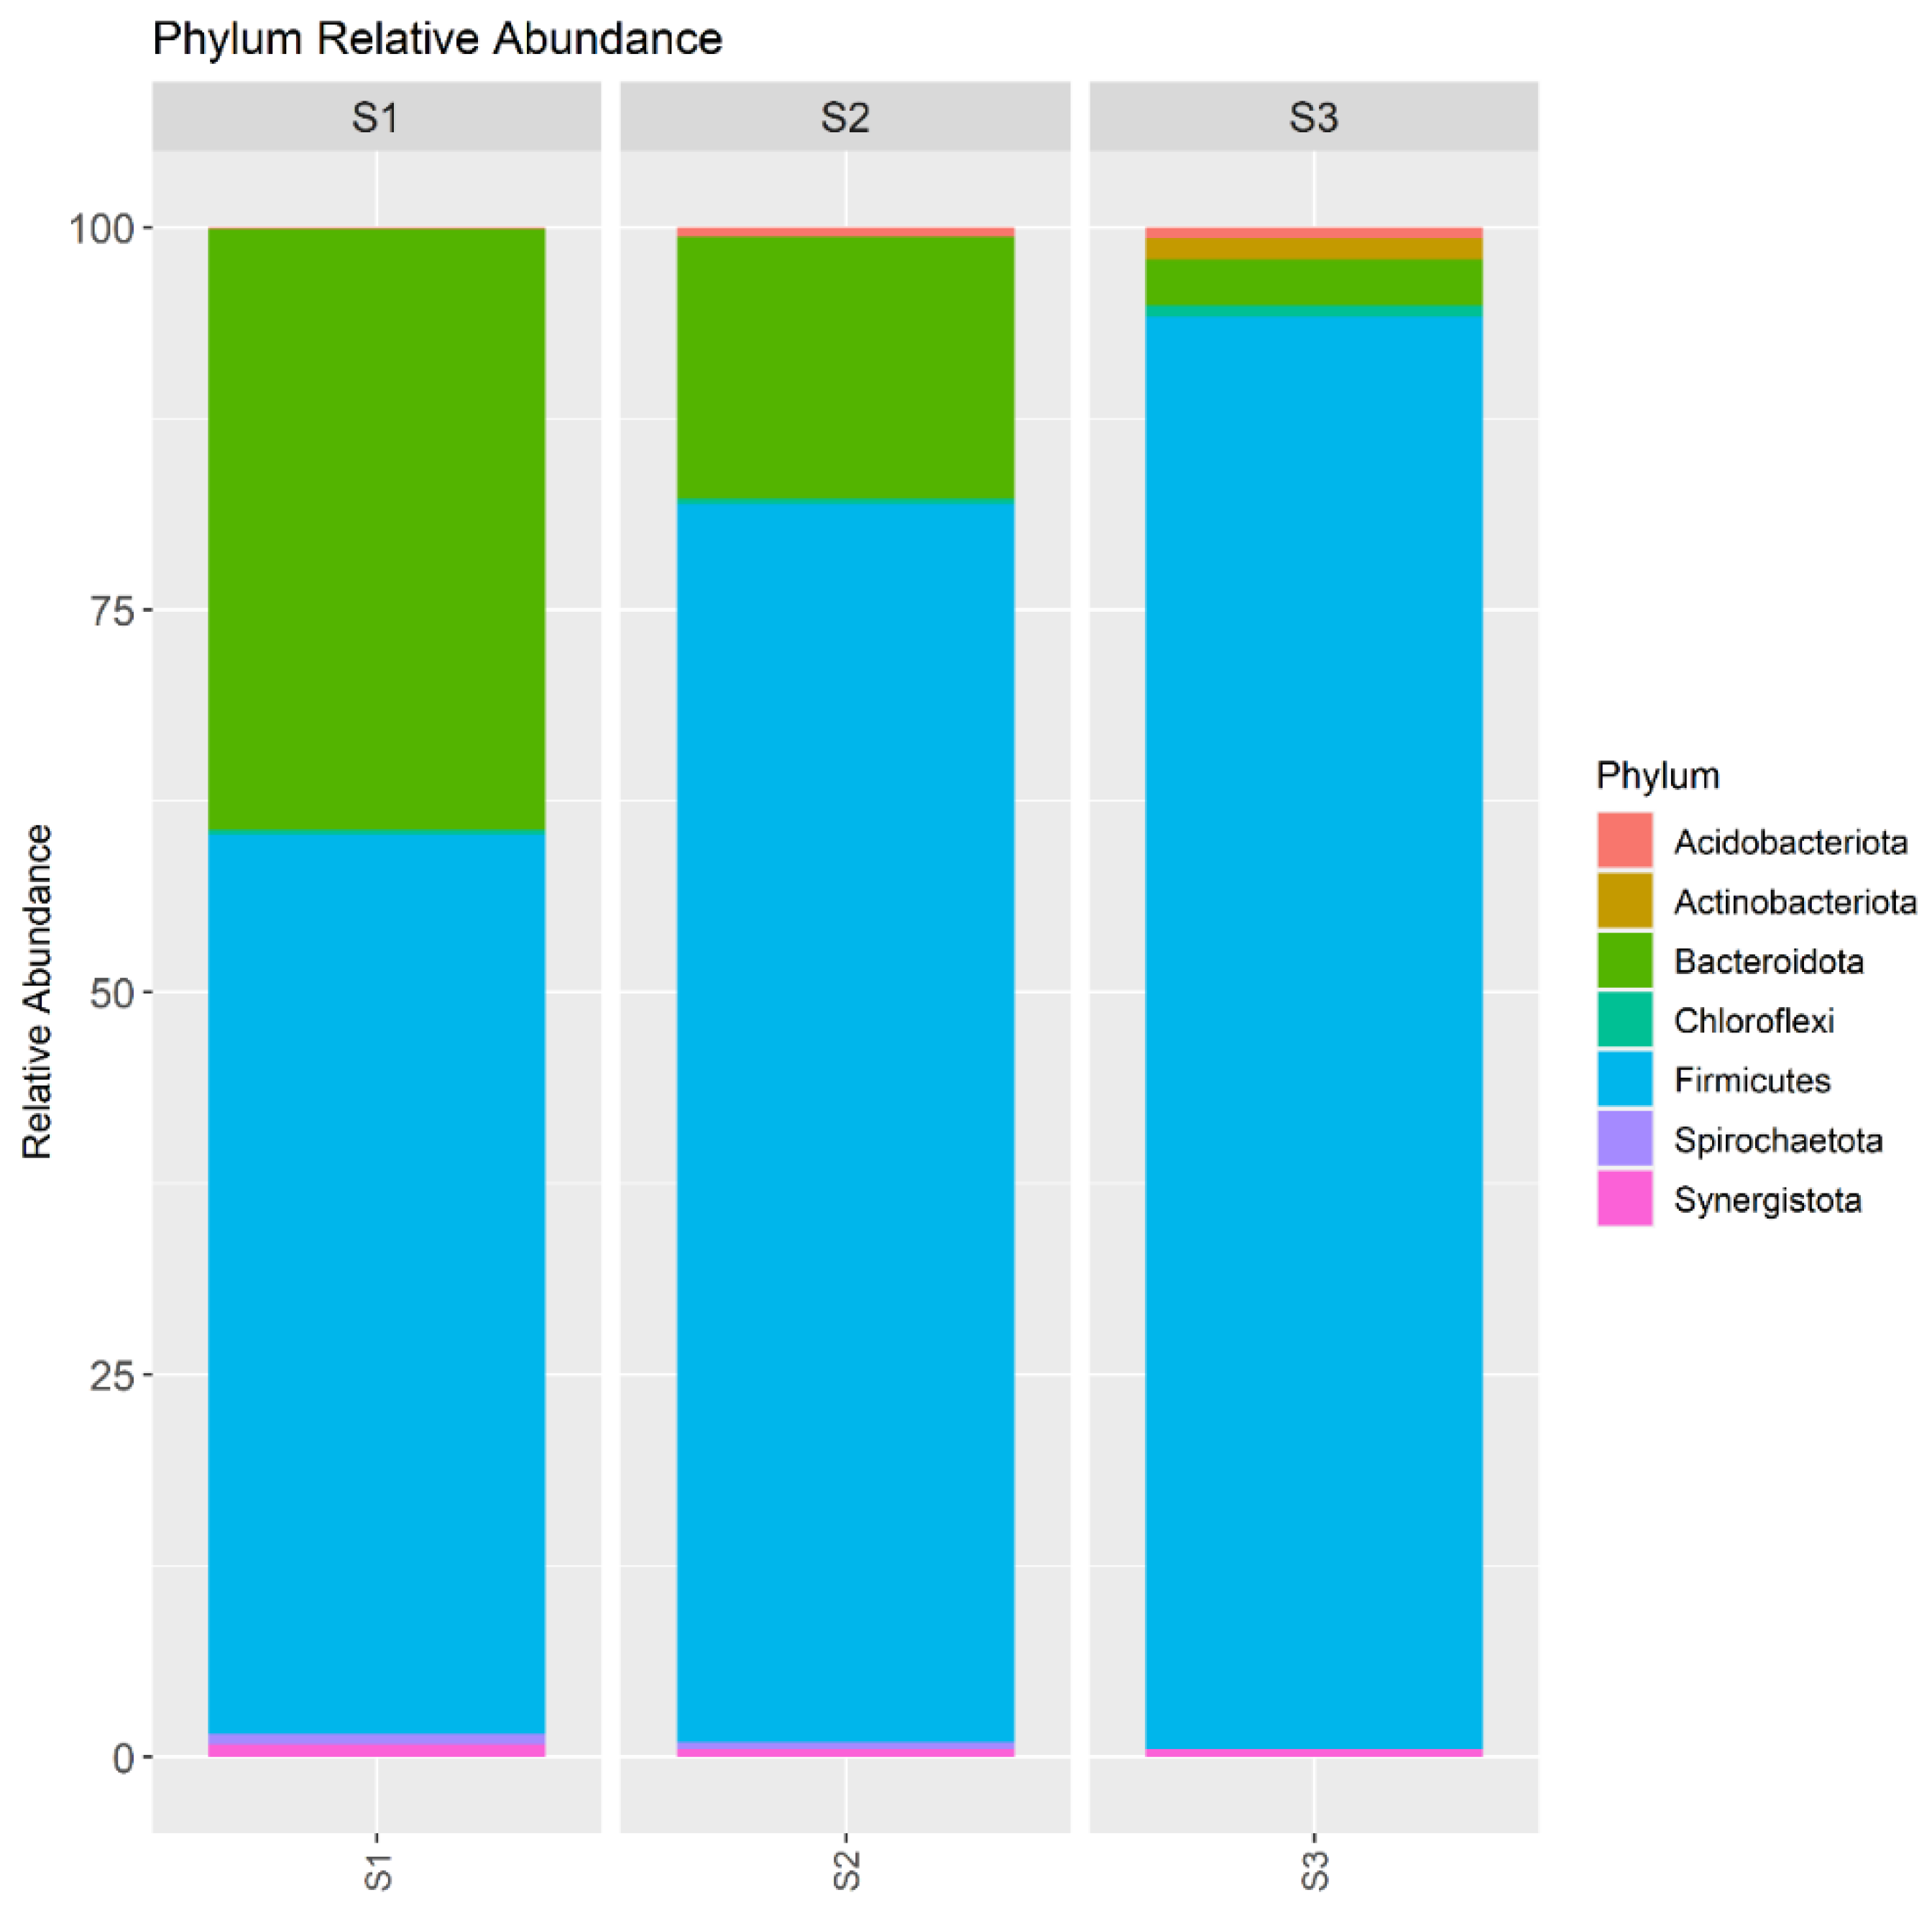
3.3. Microbial Community

Microbial community evenness and richness are reflected by the Simpson and Shannon indices, respectively (Figure 3). The highest indices were observed in S1, indicating that the microbial community in the digester with the lowest OLR had the highest species diversity. However, increasing the OLR led to a lowering of the diversity and domination of some specific species in S3.
The microbial community was dominated by Firmicutes and Bacteroidota (Figure 4). The abundance of Firmicutes increased with an increase in OLR in the digester, from 58.8% in S1, 80.9% in S2 to 93.6% in S3. The number of bacteria in the phylum Acidobacteriota, Actinobacteriota, and Chloroflexi also increased with an increase in the OLR in the digester. In contrast, Bacteroidota abundance decreased with an increase in the OLR in the digester (39.3% in S1, 17.1% in S2, 3.0% in S3). Firmicutes and Bacteroidetes are very often indicated as the most abundant phyla in mesophilic anaerobic digesters. Chen et al. pointed out the importance of interactions between Firmicutes and Bacteroidetes phyla in the stability of anaerobic digestion [26]; the authors suggested that the ratio between the abundance of Firmicutes to Bacteroidetes could be a potential indicator for process performance. Firmicutes dominated the bacterial community during stable process performance while Bacteroidetes outcompeted Firmicutes in high OLR. These observations were different to those in the present study. However, Atasoy et al. noted that the phylum Firmicutes was associated with high VFA production, which is consistent with the present study [27]. In S3, the digester with the highest OLR, methane production was inhibited, the VFAs accumulated, and the Firmicutes abundance was 93.6%.
The main genera belonging to Firmicutes identified in the present study were Caldicoprobacter and Fastidiosipila (Figure 5). The abundance of Caldicoprobacter decreased from 41% in S1, 37.5% in S2 to 25.6% in S3. Caldicoprobacter is able to degrade hemicelluloses [28]. Therefore, the high relative abundance of Caldicoprobacter could promote the degradation of Sida hermaphrodita, as it was in the case of corn straw noted by Guo et al. [29]. However, their abundance was reduced by increasing the OLR, which suggests that Caldicoprobacter is sensitive to the lowering of pH and VFA accumulation. Jiang et al. noted that the negative correlations of Caldicoprobacter with acetic acid and butyric acid, also observed in the present study, might indicate that some species within this genus may function as syntrophic oxidizers of acetate and butyrate [30]. Syntrophic oxidation of acetate and butyrate typically occurs in close cooperation with hydrogenotrophic methanogens or sulfate-reducing bacteria. This process requires the removal of hydrogen (H₂) or formate to proceed thermodynamically [30]. In the present study, the presence of microorganisms capable of removing H₂ including DMER64 and hydrogenotrophic methanogens (mentioned below) further supports the occurrence of syntrophic oxidation. These findings suggest that Caldicoprobacter may play a pivotal role in the degradation of acetate and butyrate in syntrophic association with H₂-utilizing microorganisms.
The abundance of Fastidiosipila increased with an increase in the OLR from 31.1% in S1, 52.5% in S2 to 66.7% in S3 (Figure 5). Koo et al. identified Fastidiosipila and Rikenellaceae RC9 as the major bacterial genera in anaerobic co-digestion systems and that these genera could also produce organic acids from proteins and carbohydrates [31]. Fastidiosipila has been identified as a major bacterial genus in mesophilic anaerobic digesters treating different types of substrates (i.e., waste food, waste landfill leachate, and sewage sludge), which can produce organic acids such as butyric and acetic acids [32]. In the present study, the abundance of Fastidiosipila was the highest in the digester with acetic acid accumulation.
The phyla Bacteroidota was represented by genus DMER64 (Figure 5). The abundance of DMER64 decreased (17.4% in S1, 6.9% in S2, and 1.0% in S3) with an increase in the OLR. DMER64 is considered as the essential genera for short-chain fatty acid synthesis and is specialized in producing acetic and propionic acid [33] as well as keeping low hydrogen pressure by enhancing the interspecies H2 transfer, which was probably also its contribution in the present study [34]. The authors also observed that the abundance of DMER64 strongly enhanced the hydrogenotrophic methanogenesis conducted by Methanosarcina. In the present study, Archaea abundance was reduced by increasing the OLR (3.8% in S1, 1.0% in S2, and 0.8% in S3). The main Archaea phylum was Halobacterota, represented by Methanosarcina. Thus, Meng et al.’s observations on DMER64 function and cooperation with Methanosarcina in methane production were confirmed in the present study. It also indicates that methane is produced not only by the acetoclastic pathway, but also by the hydrogenotrophic pathway. The other genus observed in the present study responsible for hydrogen production, whose abundance was reduced by the OLR (1.1% in S1, 0.6% in S2 and in S3) was Acetomicrobium, belonging to Synergistota (Figure 5). The cooperation between syntrophic hydrogen producers and methanogens is also extremely important in the anaerobic sludge community. Methanogens consume hydrogen, reduce the partial pressure of this gas, and stimulate the activity of acetogenic bacteria. This cooperation was disrupted by increasing the OLR, which inhibited methane production.

4. Conclusions

In the optimized OLR, methane production occurred through both the acetoclastic and hydrogenotrophic pathways, demonstrating the microbial community’s ability to adapt and maintain functionality under these conditions. Overloading primarily affected the pH and FOS/TAC ratio, though methane production inhibition was not yet significant, indicating a certain resilience of the system to transient disturbances. This study highlights the importance of the daily monitoring of these indicators to prevent inhibition and maintain system efficiency. Additionally, variations in sensitivity among microbial genera (e.g., Caldicoprobacter vs. Fastidiosipila) emphasize the critical role of microbial composition in process stability. These findings contribute to advancing anaerobic digestion technologies by providing insights into operational strategies and microbial dynamics for complex lignocellulosic substrates.

Supplementary Materials

The following supporting information can be downloaded at: https://www.mdpi.com/article/10.3390/en18030575/s1, Figure S1: The concentration of acetic acid during 24 h of digesters operation; Figure S2: The changes of TOC (A), TN (B) and FOS/TAC ratio (C) during 24 h of digesters operation.

Author Contributions

Conceptualization, M.Z. and P.R.; Methodology, M.Z. and P.R.; Software, Ł.P.; Validation, M.Z. and P.R.; Formal analysis, P.R.; Investigation, M.D. (Magda Dudek), M.K., and P.R.; Resources, M.D. (Magda Dudek); Data curation, P.R.; Writing—original draft preparation, P.R.; Writing—review and editing, M.Z., P.R., M.K., M.D. (Magda Dudek) and M.D. (Marcin Dębowski); Visualization, Ł.P. and P.R.; Supervision, M.Z.; Funding acquisition, M.Z. All authors have read and agreed to the published version of the manuscript.

Funding

The study was carried out within the framework of the project under program BIOSTRATEG funded by the National Center for Research and Development, No. 1/270745/2/NCBR/2015 “Dietary, power, and economic potential of Sida hermaphrodita cultivation on fallow land”.

Data Availability Statement

The original contributions presented in the study are included in the article/Supplementary Materials, further inquiries can be directed to the corresponding author.

Conflicts of Interest

The authors declare no conflicts of interest.

References

  1. Borkowska, H.; Molas, R. Two Extremely Different Crops, Salix and Sida, as Sources of Renewable Bioenergy. Biomass Bioenergy 2012, 36, 234–240. [Google Scholar] [CrossRef]
  2. Zielinski, M.; Rusanowska, P.; Krzywik, A.; Dudek, M.; Nowicka, A.; Dębowski, M. Application of Hydrodynamic Cavitation for Improving Methane Fermentation of Sida hermaphrodita Silage. Energies 2019, 12, 526. [Google Scholar] [CrossRef]
  3. Zieliński, M.; Kisielewska, M.; Dudek, M.; Rusanowska, P.; Nowicka, A.; Krzemieniewski, M.; Kazimierowicz, J.; Dębowski, M. Comparison of Microwave Thermohydrolysis and Liquid Hot Water Pretreatment of Energy Crop Sida hermaphrodita for Enhanced Methane Production. Biomass Bioenergy 2019, 128, 105324. [Google Scholar] [CrossRef]
  4. Marta, K.; Paulina, R.; Magda, D.; Anna, N.; Aleksandra, K.; Marcin, D.; Kazimierowicz, J.; Marcin, Z. Evaluation of Ultrasound Pretreatment for Enhanced Anaerobic Digestion of Sida hermaphrodita. Bioenerg. Res. 2020, 13, 824–832. [Google Scholar] [CrossRef]
  5. Barredo, M.S.; Evison, L.M. Effect of Propionate Toxicity on Methanogen-Enriched Sludge, Methanobrevibacter Smithii, and Methanospirillum Hungatii at Different PH Values. Appl. Environ. Microbiol. 1991, 57, 1764–1769. [Google Scholar] [CrossRef] [PubMed]
  6. Faisal, S.; Thakur, N.; Jalalah, M.; Harraz, F.A.; Al-Assiri, M.S.; Saif, I.; Ali, G.; Zheng, Y.; Salama, E. Facilitated Lignocellulosic Biomass Digestibility in Anaerobic Digestion for Biomethane Production: Microbial Communities’ Structure and Interactions. J. Chem. Technol. Biotechnol. 2021, 96, 1798–1817. [Google Scholar] [CrossRef]
  7. Ünyay, H.; Yılmaz, F.; Başar, İ.A.; Altınay Perendeci, N.; Çoban, I.; Şahinkaya, E. Effects of Organic Loading Rate on Methane Production from Switchgrass in Batch and Semi-Continuous Stirred Tank Reactor System. Biomass Bioenergy 2022, 156, 106306. [Google Scholar] [CrossRef]
  8. Zieliński, M.; Rusanowska, P.; Zielińska, M.; Dudek, M.; Nowicka, A.; Purwin, C.; Fijałkowska, M.; Dębowski, M. Influence of Preparation of Sida hermaphrodita Silages on Its Conversion to Methane. Renew. Energy 2021, 163, 437–444. [Google Scholar] [CrossRef]
  9. Chamy, R.; Ramos, C. Factors in the determination of methanogenic potential of manure. Bioresour. Technol. 2011, 102, 7673–7677. [Google Scholar] [CrossRef]
  10. Kisielewska, M.; Dębowski, M.; Zielińska, M.; Zieliński, Z. Improvement of Biohydrogen Production Using a Reduced Pressure Fermentation. Bioprocess Biosyst. Eng. 2015, 38, 1925–1933. [Google Scholar] [CrossRef]
  11. Motulsky, H.J. Analyzing Data with GraphPad Prism; GraphPad Software Inc.: San Diego CA, USA, 1999; Available online: www.graphpad.com (accessed on 20 November 2024).
  12. Callahan, B.J.; McMurdie, P.J.; Rosen, M.J.; Han, A.W.; Johnson, A.J.A.; Holmes, S.P. DADA2: High-Resolution Sample Inference from Illumina Amplicon Data. Nat. Methods 2016, 13, 581–583. [Google Scholar] [CrossRef] [PubMed]
  13. Quast, C.; Pruesse, E.; Yilmaz, P.; Gerken, J.; Schweer, T.; Yarza, P.; Rg Peplies, J.; Glö Ckner, F.O. The SILVA Ribosomal RNA Gene Database Project: Improved Data Processing and Web-Based Tools. Nucleic Acids Res. 2013, 41, D590–D596. [Google Scholar] [CrossRef]
  14. Mcmurdie, P.J.; Holmes, S. Phyloseq: An R Package for Reproducible Interactive Analysis and Graphics of Microbiome Census Data. PLoS ONE 2013, 8, e61217. [Google Scholar] [CrossRef] [PubMed]
  15. Wickham, H. Ggplot2: Elegant Graphics for Data Analysis; Springer: New York, NY, USA, 2016. [Google Scholar]
  16. Nordberg, Å.; Jarvis, Å.; Stenberg, B.; Mathisen, B.; Svensson, B.H. Anaerobic Digestion of Alfalfa Silage with Recirculation of Process Liquid. Bioresour. Technol. 2007, 98, 104–111. [Google Scholar] [CrossRef]
  17. Lehtomäki, A.; Huttunen, S.; Rintala, J.A. Laboratory Investigations on Co-Digestion of Energy Crops and Crop Residues with Cow Manure for Methane Production: Effect of Crop to Manure Ratio. Resour. Conserv. Recycl. 2007, 51, 591–609. [Google Scholar] [CrossRef]
  18. Krishna, D.; Kalamdhad, A.S. Pre-Treatment and Anaerobic Digestion of Food Waste for High Rate Methane Production—A Review. J. Environ. Chem. Eng. 2014, 2, 1821–1830. [Google Scholar] [CrossRef]
  19. Ren, N.; Liu, M.; Wang, A.; Ding, J.; Li, H. Organic Acids Conversion in Methanogenic-Phase Reactor of the Two-Phase Anaerobic Process. Huan Jing Ke Xue 2003, 24, 89–93. [Google Scholar] [PubMed]
  20. Wang, Y.; Zhang, Y.; Wang, J.; Meng, L. Effects of Volatile Fatty Acid Concentrations on Methane Yield and Methanogenic Bacteria. Biomass Bioenergy 2009, 33, 848–853. [Google Scholar] [CrossRef]
  21. Marchaim, U.; Krause, C. Propionic to Acetic Acid Ratios in Overloaded Anaerobic Digestion. Bioresour. Technol. 1993, 43, 195–203. [Google Scholar] [CrossRef]
  22. Zhang, C.; Su, H.; Baeyens, J.; Tan, T. Reviewing the Anaerobic Digestion of Food Waste for Biogas Production. Renew. Sustain. Energ. Rev. 2014, 38, 383–392. [Google Scholar] [CrossRef]
  23. Otite, S.V.; Lag-Brotons, A.J.; Ezemonye, L.I.; Martin, A.D.; Pickup, R.W.; Semple, K.T. Volatile Fatty Acids Effective as Antibacterial Agents against Three Enteric Bacteria during Mesophilic Anaerobic Incubation. Molecules 2024, 29, 1908. [Google Scholar] [CrossRef] [PubMed]
  24. Wambugu, C.W.; Rene, E.R.; Van de Vossenberg, J.; Dupont, C.; van Hullebusch, E.D. Biochar from Various Lignocellulosic Biomass Wastes as an Additive in Biogas Production from Food Waste. In Waste Biorefinery: Integrating Biorefineries for Waste Valorisation; Elsevier: Amsterdam, The Netherlands, 2020; pp. 199–217. [Google Scholar] [CrossRef]
  25. Taherzadeh, M.J.; Karimi, K. Pretreatment of lignocellulosic wastes to improve ethanol and biogas production: A review. Int. J. Mol. Sci. 2008, 9, 1621–1651. [Google Scholar] [CrossRef]
  26. Chen, S.; Cheng, H.; Wyckoff, K.N.; He, Q. Linkages of Firmicutes and Bacteroidetes Populations to Methanogenic Process Performance. J. Ind. Microbiol. Biotechnol. 2016, 43, 771–781. [Google Scholar] [CrossRef] [PubMed]
  27. Atasoy, M.; Eyice, O.; Schnürer, A.; Cetecioglu, Z. Volatile Fatty Acids Production via Mixed Culture Fermentation: Revealing the Link between PH, Inoculum Type and Bacterial Composition. Bioresour. Technol. 2019, 292, 121889. [Google Scholar] [CrossRef] [PubMed]
  28. Widyasti, E.; Shikata, A.; Hashim, R.; Sulaiman, O.; Sudesh, K.; Wahjono, E.; Kosugi, A. Biodegradation of Fibrillated Oil Palm Trunk Fiber by a Novel Thermophilic, Anaerobic, Xylanolytic Bacterium Caldicoprobacter sp. CL-2 Isolated from Compost. Enzym. Microb. Technol. 2018, 111, 21–28. [Google Scholar] [CrossRef] [PubMed]
  29. Guo, H.G.; Li, Q.; Wang, L.L.; Chen, Q.L.; Hu, H.W.; Cheng, D.J.; He, J.Z. Semi-Solid State Promotes the Methane Production during Anaerobic Co-Digestion of Chicken Manure with Corn Straw Comparison to Wet and High-Solid State. J. Environ. Manag. 2022, 316, 115264. [Google Scholar] [CrossRef] [PubMed]
  30. Jiang, Y.; Dennehy, C.; Lawlor, P.G.; Hu, Z.; McCabe, M.; Cormican, P.; Zhan, X.; Gardiner, G.E. Exploring the Roles of and Interactions among Microbes in Dry Co-Digestion of Food Waste and Pig Manure Using High-Throughput 16S RRNA Gene Amplicon Sequencing. Biotechnol. Biofuels 2019, 12, 5. [Google Scholar] [CrossRef] [PubMed]
  31. Koo, T.; Yulisa, A.; Hwang, S. Microbial Community Structure in Full Scale Anaerobic Mono-and Co-Digesters Treating Food Waste and Animal Waste. Bioresour. Technol. 2019, 282, 439–446. [Google Scholar] [CrossRef]
  32. Moestedt, J.; Westerholm, M.; Isaksson, S.; Schnürer, A. Inoculum Source Determines Acetate and Lactate Production during Anaerobic Digestion of Sewage Sludge and Food Waste. Bioengineering 2019, 7, 3. [Google Scholar] [CrossRef]
  33. Ghosh, P.; Kumar, M.; Kapoor, R.; Kumar, S.S.; Singh, L.; Vijay, V.; Vijay, V.K.; Kumar, V.; Thakur, I.S. Enhanced Biogas Production from Municipal Solid Waste via Co-Digestion with Sewage Sludge and Metabolic Pathway Analysis. Bioresour. Technol. 2020, 296, 122275. [Google Scholar] [CrossRef] [PubMed]
  34. Meng, X.; Cao, Q.; Sun, Y.; Huang, S.; Liu, X.; Li, D. 16S RRNA Genes- and Metagenome-Based Confirmation of Syntrophic Butyrate-Oxidizing Methanogenesis Enriched in High Butyrate Loading. Bioresour. Technol. 2022, 345, 126483. [Google Scholar] [CrossRef] [PubMed]
Figure 1. Biogas production (A) and pH and FOS/TAC ratio (B) in the sludge during anaerobic digestion operated at 2 kg VS/(m3·d), 3 kg VS/(m3·d), and 4 kg VS/(m3·d). The data present the average of three replicates of daily measurements.
Energies 18 00575 g001
Figure 2. The concentration of VFAs during 24 h of digester operation in S1 (2 kg VS/(m3·d)) (A), S2 (3 kg VS/(m3·d)) (B), and S3 (4 kg VS/(m3·d)) (C) measured by GC-FID. The data present the average of three replicates of daily measurements.
Energies 18 00575 g002aEnergies 18 00575 g002b
Figure 3. The Shannon and Simpson indices in the samples collected at the end of S1, S2, and S3.
Energies 18 00575 g003
Figure 4. The relative abundance of phylum in the sludge samples collected from S1, S2, and S3.
Energies 18 00575 g004
Figure 5. The relative abundance of genus in the sludge samples collected from S1, S2 and S3.
Energies 18 00575 g005
Table 1. Characteristics of the substrate and technological conditions of the study.
Ratio of Silage/Cattle Manure/Water
(Fresh Mass kg) (±2%)
Silage/Cattle Manure
(Dry Mass kg % of Fresh Mass)
Silage/Cattle Manure
(Dry Organic Mass % of Dry Mass)
Organic Load
(kgVS/(m3·d))
Hydraulic Retention Time
(d)
Serie 1 (S1)3.0/1.5/1.532% ± 1%/10% ± 1%90% ± 5%/85% ± 4%250.0
Serie 2 (S2)4.5/2.25/2.25337.5
Serie 3 (S3)6.0/3.0/3.0425.0
Disclaimer/Publisher’s Note: The statements, opinions and data contained in all publications are solely those of the individual author(s) and contributor(s) and not of MDPI and/or the editor(s). MDPI and/or the editor(s) disclaim responsibility for any injury to people or property resulting from any ideas, methods, instructions or products referred to in the content.

