Article

Use of Kinetic Parameters from Thermal Analysis for Balancing Free Energy of Activation Based on Calcite Decomposition

Institute of Energy and Fuel Processing Technology, Zamkowa 1, 41-803 Zabrze, Poland
*
Author to whom correspondence should be addressed.
Energies 2025, 18(3), 570; https://doi.org/10.3390/en18030570
Submission received: 29 November 2024 / Revised: 10 January 2025 / Accepted: 23 January 2025 / Published: 25 January 2025
(This article belongs to the Section J: Thermal Management)

Abstract

:
Based on the literature data, including our published paper on the thermal decomposition of solids, research regarding the possibility of balancing free energy of activation against Gibbs free energy was extended. The importance of nucleation accompanying the thermal decomposition reaction/process was established. For calcite, a symmetrical model was considered for the formation of the active state, followed by the formation into the solid, crystalline decomposition product CaO. When the decomposition is chemical in nature, we do not identify nucleation processes. This is determined by the forwards–backwards balance compatibility, and when an additional term appears, a reversible structural transformation is to be expected. An excess free energy model was proposed to determine the rate constant of activation. It is shown that the results of tests under dynamic conditions allow, with a good approximation, the determination of this quantity as tending towards a maximum rate constant equal to the Arrhenius pre-exponential factor. The solid product of the thermal decomposition of calcite is of great developmental importance, currently utilized for Calcium Looping (CaL) or for Carbon Capture and Storage (CCS) technologies using a reversible reaction of carbonation.

1. Introduction

In terms of the problems of kinetic considerations, the discussion generally boils down to an analysis of the choice of how to implement the reaction/process in relation to the mathematical formalism. In other words, whether the kinetic model adopted corresponds to the observed macroscopic changes in time, temperature, or, less commonly, pressure, and, going further, whether we can infer the mechanism and the possibility of beneficial process changes.
At the fundamental level, by citing definitions related to reaction/process kinetics according to the Gold Book, the above proportionality factor is referred to as the (n-th order) “rate coefficient”. Rate coefficients related to (or considered to relate to) elementary reactions are called “rate constants” or, more appropriately, “microscopic” (hypothetical, mechanistic) rate constants. The (overall) order of a reaction cannot be deduced from measurements of the “rate of appearance” or “rate of disappearance” at a single concentration value of a species whose concentration remains constant (or effectively constant) during the course of the reaction. For example, if the overall reaction rate is determined by [1]:
v = k [ A ] n A [ B ] n B
Equation (1) relates the reaction rate (appearance or disappearance) to the current concentration/fraction of components [A, B]. Equation (1) suggests an elementary and irreversible reaction/process pathway. In chemical engineering, the conversion degree of a selected substrate becomes more significant. Without assigning a specific expression to the scalar v , the proportionality factor in Equation (1), referred to as the rate constant, will be expressed in units which are dependent on the choice of all variables. When using a dimensionless conversion degree, the rate constant takes on the dimension of reciprocal time. For the purpose of determining further factor-specific effects on the reaction/process pathway, it is essential to specify the thermodynamic state, temperature, pressure, stoichiometric relationships, initial concentrations/fractions, as well as the nature of any accompanying physical processes.
Thermal analysis is overwhelmingly associated with decomposition or pyrolysis processes. In this respect, thermogravimetric analysis (TGA) and differential scanning calorimetry (DSC) of solids are invaluable. In TGA analysis, a distinction is made between dynamic, i.e., linear temperature rise, and, less frequently, isothermal tests at atmospheric or reduced (vacuum) pressure, or, more rarely, increased pressure.
For isothermal conditions in the kinetic conversion degree category, the starting point for Equation (1) is the expression [2,3]:
d α d t = k f α [ 1 exp ( Δ G R T ) ] , T = const
where:
Δ G = R T l n K α K , for   K α K ,   then   Δ G   0 ,   J · mol 1
and ∆G is Gibbs free energy.
The substitution of Equation (3) to Equation (2) leads to the form:
d α d t = k f α [ 1 K α K ]
In Equations (3) and (4), K is the thermodynamic equilibrium constant, while Kα is of the same mathematical structure as the constant in the denominator but refers to the current conversion degree. The expression [ 1 K α K ] = DFE (Distance From Equilibrium) represents distance from equilibrium or far from equilibrium. For isothermal thermal dissociation processes of compounds in the solid state carried out at high temperatures, the assumption of small conversion degrees of DFE → 1, and, for kinetic considerations, the assumption of DFE = 1, are commonly used. This scale is absorbed by the other quantities in the equation. For dynamic (non-isothermal) conditions, the situation is different because, with increasing temperature, DFE varies. It is worth using this approach, especially when considering a type of reversible reaction that is independently parallel as forwards–backwards.
When Kα = K, then ∆G = 0, which implies the classical expression for an equilibrium reaction/process:
Δ r G = R T l n K
The relationships between Equations (2)–(5) and DFE will be used further on.

2. Theory

A universal proposal for the kinetic constant vs. temperature is the Arrhenius equation:
k = A e E / R T
but there are also proposals to take into account the relationship between the pre-exponential factor and temperature [2,3,4,5,6]:
A     T b
In Equation (7) the exponent b takes the values −1.5 to 2.5, with Equation (6) still being valid for b = 0.
In particular, the exponent b = 1 is very important, because linking Equation (6) with the concept in (7) leads to a mathematical form of rate constant, which may suggest Transition-State Theory (TST). TST explains the reaction rates of elementary chemical reactions. The theory assumes a special type of chemical equilibrium (quasi-equilibrium) between reactants and activated transition state complexes [7].
k T S T = k B h T e Δ G + R T
where:
Δ G + = Δ H + T Δ S +   J · mol 1
In Equation (8), the transmission coefficient is omitted by taking χ = 1 [8] and writing the universal constant as B = k B h = 2.08364∙1010 (K∙s)−1. Then, one can compare the approach according to Equation (6) with Equation (8) formally as a mathematical formula. Thus:
A e E / R T = B T e Δ G + R T
In Equation (10) there is a slight formal symmetry due to temperature: on the right it occurs twice, as a directly proportional quantity and in the exponent as a 1/T stimulus. On the left-hand side, the pre-exponential factor is not a universal quantity and is variable depending on the reaction/process being analyzed, while on the right-hand side the constant is the fundamental approach. However, the main difference is in the essence of the reaction/process pathway itself. The left-hand side covers the time scale to the end of the reaction/process in the sense of the depletion of substrates or the deceleration of progress (in other words: finite time), while the right-hand side covers the time scale for the active state. The precise time-scale definition of this thermodynamic state is not known. Linking Equation (6) with (8) also leads to an approach that links the rate constant to the Gibbs free energy of activation under the assumption that k = kTST:
Δ G + R T = l n B T k
It is important to remember that the TST proposed in Eyring’s 1935 source paper [9] was approximated for practical use in further work [8,9,10,11,12,13] and the relevant models are presented in Equations (8) and (9). In Equation (11), we introduce rate constants for both forwards (→) or backwards (←) reaction/process runs as long as the activation conditions are maintained, i.e., isothermality, reversibility according to Ist kinetics, and low molecular weight substrates, which suggest a gas phase. Thus, the existing maximum reaction rates of the solid phase under dynamic conditions are an element that has emerged with the development of thermogravimetric techniques. Current computational fluid mechanics techniques allow us to go beyond conventional paradigms. Fluid mechanics has evolved by computational fluid dynamics (CFD) techniques to enable scientists and engineers to simulate and analyze fluid flow in a geometric setting [14]. In addition, density functional theory (DFT) calculations make use of the surface of the monocrystals [15]. Thus, DFT enables the calculation of the rate constants of a run abbreviated as forwards–backwards, which requires the calculation of rotational, vibrational, and translational energy partition functions [15].
Using Equations (6), (9) and (11) in reference to the derivations of [8,16], the analytical forms for the activation function are as follows:
Δ G + = E + R T l n ( B T A )
Δ H + = E R T + Δ n + R T
Δ S + = R [ ln A B T 1 + Δ n + ]
where Δ n + is the change in the number of molecules between the active state (always assumed to be 1) and the substrates. In the case of the reaction/process A s = B s + C ( g ) and A s = C ( g ) , Δ n + = 0 after considering this relation and assuming that ERT, then Equation (12) takes the form:
Δ G + = E T Δ S +
where [8]:
Δ S + = R ln A B T
In considerations involving thermodynamic activation functions, the comparison of Equations (6) and (8) requires the acceptance of certain a priori assumptions, as well as the interpretation of the proportionality factor at product (RT).
The basic assumption is the relationship between the thermodynamic equilibrium constant and the rate constant ratio for forwards–backwards reactions after bilateral logarithmization:
l n K = l n k 1 l n k 1
According to Equation (11) and the derivations [16,17], Equation (17) reduces to the simplest balance:
Δ r G = Δ G + Δ 1 G +
In the special case where Δ r G = 0, then Δ G + = Δ 1 G + , which, at isoconversion temperature, implies the equation [17]:
E E 1 = R T e q l n A A 1 = T e q Δ S = Δ r H

3. The Aim of the Work

While Equations (1)–(19) can be considered as formulations that are generally known, the formulations of Equation (17) after transformation to Equation (18) [16] need to be developed to the extent that the compatibility of the latter formulation sufficiently exhausts the relationship between the different levels of free energy.
In Equation (11) there is a rate constant, but it is not known in this treatment whether it is a quantity dimensioned as the inverse of time (s−1) and determined from Equation (1) or from Equation (4), or directly from the Arrhenius law in Equation (6). In turn, in the balance of Equation (18), the existence of additional terms of this equation or directly of a constant quantity cannot be excluded.
The aim of this paper is to balance free energy, taking into account structural transformations in the solid phase using the example of the thermal dissociation (decomposition) of calcite. This is a more recent treatment of the problem compared to [16] and allows for a more complete understanding of the forwards–backwards relationship.

4. The Concept of Free Energy Activation According to Equation (11)

Equation (19) provides a basis for considering whether the determined kinetic parameters for the forwards–backwards reaction/process are satisfied within the experimental error limit. Formally, however, Equation (19) is the relationship between Arrhenius kinetic parameters with reference to thermodynamic equilibrium functions, with the particular meaning of k1 = k−1 arising from Equation (17) for K = 1. An issue with the possibility of using Equation (18) was presented in the works [16,17], providing a closer look at the solid phase decomposition in this approach.
Let us note, following Laidler and King [18], an interesting concept of the relationship between phenomenological thermodynamics and activation thermodynamics, namely:
l n K = Δ r G R T ,   l n k 1 = Δ G + R T + C 1 ,     l n k 1 = Δ 1 G + R T + C 1
When we use Equation (20), then the notation of Equation (17) is enriched with a temperature term:
Δ r G = Δ G + Δ 1 G + + R T Δ C ,       Δ C = constant
This term disappears when Δ C = C 1 C 1 = 0 and then Equation (18) is reproduced. However, it can be assumed that Δ C = C 1 C 1 = l n k n k 1   , and so Equation (18) takes the form:
Δ r G = Δ G + Δ 1 G + + R T l n k n k n
Given the possibilities of determining the reaction/process pathway of Equation (22), then we can write the term representing the solid-phase transformation by the temperature-dependent nucleation process as:
Δ r G = Δ G + Δ 1 G + + Δ n G
In Equation (23), the meaning of the free energy symbols are as follows: ∆rG—of reaction; ∆G+, ∆−1G+—of activation forwards and backwards, respectively; and ∆nG—of nucleation.
From the concept of Equation (18), it is implied that in the solid-phase course of a reaction/process [A] ↔ [B], the substrate [A] reacts to such a form of compound [B] that represents such a state of structural organization that in the reaction/process with gas, the state of the initial compound [A] returns. In the case of solid-phase decomposition, such a return is not always possible; for example, the heterophase Boudouard–Bell reaction (Figure 1 in [19]) confirms that an amorphous form of compound [A] is obtained in a reversible reaction/process when considering the strictly defined crystalline starting state of substrate [A] (hexagonal graphite). In turn, in Equation (23), the introduced last term is the resultant, which is described by the activated nucleation process:
Δ n G = Δ n G + Δ n G +
in which the nucleation term is the difference in the nucleation activation (∆nG+) and deactivation process (∆nG+).
These considerations lead to the thesis that the excess free energy (∆GE) of the reaction/process activation is:
Δ G E = 0
which could be understood as an energy state:
G B E G A E = 0
but could also be another possibility, e.g.,
G B + E G A E = G m a x E ,   when   G A E = 0
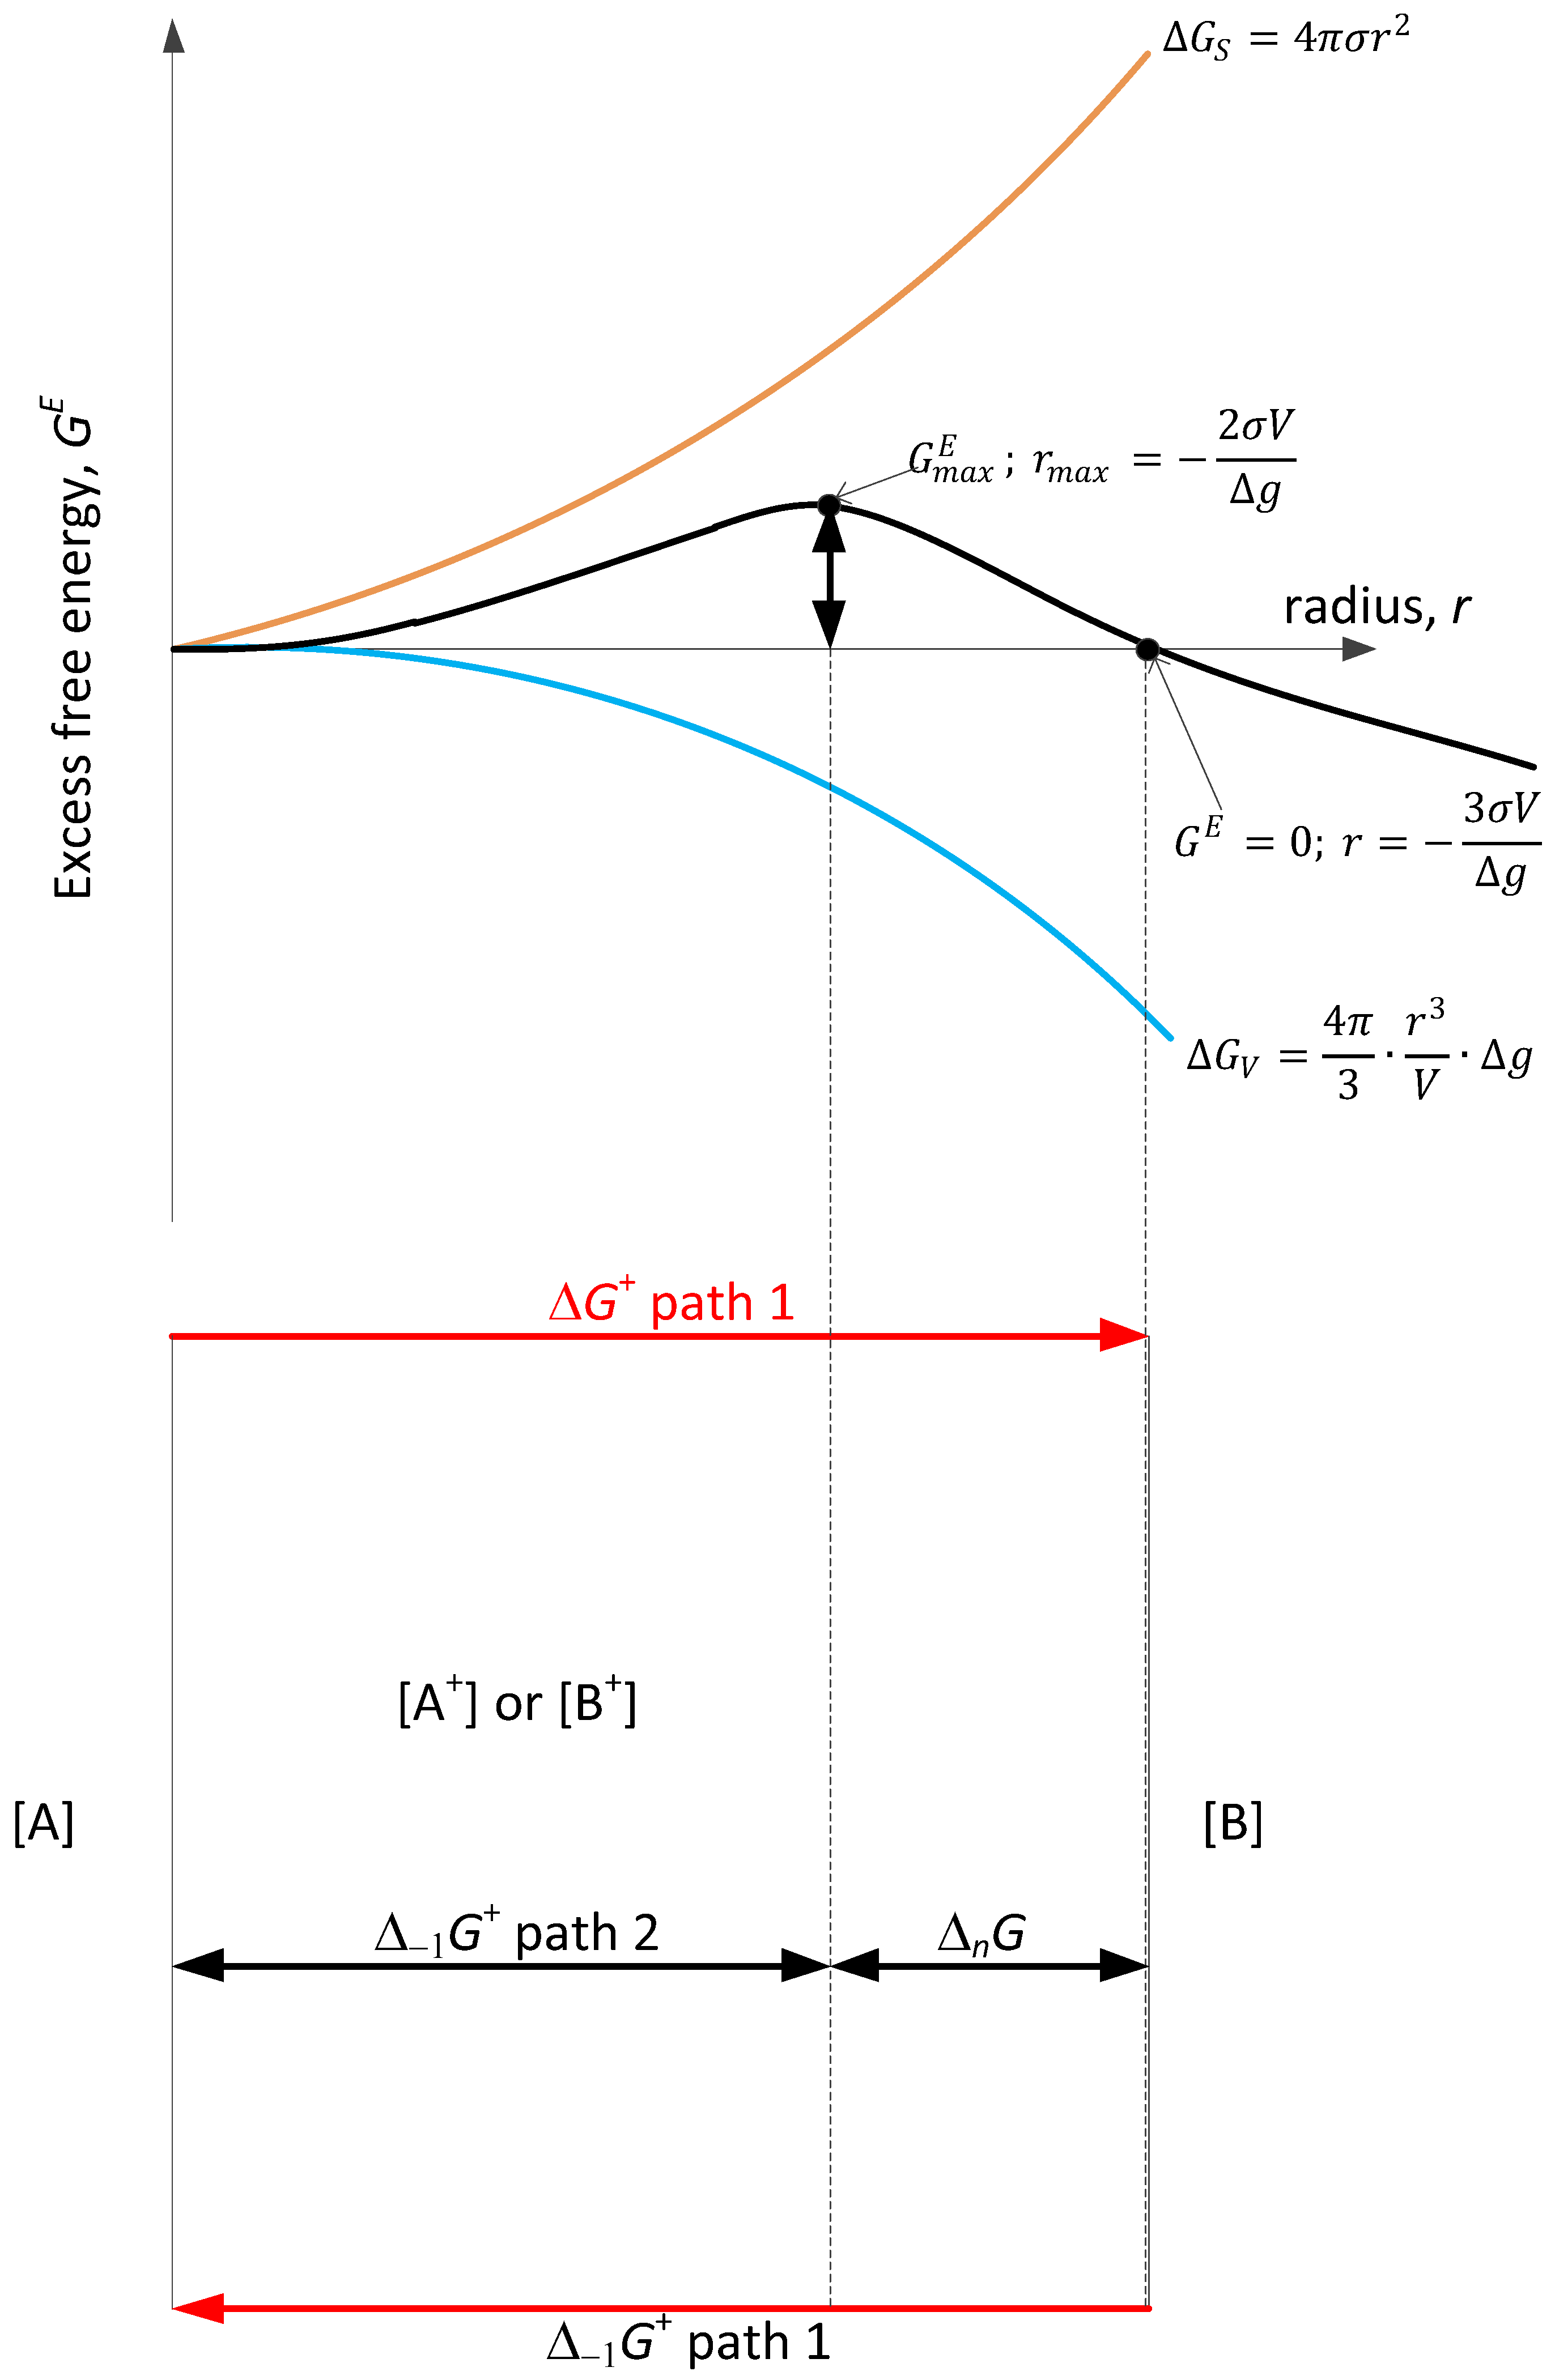
which implies the formation of a crystalline spherical form with a maximum radius r (r ∝ 2), but also, when GE = 0, the radius can be larger than the G m a x E calculation implies (r ∝ 3). A graphical illustration is given in Figure 1 where the meaning and scope of using the symbols are proposed.
Based on the works [20,21,22,23] and shown in Figure 1, the following equation represents the rate of nucleation constant and captures the Arrhenius law structural formula:
k n = A n exp G m a x E k B T · f Θ ,   s 1
and the excess free energy results from the difference in the phase transformation energy of the plane form into the spatial form.
The maximum excess free energy is expressed by a formula in which the radius for the spatial form no longer appears (∆g in J):
G m a x E = 16 π σ 3 V 2 3 ( Δ g ) 2 ,       Δ g = k B T l n S ,     S = P e q P i , P e q P i
In the special case for Equation (29), the existence of the inequality P e q P i is of little significance, since the denominator in this formula is squared. The derivation and additional information on the free energy according to Equation (3), ∆g, and supersaturation S are presented in Appendix A.
Heterogeneous nucleation is related to the apparent contact angle Θ between the embryo phase by the expression f(Θ) appearing in Equation (30) [22,23]:
f Θ = ( 2 + s i n Θ ) ( 1 c o s Θ ) 2 4
For homogeneous spontaneous nucleation Θ = 180 °C and f(Θ) = 1, while for heterogeneous nucleation the angle Θ is below 90 °C [20,21,22,23]. In Equation (29), according to Figure 1, there are two extremes under isothermal conditions: G E = 0. There is also no transformation of the plane surface into a spatial form (r = 0) as would formally be expected, but when ∆g → ∞, then the constant rate of nucleation (kn) is maximal and at the same time limiting or asymptotic:
k n = A n
so that the component in Equation (24) is analogous to Equation (11):
Δ n G + = R T l n B T A n = constant ,   when   T = constant
In the second case, G E     G m a x E     , and thus under equilibrium conditions ∆g = 0, kn → 0, which implies a chronically slow nucleation process in relatively infinite time 1/kn = ∞, producing a radius of infinite size rmax = ∞; however, this is on the nanometric (10−9 m) scale. The slower the process, the longer and longer it takes for nucleation to occur, and the paradox lies in the fact expressed by Equation (31), because the maximum rate constant of nucleation does not at all analytically guarantee the observation of this process, which is due to the reversibility of the structural transformations.
From a kinetic point of view, in considering Equation (29), the ∆g ∝ lnS becomes particularly important. For supersaturation S = 1, the process time is infinite, and for S = 3 it is 103 years, while already for S = 4 it is equal to 10−13 s [20]. For example, for S = 4, this implies P i = ( 1 / 4 ) P e q , and for T = 1000 K, ∆g = 1.914∙10−23 kJ, which is equal to ∆G = 11.53 kJ∙mol−1. The conversion follows from the known relationship between the constants R = kBN, where N = 6.022∙1023 mol−1 is the Avogadro number. Therefore, the formal notation ∆g → ∞ should be restricted by supersaturation to the assumption S ≫ 1, but without specifying its maximum value. As experience teaches, the theoretical analysis compared to the experiment indicates a “collapse of the nucleation rate”, as confirmed by [20]. The balance expressed by Equations (23) and (24) should be considered for two possibilities: omitting the term ∆nG = 0 or accepting Equation (32).

5. Thermal Decomposition of Calcite

5.1. The Simplest Decomposition Model

The solid product of the thermal decomposition of calcite is of great developmental importance, currently for use in Calcium Looping (CaL) [24,25,26,27,28] or for Carbon Capture and Storage [23] technologies using a reversible reaction:
CaCO3(s) ↔ CaO(s) + CO2(g)
It is a topochemical reaction, i.e., taking place in the solid phase, and in a closer definition is pseudomorphic and topotactic [29], which is related to the partial polymorphic transformation to vaterite described by Maciejewski et al. [30]. The most important problems related to the discussed field are due to the works on the reliability of the determined kinetic parameters [31,32,33,34,35,36,37,38,39,40,41,42,43], the effect of sample mass [34,41], the presence of the reaction/process atmosphere (inert, CO2, vacuum) [31,32,44,45,46], the atmosphere related to the equilibrium pressure of CO2 [35,45,47,48,49,50] or to the equilibrium atmospheric water vapor [51], and the structure of CaCO3 in relation to CaO [23,26,28,36,45,48,52,53], with particular consideration of the crystallographic transformation of CaO+/CaO [23,36,48,52,53]. The effect of CO2 sorption on the reaction/process according to the Langmuir–Hinshelwood model is presented in works [35,47], and the approach to the reaction/process mechanism (33) was undertaken in works [23,30,35,36,37,42,45,47,49,50,53,54,55]. For the reversible reaction (backwards ←), on the other hand, there is increasing work in this area, taking into account the initial CaO structure [28,56,57,58,59,60,61,62]. The characteristic feature is the reaction/process rate, with a clear division into two compartments taking into account the initial porosity for the fast reaction and the deceleration or chronicity, with a move towards a “plateau”. In this range, the cyclicity, the frequency of the full cycle (33) [28,60], and, above all, the temperature variation—high for calcination and much lower for carbonation—are important for CaL. The course of the reaction/process of calcination from left to right according to (33) requires that the partial pressure CO2 in the gas phase satisfies the condition (Peq > Pi). In the opposite direction, the carbonation reaction/process is conducted in an excess of CO2.
In the special case under equilibrium conditions, according to Equation (38), the reaction rate is 0. It has been shown that the activation energy is then negative [48] and calcination in a CO2 atmosphere leads to very high activation energies of E > 2000 kJ∙mol−1 [46]. In the time section, the reaction/process (33) has been studied for many years in the simplest approach with the active state indicated [23]:
CaCO 3   k 1     k 1 CaO + + CO 2 ,   CaO + k n     k n CaO

5.2. Thermal Decomposition for Variable Carbonation Activation Energies

Moving on to the analysis of Equations (18) and (22), it is necessary to refer to the work of [16], in which the concept of using Equation (18) for several solid salts, including calcite, was presented. We returned to the analysis of this case again, separating the kinetic data from the literature into two sets analyzing the course of the reaction/process (33) towards carbonation. In the first case, CaO was obtained by preparative decomposition using the Pechini method and starting from Ca(NO3)2 in a citric acid and ethylene glycol environment, which leads to a homogeneous CaO product of high crystallinity with dimensions in the nanomaterial scale. For carbonation, the following values were obtained: E 1 = 17.52 kJ∙mol−1, l n A 1 / s 1 = −3.238 [27]. According to the methodology adopted in [16], these data lead to the component Equation (18) for the temperature range 923–1023 K (650–750 °C):
Δ 1 G + = 9.44 + 0.290 T ,   kJ · mol 1 ,   for   E 1 low
For this quantity from the remaining two expressions, Equation (35) assumes the following coefficients (from the difference of the equations, see Table 1 for calcite in [16]):
Δ 1 G + = 185.55 + 0.132 T 174.92 + 0.150 T = 10.63 + 0.282 T ,   kJ · mol 1
The difference between Equations (35) and (36) is within the error limit and is of the order ∆ = ±8 ∙ 10−3∙T kJ∙mol−1, but it should be emphasized that the data for the reaction/process (33) refer to completely different sources for the substrates, i.e., for the thermal decomposition/synthesis of CaCO3. From the plethora of possibilities in [16], we selected E = 191.0 kJ∙mol−1, lnA/s−1 = 15.4; the DFT method was then used to determine E = 184.68 kJ∙mol−1, lnA/s−1 = 14.084 [23].
In resolving the question under discussion about the determined error, referring to the notation Equation (19) and the center point Teq = 1166.13 K [16], we obtain the following for the data given in [31] and using this approach, respectively: ∆rH = 167.2/173.5 kJmol−1, ∆rS = 143.3/148.8 J∙(mol∙K)−1. In [63], the average values are ∆rH = 170 kJ∙mol−1, ∆rS = 145 J∙(mol∙K)−1.
Accepting the proof included in Equation (18) and in Figure 1, which corresponds to reaction/process pathway 1, i.e., the description according to Equation (25), there is also no reason to apply Equations (23) and (24). Also, the conclusion concretized that thermogravimetric studies, even under dynamic conditions, lead to Arrhenius kinetic parameters that can be used in the TST model.
In turn, for other synthesis data from CaO, based on data from Lee [58] who recalculated older data [56,57], the following was assumed: E 1 = 70.56 kJ∙mol−1, l n A 1 / s 1 = 4.945. As before, based on Equation (19), we obtained the following: Δ r H = 191−70.56 = 120.4 kJ∙mol−1 and Δ r S = Δ r H T e q = 103.3 J∙(mol∙K)−1, which can be considered much lower than the expected values. The underestimated thermodynamic values are included in the omitted term ∆nG. It is necessary to reanalyze Equation (23) instead of Equation (18), which is expressed by the free energy of activation for the reversible reaction:
Δ 1 G + = 63.04 + 0.221 T ,   kJ · mol 1 ,   for   E 1 high
and allows the nucleation term to be determined from Equation (23):
Δ n G = 52.41 0.061 T ,   kJ · mol 1 ,   T e q = 859.18   K
In Equation (38), the coefficients are related to the average enthalpy ( T 2 ( Δ n G T ) T = Δ n H = 52.41 kJ∙mol−1) and entropy ( Δ n G T = Δ n S = −61.0 J∙(mol∙K)−1). When these values are added to the previous calculations, we obtain in the balance according to Equation (23): Δ r H = 172.8 kJ∙mol−1, Δ r S = 164.3 J∙(mol∙K)−1, compared to other data [32,64] ( Δ r H =178 kJ∙mol−1, Δ r S = 160 J∙(mol∙K)−1). It thus remains to determine for Equation (38) its components according to Equation (24).
The rate constant for nucleation is included in Equation (28), together with Equation (29) for the same data, as adopted in [23] by converting the Boltzmann constant into the universal gas constant, and we obtain after logarithmization:
l n k n = l n A n 9.110 · 10 10 T ( Δ G ) 2
where Δ G is expressed in J∙mol−1.
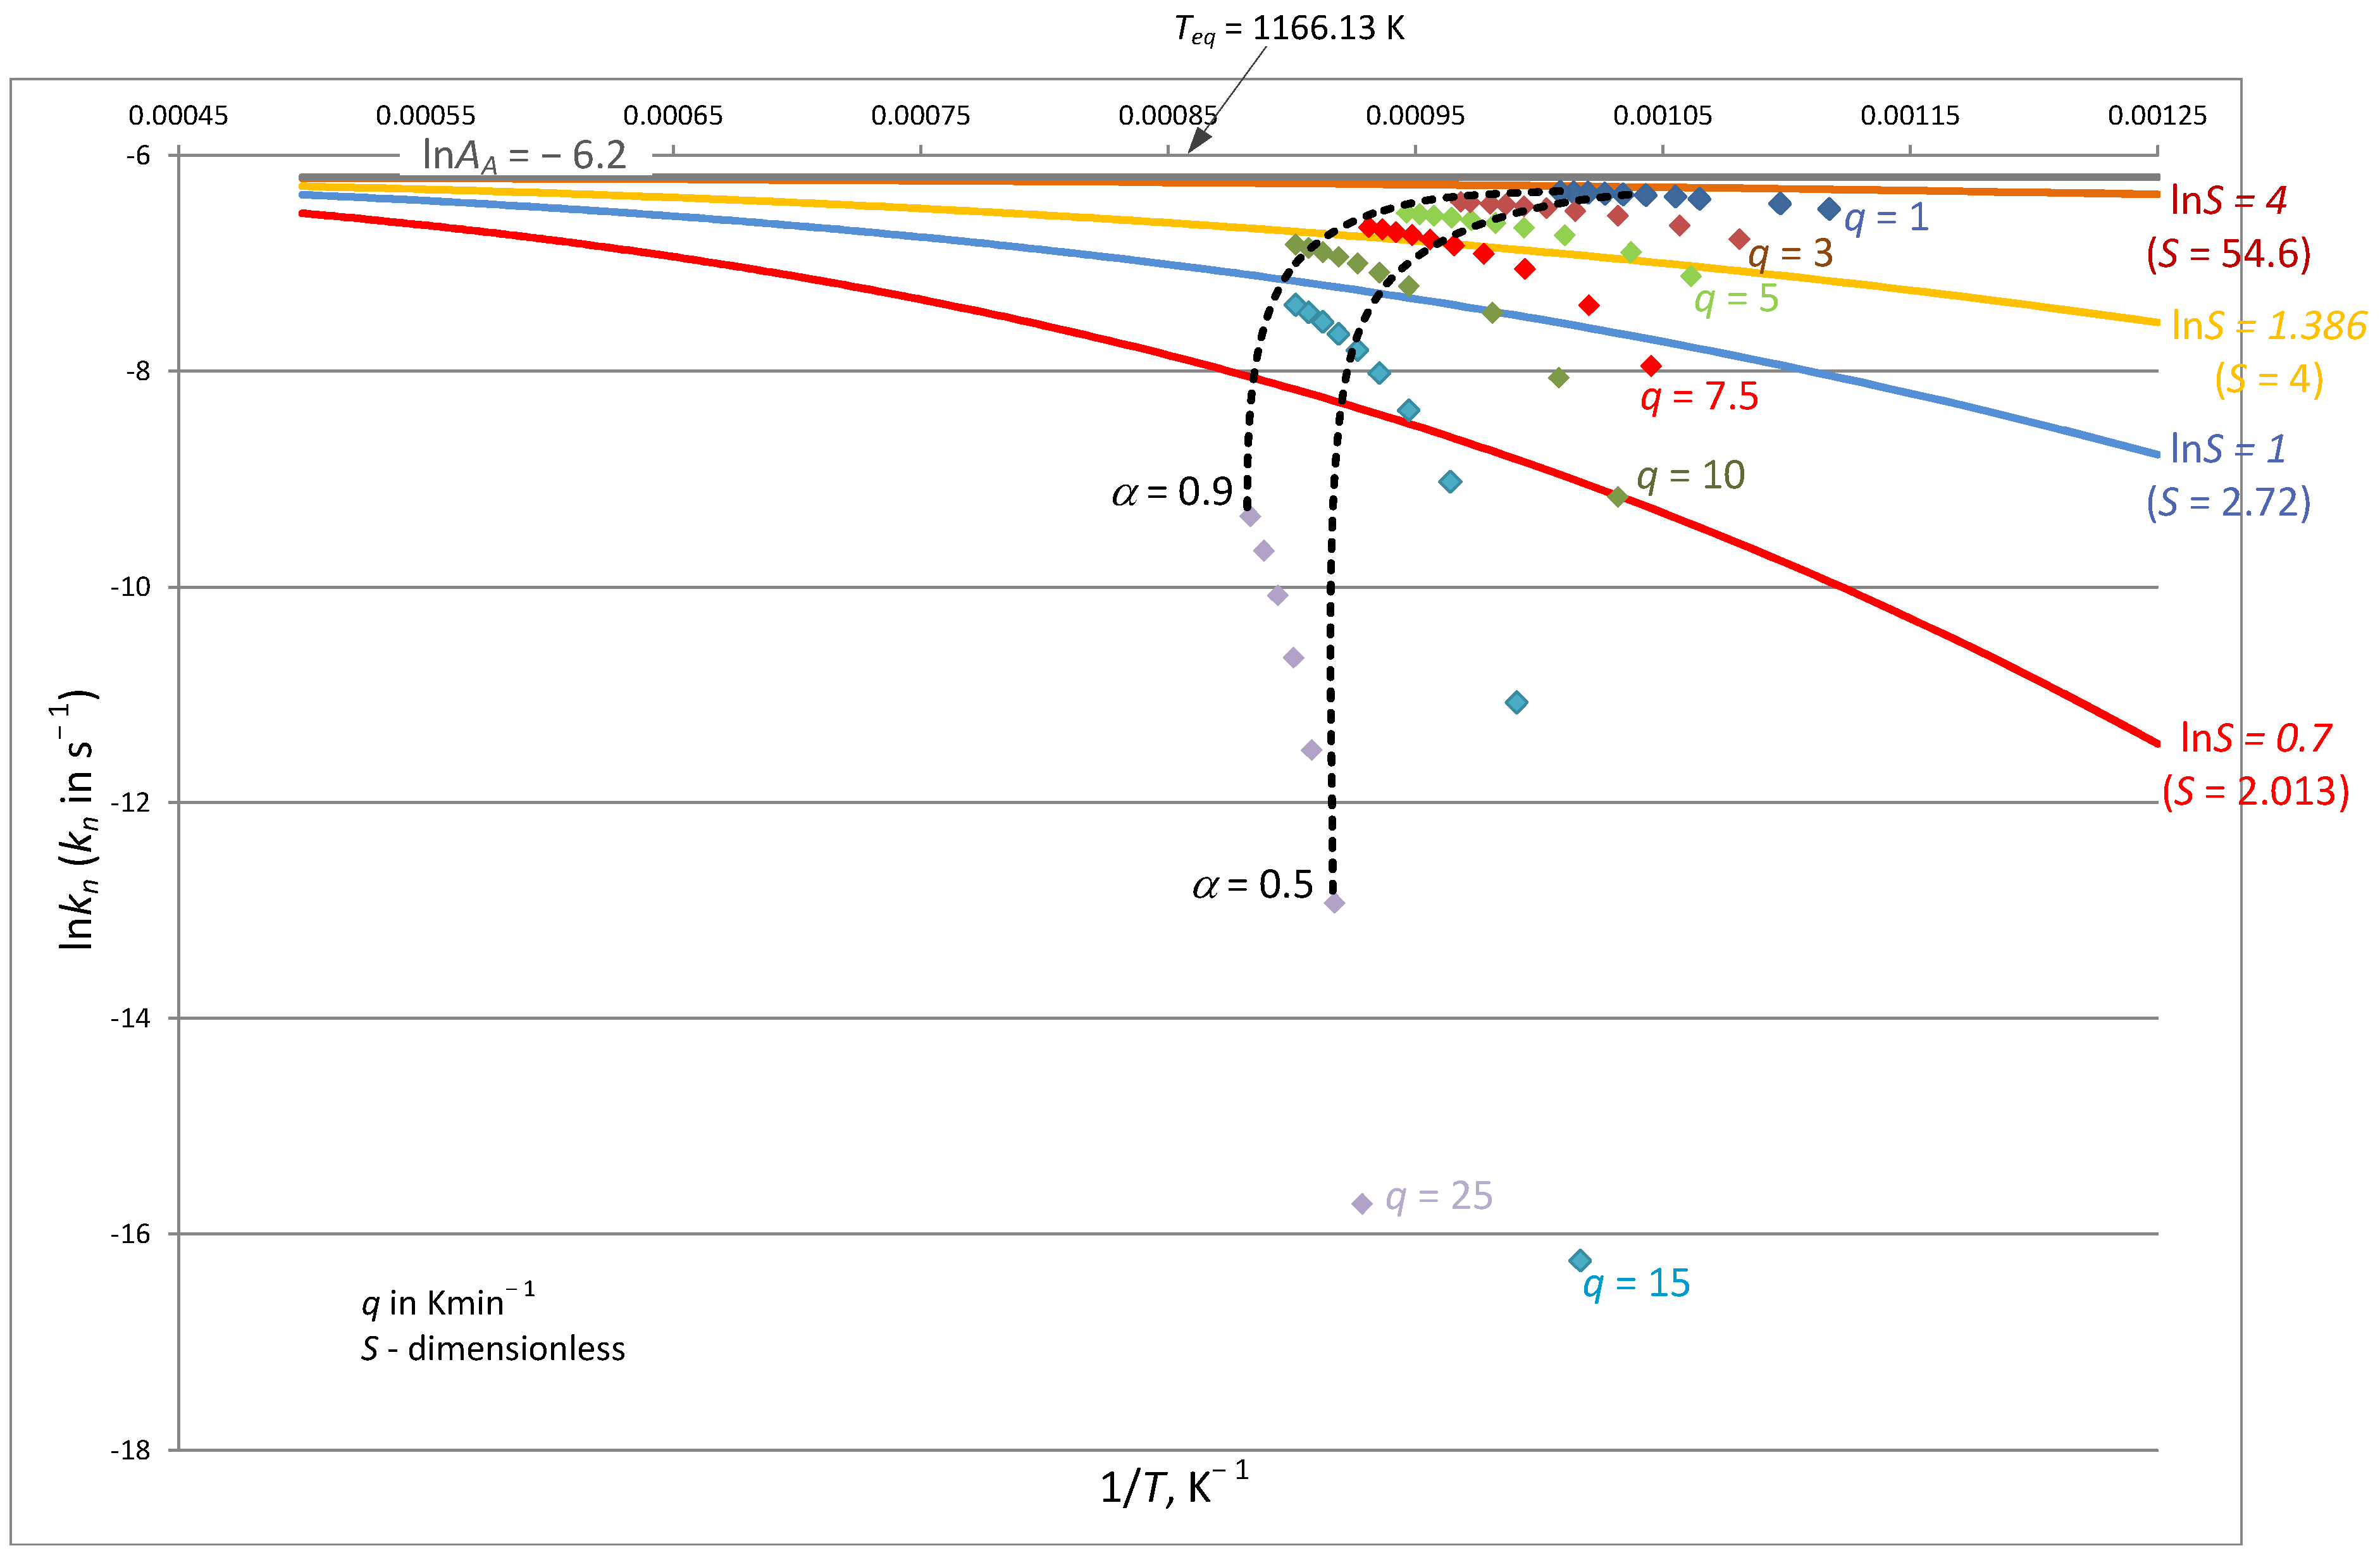
A graphical approach of Equation (39) as an Arrhenius relationship is presented in Figure 2. In addition, the experimental data presented in [63] are used, which allows for confrontation of the nucleation model for theoretical data and those obtained under dynamic conditions. The continuous lines represent the theoretical model according to Equation (39) for isothermal conditions and for the assumed supersaturation. The higher the temperature, the closer the lines approach the equality assumed from the analysis [23]: k n = A n = e x p ( 6.2 ) = 2.03∙10−3 s−1, as written in Equation (31). In contrast, the experimental points corresponding to the varying heating rates were derived from thermogravimetric measurements under dynamic conditions. The relationship used here is for the free energy according to Equation (B5) (Appendix B).
Very often in studies of the thermal stability of calcite, the first-principles condition α < αeq is not retained, meaning that ∆G > 0, and this fact remains irrelevant since the magnitude occurs in quadrature. The expression (∆G)2 loses its criterion significance but brings quantitative information about the potential for nucleation. Figure 2 suggests to assume low heating rates under dynamic conditions so that lnkn = −6.2 ÷ −7. For higher heating rates, the ∆n component of ΔnG in Equation (23) can be neglected. Figure 2 clearly shows the non-linear relationship between the variables of the Arrhenius law, which translates the variation of the activation energy from the temperature and from the heating rate, and thus also from the conversion degree. Under non-equilibrium conditions, and thus also under dynamic conditions, there is a need for the stepwise determination of free energy at individual nodes [65]. The interpretation of the observations must be based on boundary conditions or contrast parameters. Under these conditions, ignoring the large heating rates, the full decomposition (α = 1) is reached up to temperature T = Teq = 1166.13 K, and for low heating rates is close to the horizontal asymptote An. For An = constant, the activation energy is equal to E = 0 and thus GE = 0 (Figure 1), and thus also G m a x E = 0, i.e., we do not observe nucleation in the model sense, but only the component responsible for the transition from the active state to the product ∆nG. The contrast can be expressed in such a way that the formation of a radius r > 0 ( G m a x E > 0) requires an increasingly lower rate constant, and thus E → ∞, with an associated infinitely long process time.
In Equation (32), after contributing the maximum rate constant of nucleation in the form l n k n = l n A n = −6.2 (kn in s−1) and recalculation in the temperature range 800–1300 K, we obtain:
Δ n G + = R T ( l n B T l n A n )   = 8.55 + 0.315 T ,   kJ · mol 1
Returning to Equation (24) and subtracting the sides of Equation (38) from Equation (40), we obtain:
Δ n G + = 60.96 + 0.376 T ,   kJ · mol 1
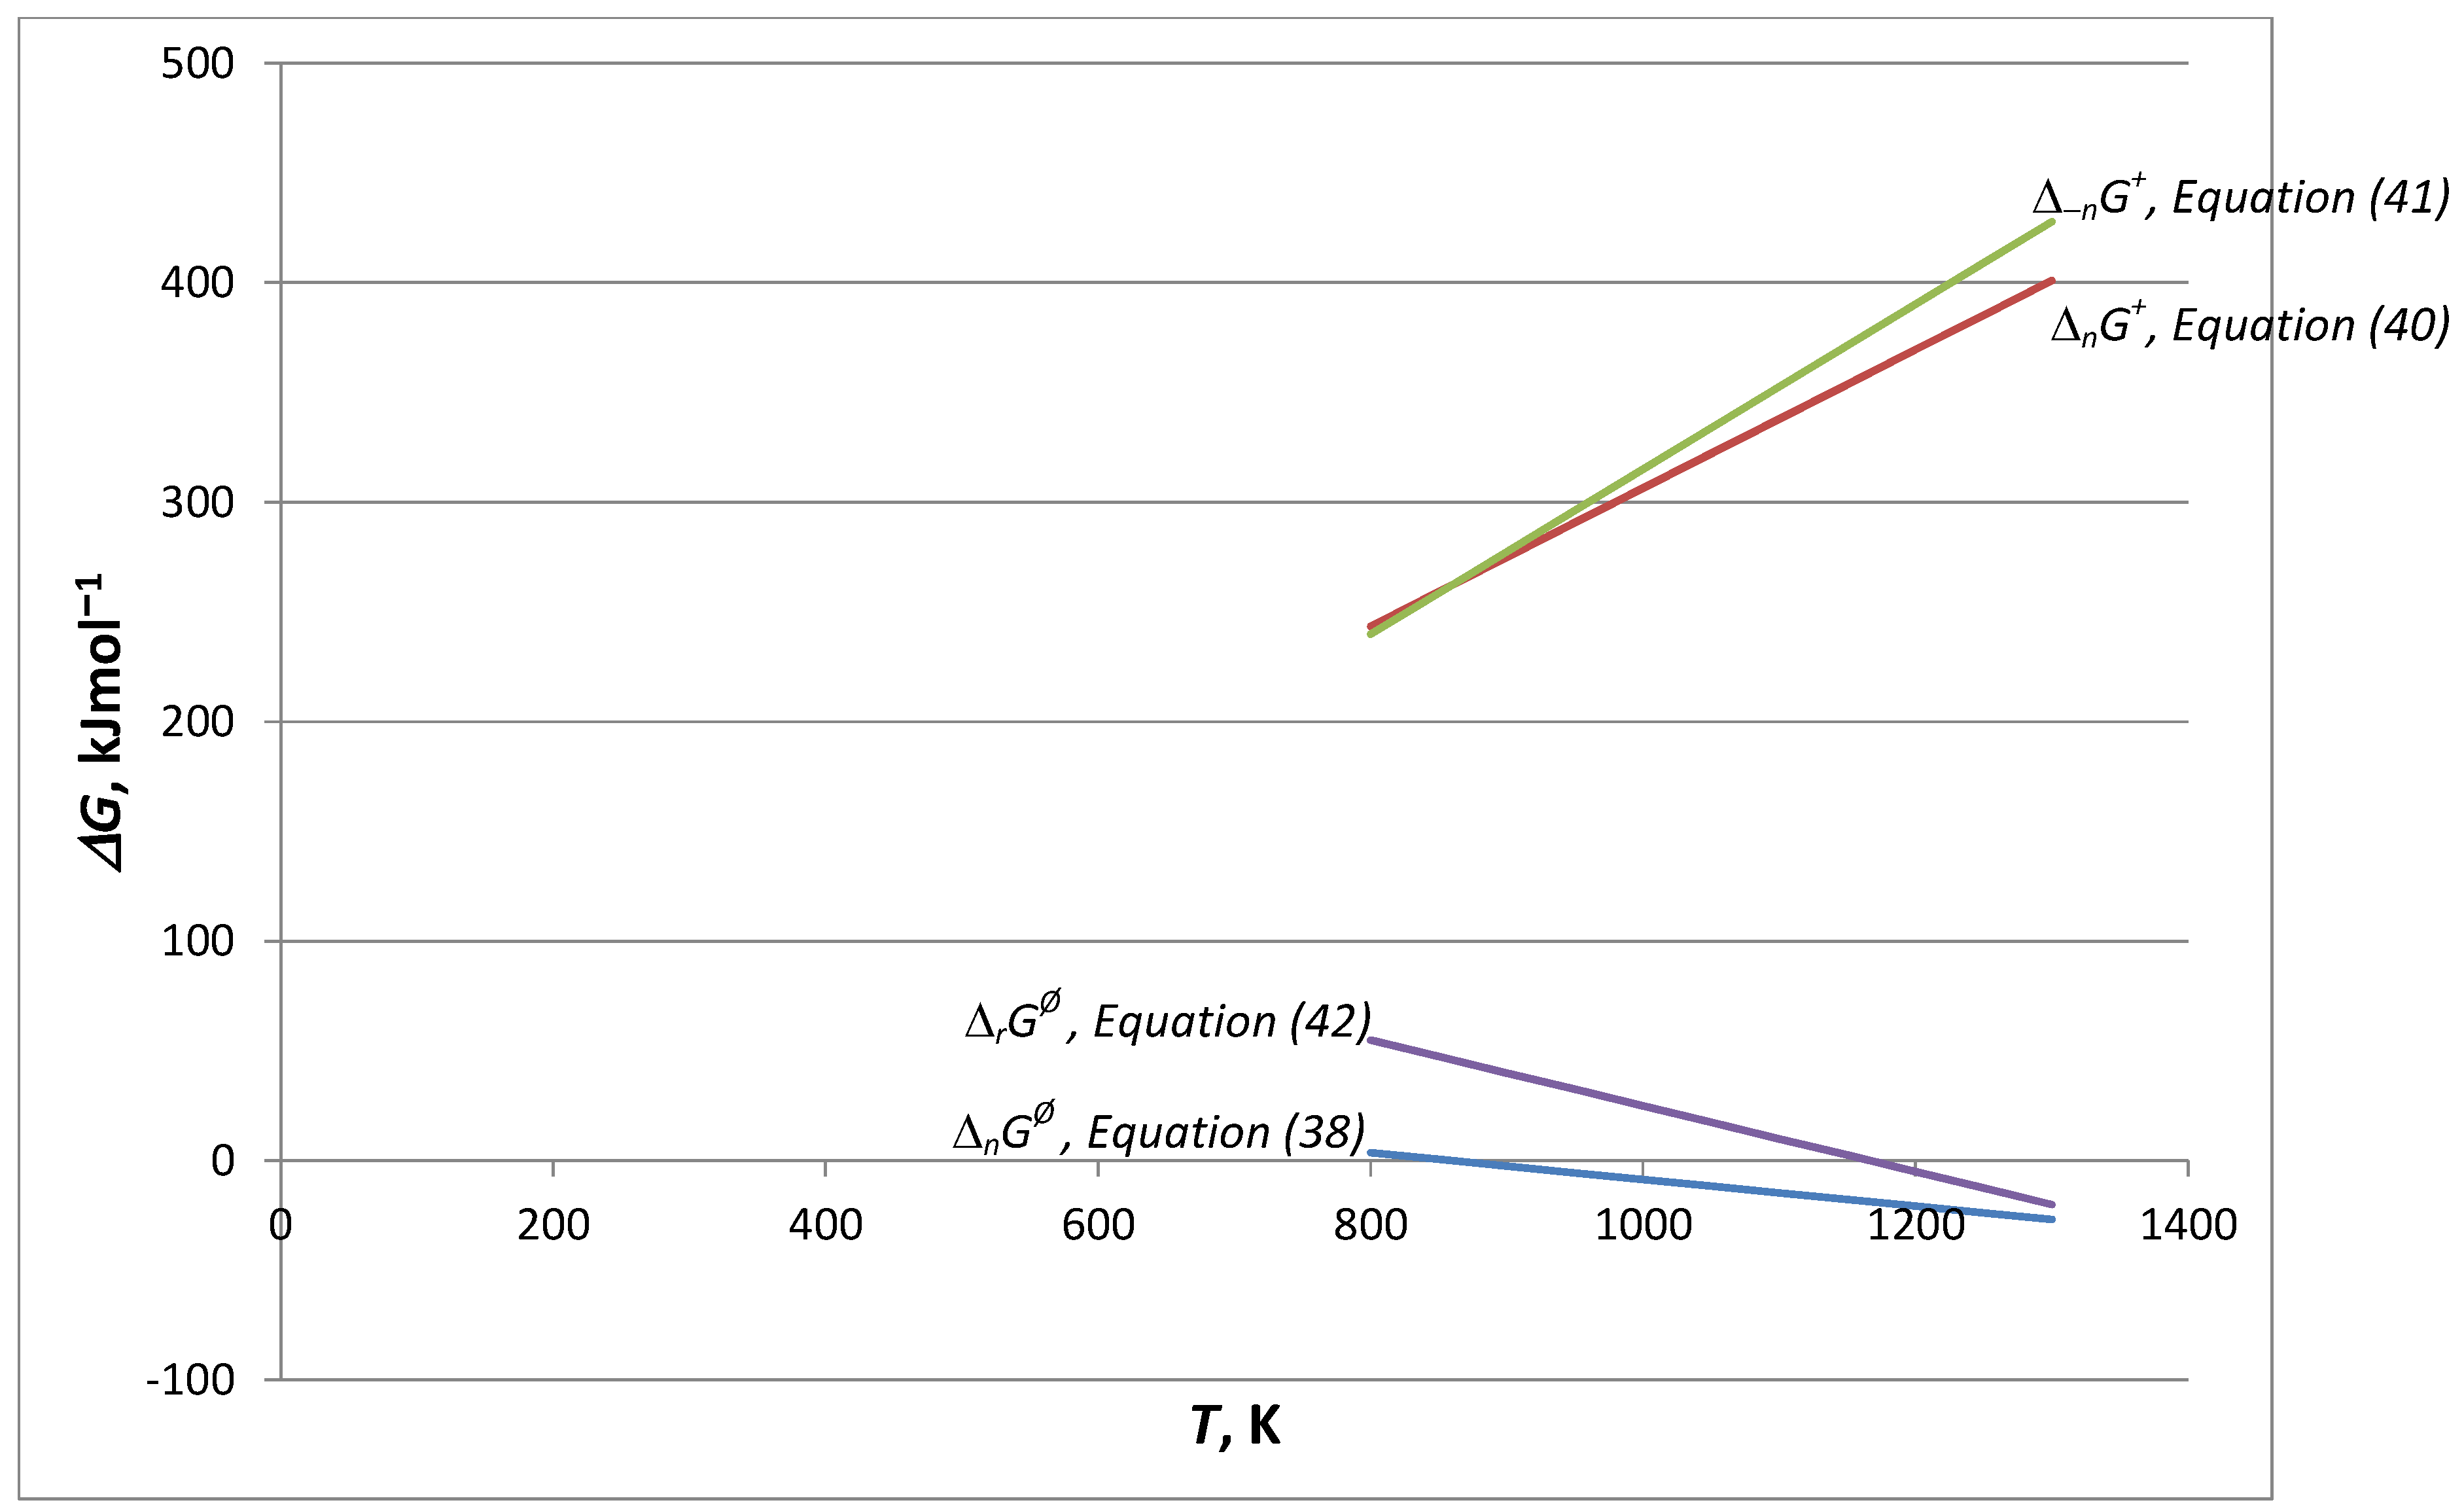
Figure 3 is a graphical illustration of Equation (38) and its components Equations (40) and (41).
The conclusions from Figure 3 are that in the considered temperature range starting from 860 K, the free energy of nucleation is negative, in terms of the value being slightly lower than that given in [16]:
Δ r G = 174.92 0.150 T ,   kJ · mol 1
and at T = 1378.52 K, these two lines intersect. The graphical representation of the temperature profiles is different from that represented in [16]. Referring to the considerations concerning Equation (38), the differences in slope for Equations (40) and (41) defining the entropy are large, but their changes are very close to 0 in the value sense ( Δ n S + Δ n S + = 315 − 376 = −61 J∙(mol∙K)−1). From the comparison of Equation (22) with (23) in combination with Equation (38) and lnkn = −6.2 (in s−1) = constant, we obtain:
l n k n = 52,410.0 R T 13.53
From Equation (41), it follows that the activation energy is negative (E = −52.41 kJ∙mol−1), which is characteristic of the decrease in the viscosity coefficient with increasing temperature, most often expressed by the Guzman–Arrhenius law [66]. In accordance with the considerations in this area, Mullin [20] proposes to add the “viscosity” term (see Equation 5.17 in [20]) in Equation (28) for the variant f(Θ) = 1.

5.3. Decomposition in CO2 Atmosphere (E Is Very High)

In the case of the thermal decomposition reaction/process of calcite in a CO2 atmosphere, it is known that the observation of the decomposition occurs at a high temperature, which translates into very high activation energies. In our own research [67], the following values were determined:
E = 1362.85   kJ · mol 1 ,   l n A = 134.75   ( A   in   s 1 )
Equation (19) can be presented in a linear form as:
Δ r G = E E 1 · ( 1 T T e q )
which results from the notation of Equation (15) taking into account Equation (16), and, for the sake of clarity of the considerations, the following notation is proposed:
Δ r G = Δ E Δ E T e q · T
where Δ E = E E 1 = Δ r H and Δ E T e q = Δ r S , and when T = T e q then Δ r G = 0.
The reaction/process of calcite decomposition is carried out in a CO2 atmosphere in non-equilibrium conditions; thus, the gas environment opposes the decomposition, which occurs only at higher temperatures. Since the active state appears with great difficulty, which results from the counteraction of the high activation energy of the reversible reaction, the nucleation process can be omitted. By introducing on the right side of Equation (45) the given kinetic parameter E−1 = 1187.93 kJ∙mol−1 (temporarily omitting lnA−1 = 116.70 (A in s−1)), and for Teq = 1166.13 K, Equation (42) is reproduced.
The element confirming the presented point of view is the balance according to Equation (23) with the inclusion of Equation (24), in which the left side is presented by Equation (42), and the right side by the components:
Δ G + = 1354.3 0.857 T ,   kJ · mol 1   for   E > 1000 ,   kJ · mol 1
instead of Δ 1 G + from Equation (35), i.e., the model with the minimum activation energy for a reversible reaction, as well as Δ n G + acc. Equation (40) looking for the relationship:
Δ n G + = 1161.39 0.682 T ,   kJ · mol 1
From Equation (47), we can determine the rate constant for creating the backward active state:
l n k n = 1,169,763.2 / R T + 113.72
The determined kinetic parameters provide a good approximation to the parameters of the reversible reaction ( E 1 ,   l n A 1 ) . The reversibility of the changes in the structure of the solid phase in these conditions determines the full course of the forwards–backwards of the reaction/process. In the conditions of the heterophase reaction/process in non-equilibrium conditions due to thermodynamic factors hindering the course of the reaction/process, Equation (18) is correct.

5.4. Discussion About the Rate Constant for Calcite

This work is based on the basic relation Equation (11), which allows us to determine the free energy of activation from the knowledge of the rate constant and vice versa, determining the component of the selected node from the balance, and returning to the determination of another rate constant. Thus, the definitional notation Equation (1) in the conversion degree category is transformed into Equation (4) and the ratio: K α K = ( α α e q ) ν (for calcite ν = 1). The full description of the isothermal reaction/process rate conditions found in the literature also takes into account the Langmuir–Hinshelwood sorption model:
d α d t = k · f α · 1 P P e q · ( 1 φ )
In Equation (49), in the simplest approach, the expression containing the ratio P P e q can be used in a very extended expression [50], as a specific constant value, or simply omitted [47]. In turn, the gas saturation of active sites φ is essential in the consideration of the reaction/process stages; (1 − φ) denotes the number of unfilled active sites [48]. Currently, in Equation (49), for cognitive reasons the form for (1 − φ) ≅ 1 becomes more important [49,50,51], although the model using φ is still used in the balance of the CO2 adsorption rate in the reaction/process using partial rate constants [23]. For φ = 0, Equation (49) results from the logical sequence of various forms of kinetic equations, i.e., the notation of Equation (1) in the notation of Equation (2) is transformed into Equation (4). In turn, introducing Equation (2) into Equation (B3) (Appendix B, for ν = 1), we obtain Equation (49).
From Equation (49) follows a whole range of information concerning the mechanism of the reaction/process in Equation (33). From the combination of the last two components in Equation (49), according to [48], one can distinguish the approximate reaction/process rates, where DFE ( 1 P P e q ) :
v 01 = k 1 1 + k n k n ( 1 P P e q ) chemical   decomposition   rate
v 02 = k n 1 + k n P k n P e q ( 1 P P e q ) structural   transformation   rate
and for P = 0 (vacuum or initial state), v 01 = k 1 · k n k n + k n k 1 when k n k n and v 02 = k n = A n = 2.029∙10−3 s−1 = constant.
Comparing the values of rate constants k1 and kn is sensible for a specific temperature, since in Teq, according to Equations (17) and (19), there appears the rate constant k1 = k−1 omitted in Equations (50) and (51). In turn, in Equation (49) for (1 − φ) ≅ 1, using various possibilities of creating expressions containing the simplex P P e q [50] and the extended kinetic formulas for f(α), the isokinetic temperature Tiso = 1190.5 K, which was close to Teq = 1166.13 K, was experimentally determined. Based on the partial rate constant [50], the influence of the geometrical system on the kinetic parameters was determined for the following:
The surface reaction (SR): E = 67.1 kJ∙mol−1, l n A = 1.24 ( A in s−1);
Two-dimensional shrinkage of the reaction interface (PBR(2)): E = 155.1 kJ∙mol−1, l n A = 10.07 ( A in s−1).
Adding to this the parameters adopted in [16] (E = 191 kJ∙mol−1, lnA = 15.4 (A in s−1) and in [23] (E = 184.7 kJ∙mol−1, lnA = 14.08 (A in s−1)), according to Equations (15) and (16), the following values of ∆G+ in kJ∙mol−1 were obtained in the same order at Teq = 1166.13 K: 353.4, 355.9, 340.2, and 346.6, respectively; an average of 349.3. The maximum difference equals to 15.7 kJ∙mol−1, which suggests that the observation of the reaction/process progress fragments is convergent at the equilibrium temperature, close to the isokinetic one. Using Equations (18) and (35) for T = Teq, we obtain in the balance: 0 = 349.3 − 347.6 = 1.7 kJ∙mol−1, which we consider as a balance agreement, and at this temperature and for Equation (35) we can ignore structural transformation processes; the decomposition is of a chemical nature. Below this temperature, Equation (18) should be replaced by Equation (23). Returning to the sources of Equation (49) or (40), it is known that for reaction/process (33), the simplest measure in DFE is the proportion:
P P e q = α α e q
The proportion (52) results from the comparison [23]:
l n P e q P = 16.720 19,680 T ,       T e q =   1177.03   K
or [56]:
l n P e q P = 17.525 20,474 T ,       T e q =   1168.27   K
with relationship α e q   v s .   T [68]:
l n α e q = 18.095 21,039.57 T ,   T e q =   1162.73   K
or [63]:
l n α e q = 17.440 20,447.44 T ,   T e q =   1172.44   K
The complement in Equation (52) is the observed conversion degree. The differences in coefficients result from the temperature range considered in the calculations.
In the case of thermographic studies, even in isothermal conditions, the gaseous product is discharged from the reaction zone. Therefore, in most works using TGA, both in isothermal and dynamic conditions, we observe α > αeq, for example, in [31,32,35,37,41,46], which is why the relationship in Equation (54) for 0.05 ≤ α ≤ 1 is in the form:
Δ G = Δ r G + ν R T l n α ,         ν = 1
which satisfies the inequality ∆G ≥ 0, and from Equation (3) it clearly follows that ∆G ≤ 0.
Under isothermal conditions, the expression (RTlnα) does not show the kinetic features of the interactions [T; α] analyzed and searched for dynamic conditions. In Equation (39), Gibbs free energy implies supersaturation in the sense of Equation (29). The role and significance of the rate constant depends on the reaction/process path being analyzed, as well as in the thermal distribution of the solid phase, on the determination conditions. The most complicated issue is the separation of this constant from the conditions of tests under dynamic conditions, which raises doubts about whether it is possible to use Equation (11) indisputably. In this paper, we recognize the agreement for the reaction/process (33), where we accept one selected from the plethora of data on this subject collected in [32] with the TST model according to [23]. On the other hand, moving on to the course acc. Equation (34) from left to right, does the selected example perfectly correspond to the structure of the substrate, so that in Equation (23), ∆nG = 0, which means chemical decomposition? On the other hand, the appearance of structural changes causes the decomposition of this term according to Equation (24), which leads to fundamental difficulties related to activation leading to the formation of CaO, which starts with the surface not the mesoporous layer [50,54], and the rate constant of activation is limited by the maximum value of lnkn = lnAn = −6.2 (in s−1). In this respect, it can be assumed that, in accordance with Figure 2, the transformation of the results of thermogravimetric studies in dynamic conditions leads to results that are acceptable as a constant quantity. Despite the non-observance of the condition ∆G ≤ 0, which results from the fact that in Equation (39), this quantity occurs in the squared power, it can be assumed that we are dealing either with the maximum rate constant or omitting the structural transformation. In this way, it results from the balance that the complementary factor in Equation (24) ∆−nG+ can be of a viscosity term in nature (negative activation energy) or characteristic for the reversible reaction kinetics (Equation (48)).

5.5. Final Remarks

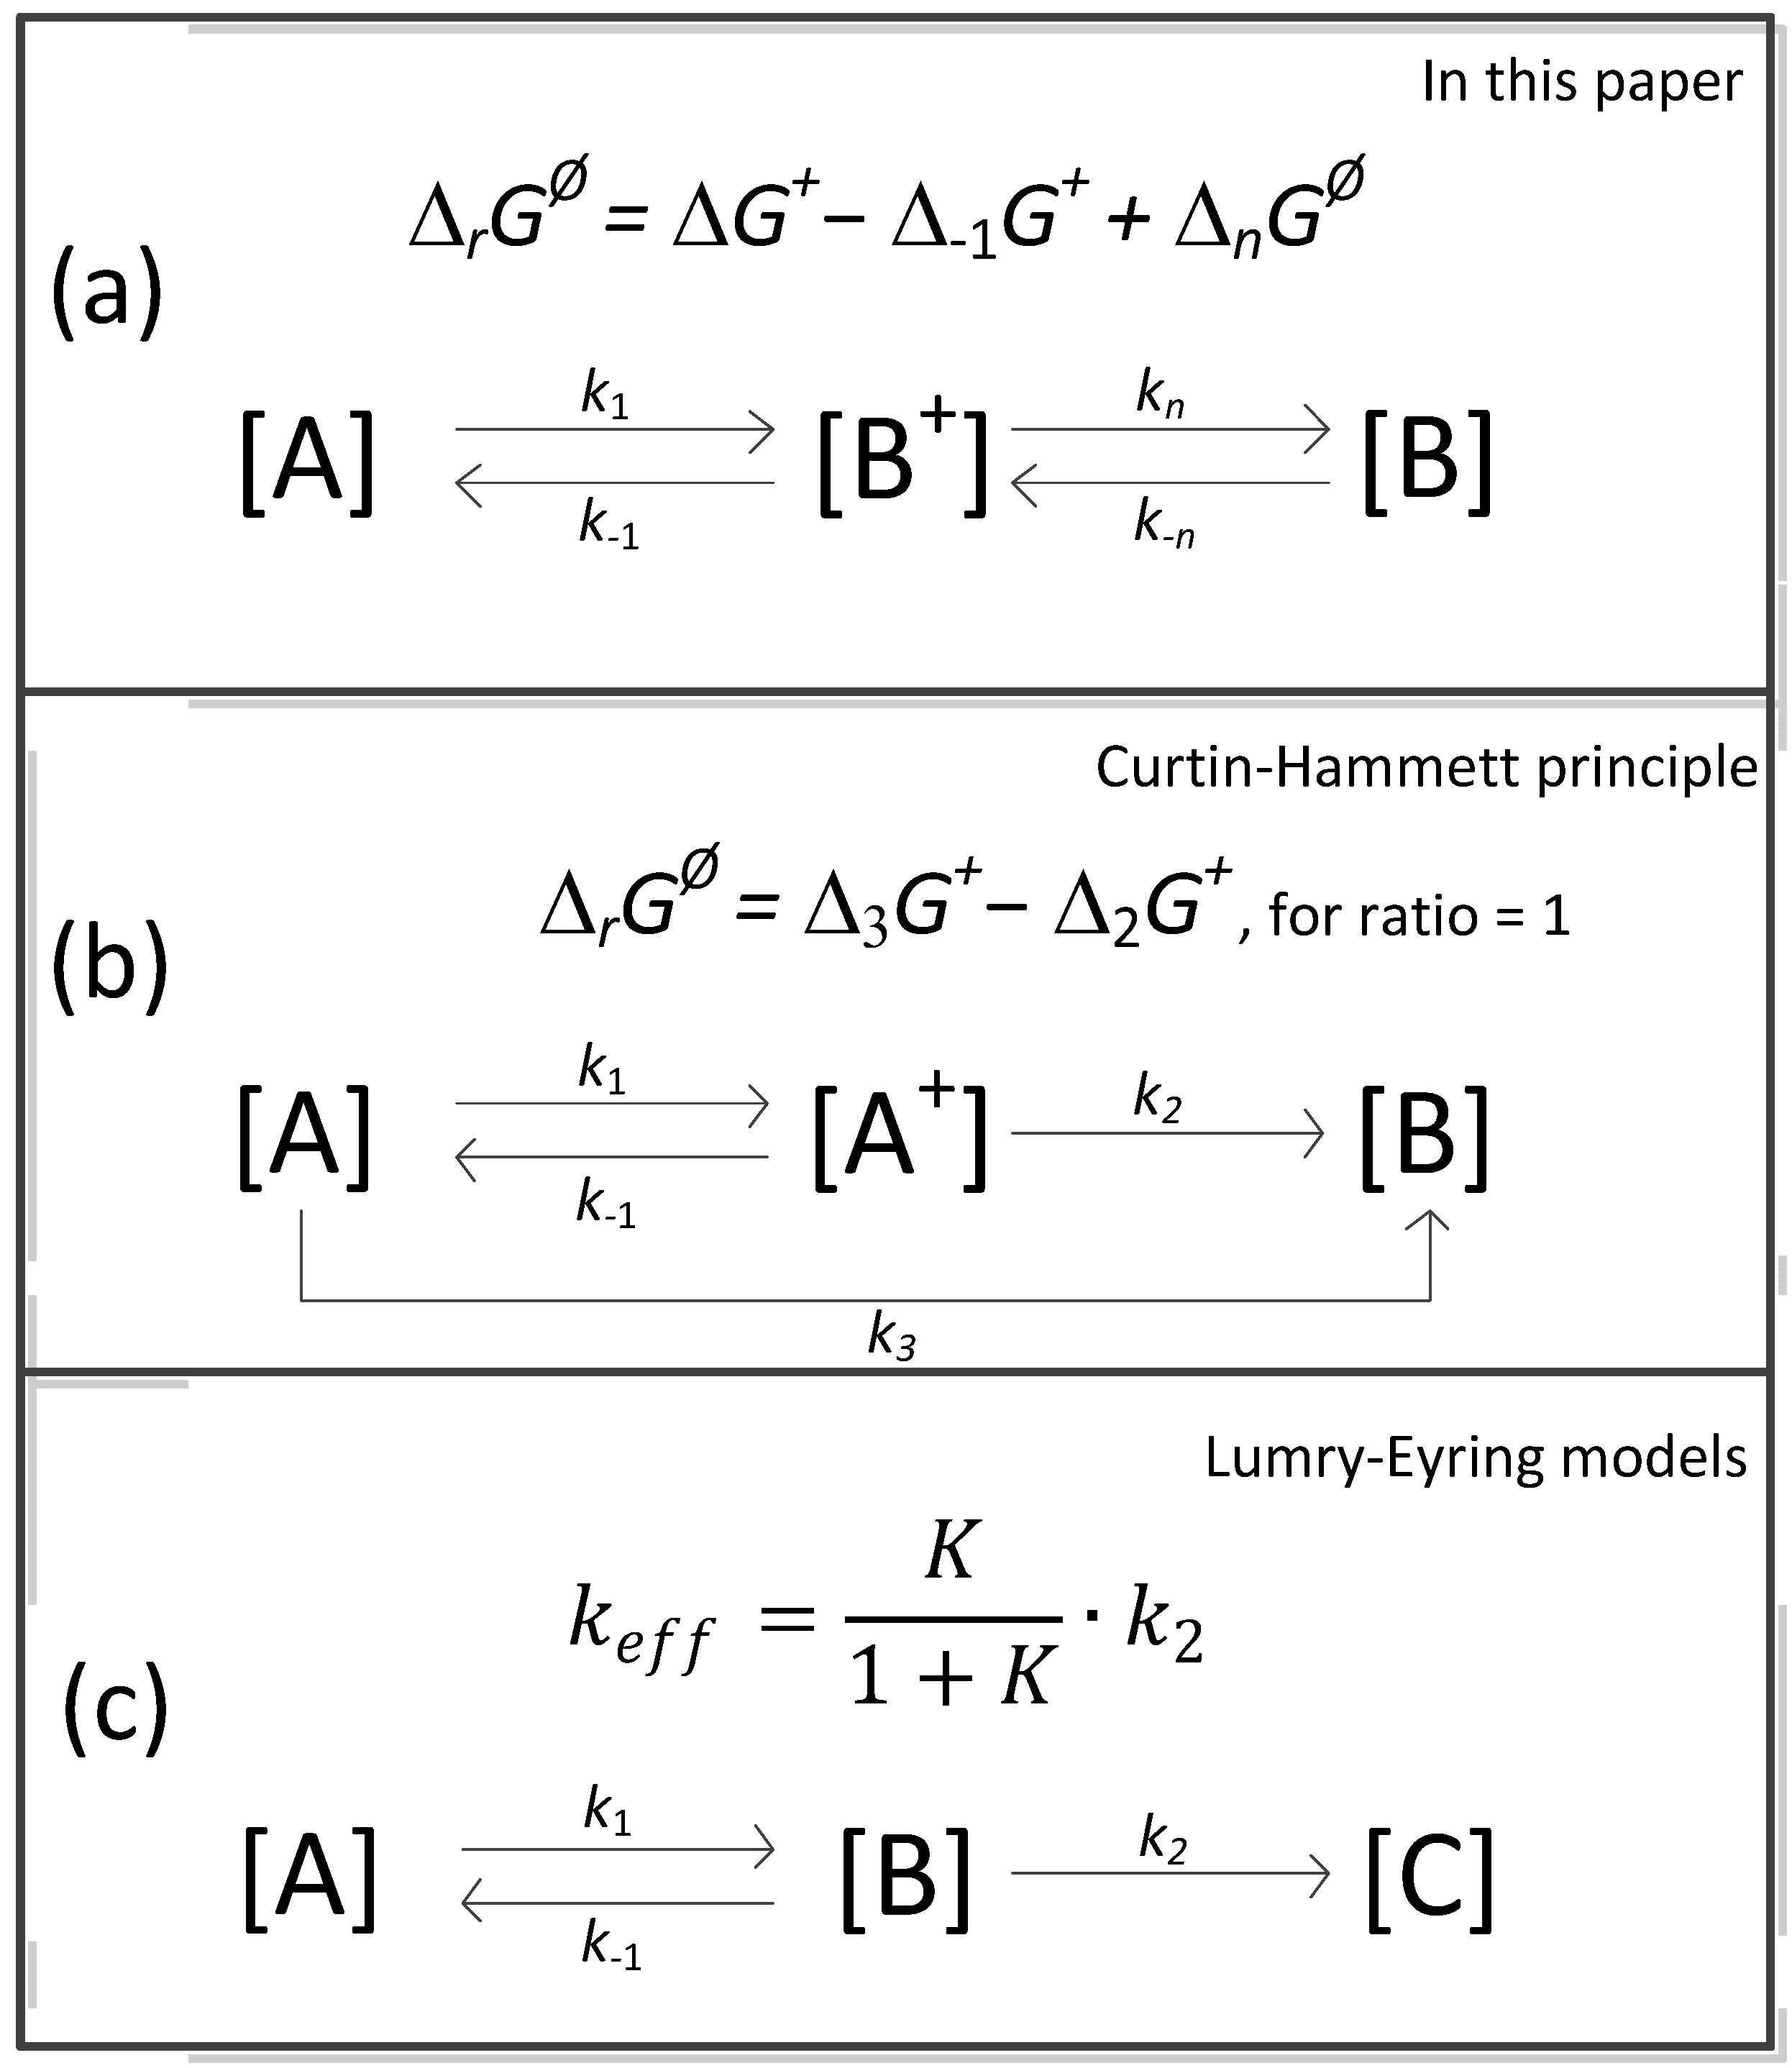
The hypothetical reaction/process paths are presented in Figure 4, where for the purposes of these considerations, the three most known models of reaction/process paths, particularly relevant for the thermal decomposition of calcite, but also possible for other decomposed chemical compounds, are summarized.
The case of Figure 4a is based on the notation of Equation (23) with the term written in Equation (24). In turn, Figure 4b is a travesty of the Curtin–Hammett principle [69] from the perspective of considering the reversibility of the reaction/process. One can imagine that the substance [A] is partially decomposed by TST and the remaining one directly to the product [B]. For convenience, the equimolar formation of CaO was assumed according to parallel paths, which is why the term RTln(ratio) was omitted, where ratio = 1 means the fractal division of the product [B] resulting from two reaction/process paths. On the other hand, Figure 4c symbolizes the Lumry–Eyring model, which was created much later than the TST in 1954 [70,71]. The discussed kinetic model is also known as pre-equilibrium approximation [72] and is reduced to a form analogous to the kinetics of the I-th order for the conversion degree of [A]:
v = d α d t = K 1 + K k 2 1 α = k e f f ( 1 α )
According to Equation (52) for α α e q = 1, K = 1, and k e f f = 1 2 k 2 , the restrictions arise from the title of the expression in which the equilibrium constant occurs.
The thermal decomposition of calcite (aragonite, vaterite) can certainly be treated in kinetic categories in the relation Arrhenius–TST [16,23,73]. To formulate the idea differently, the advantage of the TST is the extension of cognitive possibilities to the thermodynamics of activation based on the Arrhenius equation.
In view of the presented considerations, in addition to CaL, carbon dioxide forms stable carbonate compounds with minerals or mineral wastes. Magnesium metal oxides, formed from the thermal decomposition of dolomite, are used for the reaction, and less frequently with iron oxide compounds. Carbonation is carried out by binding CO2 to a solid, or to an aqueous suspension, such as calcium or magnesium silicates. Natural minerals (e.g., serpentinite, olivine, talc) or waste materials (e.g., fly ash, asbestos waste, smelter slag) can be used for mineral sequestration [74]. Parallel to these methods, absorption technologies in solutions of amine compositions are effective. In this respect, the Institute of Energy and Fuel Processing Technology has investigated and developed its own carbon capture technology [75,76,77,78,79].

6. Conclusions

The work is based solely on the results of studies in the literature, analyzing the free energy balance according to phenomenological thermodynamics with elements of free energy of activation. It is a continuation of the studies [16,17] based on Equations (18) and (23) together with Equation (24). The conclusions concern calcite.
  • A comparison of the thermal decomposition reaction/process of calcite in Equation (34) is found, which concerns the reversible reaction according to Equation (35): E−1 = 17.52 kJ∙mol−1 (low), and then we identify only the chemical decomposition rate. In turn, according to Equation (37), E−1 = 70.56 kJ∙mol−1 (high), the structural transformation rate also appears. The reversibility of changes in the structure of the solid phase in these conditions determines the full backwards course of the reaction/process of a complicated cognitive nature. Finally, for a very high activation energy of calcite decomposition/synthesis in the CO2 atmosphere (E = 1362.85 kJ∙mol−1, E−1 = 1187.93 kJ∙mol−1) in these conditions, the full forwards–backwards course of the reaction/process occurs, omitting structural effects.
  • The structural transformation rate is reduced to the course of the reaction/process according to Equation (34). For the analysis of this case, the excess free energy model known in the literature is used, which is generalized for various conditions, including dynamic ones. For calcite, the maximum constant rate of nucleation is established, which is equal to the pre-exponential constant Equation (31), then the hypothetical activation energy E = 0. For the reversible process, the term in Equation (24) informs either about viscosity changes (negative activation energy) or about the decomposition of a chemical nature (CO2 atmosphere). It should be added that the discussed term is a balance result, not an independent calculation.
  • By adding to the Arrhenius kinetic parameters from the surface reaction (SR) model, the two-dimensional shrinkage of the reaction interface (PBR(2)), and data from models [16,23] (sometimes called apparent activation energy), it is established that for T = Teq, we obtain balance agreement, and at this temperature and for Equation (35), structural transformation processes can be neglected and the decomposition is of a chemical nature. Thus, Teq is the isoequilibrium temperature of activation.
  • In conclusion No. 3, the four activation energies form a sequence of increasing values (in kJ∙mol−1): 67.1/155.1/184.7 for SR/PBR(2)/TST, respectively. From many possibilities, 191.0 was chosen in [16]. Neglecting at this stage the accompanying increase in the second Arrhenius parameter (lnA), the given sequence justifies the variation of the activation energy with the degree of transformation.
  • The free energy balance in terms of phenomenological thermodynamics is the sum of the free energy of activation reactions forwards (sign +), backwards (sign −), and activation terms symmetrically related to nucleation. For the activation process of nucleation, the rate constant can be determined from thermogravimetric studies for dynamic conditions. It is required to control the agreement of the theoretical model Equation (28) with the experimentally determined quantities (Figure 2).

Author Contributions

Conceptualization, A.M.; methodology, A.M.; software, R.B.; validation, A.M. and R.B.; formal analysis, A.M. and R.B.; investigation, A.M. and R.B.; resources, A.M. and R.B.; data curation, A.M.; writing—original draft preparation, A.M.; writing—review and editing, A.M. and R.B.; visualization, R.B.; supervision, A.M.; project administration, A.M. and R.B. All authors have read and agreed to the published version of the manuscript.

Funding

This research received no external funding.

Data Availability Statement

Data is contained within the article.

Conflicts of Interest

The authors declare no conflict of interest.

Nomenclature

a 2 coefficient: Equation (B8)
A, B, Cchemical compounds
Apre-exponential factor, s−1
b, nexponents, Equation (7) and Equation (1), respectively
B = 2.08364∙1010 (K∙s)−1ratio of Boltzmann to Planck’s constant
Cconstant
Eactivation energy, J∙mol−1
f α kinetic function of conversion degree argument
Δ g free energy, J
Δ G ,   Δ H ,   Δ S thermodynamic functions: free energy J∙mol−1, enthalpy J∙mol−1, and entropy J∙(mol∙K)−1, respectively,
h = 6.62607∙10−34 J∙sPlanck constant
krate constant, s−1
k B = 1.38065∙10−24 J∙K−1Boltzmann constant
Kequilibrium constant
K α the product of the activities of all components (defined in [3])
Δ n the change in the number of molecules in the active state minus substrates
N = 6.022∙1023 mol−1Avogadro constant
Ppressure or partial pressure, Pa
qheating rate (Figure 2), K·min−1
rradius, m
R = 8.314 J∙(mol∙K)−1universal gas constant
Ssupersaturation in Equation (29)
ttime, s−1
Tabsolute temperature, K
vrate of reaction/process
Vvolume of the CaO, m3
αconversion degree
νstoichiometric ratio
σspecific surface energy, J∙m−2
φ the fraction of active sites filled with adsorbed CO2
Χtransmission coefficient, assumed χ = 1
θ the apparent contact angle between the embryo phase, for calcite acc. [23], θ = 60°, and from Equation (30), f(θ)= 0.15625.
Subscripts
1, −1 acc. to: forwards, backwards, 01, 02—initial rate of reaction/process in Equations (50) and (51); A, B—chemical compounds; eff—effective rate constant; eq—equilibrium; iso—isokinetic; i—ith point; n—nucleation; n —backwards, nucleation inhibition; max—maximum; r—reaction; S—refers to surface; TST—Transition-State Theory; V—refers to volume; and α—refers to conversion degree.
Superscripts
E—excess; +—thermodynamic activation functions; and —standard condition.
Abbreviations
CaL—Calcium Looping; CFD—computational fluid dynamics; CCS—Carbon Capture and Storage; DFE—Distance From Equilibrium (or far from equilibrium); DFT—density functional theory; DSC—differential scanning calorimetry; TGA—thermogravimetric analysis; and TST—Transition-State Theory.

Appendix A

Derivation of Equation (29)

The overall excess free energy, according to Figure 1, is considered as the difference between the surface excess free energy (∆GS) and the excess free energy of the transformation (∆GV)—in Equation (A1) the notation in the form of a sum results from the negative value of Gibbs free energy ∆g, expressed in Joules:
G E = 4 π σ r 2 + 4 π 3 · r 3 V · Δ g ,   [ J ]
where acc. [23]: σ = 0.1 J∙m−2 (specific surface energy), and V = 3.64∙10−29 m3 referred to the Avogadro number. According to older data on the same scale: V = 2.81∙10−29 m3 [56], which is closer to vaterite (V = 3.13∙10−29 m3 [80]). In Equation (A1) and beyond, the molar volume of CaO (V) is expressed on a scale relative to Avogadro’s number.
The formal notation for Equation (3) is in the form:
Δ g = k B T l n P i P e q ,   P i     P e q ,   [ J ]
Differentiating Equation (A1) with respect to the radius and equating to zero d G E d r = 0, we obtain the formula defining the maximum radius:
r m a x = 2 σ V Δ g > 0
which, after introduction to Equation (A1) and rearrangement, determines Equation (29).
Equation (A2) expressed by supersaturation S is as follows:
Δ g = k B T l n S
and retains a negative sign, which disappears when squared.
The relationship between free energy results from the equality R = k B · N , which implies:
Δ G = N · Δ g ,
where N is the Avogadro number N = 6.022∙10−23 mol−1.

Appendix B

Equation for the Relation Equation (3)

For the preserved relation P i     P e q , Equation (A5) is presented identically to Equation (3), and for Equation (52) it can be presented in the form of Equation (55). For the thermal decomposition of solid chemical compounds, and for a reaction/process with the formation of one gaseous product with a stoichiometric coefficient ν:
K = ( P e q P ) ν
and for instantaneous nodes:
K α = ( P i P ) ν
Equation (3) is as follows:
Δ G = ν R T l n P i P e q ,
According to the interpretation [81], Equation (A8) refers to isothermal conditions, the evolution of only one gas, and a specific atmosphere that is difficult to imagine in the experimental conditions. Continuing, this means “no inert gas, the system contains pure phases”, with the obvious inequality P i P e q 1 .
However, in practice we do not have a pure phase for gases, because they are always a mixture. For these reasons, Equation (54) is presented in the form in which Δ G   0 :
Δ G = Δ r G + ν R T l n P i P e q
For each relation P i P e q 1 , Δ G   0 , that is, a “positive” free energy appears, which has only a hypothetical meaning. The transition Equation (A8) to Equation (A9) is equivalent, but the second equation (Equation (A9)) is characterized by a separate thermodynamic term for the equilibrium quantities Δ r G and taking into account Equation (55), one loses control over the correct use of free energy ex definitione. Finally, Equation (55) is presented with the restriction for the decomposition with one gaseous species (CO2) and for calcite ν = 1.
Assuming dynamic conditions, i.e., temperature variation and an increase in the degree of transformation, also functionally dependent on temperature, then for calcite:
Δ G = Δ r G + R T l n α ,     ν = 1
After differentiating with respect to temperature, we obtain the equation ( d Δ G d T = Δ S ) :
Δ S = Δ r S R ( T l n α T ) P
Using the isokinetic temperature, which in some works [50,63] indicates the approximate equality T e q = T i s o and additional relations [63]:
Δ G Δ r G T = R l n α   ( from   Equation   ( B 5 ) )
d l n α d T = Δ r H R T 2 + a 2 T i s o T T 2 ( in [ 63 ] )
and after performing the accounting operations we obtain:
Δ G = R a 2 T T i s o T Δ S
From Equation (A14), it follows directly that Δ H = R a 2 T T i s o , when T = T i s o , but also for a 2 = 0 (equilibrium conditions), then Δ H = 0.
Assuming the notation of Equation (A14) in the form [63]:
Δ G = R T a 2 [ 1 + l n T i s o T T i s o T ]
which can be written as the difference in the following:
Δ G = R T a 2 ( 1 T i s o T ) R T a 2 l n T T i s o
then compared to Equation (A14), the entropy is equal to:
Δ S = R a 2 l n ( T T i s o )
When T = T i s o or T = T i s o , then Δ G 0 , so the system approaches equilibrium.
Equation (A15) is based on the equation called the three-parameter and the relations between its coefficients according to [82]. It is assumed that the experimental data determine Δ r H with sufficient accuracy. Formally, for a 2 = 0, Equation (A13) is transformed into the form:
d l n α e q d T = Δ r H R T 2   for   ν = 1
Free energy ∆G = 0 is a characteristic node for the equilibrium T = Teq.
The two quantities experimentally determined using the TGA technique ( a 2 ;   T i s o ) implied in Equation (A10) cause the equilibrium temperature to shift to the isokinetic node T = T i s o . On the other hand, the sign in Equation (A15) remains irrelevant, because ( Δ G ) 2 0   (Equations (29) and (39)), which is discussed in Appendix A.

References

  1. IUPAC Gold Book, V. 3.0.1. Available online: https://goldbook.iupac.org/terms/view/O04322 (accessed on 15 January 2025).
  2. Šesták, J.; Šatava, V.; Wendlandt, W.W. The study of heterogeneous processes by thermal analysis. Thermochim. Acta 1973, 7, 333. [Google Scholar] [CrossRef]
  3. Blazéjowski, J. Evaluation of kinetic constants for the solid state reactions under linear temperature increase conditions. Thermochim. Acta 1981, 48, 109–124. [Google Scholar] [CrossRef]
  4. Sbirrazzuoli, N. Determination of pre-exponential factors and of the mathematical functions f(α) or G(α) that describe the reaction mechanism in a model-freeway. Thermochim. Acta 2013, 564, 59–69. [Google Scholar] [CrossRef]
  5. Lyon, R.E. Isokinetics. J. Phys. Chem. A 2019, 123, 2462–2469. [Google Scholar] [CrossRef] [PubMed]
  6. Mianowski, A.; Ściążko, M.; Radko, T. Vyazovkin’s isoconversional method as a universal approach. Thermochim. Acta 2020, 696, 178822. [Google Scholar] [CrossRef]
  7. IUPAC Gold Book, V. 3.0.1. Available online: https://goldbook.iupac.org/terms/view/T06470 (accessed on 15 January 2025).
  8. Vyazovkin, S. Misinterpretation of Thermodynamic Parameters Evaluated from Activation Energy and Preexponential Factor Determined in Thermal Analysis Experiments. Thermo 2024, 4, 373–381. [Google Scholar] [CrossRef]
  9. Eyring, H. The activated complex in chemical reactions. J. Chem. Phys. 1935, 3, 107–115. [Google Scholar] [CrossRef]
  10. Evans, M.G.; Polanyi, M. Some applications of the transition state method to the calculation of reaction velocities, especially in solution. Trans. Faraday Soc. 1935, 31, 875–894. [Google Scholar] [CrossRef]
  11. Evans, M.G.; Polanyi, M. On the introduction of thermodynamic variables into reaction kinetics. Trans. Faraday Soc. 1937, 33, 448–452. [Google Scholar] [CrossRef]
  12. Truhlar, D.G.; Garrett, B.C.; Klippenstein, S.J. Current status of transition-state theory. J. Phys. Chem. 1996, 100, 12771–12800. [Google Scholar] [CrossRef]
  13. Xu, R.; Meisner, J.; Chang, A.M.; Thompson, K.C.; Martíınez, T.J. First principles reaction discovery: From the Schrödinger equation to experimental prediction for methane pyrolysis. Chem. Sci. 2023, 14, 7447. [Google Scholar] [CrossRef] [PubMed]
  14. Jacquemin, J. A Transitional Phase for Thermo? Thermo 2024, 4, 29–30. [Google Scholar] [CrossRef]
  15. Li, Z. First-principles-based microkinetic rate equation theory for oxygen carrier reduction in chemical looping. Chem. Eng. Sci. 2022, 47, 117042. [Google Scholar] [CrossRef]
  16. Mianowski, A.; Radko, T.; Bigda, R. Elements of Transition-State Theory in Relation to the Thermal Dissociation of Selected Solid Compounds. Energies 2024, 17, 2669. [Google Scholar] [CrossRef]
  17. Mianowski, A.; Szul, M.; Radko, T.; Sobolewski, A.; Iluk, T. Literature Review on Thermodynamic and Kinetic Limitations of Thermal Decomposition of Methane. Energies 2024, 17, 5007. [Google Scholar] [CrossRef]
  18. Laidler, K.J.; King, M.C. Development of Transition-State Theory. J. Phys. Chem. 1983, 87, 2657–2664. [Google Scholar] [CrossRef]
  19. Mianowski, A.; Radko, T.; Siudyga, T. Influence of initial assumptions on the kinetic models of CO2 gasification of chars and cokes in solid phase. J. Therm. Anal. Calorim. 2016, 126, 1911–1923. [Google Scholar] [CrossRef]
  20. Mullin, J.W. Crystallization, 4th ed.; Butterworth-Heinemann: Oxford, UK, 2001. [Google Scholar] [CrossRef]
  21. Vyazovkin, S. Isoconversional Kinetics of Thermally Stimulated Processes; University of Alabama at Birmingham: Birmingham, AL, USA, 2015. [Google Scholar] [CrossRef]
  22. Zeng, Q.; Xu, S. Thermodynamics and Characteristics of Heterogeneous Nucleation on Fractal Surfaces. J. Phys. Chem. C 2015, 119, 27426–27433. [Google Scholar] [CrossRef]
  23. Cai, J.; Li, Z. First Principle-based Rate Equation Theory for the Calcination Kinetics of CaCO3 in Calcium Looping. Energy Fuels 2024, 38, 8145–8156. [Google Scholar] [CrossRef]
  24. Martínez, I.; Grasa, G.; Murillo, R.; Arias, B.; Abanades, J.C. Kinetics of Calcination of Partially Carbonated Particles in a Ca-Looping System for CO2 Capture. Energy Fuels 2012, 26, 1432–1440. [Google Scholar] [CrossRef]
  25. Valverde, J.M.; Medina, S. Reduction of calcination temperature in the Calcium Looping process for CO2 capture by using Helium: In-situ XRD analysis. ACS Sustain. Chem. Eng. 2016, 4, 7090–7097. [Google Scholar] [CrossRef]
  26. Medina-Carrasco, S.; Valverde, J.M. The Calcium Looping process for energy storage: Insights from in situ XRD analysis. Chem. Eng. J. 2021, 429, 132244. [Google Scholar] [CrossRef]
  27. Fedunik-Hofman, L.; Bayon, A.; Donne, S.W. Comparative Kinetic Analysis of CaCO3/CaO Reaction System for Energy Storage and Carbon Capture. Appl. Sci. 2019, 9, 4601. [Google Scholar] [CrossRef]
  28. Romano, M.C.; Martinez, I.; Murillo, R.; Arstad, B.; Blum, R.; Ozcan, D.C.; Ahn, H.; Brandami, S. Guidelines for Modeling and Simulation of Ca-Looping Processes; EERA: Berlin, Germany, 2012. [Google Scholar] [CrossRef]
  29. Rodriguez-Navarro, C.; Ruiz-Agudo, E.; Luque, A.; Rodriguez-Navarro, A.B.; Ortega-Huertas, M. Thermal decomposition of calcite: Mechanisms of formation and textural evolution of CaO nanocrystals. Am. Miner. 2009, 94, 578–593. [Google Scholar] [CrossRef]
  30. Maciejewski, M.; Oswald, H.-R.; Reller, A. Thermal transformations of vaterite and calcite. Thermochim. Acta 1994, 234, 315–328. [Google Scholar] [CrossRef]
  31. Brown, M.E.; Maciejewski, M.; Vyazovkin, S.; Nomen, R.; Sempere, J.; Burnham, A.; Opfermann, J.; Strey, R.; Anderson, H.L.; Kemmler, A.; et al. Computational Aspects of Kinetic Analysis: Part A: The ICTAC Kinetics Project-Data, Methods and Results. Thermochim. Acta 2000, 355, 125–143. [Google Scholar] [CrossRef]
  32. Mianowski, A.; Radko, T.; Siudyga, T. Kinetic Compensation Effect of Isoconversional Methods. React. Kinet. Catal. Lett. 2021, 132, 37–58. [Google Scholar] [CrossRef]
  33. Maciejewski, M. Computational Aspects of Kinetic Analysis: Part B. The Decomposition Kinetics of Calcium Carbonate Revisited, Ore Some Tips on Survival in the Kinetic Minefield. Thermochim. Acta 2000, 355, 145–154. [Google Scholar] [CrossRef]
  34. Maciejewski, M. Somewhere between fiction and reality. The usefulness of kinetic data of solid-state reactions. J. Therm. Anal. Calorim. 1992, 38, 51–70. [Google Scholar] [CrossRef]
  35. Maciejewski, M.; Bałdyga, J. The influence of the pressure of the gaseous product on the reversible thermal decomposition of solids. Thermochim. Acta 1985, 92, 105–108. [Google Scholar] [CrossRef]
  36. Maciejewski, M.; Reller, A. How (un)reliable are kinetic data of reversible solid-state decomposition processes? Thermochim. Acta 1987, 110, 145–152. [Google Scholar] [CrossRef]
  37. Maciejewski, M. The application of kinetic parameters to the investigation of thermal stability determined from rising temperature experiments. Thermochim. Acta 1987, 113, 287–303. [Google Scholar] [CrossRef]
  38. Powell, E.K.; Searcy, A.W. The Rate and Activation Enthalpy of Decomposition of CaCO3. Met. Trans. B 1980, 11, 427–432. [Google Scholar] [CrossRef]
  39. Georgieva, V.; Vlaev, L.; Gyurova, K. Non-Isothermal Degradation Kinetics of CaCO3 from Different Origin. J. Chem. 2012, 2013, 872981. [Google Scholar] [CrossRef]
  40. Britton, H.T.S.; Gregg, S.J.; Winsor, G.W. The calcination of dolomite part I.—The kinetics of the thermal decomposition of calcite and of magnesite. Trans. Faraday Soc. 1952, 48, 63–69. [Google Scholar] [CrossRef]
  41. Gallagher, P.K.; Johnson, D.W., Jr. The effects of sample size and heating rate on the kinetics of the thermal decomposition of CaCO3. Thermochim. Acta 1973, 6, 67–83. [Google Scholar] [CrossRef]
  42. L’vov, B.V.; Ugolkov, V.L. Peculiarities of CaCO3, SrCO3 and BaCO3 decomposition in CO2 as a proof of their primary dissociative evaporation. Thermochim. Acta 2004, 410, 47–55. [Google Scholar] [CrossRef]
  43. Zsako, J.; Arz, H.E. Kinetic analysis of thermogravimetric data. J. Therm. Anal. Calorim. 1974, 6, 651–656. [Google Scholar] [CrossRef]
  44. Beruto, D.; Searcy, A.W. Use of the Langmuir method for kinetic studies of decomposition reactions: Calcite (CaCO3). J. Chem. Soc. Faraday Trans. 1974, 70, 2145–2153. [Google Scholar] [CrossRef]
  45. Fedunik-Hofman, L.; Bayon, A.; Hinkley, J.; Lipiński, W.; Donne, S.W. Friedman method kinetic analysis of CaO-based sorbent for high-temperature thermochemical energy storage. Chem. Eng. Sci. 2019, 200, 236–247. [Google Scholar] [CrossRef]
  46. Gallagher, P.K.; Johnson, D.W., Jr. Kinetics of the thermal decomposition of CaCO3 in CO2 and some observations on the kinetic compensation effect. Thermochim. Acta 1976, 14, 255–261. [Google Scholar] [CrossRef]
  47. Valverde, J.M.; Medina, S. Crystallographic transformation of limestone during calcination under CO2. Phys. Chem. Chem. Phys. 2015, 17, 21912–21926. [Google Scholar] [CrossRef]
  48. Valverde, J.M. On the negative activation energy for limestone calcination at high temperatures nearby equilibrium. Chem. Eng. Sci. 2015, 132, 169–177. [Google Scholar] [CrossRef]
  49. Hotta, M.; Tone, T.; Favergeon, L.; Koga, N. Kinetic Parameterization of the Effects of Atmospheric and Self-Generated Carbon Dioxide on the Thermal Decomposition of Calcium Carbonate. J. Phys. Chem. C 2022, 126, 7880–7895. [Google Scholar] [CrossRef]
  50. Hotta, M.; Koga, N. Extended kinetic approach to reversible thermal decomposition of solids: A universal description considering the effect of the gaseous product and the kinetic compensation effect. Thermochim. Acta 2024, 733, 179699. [Google Scholar] [CrossRef]
  51. Hotta, M.; Koga, N. Physicogeometrical Kinetic Insight into the Acceleration Effect of Atmospheric Water Vapor on Thermal Decomposition of Calcium Carbonate. J. Phys. Chem. C 2024, 128, 11583–11597. [Google Scholar] [CrossRef]
  52. Beruto, D.; Searcy, A.W. Calcium oxides of hight reactivity. Nature 1976, 263, 221–222. [Google Scholar] [CrossRef]
  53. Towe, K.M. Ultrastructure of calcite decomposition in vacuo. Nature 1978, 274, 239–240. [Google Scholar] [CrossRef]
  54. Beruto, D.T.; Searcy, A.W.; Kim, M.G. Microstructure, kinetic, structure, thermodynamic analysis for calcite decomposition: Free-surface and powder bed experiments. Thermochim. Acta 2004, 424, 99–109. [Google Scholar] [CrossRef]
  55. Ma, Y.; Tian, P.; Bounmyxay, M.; Zeng, Y.; Wang, N. Calcium Carbonate@silica Composite with Superhydrophobic Properties. Molecules 2021, 26, 7180. [Google Scholar] [CrossRef] [PubMed]
  56. Bhatia, S.K.; Perlmutter, D.D. Effect of the Product Layer on the Kinetics of the CO2-Lime Reaction. AIChE J. 1983, 29, 79–86. [Google Scholar] [CrossRef]
  57. Gupta, H.; Fan, L.-S. Carbonation-Calcination Cycle Using High Reactivity Calcium Oxide for Carbon Dioxide Separation from Flue Ga. Ind. Eng. Chem. Res. 2002, 41, 4035–4042. [Google Scholar] [CrossRef]
  58. Lee, D.K. An apparent kinetic model for the carbonation of calcium oxide by carbon dioxide. Chem. Eng. J. 2004, 100, 71–77. [Google Scholar] [CrossRef]
  59. Sun, P.C.; Grace, J.R.; Lim, C.J.; Anthony, E.J. Determination of intrinsic rate constants of the CaO–CO2 reaction. Chem. Eng. Sci. 2008, 63, 47–56. [Google Scholar] [CrossRef]
  60. Grasa, G.; Murillo, R. Application of the Random Pore Model to the Carbonation Cyclic Reaction. AIChE J. 2009, 55, 1246–1255. [Google Scholar] [CrossRef]
  61. Rouchon, L.; Favergeon, L.; Pijolat, M. Analysis of the kinetic slowing down during carbonation of CaO by CO2. Therm. Anal. Calorim. 2013, 113, 1145–1155. [Google Scholar] [CrossRef]
  62. Ooi, B.K.H.; Marek, E.J. Kinetics of CO2 Capture with Calcium Oxide during Direct Air Capture in a Fluidized Bed. Energy Fuels 2024, 38, 22290–22297. [Google Scholar] [CrossRef]
  63. Mianowski, A.; Urbańczyk, W. Isoconversional Methods in Thermodynamic Principles. J. Phys. Chem. A 2018, 122, 6819–6828. [Google Scholar] [CrossRef]
  64. Lyon, R.E. A Physical Basis for Kinetic Compensation. J. Phys. Chem. A 2023, 127, 2399–2406. [Google Scholar] [CrossRef] [PubMed]
  65. Bracken, P. Free Energy Differences in Nonequilibrium Thermodynamic Processes. J. Phys. Chem. A 2024, 128, 6999–7004. [Google Scholar] [CrossRef] [PubMed]
  66. Ike, E. Arrhenius-Type Relationship of Viscosity as a Function of Temperature for Mustard and Cotton Seed Oils. Niger. Ann. Pure Appl. Sci. 2020, 3, 144–155. [Google Scholar] [CrossRef]
  67. Mianowski, A.; Baraniec, I. Three-parametric equation in evaluation of thermal dissociation of reference compound. J. Therm. Anal. Calorim. 2009, 96, 179–187. [Google Scholar] [CrossRef]
  68. Mianowski, A.; Baraniec-Mazurek, I.; Bigda, R. Some remarks on equilibrium state in dynamic condition. J. Therm. Anal. Calorim. 2011, 107, 1155–1165. [Google Scholar] [CrossRef]
  69. Seeman, J.I. The Curtin-Hammett Principle and the Winstein-Holness Equation, New Definition and Recent Extensions to Classical Concepts. J. Chem. Educ. 1986, 63, 42–48. [Google Scholar] [CrossRef]
  70. Lumry, R.; Eyring, H. Conformation Changes of Proteins. J. Phys. Chem. 1954, 58, 110–120. [Google Scholar] [CrossRef]
  71. Sanchez-Ruiz, J.M. Theoretical analysis of Lumry-Eyring models in differentia scanning calorimetry. Biophys. J. 1992, 61, 921–935. [Google Scholar] [CrossRef]
  72. Lente, G. Deterministic Kinetics in Chemistry and Systems Biology: The Dynamics of Complex Reaction Networks; Springer Briefs in Molecular Science; Springer: Cham, Switzerland, 2014; ISBN 978-3-319-15482-4. [Google Scholar] [CrossRef]
  73. Błażejowski, J.; Zadykowicz, B. Computational Prediction of the Pattern of Thermal Gravimetry Data for the Thermal Decomposition of Calcium Oxalate Monohydrate. J. Therm. Anal. Calorim. 2013, 113, 1497–1503. [Google Scholar] [CrossRef]
  74. Uliasz-Bocheñczyk, A.; Mokrzycki, E. Mineralna karbonatyzacja przy zastosowaniu surowców naturalnych metodą redukcji CO2? (Mineral carbonation using natural raw materials as a CO2 reduction method?). Gospod. Surowcami Miner. 2014, 30, 99–110. [Google Scholar] [CrossRef]
  75. Stec, M.; Tatarczuk, A.; Więcław-Solny, L.; Krótki, A.; Spietz, T.; Wilk, A.; Śpiewak, D. Experimental results of split-flow modification for post-combustion CO2 capture process. In Green Energy and Technology; Springer: Cham, Switzerland, 2018; pp. 441–453. [Google Scholar] [CrossRef]
  76. Tatarczuk, A.; Tańczyk, M.; Więcław-Solny, L.; Zdeb, J. Pilot plant results of amine-based carbon capture with heat integrated stripper. Appl. Energy 2024, 367, 123416. [Google Scholar] [CrossRef]
  77. Krótki, A.; Spietz, T.; Dobras, S.; Chwoła, T.; Tatarczuk, A.; Żórawski, D.; Skowron, K.; Skrzyniecki, D.; Hulisz, P. Carbon capture pilot study in Solvay soda ash process. Appl. Energy 2024, 380, 124995. [Google Scholar] [CrossRef]
  78. Krótki, A.; Chwoła, T.; Więcław-Solny, L.; Tatarczuk, A.; Spietz, T.; Dobras, S.; Zdeb, J. Advancements in CO2 hydrogenation–Investigating a CNG pilot plant in Poland. Fuel 2025, 381, 133599. [Google Scholar] [CrossRef]
  79. Krótki, A.; Spietz, T.; Dobras, S.; Chwoła, T.; Tatarczuk, A.; Żórawski, D.; Skowron, K.; Kiedzik, Ł.; Kowalska, B.; Skrzyniecki, D. Initial carbon capture pilot study in Solvay soda ash process. Chem. Eng. Res. Des. 2025, 205, 174–187. [Google Scholar] [CrossRef]
  80. Liendo, F.; Arduino, M.; Deorsola, F.A.; Bensaid, S. Nucleation and growth kinetics of CaCO3 crystals in the presence of foreign monovalent ions. J. Cryst. Growth 2022, 578, 126406. [Google Scholar] [CrossRef]
  81. Ufnalski, W. Równowagi Chemiczne; Wydawnictwa Naukowo-Techniczne: Warszawa, Poland, 1995. (In Polish) [Google Scholar]
  82. Mianowski, A.; Urbańczyk, W. Thermal dissociation in terms of the second law of chemical thermodynamics. J. Therm. Anal. Calorim. 2016, 126, 863–870. [Google Scholar] [CrossRef]
Figure 1. A graphical illustration of the reaction pathway for the decomposition of substrate A and its synthesis in the solid phase representing Equations (18) and (23), Δg < 0.
Energies 18 00570 g001
Figure 2. Arrhenius relationship as lnkn vs. 1/T for Equation (39)—theoretic approach and for experimental data (calcite). Solid lines—Equation (39), isothermal conditions, used experimental points are from [63] for dynamic conditions, and determining ∆G for Equation (39) for heating rates in the range q = 1−25 Kmin−1. α—conversion degree and S—supersaturation. Selected as proposed [23].
Energies 18 00570 g002
Figure 3. Temperature profiles of the components of Equation (38) as the difference between [Equations (40) and (41)] with reference to Equation (42) for the nucleation Equation (38), in the temperature range of 800–1300 K, for T e q = 859.18 K, Δ n G = 0.
Energies 18 00570 g003
Figure 4. Reaction/process paths presented by the rate constant: (a) the Equation (23) model together with Equation (24), (b) the reaction/process for the consecutive–parallel transformation, reduced to the Curtin–Hammett law [69], and (c) the reaction/process for the consecutive transformation according to the Lumry–Eyring model [70,71].
Energies 18 00570 g004
Disclaimer/Publisher’s Note: The statements, opinions and data contained in all publications are solely those of the individual author(s) and contributor(s) and not of MDPI and/or the editor(s). MDPI and/or the editor(s) disclaim responsibility for any injury to people or property resulting from any ideas, methods, instructions or products referred to in the content.