1. Introduction
Industry represents a substantial global energy consumer, responsible for 37% of worldwide energy use and 36% of associated carbon dioxide emissions [
1,
2]. The European food industry plays a significant role in this energy-intensive sector [
3]. In 2014, the food industry achieved the highest turnover among European industries, reaching EUR 1095 billion, and employed the largest workforce, with 4.24 million jobs [
4]. The dairy industry contributes substantially to this economic activity, holding the third-largest turnover within the European food sector [
5].
The industrial landscape of Portugal in 2016 was significantly shaped by the food industry [
6]. This sector led in sales of products and services, generating EUR 10.7 billion, representing 13.8% of the entire Portuguese industry’s sales [
7]. Furthermore, it demonstrated a substantial employment footprint, providing 20% of all jobs within the manufacturing industry [
8]. The food industry also exhibited a broad corporate base, encompassing approximately 135,000 companies [
9], constituting 14% of all companies in the industrial sector [
10]. However, this large number of companies masked a concentrated production reality where a few large companies dominated output. This concentration is evident in that 80% of food companies, employing ten or fewer workers, generated only 9% of the food industry’s turnover [
11]. In contrast, the ten largest companies were responsible for approximately 25% of the industrial food production [
12]. The broader industrial context reveals that industry was the primary consumer of electrical energy, accounting for 37.2% of the national total [
13].
Within Portugal’s dynamic food industry landscape, the dairy sector commands a notable presence [
14]. This sector contributes significantly to the national economy, boasting a turnover of EUR 1.4 billion, which translates to an average of EUR 3.4 million per company. Cow milk stands as the cornerstone of this industry, representing a dominant 95% share of the total milk production, amounting to a considerable 1,962,494 kilolitres. The primary utilisation of this milk volume lies in the production of fresh dairy products, largely destined for direct human consumption. However, a significant portion, specifically 27%, is dedicated to the manufacturing of cheese, showcasing the diversity and breadth of Portugal’s dairy processing activities.
Most of the cheese produced in Portugal is made from cow’s milk (75%; 62,460 tons), followed by ewe’s milk (14%; 11,844 tons), a mixture of milk (7%; 6035 tons), and finally, goat’s milk (4%; 2966 tons). According to the DGAV [
15], 441 cheese-making industries operate using raw milk, primarily from ewes and goats. The main products from these processing units are fresh and ripened cheese and cheese curd.
In the United States, the dairy industry accounts for 13% of the food industry’s total energy consumption. This energy is derived from two principal sources: the electrical grid and the combustion of fuels. Electricity is used for cooling systems, pumps, fans, compressed air, and lighting. The majority (80%) of fuel consumption is dedicated to heating water or generating steam, which is employed in production and cleaning processes. Within the dairy industry’s electricity usage, 40% is attributed to powering machinery, while 31% is consumed by processing, cooling, freezing, and cold storage [
16].
Portuguese food industries consumed 0.55 million tons of oil equivalent in 2010, constituting 10% of the total energy consumption of all manufacturing industries. This figure aligns with the average energy consumption of food industries across the European Union. Generally, these industries rely heavily on diesel and electricity, while natural gas and cogeneration usage remains low. The significant role of food industries in energy consumption is also evident in other nations, such as the United Kingdom, where they account for 11% of industrial energy use, and the United States, where they represent 4.4% [
17].
Traditional cheese is a highly perishable food product, and its production and storage are subject to stringent hygiene and food safety regulations, including Regulations 178/2002, 852/2004, 853/2004, and 882/2004. Due to cheese’s perishable nature, refrigeration is critical for maintaining the quality and safety of both raw materials and finished products [
18].
Cooling systems are substantial energy consumers, accounting for 15–20% of global energy use. This high energy demand stems not only from the power requirements of individual units but also from the sheer number of cooling systems in operation worldwide [
19,
20,
21,
22].
Within the dairy sector, cooling systems often represent an even larger proportion of a facility’s energy consumption. Studies indicate that cooling accounts for 25.5% of energy use in French dairy facilities, 35% in the United States, and upwards of 40% in the United Kingdom [
16,
23,
24].
The substantial energy demands of cooling systems are exacerbated by the prevalence of small-scale companies within the food industry sector in many countries, including Portugal [
19]. Furthermore, cheese production is particularly energy intensive due to the combined energy requirements of both cooling and heating processes.
Opportunities exist to reduce electricity consumption through improved operational practices and diligent maintenance of facilities and cooling components. Optimising operational procedures and implementing sound building construction practices can yield up to 15% energy savings. Similarly, maintaining or replacing cooling system components can lead to energy savings ranging from 15% to 40% [
25,
26,
27]. The Netherlands serves as a compelling example: despite increased dairy production between 1998 and 2002, the country achieved a 9.3% reduction in energy consumption within the dairy industry during the same period [
28].
To achieve high energy efficiency in both new and existing facilities, several key considerations should be addressed [
26]. For new construction, an integrated systems approach is recommended, involving careful selection of compressors, evaporators, condensers, heat transfer mechanisms, and refrigerants. System efficiency should be evaluated on an annual basis. In existing facilities, a thorough assessment of cooling needs is necessary. This includes evaluating and improving thermal insulation, optimising refrigerant distribution and system controls, exploring waste heat recovery opportunities (e.g., from condensers), implementing a comprehensive maintenance program, and conducting regular performance assessments. Compressors, which can account for up to 70% of electricity consumption in cooling systems, deserve particular attention. Careful consideration should be given to the type, quantity, and power rating of these critical components [
29].
The energy efficiency of a manufacturing facility can be assessed and compared to similar facilities using various energy consumption indicators, such as Specific Energy Consumption, Usage of Cold Room Volume, and Normalised Power Capacity. These indicators facilitate comparisons across different operating conditions by minimising the influence of external factors. This normalisation process also helps identify potential sources of energy inefficiency [
30].
Specific Energy Consumption is a widely used metric for comparing energy efficiency across industrial facilities. It is calculated as the ratio of energy consumed (electrical, thermal, or both) during a process or activity to the weight or volume of raw materials or finished products [
19,
31].
The Usage of Cold Room Volume is calculated as the ratio of raw materials stored within cold rooms to the total volume of those rooms. This metric helps identify cold storage spaces that are either too large or too small, both of which can significantly impact energy efficiency [
32].
Normalised Power Capacity, the ratio of refrigeration compressor power to cold room volume, helps identify potentially oversized or undersized compressors, thus revealing inefficiencies in the cold generation system [
32].
Specific Energy Consumption indicators have been employed to assess the potential for energy savings in various industrial activities and processes. Studies suggest that the highest SEC values observed in dairy processing could be significantly reduced, potentially by 50% or more, through technological advancements, improved equipment maintenance, and the adoption of energy-conscious practices [
31].
Refrigeration systems in cold storage can account for a substantial portion (up to 70%) of a manufacturing facility’s total energy consumption. Therefore, optimising these systems offers significant potential for energy savings. Several strategies can be implemented to achieve these savings, including establishing a well-defined loading dock area; dehumidifying the air to be cooled to reduce its thermal load; using high-efficiency equipment (e.g., floating head pressure control systems, sub-cooling evaporators, high-efficiency condensers, variable-speed motors); upgrading insulation panels; employing efficient lighting systems; and minimising air infiltration through doors [
33].
Schmitt et al. [
34] compare the sustainability of local and global food supply chains using cheese production in Switzerland and the UK as case studies. Four cheese supply chains are analysed: L’Etivaz (local) and Gruyère (global) in Switzerland, and Single Gloucester (local) and Cheddar (global/dual) in the UK. The research employs a multi-dimensional framework, considering environmental, economic, social, ethical, and health aspects of sustainability. Eight performance attributes are used for comparison: affordability, value creation and distribution, information and communication, consumer behaviour, resource use, biodiversity, nutrition, and animal welfare.
The findings suggest that local cheese production excels in areas like added value creation and distribution, animal welfare, and biodiversity. Global chains, however, demonstrate advantages in affordability, efficiency, and some environmental indicators. The study highlights the complexity of comparing local and global systems and the existence of hybrid arrangements. It emphasises the importance of considering multiple dimensions of sustainability and the trade-offs involved in different production scales. The analysis is primarily qualitative, aiming to identify critical issues and trade-offs rather than relying solely on quantitative metrics.
Canellada et al. [
35] analyse the environmental impact of a small-scale cheese factory in Southern Europe, offering a detailed life cycle assessment and calculating its carbon footprint. The results reveal that milk production (specifically cow feeding) is the primary driver of environmental impact, accounting for a substantial portion of the overall footprint. The use of whey to feed pigs significantly reduces the overall impact, demonstrating the importance of byproduct utilisation. The study calculates a carbon footprint of 10.2 kg CO
2 eq kg
−1 of cheese, a figure comparable to other full-fat cheeses. The research highlights the influence of cheese composition (fat and dry extract content) on the carbon footprint and suggests that the scale of production has a negligible effect. The LCA considers various impact categories, including natural land transformation, terrestrial ecotoxicity, agricultural and urban land occupation, freshwater and marine ecotoxicities, metal depletion, and ionising radiation. The study emphasises the importance of allocation methods in LCA analysis, particularly in multi-product systems where both cheese and food-grade whey powder are produced. The direct use of whey as animal feed is recognised as a significant factor in reducing environmental burdens.
Verduna et al. [
36] compare four dairy farming scenarios in the Italian Alps, evaluating their environmental, economic, and social sustainability. The scenarios include two mountain pasture systems and two valley-based systems. Results show that Mountain Pasture Grazing with silage offers the best balance of sustainability, demonstrating lower environmental impacts due to reduced greenhouse gas emissions and land use, while also achieving good economic performance with a gross margin of EUR 1.02 kg
−1 of cheese. While Alpine Pasture Grazing has the lowest environmental impact, its economic viability is challenged by a lower gross margin (EUR 0.67 kg
−1). The study highlights the social benefits of mountain pasture systems in preserving traditional practices and biodiversity, while the valley-based systems, particularly Intensive Winter Feeding, show higher environmental impacts due to reliance on purchased feed. Overall, the research emphasises the importance of a multi-criteria approach to assess the sustainability of different farming systems.
Nunes et al. [
37] analyse the environmental impacts of producing Beira Baixa cheese, a regional sheep cheese from Portugal, using a cradle-to-gate approach. The study focuses on four impact categories: climate change, terrestrial acidification, freshwater eutrophication, and marine eutrophication. Results show that milk production is the most impactful stage, primarily due to fodder cultivation for animal feed (fertilisation and land preparation). Enteric fermentation and manure management also contribute significantly. The cheesemaking process itself has a negligible environmental impact. Specifically, for each kilogram of Beira Baixa cheese, the study estimates contributions of 8.9 kg CO
2 eq. to climate change, 57.9 g SO
2 eq. to terrestrial acidification, 2.8 g PO
4 eq. to freshwater eutrophication, and 11.2 g N to marine eutrophication. The study concludes that promoting the cheese as environmentally friendly, given the relatively low impact of the cheesemaking stage, could be a viable marketing strategy.
Silva et al. [
38] explore best practices for enhancing energy efficiency in refrigeration applications within Portugal’s agri-food sector, where refrigeration accounts for a significant portion of energy consumption. It highlights opportunities for energy savings across various areas, from improving infrastructure insulation and optimising cold chamber layouts to implementing efficient lighting and utilising refrigerants with low global warming potential. The chapter emphasises the importance of optimising vapour compression refrigeration systems, compressed air systems, and steam/hot water systems through measures like leak detection, pressure optimisation, and heat recovery. Furthermore, it advocates for integrating renewable energy sources, such as solar thermal and photovoltaic systems, and implementing power management strategies based on consumption analysis. By adopting these best practices, agri-food companies can substantially reduce energy use, enhance competitiveness, and contribute to environmental sustainability by minimising their carbon footprint.
Martínez and Poveda [
39] characterise cooling equipment in Colombia’s meat, dairy, and fruit and vegetable sectors, aiming to understand energy consumption and identify areas for improvement. A survey of 891 companies revealed the most common cooling systems: refrigerators (used by 48% of respondents), cold rooms (47%), and centralised systems (43%). The meat sector predominantly uses cold rooms (3308 estimated units) and refrigerators, while air conditioning is prevalent in dairy (2240 units) and fruits/vegetables. The study quantifies equipment based on cooling capacity, energy consumption, and refrigerants used. It highlights the need for updated equipment and better maintenance practices to improve energy efficiency and reduce environmental impact. The research provides valuable data for policymakers and industry stakeholders to develop strategies for sustainable cooling in the Colombian food industry.
Egas et al. [
40] examine the energy efficiency of small dairy production systems, including both farming and processing stages. Nine small dairy systems in Northwest Spain were audited, revealing that milk pasteurisation and cheesemaking are the most energy-intensive processes, accounting for 47% and 35% of total energy consumption, respectively. Farming activities contribute 18% of the total energy use. The average energy consumption per litre of processed milk was found to be 0.55 kWh. The study also assesses the environmental impact, estimating 0.34 kg CO
2 equivalent emissions per litre of milk. Proposed improvements, such as heat recovery and refrigeration system optimisation, could reduce energy consumption by 16% and CO
2 emissions by 17%. These findings highlight the potential for enhancing sustainability in small dairy systems through targeted energy efficiency measures.
This research thoroughly explores the energy dynamics within cheese production facilities, aiming to construct a comprehensive model for evaluating and optimising cooling systems. The study begins with a detailed characterisation of existing cheese production companies, encompassing both physical layouts and energy consumption patterns. A key focus is the identification and characterisation of current cooling technologies, leading to the establishment of precise physical and energetic indicators for benchmarking purposes. These indicators will serve as critical reference values for energy consumption comparisons across similar companies. Moreover, the study investigates the intricate relationships between key operational parameters, including raw material quantities, electricity consumption, cold storage capacity, and air compressor power. This detailed analysis will culminate in developing a robust model, capable of not only evaluating existing cooling facilities but also providing invaluable guidance for the design and sizing of new, energy-efficient cooling systems, ultimately promoting sustainability within the cheesemaking sector.
2. Materials and Methods
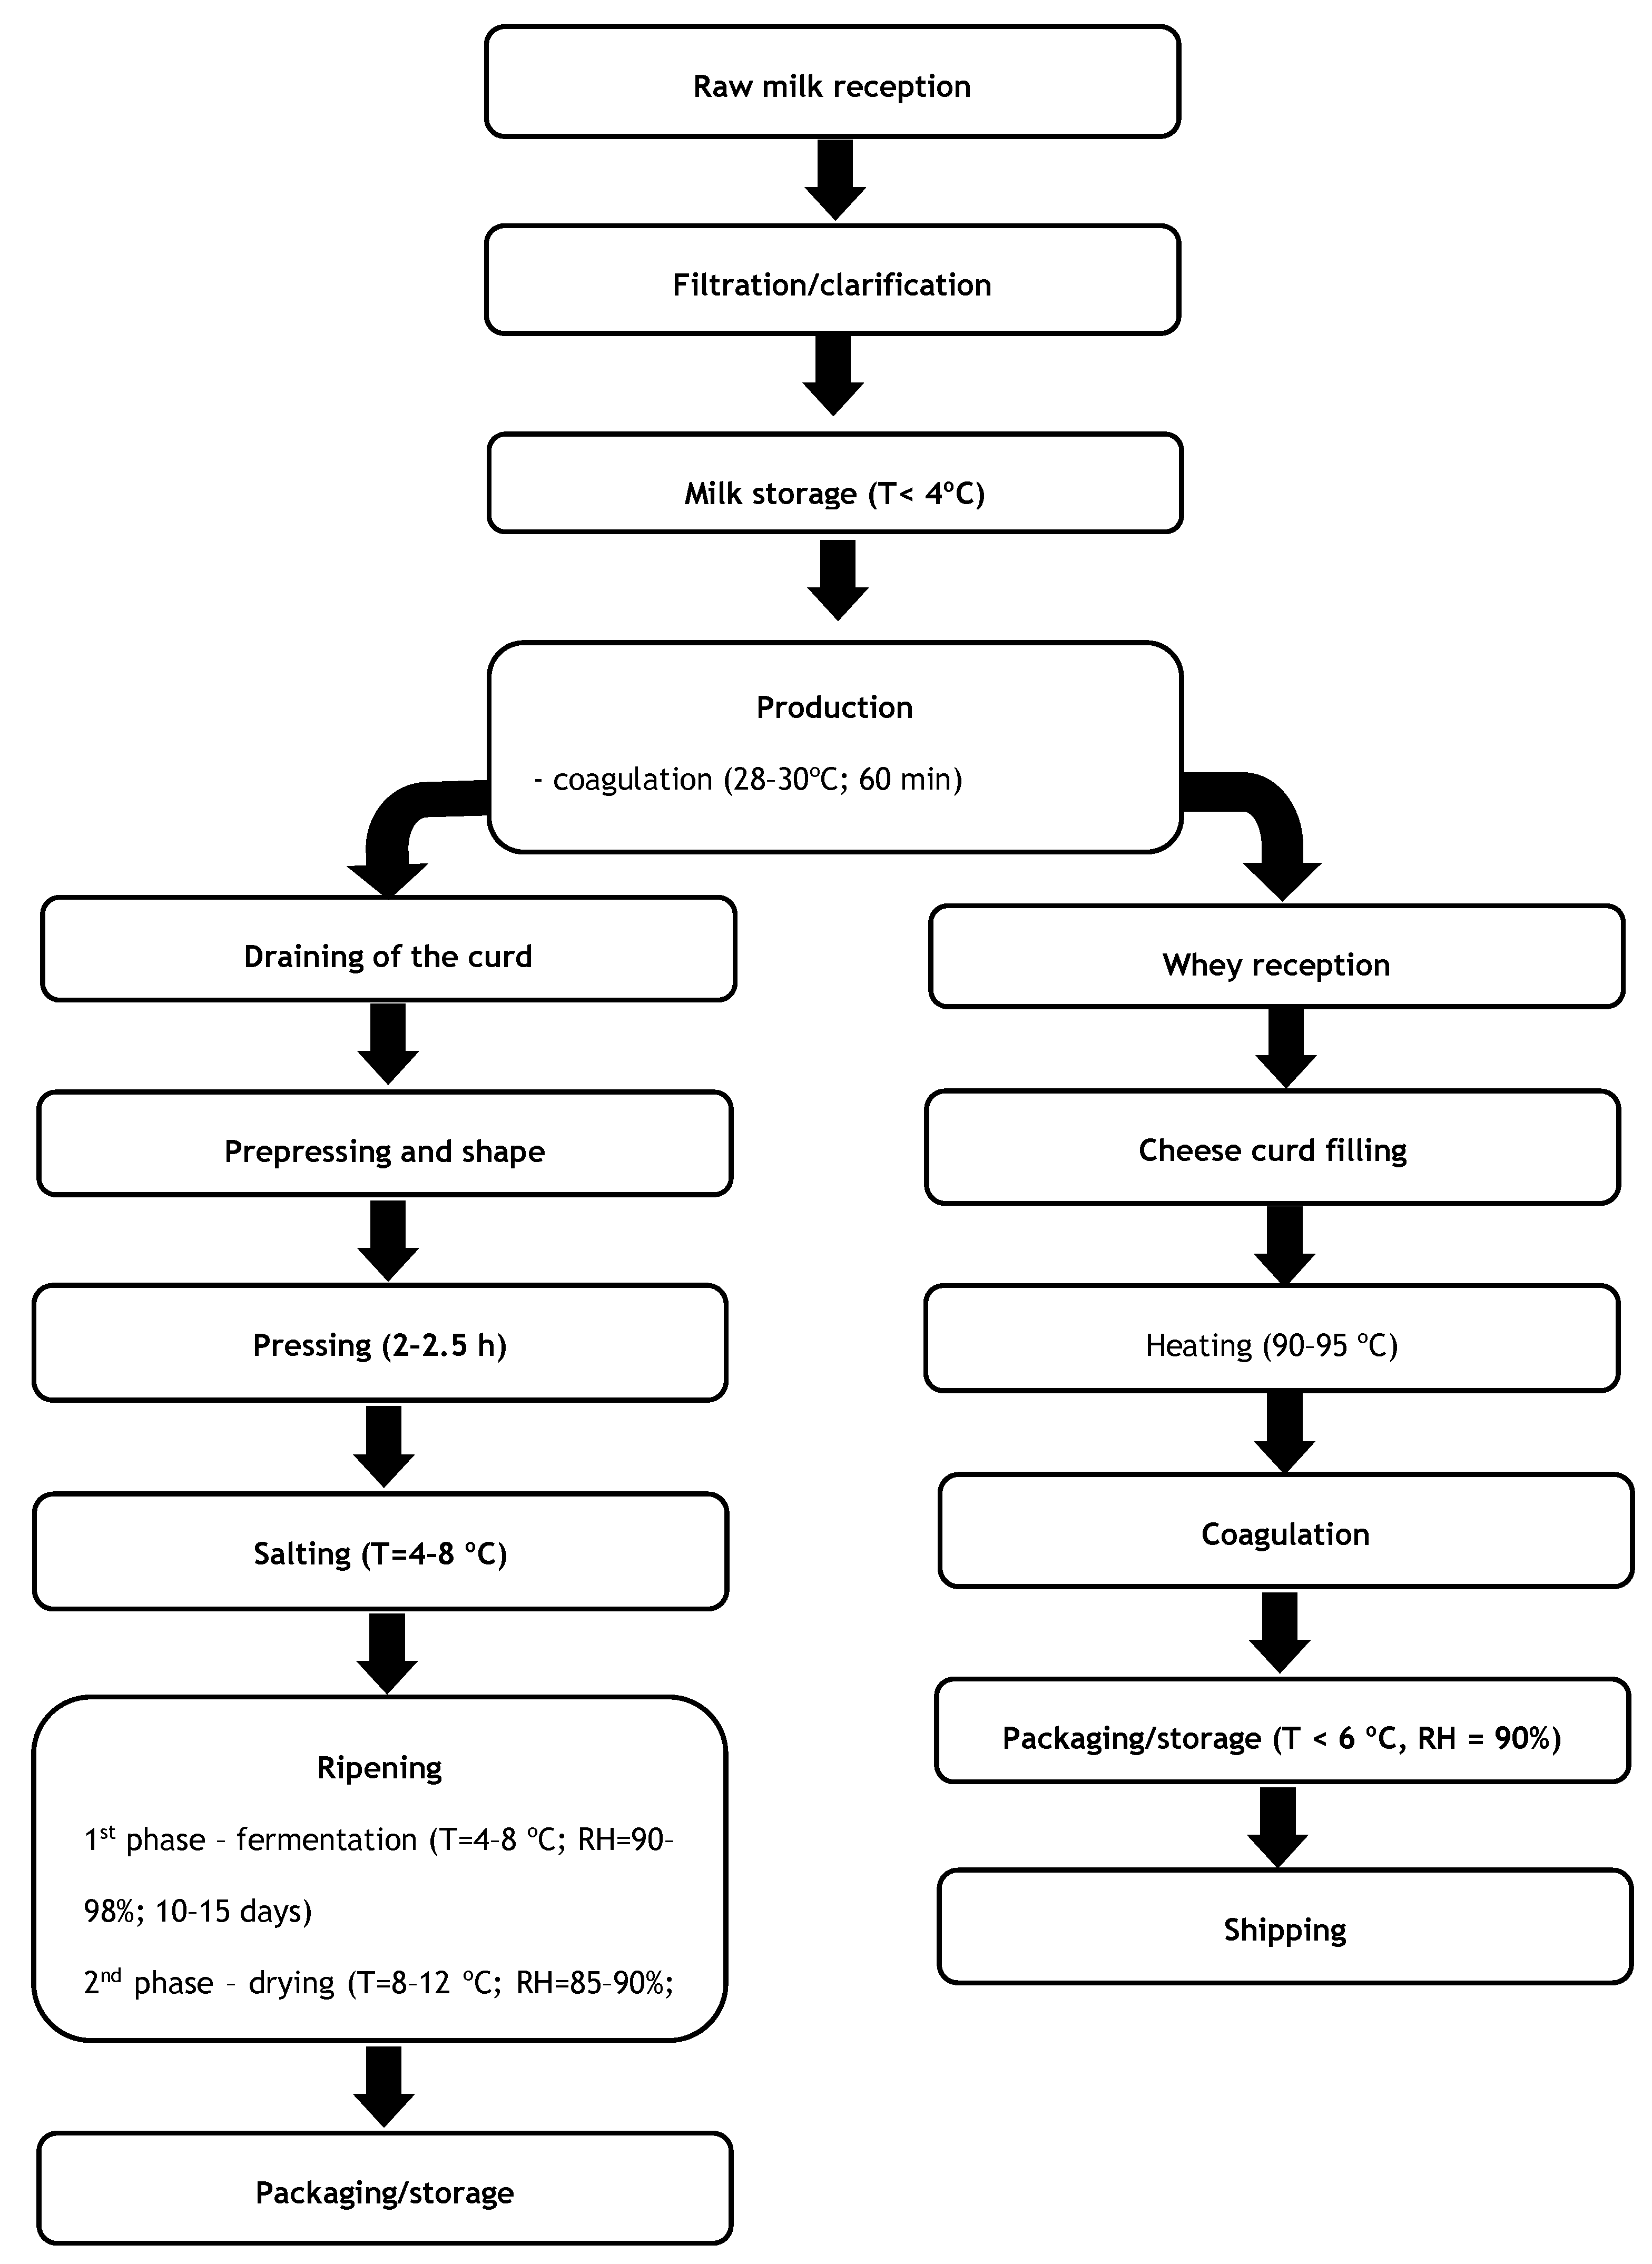
This study encompassed a selection of 31 traditional cheesemaking facilities, categorised into two distinct groups: 13 Traditional Industrial Producers (TIPs, designated as plants 1–13) employing technology-driven processes for all production stages, and 18 Traditional Handmade Producers (THPs, designated as plants 14–31) incorporating manual techniques for specific operations such as salting, pressing, and washing. All participating facilities are situated within the Beira Interior and Alentejo regions of Portugal. The cheese production process, commencing with raw milk and following a consistent sequence across all surveyed facilities, is visually summarised in
Figure 1. Ewe’s milk and goat’s milk constitute the primary raw materials, used in the production of ripened cheeses crafted from either milk type individually or a blend of both. Furthermore, certain cheesemaking facilities within the study group also produce fresh cheese, derived from pasteurised milk, and curd cheese, which undergoes a specific production process involving maintaining the whey at a temperature range of 90–95 °C for a duration of 2 to 2.5 h, followed by a filtration treatment. Upon completion of the production process, the curd cheese is stored in cold rooms maintained at a temperature range of 4–6 °C and a relative humidity range of 85–90%. The maturation period for ripened cheese typically spans between 30 and 45 days. Data acquisition for this study was conducted through direct observation during on-site visits to each facility, supplemented by a structured inquiry encompassing various aspects of the cheesemaking operations, including a general overview of the company, quantification of raw materials, and finished products, energy consumption patterns, characterisation of refrigerating and freezing rooms, assessment of environmental conditions, specifications of cooling systems, and detailed descriptions of the production processes employed.
The collected data were compiled and organised within a digital database using Microsoft Access 2007 software. Internal and external temperature and relative humidity measurements for the cold rooms were recorded using a Testo 435-2 instrument (Testo SE & Co. KGaA, Titisee-Neustadt, Germany) equipped with temperature probes (ranging from −20 °C to +70 °C) and relative humidity probes (ranging from 0% to 100%). The accuracy of this equipment was documented as 0.3 °C for temperature and 2% for relative humidity. A Testo 880-4 infrared thermography device (Testo SE & Co. KGaA, Titisee-Neustadt, Germany) was employed to conduct a comprehensive visual inspection of surfaces and to pinpoint potential thermal bridge areas. Temperature measurements at these identified thermal bridges were subsequently taken using a Testo 435-2 instrument (Testo SE & Co. KGaA, Titisee-Neustadt, Germany) in conjunction with a type K thermocouple probe (ranging from −60 °C to +300 °C), possessing an accuracy of 0.5 °C. Temperature and relative humidity data within the cold rooms and facility lofts were logged using four data loggers –two Microlite (Fourtec–Fourier Technologies Ltd., Rosh HaAyin, Israel) and two Lascar Electronics (Lascar Electronics Ltd., Whiteparish, UK) units–, each with an accuracy of 0.5 °C for temperature and 2% for relative humidity. Cold room dimensions were ascertained using a Bosch DLE-40 infrared rangefinder (Robert Bosch GmbH, Gerlingen, Germany), which has a maximum range of 40 m and an accuracy of 1.5 mm. An Elcontrol—Energy Explorer power analyser (Elcontrol Energy Net S.r.l., Pontecchio Marconi, Italy), with a voltage range of 15–750 V and a current range of 20–1000 A, and accuracies of 0.53–2 V and 0.04–2 A, respectively, was used to determine the total energy consumption of the facilities and the energy consumption specifically attributable to the refrigeration systems. The total energy consumption was also independently verified against monthly electricity bills provided by the electricity supplier.
The nominal electrical power of the compressors was determined by assessing the evaporation and condensation temperatures, along with the degree of overheating, using manufacturers’ catalogues and software resources. This methodology was validated through a process of randomly selecting a subset of compressors and measuring the electric current intensity, voltage input, and power factor using an Escort ECT-620 clamp meter (Escort Instruments Corporation, Taipei, Taiwan), which has a documented accuracy of 1.5%. The observed discrepancies between the two measurement methods consistently remained below 10%. Three key energy performance indicators were employed in the analysis: Specific Energy Consumption, Usage of Cold Rooms’ Volume, and Nominal Power of compressors per Cold rooms’ volume.
where
E represents the annual electrical energy consumption, and
RM the quantities of raw materials processed.
where
V represents the cold room volume.
where
P represents the power of the compressors.
The statistical analysis of data was performed with the SPSS Statistics software, version 26 (IBM Corporation, Armonk, NY, USA).
Studies in the literature have explored the Coefficient of Performance and Energy Efficiency Ratio values for various cooling systems. Water-cooled systems typically exhibit COP and EER values around 4.0, with some advanced technologies reaching up to 5.0. Heat pumps have been reported to achieve COP values up to 4, indicating that for every unit of electrical energy consumed, four units of thermal energy are produced [
41,
42].
The European Union has established specific COP and EER requirements for cooling systems as part of its energy efficiency standards. The EN 14511 standard defines the methodologies for calculating COP and EER for refrigeration units and heat pumps. These standards ensure that the energy performance of these systems aligns with EU criteria [
43].
Cooling systems employed in Portugal adhere to the European Union’s energy efficiency standards. Companies operating in the industrial refrigeration sector offer products compliant with EU standards, optimising energy performance.
3. Results and Discussion
A significant proportion (71%) of the cheesemaking facilities examined in this study reported an annual turnover of less than EUR 2 million, a figure notably lower than the average turnover of EUR 3.4 million observed within the broader Portuguese dairy industry. The remaining 29% of the analysed facilities demonstrated a turnover within the range of EUR 2 million to EUR 10 million. Annually, these manufacturing units process a volume of milk ranging from 38 kilolitres to 16,910 kilolitres, yielding a cheese production output between 6.5 tons and 2014 tons. The analysed companies played a significant role as employers within their respective regions. A total of 559 workers were employed across the companies studied, resulting in an average of 18 workers per industrial unit. This figure is higher than the national average of 15 workers per dairy company in Portugal [
44]. All the companies included in the analysis were categorised as either micro or small enterprises, reflecting the prevailing industrial landscape in Portugal [
45]. Within the Traditional Portuguese Hard Cheese category, only one company was classified as a micro-enterprise. In contrast, within the Traditional Portuguese Hard Cheese category, 61% of the companies fell into the micro-enterprise classification. Milk processing volumes exhibited seasonal variations, with a marked decrease during the summer months when some companies temporarily suspended operations. The physical structures of the companies primarily consisted of single-story buildings, occasionally with basements. Building dimensions were strongly correlated with the daily volume of milk processed. Our findings indicate that 42% of the companies occupied a covered area of 1000 m
2 or less, while 36% occupied an area between 1000 m
2 and 2000 m
2. Only 3% of the buildings had a covered area exceeding 4000 m
2. The choice of building materials played a crucial role in minimising thermal gains within the cold rooms and ensuring compliance with hygiene standards, such as those stipulated in Regulation No. 852/2004. Brick masonry was the predominant construction material, used in 87% of the buildings, followed by polyurethane panels in 10% of the buildings. A small percentage (3%) of buildings used both materials. Considering the typical thermal conductivity values of brick masonry (0.8 W m
−1K
−1) and polyurethane (0.03 W m
−1K
−1) [
45], it is evident that a 60 mm polyurethane panel offers superior insulation performance compared to a 300 mm brick masonry wall of the same surface area and under the same temperature gradient. Fibre cement sheets, known for their poor insulation properties, were the most prevalent roofing solution, employed in 58% of the cases. A significant majority (71%) of the manufacturing units had lofts with either no ventilation or minimal ventilation, contributing to heat buildup in these spaces. The age distribution of the plants revealed that 52% were between 11 and 20 years old, while 36% were between 21 and 30 years old.
Polyurethane panels constituted the most frequently used material in the construction of cold rooms, accounting for 48% of the observed cases. A combination of brick masonry and polyurethane panels was the second most common configuration, representing 39% of the cold rooms. The remaining 13% of cold rooms were constructed using a combination of brick masonry and cork panels. Among the polyurethane panels employed, the most prevalent thickness was 60 mm (42%), followed by 80 mm (39%) and 100 mm (19%). The thickness of brick masonry walls typically ranged from 250 mm to 300 mm.
Traditional Portuguese Hard Cheese facilities exhibited a greater number of cold rooms, and these rooms were also larger. This observation aligns with their higher average annual production of 478 tons, compared to 109 tons for Traditional Portuguese Hard Cheese. Our findings indicate that TIP facilities had an average of eight cold rooms, each with a volume of 33 cubic meters, while THP facilities averaged four cold rooms with a volume of 26 cubic meters per room. In over half of the facilities surveyed, the placement of cold rooms within the manufacturing unit was deemed suboptimal, often facing south or situated in warmer areas. Internal cold room conditions ranged from 4 to 14 °C in temperature and 55 to 92% relative humidity. During the initial ripening phase, the temperature and relative humidity are typically maintained between 4 and 8 °C and 92 and 98%, respectively. In the subsequent ripening phase, the temperature is raised to approximately 10 °C, and the relative humidity is lowered to around 85%. Towards the end of the ripening process, the temperature may reach up to 14 °C, while the relative humidity decreases to 60–65%. Certain cheese varieties are stored frozen at −8 °C.
In the study, a total of 217 cooling systems were analysed, 201 of which are direct expansion systems and 16 indirect circuit systems. These systems are broken down as follows: 32 individual refrigeration systems (14.7%), 3 direct-circuit refrigeration plants (1.4%), 16 indirect-circuit refrigeration plants (7.3%), 93 condensing units (42.6%), 5 compact units (2.3%), 7 mini air handling units (3.2%), and 62 air handling units (28.4%). The cooling systems employed in these facilities typically comprised hermetic compressors coupled with milk tanks, and semi-hermetic compressors for other cooling applications. These compressors were connected to a forced-convection condenser, which in turn supplied evaporators installed in the milk tanks and cold rooms. Medium-sized plants often incorporated air treatment units, while larger industrial plants featured both direct and indirect circuit central cooling systems. Indirect circuit systems were used for water or ice cooling, whereas direct circuit systems were employed for cooling milk and cold rooms. These larger plants also included negative cold systems for cheese freezing.
A total of 225 compressors were identified within the surveyed facilities. The vast majority (98%) of these were reciprocating compressors, with only a small fraction (2%) being scroll compressors. Semi-hermetic compressors were the most prevalent type, comprising 66% of the total, followed by hermetic compressors (23%) and open-type compressors (11%). Of the 217 cold production systems identified, 93% were direct expansion systems, and the remaining 7% were indirect expansion systems. Within this same sample, 43% were categorised as condensation units, 28% as air treatment units, 15% as individual cold production systems, 7% as indirect circuit cold centres, 3% as mini air treatment units, and 2% as compact units. Nearly all (99%) of the condensers employed forced convection cooling. Over half (54%) of the compressors had been in operation for more than 20 years, a factor potentially contributing to reduced energy efficiency. Indeed, research by Coquinot and Chapon suggests that the average lifespan of cold system equipment should be between 15 and 20 years, as energy efficiency tends to decline after this period.
The most used refrigerant fluids were R22 (45%), R404a (26%), and R134a (20.5%). R22 (chlorodifluoromethane) is a hydrochlorofluorocarbon with significant global warming and ozone depletion potential. While Regulation No. 1005/2009 permits the continued use of equipment containing R22, it prohibits repairs that require refilling the system with this refrigerant [
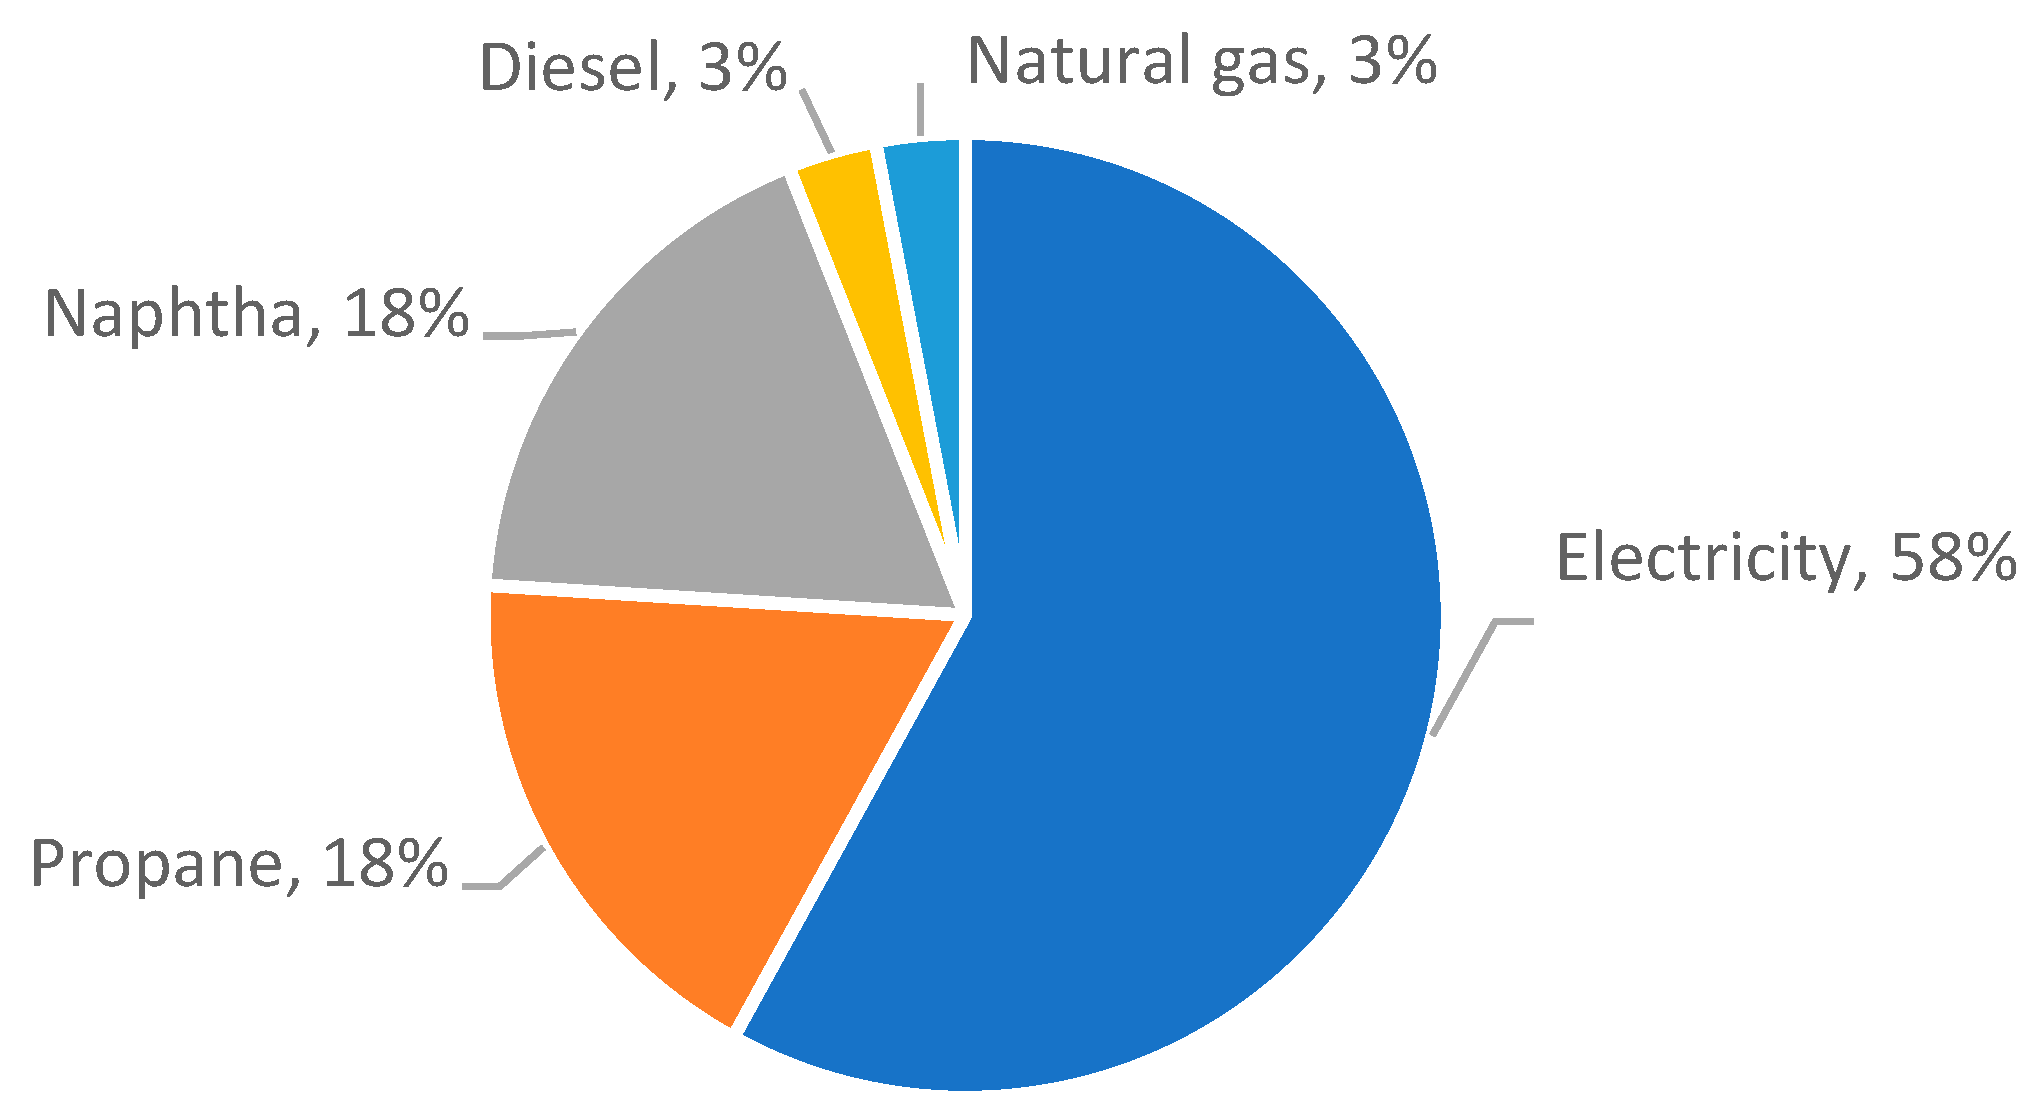
45]. In practice, this restriction often renders repairs either infeasible or prohibitively expensive. Throughout the year 2008, the 31 industrial plants under consideration consumed a total of 3462 tons of oil equivalent (toe). Of this total energy consumption, 58% was derived from the electrical power grid, while the remaining 42% was obtained through fuel combustion, as shown in
Figure 2. Naphtha and propane were the most frequently used fuels. The heat generated from fuel combustion served several purposes, including heating water for thermisation processes, heating milk, heating whey for cheese curd production, and cleaning equipment and facilities. The total energy consumed resulted in the emission of 7858 tons of carbon dioxide.
Each of the L values in
Figure 3,
Figure 4,
Figure 5,
Figure 6,
Figure 7,
Figure 8 and
Figure 9 represents different Portuguese production facilities.
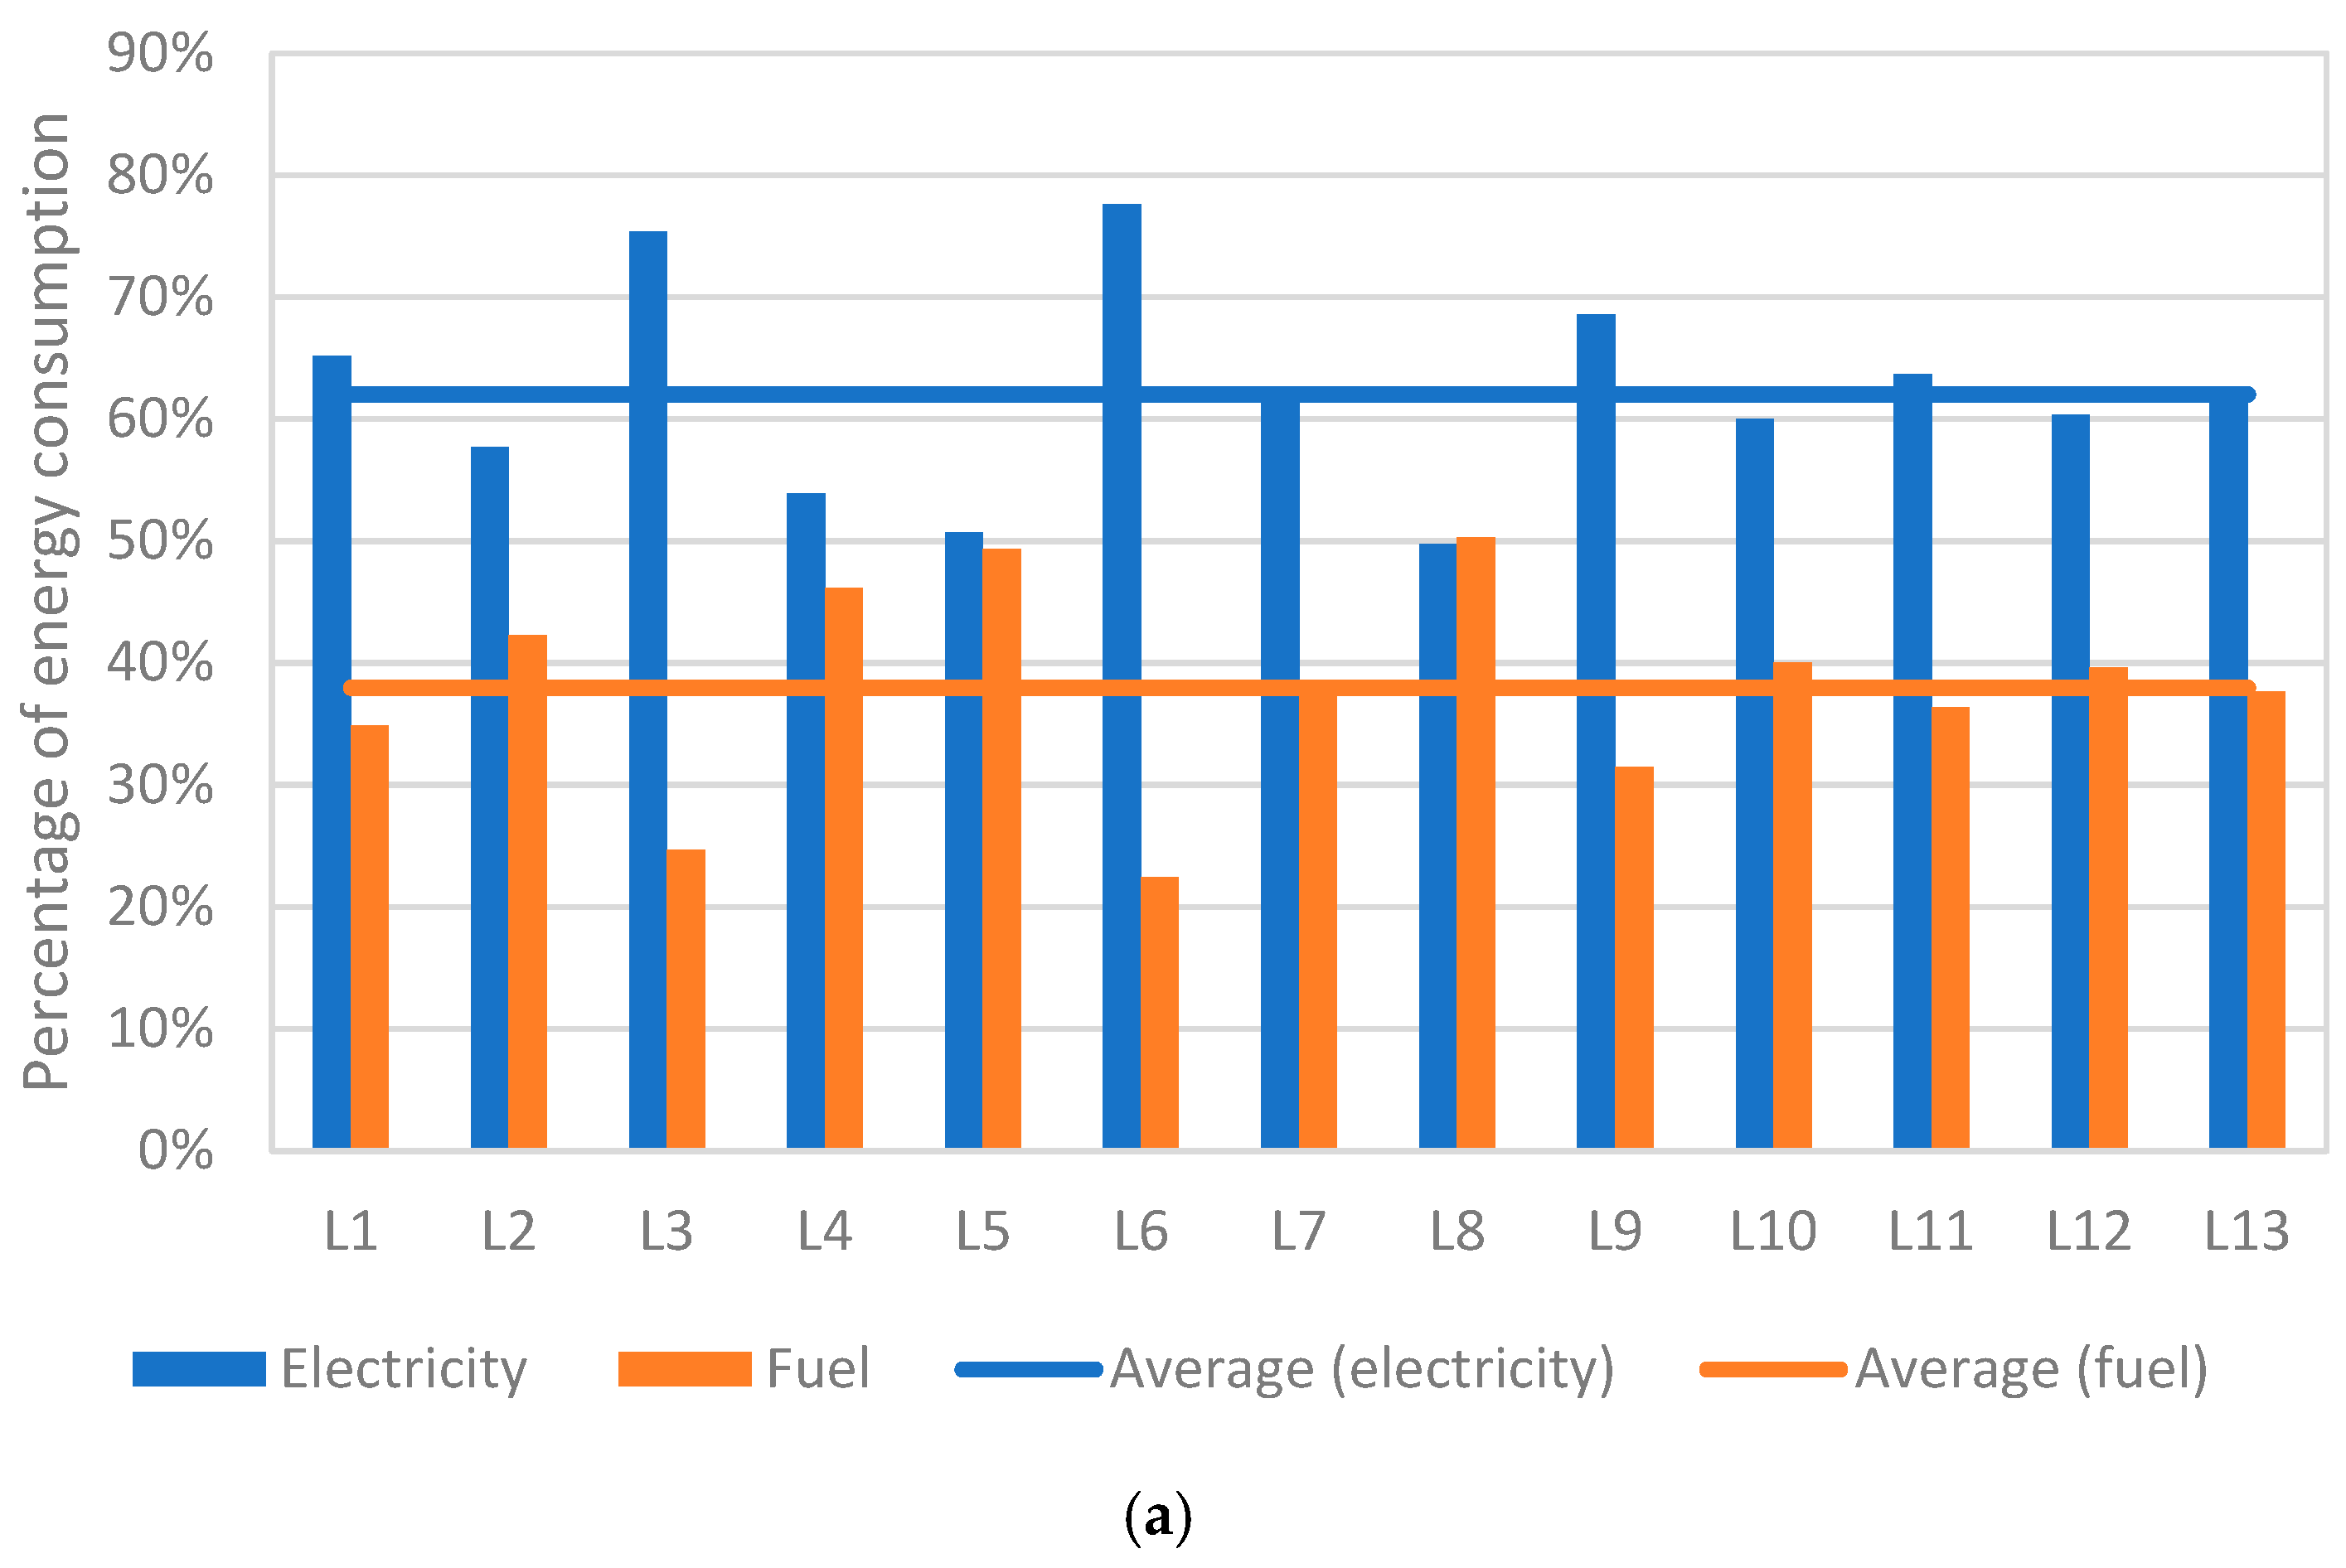
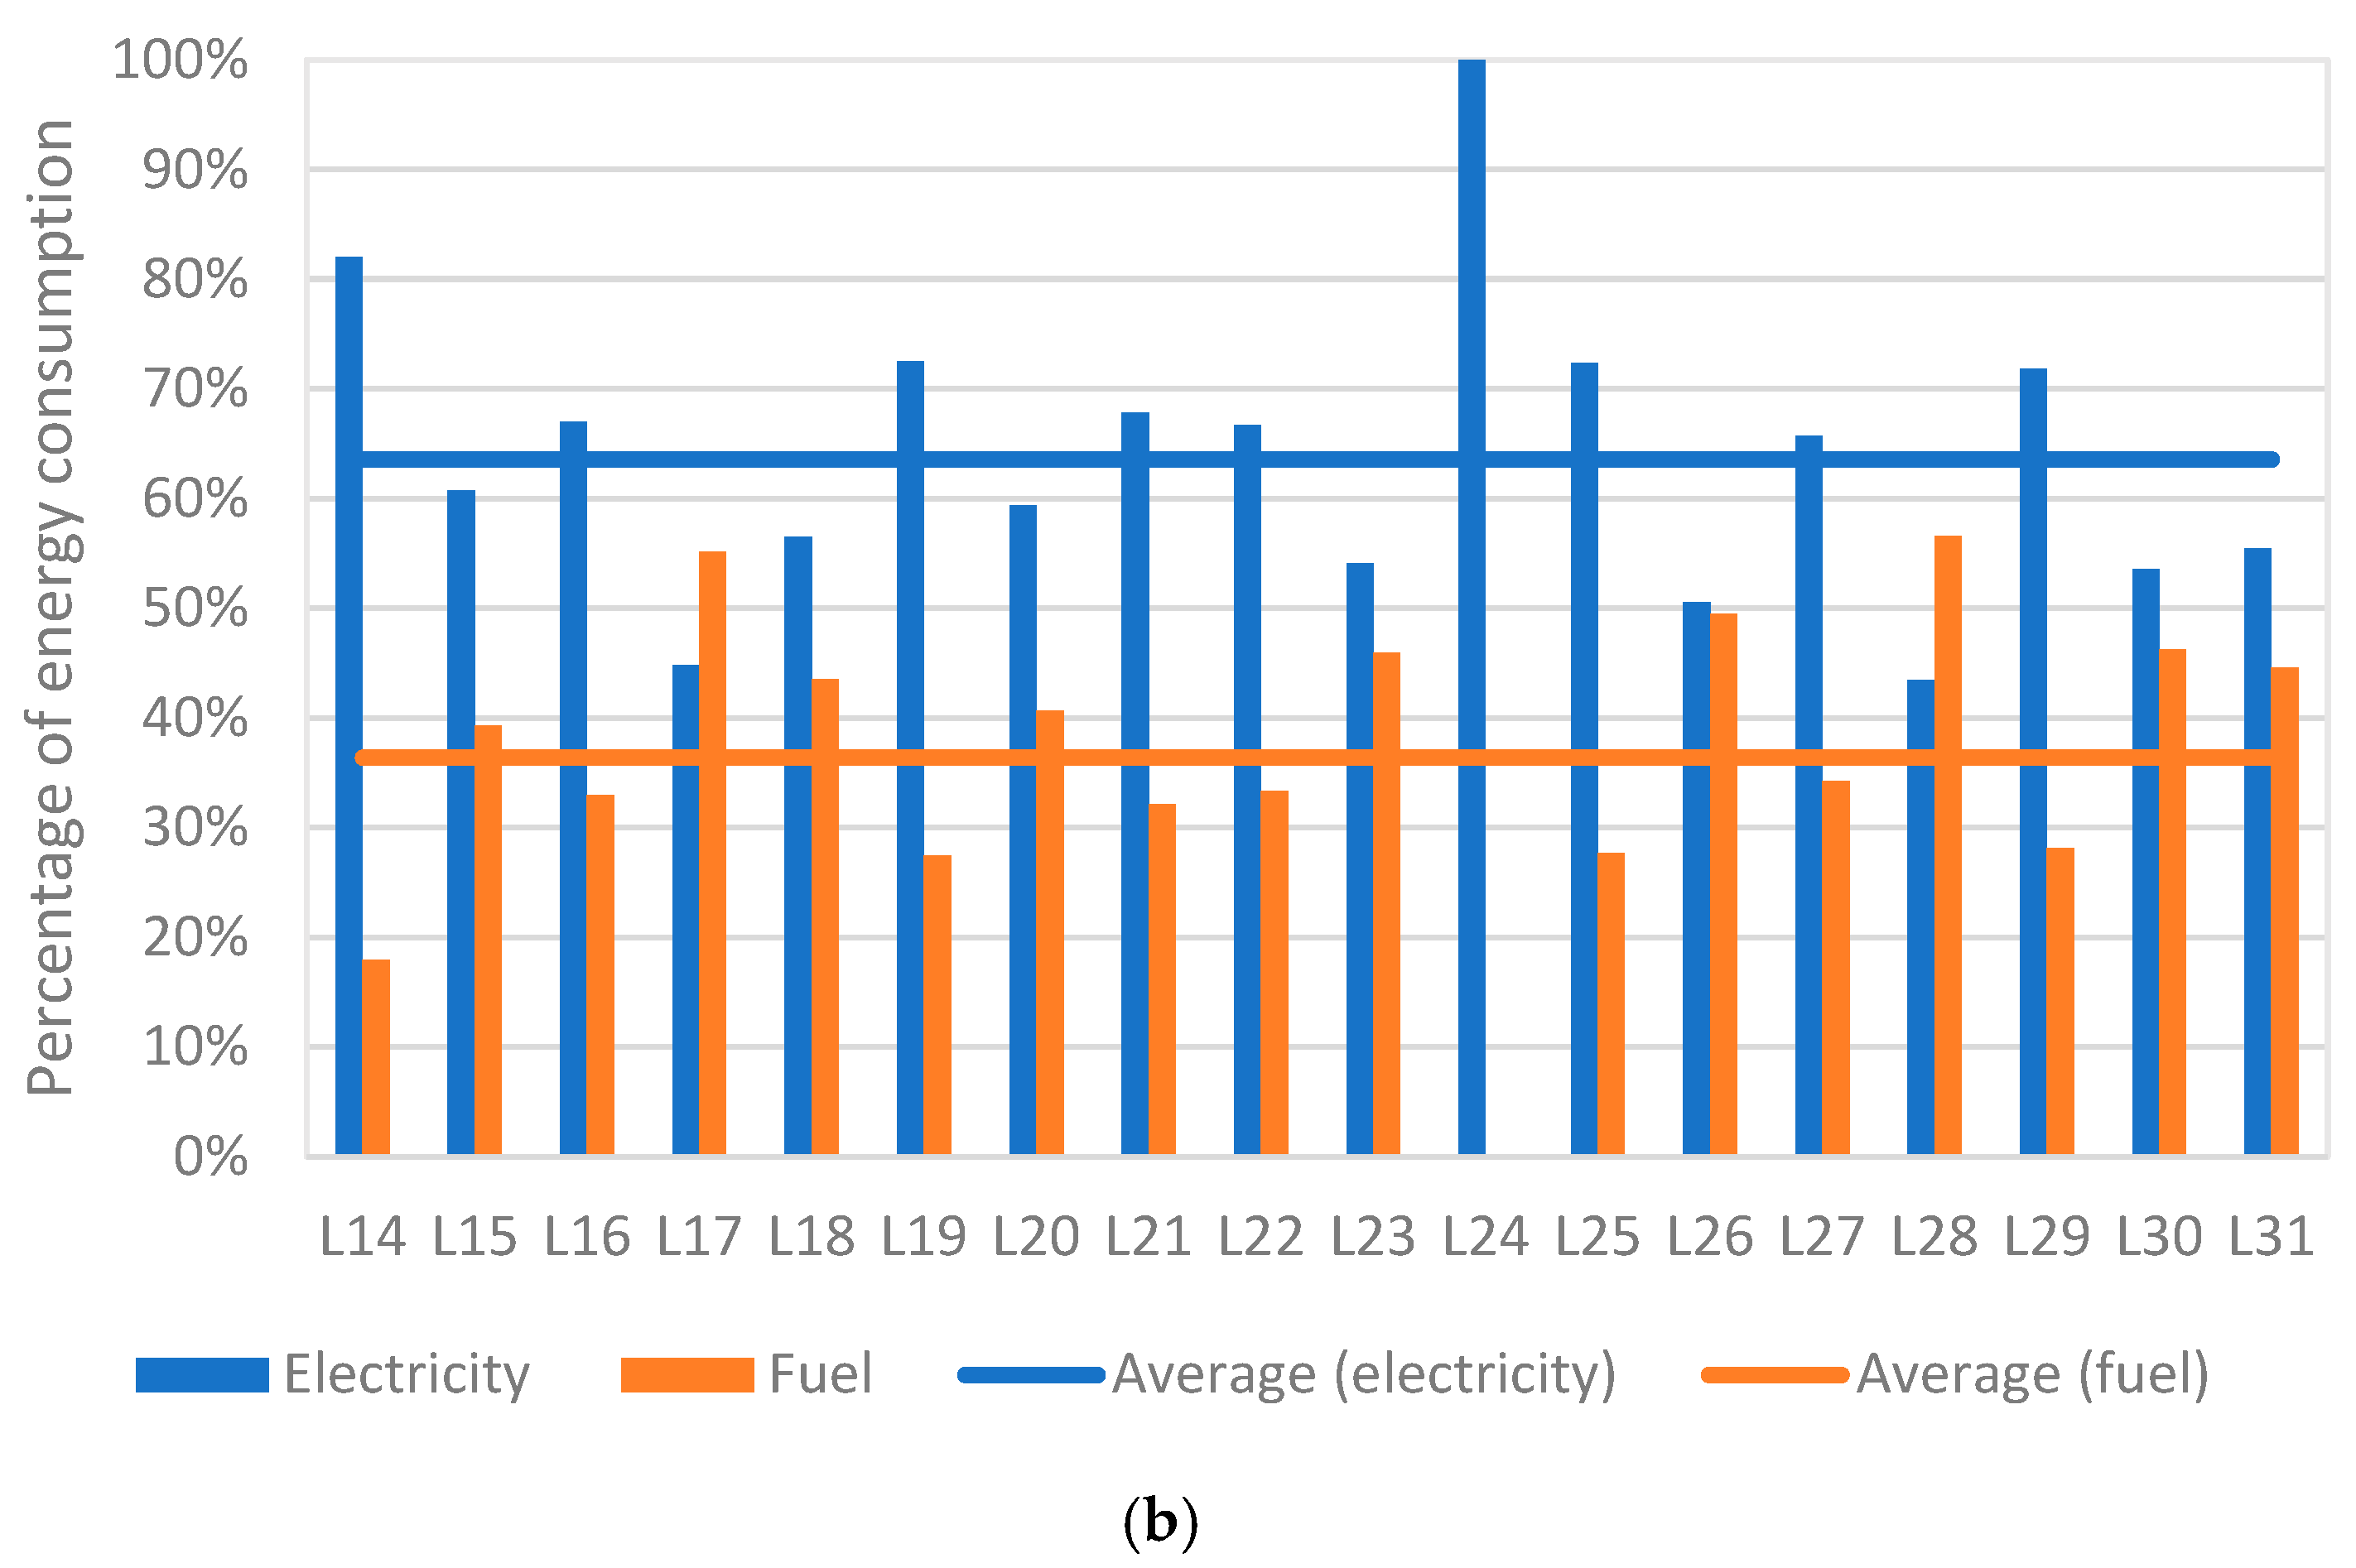
Figure 3 indicated that electricity served as the primary energy source in nearly all the dairy factories surveyed, and in one facility (L24), it was the sole energy source. On average, the ratio of electricity to fuel consumption was 62% to 38% for Traditional Portuguese Hard Cheese and 63.5% to 36.5% for Traditional Portuguese Hard Cheese. However, in facilities L4, L5, and L8, and L17, L26, and L28, fuel consumption was comparable to or even surpassed electricity consumption. This higher fuel usage is likely attributable to on-site cheese curd production, a process that requires heating whey.
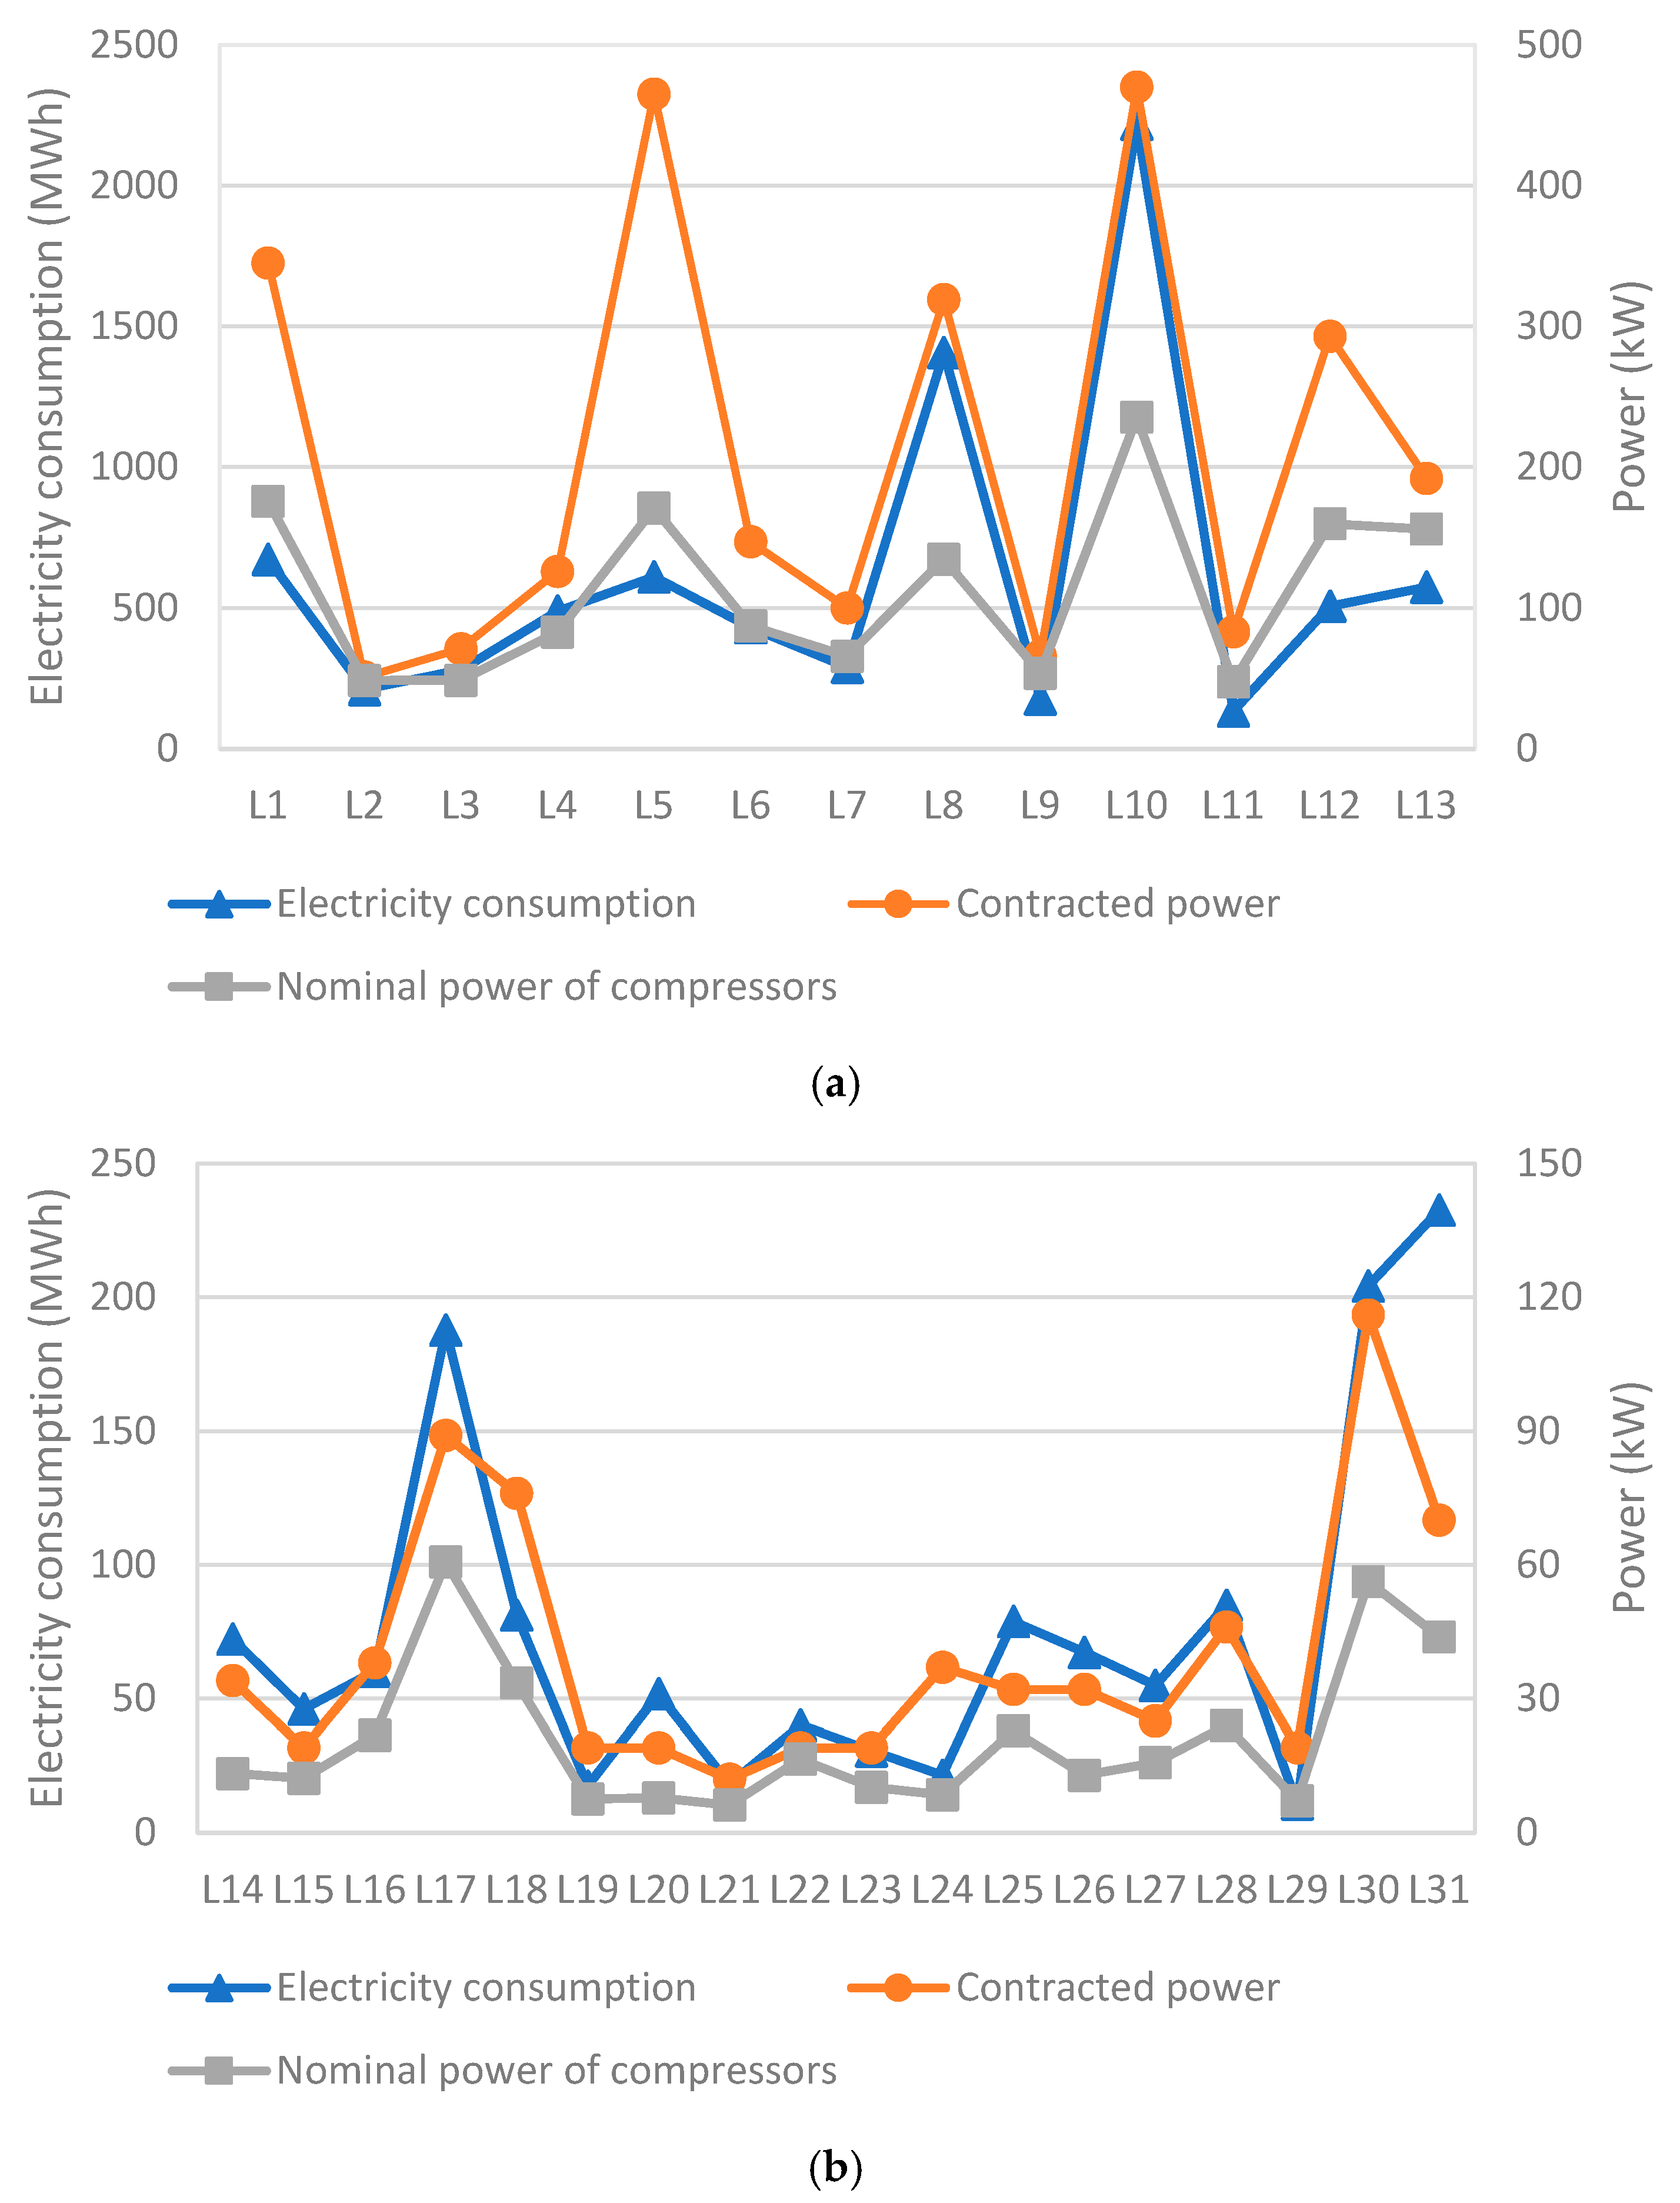
Figure 4 shows the electrical energy consumption, contracted power, and nominal power of the compressors for Traditional Portuguese Industrial Cheese and Traditional Portuguese Farmhouse Cheese, respectively. A strong correlation is observed between these three variables across almost all manufacturing units, highlighting the influence of compressor nominal power on both contracted power and overall electricity consumption. Refrigeration and freezing processes emerged as major energy consumers, accounting for anywhere from 25.5% to over 40% of the total electricity consumed by dairy facilities [
22,
23].
Electrical energy consumption for Traditional Portuguese Industrial Cheese ranged from 134.5 to 2218.0 MWh, with an average of 615.3 MWh. For Traditional Portuguese Farmhouse Cheese, consumption ranged from 10.8 to 232.7 MWh, averaging 75.6 MWh. The higher energy consumption observed in Traditional Portuguese Industrial Cheese facilities is likely associated with a greater number of technological equipment pieces and their more intensive use.
Contracted power for Traditional Portuguese Industrial Cheese facilities varied between 51 and 470 kW, with an average of 209.8 kW, while Traditional Portuguese Farmhouse Cheese facilities had contracted power between 12 and 116 kW, averaging 40.1 kW. The nominal electrical power of compressors in Traditional Portuguese Industrial Cheese facilities ranged from 47.5 to 235.5 kW (average 112.8 kW), and in Traditional Portuguese Farmhouse Cheese facilities, it ranged from 6.2 to 60.6 kW (average 21.2 kW). The nominal power of compressors constituted approximately 53% of the contracted power.
The Specific Consumption of Electrical Energy is a key indicator of energy efficiency and serves as a valuable metric for evaluating the energy performance of manufacturing units. It represents the amount of energy consumed per unit of raw material processed [
45,
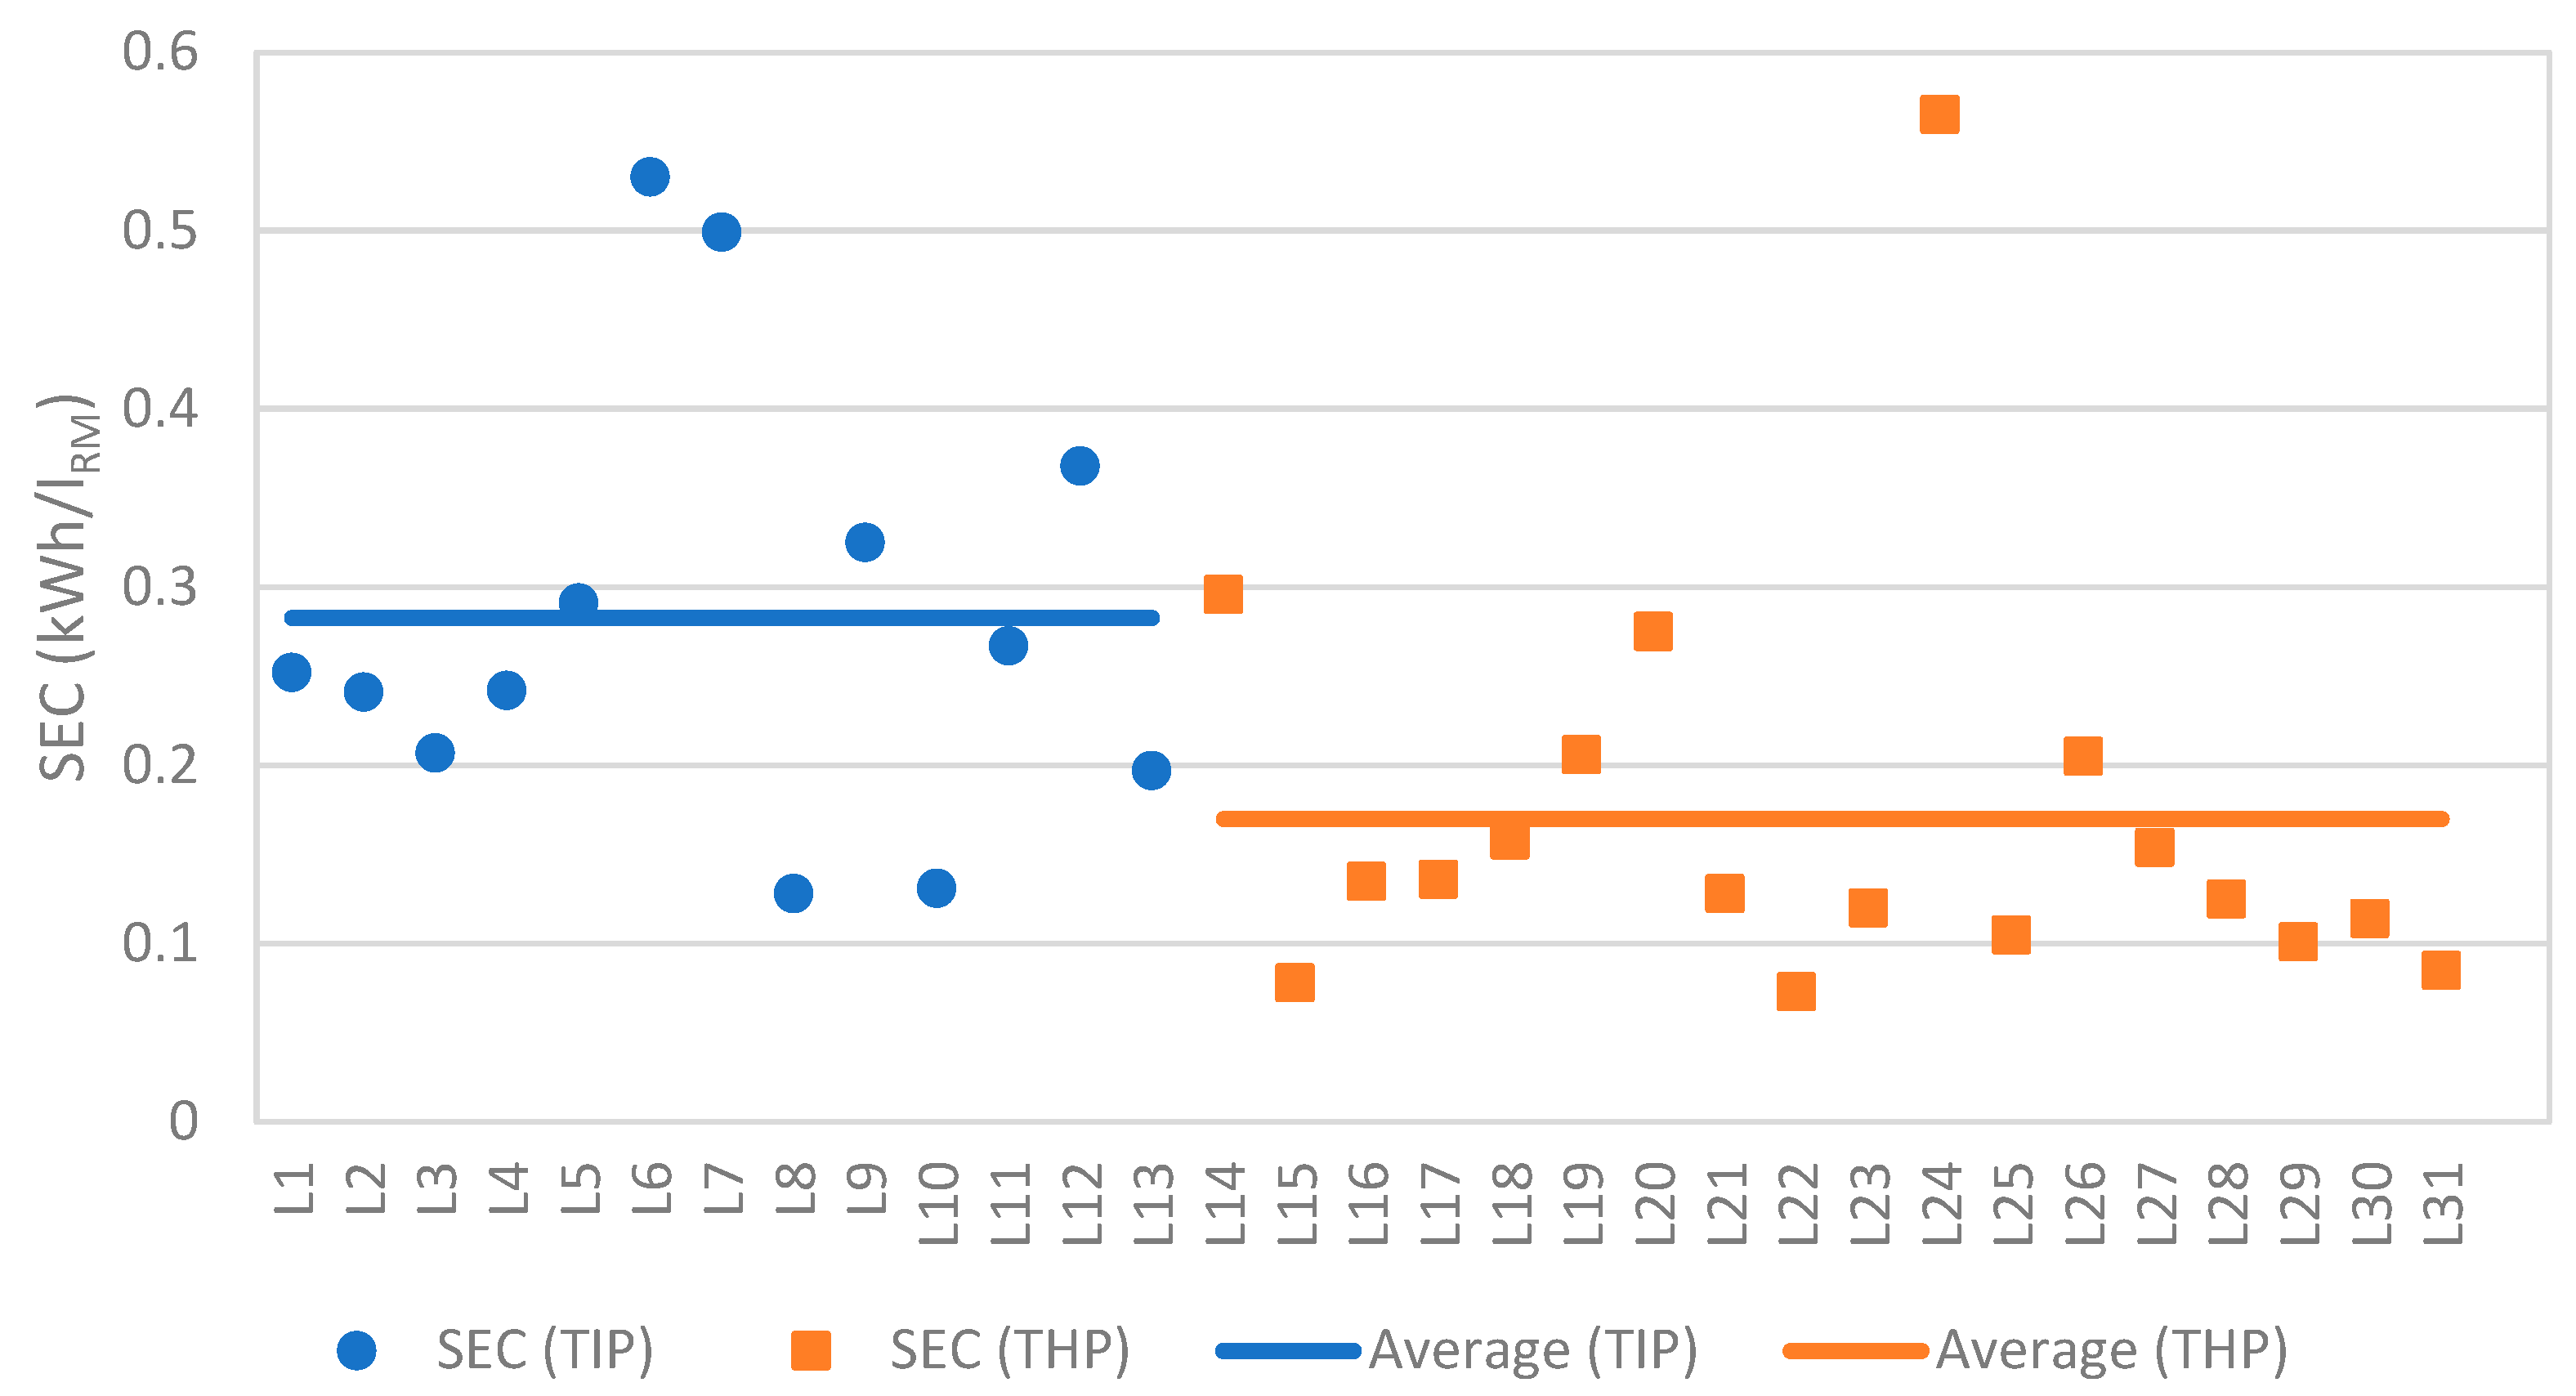
46]. In this study, SEC values for Traditional Portuguese Industrial Cheese ranged from 0.128 to 0.530 kWh/lRM (litres of raw material), with an average of 0.283 kWh/lRM. For Traditional Portuguese Farmhouse Cheese, SEC values ranged from 0.073 to 0.565 kWh/lRM, averaging 0.169 kWh/lRM, which is approximately 60% of the average for Traditional Portuguese Industrial Cheese units. The high SEC value observed in facility L24 can be attributed to its low production activity during 2008. The average SEC values obtained for both Traditional Portuguese Industrial Cheese and Traditional Portuguese Farmhouse Cheese fall within the ranges reported in existing literature [
47,
48].
According to
Figure 5, five companies in each category exhibited SEC values above their respective category averages, suggesting potential opportunities for energy-saving improvements. Facilities L6, L7, and L24, recorded the highest SEC values, as shown in
Figure 6. These same facilities also displayed the lowest Unit Capacity Ratios, which may indicate over-dimensioning of cold storage rooms and potentially higher energy consumption.
The elevated SEC observed in unit L24 is undoubtedly linked to its low production output. In the case of unit L6, it was noted that its condensers were situated within a poorly ventilated loft space, where temperatures could reach as high as 50 °C, significantly impacting energy efficiency. Two remedial measures were proposed: first, the introduction of ventilation grids in the loft walls, and second, relocating the condensers closer to these ventilation grids to enable them to draw in cooler outside air directly. Following the implementation of these measures, the SEC of unit L6 decreased from 0.530 kWh/lRM to 0.350 kWh/lRM, representing 66% of its initial value.
Units L8 and L10, and L15 and L22, exhibited the lowest SEC values within their respective categories. These units also demonstrated the highest, or at least above-average, Unit Capacity Ratios. This suggests appropriate sizing of cold storage rooms and efficient turnover of finished products.
If SEC values were reduced to the average for each category, the potential energy savings would be 19% for Traditional Portuguese Industrial Cheese companies and 21% for Traditional Portuguese Farmhouse Cheese companies.
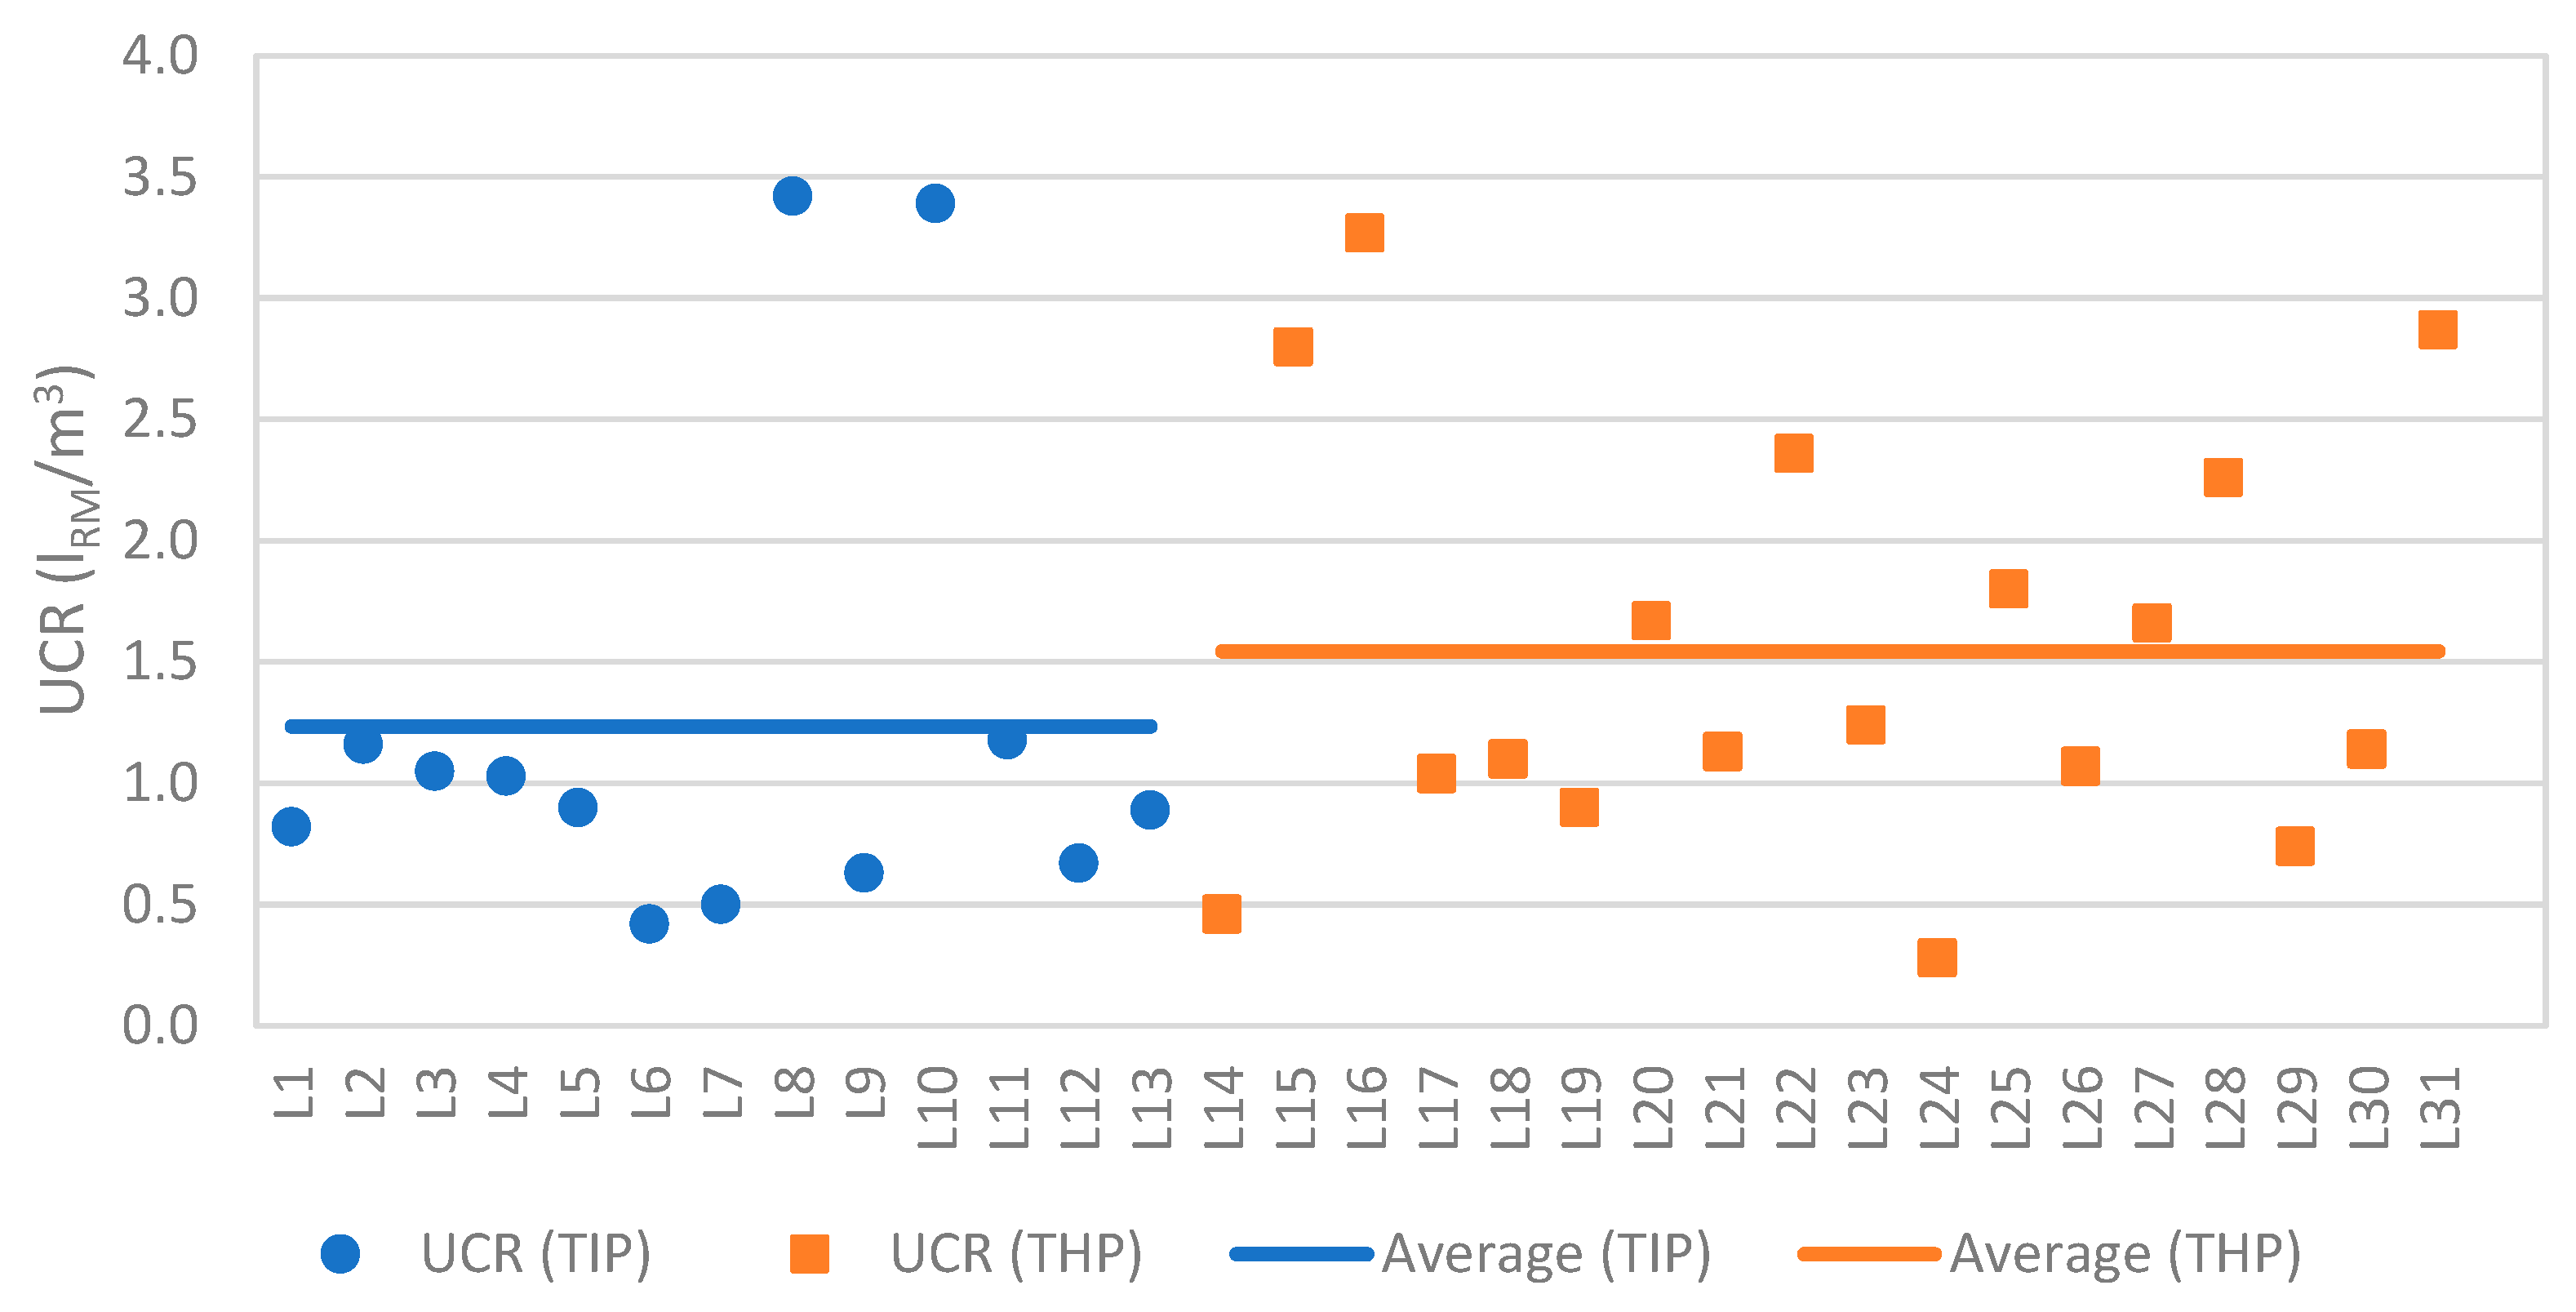
The average Usage of Cold Room Volume was slightly higher for Traditional Portuguese Farmhouse Cheese facilities (1.54 lRM/m
3) compared to Traditional Portuguese Industrial Cheese facilities (1.24 lRM/m
3), as shown in
Figure 7. This difference is attributed to the fewer and smaller cold storage rooms typically found in Traditional Portuguese Farmhouse Cheese production units. The lowest UCR value observed among Traditional Portuguese Farmhouse Cheese facilities (0.28 lRM/m
3) was recorded in unit L24, a consequence of its low production activity. Within the Traditional Portuguese Industrial Cheese category, units L8 and L10 exhibited the highest UCR values (3.42 and 3.39 lRM/m
3, respectively). These facilities were the largest in the study and processed a high percentage of cow’s milk, factors associated with a high turnover of products within their cold storage rooms.
The average Nominal Power of Compressors per Cold Room Volume was comparable for both Traditional Portuguese Industrial Cheese and Traditional Portuguese Farmhouse Cheese facilities (0.060 and 0.063 kW/m3, respectively). Units L11 and L16 exhibited NPC values (0.11 and 0.16 kW/m3, respectively) considerably higher than their respective category averages, which could suggest an oversizing of compressor nominal power. However, this does not appear to result in excessive electricity consumption per unit of raw material processed, as their Specific Consumption of Electrical Energy values (0.267 and 0.135 kWh/lRM, respectively) are below the average for each category. Furthermore, unit L16 demonstrated the highest Usage of Cold Room Volume (3.27 lRM/m3) within the Traditional Portuguese Farmhouse Cheese category, potentially indicating a high turnover of products within its cold storage facilities.
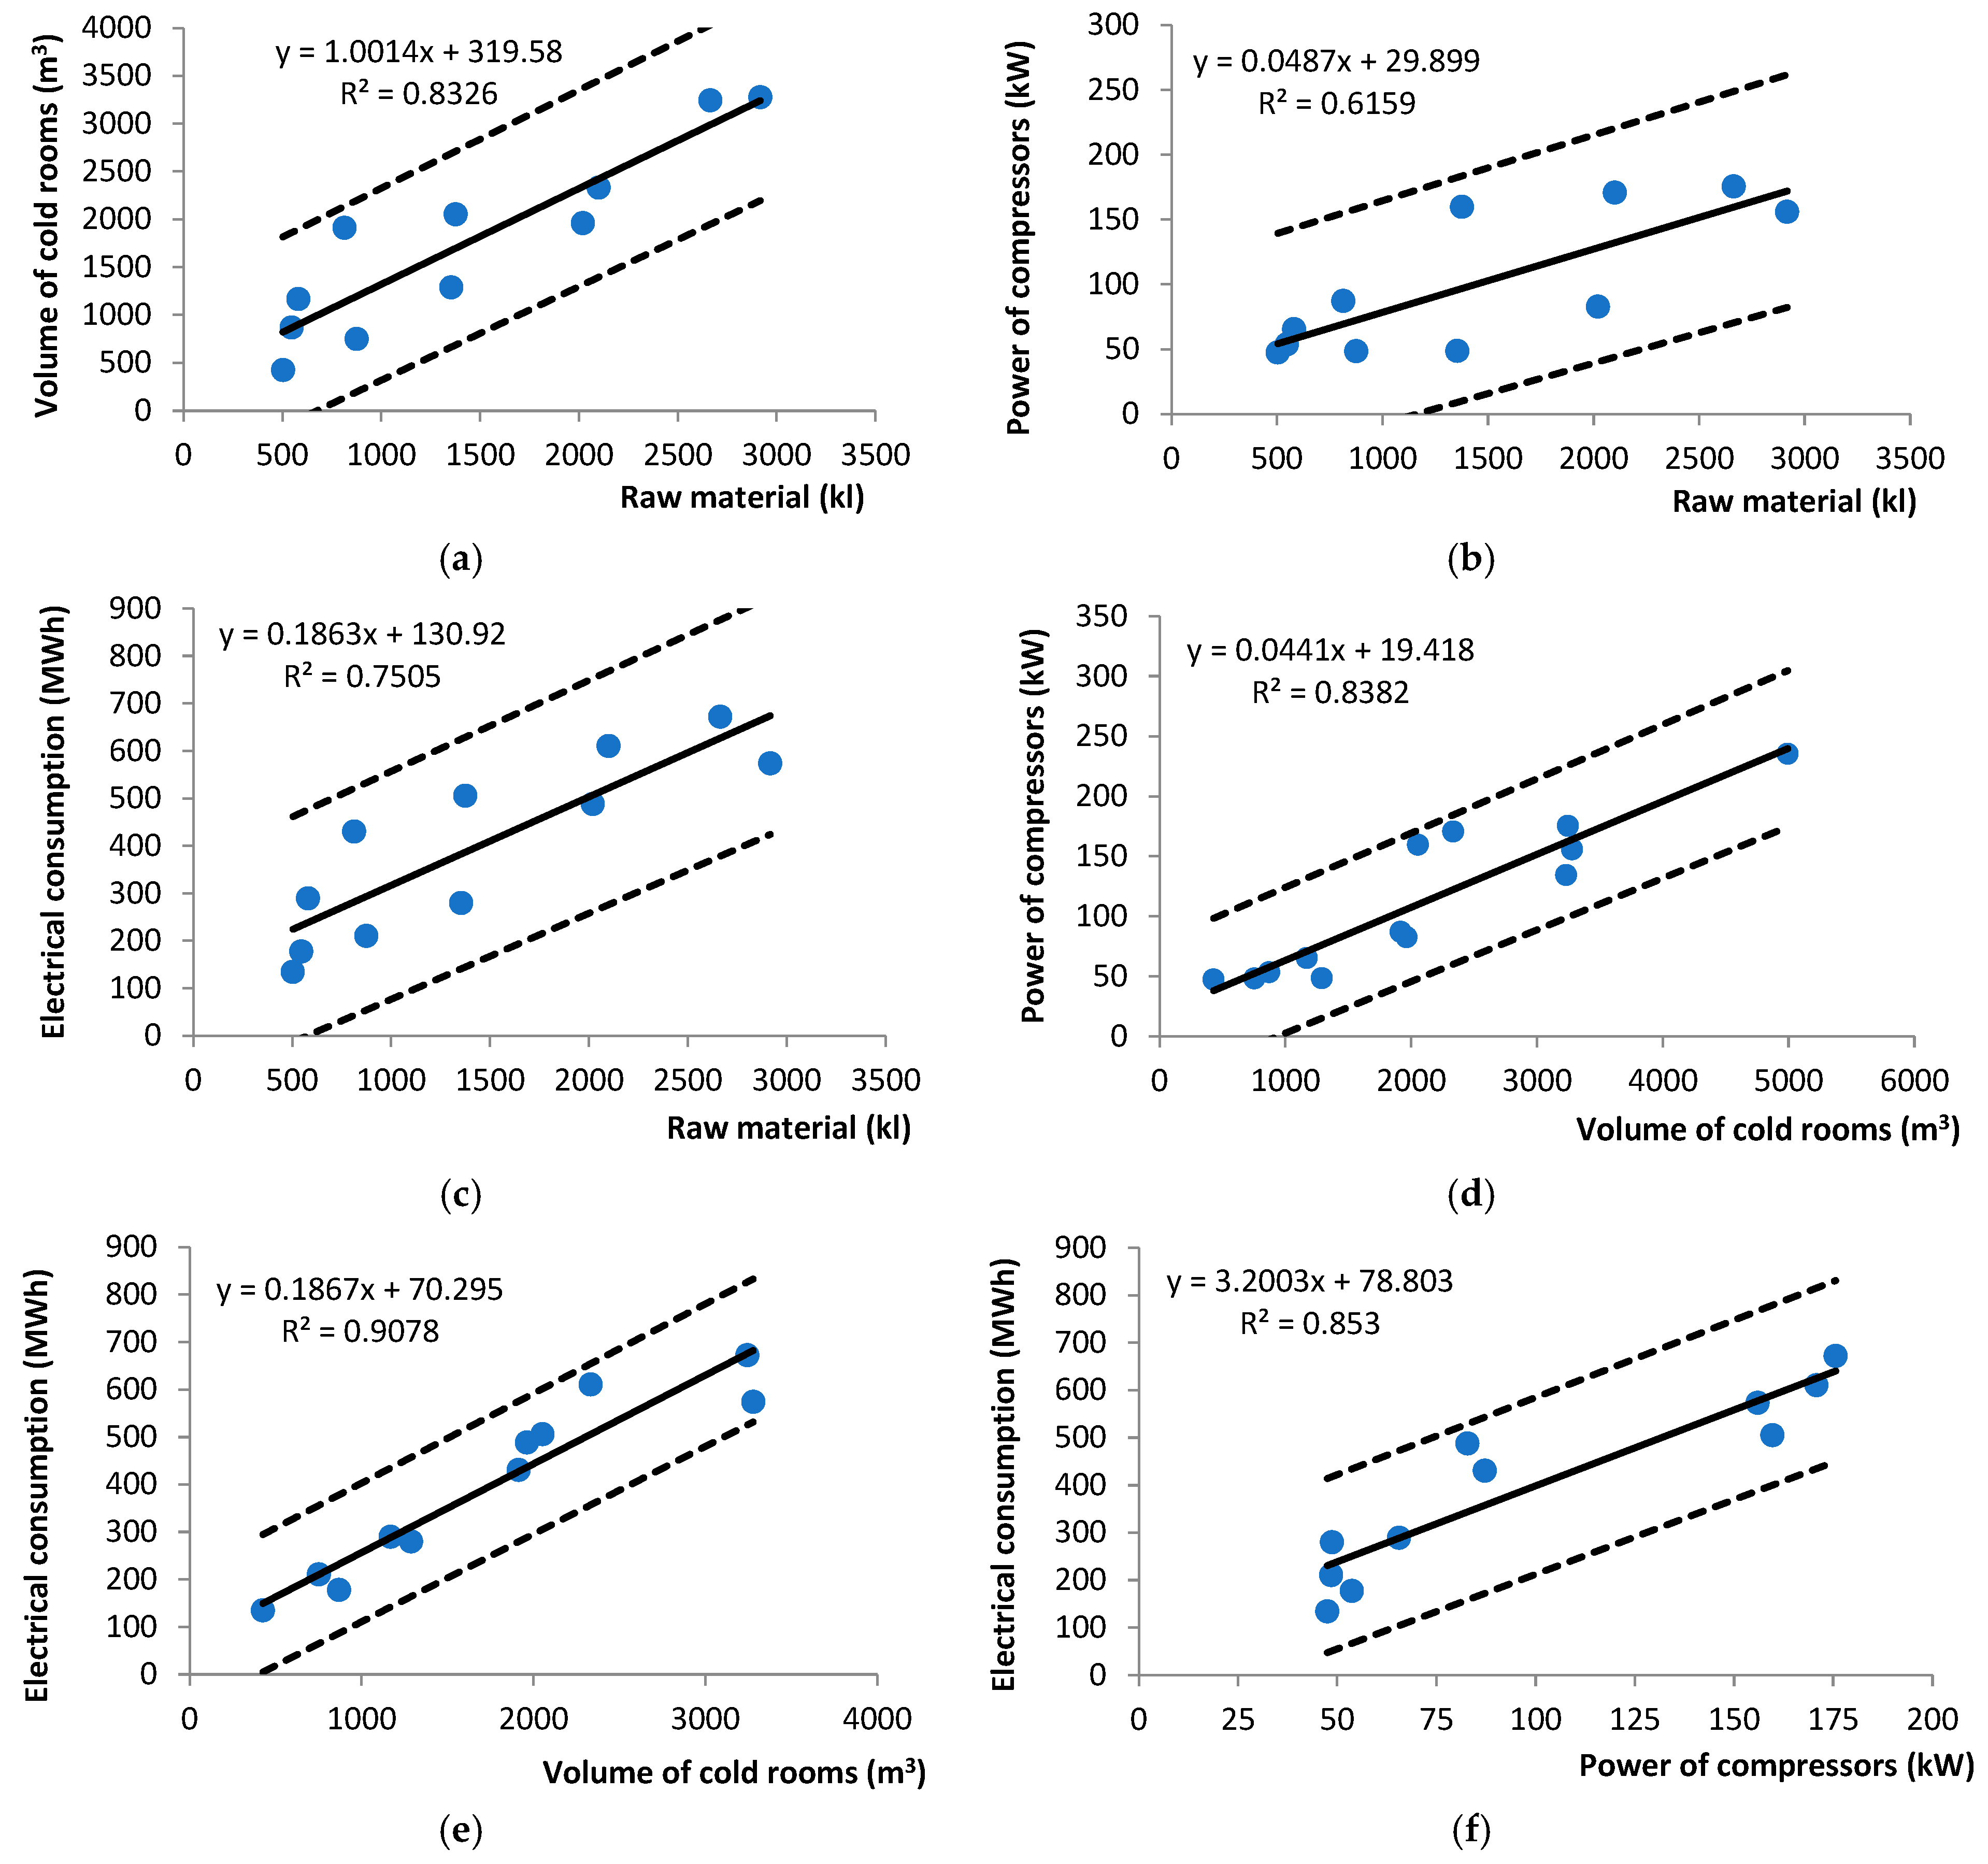
Figure 8 and
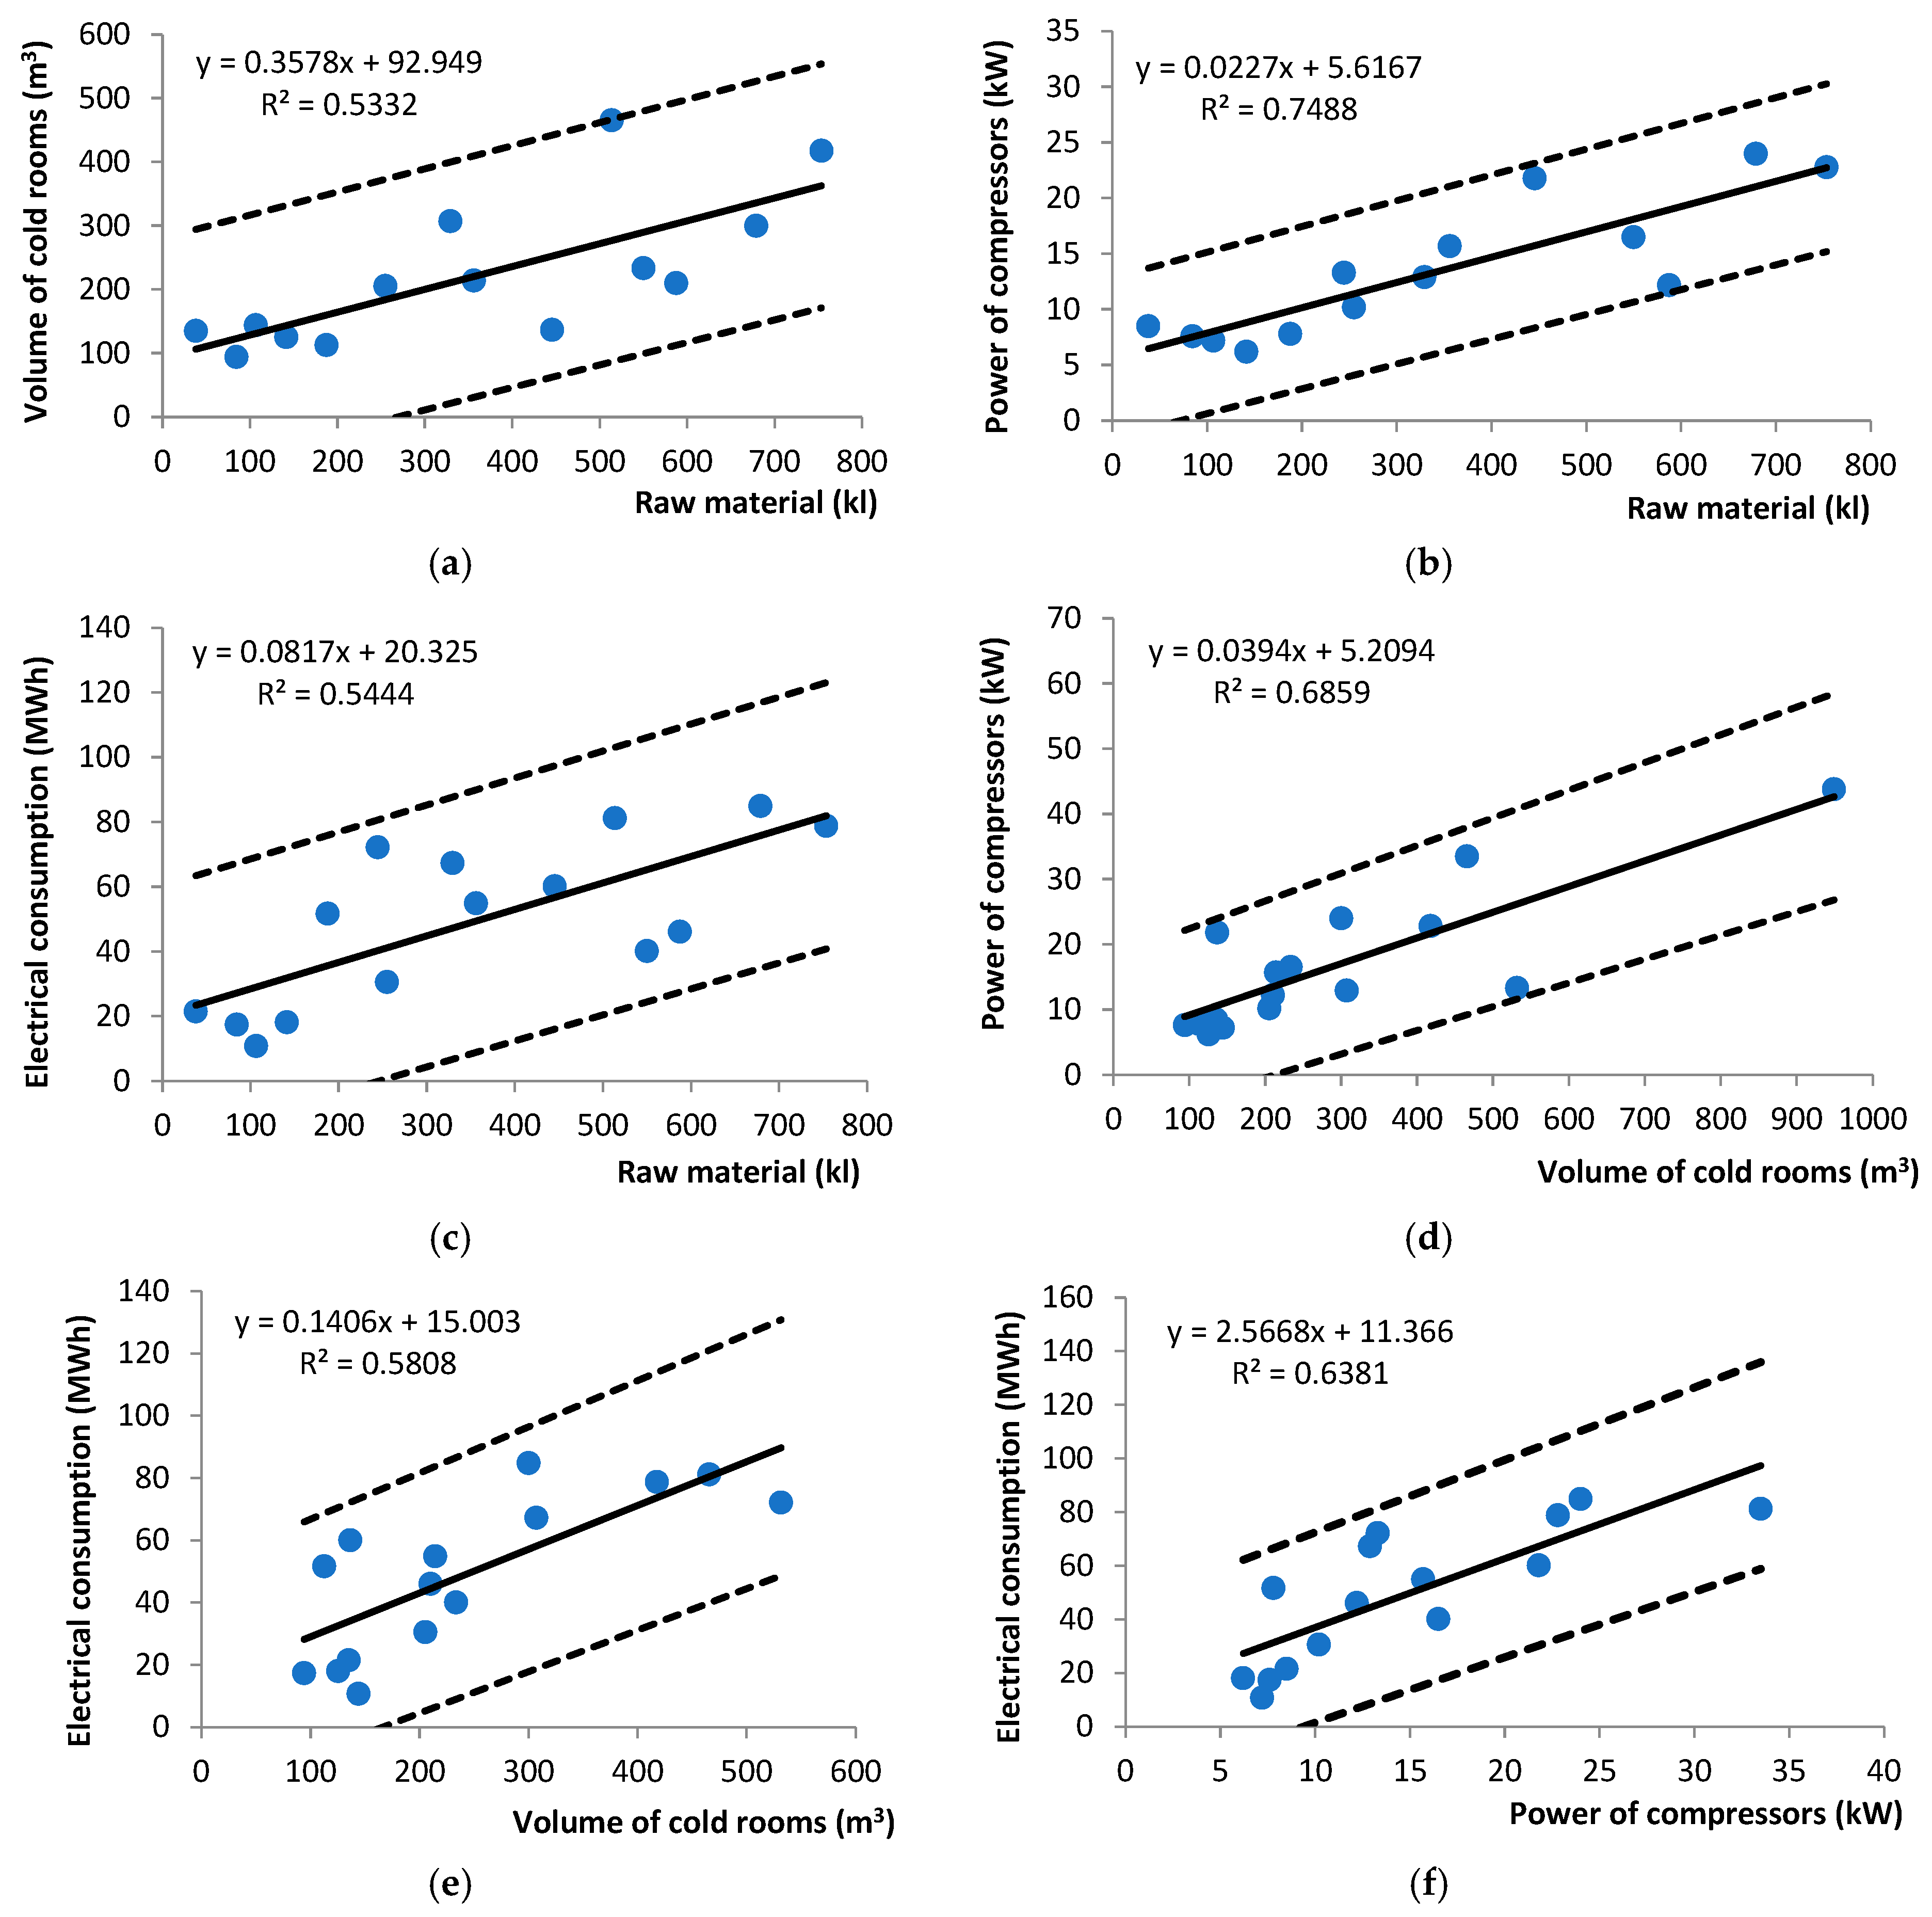
Figure 9 present the experimental results and graphical representations of the linear regressions, including the upper and lower bounds of the 95% confidence intervals, for the relationships between (i) cold room volume and raw material volume; (ii) compressor power and raw material volume; (iii) electrical energy consumption and raw material volume; (iv) compressor power and cold room volume; (v) electrical energy consumption and cold room volume; and (vi) electrical energy consumption and compressor power. In all cases, the coefficient of determination (R
2) exceeded 0.6, indicating a strong correlation between the linear regression models and the experimental data. All experimental data points fell within the 95% confidence interval.
These equations can be valuable tools for benchmarking a company’s performance against average values within its sector and for estimating potential energy savings. However, a comprehensive on-site energy audit remains essential for a more detailed and precise assessment.
As shown in
Figure 8 and
Figure 9, a positive correlation exists between compressor power and the quantity of raw materials processed. This relationship is more pronounced in Traditional Portuguese Industrial Cheese production, evidenced by the steeper slope of the linear model compared to that of Traditional Portuguese Farmhouse Cheese. This difference likely arises because Traditional Portuguese Farmhouse Cheese production incorporates more manual operations, even at higher volumes of raw material. Furthermore, it was observed that some Traditional Portuguese Farmhouse Cheese facilities exhibited compressor power values lower than anticipated. This suggests that the cooling systems in these facilities may be undersized or that they were operating below full capacity.
This industrial facility, constructed with brick masonry and a fibre cement roof, featured a poorly ventilated loft space. It housed five cold storage rooms, totalling 637.5 cubic meters in volume, constructed with 100 mm polyurethane panels. Four refrigeration systems served the facility: a direct expansion central system cooling rooms 1, 2, and 3; two air handling units for rooms 4 and 5; and an indirect expansion central system dedicated to milk tank refrigeration. The compressors, using R22 refrigerant, were semi-hermetic and had a combined electrical power of 32.48 kW. In 2010, this facility processed 701,637 L of milk into ripened cheese, consuming 221,722 kWh of electricity and 15,010 L of diesel fuel. Several characterisation parameters of Traditional Handmade Producers were analysed using regression analysis, and the results are shown in
Table 1.
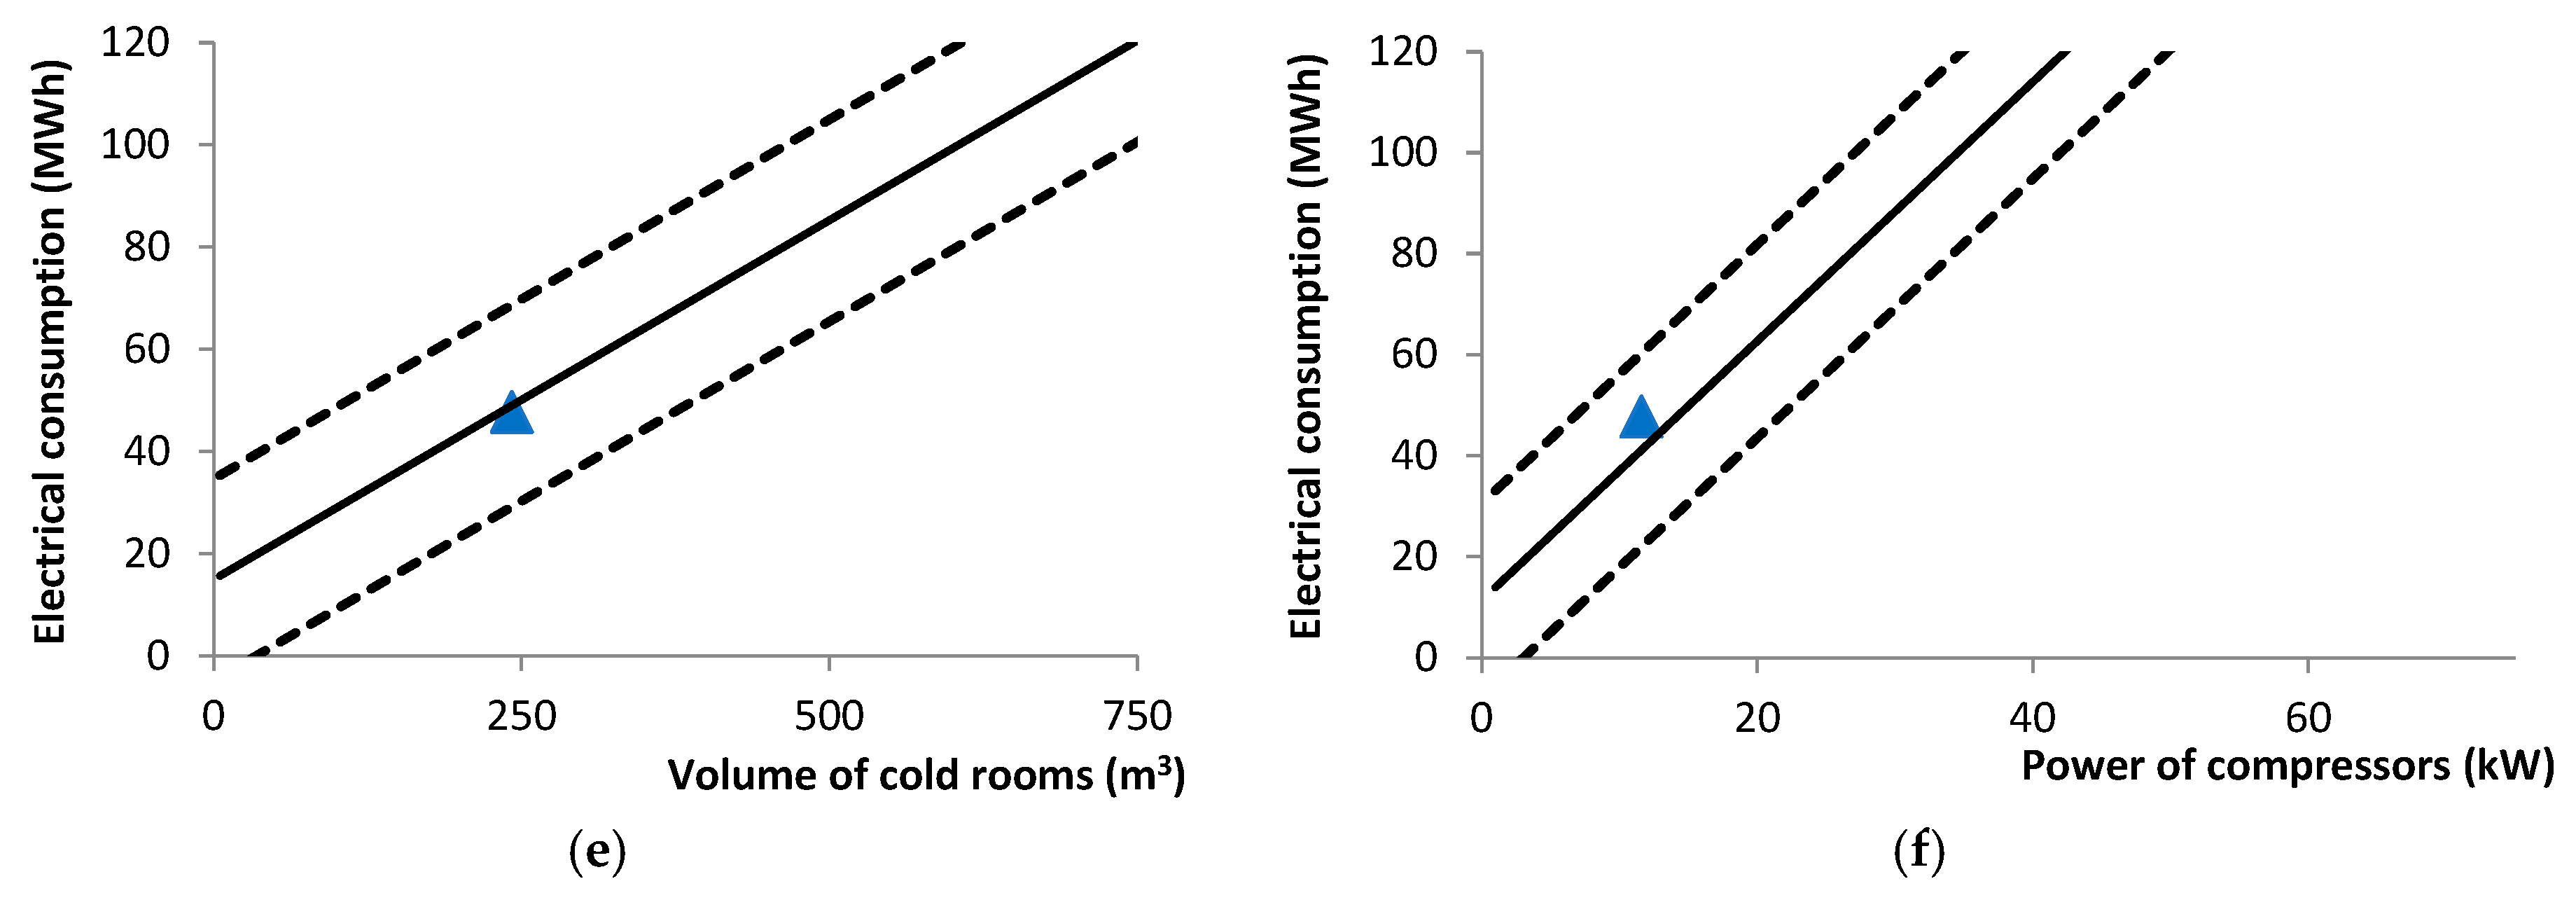
In 2010, this cheesemaking facility processed a total of 239,766 L of ewe’s and goat’s milk, consuming 47,836 kWh of electricity and 5628 L of propane. All performance indicators for this facility fell within the 95% confidence interval for its category (Traditional Portuguese Farmhouse Cheese;
Figure 10). The analysis revealed the following: (i) the cold room volume and electrical energy consumption per unit of processed raw material were higher than predicted by the model; (ii) compressor power per unit of processed raw material, electricity consumption per unit of cold room volume, and electricity consumption per unit of compressor power aligned with model predictions; and (iii) compressor power per unit of cold room volume was lower than predicted.
The results indicate that the facility’s energy consumption exceeded expectations, given the quantity of milk processed. This conclusion is supported by the Specific Energy Consumption value of 0.199 kWh/lRM, which surpassed the category average for Traditional Portuguese Farmhouse Cheese (0.147 kWh/lRM). Cold storage represented the most significant energy consumer among all operational activities, highlighting a substantial opportunity for energy savings. Therefore, the following improvements are recommended: (i) enhance loft ventilation; (ii) increase cold room wall thickness; (iii) relocate cold rooms away from the southern exposure of the building; (iv) improve overall building insulation, particularly the roof; (v) cool or better insulate the corridor leading to the ripening rooms; and (vi) implement a preventative maintenance plan for the refrigeration systems.
4. Conclusions
Refrigeration plays a crucial, yet often underestimated, role in cheese production. Given its contribution to global energy consumption, the efficiency of refrigeration systems within cheesemaking facilities warrants careful examination. This study analysed 31 small to micro-scale cheesemaking facilities, categorised as either Traditional Industrial Producers, employing technology-driven processes, or Traditional Handmade Producers, incorporating some manual operations. Data collection involved on-site visits and questionnaires.
The participating companies, averaging 18 employees each, were predominantly small to micro-sized enterprises, with 71% reporting annual turnovers below EUR 2 million. Brick masonry was the primary construction material (87%), followed by polyurethane panels (10%) and a combination of both (3%). Fibre cement sheets were the most common roofing material. Many facilities exhibited inadequate or non-existent loft ventilation, potentially impacting compressor efficiency.
Cold room walls were typically constructed from polyurethane panels or brick masonry with polyurethane panel insulation. TIP facilities generally possessed more cold rooms with larger individual volumes compared to THP facilities. Reciprocating and semi-hermetic compressors were prevalent, primarily using R22 refrigerant. Over half of the compressors were more than 20 years old.
Collectively, the 31 cheesemaking facilities consumed 3462 tons of oil equivalent (toe) of energy in 2008, resulting in 7858 tons of carbon dioxide emissions. Electricity accounted for 58% of energy consumption, with the remainder derived from fuel combustion (mainly naphtha or propane). Some facilities exhibited higher fuel usage due to cheese curd production processes.
Average Specific Energy Consumption values were lower for TIP facilities (0.283 kWh/lRM) compared to THP facilities (0.170 kWh/lRM), with both falling within the ranges reported in the literature. However, Usage of Cold Rooms values were higher for THP facilities (1.54 lRM/m3) than TIP facilities (1.24 lRM/m3), likely attributable to the fewer and smaller cold rooms in THP facilities. Nominal Power of compressors per Cold room volume was similar between both categories (0.060 kW/m3 for TIP and 0.063 kW/m3 for THP).
Several energy-saving opportunities were identified, including poorly insulated buildings (e.g., brick masonry walls and fibre cement roofing), ageing, inadequately maintained and improperly located refrigeration equipment, insufficiently insulated cold room walls, and oversized cold rooms and compressors.
Linear models developed to analyse the relationships between cold room volume, compressor power, and raw material quantity demonstrated a good fit with the observed data. These models can be valuable tools for identifying potential energy savings within individual companies and benchmarking performance against industry averages.
