Abstract
This paper reviews scenario generation techniques for modeling uncertainty in wind and photovoltaic (PV) power generation, a critical component as renewable energy integration into power systems grows. Scenario generation enables the simulation of variable power outputs under different weather conditions, serving as essential inputs for robust, stochastic, and distributionally robust optimization in system planning and operation. We categorize scenario generation methods into explicit and implicit approaches. Explicit methods rely on probabilistic assumptions and parameter estimation, which enable the interpretable yet parameterized modeling of power variability. Implicit methods, powered by deep learning models, offer data-driven scenario generation without predefined distributions, capturing complex temporal and spatial patterns in the renewable output. The review also addresses combined wind and PV power scenario generation, highlighting its importance for accurately reflecting correlated fluctuations in multi-site, interconnected systems. Finally, we address the limitations of scenario generation for wind and PV power integration planning and suggest future research directions.
1. Introduction
As the global energy demand has continued to surge rapidly, the extensive use of traditional fossil fuels has led to severe issues such as resource scarcity, environmental pollution, and climate change [1]. The fossil fuel-dominated traditional energy structure is increasingly unsustainable, creating an urgent necessity for clean, low-carbon renewable energy sources. Countries worldwide have set future-oriented energy transition targets aimed at transforming power systems toward a renewable energy-centered model, primarily based on wind and photovoltaic (PV) power [2]. This transition not only helps reduce greenhouse gas emissions but also alleviates the ecological and economic pressures associated with traditional energy use. Wind and PV power, as the primary sources of clean energy, are gradually starting to occupy a pivotal position in power systems and playing an increasingly vital role [3]. However, the production from wind and PV generation is significantly influenced by weather conditions, exhibiting intermittency, volatility, and uncertainty. Such random fluctuations increase the uncontrollability of renewable energy generation and power system planning [4]. The unpredictability in the generation of renewable energy primarily arises from the randomness of the power output at the source. For example, the wind power output varies with fluctuations in the wind speed [5], whereas PV generation is influenced by changes in the solar radiation intensity [6]. As the penetration of renewable energy increases, this uncertainty places higher demands on the regulation of power systems. To mitigate the fluctuations in the renewable energy output, power systems require more flexible optimization techniques and decision-making approaches to ensure stable and efficient operation under varying weather conditions.
In optimizing decision-making methods to address uncertainties in power systems, robust optimization (RO), stochastic optimization (SO), and distributionally robust optimization (DRO) are three primary approaches [7]. RO is based on uncertainty sets and makes stable decisions under the worst case scenario; however, it lacks the use of probabilistic information [8]. SO, by contrast, constructs probabilistic models of uncertainty factors to make optimization decisions based on expected values [9]. DRO goes a step further by using ambiguous probability sets to address errors in probabilistic models [10]. Compared to RO, SO and DRO can make better use of probabilistic information; however, these optimization methods typically rely on scenario generation to represent uncertain conditions, capturing the random volatility of the renewable energy output.
In this context, scenario generation techniques have gradually become key tools in modeling uncertainties in renewable energy. Scenario generation simulates the effect of factors like the wind speed and solar radiation intensity under various weather conditions, producing representative generation scenario data [11]. These scenarios provide essential boundary conditions for optimization methods such as RO, SO, and DRO, helping optimization models achieve more effective scheduling and decision-making under uncertain conditions. Scenario generation techniques can generally be divided into explicit and implicit approaches, which are analyzed and summarized in this study. Generally, explicit methods rely on assumptions about probability distributions and parameter estimation, using the prior modeling of renewable output characteristics to simulate specific fluctuation patterns in PV and wind power generation. These approaches usually presume that the output of wind or PV power follows a particular probability distribution and fit distribution parameters using historical data to generate realistic generation scenarios. Representative explicit methods include Markov chains [12], copula function sampling [13], Monte Carlo methods [14], Latin hypercube sampling [15], and Autoregressive Moving Average models (ARMA) [16]. Such explicit methods involve precise probabilistic analysis, capturing the uncertain nature of renewable generation through parameterization, which provides good interpretability and ease of implementation for simulating specific generation fluctuations. Implicit methods, by contrast, generally rely on deep generative models to learn complex feature distributions from historical data and produce more realistic and flexible renewable output scenarios. Unlike explicit methods, implicit methods do not rely on rigid assumptions regarding the probability distribution of the generation output, adopting a data-driven approach to model generation characteristics. This approach extracts high-dimensional features and nonlinear relationships from historical data, simulating realistic output fluctuations under varying conditions. Typical implicit methods include deep generative models like Generative Adversarial Networks (GAN) [17], Variational Autoencoders (VAE) [18], and diffusion models [19], as categorized in Figure 1. These implicit methods exhibit greater flexibility and diversity in renewable scenario generation, effectively capturing complex fluctuations under uncertain conditions.
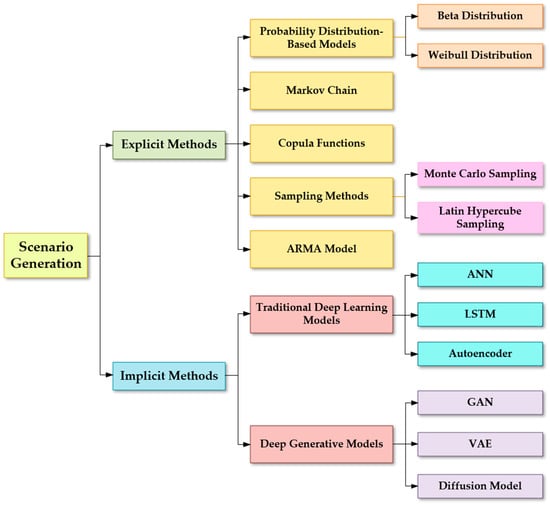
Figure 1.
Classification of scenario generation methods.
In recent years, the growing integration of renewable energy has led power systems to place a greater focus on coordinating generation and enhancing interactions between various regions [20]. In multi-region interconnected power systems, the penetration rate of clean energy sources like wind and PV power has risen significantly, making precise scenario generation for the output of multiple sites at the regional level a critical issue [21]. Traditional small-scale generation methods face challenges in comprehensively capturing the spatiotemporal correlations and interdependencies between various sites when dealing with the large-scale, complex layouts of renewable energy sites. This underscores the significance of developing multi-site scenario generation methods that integrate both wind and PV outputs. Therefore, after introducing existing scenario generation techniques for wind and PV power, this paper will also explore the current research status and future outlook of combined wind–PV power scenario generation, aiming to provide more comprehensive data support for uncertainty analysis in future interconnected power systems across multiple regions.
This paper reviews the research progress in PV and wind power scenario generation, covering both explicit and implicit methods as well as the current status and prospects of combined wind–PV power scenario generation. Through an analysis of the primary methods, this paper further explores the strengths and limitations of various approaches in renewable energy scenario generation, providing a valuable reference for prospective research avenues and applications.
2. Explicit Methods
Explicit methods rooted in probability and statistics often rely on precise mathematical formulations to develop scenario models for renewable energy generation. The core of these methods is to first assume that certain key parameters in renewable energy generation follow specific probability distributions and then use historical data to fit the parameters within these distributions, thereby modeling the uncertainty. This modeling process can intuitively reflect the statistical characteristics of the parameters while reducing complexity and maintaining model interpretability. For example, the solar radiation intensity is often assumed to adhere to a Beta distribution in many studies [22,23,24], while the wind speed is commonly assumed to adhere to a Weibull distribution [25,26,27]. Using this approach, the randomness of different renewable energy parameters can be considered, generating reasonable scenarios. The advantages of such probabilistic statistical models lie not only in their lower complexity but also in their good interpretability, providing a clear logical basis for analyzing the uncertainty of the renewable energy output [28]. In this section, we will focus on four common probabilistic statistical modeling methods and demonstrate how they play a role in scenario generation for renewable energy generation.
2.1. Markov Chain
Markov chains are a stochastic process based on state transition probabilities, which are capable of predicting the next state from the current state. In PV and wind power scenario generation, Markov chains can effectively grasp the temporal correlations and fluctuations in power generation. Let the random process Xt represent the power generation state at time t. If the process satisfies the Markov property, meaning that the future state Xt+1 = xt+1 relies solely on the current state Xt = xt, with no dependence on previous states, then the following holds:
Through this property, the state transition matrix P can be defined, where Pij indicates the likelihood of moving from state i to state j. The sum of each column of the matrix P equals 1 (2). Figure 2 shows an example with only two states.
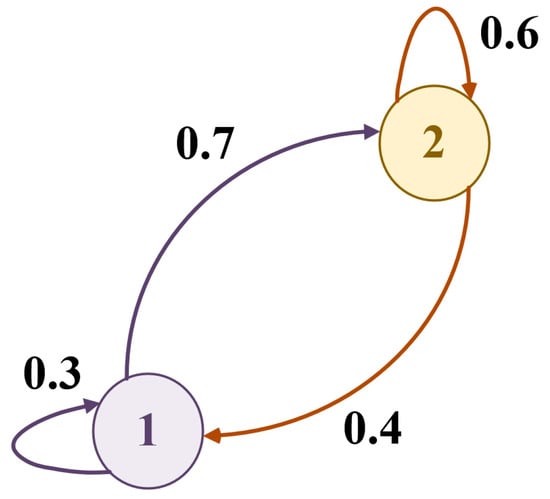
Figure 2.
Markov chains with two transition states.
The Markov chain model first estimates the transition matrix P based on historical data and then generates the next state based on the current state and the matrix P, thereby simulating the random fluctuations in the power output while generating wind and PV power scenarios. This method both captures the temporal variability and provides typical scenarios of power generation under different weather conditions.
Renewable energy power time series data often display characteristics of Markov processes, and as a result, numerous studies have adopted the Markov chain model to generate such data. The core advantage of the Markov chain lies in its ability to effectively capture temporal correlations and model the transition dynamics of system states through the transition probability matrix. However, its main limitation is that it cannot directly handle spatial correlations, particularly in multi-site renewable energy scenarios. To address this issue, researchers often combine the Markov chain with other methods to more comprehensively learn the spatiotemporal characteristics of renewable energy generation scenarios. As an example, reference [29] employed a first-order Markov chain to create representative scenarios aimed at addressing stochastic optimization problems. In [30], a higher order Markov chain model was used to classify the operating state of the PV system using the ambient temperature and solar radiation intensity. In [31], a mixed distribution model based on Markov chains was applied to short-term load forecasting, demonstrating its strengths in terms of both the prediction accuracy and computational efficiency. Additionally, in [32], a Markov chain was used to simulate solar radiation scenarios throughout the year, successfully capturing the probabilistic features of solar radiation. To further enhance the performance of Markov chains in renewable energy scenario modeling, some studies have incorporated techniques such as graph learning to improve the spatial correlation modeling based on temporal correlations. For example, reference [33] introduced a Markov chain model enhanced by graph-based learning techniques. Compared to traditional Markov chains, this model can more effectively capture the spatiotemporal characteristics of wind farms, significantly improving the accuracy of scenario modeling. The main components of the above are summarized in Table 1.

Table 1.
Markov chain methods summary.
2.2. Copula Function
In PV and wind power scenario generation, multiple highly correlated variables are typically involved, including the solar radiation, wind speed, and power output. The copula function can flexibly represent the nonlinear dependencies between these variables, making the generated scenarios more realistic.
Given n random variables, X1, X2, …, Xn, along with the joint distribution function F(X1, X2, …, Xn) and the marginal distributions F(X1), F(X2), …, F(Xn), there exists a copula function, C, such that the joint distribution can be expressed as a combination of the marginal distributions:
The coefficients of the copula function can be determined by fitting it to historical data to generate multivariate distribution characteristics that match the actual observed data. When we want to generate new scenario data, we can first sample the distribution values U1, U2, …, Un from the copula’s joint distribution and then obtain the corresponding random variable values by applying the inverse transformation of each marginal distribution:
where represents the inverse transformation.
The copula function has been widely applied in renewable energy scenario modeling, with its core advantage being the capacity to dynamically capture both temporal and spatial dependencies, making it particularly suitable for analyzing the complex relationships between multiple stochastic processes. For example, in [34], traditional copula functions were employed to model the stochastic dependencies in wind power scenarios, providing theoretical support for generating complex scenarios. Reference [35] used a multivariate Gaussian copula to generate strongly correlated aggregation production scenarios based on probabilistic forecasts of wind power, solar power, and small hydropower. However, traditional multivariate copula methods often assume that the correlation structure between every pair of variables is the same, which is generally not valid in practice. Therefore, more flexible models have emerged. To improve the modeling flexibility, reference [36] proposed using a vine copula to capture dependencies between wind power plants. This method allows for the flexible adjustment of correlation structures between different variables, significantly improving the accuracy of wind energy dependency modeling. Similarly, reference [37] used a Pair Copula Construction to capture dependencies in scenario generation, with numerical tests showing that it effectively modeled the complex dependencies between wind power plant scenarios.
To more comprehensively capture uncertainties and spatiotemporal correlations in renewable energy scenarios, many studies have combined a copula with other methods. For example, reference [38] applied non-parametric kernel density estimation along with copula functions to simulate various scenarios, constructing a more accurate renewable energy stochastic programming model. Reference [39] combined a copula with Markov chains, first using the copula to model spatial dependencies between wind and PV power and then modeling temporal dependencies with the Markov chain, thus considering both of their correlation characteristics. In more complex scenario modeling, reference [40] proposed building detailed statistical models using D-vine and copula methods to generate more diverse renewable energy output samples and accurately capture the spatial correlations between wind turbine outputs at different locations. Further, reference [41] combined the K-means with a C-vine and D-vine copula to precisely simulate the dependencies of multiple wind farm outputs, providing a more flexible tool for analyzing the power characteristics of multiple wind farms. The main components of the above are summarized in Table 2.
Table 2.
Copula function methods summary.
2.3. Sampling Methods
Although probability models for random variables can be applied to characterize uncertainty features, due to the complexity of stochastic optimization problems, directly applying these probability models is often infeasible. Therefore, sampling methods are needed to discretize continuous probability models, thereby generating discrete probability distributions and forming an initial set of scenarios. These scenario sets are used as input data in stochastic optimization, helping optimization algorithms analyze the system’s performance under different scenarios. Frequently used sampling techniques include the Monte Carlo and Latin hypercube methods.
2.3.1. Monte Carlo Sampling
In PV and wind power scenario generation, the Monte Carlo method helps simulate power outputs under various weather and environmental conditions, providing more comprehensive scenario data for the scheduling and optimization of renewable energy generation. By repeatedly sampling randomly and calculating the power output, the Monte Carlo method can generate power data sequences that align with real distributions, making it suitable for handling complex nonlinear relationships and multivariate stochastic processes.
Specifically, assuming the distribution function of PV or wind power is f(x), the Monte Carlo sampling method randomly samples N times from f(x) to obtain the samples x1, x2, …, xn, and based on these samples, it estimates the expected value of a certain statistical quantity E(X):
where N represents the sample size.
In PV and wind power scenario generation, it is often essential to combine external factors (such as the solar radiation, wind speed, etc.) for multivariable sampling. Suppose there are multiple variables, X1, X2, …, Xn, representing the related environmental parameters in the PV system. The Monte Carlo method draws samples from the joint probability distribution f(X1, X2, …, Xn), thereby generating scenario data with actual correlations.
The Monte Carlo method is often employed to mine and analyze the random characteristics of PV and wind power derived from historical data samples, generating scenarios that meet these characteristics to support uncertainty modeling and optimization analysis in renewable energy systems. Through this method, scenario data that closely resemble the actual characteristics of renewable energy generation can be obtained, improving the adaptability of models [42,43]. In [44], researchers used the reduced Monte Carlo method combined with K-means clustering to generate representative distribution scenarios for distributed generation, simplifying the complexity of random scenario sets while retaining key statistical features. Likewise, reference [45] applied the Monte Carlo approach to model short-term uncertainties in wind power, offering robust support for system scheduling decisions. Regarding wind power characteristics, reference [46] proposed an improved Markov chain Monte Carlo method that fully considers the persistence and variability characteristics of wind power. Additionally, Gibbs sampling, as an enhancement to the sampling process, has been applied to the sampling problem of the joint distribution of multiple renewable energy sources. Reference [47] used Gibbs sampling to efficiently generate multiple renewable energy scenarios, considering spatiotemporal correlations, improving the efficiency and accuracy of the generated scenarios.
2.3.2. Latin Hypercube Sampling
In contrast to Monte Carlo, Latin hypercube sampling evenly divides the range of each input variable into N intervals and randomly selects a sample point in each interval to ensure that the sample uniformly covers the entire range of variable values. For the variable Xi, the sample generation formula is
where represents the inverse of the cumulative distribution for Xi. The sample points generated in this way are uniformly distributed in different intervals, which can more effectively simulate the uncertainty characteristics in PV and wind power scenarios, making the scenarios more representative of the actual distribution characteristics.
Latin hypercube sampling usually requires lower sampling times and can more accurately reconstruct the feature distribution of input data than other sampling methods, causing it to be commonly applied in generating new energy scenarios [48]. In [49], a method was proposed that integrates Latin hypercube sampling with Cholesky decomposition to perform probabilistic power flow (PPF) analysis, effectively tackling load flow challenges under multiple uncertainties in power systems. By combining these two methods, uncertainty in the power system can be effectively addressed, ensuring the accuracy and stability of analysis results. In addition, reference [50] adopted a low-variation Latin hypercube sampling method to address the correlation issue between power generation units, thus enabling the more effective sampling of power data. This method optimizes the sampling process, reduces mutual interference between variables, and improves the quality and computational efficiency of sampling. Reference [51] proposed a method that combines Latin hypercube sampling with polynomial normal transformation. By establishing a probability distribution model through statistical measures and correlation structures, it is better able to simulate the uncertainty of the power system, especially when dealing with input variables with a high correlation. Reference [52] used the Nataf transform to handle the correlation between variables and combined it with Latin hypercube sampling for PPF analysis. The Nataf transform transforms the correlations of variables into independent variables, enhancing the efficiency of the sampling process and boosting the accuracy of the results. The main components of the above are summarized in Table 3.
Table 3.
Sampling methods summary.
2.4. Autoregressive Moving Average Mode
The ARMA is a widely utilized method for modeling time series data that is suitable for capturing trends and fluctuations in power generation. The ARMA consists of autoregression (AR) and a moving average (MA). The former uses historical data to predict the current value, while the latter corrects the prediction through historical error terms. Assuming the PV and wind power series is Xt, the ARMA assumes that the current Xt depends on the past p moments and the random errors from past q terms. Its mathematical expression is
where ϕi and θj are the coefficients of AR and the MA. ϵt represents noise. By adjusting the parameters p and q, the ARMA can adapt to different time series patterns, aligning the generated power scenarios more closely with the actual variation characteristics.
The ARMA is capable of accurately simulating the dynamic fluctuations of weather changes, such as solar radiation and wind speed measurements, capturing temporal dependencies and prediction errors. In wind energy applications, references [53,54] used ARMA models to model hourly wind speeds. In addition, reference [55] proposed to construct a wind speed prediction error model using the ARMA model, effectively simulating the statistical behavior of prediction errors and helping to reduce unbalanced costs in wind power trading. For multiple wind power stations, reference [56] proposed a method based on the ARMA model to generate spatiotemporally correlated wind speed scenarios, while reference [57] converted the ARMA into a state space representation to accurately capture the spatiotemporal correlation of the wind speed. In uncertainty analysis, reference [58] combined ARMA and probabilistic distance-based backward reduction methods to optimize wind energy scenario generation. Unlike the ARMA, the Autoregression Integrated Moving Average (ARIMA) can process non-static data through differential operations. The ARIMA-based wind power generation model proposed in [59] further introduces the limited ARIMA (LARIMA) to improve the accuracy of wind speed modeling. The main components of the above are summarized in Table 4.
Table 4.
Explicit methods summary.
The advantages and disadvantages of the above four explicit methods are summarized in Table 5. Although explicit probability statistical models have certain advantages in scenario generation, they also face limitations. Firstly, such models possess a restricted capacity, making it difficult to effectively describe complex temporal features and lacking the flexible capturing of randomness and diversity in scenario generation. In addition, because of the substantial effect of weather conditions on wind and PV power generation data, their uncertainty is high, and explicit models rely too much on preset probability distribution functions, making it difficult to precisely capture the uncertainty characteristics through mathematical expression.
Table 5.
Advantages and disadvantages of four methods.
3. Implicit Methods
As deep learning continues to evolve, implicit models have gradually become the main tool for generating new energy generation scenarios. This type of model utilizes the nonlinear mapping ability of neural networks to automatically capture intricate distribution features from historical data, thereby effectively characterizing the randomness and volatility characteristics in new energy generation. Among these models, traditional deep learning methods such as artificial neural networks (ANNs) [60,61] and long short-term memory networks (LSTM) [62] have been widely applied in the generation of renewable energy scenarios.
On this basis, generative deep learning models further expand the expressiveness of implicit models and have gradually become an important tool in the generation of new energy scenarios. Generative models not only learn the data distribution from historical data through complex nonlinear mapping but also generate diverse and realistic samples of new energy scenarios. Their advantage lies in the adaptive learning of complex features in the data: generative models can automatically capture nonlinear and high-dimensional features in data through data-driven methods without relying on specific probability distribution assumptions. This enables them to effectively depict the complex correlations in new energy scenarios, fully reflecting the uncertainty and diversity of wind and PV power generation, especially the characteristics under different meteorological conditions. Next, we will introduce several main generative deep learning models (GANs, VAEs, and diffusion models) and their applications in generating new energy scenarios, exploring how they construct realistic new energy output scenarios through data-driven approaches.
3.1. Generative Adversarial Network
GANs can effectively generate realistic PV and wind power scenario data through the adversarial training of generators and discriminators. The generator produces realistic scenarios, while the discriminator is tasked with distinguishing between the synthetic scenarios and the authentic ones, as shown in Figure 3. The loss function of the generator is
where G(z) denotes the mapping of the random noise z to the output, D(x) represents the discriminator’s judgment on real data, x, D(G(z)) represents the discriminator’s judgment on generated data, and pdata and pz are the distributions of the real data and noise.
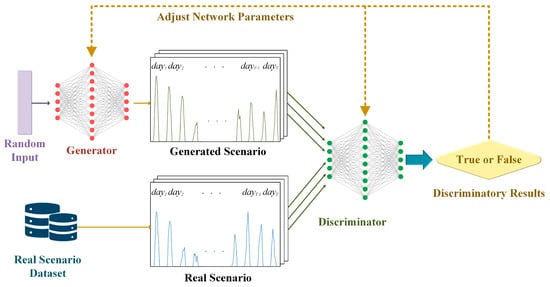
Figure 3.
Structure of GAN.
The GAN generation process can be enhanced by further improving it using a Conditional GAN (CGAN), which adds additional conditions, y (such as weather conditions), to the generator and discriminator to generate new energy scenarios in specific contexts.
Through this method, GANs can generate PV and wind power scenario data under specific conditions, making the generated data more targeted and practical and improving the accuracy of scenario generation.
GANs can construct realistic scenarios that conform to the patterns of PV and wind power. Reference [63] used a GAN model to extract the complex spatiotemporal relationship features of wind power and further generate a fuzzy set based on f-divergence to construct a distributionally robust joint probability-constrained scheduling scheme. The CGAN is an extended version of the GAN that can utilize conditional information to constrain the generation process and generate new energy scenarios under specific conditions. In [64], a new framework called the Fed-LSGAN was introduced, leveraging federated deep generative learning to develop a spatiotemporal scenario generation method for renewable energy that preserves privacy. In references [65,66,67], a CGAN was used for PV scenario generation, incorporating environmental conditions such as the weather and seasons to generate PV scenarios under these conditions.
The Wasserstein Generative Adversarial Network (WGAN) further improves the GAN model by introducing gradient penalties to make the model more stable and generate higher quality scenarios. References [68,69,70,71] applied the WGAN and utilized a gradient penalty strategy to refine the generation quality of a GAN for wind and PV power scenarios, enhancing Lipschitz continuity constraints. Reference [72] proposed an improved GAN model based on the Wasserstein distance and Gaussian copula for scenario planning for wind and PV power fields to more accurately simulate the correlations of scenarios. Reference [73] explored the use of a transparent latent space-controlled GAN (ctrl GAN) to generate renewable energy scenarios, achieving precise control of the generation process by controlling latent variables. The SolarGAN is an improvement based on the Wasserstein GAN, designed for generating and completing PV data. In reference [74], the SolarGAN combined random noise and real solar radiation samples to generate realistic solar time series, effectively handling the independent time features of PV data.
To enhance the diversity of scenarios, reference [75] introduced a Bayesian GAN-based scenario generation model. By using a Bayesian modeling generator, multiple patterns in the data could be better captured to simulate the diversity and physical processes of new energy scenarios. Another study proposed a PV scenario generation method based on the Spectral Normalization GAN (SNGAN) [76], which enhances the stability of the GAN model by introducing spectral normalization as a regularization technique, effectively improving the quality of PV data scenario generation. Another study used the Style-GAN2 to further enhance the quality of PV scenario generation. In reference [77], the improved Style-GAN2 accurately generated PV data scenarios that met specific conditions through the interdependence of the historical power, predicted power, and meteorological variables. It utilized style-mixing techniques and sequence encoders to make the generated scenarios more realistic.
In time series modeling, both the Sequence GAN (SeqGAN) and Progressive Growth GAN (PgGAN) demonstrate strong adaptability. Reference [78] used the SeqGAN to more accurately extract time-dependent features in PV scenarios, while reference [79] used the Pg GAN to capture the temporal dynamic mode of wind power, providing a multi-criteria optimization solution for scenario modeling. Meanwhile, a model combining LSTM and the GAN demonstrates advantages in predicting the temperature and radiation throughout the year. Reference [80] combined LSTM and GAN models to generate temperature and radiation data and captured the global characteristics of time series based on the loss functions of the mean and variance. Reference [81] adopted a combination of style transfer and bidirectional LSTM to ensure the diversity of PV scenarios and achieve the accurate learning of temporal features in PV scenarios. The main components of the above are summarized in Table 6.
Table 6.
GAN methods summary.
3.2. Variational Autoencoder
The VAE, alongside the GAN, stands out as one of the most widely used deep generative models. The VAE is a probability distribution-based generative model that learns hidden features from data through an encoder–decoder structure, making the generated PV and wind power scenario data more diverse and realistic. The VAE is composed of two primary components: an encoder and a decoder. The encoder transforms the input data into a latent space representation, while the decoder reconstructs the input data from this representation to generate the target output scenario.
As illustrated in Figure 4, the VAE framework processes the input through an encoder, which computes two essential parameters: the mean (μ) and standard deviation (σ). These parameters characterize the latent space distribution. To produce the latent variable z, the VAE applies a reparameterization method, where random noise, ϵ, is drawn from a standard normal distribution and sampled using Equation (10). This approach ensures the sampling process remains differentiable, allowing the model to capture the data’s intricate distribution through optimization using gradient descent.
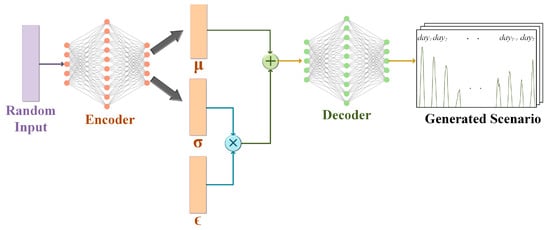
Figure 4.
Structure of VAE.
During training, the VAE focuses on optimizing the Evidence Lower Bound (ELBO) of the marginal likelihood, represented by the following expression:
where q(z|x) refers to the estimated posterior distribution of the latent variable z, p(z) is the prior distribution, often taken as a standard normal distribution, and p(x|z) represents the probability of the decoder generating the data given the latent variable z. The first term is the Kullback–Leibler (KL) divergence, whereas the second component aims to maximize the probability of data generation.
When creating PV and wind power scenarios, the VAE produces new samples by identifying and utilizing the underlying patterns within the latent space distribution. For example, by sampling z in the latent space and inputting it into the decoder, the generated sample, x, obtained is the simulated PV and wind power output:
VAEs can generate new energy scenarios with complex features while ensuring the continuity and stability of the generated data. The generated PV and wind power scenario data can be used to evaluate power fluctuations under different meteorological conditions, providing support for new energy dispatching and planning. The VAE has been widely applied in research related to the generation of scenarios in renewable energy. In reference [82], a deep convolutional VAE (DC-VAE) was employed to model the energy usage behavior of electric vehicles. By designing the model’s structure, the simulation results preserved the temporal dependencies and statistical distribution features of the load curve. Additionally, they demonstrated a strong ability to recover both the timing patterns and fluctuation characteristics, highlighting the benefits of VAEs in generating complex load data. To improve the diversity of scenario generation, reference [83] introduced an additional feature extraction layer. This modification enables traditional VAEs to conditionally fit data, allowing for the accurate representation of multi-source energy consumption patterns in smart distribution grids. To efficiently extract critical features from wind power data, reference [84] integrated a self-attention mechanism into the VAE’s encoder and decoder. This enhancement strengthened the model’s ability to capture nonlinear features in time series data, emphasizing the most significant patterns within wind power datasets. In addition, the combination of VAEs and GANs has gradually become a new trend. For example, references [85,86] utilized the VAE-GAN architecture to combine the efficient training of VAEs and the generation accuracy advantages of GANs. While improving the model’s training speed, they ensured the accuracy of the generated PV scenario data, thereby providing more stable and diverse scenario generation capabilities. The main components of the above are summarized in Table 7.
Table 7.
VAE methods summary.
3.3. Diffusion Model
Although scene generation based on GANs exhibits excellent performance in terms of probabilistic and temporal characteristics, the diversity of the generated scenes remains limited due to the inherent architectural constraints, potentially failing to capture the full distribution of real data [87]. To address this, researchers have proposed a novel generative model known as the diffusion model [88], which surpasses GAN models on many evaluation metrics [89]. Building on this diffusion framework, several widely recognized AI-driven models for generating images from text, such as Stable Diffusion [90] and Midjourney [91], have emerged. Notably, OpenAI’s latest product, Sora [92], is also based on the diffusion model architecture.
Currently, diffusion models have been applied across a variety of fields with impressive results, including textile and apparel pattern design, floral fabric pattern generation, brain tumor anomaly detection, music generation, flow field modeling, network traffic intrusion detection, and image restoration, among others. In contrast to GANs, the diffusion model represents a completely different neural network architecture, as illustrated in Figure 5. Unlike the adversarial training used in GANs, the diffusion model adds noise to the input data during the forward phase. In the reverse phase, it recovers the original data by forecasting the noise and removing it. Through this approach, the diffusion model learns how to map noise to real data, allowing for the gradual generation of new scenarios starting from noise. Unlike GANs, which produce a single image in one step, the diffusion model estimates the image distribution iteratively at each stage and samples from it. This approach significantly improves the diversity of the generated scenarios. The noise-adding process can be defined as follows:
where at and bt are two hyperparameters that control the level of noise introduced at each step, while ct represents the Gaussian noise added at the tth time step.
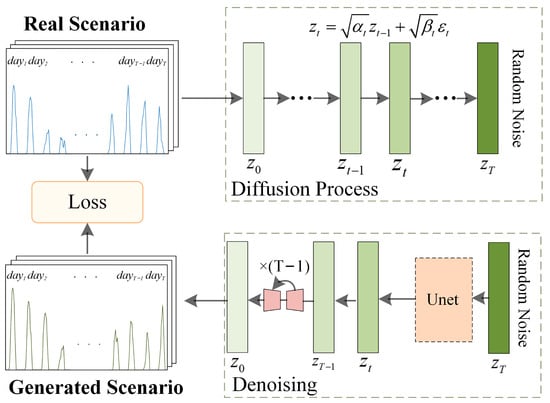
Figure 5.
Structure of diffusion model.
The key aspect of scene generation using diffusion models lies in the reverse denoising process, which is the process of generating new scenes. The denoising task can be described using Bayes’ theorem as follows:
where p(•|•) represents the conditional distribution.
Given the exceptional success of diffusion models in image generation, researchers have started exploring their applicability in creating scenarios for renewable energy systems. Dong et al. [93] redefined the task of generating renewable energy scenarios as a regression problem focused on deterministic predictions and error generation, employing conditional diffusion models to create deviations in the latent space. This approach enabled the generation of short-term wind power scenarios for up to 72 h ahead. Xu et al. [87] utilized foundational diffusion models to generate 48 h wind power scenarios within the context of wind energy simulation. Their results demonstrated that the generated scenarios successfully retained the original data’s variability and temporal characteristics. Yan et al. [94] employed a combination of U-Net and ResNet as the main architecture for the diffusion model, enabling the generation of 24 h wind power simulations with a 15 min resolution, validating its superior performance compared to CGANs. Li et al. [95] employed an enhanced diffusion model built on the U-Net framework and trained with wind and PV data from Jiangsu Province. Their study revealed that this approach offered greater training stability compared to traditional methods, achieved more precise probability distribution fitting, and successfully simulated scenarios up to 24 h in advance. In contrast, there is currently no research on scenario generation based on diffusion models in China. The main components of the above are summarized in Table 8.
Table 8.
Diffusion models summary.
The advantages and disadvantages of the above three implicit methods are summarized in Table 9; current scenario generation methods based on diffusion models primarily focus on wind power simulations, with limited application to PV simulations, and the simulation duration ranges from 24 to 72 h. Moreover, existing methods predominantly utilize the traditional U-Net architecture, which has notable limitations. For instance, the scalability of the U-Net architecture is restricted, as it cannot increase the model complexity through flexible adjustments to the depth/width or input token quantity, as seen with Transformer models. U-Net leverages Convolutional Neural Networks (CNNs) for feature extraction. Nevertheless, the constrained receptive field of convolutional layers can limit the model’s capacity to grasp broader contextual relationships. Researchers have proposed a new model that combines the diffusion model with a Transformer, known as a Diffusion Transformer (DiT) [96], but to date, there has been no research on its application in scene generation.
Table 9.
Implicit methods summary.
4. Wind–Solar Joint Scenario Generation
The prior two sections discussed the extensive application of explicit models grounded in probabilistic statistics, including copula functions, Markov chains, and Latin hypercube sampling, as well as data-driven implicit models such as GANs, VAEs, and diffusion models, in the generation of wind and PV power scenarios. As shown in Table 10, explicit models utilizing clear mathematical modeling methods can provide relatively accurate single-renewable-energy scenarios even with limited data, but they exhibit limitations in extracting complex spatiotemporal features. On the other hand, implicit models leverage the powerful data fitting capabilities of deep learning, enabling the generation of realistic renewable energy scenario data and offering advantages in capturing nonlinear relationships. However, these models are primarily used for the generation of single-energy scenarios, with relatively few studies focusing on wind–solar joint scenario generation.
As the share of wind and PV resources in the energy system has continued to rise [97], wind–solar joint scenario generation has gradually become essential. Wind power and PV resources exhibit complex interdependencies in terms of time, space, and meteorological conditions [98], and relying solely on single-scenario generation methods is insufficient to fully characterize the uncertainty of their joint output and its impact on the system stability [99,100]. Therefore, researching wind–solar joint scenario generation can not only enhance the realism of the generated scenarios but also provide a more reliable input for grid scheduling and capacity planning. In this context, the following sections will examine the specific needs of joint wind–solar scenario generation. We will also address the related uncertainties and explore the emerging requirements for generative models.
Table 10.
Comparison of scenario generation methods.
Table 10.
Comparison of scenario generation methods.
| Method | Spatial Correlation | Temporal Correlation | Probability | Diversity |
|---|---|---|---|---|
| Beta Distribution [23] | ✕: Unable to handle spatial correlations, usually uses univariate modeling. | ✕: Not proficient in time series data modeling. | ✓: Parameterized probability distribution, suitable for generating random scenarios. | ✓: Dependent parameter adjustment generates diverse scenarios. |
| Weibull Distribution [27] | ✕: Univariate modeling. | ✕: Not suitable for modeling time dependencies. | ✓: Probability distribution modeling. | ✓: Diversity control based on parameters. |
| Markov Chain [39] | ✕: Mainly used for state transition modeling, not proficient in handling spatial correlations. | ✓: Proficient in modeling state transitions in time series. | ✓: Focuses on modeling the transition probabilities between states as a probabilistic model. | ✕: Ensures diversity in the generated results, avoiding reliance on a predefined transition matrix. |
| Copula Functions [35] | ✓: Model the joint distribution among multiple variables. | ✕: Combine with other time series methods to model temporal dependencies. | ✓: Specifically designed for constructing joint probability distributions. | ✓: Enable the generation of diverse scenarios through different marginal distributions and types of copulas. |
| Monte Carlo Sampling [101] | ✓: Utilizes correlation matrices to generate spatially correlated scenarios. | ✕: Require integration with specific models or assumptions. | ✓: Samples based on probability distributions. | ✓: Achieves high diversity through multiple samplings. |
| Latin Hypercube Sampling [102] | ✓: Can control the distribution of sample points in space. | ✕: Single sampling cannot capture time dependencies. | ✓: Sampling method based on probability space. | ✓: Ensures global distribution uniformity with good diversity. |
| ARMA Model [16] | ✕: Does not support modeling of multivariable or spatial correlations. | ✓: Classic time series modeling methods, suitable for short-term dependencies. | ✓: The generated results can be interpreted as models based on probability distributions. | ✕: The results are limited by the data patterns, leading to lower diversity. |
| ANN [60] | ✓: Spatial correlations can be captured through training. | ✕: Not suitable for directly modeling time series. | ✕: Based on deterministic mapping, not good at probabilistic generation. | ✕: Constrains the variety of generated outputs and heavily relies on the training dataset. |
| LSTM [81] | ✕: Cannot handle spatial correlations. | ✓: Specialized for modeling time dependencies. | ✕: Outputs deterministic values. | ✕: Generates limited diversity. |
| Autoencoder [82] | ✓: Captures the spatial structure of the input data. | ✕: Combines with RNN/LSTM to handle temporal correlations. | ✕: Ensures the generated results are deterministic. | ✓: Achieves diversity through perturbations in the latent space. |
| GAN [103] | ✓: Excels at generating high-resolution data with spatial characteristics. | ✓: Captures time dependencies through variants like TimeGAN. | ✓: Uses implicit probability models. | ✓: Generates high-diversity samples. |
| VAE [85] | ✓: Captures spatial correlations through the encoder–decoder network. | ✓: Models temporal dependencies after integration with a time series module. | ✓: Uses implicit probabilistic models. | ✓: Achieves diversity through latent space perturbation. |
| Diffusion Model [104] | ✓: Generates complex scenarios with spatial correlation structures. | ✓: Models through temporal diffusion processes. | ✓: Generates probabilistically based on diffusion processes. | ✓: Generates results with high diversity. |
4.1. Wind–Solar Joint Scenario Generation Requirements Analysis
4.1.1. Complementarity of Wind–Solar Joint Scenario Generation
The need for joint wind–solar scenario generation arises from the complementary nature of wind and solar power, particularly in their generation behaviors and spatiotemporal distributions. Wind power and PV outputs frequently display variations and synergistic traits influenced by temporal and weather-related factors. For instance, PV generation is most efficient on sunny days during daylight hours but is almost nonexistent at night or on cloudy days; in contrast, wind power can be produced at any moment based on the wind velocity, especially in areas with higher wind intensities [105,106]. The complementary nature of these two resources allows wind–solar joint generation to effectively provide a stable renewable energy output under uncertain conditions for the power system.
In power system planning and scheduling, the demand for wind–solar joint scenario generation is becoming increasingly urgent. With the increasing integration of renewable energy into the power grid, greater attention must be given to the combined output patterns shaped by varying weather conditions and seasonal fluctuations. Conversely, to handle the variability of renewable energy, the grid system must be more adaptable in its scheduling capabilities. Single-source wind or PV power scenario generation can no longer meet the comprehensive and precise planning needs of the power system, whereas joint scenario generation provides a more accurate input for uncertainty assessments and scheduling strategy optimization.
4.1.2. Uncertainty in Wind–Solar Joint Scenario Generation
The output of wind and PV power generation is highly dependent on meteorological conditions, exhibiting significant randomness and uncertainty, which poses numerous challenges for power system planning and scheduling. This uncertainty in single-source wind or PV power scenario generation usually arises from variations in individual meteorological factors. These factors include elements like the wind velocity or solar irradiance levels. Traditional univariate scenario generation methods struggle to effectively capture the nuanced behaviors of wind–solar joint generation scenarios, as the wind speed and solar radiation exhibit different variation patterns at different times and geographical locations [101], leading to complex fluctuations in the generation output. Wind–solar joint scenario generation methods attempt to address this challenge by simultaneously simulating the output variations of both wind and solar generation, aiming to provide a comprehensive simulation of multiple meteorological variables, thereby more realistically reflecting the fluctuations in joint generation.
In specific scenarios, for instance, under weather conditions with clear skies and strong winds, both wind and solar power may reach their peak output simultaneously, whereas during the night or on cloudy days with no wind, both sources may approach zero output. This uncertainty not only imposes higher requirements on load balancing in wind–solar joint generation scenarios [107] but also increases the difficulty of short-term grid scheduling. If high-precision scenario generation cannot be achieved, additional backup resources may be needed to ensure system stability, thereby increasing scheduling costs. Therefore, creating more precise joint scenario generation models is crucial to managing the uncertainty caused by the fluctuating nature of wind and solar resources. This is essential for enhancing the grid’s operational reliability and lowering operational costs [102].
Beyond temporal volatility, wind–solar joint scenario generation must also consider spatial correlations. Large-scale wind and PV power plants often cover multiple geographical regions [108], and these regions, due to differences in the terrain, climate, and other factors, may exhibit distinct meteorological characteristics. For example, one region may have higher wind speeds, while an adjacent region may experience stronger solar radiation. Such geographical distribution characteristics [109] result in spatial inconsistencies in the generation output. Therefore, joint scenario generation not only needs to capture the dynamic characteristics of different meteorological variables but also must establish spatial correlation models between regions to characterize the spatial heterogeneity and interdependence of multi-region wind–solar outputs. This will provide a more representative input for system planning and scheduling. The development of such models generally requires the multi-layer integration of geographical and meteorological data, employing machine learning or deep learning methods to uncover spatial relationships within the data, thereby enabling precise joint wind–solar scenario generation.
4.1.3. New Requirements for Generation Models
With the increasing demand for wind–solar joint scenario generation and the intensifying uncertainty factors in the systems, generation models need to possess several key characteristics to address the complex spatiotemporal dependencies and diverse random features. Firstly, the generation model must possess effective spatiotemporal feature extraction abilities, allowing it to thoroughly capture the multifaceted interactions between wind and solar power production. In multi-region and multi-timescale scenarios, traditional generation methods often underperform due to their limitation to a single time dimension. Deep generative models, such as GANs, offer new possibilities for capturing complex spatiotemporal features, particularly showcasing their advantages in handling multidimensional dependencies in wind–solar joint scenario generation.
Moreover, the generation model must exhibit good generalization and transferability to adapt to newly established wind or PV power stations with sparse data. Many renewable energy development regions lack sufficient historical data [110], making it necessary for the model to have transfer learning capabilities. This will allow the model to apply existing data and models to data-scarce areas [111], ensuring the representativeness of the generated results. To achieve this, the model design should fully consider factors such as data imbalances and regional differences, enhancing its adaptability and generalization ability across different regions, thereby ensuring its effectiveness in a variety of application scenarios.
4.2. Exploration of Wind–Solar Joint Scenario Generation Methods
4.2.1. Research on Existing Wind–Solar Joint Scenario Modeling
To meet the demands for extracting multidimensional spatiotemporal features in wind–solar joint scenario generation, the application of GANs in this field has been extensively explored in recent years, evolving into several improved models to more effectively handle the intricacy and unpredictability of wind–solar resources. Study [103] employed an improved InfoGAN, which maximized information and optimized adaptive control parameters, showing significant advantages in joint scenario generation. This method effectively modeled the correlations between the wind output, solar output, and load, making the generated extreme scenarios more practically valuable and controllable, thereby providing data support for the safety assessment of high-renewable-energy-penetration systems.
To further enhance the model performance, study [112] applied the Wasserstein distance and gradient penalty mechanism to generate more stable wind–solar scenarios, offering a more accurate reflection of the future production volatility. By incorporating two extra metrics, the “output smoothness” and “source-load alignment”, the model offers a scientific basis for quantifying the synergy between wind and solar resources, thus aiding in the capacity planning of wind–solar hybrid systems.
Study [113] further combined the WGAN-GP with the sparrow search algorithm, improving the capacity configuration of wind–solar hybrid storage systems. This approach optimized the reliability and matching of the wind–solar system, effectively reducing curtailment rates and enhancing system investment returns, making it more suitable for practical multi-scenario planning. Building on this, study [114] introduced the GAN-VI model, incorporating variational inference (VI) to improve the spatiotemporal consistency and generation quality of wind–solar scenario data. By incorporating variational inference, the GAN-VI captures the complex distributions and nonlinear characteristics within wind–solar data, with the generated scenarios exhibiting higher precision in terms of spatiotemporal correlations. This provides high-quality simulation data for short-term optimization scheduling in multi-energy hybrid systems.
Overall, significant progress has been made in wind–solar joint scenario generation, particularly in the exploration of multidimensional spatiotemporal dependencies and complementarity in wind–solar joint modeling, which previous models lacked. However, there remains room for improvement in generating multi-region, multi-timescale scenarios and enhancing the broad adaptability of existing methods under complex conditions. The next section will further explore potential technical directions that could be explored in wind–solar joint modeling to more comprehensively meet practical application needs.
4.2.2. Outlook on Wind–Solar Joint Scenario Modeling
With the increasing demand for wind–solar joint scenario generation, effectively capturing the spatiotemporal dependencies of wind and solar resources remains a key research direction. Diffusion models, an emerging generative deep learning technology, have demonstrated unique advantages in generating high-quality and diverse data [104], presenting significant potential for application in wind–solar joint scenario modeling. At the same time, the Graph Attention Network (GAT), with its exceptional ability to capture complex spatial dependencies [115], complements the characteristics of diffusion models, making their integration a promising avenue for future research.
The core feature of diffusion models lies in their ability to accurately model complex probability distributions through a process of progressively adding random noise and reverse reconstruction to generate samples. This stepwise diffusion and restoration approach gives them a natural advantage in generating data with high randomness and diversity [116]. Specifically, the wind speed, radiation, and other data in wind–solar joint scenarios often exhibit high nonlinearity and randomness. Through a multi-step denoising process, diffusion models can incrementally capture fine-grained data features, producing scenario data that closely approximate the true distribution.
In the spatial dimension, diffusion models can further enhance their ability to capture inter-regional dependencies by integrating the adaptive attention mechanism of the GAT. By treating wind farms and PV stations as nodes in a graph, the GAT dynamically adjusts the weights between nodes, highlighting the influence of key regions on the generation process. This integration enables diffusion models to incorporate critical factors such as geographic information and climatic characteristics [117], fully reflecting inter-regional differences and correlations. Such a combination provides more accurate support for wind–solar joint modeling, as illustrated in Figure 6.
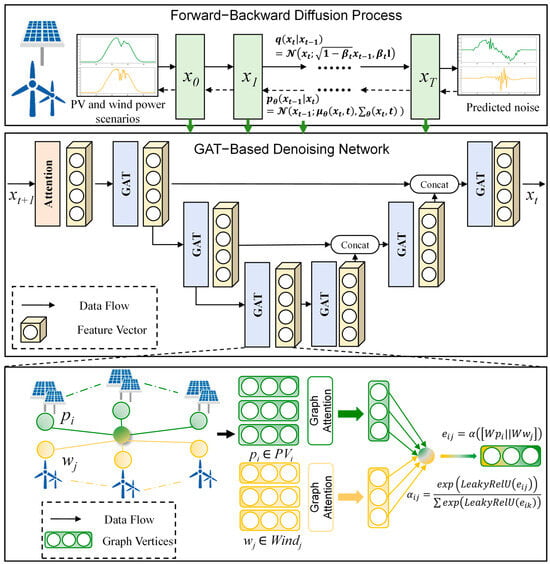
Figure 6.
Prospects for modeling with the integration of diffusion models and the GAT.
In addition, the temporal modeling capability of diffusion models provides critical support for capturing the temporal characteristics of wind and solar resources. By integrating Temporal Embedding techniques, diffusion models can incorporate time information during the generation process, reflecting the short-term random fluctuations and medium- to long-term cyclical patterns of wind and solar resources [118]. Meanwhile, with the assistance of the GAT in spatial feature modeling, diffusion models can collaboratively capture the dynamic spatiotemporal variations in wind and solar resources, making the generated scenario data better align with practical needs.
Current research on diffusion models is primarily focused on fields such as image generation, text generation, and molecular structure design [119,120]. The successes in these areas demonstrate their significant advantages in capturing complex multimodal and high-dimensional features. For instance, diffusion models have achieved high-precision generation that closely approximates real image distributions in image generation [121], while the GAT has exhibited powerful capabilities in modeling complex dependencies, such as in traffic flow prediction. These advancements offer important guidance for combining diffusion models with the GAT in wind–solar joint scenario modeling applications.
The use of diffusion models for wind–solar joint scenario generation remains at a preliminary stage. Future research can focus on several key directions. First, it could explore efficient diffusion process designs to optimize the computational efficiency of denoising networks and meet the large-scale data demands of wind–solar scenario generation. Second, it could integrate domain knowledge to develop more targeted conditional diffusion models and investigate joint optimization strategies for combining the GAT with diffusion models. By leveraging the GAT to dynamically model complex inter-regional dependencies, the model’s ability to capture specific features of wind–solar scenarios can be further enhanced. Third, it could design multi-timescale diffusion strategies to achieve integrated modeling capable of generating short-term, medium-term, and long-term scenarios. With the continual advancement of technology, the fusion of diffusion models and the GAT is anticipated to become an essential tool in joint wind–solar scenario generation, offering high-quality scenario data to aid in the planning and operation of renewable energy systems.
As shown in Figure 7, the future of wind and PV power joint scenario generation will revolve around three core objectives: ‘More Realistic’, ‘More Accurate’, and ‘More Timely’. In terms of ‘More Realistic’, the integration of generative AI and the metaverse will simulate highly realistic wind and PV power scenarios, capturing the diversity and complexity of natural environments. For ‘More Accurate’, advanced computer vision technologies will enhance spatial analysis capabilities, precisely modeling the spatial correlations of wind and PV power systems. Additionally, natural language processing technologies, represented by models like ChatGPT, will enable multi-modal information fusion and intelligent energy scenario generation. Regarding ‘More Timely’, edge computing and 6G ultra-fast networks will ensure real-time scenario generation and dynamic responses, providing robust support for distributed energy management and scheduling. The entire system is underpinned by supercomputing capabilities, processing massive datasets, and complex models, forming the foundation for advancing wind and PV power scenario generation technologies.
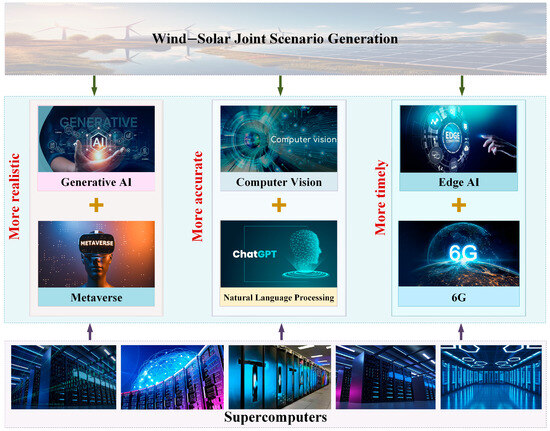
Figure 7.
Prospects for wind–solar joint scenario modeling.
5. Discussion
Weather forecasts inherently contain uncertainty, which can significantly affect the accuracy of power scenario generation. For example, the uncertainty in forecasting parameters such as the wind speed, solar radiation, and temperature can propagate through energy conversion models and impact the final power output predictions. The propagation of this uncertainty largely depends on factors such as the geographic location, the forecast’s temporal resolution, and the specific characteristics of the renewable energy systems in question. In Figure 8, we compare the local measured data (LMD) and numeric weather prediction (NWP) from a PV station in Hebei, China. The data include measurements of the temperature, direct radiation, and diffuse radiation. The comparison in the figure reveals two important issues.
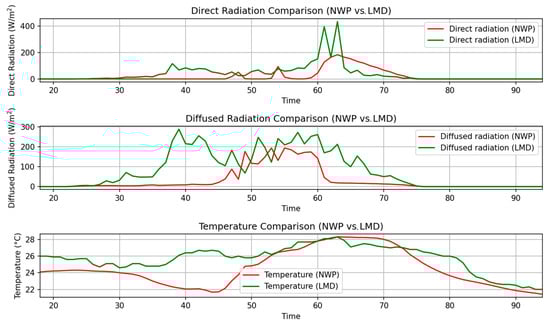
Figure 8.
Comparison of NWP and LMD differences.
Firstly, both the LMD and NWP have significant measurement errors and uncertainties. The LMD can fluctuate due to factors like the instrument precision and environmental interference, challenging accurate power generation forecasting. Moreover, even under ideal conditions, the instantaneous changes in the weather make precise predictions difficult.
Secondly, Figure 8 shows a significant discrepancy between the LMD and NWP. This is because the NWP relies on large-scale meteorological models that cannot fully account for the local microclimate at PV stations and wind farms, which are often located in areas with complex terrains or significant climatic variations [122]. As a result, using a large-scale NWP to generate power output scenarios for these facilities may not accurately reflect local weather conditions, impacting the scenario generation accuracy.
The uncertainty in the NWP clearly impacts PV power output scenario generation. Inherent errors in the NWP, especially when large-scale data are applied to localized areas, directly transfer uncertainty to the model output, causing fluctuations in the generation results and reducing the scenario reliability. The uncertainty propagates through the model, affecting the power output accuracy. For example, PV power generation is closely tied to the temperature and solar radiation, while the wind farm output depends on the wind speed and air pressure. Errors in weather forecasts, particularly in radiation, wind speed, and temperature predictions, lead to biases in the power output. These inaccuracies can amplify through the model, especially in complex, nonlinear models. Different models, such as GANs and VAEs, simulate uncertainty by generating multiple scenarios, mitigating the impact of input errors. However, regardless of the model used, input errors ultimately affect the prediction accuracy. Thus, accurately capturing and propagating the input uncertainty is crucial for improving the scenario generation reliability.
In addition to the uncertainties in the NWP, the interplay between economic uncertainty and energy generation is also a critical factor for decision-making and policy development. Economic uncertainty not only directly impacts the energy demand and the production costs of renewable energy but may also exacerbate challenges in energy forecasting [123,124]. For instance, fluctuations in inflation may alter the cost structure of renewable energy technologies, thereby influencing their deployment progress. Meanwhile, changes in interest rates could affect investment decisions in energy infrastructure, thus impacting the supply capacity and development pace of renewable energy. Existing studies have shown that economic policy uncertainty plays a significant role in energy generation. For example, Adedoyin et al. found that economic uncertainty not only exacerbates energy emissions but also plays a moderating role to some extent, revealing the complex relationship between economic policy and energy systems [125]. Similarly, Borozan et al. pointed out that economic policy uncertainty has a significant long-term asymmetric effect on renewable energy consumption, emphasizing the crucial impact of policy stability on energy systems [126]. These studies suggest that economic uncertainty not only affects energy production and consumption but also potentially propagates uncertainty into energy forecasting through various channels. In renewable energy sectors such as wind and PV power, economic uncertainty may amplify the uncertainty in energy forecasts by influencing costs, investments, and demand. Therefore, the impact of economic uncertainty needs to be fully considered in order to provide more comprehensive and robust decision-making support for future energy policies and planning.
6. Conclusions
Wind–solar joint scenario generation is a key technology for addressing the uncertainties associated with wind and PV power generation. Traditional scenario generation methods for wind and solar power have mostly been treated independently, failing to effectively leverage the spatiotemporal complementarity between the two. With the growing penetration of renewable energy in power systems, joint wind–solar modeling has emerged as a crucial method for enhancing the precision of grid scheduling and energy system optimization.
This paper offers an in-depth overview and synthesis of current approaches to joint wind–solar scenario generation. We analyzed the principles and applications of explicit models (such as Markov processes, copula models, Monte Carlo simulations, and Latin hypercubes) and implicit models (including GANs, VAEs, and diffusion models) in wind–solar joint scenario generation. Although current methods have shown promising results in addressing the uncertainty of individual energy sources (such as wind or solar), they still face challenges in joint wind–solar modeling. These approaches encounter difficulties, particularly in modeling the intricate spatiotemporal relationships between wind energy production and solar energy generation, while also striving to enhance the model adaptability.
Section 4 surveyed the current state of wind–solar joint modeling and summarized the mainstream modeling methods in current research, pointing out their limitations in handling the fluctuations in wind and solar energy production. While some models have attempted to integrate wind and solar power data, significant research gaps remain in areas such as spatiotemporal correlation modeling, multiscale uncertainty analysis, and model adaptability improvement. Current methods for joint wind–solar scenario generation have not fully utilized the synergistic potential of the production of wind and solar energy. This limits their effectiveness in grid management and optimizing energy systems.
Looking ahead, research on wind–solar joint scenario generation will deepen further. First, enhancing the diffusion process to boost the computational efficiency of denoising networks is crucial for addressing the extensive data demands of wind–solar scenario generation. Second, integrating domain-specific conditional diffusion models and developing joint optimization strategies with the GAT will enhance the model’s ability to dynamically capture spatiotemporal dependencies and region-specific characteristics. Third, multi-timescale diffusion strategies capable of generating short-term, medium-term, and long-term scenarios in an integrated manner will address practical needs for flexible grid operation and energy system optimization. These advancements will support more comprehensive and accurate wind–solar scenario modeling. As the combination of diffusion models and the GAT becomes more mature, it is expected to become a critical tool for joint wind–solar modeling, enabling more precise scenario generation and data-driven decision-making in renewable energy systems.
Wind–solar joint scenario generation technology will offer valuable tools for power system planning, operational optimization, and market scheduling. It will facilitate the effective use of renewable energy and accelerate the shift towards a greener energy future. As technology and data accumulation continue to progress, this field will play an increasingly important role in achieving the global energy transition and sustainable development.
Author Contributions
Conceptualization, C.Z. (Chunyu Zhang); methodology, C.Z. (Chen Zhang); investigation, F.C.; resources, Z.S.; writing—original draft preparation, K.Z.; writing—review and editing, Z.S.; visualization, Y.S.; supervision, D.Y. and X.F.; project administration, Z.S.; funding acquisition, K.Z., Z.S. and Y.S. All authors have read and agreed to the published version of the manuscript.
Funding
This work was supported by the National Key Research and Development Program of China (Grant No. 2022YFE0129400) and the science and technology projects of Guangxi Grid Company Limited (Grant No. WT0400550000000987).
Conflicts of Interest
The authors declare no conflicts of interest.
Abbreviations
| Abbreviations | Symbols |
| ANN | Artificial neural networks |
| AR | Autoregression |
| ARIMA | Autoregression Integrated Moving Average |
| ARMA | Autoregressive Moving Average models |
| CGAN | Conditional GAN |
| CNNs | Convolutional Neural Networks |
| DC-VAE | Deep convolutional VAE |
| DiT | Diffusion Transformer |
| DRO | Distributionally robust optimization |
| GAN(s) | Generative Adversarial Network(s) |
| GAT | Graph Attention Network |
| KL-divergence | Kullback–Leibler divergence |
| LARIMA | Limited Autoregression Integrated Moving Average |
| LMD | Local measured data |
| LSTM | Long short-term memory networks |
| MA | Moving average |
| NMP | Numeric weather prediction |
| PV | Photovoltaic |
| PPF | Probabilistic power flow |
| PgGAN | Progressive Growth GAN |
| RO | Robust optimization |
| SeqGAN | Sequence GAN |
| SNGAN | Spectral Normalization GAN |
| SO | Stochastic optimization |
| VAE(s) | Variational Autoencoder(s) |
| VI | Variational inference |
| WGAN | Wasserstein Generative Adversarial Network |
References
- Li, C.; Umair, M. Does green finance development goals affects renewable energy in China. Renew. Energy 2023, 203, 898–905. [Google Scholar] [CrossRef]
- Adebayo, T.S.; Ullah, S.; Kartal, M.T.; Ali, K.; Pata, U.K.; Ağa, M. Endorsing sustainable development in BRICS: The role of technological innovation, renewable energy consumption, and natural resources in limiting carbon emission. Sci. Total Environ. 2023, 859, 160181. [Google Scholar] [CrossRef] [PubMed]
- Gielen, D.; Boshell, F.; Saygin, D.; Bazilian, M.D.; Wagner, N.; Gorini, R. The role of renewable energy in the global energy transformation. Energy Strategy Rev. 2019, 24, 38–50. [Google Scholar] [CrossRef]
- Wang, S.; Geng, G.; Jiang, Q.; Bo, R. Generation expansion planning considering discrete storage model and renewable energy uncertainty: A bi-interval optimization approach. IEEE Trans. Ind. Inform. 2022, 19, 2973–2983. [Google Scholar] [CrossRef]
- Quan, H.; Khosravi, A.; Yang, D.; Srinivasan, D. A survey of computational intelligence techniques for wind power uncertainty quantification in smart grids. IEEE Trans. Neural Netw. Learn. Syst. 2019, 31, 4582–4599. [Google Scholar] [CrossRef]
- Wen, Y.; AlHakeem, D.; Mandal, P.; Chakraborty, S.; Wu, Y.K.; Senjyu, T.; Paudyal, S.; Tseng, T.L. Performance evaluation of probabilistic methods based on bootstrap and quantile regression to quantify PV power point forecast uncertainty. IEEE Trans. Neural Netw. Learn. Syst. 2019, 31, 1134–1144. [Google Scholar] [CrossRef]
- Li, B.; Tan, Y.; Wu, A.G.; Duan, G.R. A distributionally robust optimization based method for stochastic model predictive control. IEEE Trans. Autom. Control. 2021, 67, 5762–5776. [Google Scholar] [CrossRef]
- Ceseña, E.A.M.; Mancarella, P. Energy systems integration in smart districts: Robust optimisation of multi-energy flows in integrated electricity, heat and gas networks. IEEE Trans. Smart Grid 2018, 10, 1122–1131. [Google Scholar] [CrossRef]
- Li, J.; Zhang, J. Maximum likelihood identification of dual-rate Hammerstein output-error moving average system. IET Contr. Theory Appl. 2020, 14, 1089–1101. [Google Scholar] [CrossRef]
- Xu, X.; Lin, Z.; Li, X.; Shang, C.; Shen, Q. Multi-objective robust optimisation model for MDVRPLS in refined oil distribution. Int. J. Prod. Res. 2022, 60, 6772–6792. [Google Scholar] [CrossRef]
- Li, J.; Zhou, J.; Chen, B. Review of wind power scenario generation methods for optimal operation of renewable energy systems. Appl. Energy 2020, 280, 115992. [Google Scholar] [CrossRef]
- Papaefthymiou, G.; Klockl, B. MCMC for wind power simulation. IEEE Trans. Energy Convers. 2008, 23, 234–240. [Google Scholar] [CrossRef]
- Haghi, H.V.; Lotfifard, S. Spatiotemporal modeling of wind generation for optimal energy storage sizing. IEEE Trans. Sustain. Energy 2014, 6, 113–121. [Google Scholar] [CrossRef]
- Hart, E.K.; Jacobson, M.Z. A Monte Carlo approach to generator portfolio planning and carbon emissions assessments of systems with large penetrations of variable renewables. Renew. Energy 2011, 36, 2278–2286. [Google Scholar] [CrossRef]
- Loh, W.L. On Latin hypercube sampling. Ann. Stat. 1996, 24, 2058–2080. [Google Scholar] [CrossRef]
- Matevosyan, J.; Soder, L. Minimization of imbalance cost trading wind power on the short-term power market. IEEE Trans. Power Syst. 2006, 21, 1396–1404. [Google Scholar] [CrossRef]
- Goodfellow, I.; Pouget-Abadie, J.; Mirza, M.; Xu, B.; Warde-Farley, D.; Ozair, S.; Courville, A.; Bengio, Y. Generative adversarial networks. Commun. ACM 2020, 63, 139–144. [Google Scholar] [CrossRef]
- Doersch, C. Tutorial on variational autoencoders. arXiv 2016, arXiv:1606.05908. [Google Scholar]
- Özdenizci, O.; Legenstein, R. Restoring vision in adverse weather conditions with patch-based denoising diffusion models. IEEE Trans. Pattern Anal. Mach. Intell. 2023, 45, 10346–10357. [Google Scholar] [CrossRef]
- Chai, S.; Xu, Z.; Jia, Y.; Wong, W.K. A robust spatiotemporal forecasting framework for photovoltaic generation. IEEE Trans. Smart Grid 2020, 11, 5370–5382. [Google Scholar] [CrossRef]
- Li, Z.; Ye, L.; Song, X.; Luo, Y.; Pei, M.; Wang, K.; Yu, Y.; Tang, Y. Heterogeneous Spatiotemporal Graph Convolution Network for Multi-Modal Wind-PV Power Collaborative Prediction. IEEE Trans. Power Syst. 2023, 39, 5591–5608. [Google Scholar] [CrossRef]
- Sannigrahi, S.; Ghatak, S.R.; Acharjee, P. Multi-scenario based bi-level coordinated planning of active distribution system under uncertain environment. IEEE Trans. Ind. Appl. 2019, 56, 850–863. [Google Scholar] [CrossRef]
- Kayal, P.; Chanda, C.K. Optimal mix of solar and wind distributed generations considering performance improvement of electrical distribution network. Renew. Energy 2015, 75, 173–186. [Google Scholar] [CrossRef]
- Mullen, R.; Marshall, L.; McGlynn, B. A beta regression model for improved solar radiation predictions. J. Appl. Meteorol. Climatol. 2013, 52, 1923–1938. [Google Scholar] [CrossRef]
- Bludszuweit, H.; Domínguez-Navarro, J.A.; Llombart, A. Statistical analysis of wind power forecast error. IEEE Trans. Power Syst. 2008, 23, 983–991. [Google Scholar] [CrossRef]
- Gryning, S.E.; Floors, R.; Peña, A.; Batchvarova, E.; Brümmer, B. Weibull wind-speed distribution parameters derived from a combination of wind-lidar and tall-mast measurements over land, coastal and marine sites. Bound.-Layer Meteor. 2016, 159, 329–348. [Google Scholar] [CrossRef]
- Mohammadi, K.; Alavi, O.; Mostafaeipour, A.; Goudarzi, N.; Jalilvand, M. Assessing different parameters estimation methods of Weibull distribution to compute wind power density. Energy Conv. Manag. 2016, 108, 322–335. [Google Scholar] [CrossRef]
- Fu, X.; Zhang, C.; Wu, X. Statistical machine learning model for uncertainty analysis of photovoltaic power. Front. Energy Res. 2022, 10, 956543. [Google Scholar] [CrossRef]
- Rayati, M.; Bozorg, M.; Carpita, M.; Cherkaoui, R. Stochastic optimization and Markov chain-based scenario generation for exploiting the underlying flexibilities of an active distribution network. Sustain. Energy Grids Netw. 2023, 34, 100999. [Google Scholar] [CrossRef]
- Sanjari, M.J.; Gooi, H.B. Probabilistic forecast of PV power generation based on higher order Markov chain. IEEE Trans. Power Syst. 2016, 32, 2942–2952. [Google Scholar] [CrossRef]
- Munkhammar, J.; van der Meer, D.; Widén, J. Very short term load forecasting of residential electricity consumption using the Markov-chain mixture distribution (MCM) model. Appl. Energy 2021, 282, 116180. [Google Scholar] [CrossRef]
- Fu, X. Statistical machine learning model for capacitor planning considering uncertainties in photovoltaic power. Prot. Control Mod. Power Syst. 2022, 7, 1–13. [Google Scholar] [CrossRef]
- He, M.; Yang, L.; Zhang, J.; Vittal, V. A spatio-temporal analysis approach for short-term forecast of wind farm generation. IEEE Trans. Power Syst. 2014, 29, 1611–1622. [Google Scholar] [CrossRef]
- Papaefthymiou, G.; Kurowicka, D. Using copulas for modeling stochastic dependence in power system uncertainty analysis. IEEE Trans. Power Syst. 2008, 24, 40–49. [Google Scholar] [CrossRef]
- Camal, S.; Teng, F.; Michiorri, A.; Kariniotakis, G.; Badesa, L. Scenario generation of aggregated wind, photovoltaics and small hydro production for power systems applications. Appl. Energy 2019, 242, 1396–1406. [Google Scholar] [CrossRef]
- Wang, Z.; Wang, W.; Liu, C.; Wang, B. Forecasted scenarios of regional wind farms based on regular vine copulas. J. Mod. Power Syst. Clean Energy 2019, 8, 77–85. [Google Scholar] [CrossRef]
- Becker, R. Generation of time-coupled wind power infeed scenarios using pair-copula construction. IEEE Trans. Sustain. Energy 2017, 9, 1298–1306. [Google Scholar] [CrossRef]
- Chen, J.; Mao, C.; Liu, Z.; Ma, C.; Sha, G.; Duan, Q.; Fan, H.; Qiu, S.; Wang, D. Stochastic planning of integrated energy system based on correlation scenario generation method via Copula function considering multiple uncertainties in renewable energy sources and demands. IET Renew. Power Gener. 2023, 17, 2978–2996. [Google Scholar] [CrossRef]
- Yang, M.; Liu, W.; Yin, X.; Cui, Z.; Zhang, W. A two-stage scenario generation method for wind-solar joint power output considering temporal and spatial correlations. In Proceedings of the 2021 6th Asia Conference on Power and Electrical Engineering (ACPEE), Chongqing, China, 8–11 April 2021; pp. 415–423. [Google Scholar]
- Sun, M.; Cremer, J.; Strbac, G. A novel data-driven scenario generation framework for transmission expansion planning with high renewable energy penetration. Appl. Energy 2018, 228, 546–555. [Google Scholar] [CrossRef]
- Qiu, Y.; Li, Q.; Pan, Y.; Yang, H.; Chen, W. A scenario generation method based on the mixture vine copula and its application in the power system with wind/hydrogen production. Int. J. Hydrogen Energy 2019, 44, 5162–5170. [Google Scholar] [CrossRef]
- Alahyari, A.; Ehsan, M.; Mousavizadeh, M. A hybrid storage-wind virtual power plant (VPP) participation in the electricity markets: A self-scheduling optimization considering price, renewable generation, and electric vehicles uncertainties. J. Energy Storage 2019, 25, 100812. [Google Scholar] [CrossRef]
- Swamy, C.; Shmoys, D.B. Sampling-based approximation algorithms for multistage stochastic optimization. SIAM J. Comput. 2012, 41, 975–1004. [Google Scholar] [CrossRef]
- Shi, Q.; Li, F.; Kuruganti, T.; Olama, M.M.; Dong, J.; Wang, X.; Winstead, C. Resilience-oriented DG siting and sizing considering stochastic scenario reduction. IEEE Trans. Power Syst. 2020, 36, 3715–3727. [Google Scholar] [CrossRef]
- Sun, Y.; Zhong, J.; Li, Z.; Tian, W.; Shahidehpour, M. Stochastic scheduling of battery-based energy storage transportation system with the penetration of wind power. IEEE Trans. Sustain. Energy 2016, 8, 135–144. [Google Scholar] [CrossRef]
- Li, J.; Li, J.; Wen, J.; Cheng, S.; Xie, H.; Yue, C. Generating wind power time series based on its persistence and variation characteristics. Sci. China-Technol. Sci. 2014, 57, 2475–2486. [Google Scholar] [CrossRef]
- Tang, C.; Wang, Y.; Xu, J.; Sun, Y.; Zhang, B. Efficient scenario generation of multiple renewable power plants considering spatial and temporal correlations. Appl. Energy 2018, 221, 348–357. [Google Scholar] [CrossRef]
- Shu, Z.; Jirutitijaroen, P. Latin hypercube sampling techniques for power systems reliability analysis with renewable energy sources. IEEE Trans. Power Syst. 2011, 26, 2066–2073. [Google Scholar]
- Yu, H.; Chung, C.Y.; Wong, K.P.; Lee, H.W.; Zhang, J.H. Probabilistic load flow evaluation with hybrid latin hypercube sampling and cholesky decomposition. IEEE Trans. Power Syst. 2009, 24, 661–667. [Google Scholar] [CrossRef]
- Diaz, G.; Abd-el-Motaleb, A.M.; Mier, V. On the capacity factor of distributed wind generation in droop-regulated microgrids. IEEE Trans. Power Syst. 2012, 28, 1738–1746. [Google Scholar] [CrossRef]
- Cai, D.; Shi, D.; Chen, J. Probabilistic load flow computation with polynomial normal transformation and Latin hypercube sampling. IET Gener. Transm. Distrib. 2013, 7, 474–482. [Google Scholar] [CrossRef]
- Chen, Y.; Wen, J.; Cheng, S. Probabilistic load flow method based on Nataf transformation and Latin hypercube sampling. IEEE Trans. Sustain. Energy 2012, 4, 294–301. [Google Scholar] [CrossRef]
- Gao, Z.X.; Mao, A.J.; Chen, D.Z.; Song, Y.T. A Wind Farm Capacity Credibility Calculation Method Based on Parabola. Appl. Mech. Mater. 2014, 472, 953–957. [Google Scholar] [CrossRef]
- Wangdee, W.; Billinton, R. Probing the intermittent energy resource contributions from generation adequacy and security perspectives. IEEE Trans. Power Syst. 2012, 27, 2306–2313. [Google Scholar] [CrossRef]
- Jeon, J.; Taylor, J.W. Short-term density forecasting of wave energy using ARMA-GARCH models and kernel density estimation. Int. J. Forecast. 2016, 32, 991–1004. [Google Scholar] [CrossRef]
- Morales, J.M.; Minguez, R.; Conejo, A.J. A methodology to generate statistically dependent wind speed scenarios. Appl. Energy 2010, 87, 843–855. [Google Scholar] [CrossRef]
- Díaz, G.; Gómez-Aleixandre, J.; Coto, J. Wind power scenario generation through state-space specifications for uncertainty analysis of wind power plants. Appl. Energy 2016, 162, 21–30. [Google Scholar] [CrossRef]
- Sharma, K.C.; Jain, P.; Bhakar, R. Wind power scenario generation and reduction in stochastic programming framework. Electr. Power Compon. Syst. 2013, 41, 271–285. [Google Scholar] [CrossRef]
- Chen, P.; Pedersen, T.; Bak-Jensen, B.; Chen, Z. ARIMA-based time series model of stochastic wind power generation. IEEE Trans. Power Syst. 2009, 25, 667–676. [Google Scholar] [CrossRef]
- Vagropoulos, S.I.; Kardakos, E.G.; Simoglou, C.K.; Bakirtzis, A.G.; Catalao, J.P. ANN-based scenario generation methodology for stochastic variables of electric power systems. Electr. Power Syst. Res. 2016, 134, 9–18. [Google Scholar] [CrossRef]
- Cui, M.; Ke, D.; Sun, Y.; Gan, D.; Zhang, J.; Hodge, B.M. Wind power ramp event forecasting using a stochastic scenario generation method. IEEE Trans. Sustain. Energy 2015, 6, 422–433. [Google Scholar] [CrossRef]
- Yang, J.; Zhang, S.; Xiang, Y.; Liu, J.; Liu, J.; Han, X.; Teng, F. LSTM auto-encoder based representative scenario generation method for hybrid hydro-PV power system. IET Gener. Transm. Distrib. 2020, 14, 5935–5943. [Google Scholar] [CrossRef]
- Ning, C.; You, F. Deep learning based distributionally robust joint chance constrained economic dispatch under wind power uncertainty. IEEE Trans. Power Syst. 2021, 37, 191–203. [Google Scholar] [CrossRef]
- Li, Y.; Li, J.; Wang, Y. Privacy-preserving spatiotemporal scenario generation of renewable energies: A federated deep generative learning approach. IEEE Trans. Ind. Inform. 2021, 18, 2310–2320. [Google Scholar] [CrossRef]
- Yang, X.; He, H.; Li, J.; Zhang, Y. Toward optimal risk-averse configuration for HESS with CGANs-based PV scenario generation. IEEE Trans. Syst. Man Cybern.-Syst. 2019, 51, 1779–1793. [Google Scholar] [CrossRef]
- Liu, W.; Wang, Y.; Shi, Q.; Yao, Q.; Wan, H. A multi-stage restoration strategy to enhance distribution system resilience with improved conditional generative adversarial nets. CSEE J. Power Energy Syst. 2022, 1–12. [Google Scholar] [CrossRef]
- Huang, X.; Li, Q.; Tai, Y.; Chen, Z.; Liu, J.; Shi, J.; Liu, W. Time series forecasting for hourly photovoltaic power using conditional generative adversarial network and Bi-LSTM. Energy 2022, 246, 123403. [Google Scholar] [CrossRef]
- Zhang, Y.; Ai, Q.; Xiao, F.; Hao, R.; Lu, T. Typical wind power scenario generation for multiple wind farms using conditional improved Wasserstein generative adversarial network. Int. J. Electr. Power Energy Syst. 2020, 114, 105388. [Google Scholar] [CrossRef]
- Jiang, C.; Mao, Y.; Chai, Y.; Yu, M.; Tao, S. Scenario generation for wind power using improved generative adversarial networks. IEEE Access 2018, 6, 62193–62203. [Google Scholar] [CrossRef]
- Zhang, X.; Li, D.; Fu, X. A novel wasserstein generative adversarial network for stochastic wind power output scenario generation. IET Renew. Power Gener. 2024, 18, 3731–3742. [Google Scholar] [CrossRef]
- Li, J.; Liao, W.; Yang, R.; Chen, Z. A data augmentation method for distributed photovoltaic electricity theft using wasserstein generative adversarial network. In Proceedings of the 2021 IEEE 5th Conference on Energy Internet and Energy System Integration (EI2), Taiyuan, China, 22–24 October 2021; pp. 3132–3137. [Google Scholar]
- Schreiber, J.; Jessulat, M.; Sick, B. Generative adversarial networks for operational scenario planning of renewable energy farms: A study on wind and photovoltaic. In Proceedings of the Artificial Neural Networks and Machine Learning–ICANN 2019: Image Processing: 28th International Conference on Artificial Neural Networks, Munich, Germany, 17–19 September 2019; pp. 550–564. [Google Scholar]
- Qiao, J.; Pu, T.; Wang, X. Renewable scenario generation using controllable generative adversarial networks with transparent latent space. CSEE J. Power Energy Syst. 2020, 7, 66–77. [Google Scholar]
- Zhang, W.; Luo, Y.; Zhang, Y.; Srinivasan, D. SolarGAN: Multivariate solar data imputation using generative adversarial network. IEEE Trans. Sustain. Energy 2020, 12, 743–746. [Google Scholar] [CrossRef]
- Chen, Y.; Li, P.; Zhang, B. Bayesian renewables scenario generation via deep generative networks. In Proceedings of the 2018 52nd Annual Conference on Information Sciences and Systems (CISS), Princeton, NJ, USA, 21–23 March 2018; pp. 1–6. [Google Scholar]
- Zhang, X.; Fan, S.; Li, D. Spectral normalization generative adversarial networks for photovoltaic power scenario generation. IET Renew. Power Gener. 2024. [CrossRef]
- Yuan, R.; Wang, B.; Sun, Y.; Song, X.; Watada, J. Conditional style-based generative adversarial networks for renewable scenario generation. IEEE Trans. Power Syst. 2022, 38, 1281–1296. [Google Scholar] [CrossRef]
- Liang, J.; Tang, W. Sequence generative adversarial networks for wind power scenario generation. IEEE J. Sel. Areas Commun. 2019, 38, 110–118. [Google Scholar] [CrossRef]
- Yuan, R.; Wang, B.; Mao, Z.; Watada, J. Multi-objective wind power scenario forecasting based on PG-GAN. Energy 2021, 226, 120379. [Google Scholar] [CrossRef]
- Fu, X.; Zhang, C.; Xu, Y.; Zhang, Y.; Sun, H. Statistical machine learning for power flow analysis considering the influence of weather factors on photovoltaic power generation. IEEE Trans. Neural Netw. Learn. Syst. 2024, 1–15. [Google Scholar] [CrossRef]
- Fu, X.; Zhang, C.; Zhang, X.; Sun, H. A Novel GAN Architecture Reconstructed Using Bi-LSTM and Style Transfer for PV Temporal Dynamics Simulation. IEEE Trans. Sustain. Energy 2024, 15, 2826–2829. [Google Scholar] [CrossRef]
- Pan, Z.; Wang, J.; Liao, W.; Chen, H.; Yuan, D.; Zhu, W.; Fang, X.; Zhu, Z. Data-driven EV load profiles generation using a variational auto-encoder. Energies 2019, 12, 849. [Google Scholar] [CrossRef]
- Wang, X.; Li, Y.; Dong, X. Multi source-load scenario generation method of active distribution network based on variational autoencoder. Power Syst. Technol. 2021, 45, 2962–2969. [Google Scholar]
- Xiao, S.; Liu, Z.; He, X.; Zhang, J.; Liu, H. Wind Power Output Scenario Generation Based on Importance Weighted Autoencoder. In Proceedings of the 2023 26th International Conference on Electrical Machines and Systems (ICEMS), Zhuhai, China, 5–8 November 2023; pp. 791–796. [Google Scholar]
- Razghandi, M.; Zhou, H.; Erol-Kantarci, M.; Turgut, D. Variational autoencoder generative adversarial network for synthetic data generation in smart home. In Proceedings of the ICC 2022-IEEE International Conference on Communications, Seoul, Republic of Korea, 16–20 May 2022; pp. 4781–4786. [Google Scholar]
- de Jesús, D.A.R.; Mandal, P.; Senjyu, T.; Kamalasadan, S. Unsupervised hybrid deep generative models for photovoltaic synthetic data generation. In Proceedings of the 2021 IEEE Power & Energy Society General Meeting (PESGM), Washington, DC, USA, 25–29 June 2021; pp. 1–5. [Google Scholar]
- Xu, C.; Dai, Y.; Xu, P.; Gao, T.; Zhang, J. Wind Power Scenario Generation Based on Denoising Diffusion Probabilistic Model. In Proceedings of the 2023 IEEE International Conference on Systems, Man, and Cybernetics (SMC), Honolulu, HI, USA, 1 October 2023; pp. 4525–4529. [Google Scholar]
- Ho, J.; Jain, A.; Abbeel, P. Denoising Diffusion Probabilistic Models. In Proceedings of the Advances in Neural Information Processing Systems; Curran Associates, Inc.: New York, NY, USA, 2020; Volume 33, pp. 6840–6851. [Google Scholar]
- Dhariwal, P.; Nichol, A. Diffusion Models Beat GANs on Image Synthesis. Adv. Neural Inf. Process. Syst. 2021, 34, 8780–8794. [Google Scholar]
- Rombach, R.; Blattmann, A.; Lorenz, D.; Esser, P.; Ommer, B. High-resolution image synthesis with latent diffusion models. In Proceedings of the IEEE/CVF Conference on Computer Vision and Pattern Recognition, New Orleans, LA, USA, 18–24 June 2022; pp. 10684–10695. [Google Scholar]
- Hanna, D. The Use of Artificial Intelligence Art Generator “Midjourney” in Artistic and Advertising Creativity. J. Des. Sci. Appl. Arts 2023, 4, 42–58. [Google Scholar] [CrossRef]
- Liu, Y.; Zhang, K.; Li, Y.; Yan, Z.; Gao, C.; Chen, R.; Yuan, Z.; Huang, Y.; Sun, H.; Gao, J.; et al. Sora: A Review on Background, Technology, Limitations, and Opportunities of Large Vision Models. arXiv 2024, arXiv:2402.17177. [Google Scholar]
- Dong, X.; Mao, Z.; Sun, Y.; Xu, X. Short-Term Wind Power Scenario Generation Based on Conditional Latent Diffusion Models. IEEE Trans. Sustain. Energy 2024, 15, 1074–1085. [Google Scholar] [CrossRef]
- Yan, J.; Li, P.; Huang, Y. A Short-Term Wind Power Scenario Generation Method Based on Conditional Diffusion Model. In Proceedings of the 2023 IEEE Sustainable Power and Energy Conference (iSPEC), Chongqing, China, 28–30 November 2023; pp. 1–6. [Google Scholar]
- Li, S.; Xu, C.; Wei, L.; Li, R.; Ai, X. Scenario Generation of Renewable Energy Based on Improved Diffusion Model. In Proceedings of the 2023 IEEE Sustainable Power and Energy Conference (iSPEC), Chongqing, China, 28–30 November 2023; pp. 1–7. [Google Scholar]
- Peebles, W.; Xie, S. Scalable Diffusion Models with Transformers. In Proceedings of the 2023 IEEE/CVF International Conference on Computer Vision (ICCV), Paris, France, 2–3 October 2023; pp. 4172–4182. [Google Scholar]
- Zhou, B.; Cai, Y.; Zang, T.; Wu, J.; Li, X.; Dong, S. Reliability Optimization Method for Gas–Electric Integrated Energy Systems Considering Cyber–Physical Interactions. Energies 2023, 16, 5187. [Google Scholar] [CrossRef]
- Li, F.; Chen, S.; Ju, C.; Zhang, X.; Ma, G.; Huang, W. Research on short-term joint optimization scheduling strategy for hydro-wind-solar hybrid systems considering uncertainty in renewable energy generation. Energy Strateg. Rev. 2023, 50, 101242. [Google Scholar] [CrossRef]
- Couto, A.; Estanqueiro, A. Assessment of wind and solar PV local complementarity for the hybridization of the wind power plants installed in Portugal. J. Clean. Prod. 2021, 319, 128728. [Google Scholar] [CrossRef]
- Xu, L.; Ruan, X.; Mao, C.; Zhang, B.; Luo, Y. An improved optimal sizing method for wind-solar-battery hybrid power system. IEEE Trans. Sustain. Energy 2013, 4, 774–785. [Google Scholar]
- Yin, Y.; Liu, T.; He, C. Day-ahead stochastic coordinated scheduling for thermal-hydro-wind-photovoltaic systems. Energy 2019, 187, 115944. [Google Scholar] [CrossRef]
- Yang, S.; Tan, Z.; Gou, S.; Li, P.; Ju, L.; Tong, X. Optimization model of WPO-PVO-ESO cooperative participation in day-ahead electricity market transactions considering uncertainty and CVaR theory. Int. J. Electr. Power Energy Syst. 2021, 129, 106718. [Google Scholar] [CrossRef]
- Yi, D.; Yu, M.; Wang, Q.; Tian, H.; Wang, L.; Yan, Y.; Li, C. Method for Wind–Solar–Load Extreme Scenario Generation Based on an Improved InfoGAN. Appl. Sci. 2024, 14, 9163. [Google Scholar] [CrossRef]
- Peng, H.Y.; Zhang, J.P.; Guo, M.H.; Cao, Y.P.; Hu, S.M. Charactergen: Efficient 3d character generation from single images with multi-view pose canonicalization. ACM Trans. Graph 2024, 43, 1–13. [Google Scholar] [CrossRef]
- Crăciunescu, A.; Popescu, C.; Popescu, M.; Florea, L.M. Stand-alone hybrid wind-photovoltaic power generation systems optimal sizing. In Proceedings of the 11th International Conference of Numerical Analysis and Applied Mathematics (ICNAAM), Rhodes, Greece, 21–27 September 2013; pp. 1253–1256. [Google Scholar]
- Park, S.J.; Kang, B.B.; Yoon, J.P.; Cha, I.S.; Lim, J.Y. A study on the stand-alone operating or photovoltaic/wind power hybrid generation system. In Proceedings of the 2004 IEEE 35th Annual Power Electronics Specialists Conference (IEEE Cat. No. 04CH37551), Aachen, Germany, 20–25 June 2004; Volume 3, pp. 2095–2099. [Google Scholar]
- Tan, Q.; Wen, X.; Sun, Y.; Lei, X.; Wang, Z.; Qin, G. Evaluation of the risk and benefit of the complementary operation of the large wind-photovoltaic-hydropower system considering forecast uncertainty. Appl. Energy 2021, 285, 116442. [Google Scholar] [CrossRef]
- Li, J.; Zhou, Z.; Wen, M.; Huang, H.; Wen, B.; Zhang, X.; Liang, H. Multi-objective optimization method for medium and long-term power supply and demand balance considering the spatiotemporal correlation of source and load. Energy Strategy Rev. 2024, 54, 101463. [Google Scholar] [CrossRef]
- van Staden, C.Y.; Vermeulen, H.J. Geospatial optimisation of wind and solar energy generation: A framework for optimised resource allocation. Sustain. Energy Grids Netw. 2024, 39, 101389. [Google Scholar] [CrossRef]
- Gao, Y.; Hu, Z.; Chen, W.A.; Liu, M. Solutions to the insufficiency of label data in renewable energy forecasting: A comparative and integrative analysis of domain adaptation and fine-tuning. Energy 2024, 302, 131863. [Google Scholar] [CrossRef]
- Al-Hajj, R.; Assi, A.; Neji, B.; Ghandour, R.; Al Barakeh, Z. Transfer learning for renewable energy systems: A survey. Sustainability 2023, 15, 9131. [Google Scholar] [CrossRef]
- Ma, X.; Liu, Y.; Yan, J.; Wang, H. A WGAN-GP-Based Scenarios Generation Method for Wind and Solar Power Complementary Study. Energies 2023, 16, 3114. [Google Scholar] [CrossRef]
- Ma, X.; Deveci, M.; Yan, J.; Liu, Y. Optimal capacity configuration of wind-photovoltaic-storage hybrid system: A study based on multi-objective optimization and sparrow search algorithm. J. Energy Storage 2024, 85, 110983. [Google Scholar] [CrossRef]
- Wei, H.; Hongxuan, Z.; Yu, D.; Yiting, W.; Ling, D.; Ming, X. Short-term optimal operation of hydro-wind-solar hybrid system with improved generative adversarial networks. Appl. Energy 2019, 250, 389–403. [Google Scholar] [CrossRef]
- Yu, S.; Li, J.; Chen, Z.; Ren, L.; Hua, Z. Multi-scale Attention Fusion Graph Network for Remote Sensing Building Change Detection. IEEE Trans. Geosci. Remote Sens. 2024, 62, 4402618. [Google Scholar]
- Liu, L.; Chen, B.; Chen, H.; Zou, Z.; Shi, Z. Diverse hyperspectral remote sensing image synthesis with diffusion models. IEEE Trans. Geosci. Remote Sens. 2023, 61, 5532616. [Google Scholar] [CrossRef]
- Fan, J.; Weng, W.; Tian, H.; Wu, H.; Zhu, F.; Wu, J. RGDAN: A random graph diffusion attention network for traffic prediction. Neural Netw. 2024, 172, 106093. [Google Scholar] [CrossRef] [PubMed]
- Croitoru, F.A.; Hondru, V.; Ionescu, R.T.; Shah, M. Diffusion models in vision: A survey. IEEE Trans. Pattern Anal. Mach. Intell. 2023, 45, 10850–10869. [Google Scholar] [CrossRef] [PubMed]
- Liu, R.; Xiao, Y.; Peng, Y.; Tian, X. DDFSRM: Denoising Diffusion Fusion Model for Line-Scanning Super-Resolution. IEEE Trans. Comput. Imaging 2024, 10, 1357–1367. [Google Scholar] [CrossRef]
- Yang, C.; Wang, H.; Tang, J.; Shi, C.; Sun, M.; Cui, G.; Liu, Z. Full-scale information diffusion prediction with reinforced recurrent networks. IEEE Trans. Neural Netw. Learn. Syst. 2021, 34, 2271–2283. [Google Scholar] [CrossRef] [PubMed]
- Cao, H.; Tan, C.; Gao, Z.; Xu, Y.; Chen, G.; Heng, P.A.; Li, S.Z. A survey on generative diffusion models. IEEE Trans. Knowl. Data Eng. 2024, 36, 2814–2830. [Google Scholar] [CrossRef]
- Gong, Y.; He, T.; Chen, M.; Wang, B.; Nie, L.; Yin, Y. Spatio-Temporal Enhanced Contrastive and Contextual Learning for Weather Forecasting. IEEE Trans. Knowl. Data Eng. 2024, 36, 4260–4274. [Google Scholar] [CrossRef]
- Zhang, R.J.; Razzaq, A. Influence of economic policy uncertainty and financial development on renewable energy consumption in the BRICST region. Renew. Energy 2022, 201, 526–533. [Google Scholar] [CrossRef]
- Chishti, M.Z.; Dogan, E. Analyzing the determinants of renewable energy: The moderating role of technology and macroeconomic uncertainty. Energy Environ. 2024, 35, 874–903. [Google Scholar] [CrossRef]
- Adedoyin, F.F.; Ozturk, I.; Agboola, M.O.; Agboola, P.O.; Bekun, F.V. The implications of renewable and non-renewable energy generating in Sub-Saharan Africa: The role of economic policy uncertainties. Energy Policy 2021, 150, 112115. [Google Scholar] [CrossRef]
- Borozan, D. Asymmetric effects of policy uncertainty on renewable energy consumption in G7 countries. Renew. Energy 2022, 189, 412–420. [Google Scholar] [CrossRef]

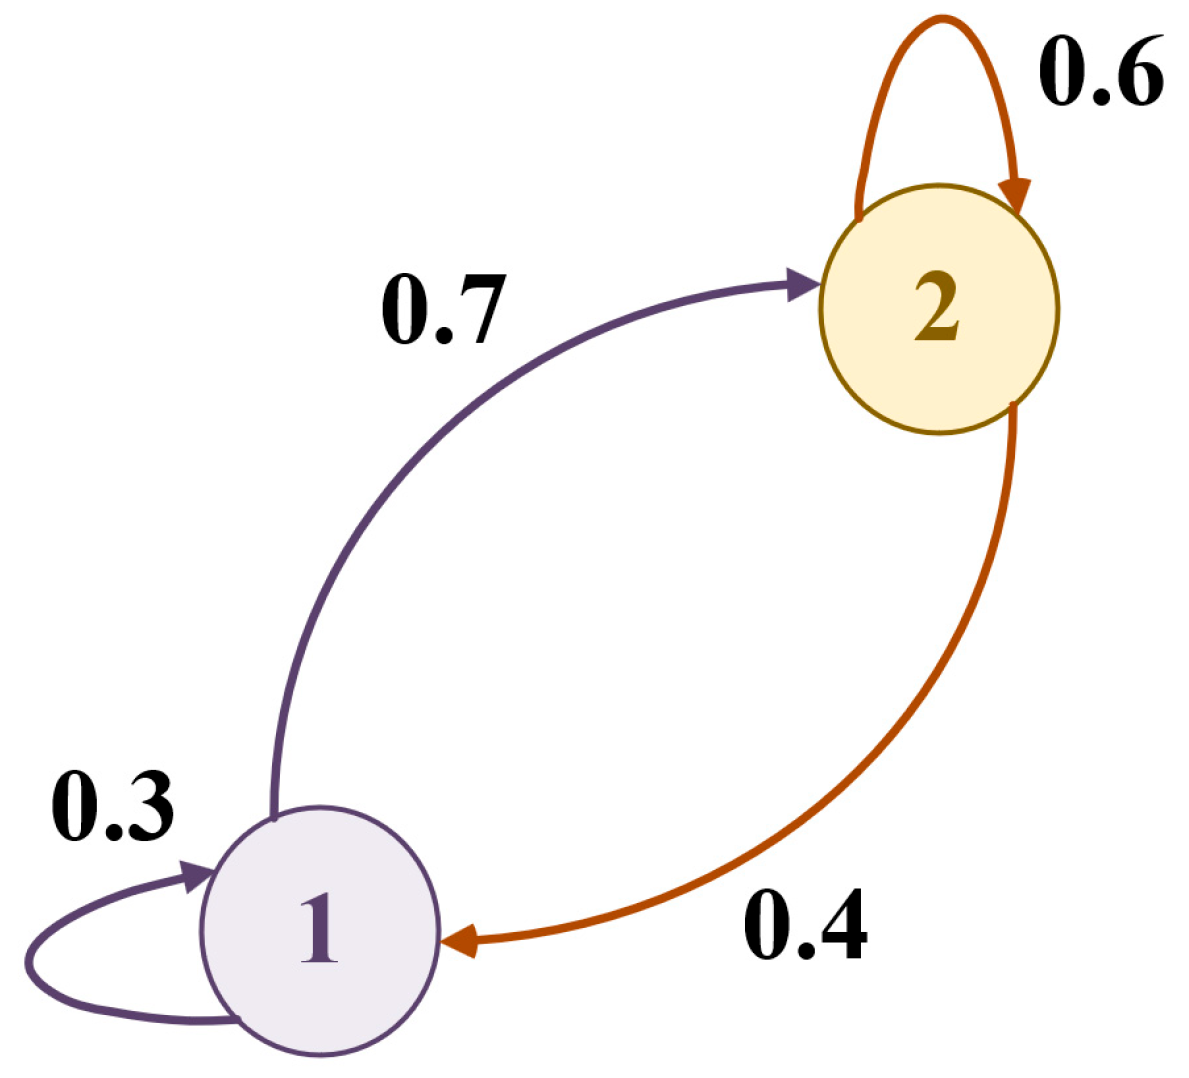
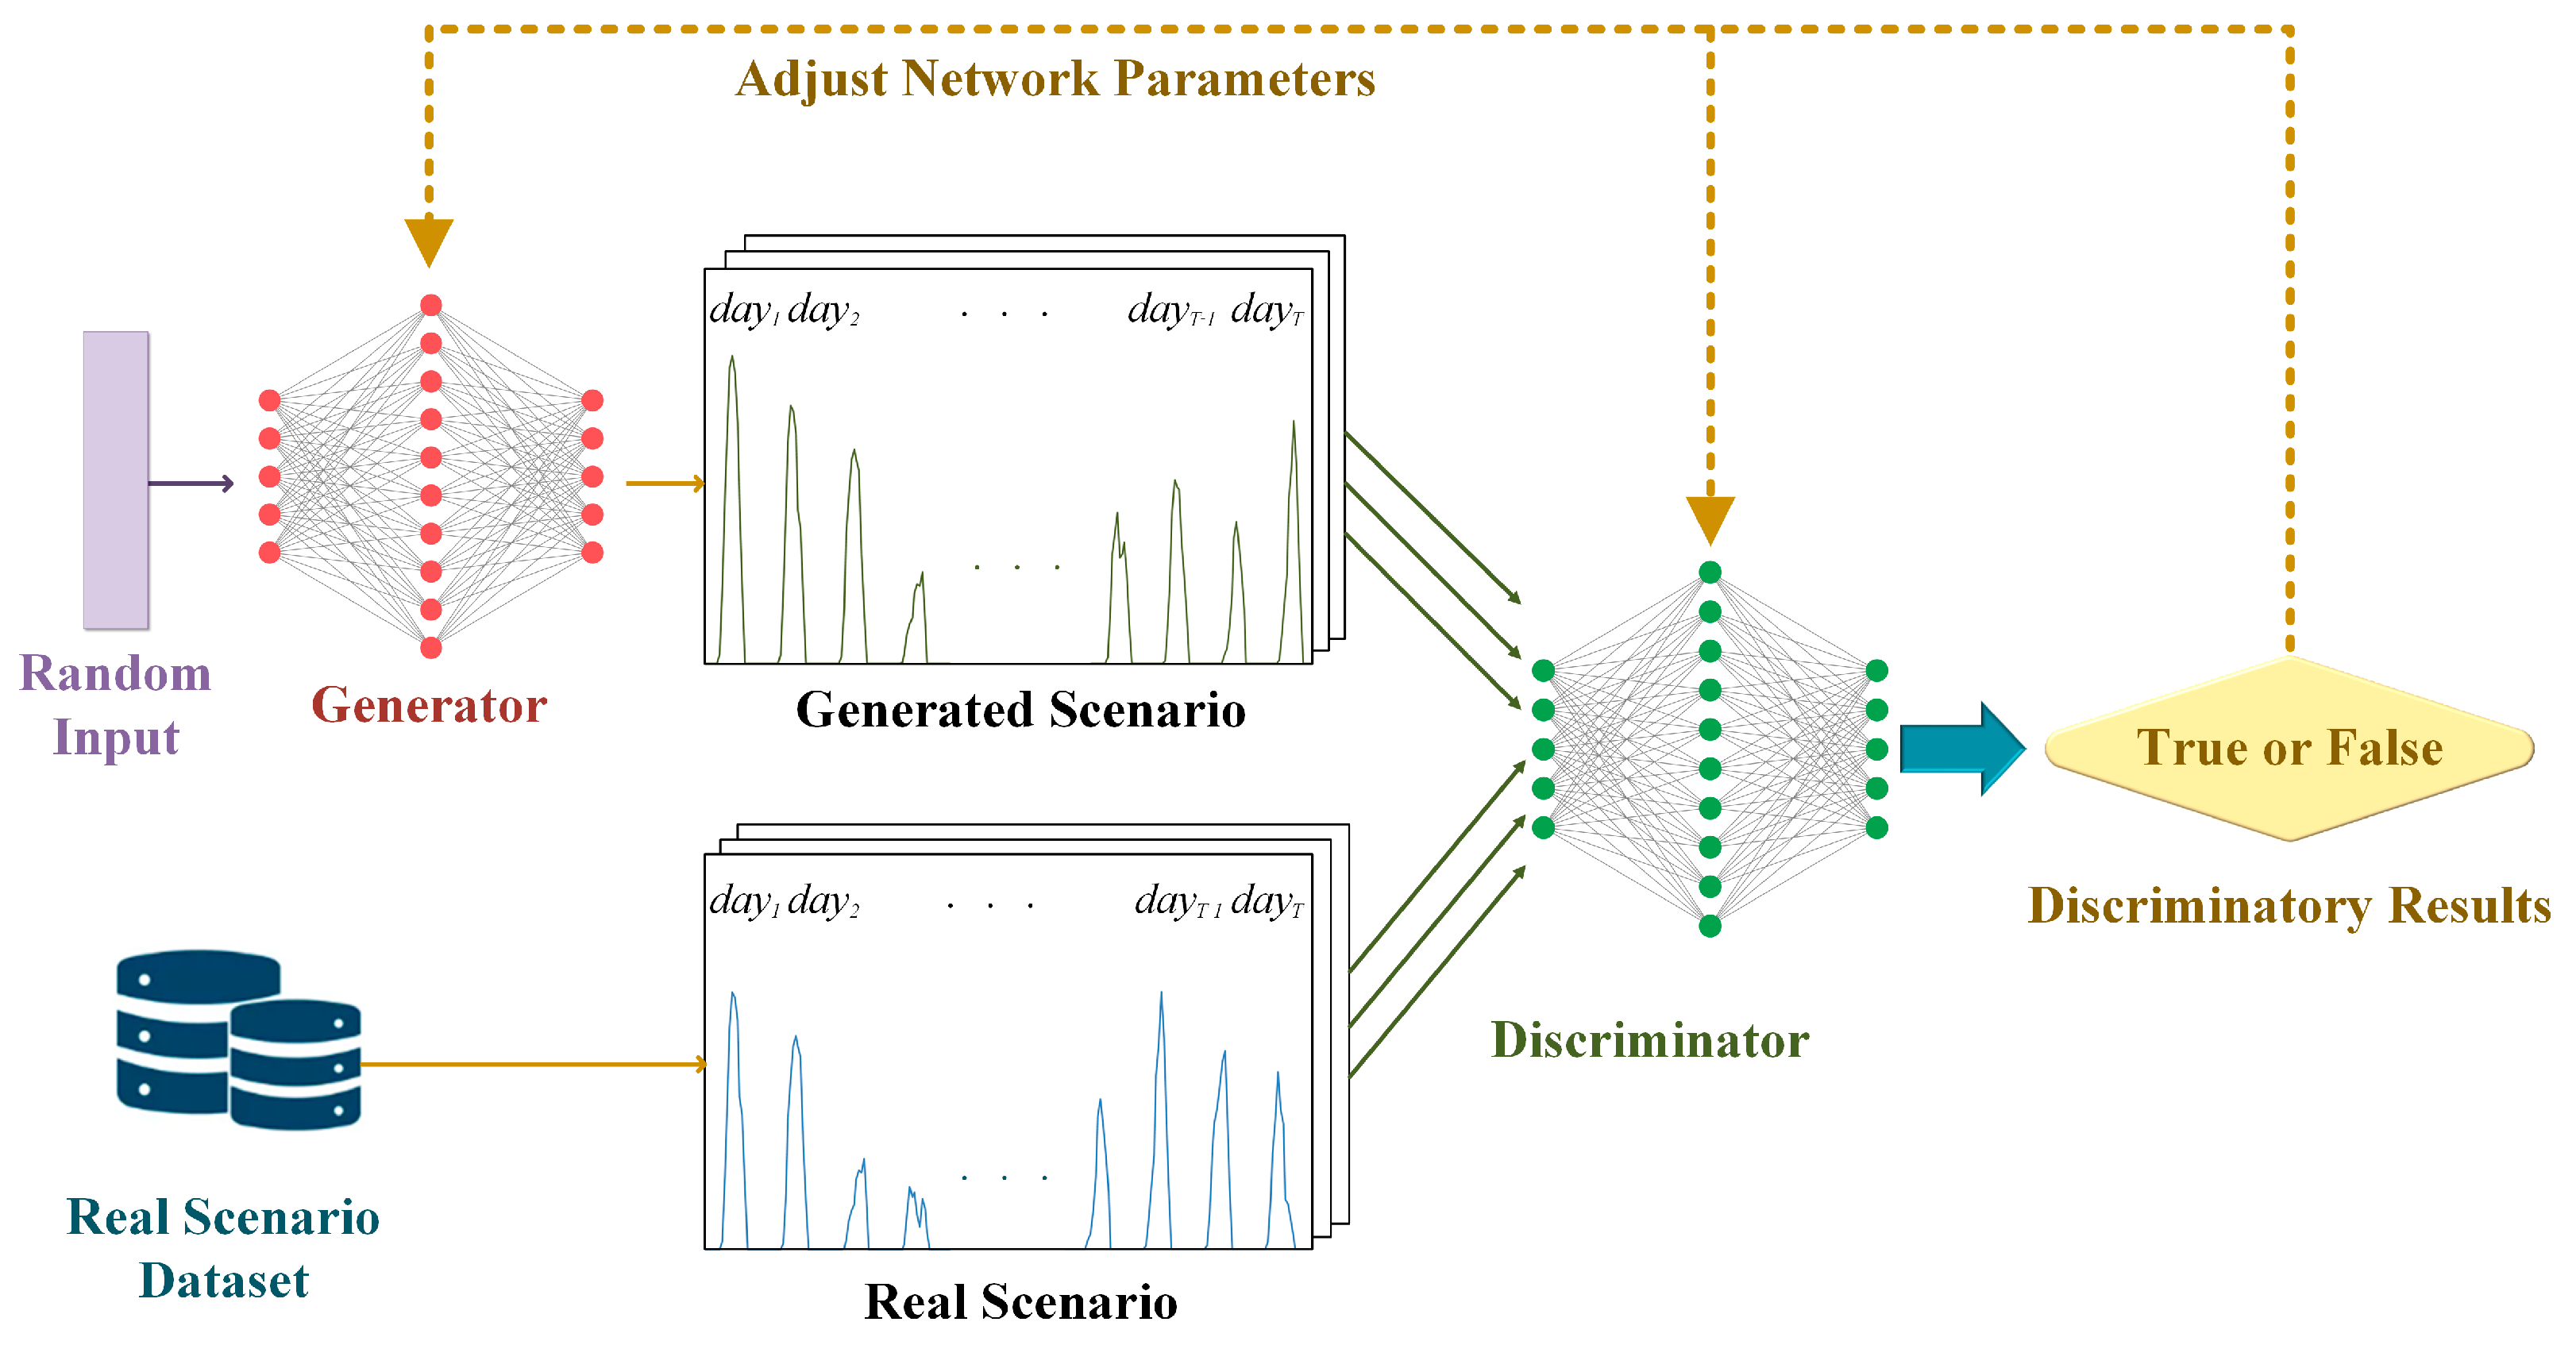
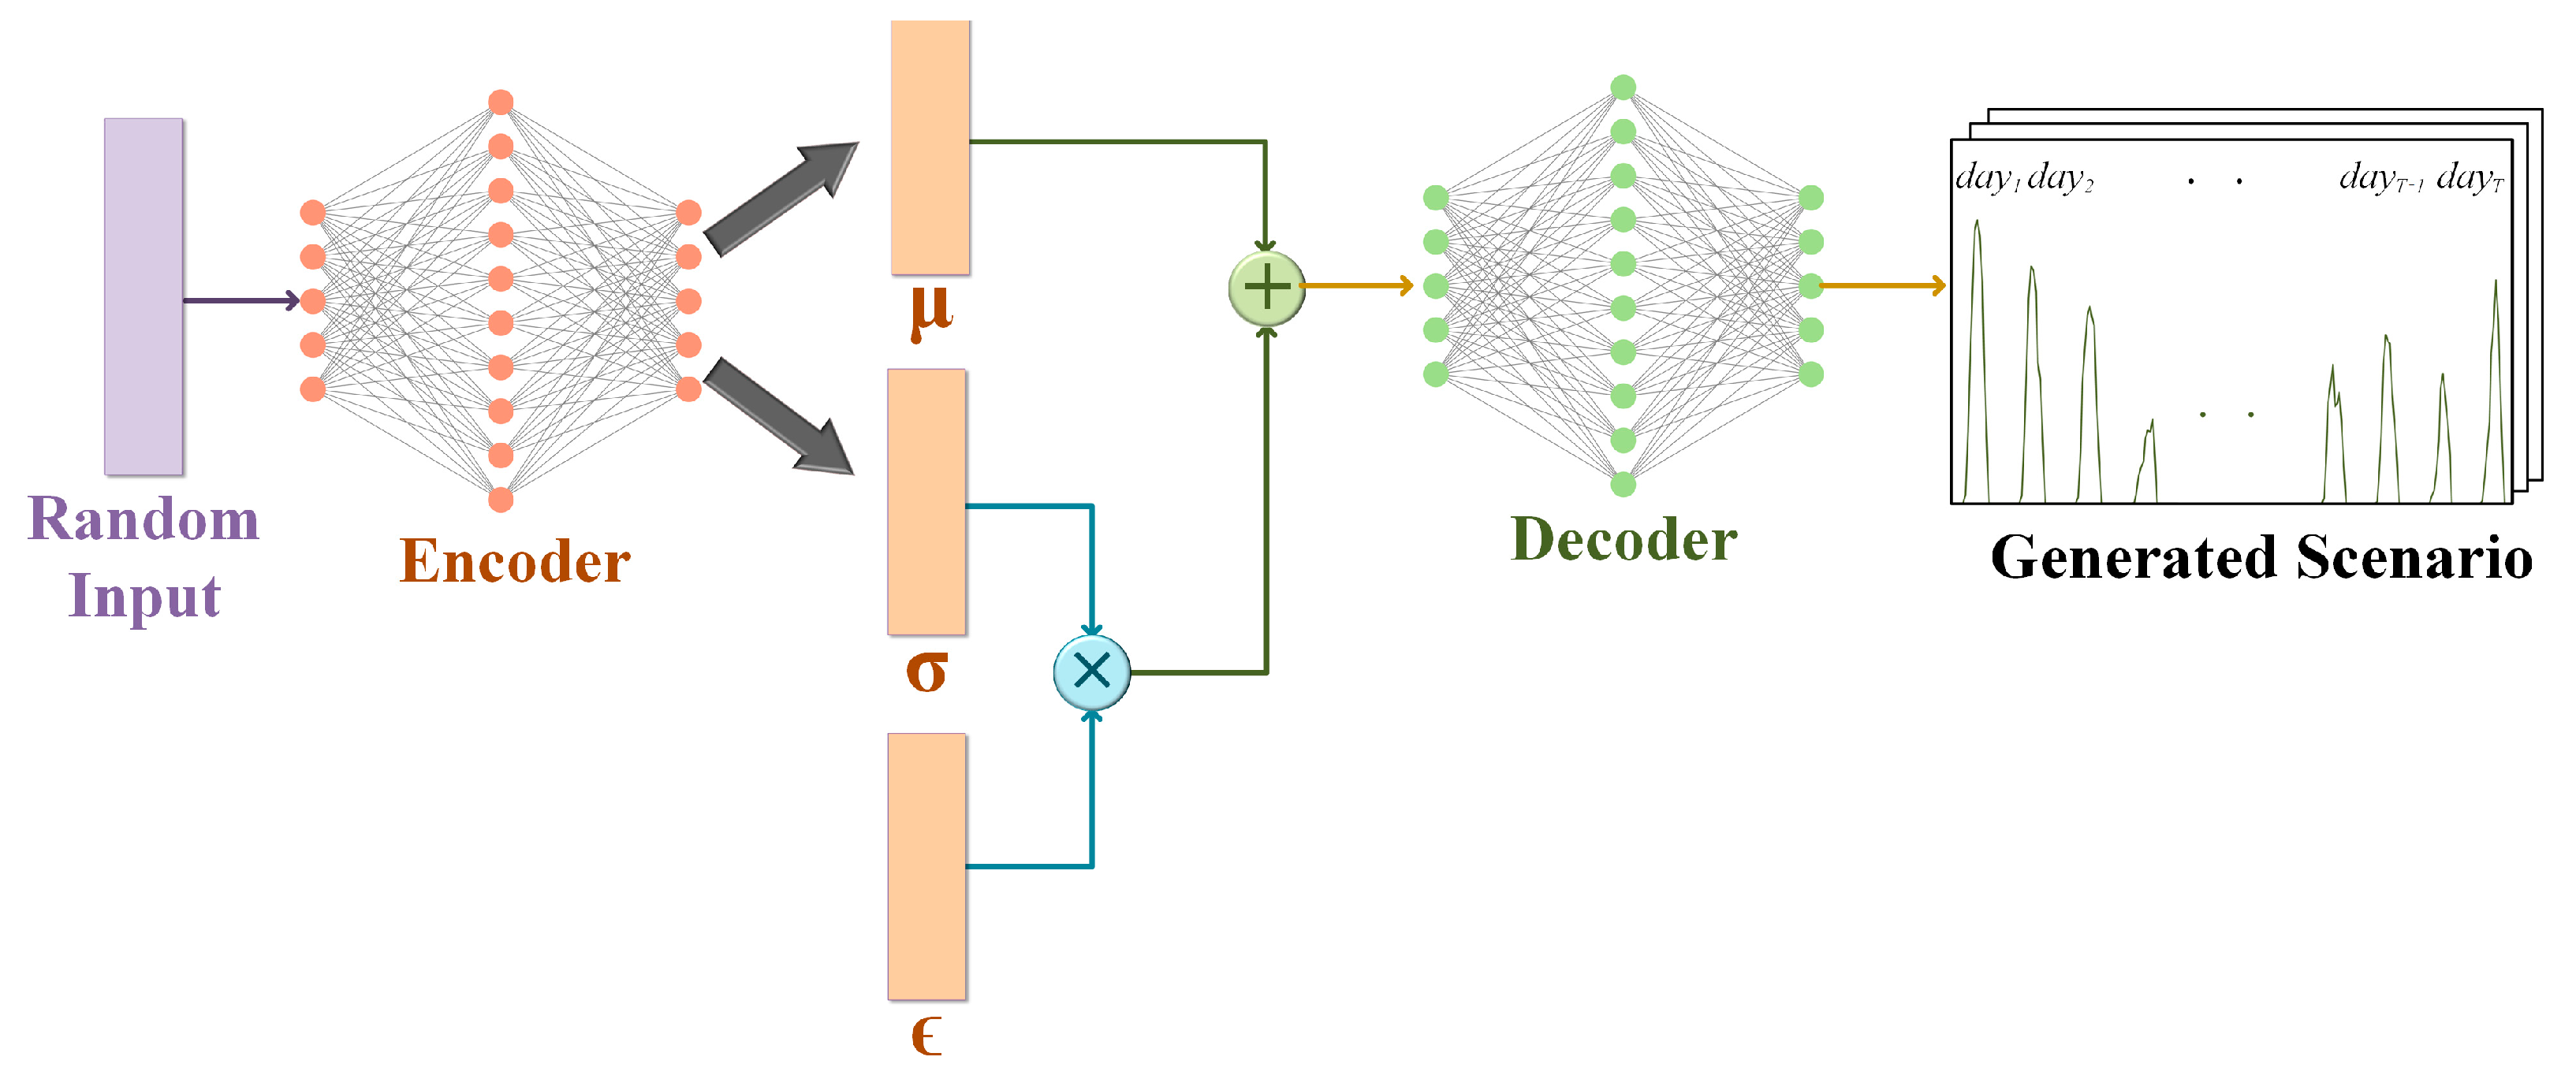
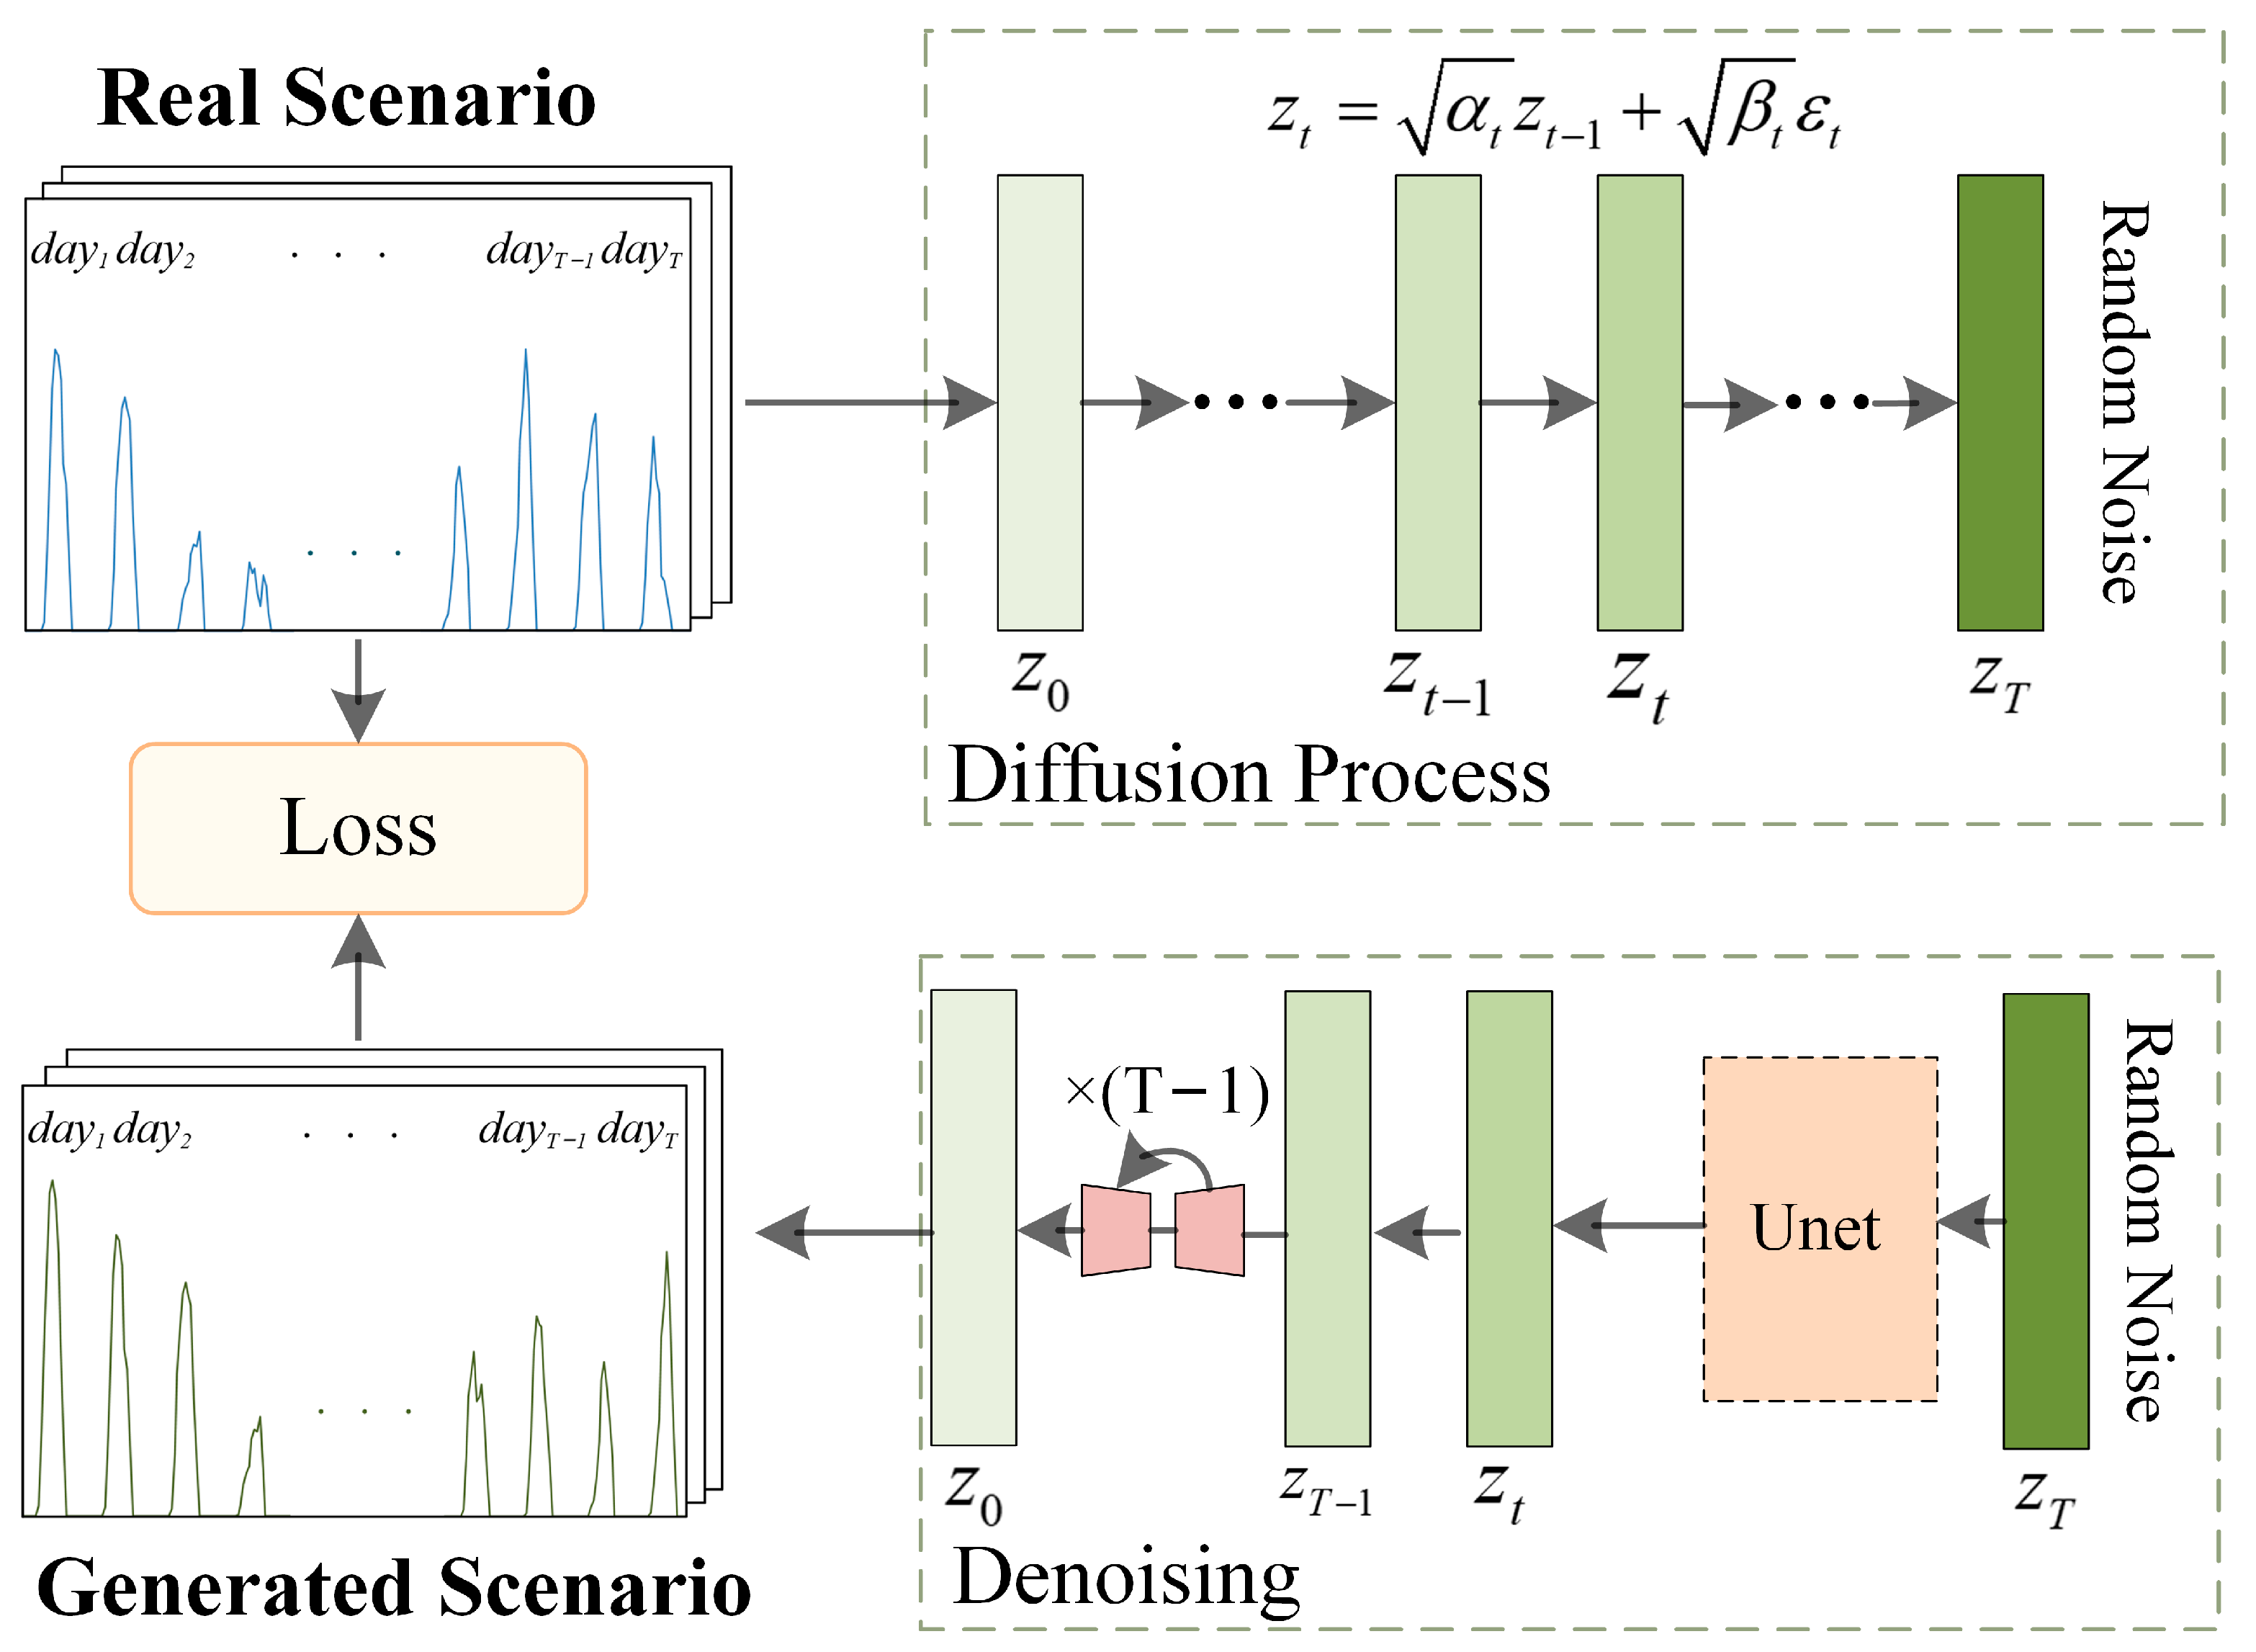
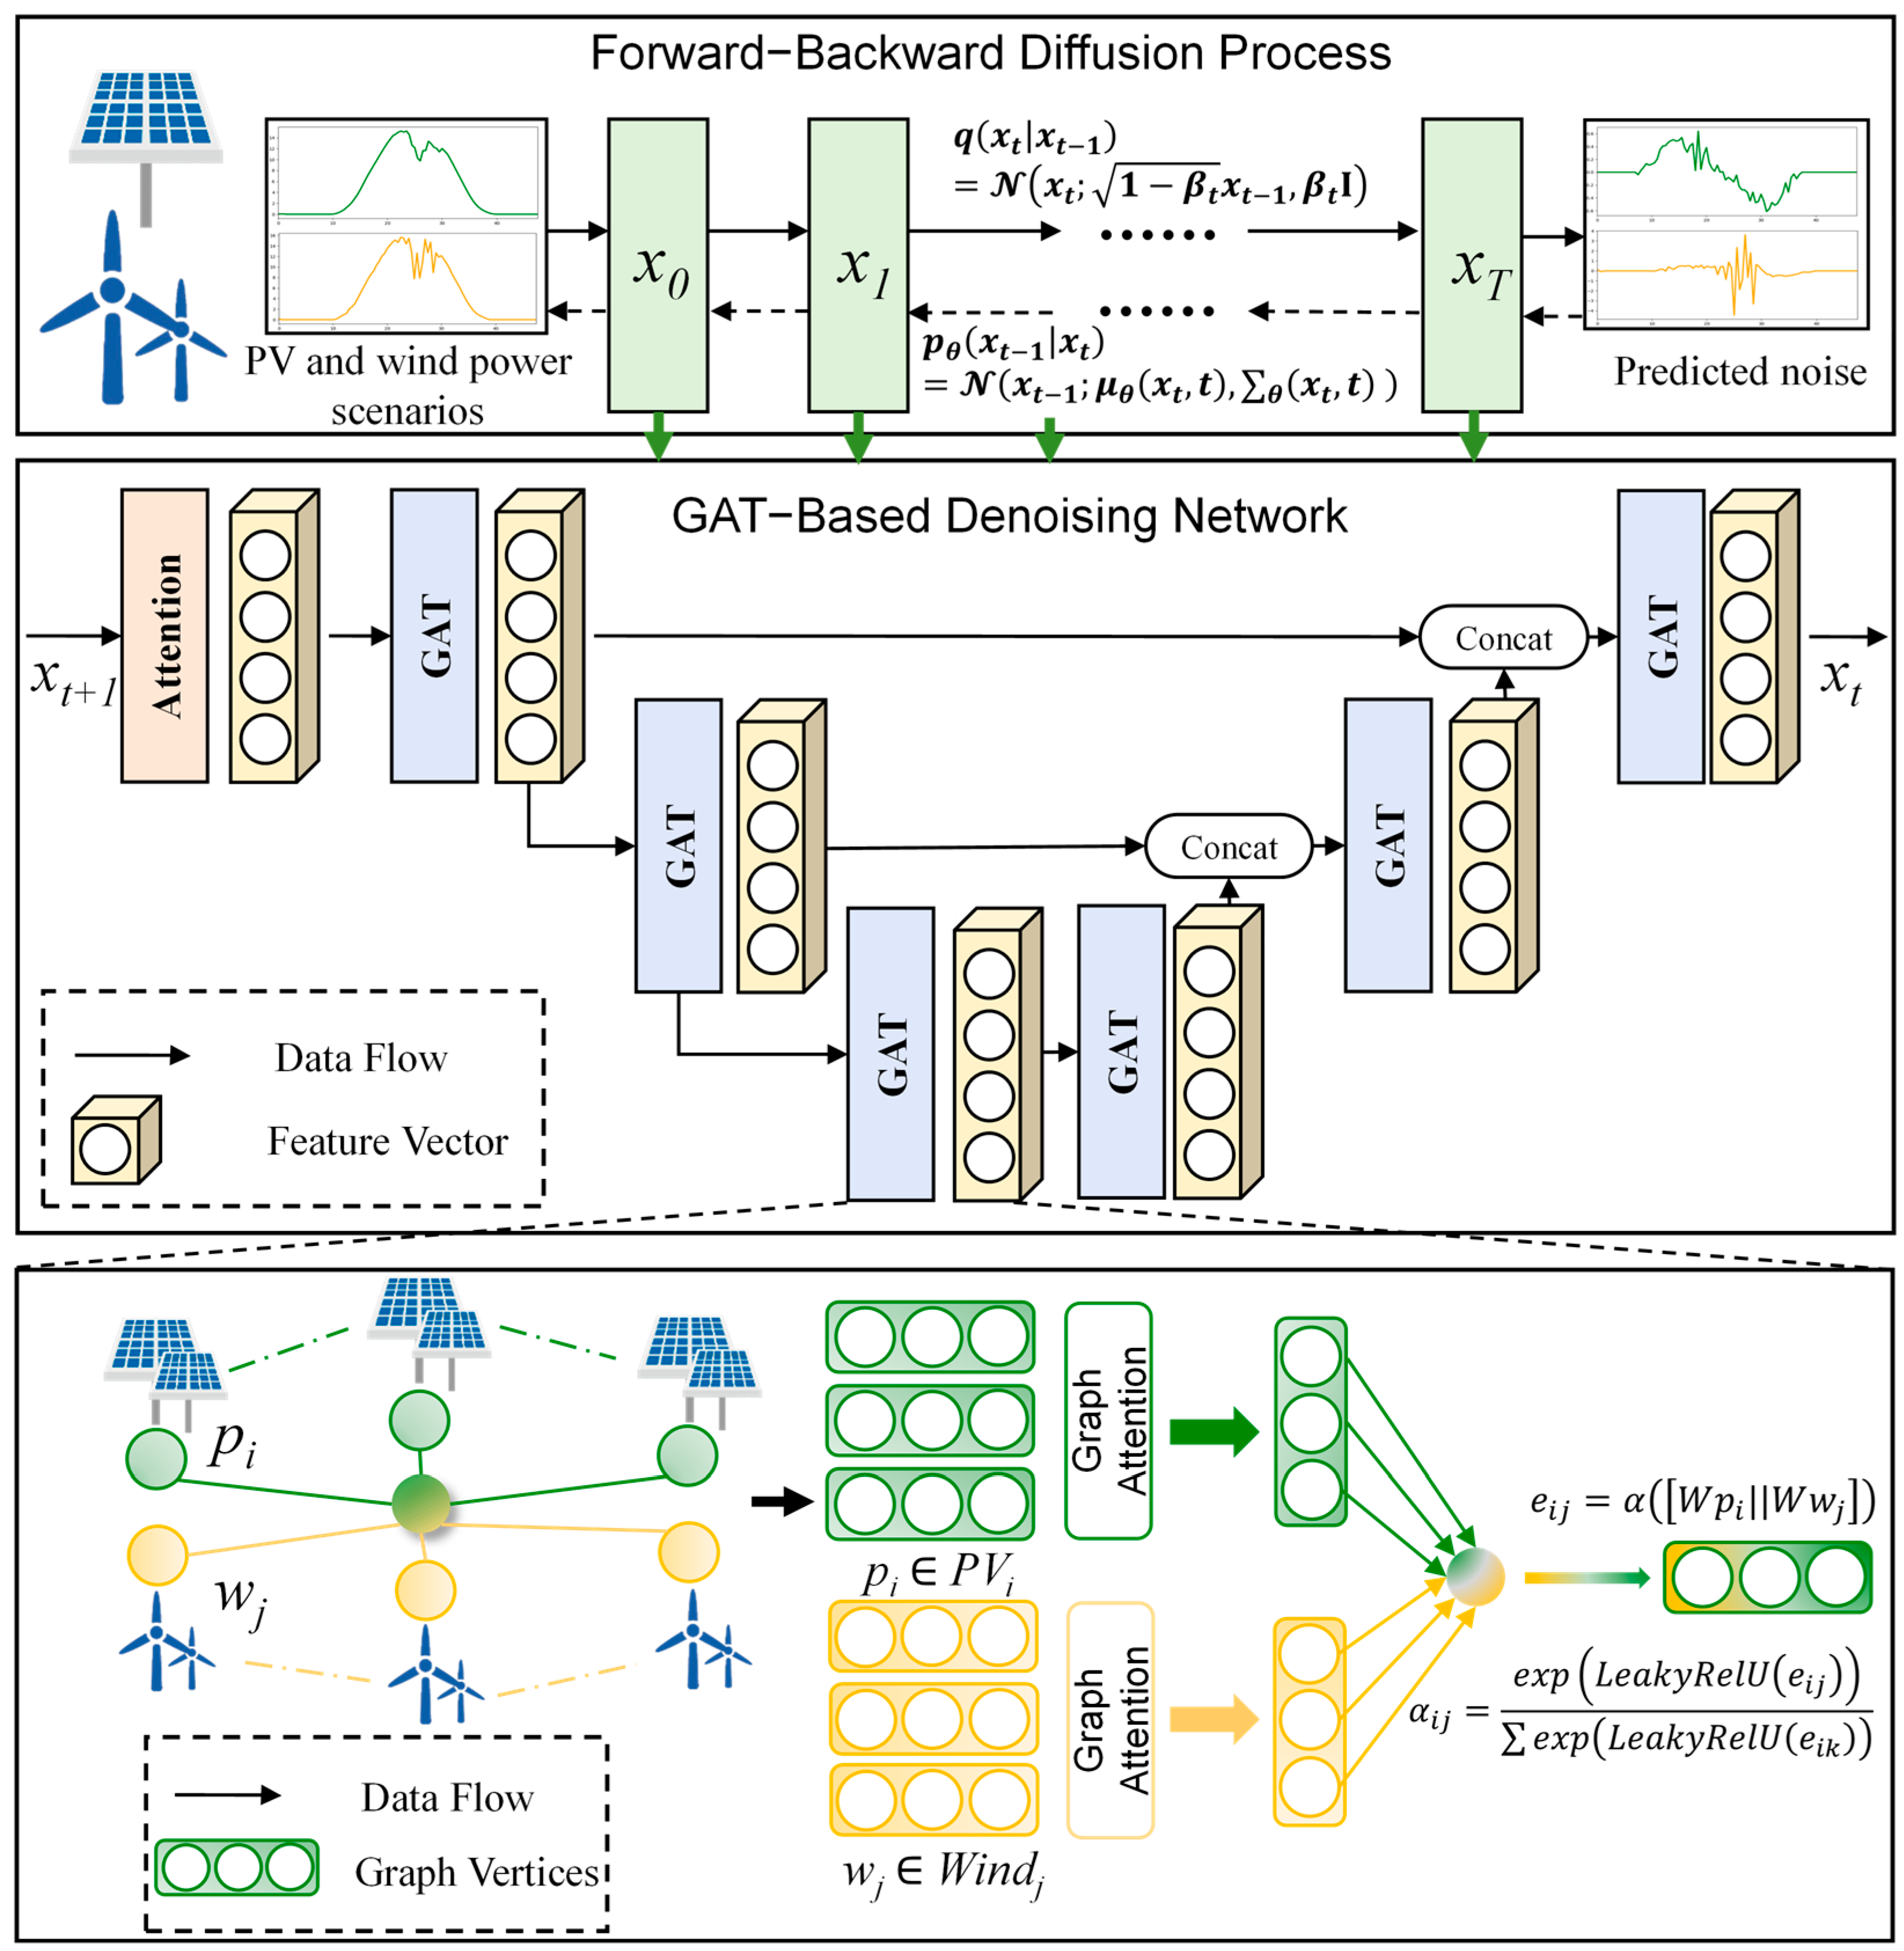
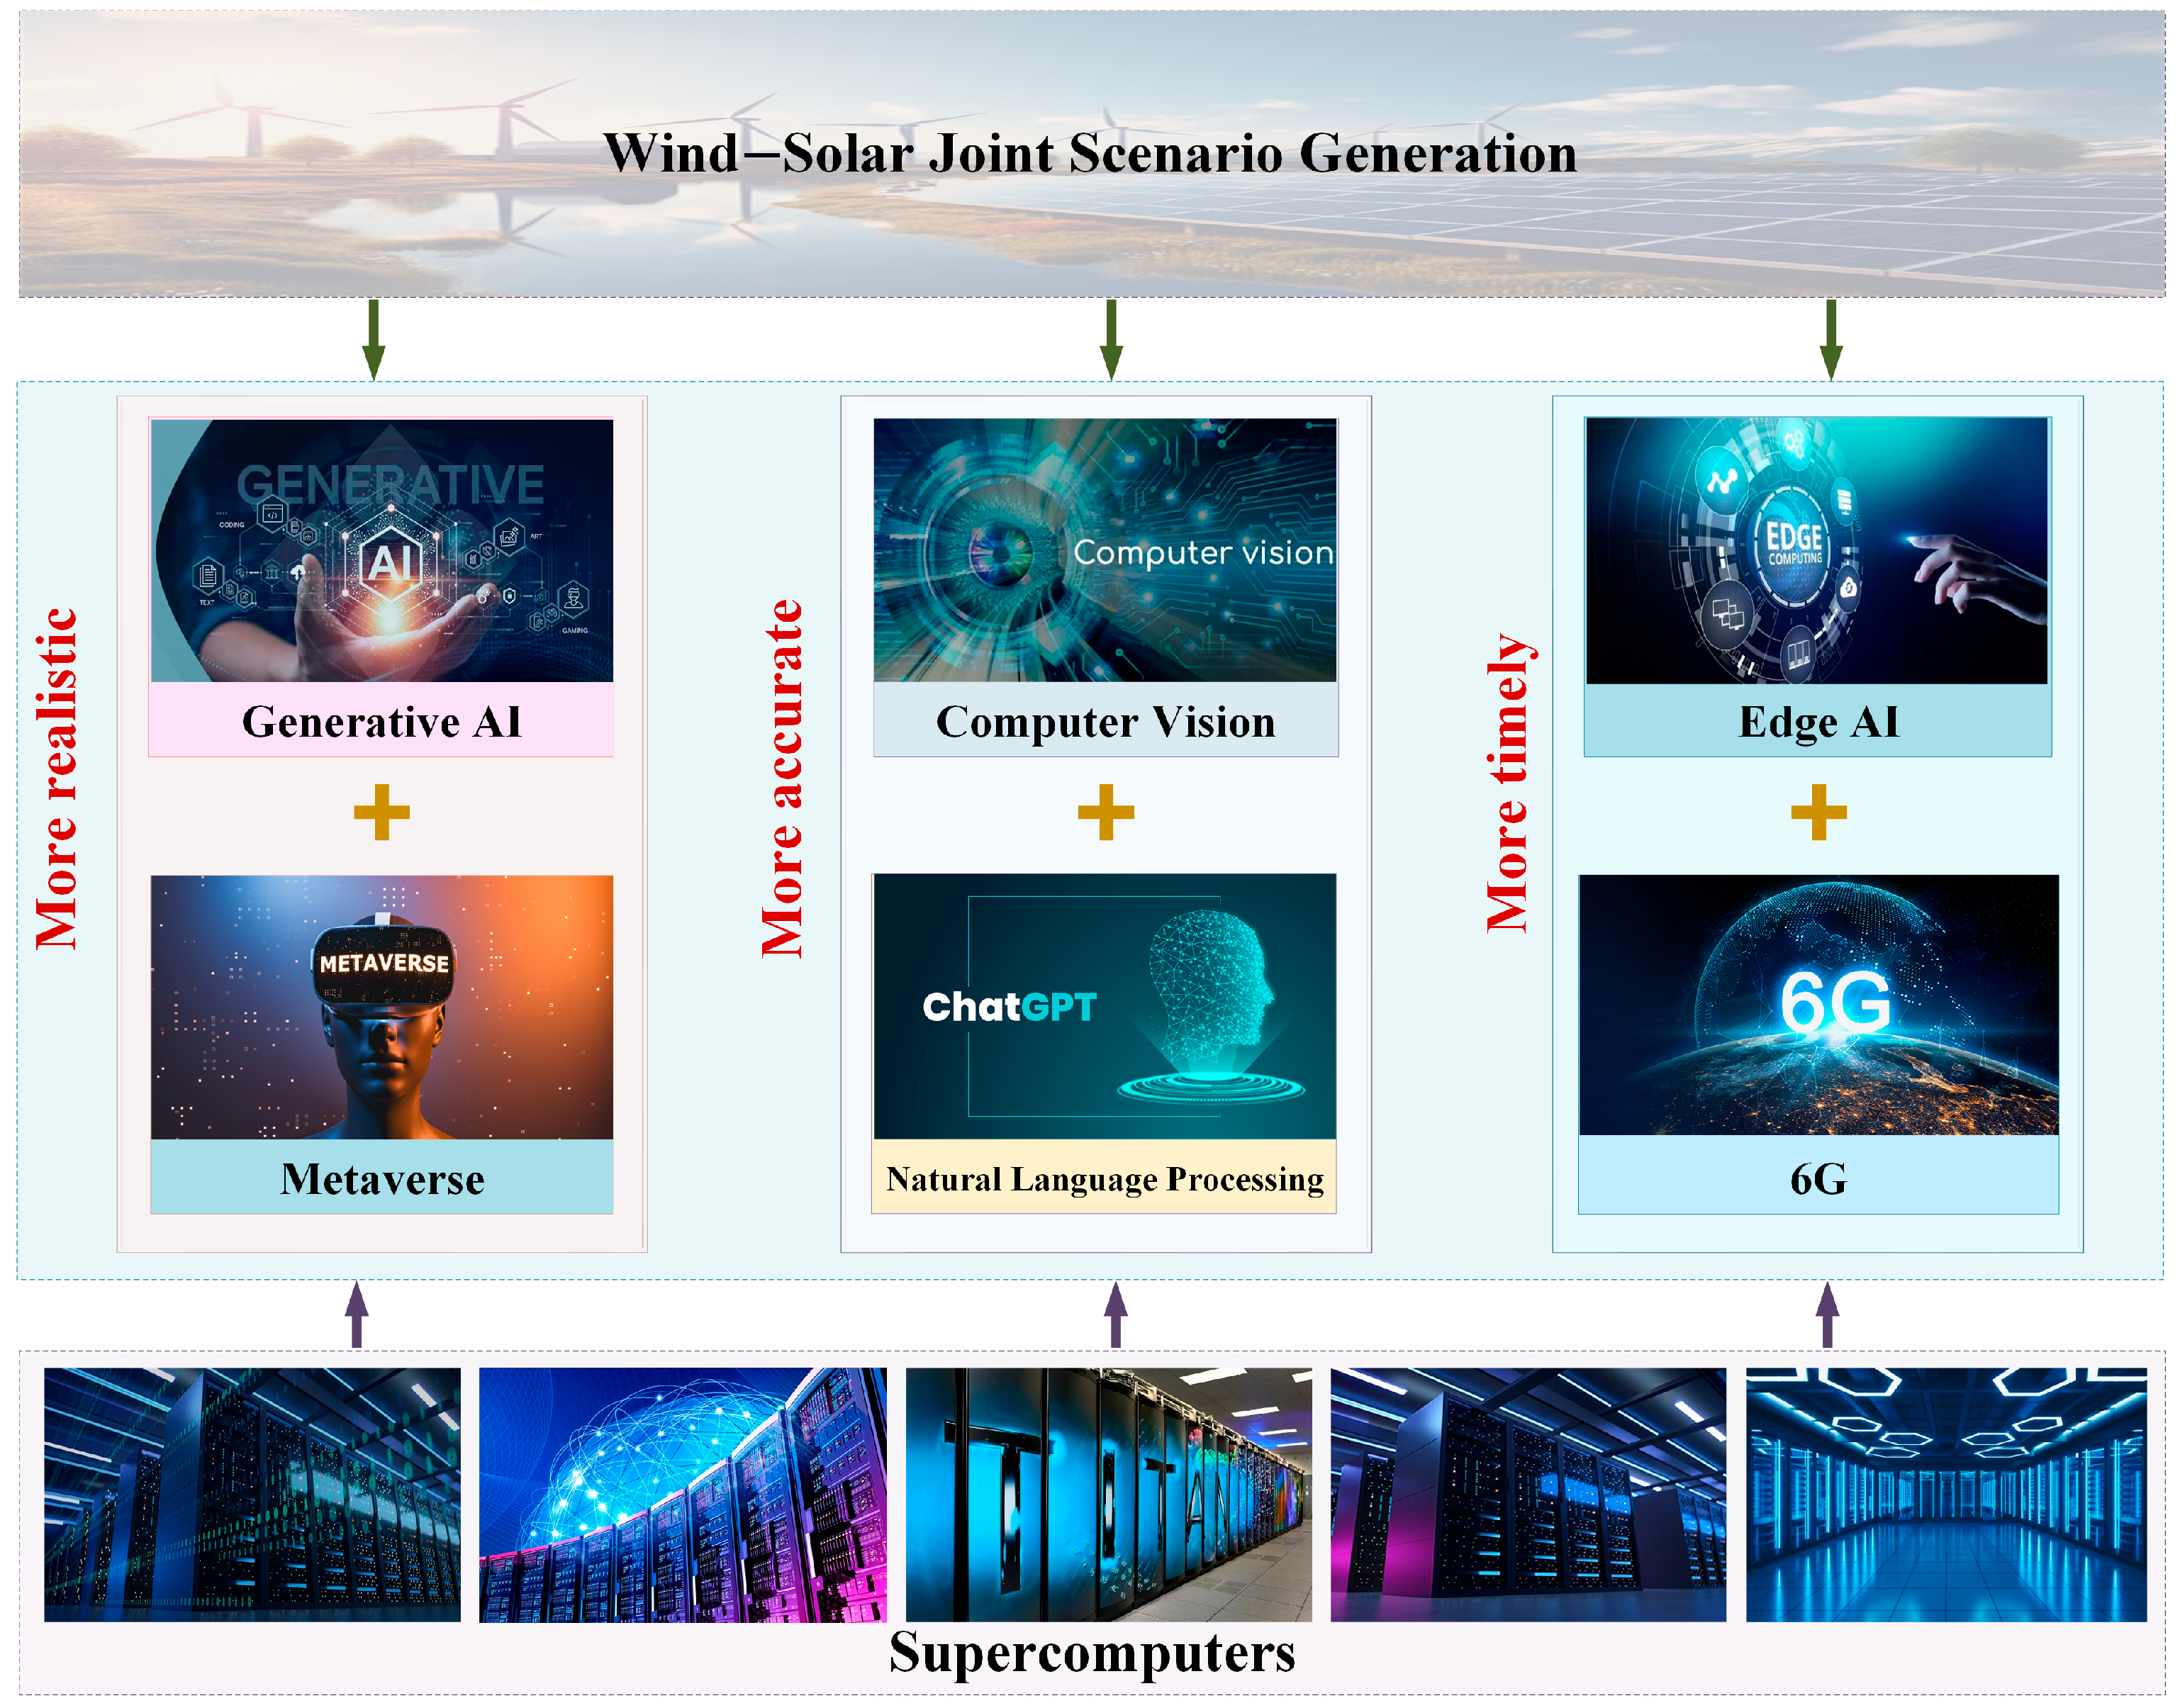

Disclaimer/Publisher’s Note: The statements, opinions and data contained in all publications are solely those of the individual author(s) and contributor(s) and not of MDPI and/or the editor(s). MDPI and/or the editor(s) disclaim responsibility for any injury to people or property resulting from any ideas, methods, instructions or products referred to in the content. |
© 2025 by the authors. Licensee MDPI, Basel, Switzerland. This article is an open access article distributed under the terms and conditions of the Creative Commons Attribution (CC BY) license (https://creativecommons.org/licenses/by/4.0/).