Abstract
The increasing emphasis on environmental sustainability and stricter gas emissions regulations has made the optimization of fuel and emissions a crucial factor for marine propulsion systems. This paper investigates the potential to improve fuel efficiency and reduce emissions of LNG ship propulsion systems by using different load sharing strategies in Dual-Fuel Diesel-Electric (DFDE) propulsion systems. Using data collected from on-board cyclic measurements and an optimization model, the effects of different load sharing strategies for various types of fuel, such as HFO, MDO, and LNG, under different engine load conditions were investigated. The results of these strategies are compared with those of on-board power management systems (PMS), which evenly allocate power among the engines, irrespective of fuel usage and emission levels. The results show that load adjustments according to the optimization model can considerably increase fuel economy and contribute to the reduction of CO2 and NOx compared to standard practice at the equal load in different ship operating modes. Our approach introduces an innovative optimization concept that has been proven to improve fuel efficiency and reduce emissions beyond standard practices. This paper demonstrates the robustness of the model in balancing environmental and operational objectives and presents an effective approach for more sustainable and efficient ship operations. The results are in line with global sustainability efforts and provide valuable insights for future innovations in energy optimization and ship emission control.
1. Introduction
This study builds on previous research [1] that addressed the potential of Liquid Natural Gas (LNG) marine propulsion systems to decrease fuel usage by managing load distribution among engines in a Dual-Fuel Diesel-Electric (DFDE) propulsion system. Using on-board cyclic data acquisition and an optimization model, this study investigates different approaches to load distribution and compares the results of the optimization model recommendations with an automatic (uniform) load distribution. The evaluation includes scenarios with different fuel types: Liquefied Natural Gas (LNG), marine diesel oil (MDO), and heavy fuel oil (HFO), tested at various engine loads. The results showed that adjusting the load distribution according to the results of the optimization model moderately improved fuel efficiency at almost all load intervals, in contrast to the traditional approaches of even load distribution managed by energy management systems.
While the previous model [1] effectively demonstrated fuel savings through optimized load sharing, this research extends the scope of the model to exhaust emissions, particularly nitrogen oxides (NOx) and carbon dioxide (CO2), in response to increasingly stringent environmental regulations. By including emissions in the optimization framework, the aim is to create a more holistic approach to sustainable LNG propulsion of ships.
In this paper, as mentioned above, four-stroke DFDE engines (type: 8L51/60DF) consisting of five main diesel engine generators whose specifications are listed in Table 1 were considered.

Table 1.
Specification of DF-8L 51/60 DF @ 100% load.
A series of exhaust gas emission measurements were performed under actual operating conditions across different modes of operation.
Previous studies have analyzed the limitations of on-board PMS that evenly distribute power among engines without considering fuel consumption or emissions. While these systems meet basic operational requirements, they often lack the adaptability needed to provide economical and environmentally friendly solutions under changing ship operating conditions. Building on these findings, this study presents an optimization model that directly addresses these limitations by dynamically adjusting engine loads to reduce fuel consumption and emissions. This study is an advance over previous work, as it incorporates real-world operational data and focuses on diesel-electric dual-fuel propulsion systems (DFDE). This becomes particularly clear in scenarios such as navigation in rough seas, longer maneuvers, or extended stays in port, where several engines are operating at low load. The results of previous studies indicate that engine usage needs to be adjusted on a daily basis, including the redistribution of power between engines. In some cases, manual redistribution of the engine load is required to increase fuel efficiency and consequently reduce NOx and CO2 emissions. Considering the urgent environmental issues confronting the shipping industry, particularly the imperative to reduce greenhouse gas emissions in accordance with global standards, increasing fuel efficiency has become a key priority.
The Section 1 introduces a series of measurements of exhaust emissions (CO2 and NOx) and specific fuel oil consumption (SFOC) conducted using three different types of fuel, MDO, HFO, and LNG, under varying engine loads.
In Section 2, an extended optimization model is presented and explained, which aims to formulate an energy optimization strategy for an energy optimization approach for an LNG vessel, aimed at minimizing fuel consumption and lower exhaust emissions, taking into account the three different fuel types used by the vessel.
In Section 3, the fuel savings and the reduction of exhaust emissions (calculated) are presented by comparing the uniform load distribution on the engines specified by the power management system with the proposal for an optimized load distribution with identical load and different operating modes of the ship.
Previous research [2] has examined in detail the effects of vessel operating conditions on exhaust emissions and fuel consumption, focusing on the dynamic interaction between power demand, fuel consumption, and emissions under simulated conditions. However, the present study builds on this foundation by using real operating data and extending the analysis to dual-fuel diesel engine (DFDE) configurations. Unlike previous work, this research integrates emissions optimization into the framework, providing a comprehensive strategy for achieving environmental and operational goals. Its aim is to use data from simulators and test benches to determine the most suitable engine configuration for each operating mode, taking into account safety considerations and port regulations. An analysis was carried out to demonstrate the effectiveness of the inbuilt power management system (PMS) in terms of manual load sharing between the engines. A comprehensive analysis of the data and their comparison led to the conclusion that manual power distribution between the motors is a slightly better solution. The results show that the daily fuel consumption for both fuel types considered (MDO and LNG) is lower when the load is distributed manually to the engines than when the load is distributed evenly to the engines according to the PMS. Over a 24-h period, giving an example of a typical vessel load in sailing mode (17,700 kW) combined with an equivalent power output and considering two engine operating configurations, the fuel consumption is reduced by 4.09% when the engines are running on MDO and by 3.34% when the engines are running on LNG. Considering the high daily fuel consumption of this type of vessel, it is concluded that fuel savings on an annual basis will be significant.
As far as NOx emissions are concerned, the results for MDO operation show that the emissions are lower when the load is distributed manually between the engines than when the load is distributed evenly between the engines according to the PMS.
The latest research focuses on improving the performance and reducing the emissions of marine engines, driven by strict environmental regulations and the demand for better fuel efficiency. For example, in [3], a universal method for enhancing the design and functionality of DE propulsion systems on-board the vessel is introduced, emphasizing increasing energy efficiency and reducing fuel consumption. In the study, a genetic algorithm is used to determine the most efficient configuration and operation of diesel-electric propulsion systems. Considerations include the number and type of motors, their power and speed, and the optimum distribution of the load between the motors.
Various drive configurations (AC and DC networks) are evaluated to identify the most effective configuration in terms of fuel consumption under design and non-design conditions. To optimize the design, the study examines the types of engines and their ideal operational settings for a pleasure boat, aimed at achieving a design speed of 17 knots, and analyzing speeds in the range of 10 to 17 knots. The optimization algorithm determines the best performance points at reduced speeds and selects the number and operating parameters of the diesel engines. Two energy management strategies were investigated: one with balanced load distribution between the engines and another that permits unbalanced load distribution. The study highlights the benefits of variable speeds compared to fixed speeds, including improved engine efficiency, lower fuel consumption, and fewer interruptions due to frequent generator starts and stops. The results show that diesel-electric systems, particularly those with variable speed control and uneven load distribution, provide considerable benefits in terms of fuel efficiency and operating performance, particularly at reduced speeds.
In [4], the approaches discussed in the literature for optimization-based power and energy management on ships were analyzed. They take into account the reduction of fuel usage, the reduction of the environmental footprint, the minimization of economic investments, the optimization of dimension and weight of ship equipment, and the maximization of navigation endurance. The approaches for optimizing the operation of the power and energy management system are discussed and techniques for improving power and energy management are presented. Similarly, Carlsen in [5] uses various forms of optimization algorithms with different cases and optimization algorithms using the Metso DNA system (single automation system). The load distribution with 4 DGs installed for different loads shows an average saving of 2.36% when using the Metso DNA system. For comparison, when using the simple simulator, the savings are 0.1675% for smaller loads and 2.5248% for larger loads for an unbalanced system compared to a balanced system (equal load).
In [6], an optimization approach for an all-electric ship with the aim of minimizing costs and improving the Energy Efficiency Operational Indicator (EEOI) while reducing greenhouse gas (GHG) emissions for a cruise ferry is presented. When analyzing different load scenarios for diesel generators (DGs), the study shows a decrease in operational expenses of approximately 2.88% with propulsion adjustment alone and 2.66% when propulsion adjustment is combined with an EEOI constraint.
In contrast to these methods, our proposed model incorporates real operational data and can prioritize emissions over fuel efficiency by weighting factors to ensure robust performance across a wide range of ship operating conditions. By integrating emissions as a fundamental parameter, our approach provides a more holistic and efficient optimization framework compared to previous methods. Numerous optimization-based methods for power and energy management have been investigated, but few of these approaches integrate real operational data with load balancing optimization for DFDE configurations. This study builds on this foundation by introducing a real-time, data-driven optimization model developed specifically for DFDE propulsion systems that demonstrates improved fuel efficiency and reduced emissions in real-world operating scenarios. Furthermore in [7] proposes a control system to minimize fuel consumption in terms of limiting gas emissions from a full electric propulsion vessel for two fuel types. The paper found that the goal of cost minimization is usually in conflict with the goal of environmentally friendly operation. Furthermore, the cost reduction in the system at high load operation is almost 11% when the greenhouse gas limitation (EEOI) is deactivated.
In [8] the authors propose an optimal power management for ship electric power systems integrating full electric propulsion, energy storage, and shore power supply using a fuzzy-based particle swarm optimization algorithm. This algorithm aims to minimize operating costs, reduce greenhouse gas emissions, and meet technical and operational constraints. The simulation results show that the fuzzy-based particle swarm optimization method outperforms conventional methods in cost reduction and emission control.
In dissertation, ref. [9] provides general considerations regarding fuel efficiency of diesel-driven generator set plants, presents measurements of the fuel consumption of a general set under different operating conditions and proposes a genetic algorithm-based method for fuel optimization of the system. Using the genetic algorithm approach, fuel savings of up to 3.1% can be achieved. Similarly, the authors in [10] use two approaches to optimize fuel consumption: gradient search and genetic algorithm. Using the gradient search approach for a fixed selection of GDs, the potential savings are 0.1% and 3% for the genetic algorithm approach.
The article [11] presents an optimization model that can be used in the conceptual phase of ship design for decision support in selecting the configuration of diesel engines in a DE engine system (operating costs with NOx tax and investment costs). Higher investment costs, if they result in lower fuel consumption, can lead to savings over the entire service life, which is why it can be economically advantageous to consider investment and operating costs simultaneously. In [12], various aspects of consumption reduction were considered in the article: weather routing, optimal alignment of DG sets, and integration of weather routing with the power management system (for identical and non-identical engines). The use of energy storage systems (batteries) was also taken into account. The savings in load optimization with regard to load distribution to the generators amount to 5%.
Furthermore, in [13], an optimal power management method based on the application of dynamic programming is proposed for a complex ship energy system with electric shaft machines. Propulsion engines that run on heavy fuel oil and generator engines consuming light fuel oil are included in the consideration. It is possible to optimize the operation of a ship, even if some of the goals to be achieved (e.g., cost reduction and limitation of greenhouse gas emissions) are contradictory. The inclusion of various measures leads to savings of up to 3.8%. A holistic approach was developed [14] to find the optimal system design from both economic and environmental perspectives. By using the whale optimization algorithm for the energy management of ships, fuel consumption and the associated emissions could be reduced by 4.04 to 8.86%. Similarly, in [15], a load allocation optimization method utilizing mixed-integer linear programming was introduced and applied to a case study involving a cruise ship. The findings suggest potential fuel savings of 3%, leading to a reduction in harmful emissions. In addition, ref. [16] investigated the efficient operation of generators with regard to greenhouse gas emissions. The results show that emissions vary depending on specific power requirements and circumstances, and that the application of a suitable load balancing strategy could lead to savings of up to 22%.
A significant number of studies focus on the optimization of DFDE engines, such as [17,18,19,20,21,22]. However, no approach similar to the one presented in this paper has been identified in the available literature that considers the optimization of DFDE power plants and the reduction of fuel consumption and exhaust gas emissions through load sharing between engines.
This research contributes to the field of ship propulsion and emissions optimization in the following ways:
- It presents a new optimization model for load sharing in diesel-electric dual-fuel propulsion systems (DFDE) that incorporates real-world operational data to improve accuracy and applicability;
- The model extends previous research by integrating the optimization of emissions, in particular the reduction of CO2 and NOx, together with improvements in fuel efficiency;
- A comprehensive model validation is performed with real-world data collected under different operating conditions and fuel types to ensure reliability and practical relevance.
These contributions provide a robust framework for optimizing engine load distribution and are in line, with global initiatives to reduce greenhouse gas emissions and promote sustainable maritime practices. Therefore, this study investigates the potential for fuel savings and the reduction of exhaust emissions using a case study of DFDE engines on an LNG vessel.
2. Emission Measurements in Real Conditions of Ship Exploitation
Similar to the previous work [1], where only fuel consumption was measured, the emissions data were collected on board under real operating conditions and in different operating regimes using three types of fuel: LNG, HFO, and MDO. This was done in accordance with the guidelines given in [23]. These measurements covered engine loads ranging from 20% to 90%, with data collected in 10% increments. The analysis of the collected data showed that an optimized distribution of the load on the Dual-Fuel Diesel-Electric systems is required to reduce fuel consumption and exhaust emissions. To substantiate the reliability of these results, additional measurements were taken between the initially recorded points, resulting in a 5% increase in the final engine load data, which was subsequently incorporated into the model development. Measurements were taken by switching the load sharing mode to manual mode and gradually increasing the load by 5% to reach the desired measurement point. When the desired measurement point was reached, the load was kept in this mode for at least 10 min, and when all the operating parameters were stable, the recording was started (in compliance with sections 6.4.9.2 and 6.4.9.3 of the NOx Technical Code 2008) [23] as shown as an example in Figure 1 taken during measurements on an LNG ship.
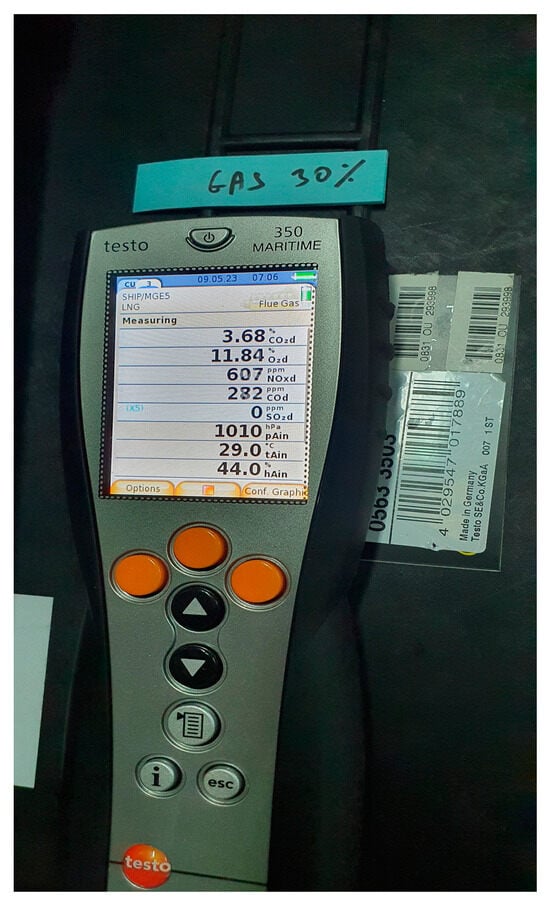
Figure 1.
Example of an emission measurement while the engine is running on LNG.
The fuel consumption data were collected using a “145 PROFLOW Series ‘J’ Vane meter” mass flow meter, which had a valid calibration with an accuracy of ±0.2% at the time of measurement.
Figure 2 graphically presents the recorded data for SFOC for all three fuel types and as a function of the engine load.
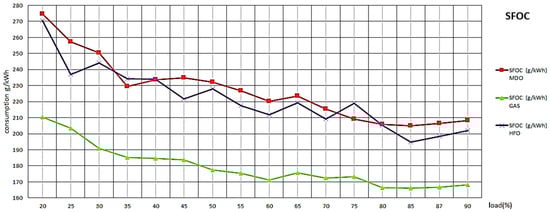
Figure 2.
Fuel consumption data for three different types of fuel depending on the engine load.
The exhaust gas analyzer for emission measurements on marine diesel engines “Testo 350 Maritime”, shown in Figure 3, which was also used to record emissions on the test bench, was used for the measurements of exhaust gases.
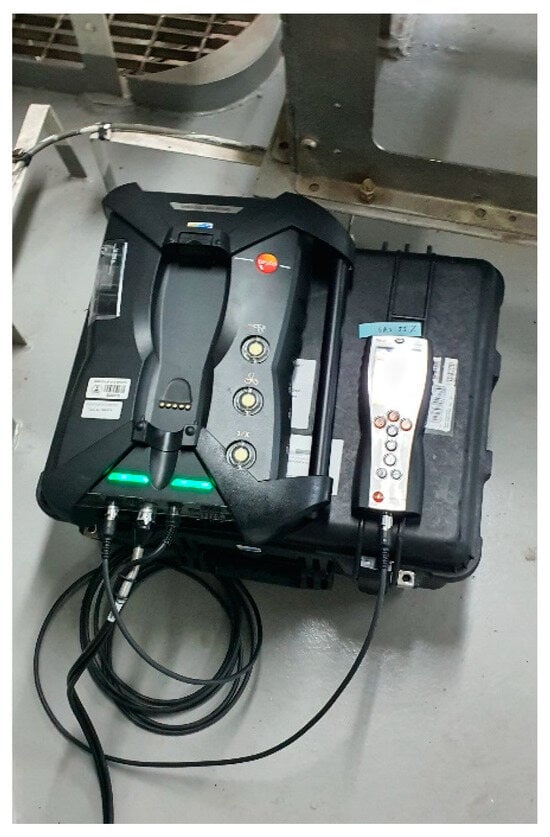
Figure 3.
Exhaust gas analyzer “Testo 350 Maritime”, used for measurements on an LNG ship.
Figure 4 shows graphically the measured data for CO2 for all three fuel types and in relation to the engine load.
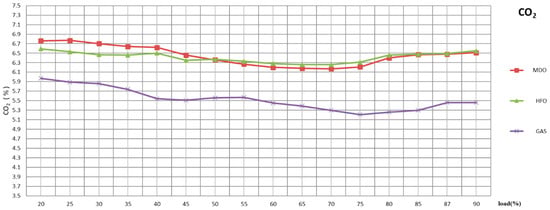
Figure 4.
CO2 emissions for three types of fuel depending on the engine load.
Figure 5 shows graphically the measured data for NOx for all three fuel types in relation to the engine load.
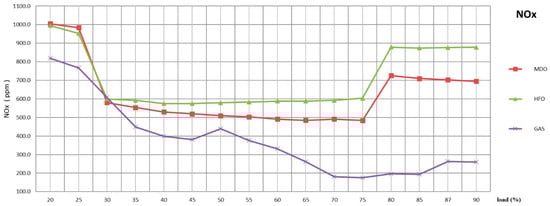
Figure 5.
NOx emissions for three types of fuel depending on the engine load.
Care was taken to ensure that the accuracy of the measuring equipment was such that the maximum tolerances of the values specified in 1.3.1 of Annex 4 of the Technical Code 2008 were not exceeded. Care has also been taken to ensure that the gaseous emissions sampling probes are located at least 0.5 m or three times the diameter of the exhaust pipe, whichever is greater, upstream of the exhaust system outlet, as far as practicable, but close enough to the engine to ensure an exhaust gas temperature of at least 343 K (70 °C) at the probe in accordance with the test cycles defined in 3.2. of Technical Code 2008 [23] as can be seen in Figure 6, which was taken during the actual recording for the purposes of this article.
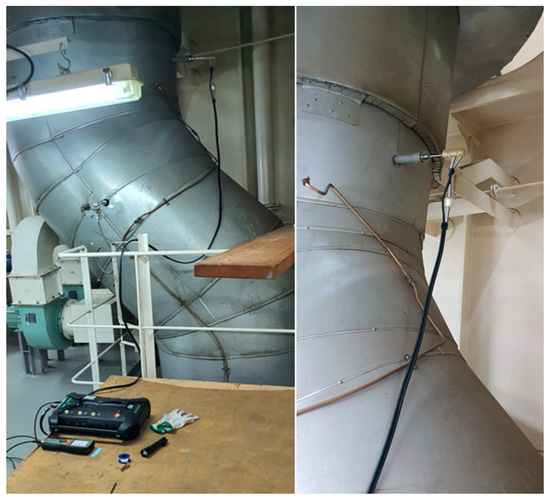
Figure 6.
Position of the sampling probes during recording under real operating conditions.
The operating parameters of the engine as well as the gas emissions NOx, CO2, and the specific fuel consumption (SFOC) were recorded and analyzed, collecting discrete data for the entire load range (20–90%). The data obtained were used to develop an optimization model that determines the individual optimal utilization of the diesel gensets used for each required electrical power of the ship power plant, with the aim of increasing energy efficiency, i.e., reducing fuel consumption, as well as reducing harmful gas emissions (CO2 and NOx). The results of the conducted research showed the justification of the hypothesis that it is possible to improve the existing control system for PMS to individual engines in the on-board power plant of the LNG vessel. By examining the data collected under the ship’s real operating conditions, guidelines for further research were established and the model developed was validated. The results obtained with the model at different loads and fuel types were checked again by the author on the ship under real operating conditions and proved to be reliable. However, it should be noted that environmental conditions such as weather, humidity (Figure 7), and other external factors were not explicitly considered, although they were roughly the same during the validation process.
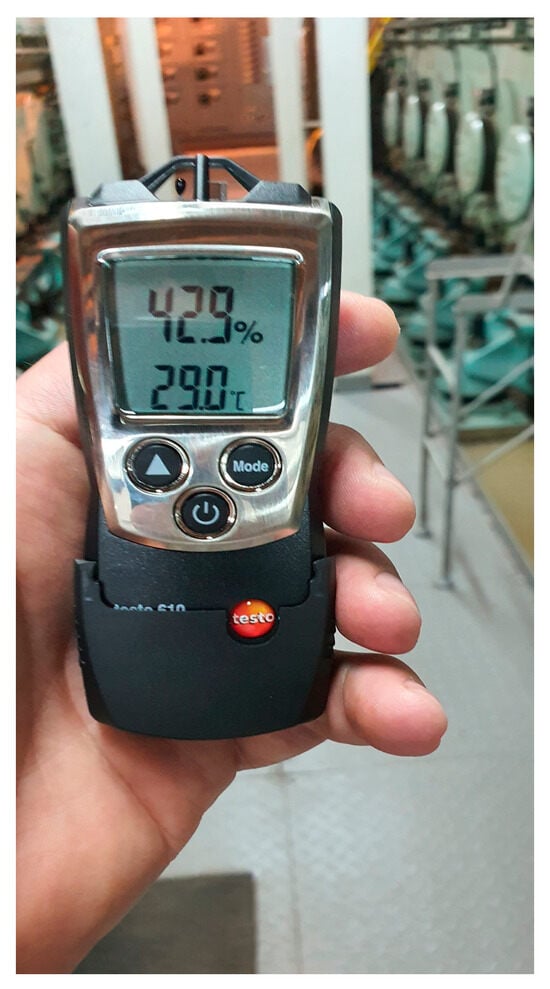
Figure 7.
Humidity measuring instrument “Testo 610”, used for measurements on an LNG ship.
Furthermore, the validation focused solely on the fuel consumption of all three fuels to ensure the accuracy of the model in predicting this specific parameter under the given conditions. It was found that the allocation of load among the DFDE engines connected to the ship’s network needs to be optimized in order to reduce harmful gas emissions and fuel consumption. Alongside the main fuel lines, DFDE engines utilize secondary lines to deliver a small quantity of fuel, referred to as pilot fuel. This pilot fuel plays a key role in ignition when the engine is running on an LNG–air mixture [24] or distillate [25] to cool the nozzles. The consumption of pilot fuel is taken into account when calculating the SFOC for each type of fuel analyzed. The performance and efficiency of DFDE engines are well documented in the existing literature [26,27,28,29,30,31,32,33,34].
3. Optimization Model
The model considers three fuel types, as in previous research: Heavy Fuel Oil (HFO), Marine Diesel Oil (MDO), and Liquefied Natural Gas (LNG), with all operational data stored in a predefined input file. The optimization process uses a combination of spline interpolation performed in MATLAB, as explained in [35] and defined in previous research [1], to uniformly fit the data and cost functions based on specific fuel oil consumption and NOx emissions. The workflow of the optimization model is illustrated in Figure 8 and shows the main steps, including the processing of the input data, the optimization process, and the comparison of the results.
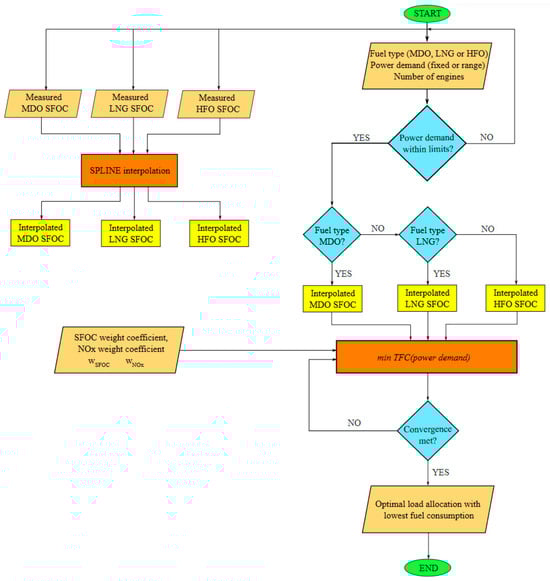
Figure 8.
Optimization model flow chart.
The objective function is weighted to reflect the relative importance of each parameter, normalized based on the maximum operational values of each engine. The optimization is performed using the fmincon function, aiming to balance power—load distribution across multiple engines while minimizing operational costs and emissions. Additionally, the model includes a penalty function to ensure that the total engine output matches the required power demand. The results are compared between optimized load distribution and an equal load distribution scenario. The model’s effectiveness is visualized through various bar charts, illustrating fuel consumption and emission levels under different operational strategies. This approach provides valuable insights into optimizing marine engine operations for sustainability and efficiency. This paper proposes a weight coefficient for fuel consumption (wfFC) and NOx (wfNOx), thus incorporating them into the previously developed optimization model. These weights are used to prioritize fuel consumption and emissions in the optimization as follows:
The purpose of the normalization is to scale the weight factors so that each factor is appropriately balanced in terms of its contribution to the overall objective function. Without normalization, the objective function could be dominated by factors that have higher raw values, even though their actual importance might be lower.
The objective function can be described as follows:
The fmincon function is converging the total fuel consumption (TFC) to the minimum value while utilizing constraints. It is described mathematically as follows:
The function begins with an initial estimate of load distribution and then iteratively adjusts it to minimize the total fuel consumption (TFC) function, while ensuring all defined limitations and boundaries are met. The process continues to refine the solution until it converges. Ultimately, the optimized load distribution, tailored to the specified power demand, number of engines, and SFOC and NOx weight coefficients, is returned as the solution. In addition to handling a specific power demand, the model is also capable of determining the optimal load distribution for various power demands. In both cases, the model provides a comparison between the optimized load distribution and a scenario with equal load distribution, reporting the total fuel consumption for both cases.
4. Results and Discussion
An optimization example was developed in MATLAB R2024a and demonstrated using different fuel types and load requirements based on the ship’s operating modes.
4.1. Example of Optimization of Liquefied Natural Gas (LNG) at Low Load
Figure 9 shows the results of an optimization model designed to reduce fuel consumption and greenhouse gas emissions, in particular CO2 and NOx, at a total load of 8000 kW, a load frequently encountered during cargo operations when the ship is in port. The model aims to optimize fuel consumption and emissions by strategically distributing the load between two engines. The following weighting factors for reduction of fuel consumption (wfFC) and NOx (wfNOx) were applied in the optimization model: wfFC at 0.2, and wfNOx at 0.8.
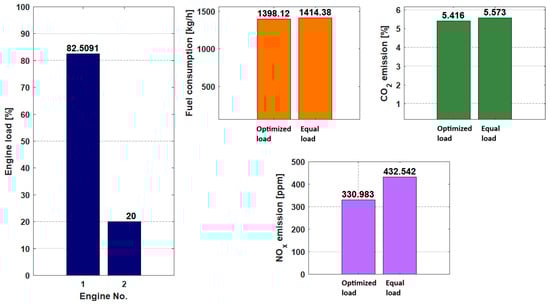
Figure 9.
Optimization example for LNG at 8000 kW on two engines.
The optimized fuel consumption was calculated at 1398.12 kg/h, compared to 1414.38 kg/h for operation with the equal load distribution. Although the difference is relatively small, it corresponds to a fuel saving of around 16.26 kg/h, which means that consumption is 1.16% higher with the equal load distribution than with optimized consumption. The improvement in fuel efficiency corresponds to the lower priority the model gives to fuel consumption, as shown by the wfFC of 0.2.
CO2 emissions were 5.416% with the optimized load distribution, slightly lower than the 5.573% observed under the equal load conditions. The marginal difference of 0.157 percentage points indicates that the model’s load optimization process had a limited impact on CO2 emissions.
The most remarkable result of the optimization process is the significant reduction in NOx emissions. With the optimized load distribution, NOx emissions were reduced to 330.983 ppm, compared to 432.542 ppm with the equal load distribution. This reduction of 23.47% represents a significant improvement and is in line with the wfNOx (0.8). The large reduction in NOx emissions shows that the model has achieved its main objective.
In summary, for this particular load requirement, the optimization model had its greatest impact on NOx emissions, which were significantly reduced by optimizing the load distribution between the engines. While improvements in fuel consumption and CO2 emissions were also observed, these were less pronounced, reflecting their lower priority in the optimization process. These results show that operating the engines under an optimized, selected load distribution results in a more efficient and environmentally friendly system than operating under equal load, confirming the effectiveness of the optimization approach.
4.2. An Example of the Optimization of Different Fuel Types Under Normal Load at Sea
The following examples show the results of an optimization model to reduce fuel consumption and GHG emissions, in particular CO2 and NOx, at a total load of 20,000 kW, the load with which the ship is most frequently operated at sea, with a total of four engines in the network and with different types of fuel. The aim of the model is to optimize fuel consumption and emissions by strategically distributing the load across the engines in the network. The following weighting factors: wfFC and wfNOx, were applied in the optimization model for all fuel types: wfFC at 0.6 and wfNOx at 0.4.
4.2.1. LNG Optimization Example
Figure 10 shows that the optimized fuel consumption is 3498 kg/h, compared to 3512.21 kg/h for operation with equal load distribution. The difference of 14.21 kg/h is modest, but given the relatively high wfFC (0.6), it reflects the importance placed on fuel efficiency in the optimization process.
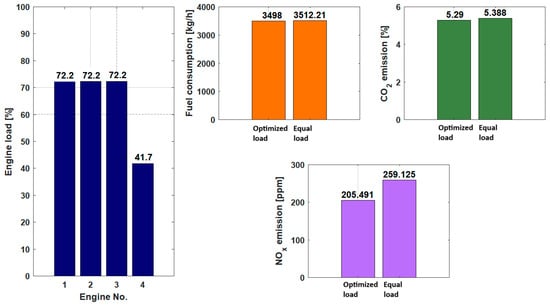
Figure 10.
Optimization example for LNG at 20,000 kW on four engines.
The CO2 emissions with optimized load distribution were 5.290, slightly lower than the 5.388% measured under equal load conditions. There is a slight reduction of 0.098 percentage points, indicates that at the model’s a load significant reduction in NOx emissions. With the optimized load distribution, NOx emissions decrease to 205,491 ppm, compared to 259,125 ppm with the equal load distribution. The greatest effect of the optimization is seen in the NOx emissions. The optimized load scenario leads to a reduction of 20.69% compared to the case with the equal load. The wfNOx (0.4) indicates that although the reduction in NOx emissions was important, it was a lower priority compared to fuel consumption. Nevertheless, the load optimization effectively reduced NOx emissions and contributed to a more environmentally friendly operation.
In general, the optimization model delivers a more balanced result by focusing primarily on fuel consumption, but also achieves a significant reduction in NOx emissions.
While fuel consumption is slightly reduced, NOx emissions are improved more significantly. This shows that the model can achieve significant improvements in emissions control without compromising fuel efficiency.
In summary, the optimized load scenario allows for more efficient and environmentally friendly operation with this type of fuel compared to an equal load distribution and confirms the model’s ability to balance fuel efficiency and emission control, especially for NOx.
4.2.2. HFO Optimization Example
Figure 11 shows that the optimized fuel consumption is calculated at 4282.2 kg/h, compared to 4386.9 kg/h for operation with the equal load distribution. This shows that fuel consumption with the same load distribution is 2.44% higher than with the optimized distribution. This shows that the optimized load distribution is more fuel efficient for the total load of 20,000 kW, as it consumes less fuel to generate the same power.
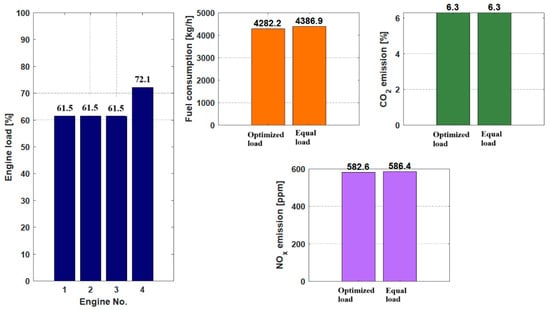
Figure 11.
Optimization example for HFO at 20,000 kW on four engines.
As can be seen from the graph, the percentage of CO2 emissions in this case remains constant at 6.3% in both scenarios, in contrast to the previously considered fuel (LNG).
With the optimized load distribution, NOx emissions are reduced to 582.6 ppm, compared to 586.4 ppm with the equal load distribution.
The wfNOx (0.4) shows that although the reduction of NOx emissions was important, it was a lower priority compared to fuel consumption. Nevertheless, load optimization effectively reduced NOx emissions and contributed to a more environmentally friendly operation.
In summary, as on the previous observed fuel (LNG), the optimized load scenario provides more efficient and environmentally friendly operation compared to the uniform load distribution and confirms the model’s ability to balance fuel efficiency and emissions control.
4.2.3. MDO Optimization Example
Figure 12 shows that the optimized fuel consumption is calculated at 4354.1 kg/h, compared to 4470.2 kg/h for operation with the equal load distribution. This implies that the fuel consumption with the same load distribution is 2.66% higher than with the optimized configuration. This shows that the optimized load distribution is more fuel efficient for the total load of 20,000 kW, as it uses less fuel for the same power.
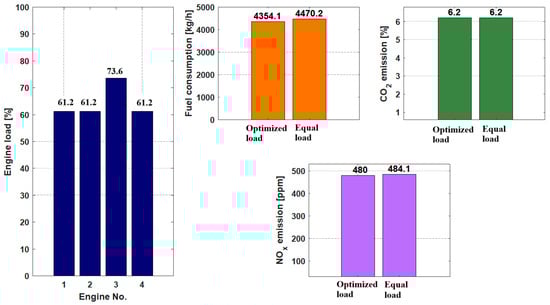
Figure 12.
Optimization example for MDO at 20,000 kW on four engines.
As in the case of the HFO, it can be seen from the data that the CO2 emission percentage remains constant at 6.2% in both scenarios.
With the optimized load distribution, NOx emissions are reduced to 480 ppm, compared to 484.1 ppm with the equal load distribution, which corresponds to a percentage reduction of 0.85%.
In summary, as with the LNG and HFO, the optimized load scenario provides more efficient and environmentally friendly operation compared to the equal load distribution and confirms the model’s ability to balance fuel efficiency and emissions control.
4.3. Heavy Fuel Oil (HFO) Optimization Example for a Larger Power Demand Range
Figure 13 illustrates the fuel consumption for HFO in a power plant operating at 24,000 kW to 26,000 kW for five engines, a range commonly encountered under typical ship operating conditions. It shows the difference in fuel consumption (kg/h) between two scenarios:
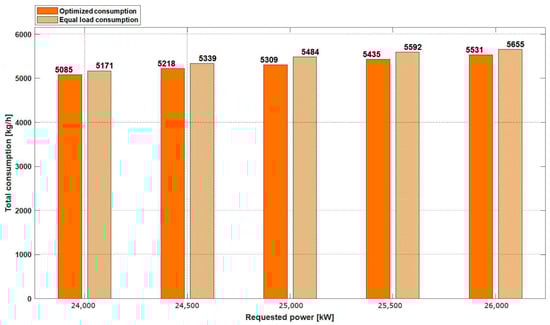
Figure 13.
Fuel consumption for the power range 24,000–26,000 kW.
- Consumption at the equal load distribution (light orange bars): This scenario represents the case where the power is uniformly allocated among all engines.
- Optimized consumption (dark orange bars): This scenario occurs when an optimization model suggests a specific power distribution between engines to improve fuel efficiency.
The following weighting factors, wfFC and wfNOx, were applied in the optimization model for all fuel types: wfFC at 0.4, and wfNOx at 0.6.
The x-axis represents the requested power in kW, ranging from 24,000 kW to 26,000 kW in increments of 500 kW, while the y-axis depicts the total fuel consumption in kg/h.
The graph shows that optimized consumption for each level of power demand consistently results in lower fuel consumption compared to an evenly distributed load. This shows the effectiveness of the optimization model in reducing fuel consumption, which can lead to cost savings and potentially lower environmental impact.
At an output of 24,000 kW, for example, the consumption at the equal load is 5171 kg/h, while the optimized consumption is lower at around 5085 kg/h, i.e., 1.66% less fuel is consumed.
At an output of 26,000 kW, the consumption at the equal load is 5655 kg/h, while the optimized consumption is 5531 kg/h, which means 2.19% less consumption and shows constant savings over the entire output range.
The optimization seems to lead to better fuel economy, especially when the requested power increases, which is a valuable insight for operational planning and cost management.
Figure 14 shows the comparison of CO2 emissions at different requested power levels (24,000 kW to 26,000 kW) for both optimized and uniform load distribution scenarios. As can be seen from the graph, the percentage of CO2 emissions remains constant at 6.3% in both cases, regardless of the requested power or load distribution. This is consistent with the assigned weighting factor of 0 for CO2 in the optimization model, indicating that CO2 emissions were not directly considered in the optimization process. Consequently, the model’s focus on other factors, such as fuel consumption or NOx emissions, has no significant impact on the level of CO2 emissions, which remain stable across all power levels.
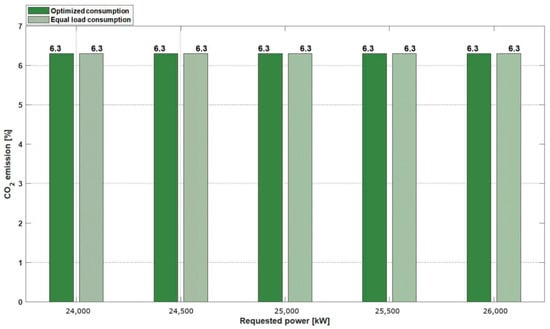
Figure 14.
Share of CO2 emissions for the power range 24,000–26,000 kW.
According to IMO regulations and guidelines, CO2 emissions (including CII, EEPI, cbDIST and clDIST [36], EEXI [37], and EEOI [38]) are calculated on the basis of fuel consumption and its complete combustion. However, complete combustion is rarely achieved in practice, so such consideration was not taken into account in this analysis.
Figure 15 shows a comparison of NOx emissions (in ppm) for different required power levels (from 24,000 kW to 26,000 kW) with optimized load distribution and uniform load. The NOx emissions of the scenario with optimized load distribution are consistently lower at all power levels compared to the scenario with equal load distribution. At 24,000 kW, for example, the optimized scenario results in 583.4 ppm NOx, while the scenario with the equal load distribution has a slightly higher value of 586.7 ppm. At the highest power level (26,000 kW), the optimized scenario results in 577.2 ppm, while the scenario with the equal load distribution results in 591.8 ppm, which is 2.52% higher than the optimized scenario.
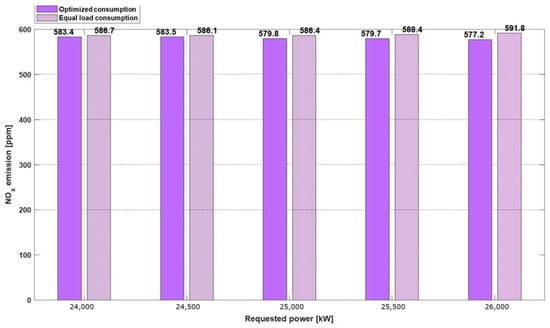
Figure 15.
Share of NOx emissions for the power range 24,000–26,000 kW.
While this consistent reduction in NOx emissions is relatively modest, it demonstrates the impact of the optimization model’s efforts to reduce NOx emissions, which are likely influenced by the weighting of the NOx model (wfNOx). Although the differences are not extremely large, the reductions indicate that the load optimization strategy effectively controls NOx emissions at different power demands and contributes to cleaner and greener operation. The reduction trend is the same at all power levels, highlighting the model’s ability to optimize NOx emissions through load balancing.
The 3D bar chart in Figure 16 shows the percentage load distribution across five motors in a power plant for a power range of 24,000 kW to 26,000 kW. This diagram effectively illustrates the distribution of loads across the individual motors at different levels of total power demand. Each colored segment in the bars represents the portion of the load assigned to a particular motor for each total power level.
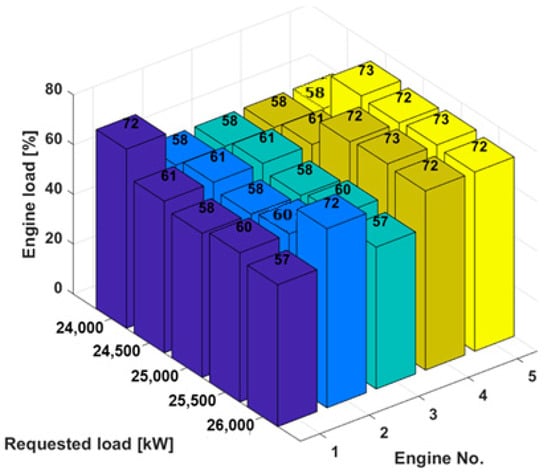
Figure 16.
Percentage load distribution across the engines for the power range of 24,000–26,000 kW.
5. Model Validation with Consumption and Emission Analysis Based on Weight Factors for HFO at High Load Demand
The following diagrams (17, 18, and 19) illustrate the effects of varying the weighting factor of fuel consumption (wfFC) and NOx (wfNOx) in the optimization model on the reduction of fuel consumption, CO2 and NOx emissions at a high-power requirement of 25,000 kW. This power was chosen to ensure that all five engines were connected to the network and running on HFO fuel to test the model under realistic and demanding conditions. These results demonstrate the validity of the model by highlighting its ability to respond effectively to prioritization. As the weighting factor of fuel consumption (wfFC) and NOx emissions (wfNOx) increases, a linear decrease in fuel consumption (and consequently a decrease in CO2) and NOx emissions can be observed, which confirms the effectiveness of the model in balancing environmental and operational objectives. The ability of the model to balance the reduction of emissions and fuel consumption with a higher weighting priority underlines its robustness and adaptability in optimizing efficiency and sustainability. By choosing this range of 0.1 to 0.9, the model follows the principle of shared prioritization and allows for significant trade-offs between fuel consumption (and consequently CO2) and NOx emissions, while ensuring that each objective remains influential.
In addition, the use of a weighting factor in the range of 0.1 to 0.9 supports the concept of distributed weighting, where the sum of the weighting factors per objective is moderated. This range prevents a single factor from dominating the optimization, resulting in a balanced distribution that allows each objective to make a proportional contribution. This approach improves the adaptability of the model to different operating conditions while maintaining the comparability of the results in different scenarios.
Figure 17 shows the relationship between the weight factor (wfFC) and the total fuel consumption in kilograms per hour (kg/h). The values range from wfFC = 0.1 to wfFC = 0.9.
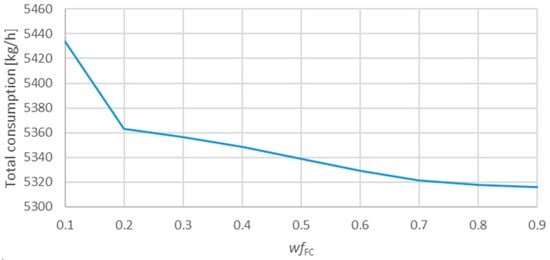
Figure 17.
Consumption based on the fuel weighting factors.
There is a clear downward trend in fuel consumption as the wfFC value increases.
Initially, there is a steeper decline from wfFC = 0.1 to wfFC = 0.2, indicating a significant improvement in fuel efficiency with small increases in weight factor at lower values.
As wfFC increases toward 0.9, the reduction in fuel consumption becomes more gradual, suggesting that further increases in weight factor pay less and less dividends.
This reduction in fuel consumption demonstrates the efficiency of the optimization model in improving fuel efficiency.
Figure 18 shows CO2 emissions (in percent) are plotted against the same weighting factor for fuel consumption (wfFC).
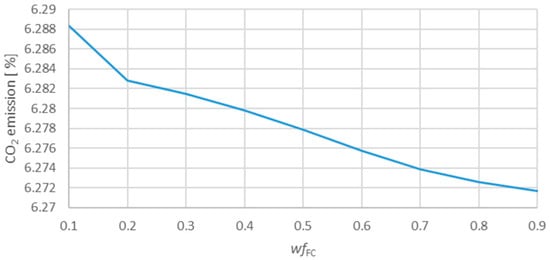
Figure 18.
CO2 emissions based on the fuel weighting factors.
A similar downward trend can be seen, showing a decrease in CO2 emissions as the wfFC value increases and fuel consumption decreases uniformly.
As with fuel consumption, the decrease is more pronounced between wfFC = 0.1 and wfFC = 0.2, after which it gradually decreases.
Since CO2 emissions are directly related to fuel consumption, the reduction in emissions is aligned with the reduction in fuel consumption. This suggests that the optimization model is also effective in reducing environmental impact, achieving sustainability goals and regulatory compliance.
Both graphs (17 and 18) show similar downward trends, reflecting a strong correlation between fuel consumption and CO2 emissions. According to the results presented, it is obvious that prioritizing fuel consumption in the optimization model (wfFC) not only increases efficiency, but also moderately reduces greenhouse gas emissions, in this case CO2 in particular. This double benefit is crucial for compliance with energy efficiency and environmental standards and confirms the model’s effectiveness in lowering fuel consumption and CO2 emissions.
Figure 19 shows the relationship between the weighting factor for NOx emissions (wfNOx) and NOx emissions measured in parts per million (ppm). The weighting factor (wfNOx) ranges from 0.1 to 0.9.
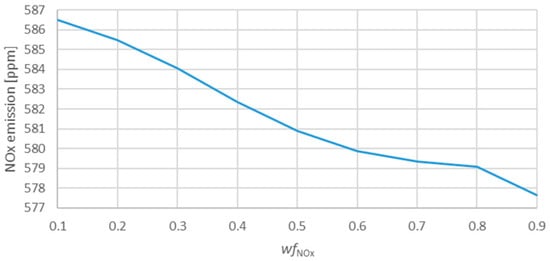
Figure 19.
NOx emissions based on the weighting factors.
A uniform decrease in NOx emissions can be observed when wfNOx increases. This shows that the optimization model effectively reduces NOx emissions when the weighting factor that prioritizes NOx emissions is increased.
It starts with a steeper increase in the earlier range from 0.1 to 0.3, falling from about 587 ppm to 583 ppm, then the curve is observed to become less steep in the middle from 0.3 to 0.7, with emissions gradually decreasing from about 583 ppm to 579 ppm, and finally a steeper decline in the curve is observed again from 0.7 to 0.9, with emissions decreasing more significantly at 579 ppm to 577 ppm.
The reduction in NOx emissions complements the earlier reductions in fuel consumption and CO2 emissions. This indicates that the optimization model can achieve multiple environmental goals simultaneously.
6. Conclusions
This study demonstrates the effectiveness of an optimization model for controlling DFDE engine load distribution in LNG ship propulsion systems with the aim of reducing fuel consumption and exhaust gas emissions, especially NOx. Building on previous work that focused solely on fuel consumption, this extended model also incorporates emissions parameters, reflecting the industry’s shift toward broader sustainability goals. By adjusting the load distribution across multiple engines based on weighted factors for fuel consumption and emissions, the model significantly reduces NOx emissions and achieves moderate improvements in fuel efficiency, in compliance with current environmental regulations.
The results show that optimized load distribution offers significant environmental and operational benefits. For example, NOx emissions were reduced by up to 23% in some scenarios, while fuel consumption savings were consistent, albeit small, at all load levels. This approach has proven valuable for managing fuel efficiency and reducing emissions under real-world operating conditions, as demonstrated by on-board validation measurements.
The adaptability of the model, demonstrated using scenarios with different fuel types and workloads, supports its application to different ship propulsion configurations. Furthermore, this research highlights the importance of incorporating emissions parameters such as CO2 and NOx into optimization frameworks, paving the way for more holistic approaches to marine engine efficiency and environmental impact reduction.
The multi-criteria optimization model validated in this study effectively demonstrates its ability to accommodate different operational strategies and environmental standards by adjusting the weighting factors for fuel consumption and emissions. This adaptability not only confirms the robustness of the model, but also underlines its potential to adapt to specific regulatory requirements and operational needs. By being able to fine-tune these factors, the model can provide optimized solutions that balance fuel efficiency and emissions control, underlining its practical utility in real-world ship operations.
Future research could investigate the integration of this optimization framework with real-time energy management systems to dynamically adjust engine load to further improve emissions control, fuel consumption, and energy and exergy analysis in ecological applications. In addition, the evaluation of trade-offs with other factors (e.g., operating costs, engine performance or other emissions) could be included to further improve the model.
Overall, this study contributes to a sustainable method for greener and more efficient operation of LNG ships and promotes the maritime industry’s efforts to comply with environmental regulations.
Author Contributions
Conceptualization, S.M.-C. and Z.J.; methodology, S.M.-C.; software, S.M.-C.; validation, N.A. and N.R.; formal analysis, S.M.-C. and N.R.; investigation, S.M.-C. and N.A.; resources, S.M.-C.; data curation, S.M.-C., Z.J. and N.A.; writing—original draft preparation, S.M.-C., Z.J. and N.A.; writing—review and editing, S.M.-C., Z.J., N.R and N.A.; visualization, S.M.-C., N.R. and N.A.; supervision, Z.J. and N.R.; project administration, S.M.-C.; funding acquisition, S.M.-C. All authors have read and agreed to the published version of the manuscript.
Funding
This work has been fully supported by the Croatian Science Foundation under the project IP.2020-02-6249. MOPTIHYB—Efficiency Improvement, Emission Reductions and Hybridization of the Marine Power Systems.
Data Availability Statement
The original contributions presented in the study are included in the article, further inquiries can be directed to the corresponding author.
Conflicts of Interest
The authors declare no conflicts of interest.
References
- Martinić-Cezar, S.; Jurić, Z.; Assani, N.; Lalić, B. Optimization of Fuel Consumption by Controlling the Load Distribution between Engines in an LNG Ship Electric Propulsion Plant. Energies 2024, 17, 3718. [Google Scholar] [CrossRef]
- Martinić-Cezar, S.; Bratić, K.; Jurić, Z.; Račić, N. Exhaust Emissions Reduction and Fuel Consumption from the LNG Energy System Depending on the Ship Operating Modes. Pomorstvo 2022, 36, 338–349. [Google Scholar] [CrossRef]
- Zaccone, R.; Campora, U.; Martelli, M. Optimisation of a Diesel-Electric Ship Propulsion and Power Generation System Using a Genetic Algorithm. J. Mar. Sci. Eng. 2021, 9, 587. [Google Scholar] [CrossRef]
- Xie, P.; Guerrero, J.M.; Tan, S.; Bazmohammadi, N.; Vasquez, J.C.; Mehrzadi, M.; Al-Turki, Y. Optimization-Based Power and Energy Management System in Shipboard Microgrid: A Review. IEEE Syst. J. 2022, 16, 578–590. [Google Scholar] [CrossRef]
- Carlsen, A. Diesel-Electric Generator Load Optimization. Master’s Thesis, Norwegian University of Science and Technology, Trondheim, Norway, 2014. [Google Scholar]
- Kanellos, F.D.; Tsekouras, G.J.; Hatziargyriou, N.D. Optimal Demand-Side Management and Power Generation Scheduling in an All-Electric Ship. IEEE Trans. Sustain. Energy 2014, 5, 1166–1175. [Google Scholar] [CrossRef]
- Kanellos, F.D.; Prousalidis, J.M.; Tsekouras, G.J. Control system for fuel consumption minimization–gas emission limitation of full electric propulsion ship power systems. Proc. Inst. Mech. Eng. Part M J. Eng. Marit. Environ. 2014, 228, 17–28. [Google Scholar] [CrossRef]
- Kanellos, F.D.; Anvari-Moghaddam, A.; Guerrero, J.M. A cost-effective and emission-aware power management system for ships with integrated full electric propulsion. Electr. Power Syst. Res. 2017, 150, 63–75. [Google Scholar] [CrossRef]
- Knudsen, J.V. Modeling, Control, and Optimization for Diesel-Driven Generator Sets. Ph.D. Thesis, Aalborg Universitet, Aalborg, Denmark, 2017. [Google Scholar] [CrossRef]
- Knudsen, J.; Bendtsen, J.; Andersen, P.; Madsen, K.; Sterregaard, C.; Rossiter, A. Fuel Optimization in Multiple Diesel Driven Generator Power Plants. In Proceedings of the 2017 IEEE Conference on Control Technology and Applications (CCTA 2107), Kohala Coast, HI, USA, 27–30 August 2017; pp. 493–498. [Google Scholar]
- Solem, S.; Fagerholt, K.; Erikstad, S.O.; Patricksson, Ø. Optimization of diesel electric machinery system configuration in conceptual ship design. J. Mar. Sci. Technol. 2015, 20, 406–416. [Google Scholar] [CrossRef]
- Frisk, M. On-Ship Power Management and Voyage Planning Interaction. Master’s Thesis, Uppsala University, Uppsala, Sweden, 2015. [Google Scholar]
- Michalopoulos, P.; Kanellos, F.D.; Tsekouras, G.J.; Prousalidis, J.M. A method for optimal operation of complex ship power systems employing shaft electric machines. IEEE Trans. Transp. Electrif. 2016, 2, 547–557. [Google Scholar] [CrossRef]
- Nuchturee, C.; Li, T.; Xia, H. Design of Cost-Effective and Emission-Aware Power Plant System for Integrated Electric Propulsion Ships. J. Mar. Sci. Eng. 2021, 9, 684. [Google Scholar] [CrossRef]
- Baldi, F.; Ahlgren, F.; Melino, F.; Gabrielii, C.; Andersson, K. Optimal Load Allocation of Complex Ship Power Plants. Energy Convers. Manag. 2016, 124, 344–356. [Google Scholar] [CrossRef]
- Yiğit, K. Examining the effect of generator load sharing practices on greenhouse gas emissions for a ship. Konya J. Eng. Sci. 2022, 10, 301–311. [Google Scholar] [CrossRef]
- Shih, Y.C.; Tzeng, Y.A.; Cheng, C.W.; Huang, C.H. Speed and Fuel Ratio Optimization for a Dual-Fuel Ship to Minimize Its Carbon Emissions and Cost. J. Mar. Sci. Eng. 2023, 11, 758. [Google Scholar] [CrossRef]
- Pang, B.; Liu, S.; Zhu, H.; Feng, Y.; Dong, Z. Real-Time Optimal Control of an LNG-Fueled Hybrid Electric Ship Considering Battery Degradations. Energy 2024, 296, 131170. [Google Scholar] [CrossRef]
- Zhang, B.; Jiang, Y.; Chen, Y. Research on Calibration, Economy and PM Emissions of a Marine LNG–Diesel Dual-Fuel Engine. J. Mar. Sci. Eng. 2022, 10, 239. [Google Scholar] [CrossRef]
- Cong, Y.; Gan, H.; Wang, H.; Hu, G.; Liu, Y. Multiobjective Optimization of the Performance and Emissions of a Large Low-Speed Dual-Fuel Marine Engine Based on Mnlr-Mopso. J. Mar. Sci. Eng. 2021, 9, 1170. [Google Scholar] [CrossRef]
- Bui, K.Q.; Perera, L.P.; Emblemsvåg, J. Life-Cycle Cost Analysis of an Innovative Marine Dual-Fuel Engine under Uncertainties. J. Clean. Prod. 2022, 380, 134847. [Google Scholar] [CrossRef]
- Radan, D.; Johansen, T.A.; Sørensen, A.J.; Adnanes, A.K. Optimization of Load Dependent Start Tables in Marine Power Management Systems with Blackout Prevention. WSEAS Trans. Circuits Syst. 2005, 4, 1861–1866. [Google Scholar]
- International Maritime Organization. Resolutions NOx TECHNICAL CODE (2008) Technical Code on Control of Emission of Nitrogen Oxides from Marine Diesel Engines. Available online: https://wwwcdn.imo.org/localresources/en/KnowledgeCentre/IndexofIMOResolutions/MEPCDocuments/MEPC.177(58).pdf (accessed on 22 November 2024).
- Huan, T.; Hongjun, F.; Wei, L.; Guoqiang, Z. Options and Evaluations on Propulsion Systems of LNG Carriers. In Propulsion Systems; IntechOpen: London, UK, 2019. [Google Scholar]
- Wärtsilä. Wärtsilä 50DF; Wärtsilä Corporation. Wärtsilä 50DF Engine Technology; Wärtsilä Corporation. Available online: https://www.scribd.com/document/556733678/wartsila-50df (accessed on 21 November 2024).
- Mousavi, S.M.; Saray, R.K.; Poorghasemi, K.; Maghbouli, A. A Numerical Investigation on Combustion and Emission Characteristics of a Dual Fuel Engine at Part Load Condition. Fuel 2016, 166, 309–319. [Google Scholar] [CrossRef]
- Cameretti, M.C.; Tuccillo, R.; De Simio, L.; Iannaccone, S.; Ciaravola, U. A Numerical and Experimental Study of Dual Fuel Diesel Engine for Different Injection Timings. Appl. Therm. Eng. 2016, 101, 630–638. [Google Scholar] [CrossRef]
- Wang, B.; Li, T.; Ge, L.; Ogawa, H. Optimization of Combustion Chamber Geometry for Natural Gas Engines with Diesel Micro-Pilot-Induced Ignition. Energy Convers. Manag. 2016, 122, 552–563. [Google Scholar] [CrossRef]
- Yang, B.; Xi, C.; Wei, X.; Zeng, K.; Lai, M.C. Parametric Investigation of Natural Gas Port Injection and Diesel Pilot Injection on the Combustion and Emissions of a Turbocharged Common Rail Dual-Fuel Engine at Low Load. Appl. Energy 2015, 143, 130–137. [Google Scholar] [CrossRef]
- Lounici, M.S.; Loubar, K.; Tarabet, L.; Balistrou, M.; Niculescu, D.C.; Tazerout, M. Towards Improvement of Natural Gas-Diesel Dual Fuel Mode: An Experimental Investigation on Performance and Exhaust Emissions. Energy 2014, 64, 200–211. [Google Scholar] [CrossRef]
- Di Blasio, G.; Belgiorno, G.; Beatrice, C. Effects on Performances, Emissions and Particle Size Distributions of a Dual Fuel (Methane-Diesel) Light-Duty Engine Varying the Compression Ratio. Appl. Energy 2017, 204, 726–740. [Google Scholar] [CrossRef]
- Li, W.; Liu, Z.; Wang, Z. Experimental and Theoretical Analysis of the Combustion Process at Low Loads of a Diesel Natural Gas Dual-Fuel Engine. Energy 2016, 94, 728–741. [Google Scholar] [CrossRef]
- Mustafi, N.N.; Raine, R.R.; Verhelst, S. Combustion and Emissions Characteristics of a Dual Fuel Engine Operated on Alternative Gaseous Fuels. Fuel 2013, 109, 669–678. [Google Scholar] [CrossRef]
- Bora, B.J.; Saha, U.K.; Chatterjee, S.; Veer, V. Effect of Compression Ratio on Performance, Combustion and Emission Characteristics of a Dual Fuel Diesel Engine Run on Raw Biogas. Energy Convers. Manag. 2014, 87, 1000–1009. [Google Scholar] [CrossRef]
- Cuevas, E.; Luque, A.; Escobar, H. Spline Interpolation. In Computational Methods with MATLAB®; Springer Nature: Cham, Switzerland, 2024; pp. 151–177. ISBN 978-3-031-40478-8. [Google Scholar]
- International Maritime Organization. 2022 Guidelines on Operational Carbon Intensity Indicators and the Calculation Methods (CII Guidelines, G1). Available online: https://wwwcdn.imo.org/localresources/en/OurWork/Environment/Documents/Air pollution/MEPC.346(78).pdf (accessed on 1 December 2024).
- International Maritime Organization. 2022 Guidelines on Survey and Certification of the Attained Energy Efficiency Existing Ship Index (EEXI). Available online: https://wwwcdn.imo.org/localresources/en/KnowledgeCentre/IndexofIMOResolutions/MEPCDocuments/MEPC.351(78).pdf (accessed on 1 December 2024).
- International Maritime Organization. Guidelines for Voluntary Use of the Ship Energy Efficiency Operational Indicator (EEOI). Available online: https://gmn.imo.org/wp-content/uploads/2017/05/Circ-684-EEOI-Guidelines.pdf (accessed on 1 December 2024).
Disclaimer/Publisher’s Note: The statements, opinions and data contained in all publications are solely those of the individual author(s) and contributor(s) and not of MDPI and/or the editor(s). MDPI and/or the editor(s) disclaim responsibility for any injury to people or property resulting from any ideas, methods, instructions or products referred to in the content. |
© 2025 by the authors. Licensee MDPI, Basel, Switzerland. This article is an open access article distributed under the terms and conditions of the Creative Commons Attribution (CC BY) license (https://creativecommons.org/licenses/by/4.0/).