Abstract
In electric vehicles (EVs), the batteries are arranged in the battery pack (BP), which has a small layout space and difficulty in dissipating heat. Therefore, in EVs, the battery thermal management systems (BTMSs) are critical to managing heat to ensure safety and performance, particularly under higher operating temperatures and longer discharge conditions. To solve this problem, in this article, the thermal analysis models of a 3-battery-cell BP were created, including scenarios (1) natural air cooling without a BTMS; (2) natural air cooling with water cooling hybrid BTMS; and (3) forced air cooling plus water cooling composite BTMS. The thermal performances of the pack-level BPs were simulated and analyzed based on computational fluid dynamics (CFD). A variety of boundary conditions and working parameters, such as ambient temperature, inlet coolant flow rate and initial temperature, discharge rate, air flow rate, and initial temperature, were considered. The results show that without a BTMS (Scenario 1), the maximum temperature in the BP rises rapidly and continuously to reach 63.8 °C, much higher than the upper bound of the recommended operating temperature range (ROTR between +20 °C to +35 °C) under the extreme discharge rate of 3 C and even if the discharge rate is 2 C. With a hybrid BTMS (Scenario 2), the maximum temperature in BP rises to about 38.7 °C, slightly above the upper bound of the ROTR. Lowering the coolant (water) initial temperature can effectively lower the temperature up to 5.7 °C in BP, but the water flow rate cannot since the turbulence model. While with a composite BTMS (Scenario 3), the temperature can be further lowered up to 1.5 °C under the extreme discharge rate of 3C, just reaching the upper bound of the ROTR. In addition, lowering the initial coolant temperature or air temperature can effectively decrease the temperatures up to 5.1 and 1.0 °C, respectively, in BP, but the coolant flow rate (due to the turbulence model) and the air flow rate cannot. Finally, the thermal performances of the different battery cells in the BP with different cooling systems and at the different positions of the BP were compared and analyzed. The present work may contribute to the design of BTMSs in the EV industry.
1. Introduction
Global fossil CO2 emissions are expected to further increase in 2023 by 1.1% relative to 2022, reaching 36.8 Gt CO2 yr−1 [1]. In this regard, it is worth noticing that the automobile industry is one of the key contributors since the number of automobiles, particularly motor vehicles, is estimated to reach 1.47 billion by 2023 at the latest [2]. Therefore, there is increasing concern about the causes and effects of global warming and climate change. There are growing calls to reduce carbon emissions. Electric vehicles (EVs) cannot emit greenhouse gases during operation, and they have the potential benefit of reducing daily tailpipe emissions compared to the conventional carbon-based fuel vehicles. Thus, the EV market is seeing exponential growth [3]. The projected EV demands in major automotive markets will have a profound impact on the current environmental policy on energy markets and climate goals. Under the International Energy Agency’s Stated Policies Scenario (STEPS), the predicted global share of EV sales has risen from less than 25% in previous forecasts to 35% by 2023, based on the existing policies and company targets. China remains the largest market for EVs in the forecast, accounting for 40% of total sales by 2030. Thanks to recent policy moves, the US market share will double to 20% by the end of the decade, while Europe’s market share will remain at 25% [3].
EVs are divided into two categories: pure EVs and hybrid EVs. The former only uses electrical energy as a power source, while the latter uses a conventional gasoline engine running in parallel with a power battery. Pure EVs are more environmentally friendly than hybrid EVs but usually have shorter battery life. Currently, the mileage of EVs is difficult to reach the level of carbon-based fuel vehicles at the same price. Therefore, the type of battery for EVs becomes a critical issue.
At present, the main requirements for EVs are long battery life and extended battery cycles. These two aspects require the EVs’ batteries to have high energy density, prolonged cycle periods, and high discharge rates. The most common choice in the current EV market is lithium-ion (Li-ion) batteries. Compared with other rechargeable batteries, the Li-ion batteries show superior advantages, including low mass density, low self-discharge rate, high energy density, and great working performance. Li-ion batteries are a balanced choice [4]. However, in low-temperature conditions, the loss of energy in batteries primarily arises from the precipitation of Li-ions within Li-ion batteries, forming Li-dendrites. These Li-dendrites may penetrate the battery’s membrane, leading to short internal circuits and resulting in energy loss [5]. Studies have shown that excessive environmental temperatures can induce irreversible thermal runaway in batteries. This leads to the oxidation of the electrolyte (chemical reactions, resulting in electrolyte decomposition) and the release of large amounts of gas, causing rapid expansion of the batteries, intensifying internal side reactions, generating significant heat, and thereby triggering safety incidents such as self-ignition and explosions [6,7]. Furthermore, temperature variations directly impact the discharge performance and capacity of Li-ion batteries. Both elevated temperatures (≥50 °C) and low temperatures (≤20 °C) can cause varying degrees of capacity reduction in Li-ion batteries [8]. Research indicates that after 500 discharge cycles at 55 °C, the capacity of Li-ion batteries drops by nearly 70% [9]. Considering the EV target market and seasonal ambient temperatures, it was determined that the operating temperature of the battery pack (BP) should be between −30 °C and +50 °C. The battery cells within a BP often exhibit uneven temperatures. Poor temperature uniformity can lead to a partial state of charge (SOC), which reduces the cycle life of the batteries [10,11]. Therefore, the recommended operation temperature range (ROTR) of a BP should be maintained between +20 °C and +35 °C [12].
Research and applications clearly show that temperature is a key factor affecting the performance of Li-ion batteries, limiting the application of Li-ion batteries [13]. Furthermore, the battery capacity degradation (leading to battery failure) is affected by several factors, including temperature, current, and voltage during charging and discharging operations, and the level at which the battery is charged and discharged.
In EVs, the batteries are arranged in the BP, which has a small layout space and difficulty in dissipating heat. Therefore, in EVs, the battery thermal management systems (BTMSs) have a significant impact on their performance [14].
In extreme temperature operating environments, problems such as electrolyte performance degradation and thermal runaway can occur in Li-ion batteries [15]. Therefore, it is necessary to integrate the BTMS into the BP so that it is able to keep the BP’s operating temperature within a safe range [5], i.e., to effectively control the heat generation, heat dissipation, and temperature distribution of the BPs during battery charge–discharge operation cycles. Thus, the BTMSs serve as an important means and can effectively extend the lifespan of the Li-ion batteries, improve the performance, cost per power output, and safety of the batteries by adjusting the temperature levels and the distribution of the battery layout and the BTMS design in the EVs [5,16,17,18].
In order to keep the BP in the EVs within the optimal operating temperature range, i.e., ROTR, the BTMS needs to perform several functions: dissipating the generating heat during battery charging and discharging operation, preventing sudden changes in temperature by system thermal insulation, and ventilating to remove potentially harmful gases from the operation. The BTMSs with the evolution of EV battery technology, such as increased power capacity, voltage, and current in proportion to increased range requirements, become a critical system. The requirements of the BTMS also include a small overall system weight, minimal space occupancy within the vehicle, a simple structure, and avoidance of multi-step or complex production processes [19,20]. Based on the cooling methods employed, BTMSs can be categorized into three primary types, i.e., active cooling, passive cooling, and hybrid cooling. Figure 1 shows the detailed categorization of the commonly adopted BTMSs [21,22,23].
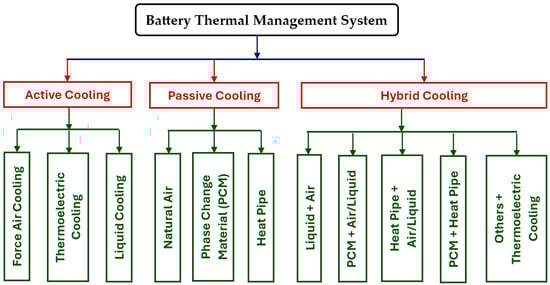
Figure 1.
Schematic diagram of BTMS classifications.
The air-cooling methods are simple, low-cost, and easy to maintain. However, their efficiency drops significantly at high ambient temperatures. Researchers have proposed various improvement methods, such as air-channel improvement, adding fin structure, and changing battery arrangement to improve the performance of air-cooled BTMSs. Liquid-cooling methods are highly effective for demanding applications like EVs. Compared with air cooling, liquid cooling has excellent heat-transfer capabilities, making it suitable for high-power density scenarios. Phase change material (PCM)-based cooling methods provide passive thermal management by absorbing heat during phase change. This method is effective for maintaining consistent battery temperature but needs to be supplemented with active cooling systems to operate at high power for a long time. Thermoelectric cooling methods use the Peltier effect to achieve efficient temperature control. It has advantages such as small size, low noise, and long life, making it suitable for various applications, including BTMSs [21,22,23,24,25]. In the category of hybrid cooling BTMSs, they are just a combination of active and passive cooling systems. It has been shown that hybrid BTMSs will become one of the promising technologies [26,27,28].
At present, the existing BTMSs have their own advantages and disadvantages. Researchers have begun to develop new BTMSs by using novel design methods such as new coolants and changing the system structures [29,30,31,32,33,34,35,36]. In recent years, many different approaches have been proposed to promote the research and development of BTMSs from different perspectives. For example, Sui et al. [37] proposed a cold plate equipped with hybrid manifold channels located at the bottom of a high-capacity 280 Ah LiFeO4 battery pack. Based on the numerical investigation of the developed battery pack model, the maximum battery temperature can be limited to 30.73–33.78 °C, the coolant pressure drop range is 7.66 kPa to 1.76 kPa, and the battery heating power is 10 kW/m3. Furthermore, researchers have designed effective BTMSs by developing novel thermal conductive materials between the cell-to-cell interlayers, but current designs and research lack the responsiveness required for performance and safety. Wang et al. [38] designed a thermal-switching material with a high switching ratio from a conductive state to an insulative state, opening up a different path for rapid temperature-responsive thermal regulators for battery module safety management. Applying this designed thermal-switching material to the cell-to-cell interlayer of four 50 Ah nickel-cobalt-manganese Li-ion battery modules not only ensures uniform temperature distribution under normal operating conditions, but more importantly, it prevents 80% of the thermal runaway heat transfer, effectively avoiding catastrophic battery explosions.
In a fluid cooling BTMS, the cold plate in contact with the BP is the most important component. Zuo et al. [39] proposed a double S-channel cold plate to cool the prismatic LiFePO4 batteries, compared with the traditional single S-channel cold plate. The thermal behavior of the BTMSs was numerically investigated and compared under different conditions. The results showed that compared with the single S-channel cold plate, the double S-channel cold plate had a similar maximum battery temperature and a smaller temperature difference; the pressure drop and pumping power were reduced by 74%, and the overall thermal performance was improved. Zhang et al. [40] designed an inclined channel cold plate based on the straight channel cold plate for cooling a prismatic LiFePO4 battery. The numerical investigation showed that compared with the performance of the regular straight channel cold plate, the performance of the inclined channel cold plate, represented by the non-dimensional factor ratio j/f (j—the non-dimensional surface heat transfer factor and f—the non-dimensional surface friction factor), is improved by 79.4% when the coolant is water and the mass flow rate is 0.6 g/s. It is found that the larger the inclined angle, the better the performance of the inclined channel cold plate.
Therefore, understanding the heat transfer process and thermal mechanism in a BTMS based on accurate prediction/simulation of the temperature distribution inside the battery cells under operating conditions is crucial for the effective design and optimization of the BTMS, but research work in this area has not been fully explored. In this study, three-dimensional (3D) models of three-battery-cell pack-level BP, including a BP model without a BTMS (Scenario 1—with surface natural air convection cooling only), a BP model with a hybrid BTMS (Scenario 2—surface natural air cooling plus liquid (water) cooling), and a BP model with a composite BTMS (Scenario 3—with forced air cooling plus a liquid (water) cooling), were generated. The commercial software ANSYS® Fluent 2022 R1 was used to perform numerical simulations on the thermal performance of the pack-level BP models based on computational fluid dynamics (CFD). The effects of parameters, including ambient temperature, inlet coolant flow rate, and initial temperature, discharge rate, air flow rate and initial temperature, on the thermal behaviors of the BPs were analyzed. Finally, the thermal performances of the single battery cell in BP with different cooling systems and at different positions in BP were compared and analyzed.
2. Method and Model Used for Evaluating BTMSs
It is crucial to effectively evaluate the performance and thermal behavior of Li-ion batteries during operation. Various factors and operational parameters, such as electrochemistry, operation time, ambient temperature, discharge rate, and charging status, type of coolant, coolant temperature, and flow rate, influence battery performance, heat generation, and heat dissipation. These factors pose challenges for researchers in accurately determining current density within the battery and the non-uniformity of battery surface temperature during instantaneous transient conditions. For example, in a free convection airflow setup, the maximum temperature difference for a single cell exceeded 2 °C, while in a forced convection airflow configuration, it exceeded 3 °C, even though the average temperature is lower [41]. Studies have found that the conductivity of the solid phase and liquid phase will affect the current density, thereby affecting the electrochemistry of the batteries, and the uniformity of the current density distribution is related to the utilization of active materials in the electrode [42].
2.1. Experimental and Computational Methods for Evaluating BTMSs
In order to evaluate the BP’s performance in an EV, several experimental methods, especially non-destructive techniques, can be adopted, such as (1) electromechanical impedance spectroscopy (EIS), which measures battery impedance as a function of the input frequencies. Since impedance is a measure of a battery’s resistance to the flow of current. EIS can be used to evaluate a few batteries’ performance related to SOC to gain insight into the properties of the BP system; (2) infrared thermography (IRT) can be used for quality control and process monitoring. An IRT is equipped with an infrared camera enabling temperature measurement by capturing the infrared spectrum emitted by the measuring surfaces; (3) X-ray computer tomography (XCT) examines internal structures and gains insight into the mechanical and structural stability and damage of the BP system. This technique is widely used in medical imaging for diagnosing diseases and injuries and in materials science and engineering to examine the internal structure and damage of objects without causing damage. (4) Ultrasonic testing (UT) used in Li-ion battery evaluation mainly focuses on detecting defects and monitoring the battery’s SOC and health status in real time. It emits the ultrasonic waves to propagate in the battery material; it receives the waves reflecting from the interface between components such as electrodes and electrolytes [43]. (5) Of course, the simplest thermocouples can be installed on the battery surface to monitor changes in battery surface temperature during battery operation; (6) isothermal battery calorimeters and acceleration calorimeters can be used to measure heating rates. Isothermal battery calorimeters are ideal for assessing continuous heating but face challenges in capturing transient temperature in batteries. This method only works if the battery surface temperature is consistently uniform. On the other hand, acceleration calorimeters are more commonly used to monitor battery temperatures during thermal runaway experiments because they can effectively measure battery discharge temperature [44,45].
The BTMSs in EVs are expected to perform a variety of functions, such as measuring basic system operation conditions such as voltage, temperature, and current of the BP system. However, to accurately determine the availability of energy in order to reliably calculate the range, complex algorithms are needed. Although each battery in a parallel BP can maintain the same voltage, the batteries in series during operation can have different voltages even if they are identical. Since batteries at different locations within BP are subject to different environmental conditions and also small differences in the manufacturing process accumulate over time. These factors may result in the capacity decay of the series batteries. This shows that the BTMS is an important component of the energy storage system, and effective and accurate evaluation and analysis of the BTMS is a prerequisite for the overall optimal design of the BTMS [46].
From previous experimental studies, there is a lack of quantitative evaluation and comprehensive understanding of the effects of various working conditions/parameters and their interaction in BTMS on BP performance. Traditional trial-and-error-based experimental methods are costly, time-consuming, and sometimes even impossible. Computer simulations can evaluate the thermal performance of the designed BTMS, including the thermal performance of the batteries during charging and discharging and the size of the passive and active cooling elements. Depending on the problem interest and the simulation capability, various approaches for evaluation and optimal design of the performance of the BTMS based on computer modeling are evolving, ranging from subatomic scales (such as quantum mechanics) and atomic scales (such as molecular dynamics) to micro and macro scales (such as continuum mechanics-based finite element analysis (FEA) and computational fluid dynamics (CFD)) [46]. In general, by establishing mathematical and physical models and equations for multi-field coupling analysis of battery systems and selecting appropriate meshes, the CFD simulation method can be used for extensive preliminary experiments, thus offering optimized solutions for various aspects of battery performance. The commercial software ANSYS®, a versatile software, within the CFD software ANSYS Fluent, includes a Li-ion battery module that can be used to simulate the performance of the BTMSs.
The battery thermal model is one of the models used to evaluate the thermal performance of the BTMS, taking into account factors such as the battery’s heat generation characteristics, surface thermal uniformity, and the battery’s maximum, minimum, and average temperatures.
2.2. Fundamentals of CFD and Thermal Models of BTMS in This Study
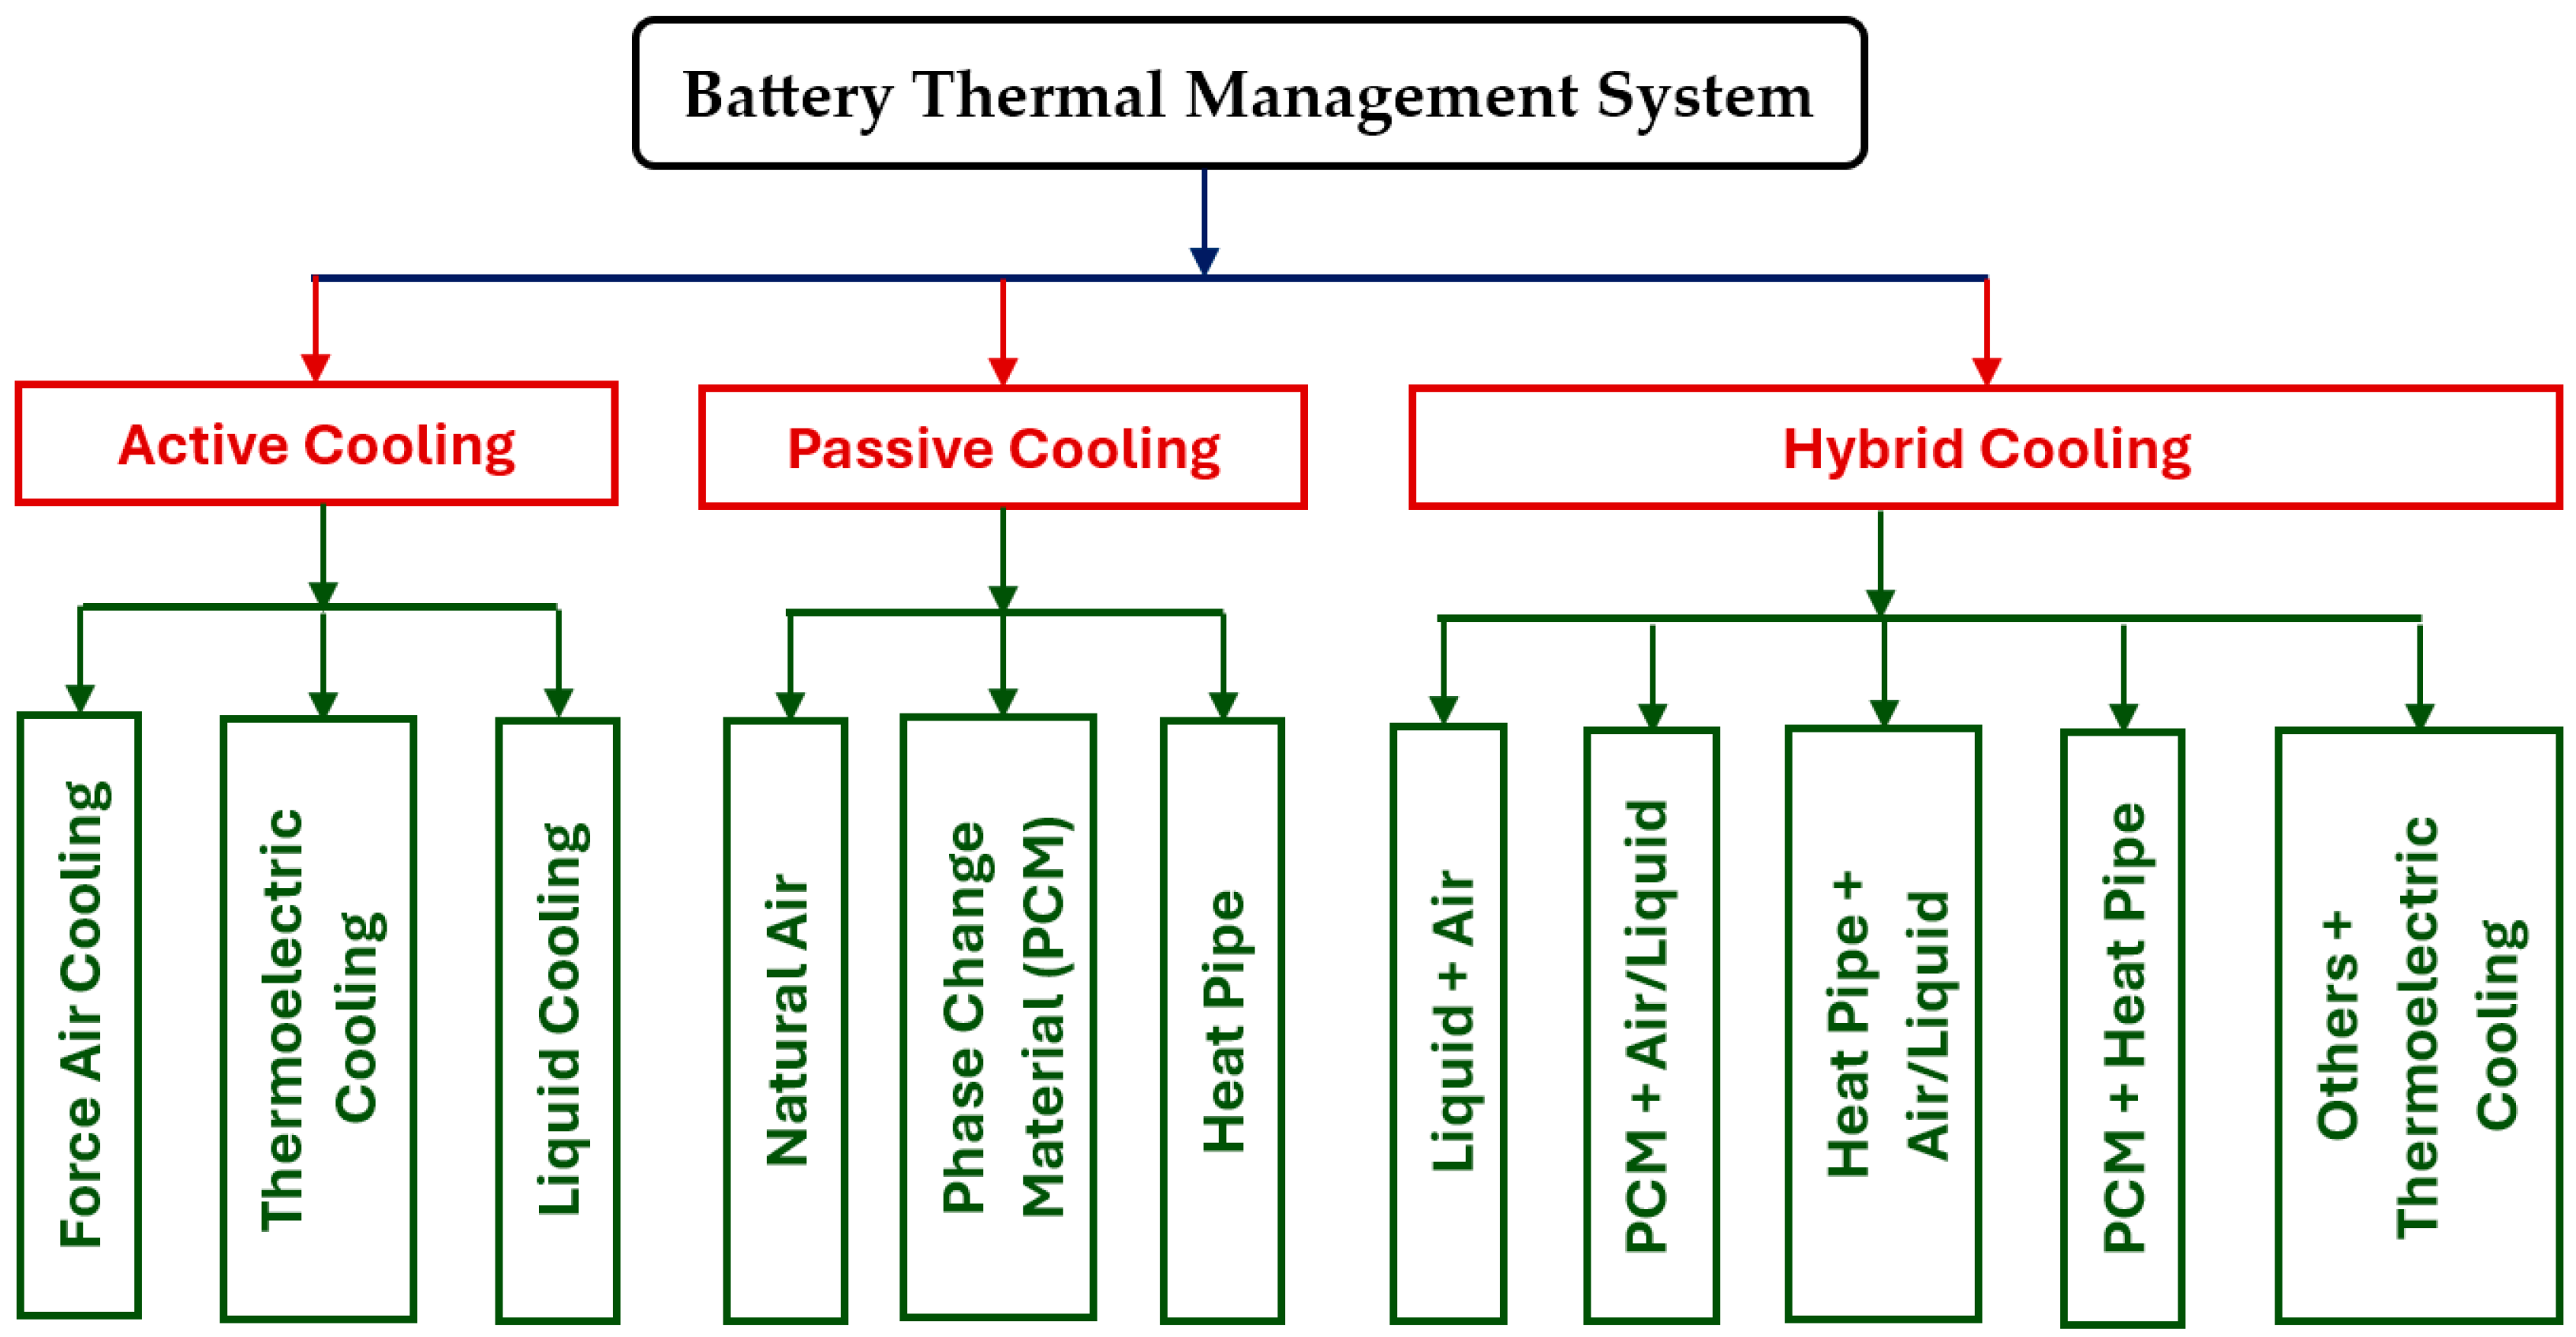
In this work, the 3-battery cell pack-level thermal BP models, including a surface natural air (passive) cooling without a BTMS, a surface natural air cooling with a fluid (water) cooling hybrid BTMS, and a surface forced air cooling plus a fluid (water) cooling composite BTMS, relative simpler battery cooling systems by which the cooling performance can be manipulated or optimized, were created and studied based on ANSYS® Fluent CFD simulations. These BP models consist of four thermally conductive silicon plates (each one placed above, below, and between the batteries), two liquid cooling aluminum plates (with squared cooling channels above and below the thermally conductive silicon plates that are above and below the batteries), and two aluminum shells on both sides of the batteries. The entire system adopts an incomplete encapsulation structure for air passing through and coolant circulation. The BP shell is constructed from aluminum plates, a good conductive material. Figure 2 illustrates the designed geometric model having surface air or forced air and fluid cooling BTMS.

Figure 2.
Perspective view of the BP structure with the designed BTMS.
Since the coolant flow in this designed model is turbulent, the commonly used turbulent model in CFD is the standard k-ε model. This method is based on the concept of eddy viscosity. Based on the fundamentals of the turbulent model of the standard k-ε model (Refs. [47,48,49,50,51,52,53] and Equations (A1)–(A15), refer to Appendix A), the CDF modeling has been established (refer to Appendix A).
2.3. Physical Parameters, and Boundary and Working Conditions in Modeling
The pack-level BP thermal models consist of a 3-battery-cell BP, four thermally conductive silicone plates, two liquid cooling aluminum plates, and two aluminum shells, referring to Figure 2. The entire system adopts an incomplete encapsulation structure for air passing through and liquid circulation. The BP shell is constructed from aluminum plates. The BP model created incorporates three square Li-ion phosphate batteries. Liquid cooling plates with identical parameters are positioned both above and below the battery assembly. 2 mm-thick thermally conductive silicone plates are inserted between the batteries and between the battery assembly and the liquid cooling plates. Both the liquid cooling plate and the BP casing are crafted from aluminum plates. The aluminum plate casing of the liquid cooling plate measures 2 mm in thickness, while the aluminum plate casing of the BP measures 3.85 mm in thickness.
The natural air convection between the housing and the surrounding air can be determined by [52]
where the convection coefficient of the natural air is 5 . represents the thermal conductivity of the shell, and and represent the shell and ambient temperatures, respectively. n indicates the wall normal.
The heat generation rate of Li-ion batteries mainly relies on theoretical calculations. In order to ensure calculation efficiency, reasonable assumptions are made for the physical model in the simulation as follows:
- (1)
- The density, thermal conductivity, and specific heat of each material do not change with temperature and SOC.
- (2)
- The thermal conductivity of battery materials is anisotropic and changes in different directions, while the thermophysical parameters in the same direction are constant.
- (3)
- The heat generation rate of the battery remains unchanged, and the current density is evenly distributed.
- (4)
- Ignore radiation during heat transfer.
- (5)
- The coolant (water) is considered an incompressible Newtonian fluid. Since heat conduction plays a major role in the BTMS heat transfer process, its natural convection is ignored.
- (6)
- Based on the principle of a simplified model, the battery only retains the structural dimensions and the function of heating part of the battery core by ignoring the details of the positive and negative electrode tabs and busbar.
The specific physical parameters of the BP without a BTMS (only having natural air passive cooling), with a hybrid BTMS (having natural air passive cooling and a water coolant active cooling), and with a composite BTMS (having forced air active cooling and a water coolant active cooling) are listed in Table 1, Table 2 and Table 3 [54,55].

Table 1.
Physical parameters of the BP without BTMS (only natural air passive cooling).
Table 2.
Physical parameters of the BP with hybrid BTMS (having natural air and water cooling).
Table 3.
Physical parameters of the BP with BTMS having forced air and water coolant-active cooling.
The effective convective coefficient, heff, regarding the overall cooling effect of the BP surface, can be calculated through the ANSYS® fluent program based on the following equation [51]:
where Tref and Twall are the reference temperature defined as room temperature of 25 °C and the wall temperature, respectively. q is the heat flux.
The selected battery in this case study is the EVE LF50F Lithium Energy (Evlithium Limited, Zaozhuang, China) square lithium iron phosphate battery. The battery has a long cycle life, low battery internal resistance, and high discharge rate. It has been widely used in the EV market and industrial energy storage. Table 4 lists the battery’s physical parameters [55].
Table 4.
Physical parameters of the battery LF50F.
The basis of temperature-field simulation of Li-ion BP is the thermophysical parameters of battery materials. Accurate thermophysical parameters are of great significance to the accuracy of simulation results. In practical applications, accurately obtaining the heat generation rate of the battery during charging and discharging operations is a challenge. There are two ways to solve the problem: experimental measurement and theoretical calculation. This work mainly uses the battery heat generation rate model proposed by Bernardi [56]. The battery heat generation rate is calculated and to be used in the CFD simulations as follows:
This model divides the battery-generated heat into two categories: Joule heat and reversible reaction heat. I is the charge and discharge current, which is negative during charging and positive during discharging; V represents the battery volume; U0 and U represent the open circuit voltage and the battery terminal voltage, respectively; is the temperature gradient of the open circuit voltage, generally a constant 0.5 Mv/K; and T is the battery temperature. Since the internal resistance of the battery R does not change much when the battery is charging or discharging, therefore, in this work, an R value of 2.0 mΩ was selected [55]. Because U0 − U = IR, then Equation (3) can be rewritten as follows:
Table 5 lists the heat generation rate of a single battery cell at different discharge rates, calculated according to Equation (3).
Table 5.
Heat generation rates of a single battery cell at various discharge rates.
In this study, the BTMS design primarily emphasizes heat dissipation and temperature distributions, i.e., average temperature, maximum temperature, and minimum temperature, in the BP. As a result, water-ethylene glycol, which offers superior thermal insulation but poor thermal conductivity, is not chosen as the coolant. Additionally, since the BP is designed as a non-sealed structure, it does not utilize insulating thermal oil commonly found in immersion cooling systems. Instead, water is selected as the cooling medium. The liquid cooling plate is designed with a multi-channel configuration featuring a five-water-inlet and five-water-outlet layout above and below the BP, as shown in Figure 2.
This simulation involved the coupled modeling of the heat transfer between fluid and solid. The water coolant flows in the pipeline, and the viscosity model needs to be determined. The flow state is determined according to the Reynolds number Re, where Re < 2300 is a laminar flow, Re > 4000 is a turbulent flow, and Re between 2300 and 4000 is a transitional flow. The Reynolds number Re is calculated by [57]
where µ, ρ, and v are the fluid viscosity coefficient, the fluid density, and the fluid flow rate, respectively. D is the flow path equivalent diameter.
The liquid cooling plates designed in this work are rectangular plates, and the shear stress is unevenly distributed around the interface. Therefore, the equivalent diameter of the cooling plate interface can be converted as [58]
where Ac and Pw are the cross-sectional area and the wetting perimeter of the liquid cooling plate, respectively. The maximum flow rate of common vehicle water pumps on the market is 10 L/min–40 L/min [59,60]. In this model, as shown in Figure 2, if using a 40 L/min automotive water pump, the maximum coolant velocity is 0.552 m/s, so it is reasonable to select a flow rate of 0.5 m/s at the coolant (water) inlet of the cooling plate as a basic parameter in the modeling. The calculated Reynolds number Re is ranging from 3083 to 7706 in this work. In the modeling, if a higher flow rate is used, a higher Reynolds number will be. Therefore, the model is primarily a turbulence model, which corresponds to the worst cooling performance scenario. If a lower flow rate water pump is adopted, the fluid flow model can be a laminar flow or a transitional flow model.
In this study, the thermal conduction within the silicone thermal conductive plate and the liquid cooling plate (the same as the silicone thermal conductive plate) were considered, which is calculated as [53]
where ρ, c, and k represent the density, the specific heat, and the thermal conductivity of the silicone plate, respectively.
2.4. Mesh Convergence Study
In solid mechanics or CFD simulations based on finite element analysis, finer meshes usually produce solutions with higher accuracy. However, as the meshes become finer, the computation time increases. Therefore, it needs to determine a proper mesh size (or total element number) with a satisfactory balance between accuracy and computational resources. One common approach is to perform a mesh-independent study, also called a mesh convergence study. This process includes the following basic steps:
- Create a mesh using a minimum or reasonable number of elements and reasonable element size and analyze a specific convergence output variable or variables, such as maximum displacement of the problem in the solid mechanics problems or maximum, minimum, or average temperature in the thermal problem in this study.
- Recreate the mesh with a denser element distribution or finer elements, re-analyze the specific output variable/s, and compare the results with those of the previous solutions.
- Keep increasing the mesh density and re-analyzing the modeling results until the specific output variable/s from the modeling result converge satisfactorily.
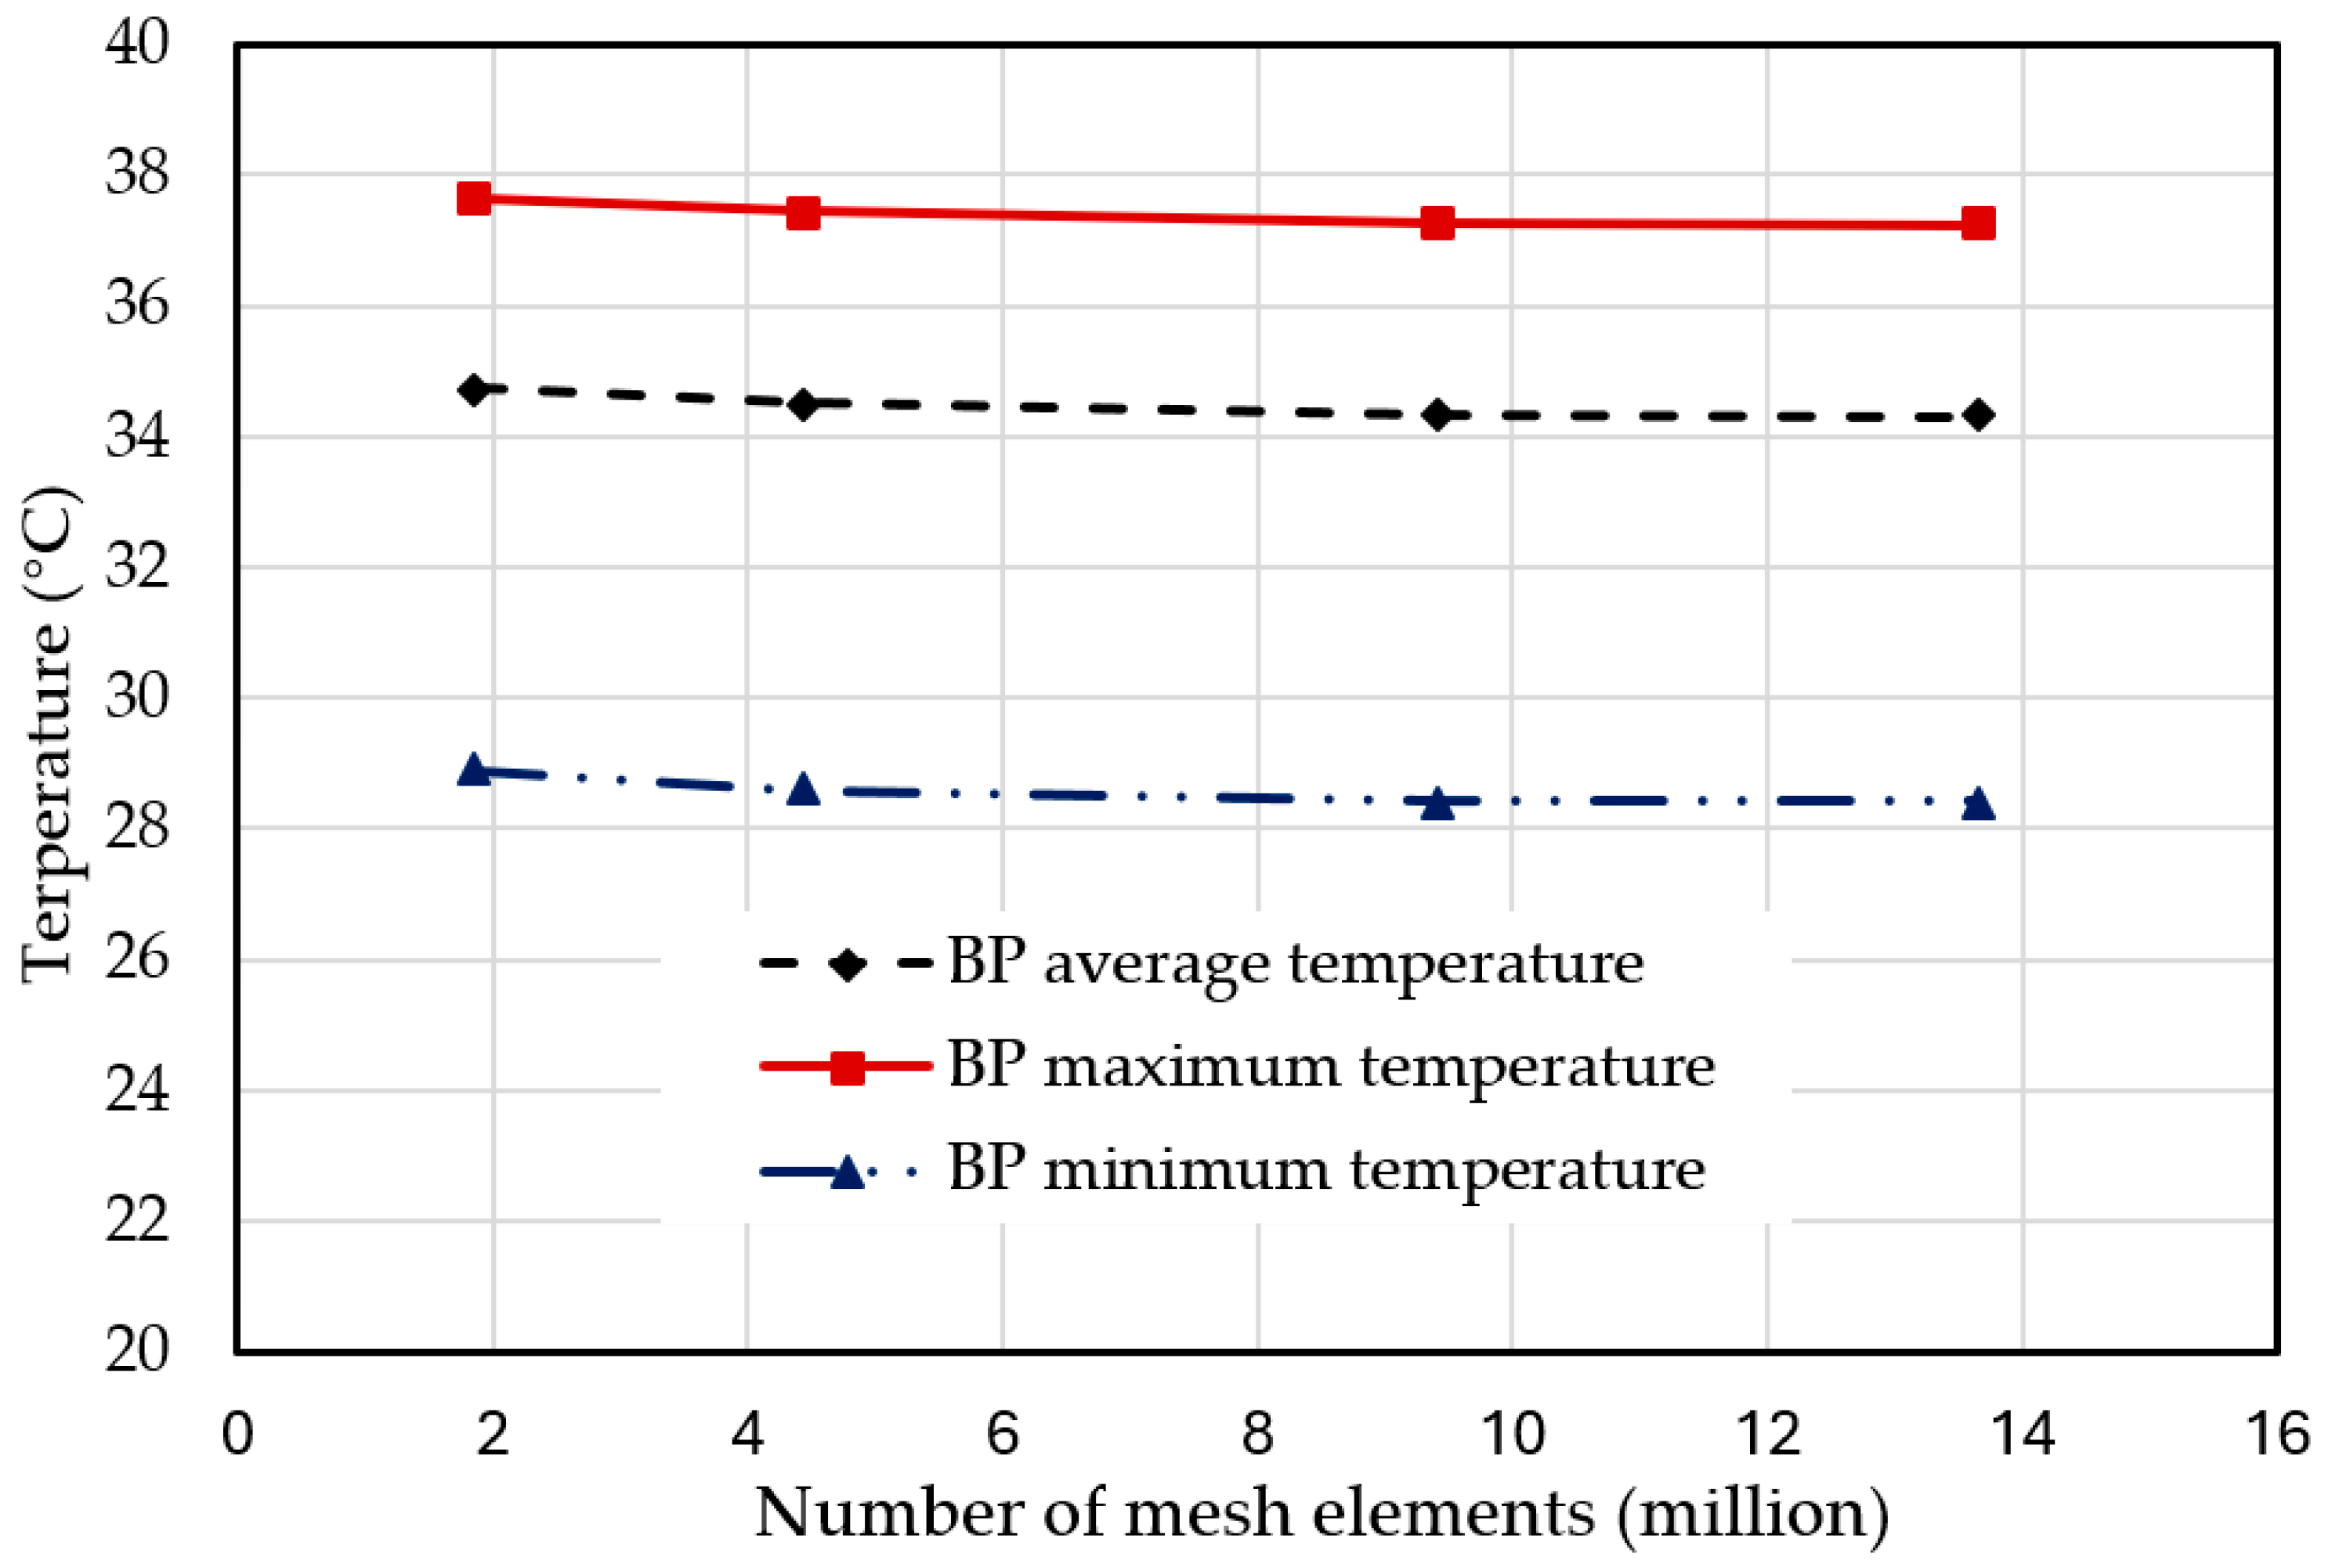
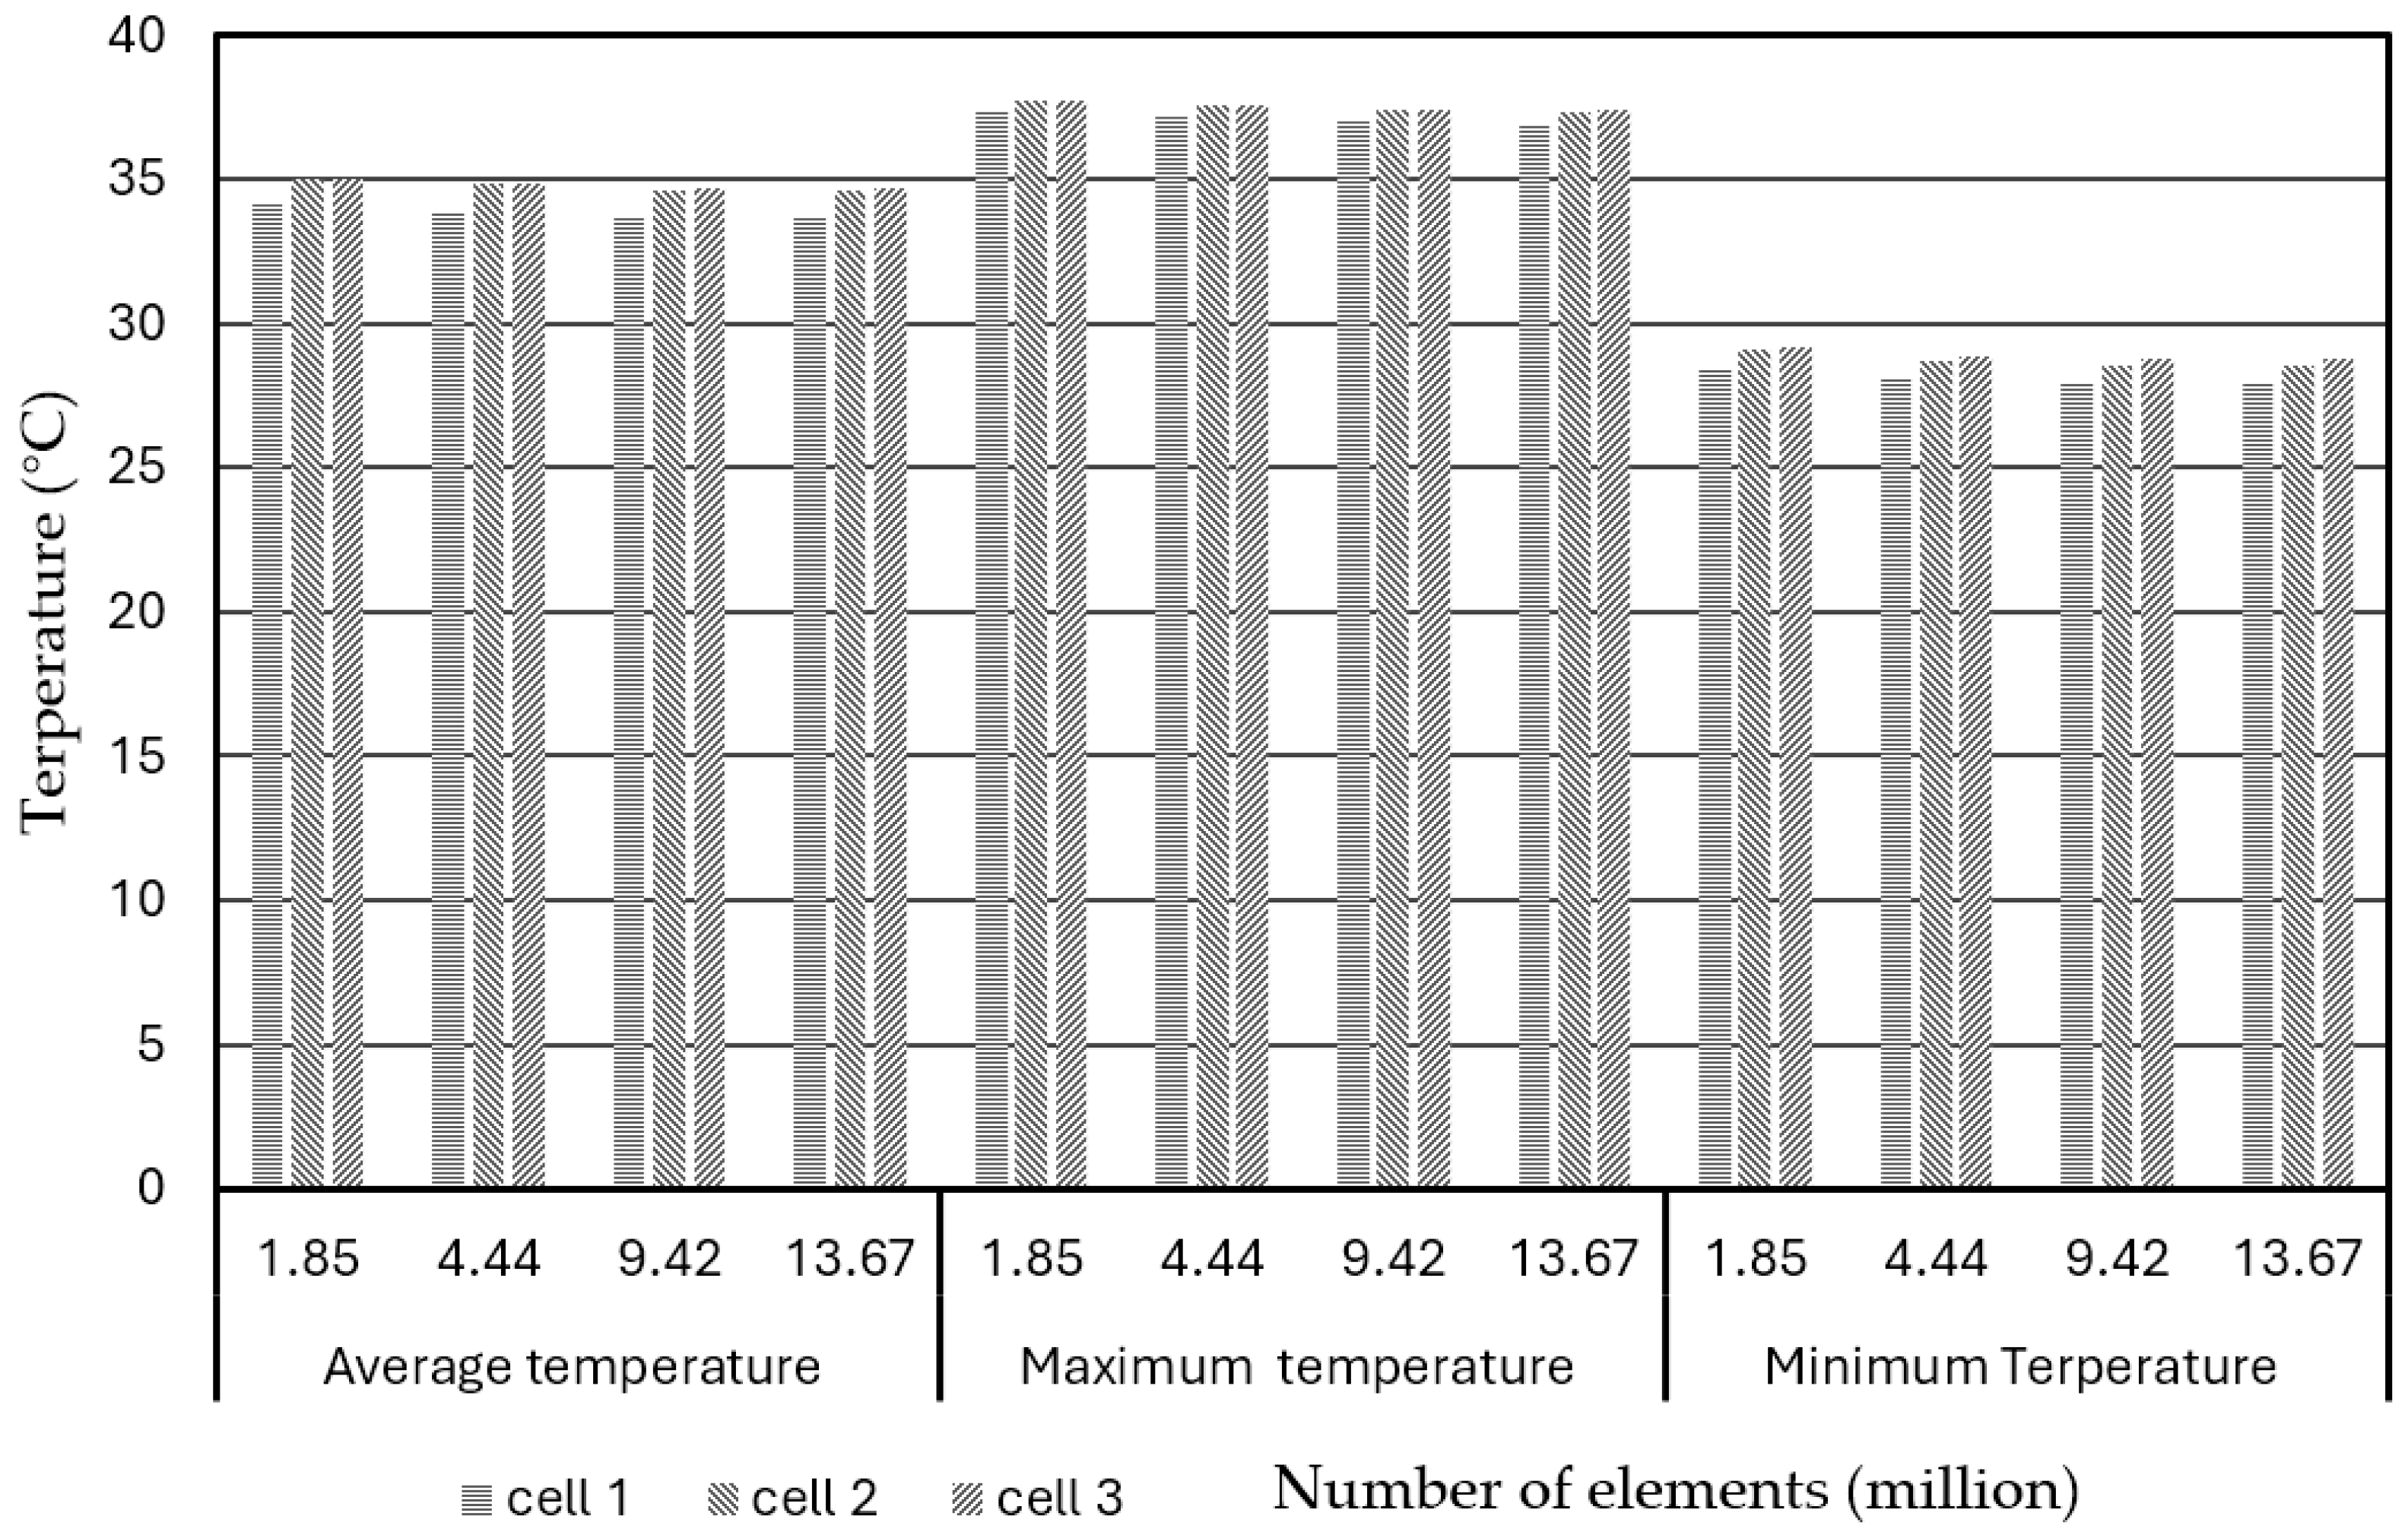
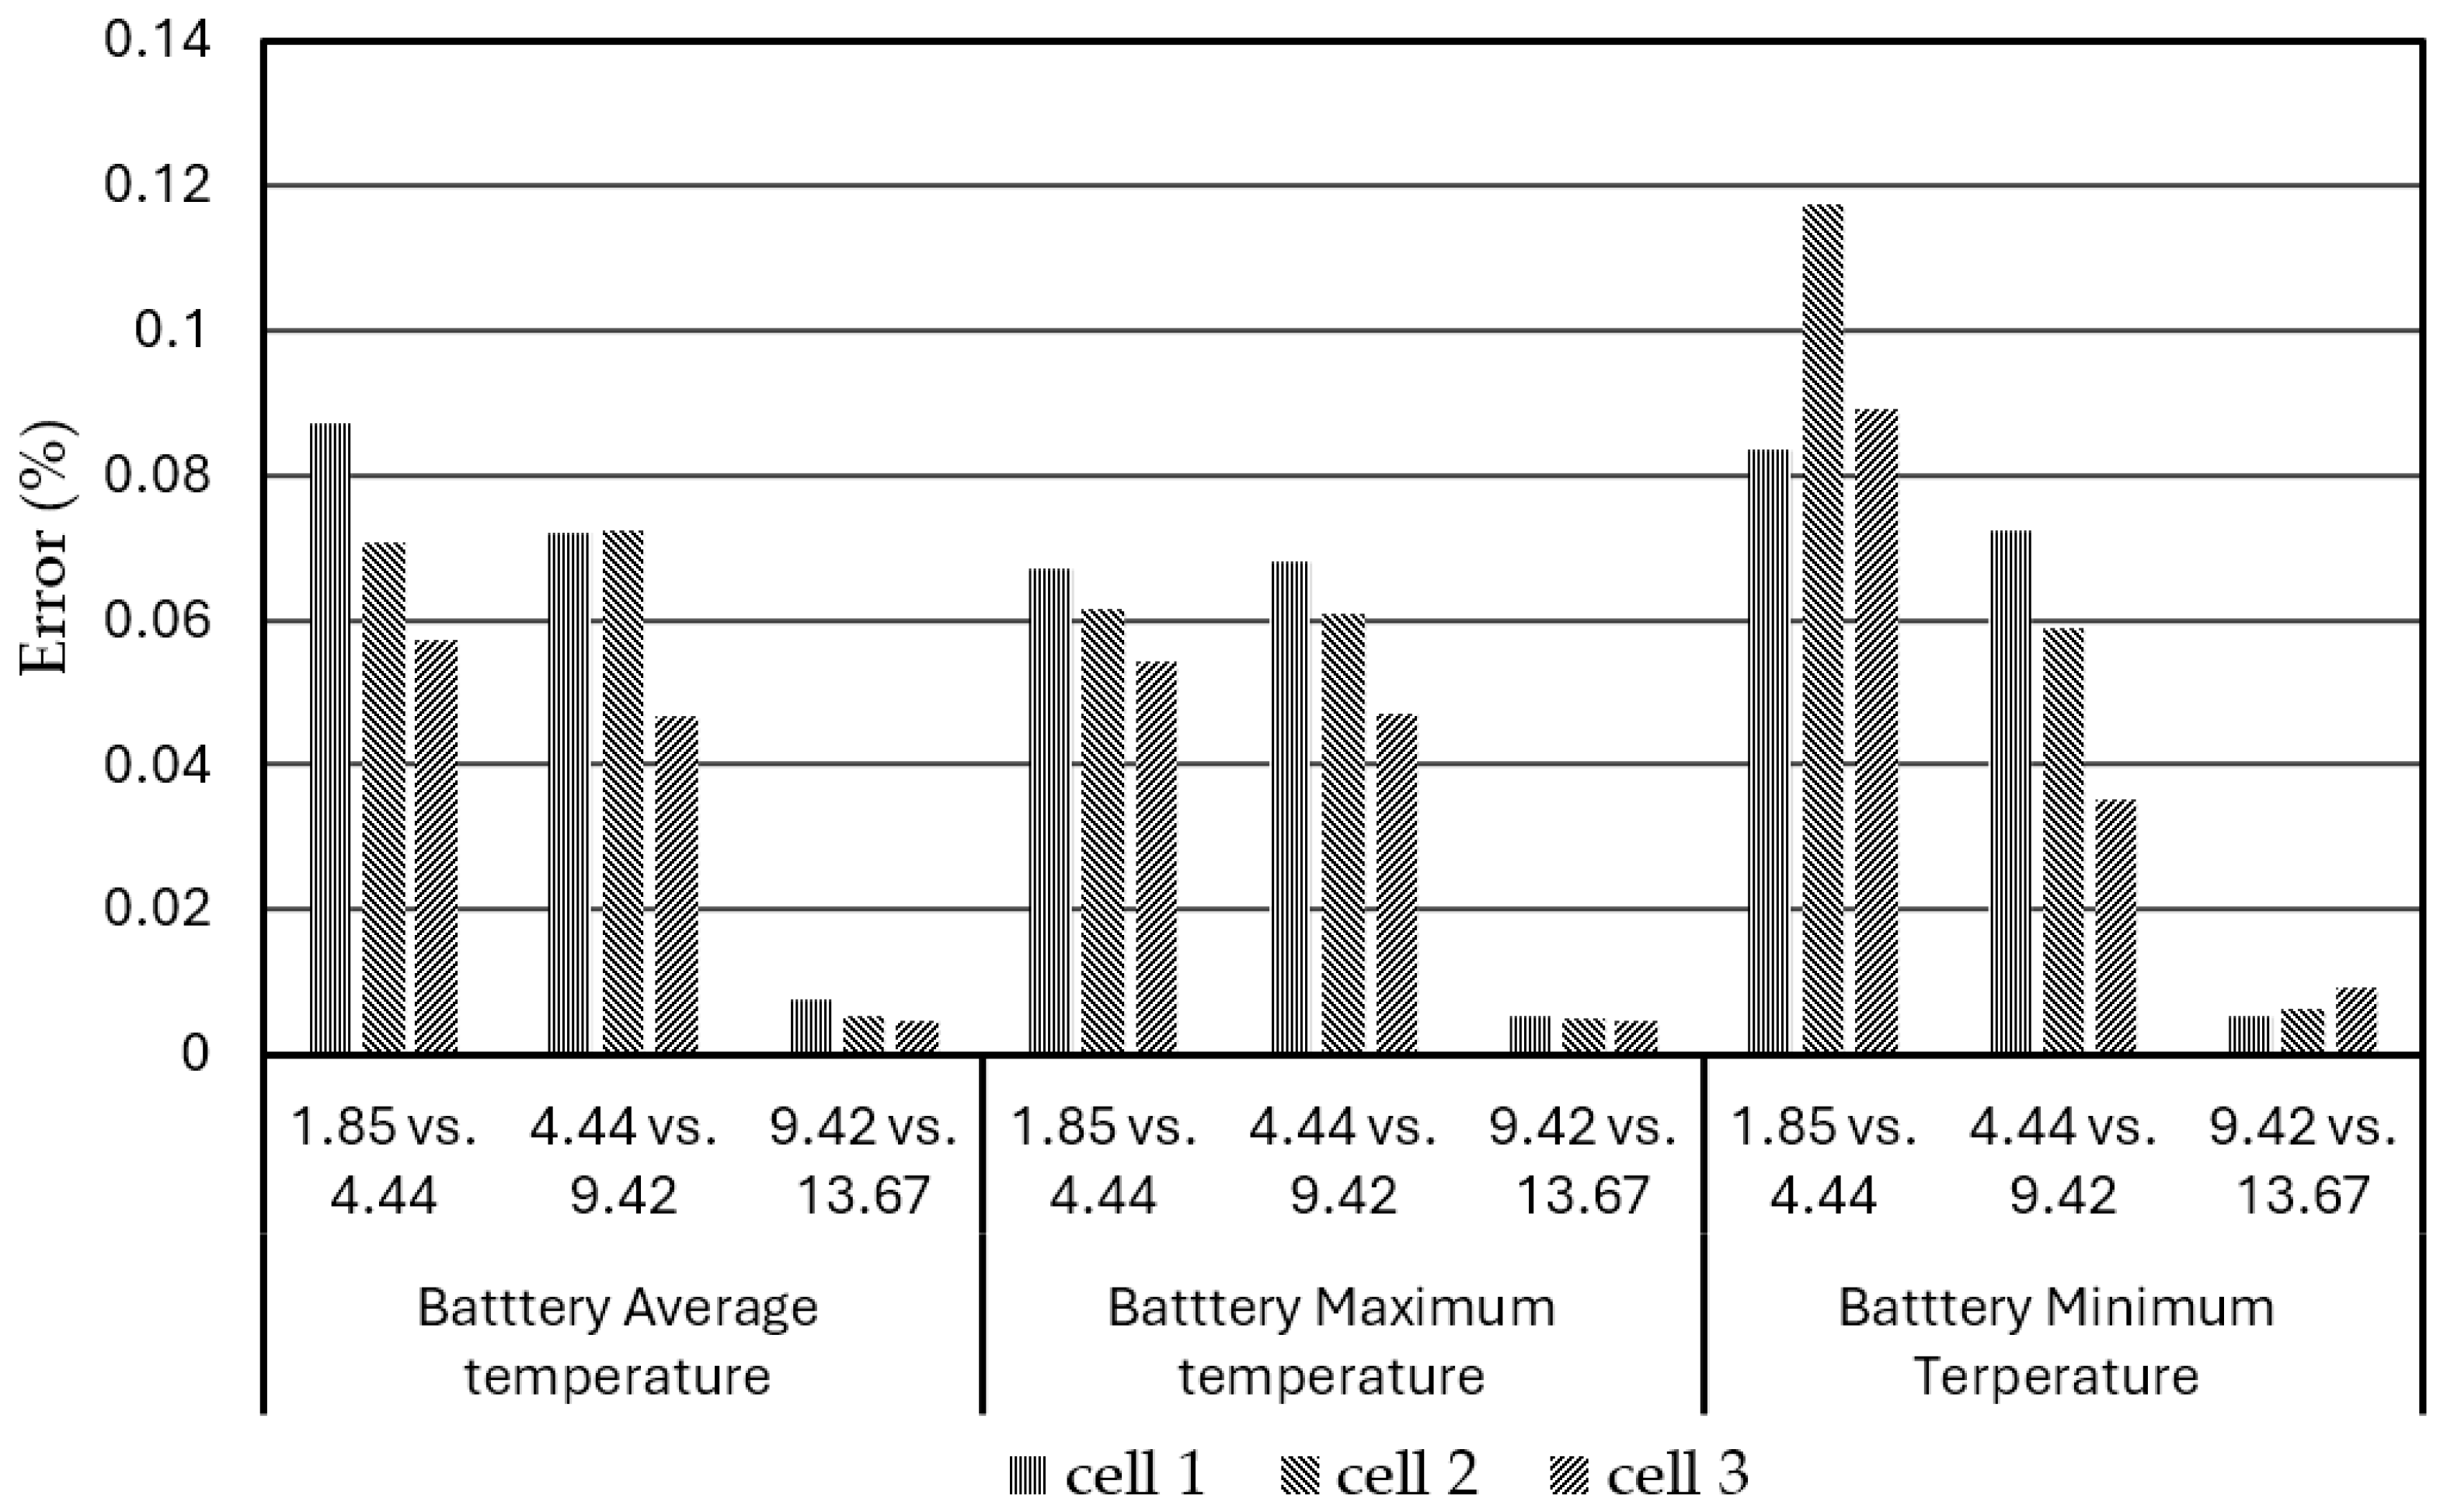
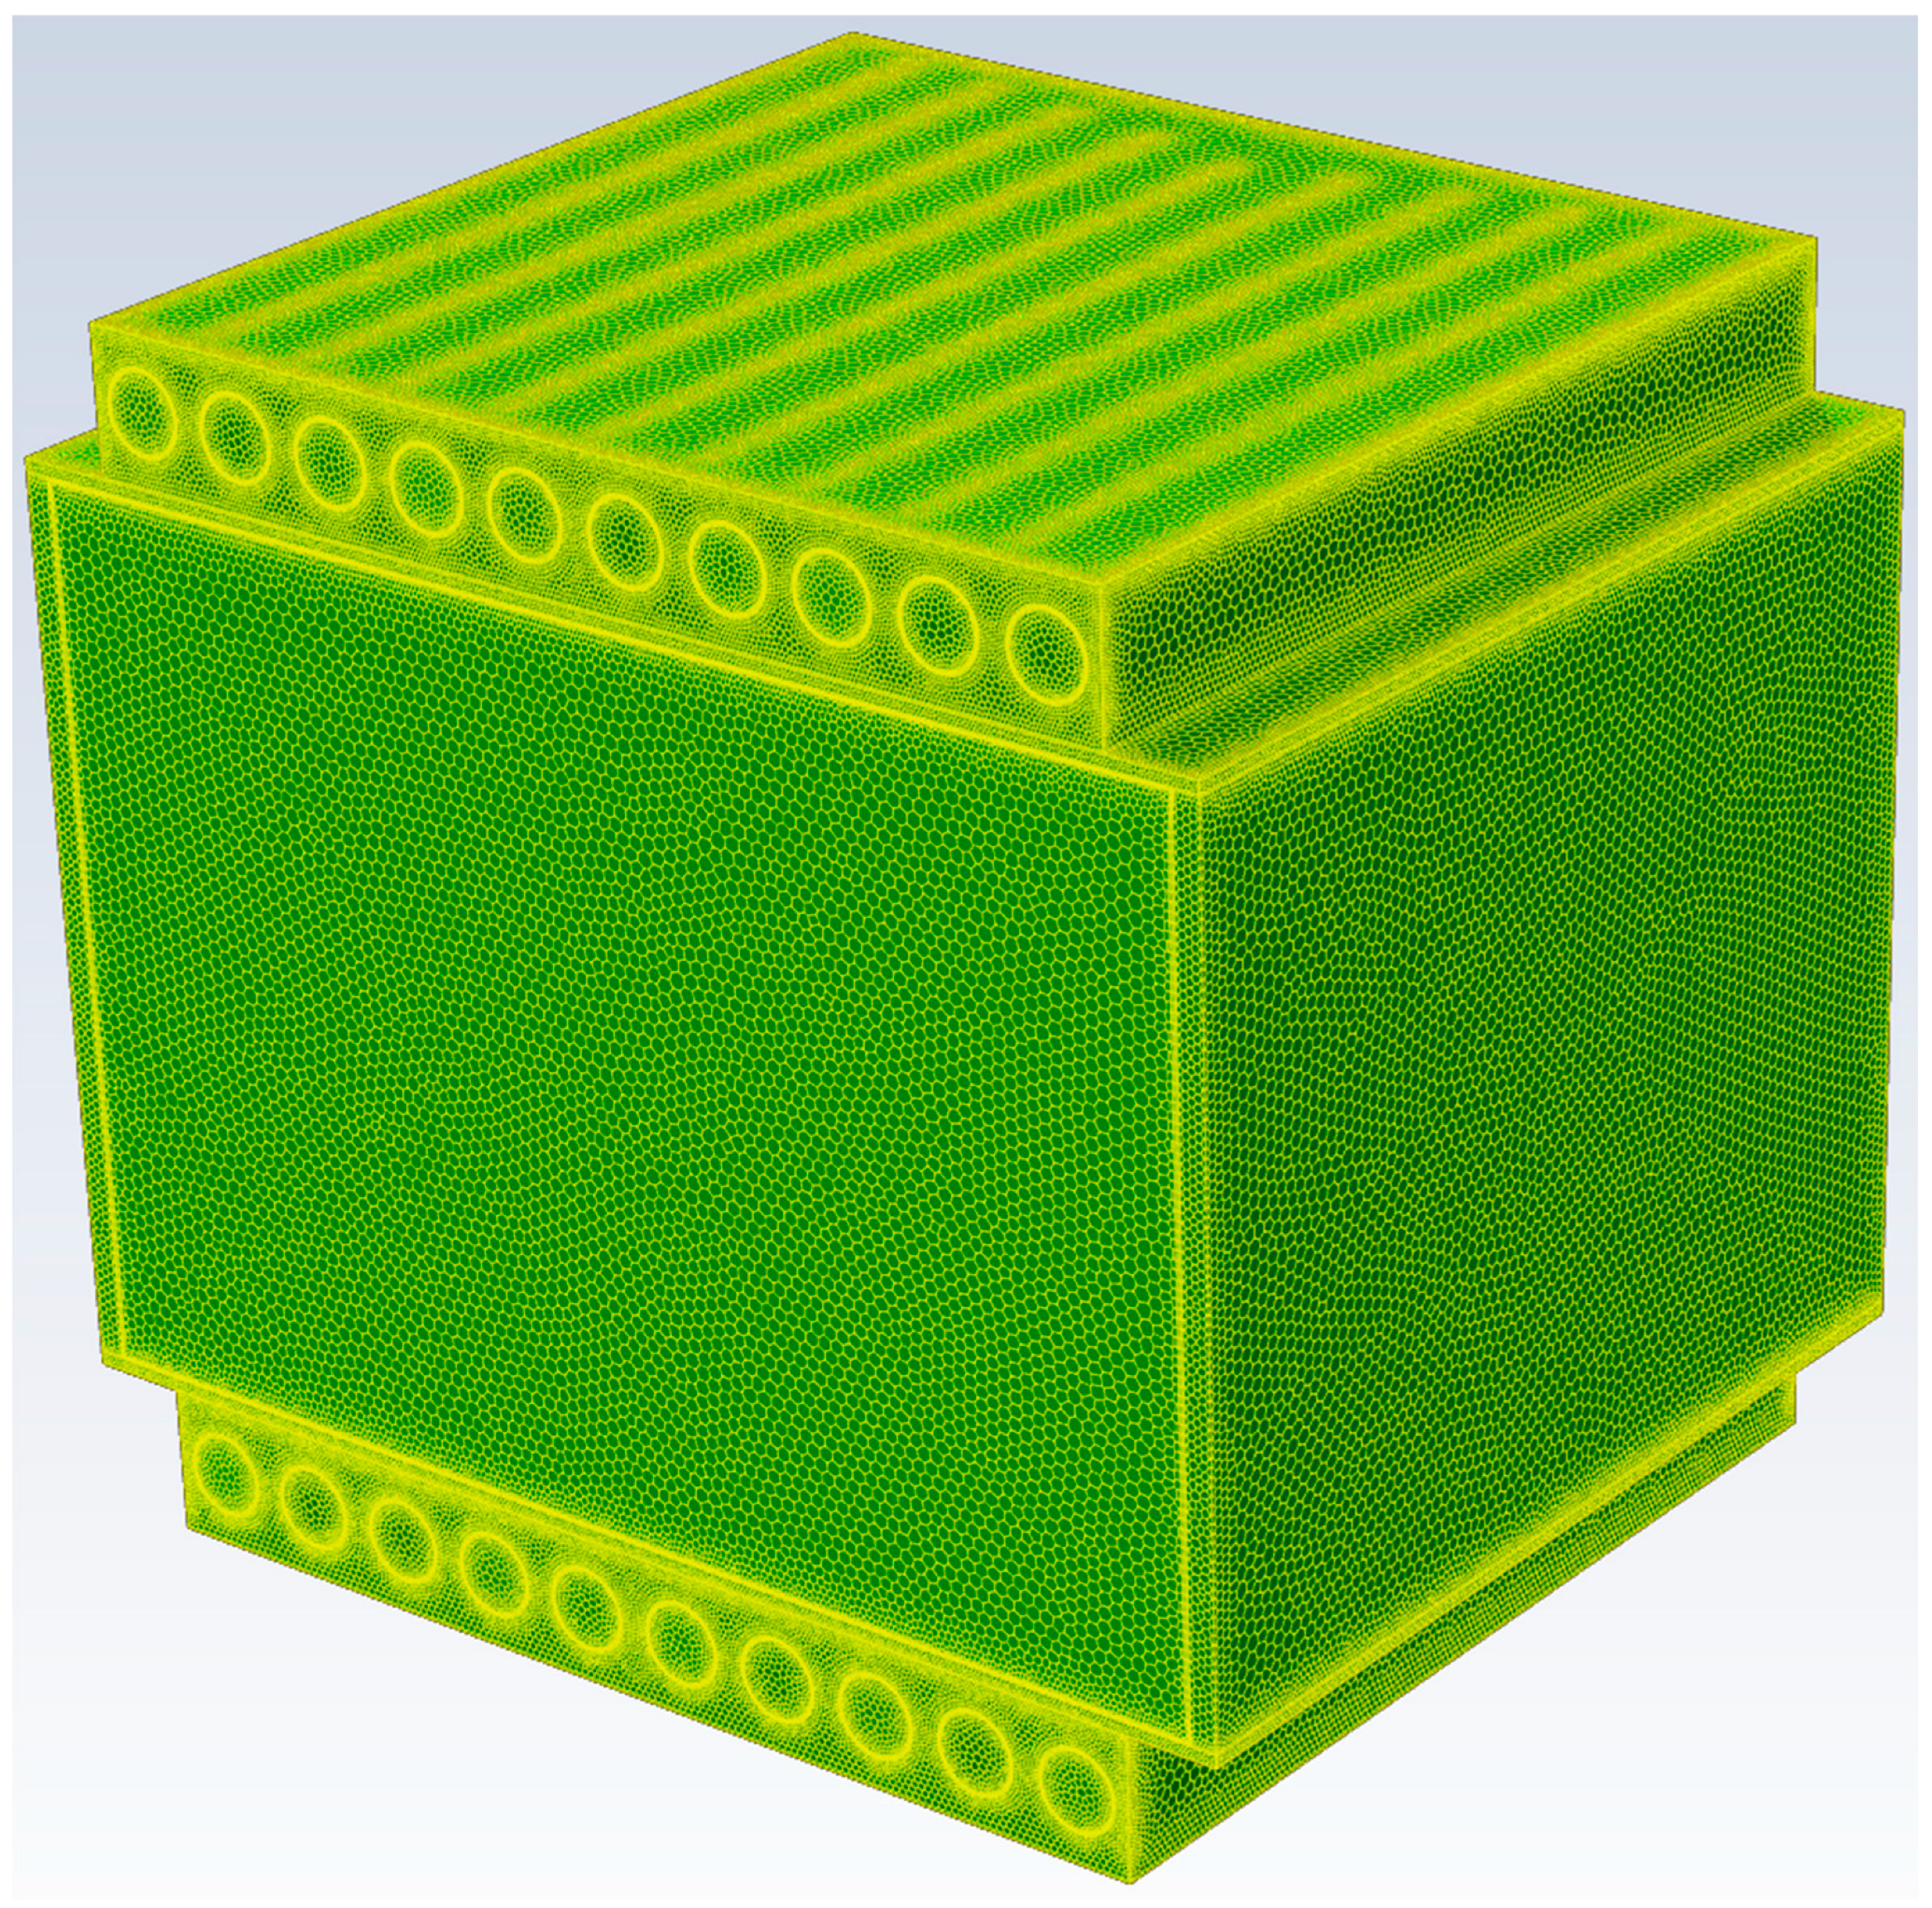
In this study, a poly-hexagonal core shape for the mesh is available in ANSYS® Fluent and was adopted in both the prismatic battery and coolant flow systems, which are better suited for accommodating prismatic and vertical boundaries, and it exhibits greater sensitivity to local changes. In order to conduct the mesh convergence study, firstly, it was decided to use the designed battery model for mesh independence study, i.e., a pack-level BP model with 3-battery cells with a composite BTMS (under forced air: a flow rate of 1 m/s and an initial temperature of 25 °C; and water cooling: a velocity of 0.5 m/s and an initial temperature of 25 °C) was meshed and simulated using different numbers of elements or different element sizes. Figure 3 shows the curves of the output variables, such as average, maximum, and minimum temperatures in the BPs, varying with the number of elements (1.85, 4.44, 9.42, and 13.67 million) under a discharge rate of 3 C at an operation time of 1200 s. Figure 4 shows the bar chart plot of the average, maximum, and minimum temperatures of the different battery cells (cell 1, cell 2, and cell 3) in the BPs, varying with the numbers of elements under a discharge rate of 3 C at an operation time of 1200 s. Figure 5 shows the relative percent errors of the simulated average, maximum, and minimum temperatures in the BPs, varying with the numbers of elements under a discharge rate of 3 C at an operation time of 1200 s. When the number of element exceeds 4.44 million, the relative errors of the specific output temperatures of the BPs are less than 0.08%. Therefore, the pack-level BP with a composite BTMS model with 4.44 million elements was adopted, which has sufficient accuracy for the simulations. The 3D view of the meshed BP with a composite BTMS model with 4.44 million elements is shown in Figure 6.
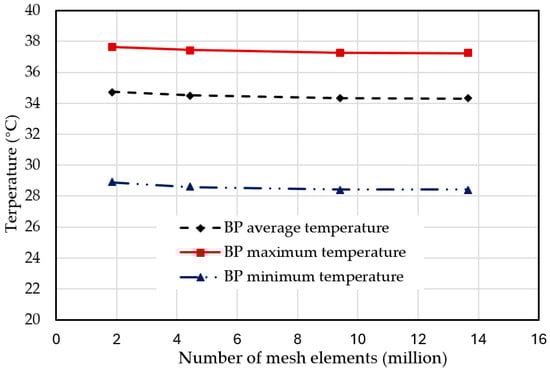
Figure 3.
Mesh convergence study on temperatures in a 3-battery-cell BP with a composite BTMS (forced air: a flow rate of 1 m/s and an initial temperature of 25 °C; and water cooling: a flow rate of 0.5 m/s and an initial temperature of 25 °C), vs. number of elements at a discharge rate of 3 C and operation time of 1200 s.
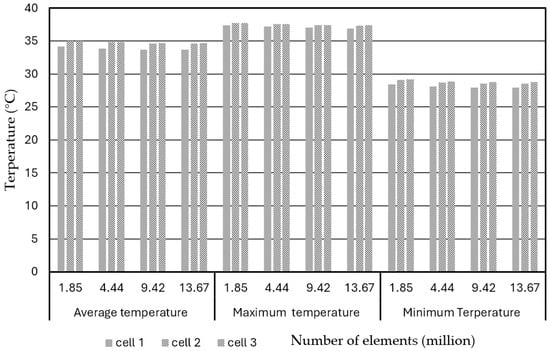
Figure 4.
Mesh convergence study on temperatures in different battery cells of a 3-battery-cell BP with a composite BTMS (forced air: a flow rate of 1 m/s and an initial temperature of 25 °C, and water cooling: a flow rate of 0.5 m/s and an initial temperature of 25 °C), vs. number of elements at a discharge rate of 3 C and operation time of 1200 s.
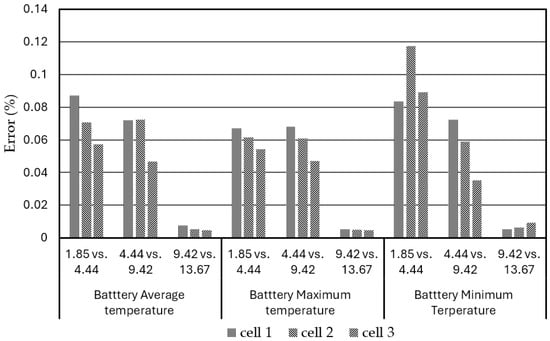
Figure 5.
Mesh convergence study on relative percentage error in temperatures in different battery cells of a 3-battery-cell BP with a composite BTMS (forced air: a flow rate of 1 m/s and an initial temperature of 25 °C; and water cooling: a flow rate of 0.5 m/s and an initial temperature of 25 °C), vs. number of elements at a discharge rate of 3 C and operation time of 1200 s.
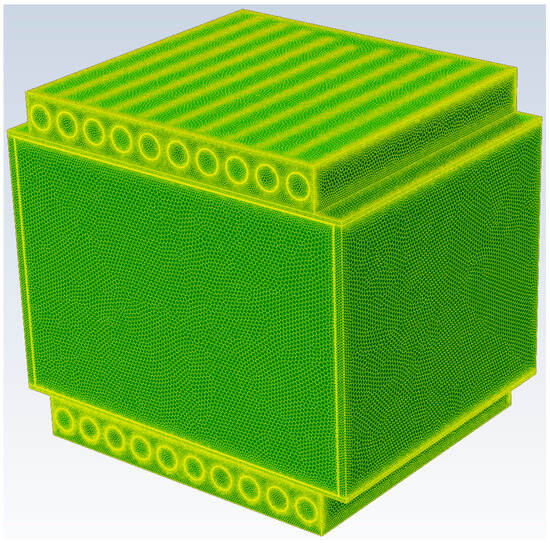
Figure 6.
Three-dimensional view of the 3-battery-cell BP model meshed with 4.44 million elements.
3. Results and Discussion
When an EV maintains a constant speed, the discharge rate of its individual battery typically remains stable, resulting in a consistent temperature change within the battery. However, various factors, such as road conditions, traffic congestion, and individual driving habits, can lead to irregular driving patterns. During scenarios like ascending hills or rapid acceleration, the battery’s discharge rate experiences significant fluctuations over short durations, consequently affecting its temperature dynamics. Therefore, this study adopts three-battery-cell BP models to simulate and discuss several cases under various boundary conditions and working parameters, such as cooling methods, discharge rates, operation times, coolant flow rates and initial temperatures, forced air flow rates, and initial air temperatures. The simulation scenarios include (1) the BP thermal performance without a BTMS (natural air convection cooling only); (2) the effect of coolant (water) in a hybrid BTMS on the BP thermal performance; (3) the effect of discharge rate on the BP thermal performance; and (4) the effect of forced air cooling in a composite BTMS on the BP thermal performance. (5) Finally, the thermal performance of the three-battery-cell BP used as a battery module (BM) installed in a larger BP system was evaluated based on CFD, considering the different BM positions located in the larger BP system (at the corner and at the middle edge of the BP or independently placed).
3.1. BP Thermal Performance Without BTMS
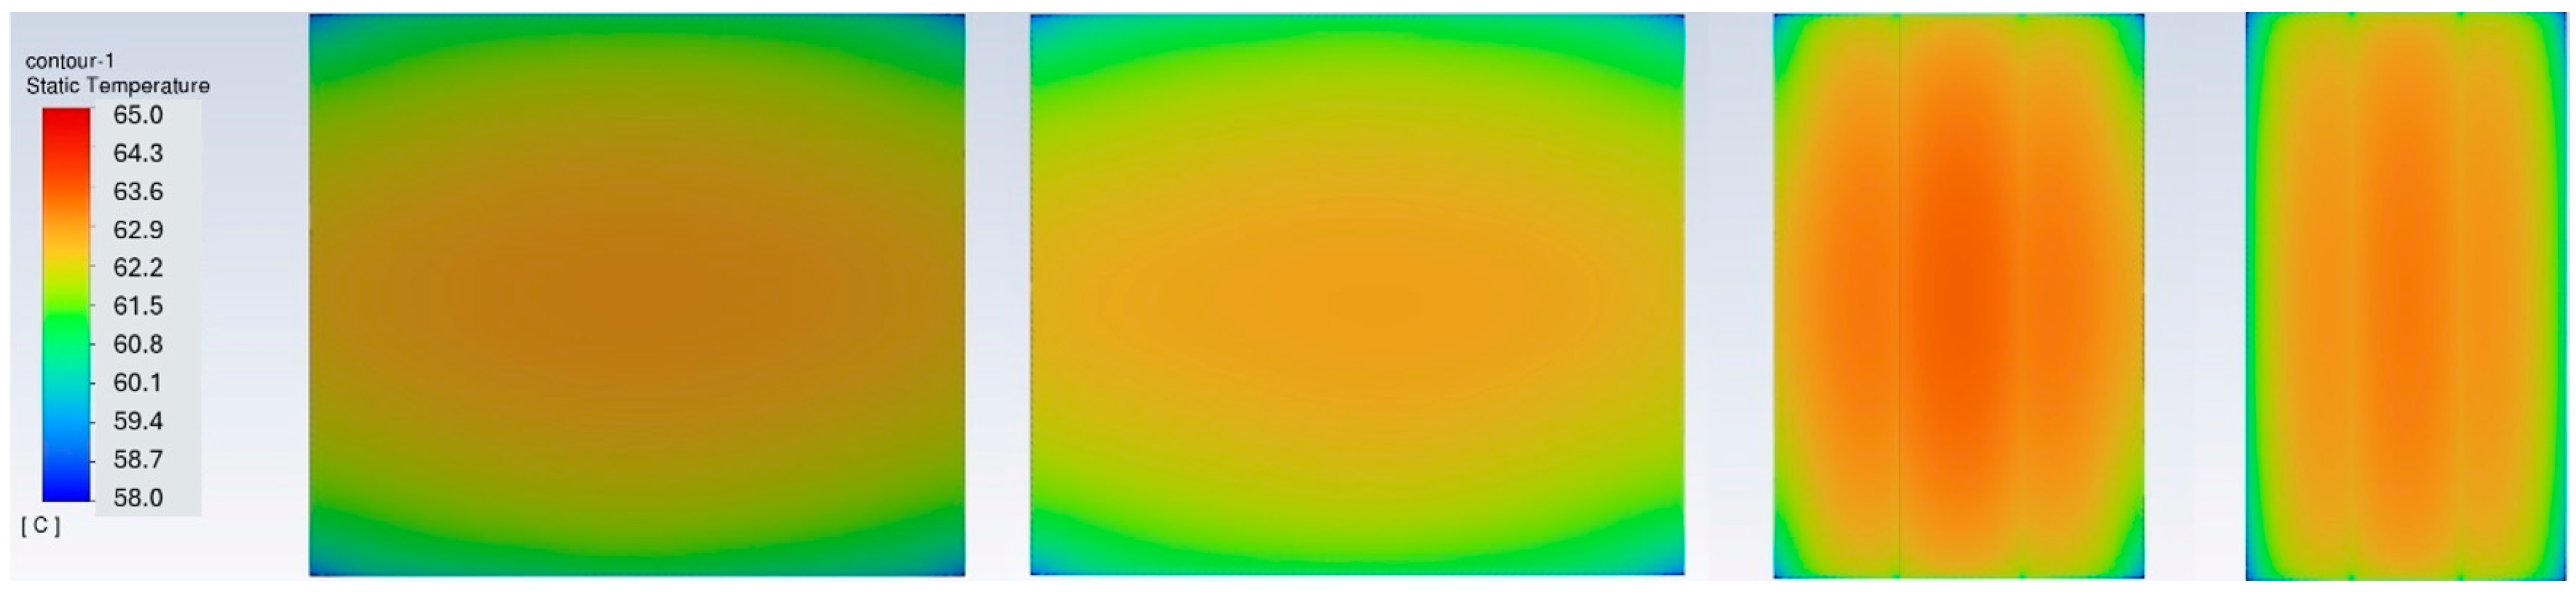
In this case, the BP consists of three battery cells in each group without a BTMS (heat exchanging with the surrounding environment through natural air convection—passive cooling), and the temperature distributions in the BP under an extreme discharge rate of 3 C were simulated and analyzed. According to Table 5, the discharge operation time was taken up to 1200 s, and the initial temperature in the model was set to 25 °C. The thermal properties of the model refer to Table 1. Figure 7 shows the surface temperature distribution of the BP without a BTMS at a discharge rate of 3 C and an operation time of 1200 s. Usually, due to the worst heat dissipation effect, the maximum temperature appears in the middle of the BP, and the minimum temperature appears at the corners of the BP. The average, maximum, and minimum temperatures when viewed from the front, rear, side, and top are quite close and symmetric. The minimum and maximum temperatures are 59.8 °C and 63.6 °C, respectively, much higher than the ROTR (+20 °C ~+35 °C). The maximum temperature difference is less than 4 °C, indicating that under this natural air passive cooling condition, the heat dissipation capability is not effective.
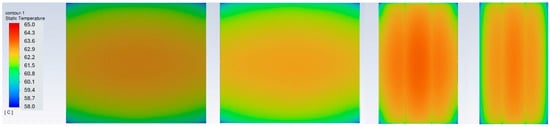
Figure 7.
Temperature distribution in a three-battery-cell BP surface without a BTMS (natural air convection only) at a discharge rate of 3 C and operation time of 1200 s (from left to right: front view, rear view, side view, and top view).
3.2. Effect of a Hybrid BTMS (Water Cooling) on BP Thermal Performance
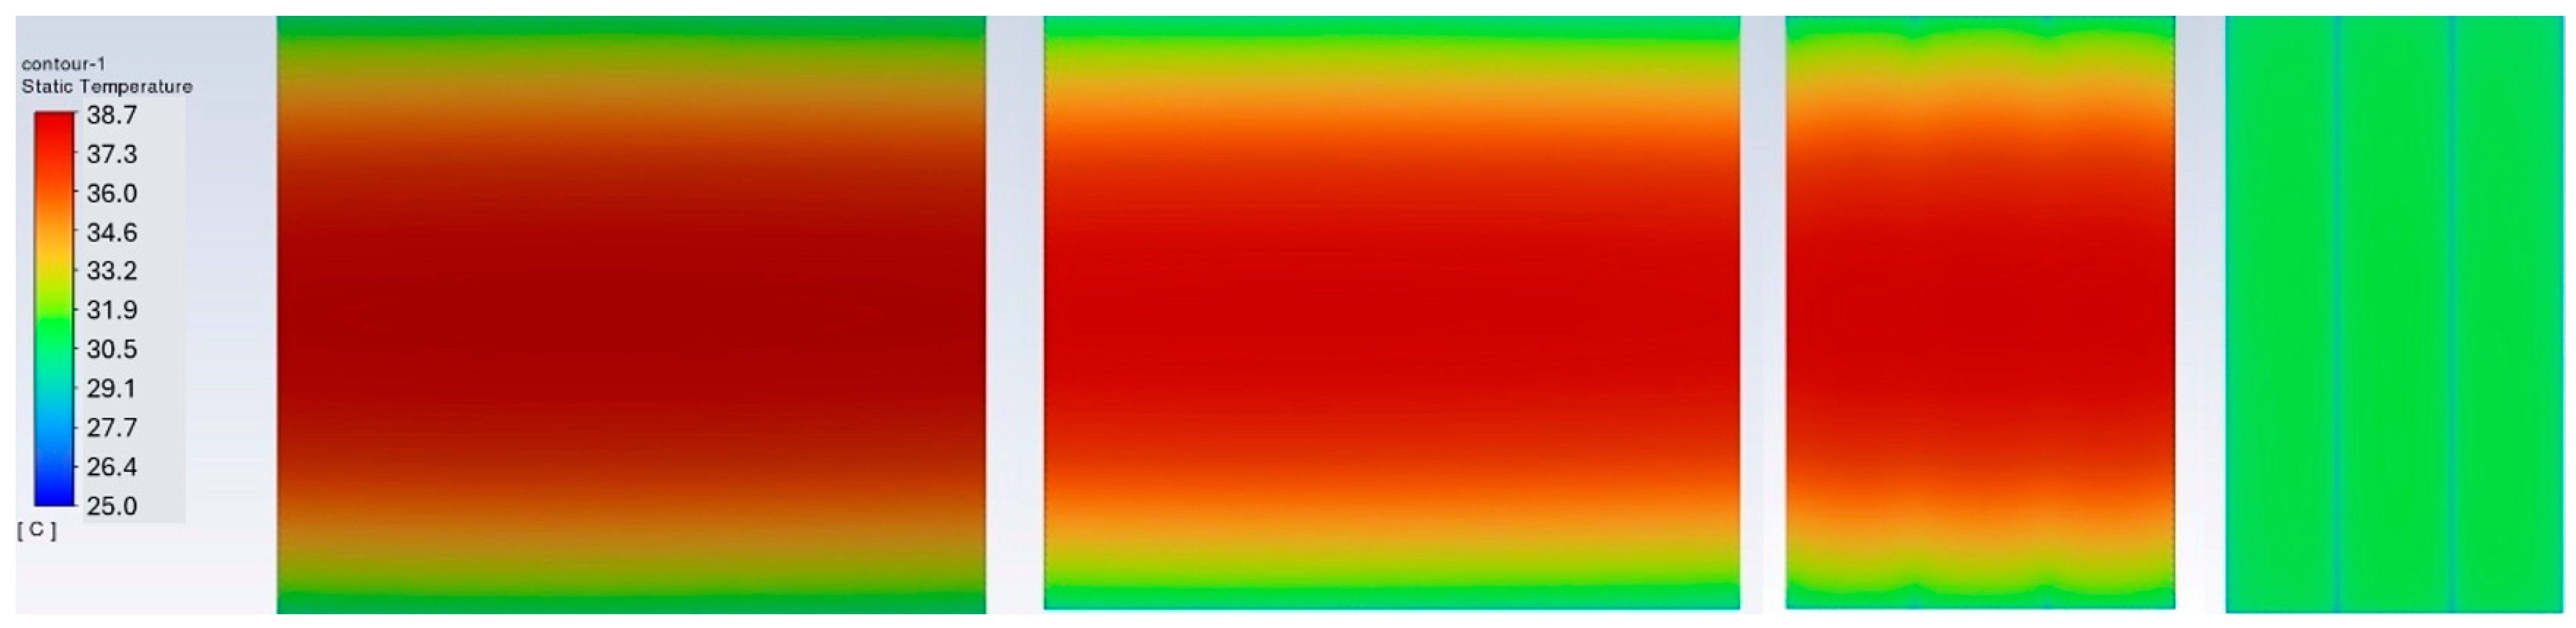
In this case, the BP model is the same as adopted in Section 3.1. For comparison, adding a BP model with a hybrid BTMS, i.e., the natural air convection plus water coolant—active cooling with an initial water flow rate of 0.5 m/s and an initial temperature of 25 °C. The temperature distributions in the BP under an extreme discharge rate of 3 C were simulated and analyzed. The thermal properties of the model are referred to in Table 1 and Table 2. According to Table 5, the discharge operation time was taken up to 1200 s, and the model’s initial temperature was set to 25 °C, and other conditions remain unchanged. Therefore, the effect of the hybrid BTMS with defined conditions on the BP thermal performance was simulated and evaluated. Figure 8 shows the temperature distribution in the BP with a hybrid BTMS at a discharge rate of 3 C and an operation time of 1200 s. The maximum temperature rises to about 38.7 °C, much lower than the case without a BTMS (24.9 °C lower) and slightly above the ROTR (+20 °C ~+35 °C).

Figure 8.
Temperature distribution in a BP surface with a hybrid BTMS at a discharge rate of 3 C and operation time of 1200 s (from left to right: front view, rear view, side view, and top view).
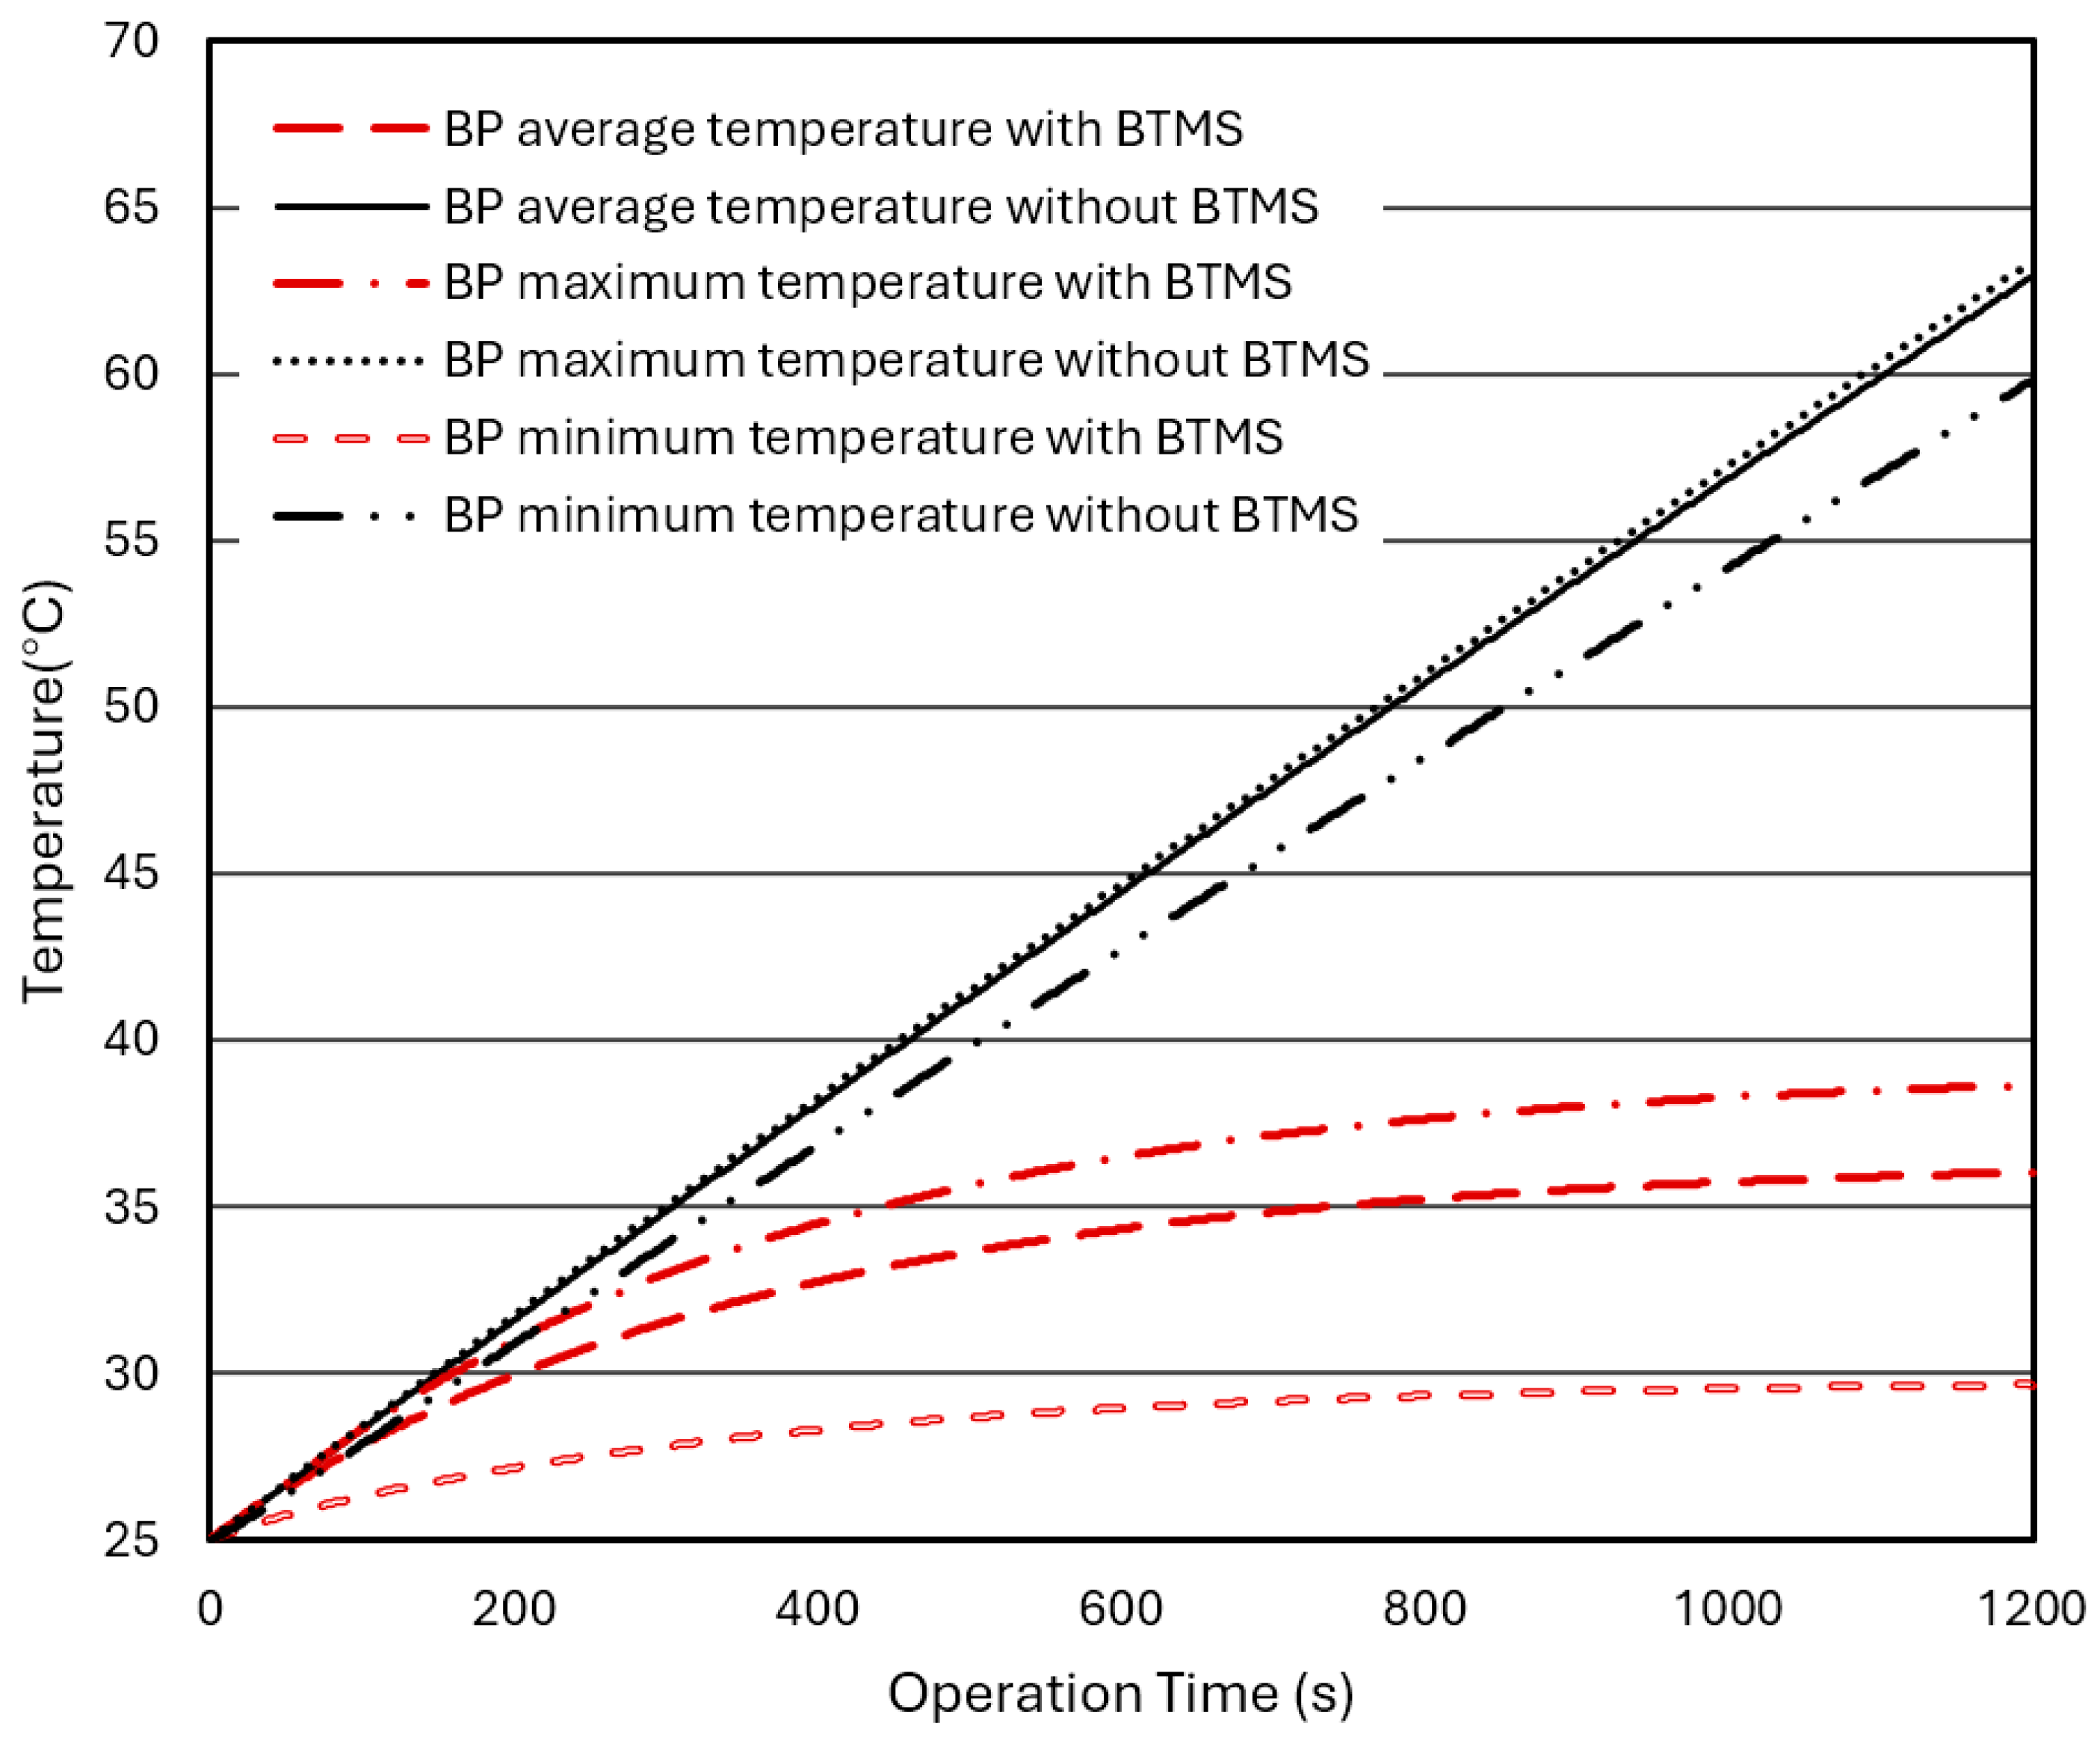
Figure 9 compares the changes in the average, maximum, and minimum temperatures in the BPs without a BTMS or with a hybrid BTMS varying with operation time under a discharge rate. For the BP without a BTMS, the temperatures continuously and rapidly rise with operation time. However, for the BP with additional water-cooling BTMS, the temperatures rise much slower and tend to converge (stabilize) at a certain value. After installing the liquid (water)-cooling BTMS, the internal temperatures of the BP can be well controlled between 30 °C and 40 °C. The minimum, maximum, and average temperatures in the BP converge after 1200 s of operation time to stable values of 29.64 °C, 38.66 °C, and 36.02 °C, respectively, and they are significantly reduced by 29.67 °C, 24.73 °C, and 28.89 °C, respectively, compared to the BP without a BTMS, and slightly over the recommended temperature range of +20 °C ~+35 °C.
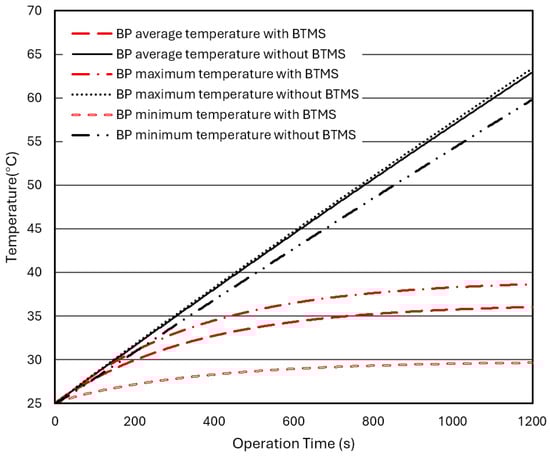
Figure 9.
Temperature changes in the BPs without a BTMS or with a hybrid BTMS vary with operation time at a discharge rate of 3 C.
3.3. Effect of Discharge Rate on BP Thermal Performance
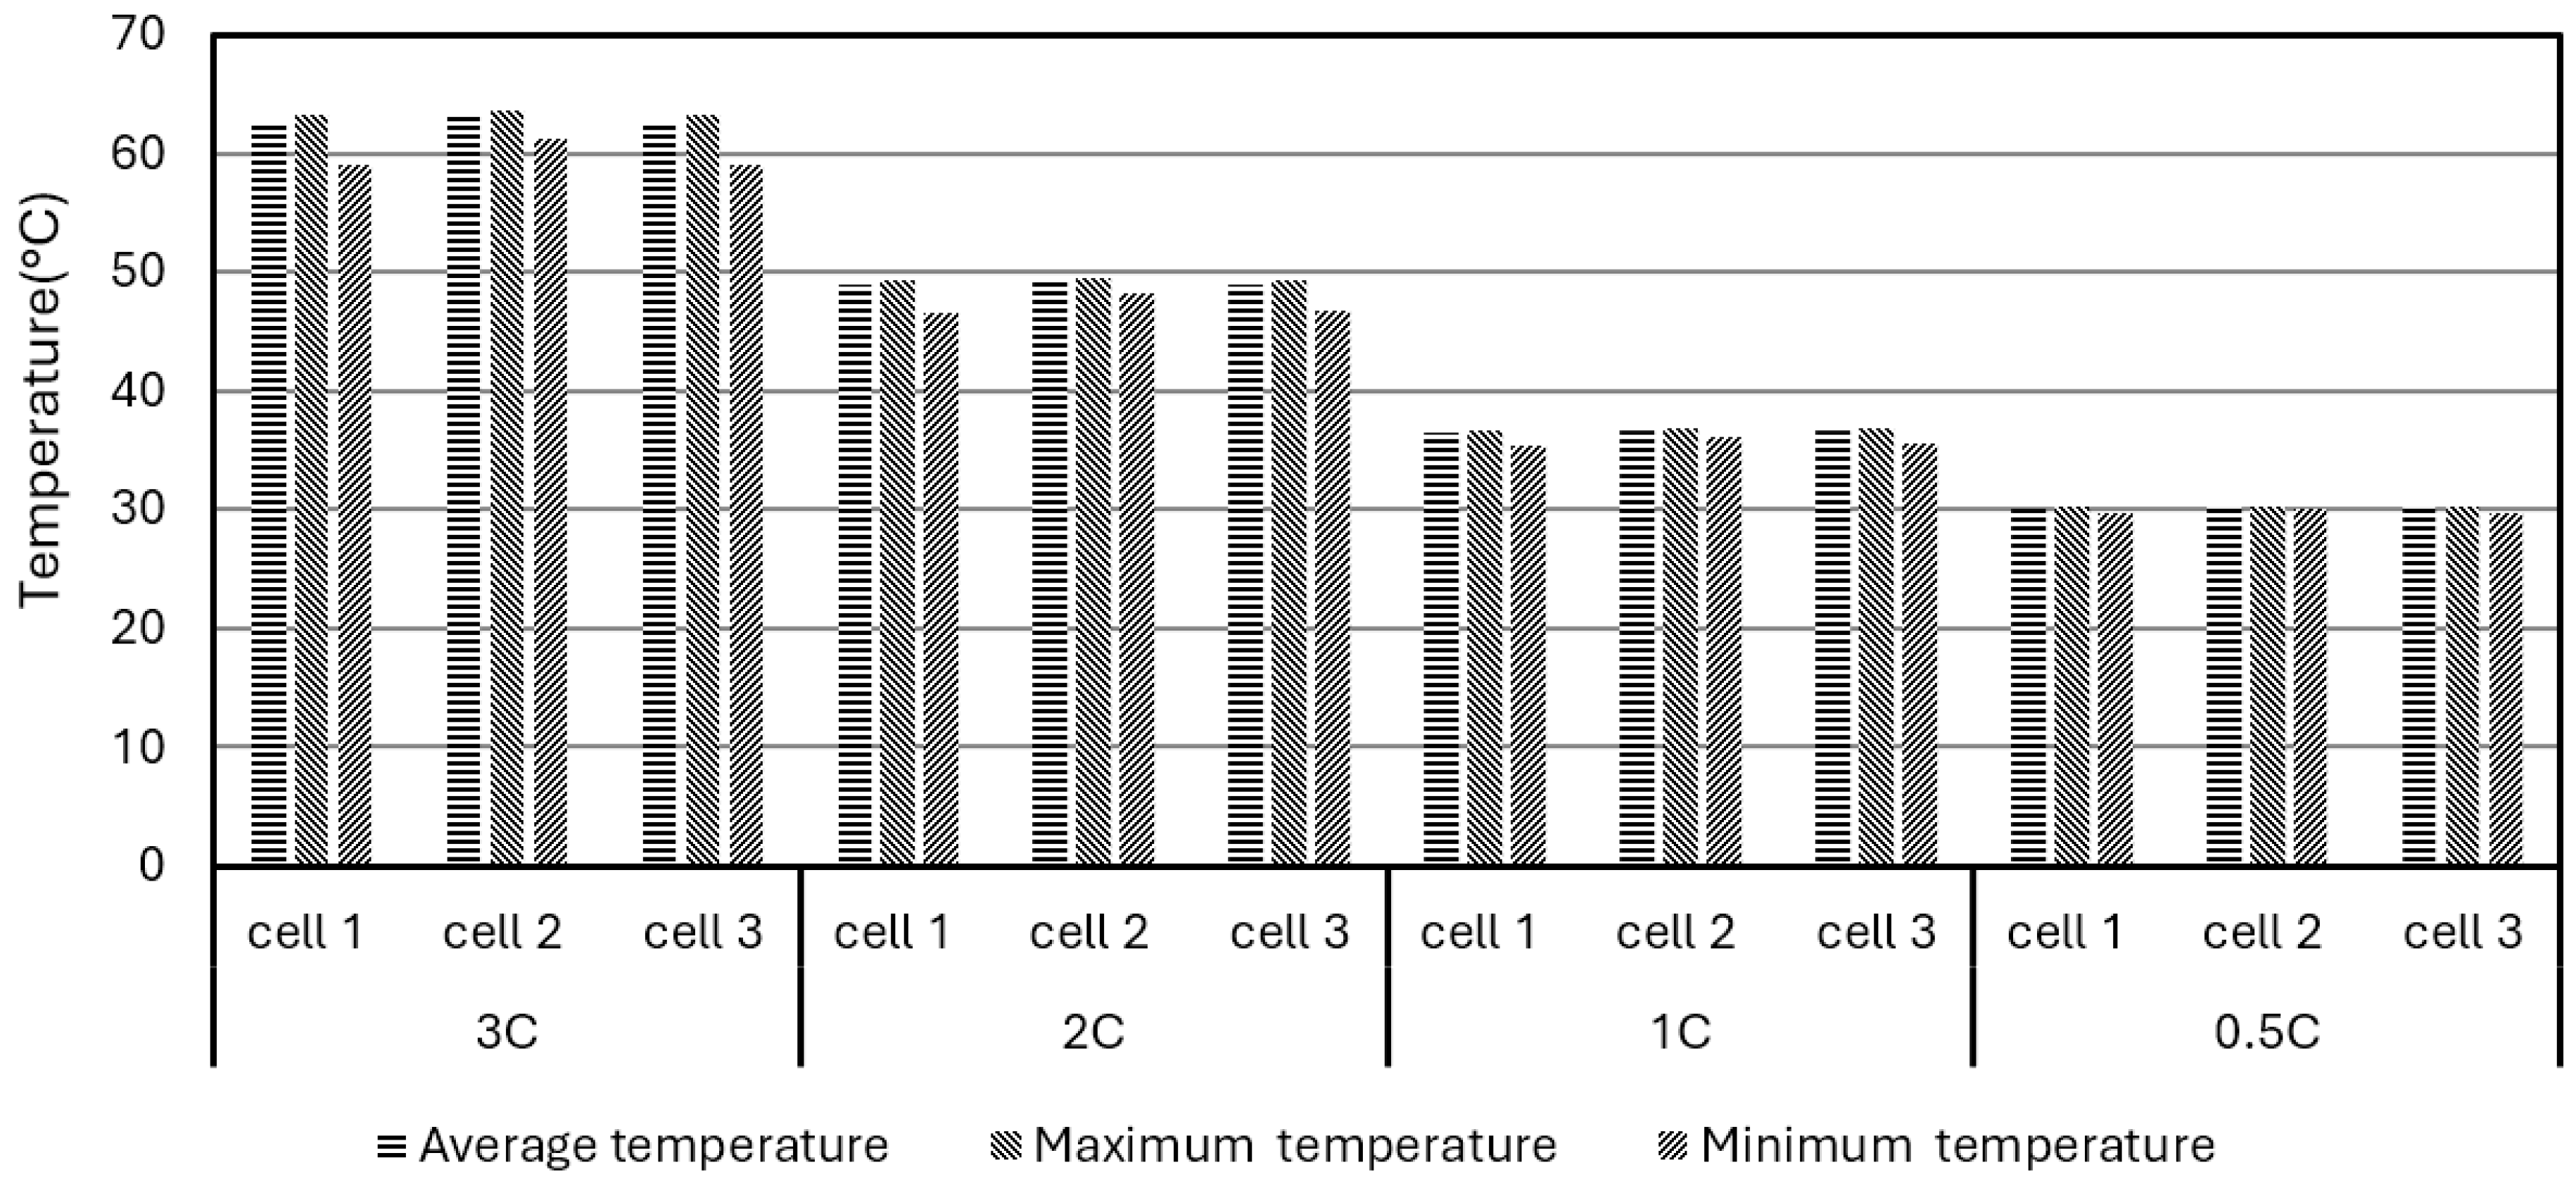
The BP models and conditions are the same as those adopted in Section 3.1. Figure 10 shows the effect of the discharge rate (0.5 C, 1 C, 2 C, and 3 C) on the average, maximum, and minimum temperatures in the three-battery-cell BPs without a BTMS (natural air convection only). The operation times are calculated according to the discharge rate as shown in Table 5. The initial temperature for the simulations was set to 25 °C. As can be seen from Figure 10, the temperature differences in different battery cells are very close. The higher the discharge rate, the more heat is generated in each cell, and the higher the temperature rises in each cell. When the discharge rate is 3 C, the average, maximum, and minimum temperatures rise to around 60 °C, much higher than the ROTR. Even when the discharge rates are lower than 2 C, the temperature of the BP is still higher than that of ROTR.

Figure 10.
Temperatures vs. discharge rate (0.5 C, 1 C, 2 C, and 3 C) for a three-battery-cell BP (cell 1, cell 2, and cell 3) without a BTMS (at operation times indicated as in Table 5 corresponding to the discharge rate).
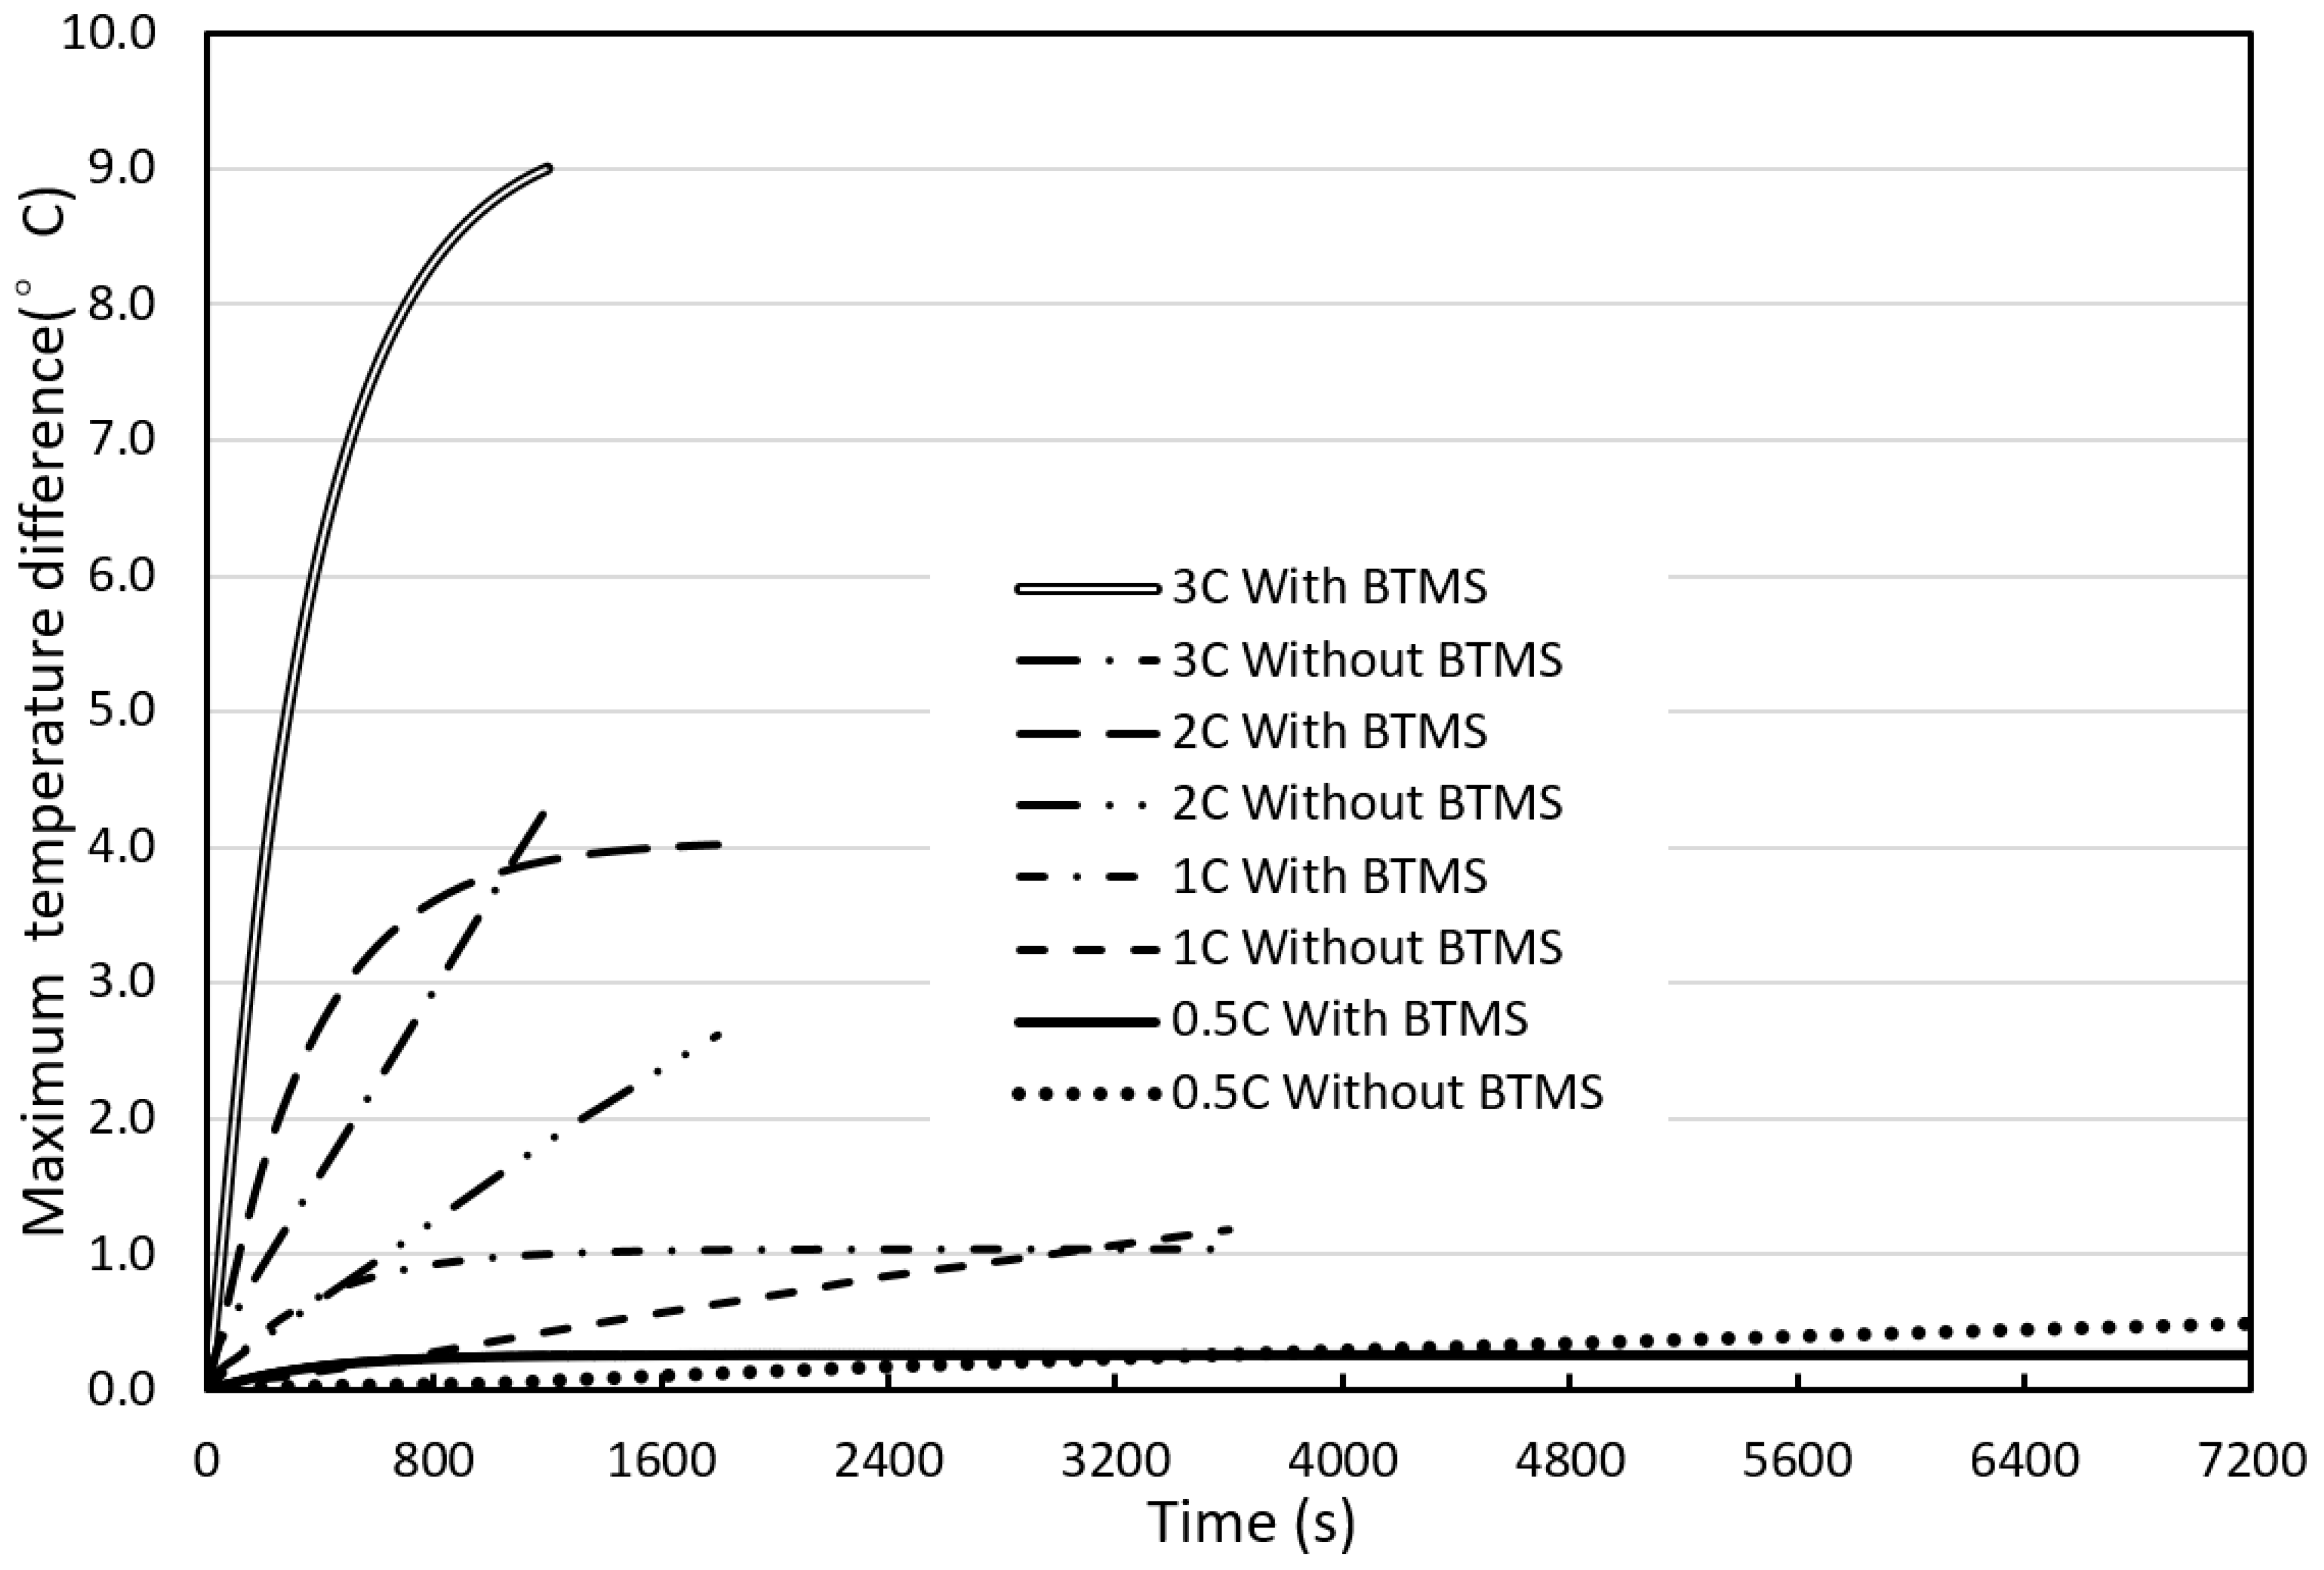
Figure 11 shows the effect of the discharge rates on the maximum temperature difference in BPs without a BTMS (natural air convection only) or with a hybrid BTMS (water cooling combined with natural air convection) over operation time. The maximum temperature differences in BPs with a hybrid BTMS under different discharge rates are obvious, and the maximum value appears in the BP model with a discharge rate of 3C, reaching 9.0 °C. The liquid (water) cooling plates are installed on the upper and lower sides of the batteries, forcing the coolant to dissipate heat to the surrounding area, causing the temperature in the BP to drop significantly, and there is a significant temperature difference between the upper and lower parts of the battery cell compared to the central area.
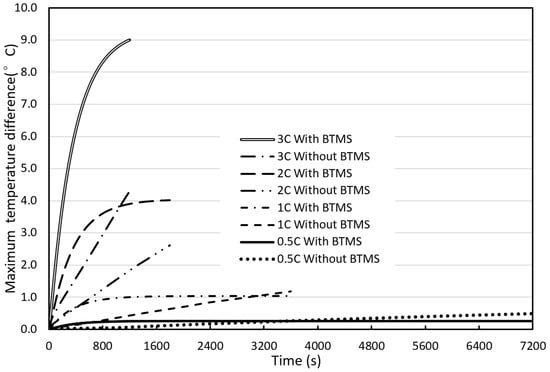
Figure 11.
Maximum temperature difference vs. operation time at different discharge rates for a three-battery-cell BP with a hybrid BTMS (water cooling and natural air convection) or without a BTMS (natural air convection only).
3.4. Effect of Water Coolant Flow Rate and Initial Temperature on BP Thermal Performance
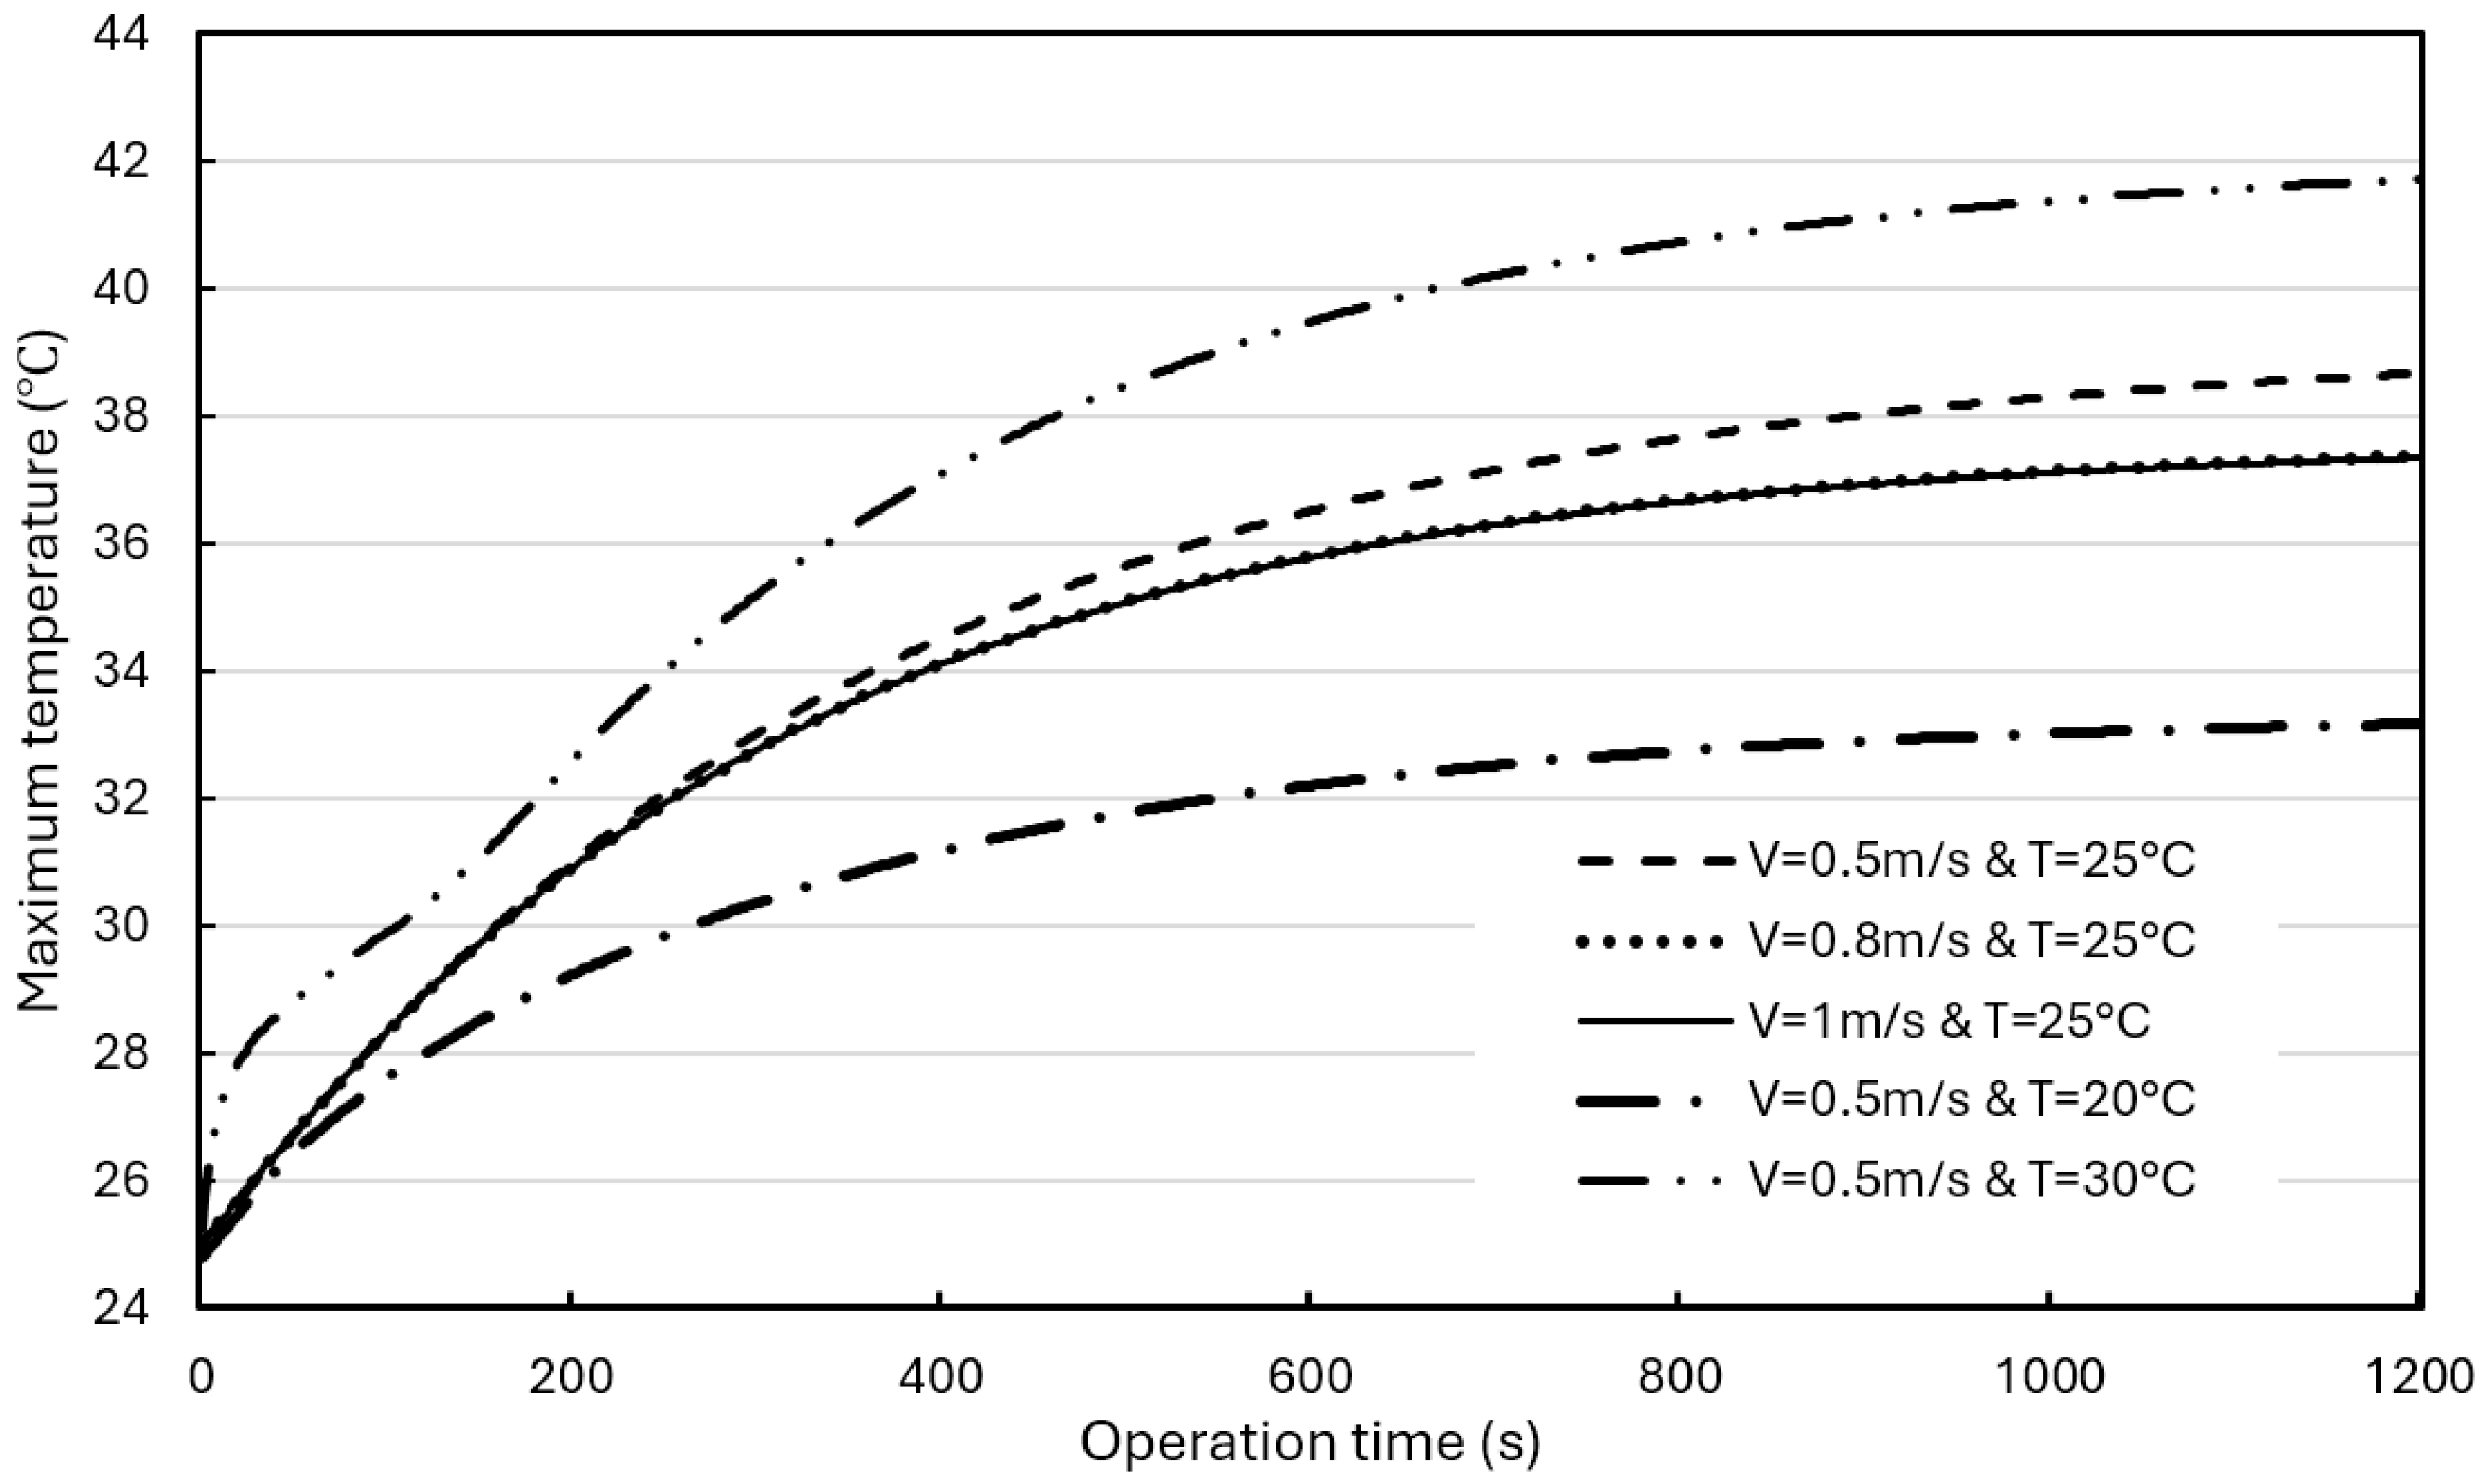
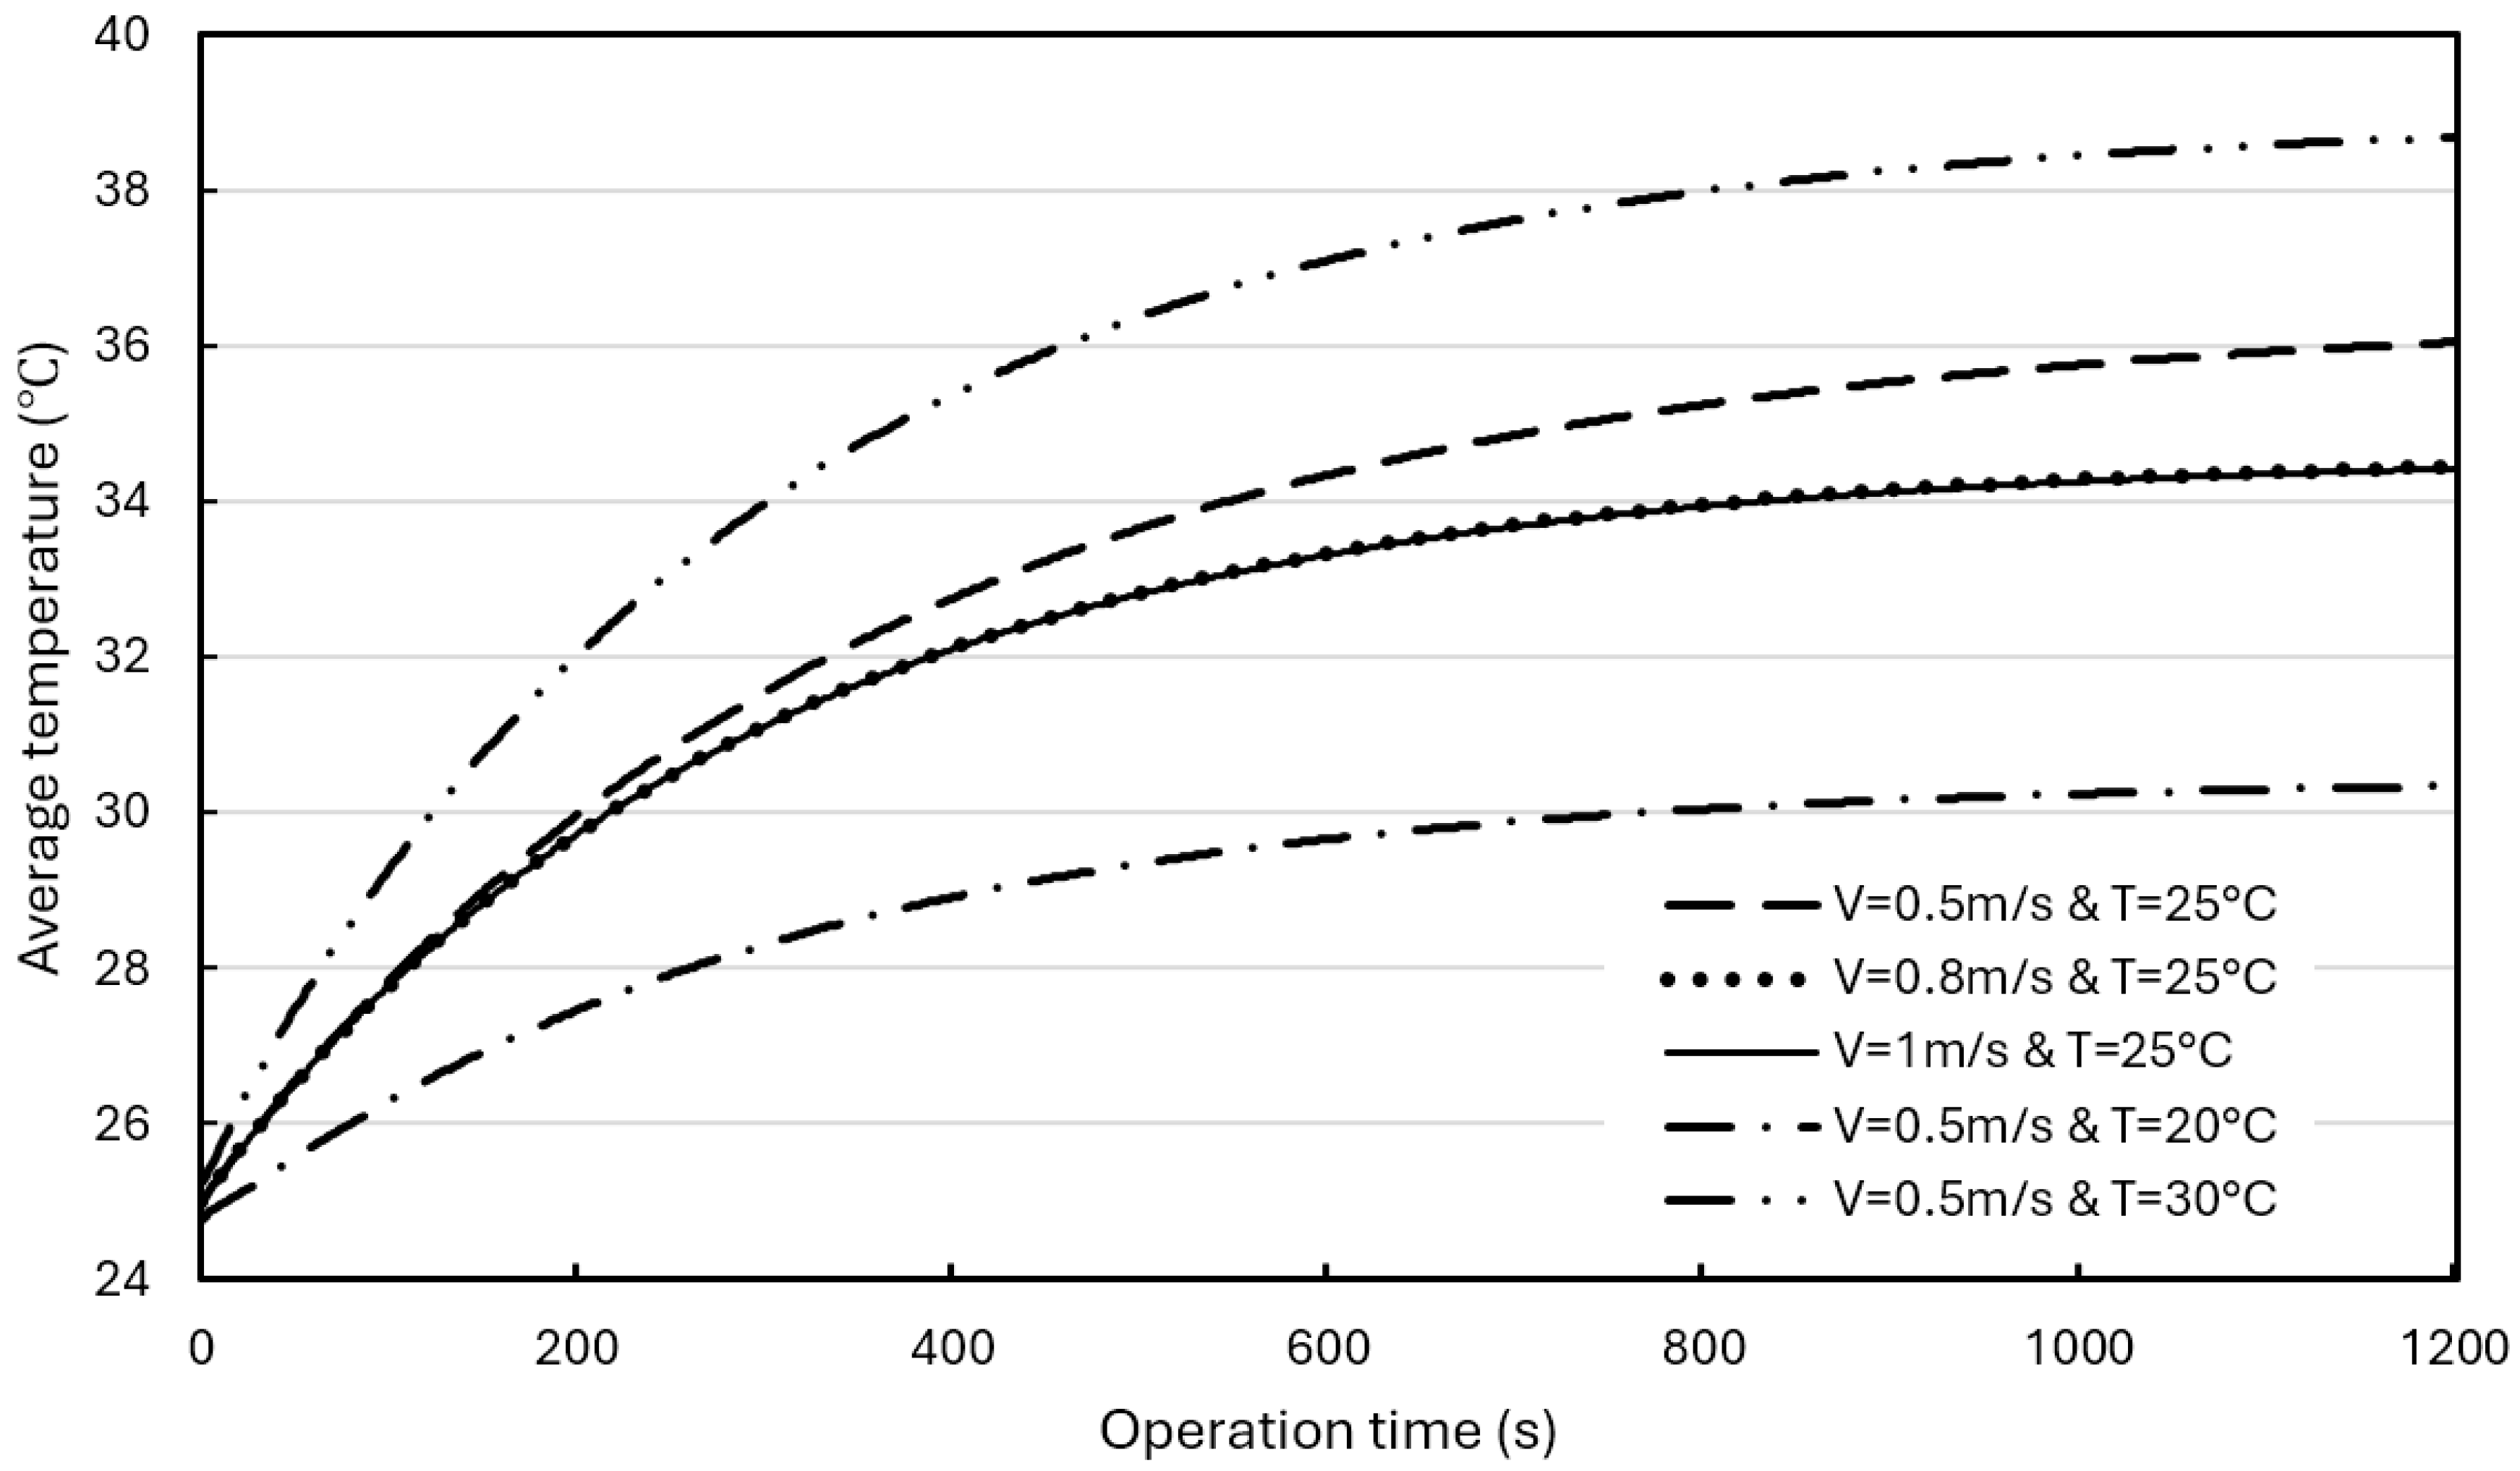
In this case, the BP is still three battery cells per group; the BP model and conditions are the same as in Section 3.2. The BPs used a hybrid BTMS, and different water coolant flow rates (0.5 m/s, 0.8 m/s, and 1.0 m/s) and different initial temperatures (20 °C and 30 °C) were adopted for simulations. All simulations were carried out at a discharge rate of 3 C. Figure 12 shows the effects of water coolant flow rate and initial temperature on the maximum BP temperature. As can be seen, when the initial coolant temperature is 25 °C, the maximum temperature curves are almost the same when flow rates are 0.8 m/s and 1.0 m/s, respectively. Even at a flow rate of 0.5 m/s, the curve differs slightly from these two curves, indicating that the water coolant flow rate has less influence on the maximum BP temperature. The coolant initial temperature has a much greater effect on the maximum temperature changes. Figure 13 shows the effects of the water coolant flow rate and the initial temperature on the average temperature in the BPs. The simulated effects of the coolant flow rate and the initial temperature on the average BP temperature are similar to the effects on the maximum BP temperature (as in Figure 12). Figure 12 and Figure 13 show that when the flow rate increases from 0.5 m/s to 0.8 m/s, the maximum temperature and average temperature decrease by 1.3 °C and 1.5 °C, respectively. Further increasing the flow rate to 1 m/s, no significant changes were found, indicating that the cooling effect was not significantly improved. Choosing a coolant initial temperature of 30 °C (typical summer conditions), the maximum and average temperatures will rise by 3.3 °C and 2.6 °C, respectively. While lowering the coolant initial temperature to 20 °C significantly lowers the maximum and average temperatures by 5.5 °C and 5.7 °C, respectively.

Figure 12.
Maximum temperature in the BPs vs. operation time at different water coolant flow rates and initial temperatures with hybrid BTMS (water cooling and natural air convection).
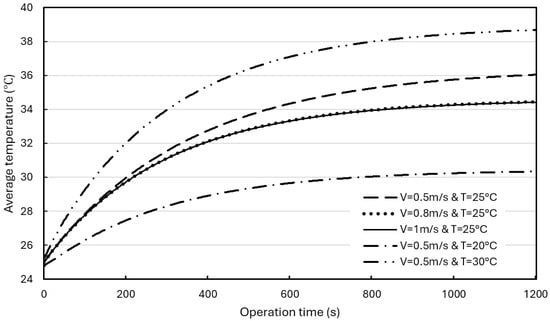
Figure 13.
Average temperature in the BPs vs. operation time at different water coolant flow rates and initial temperatures with a hybrid BTMS (water cooling and natural air convection).
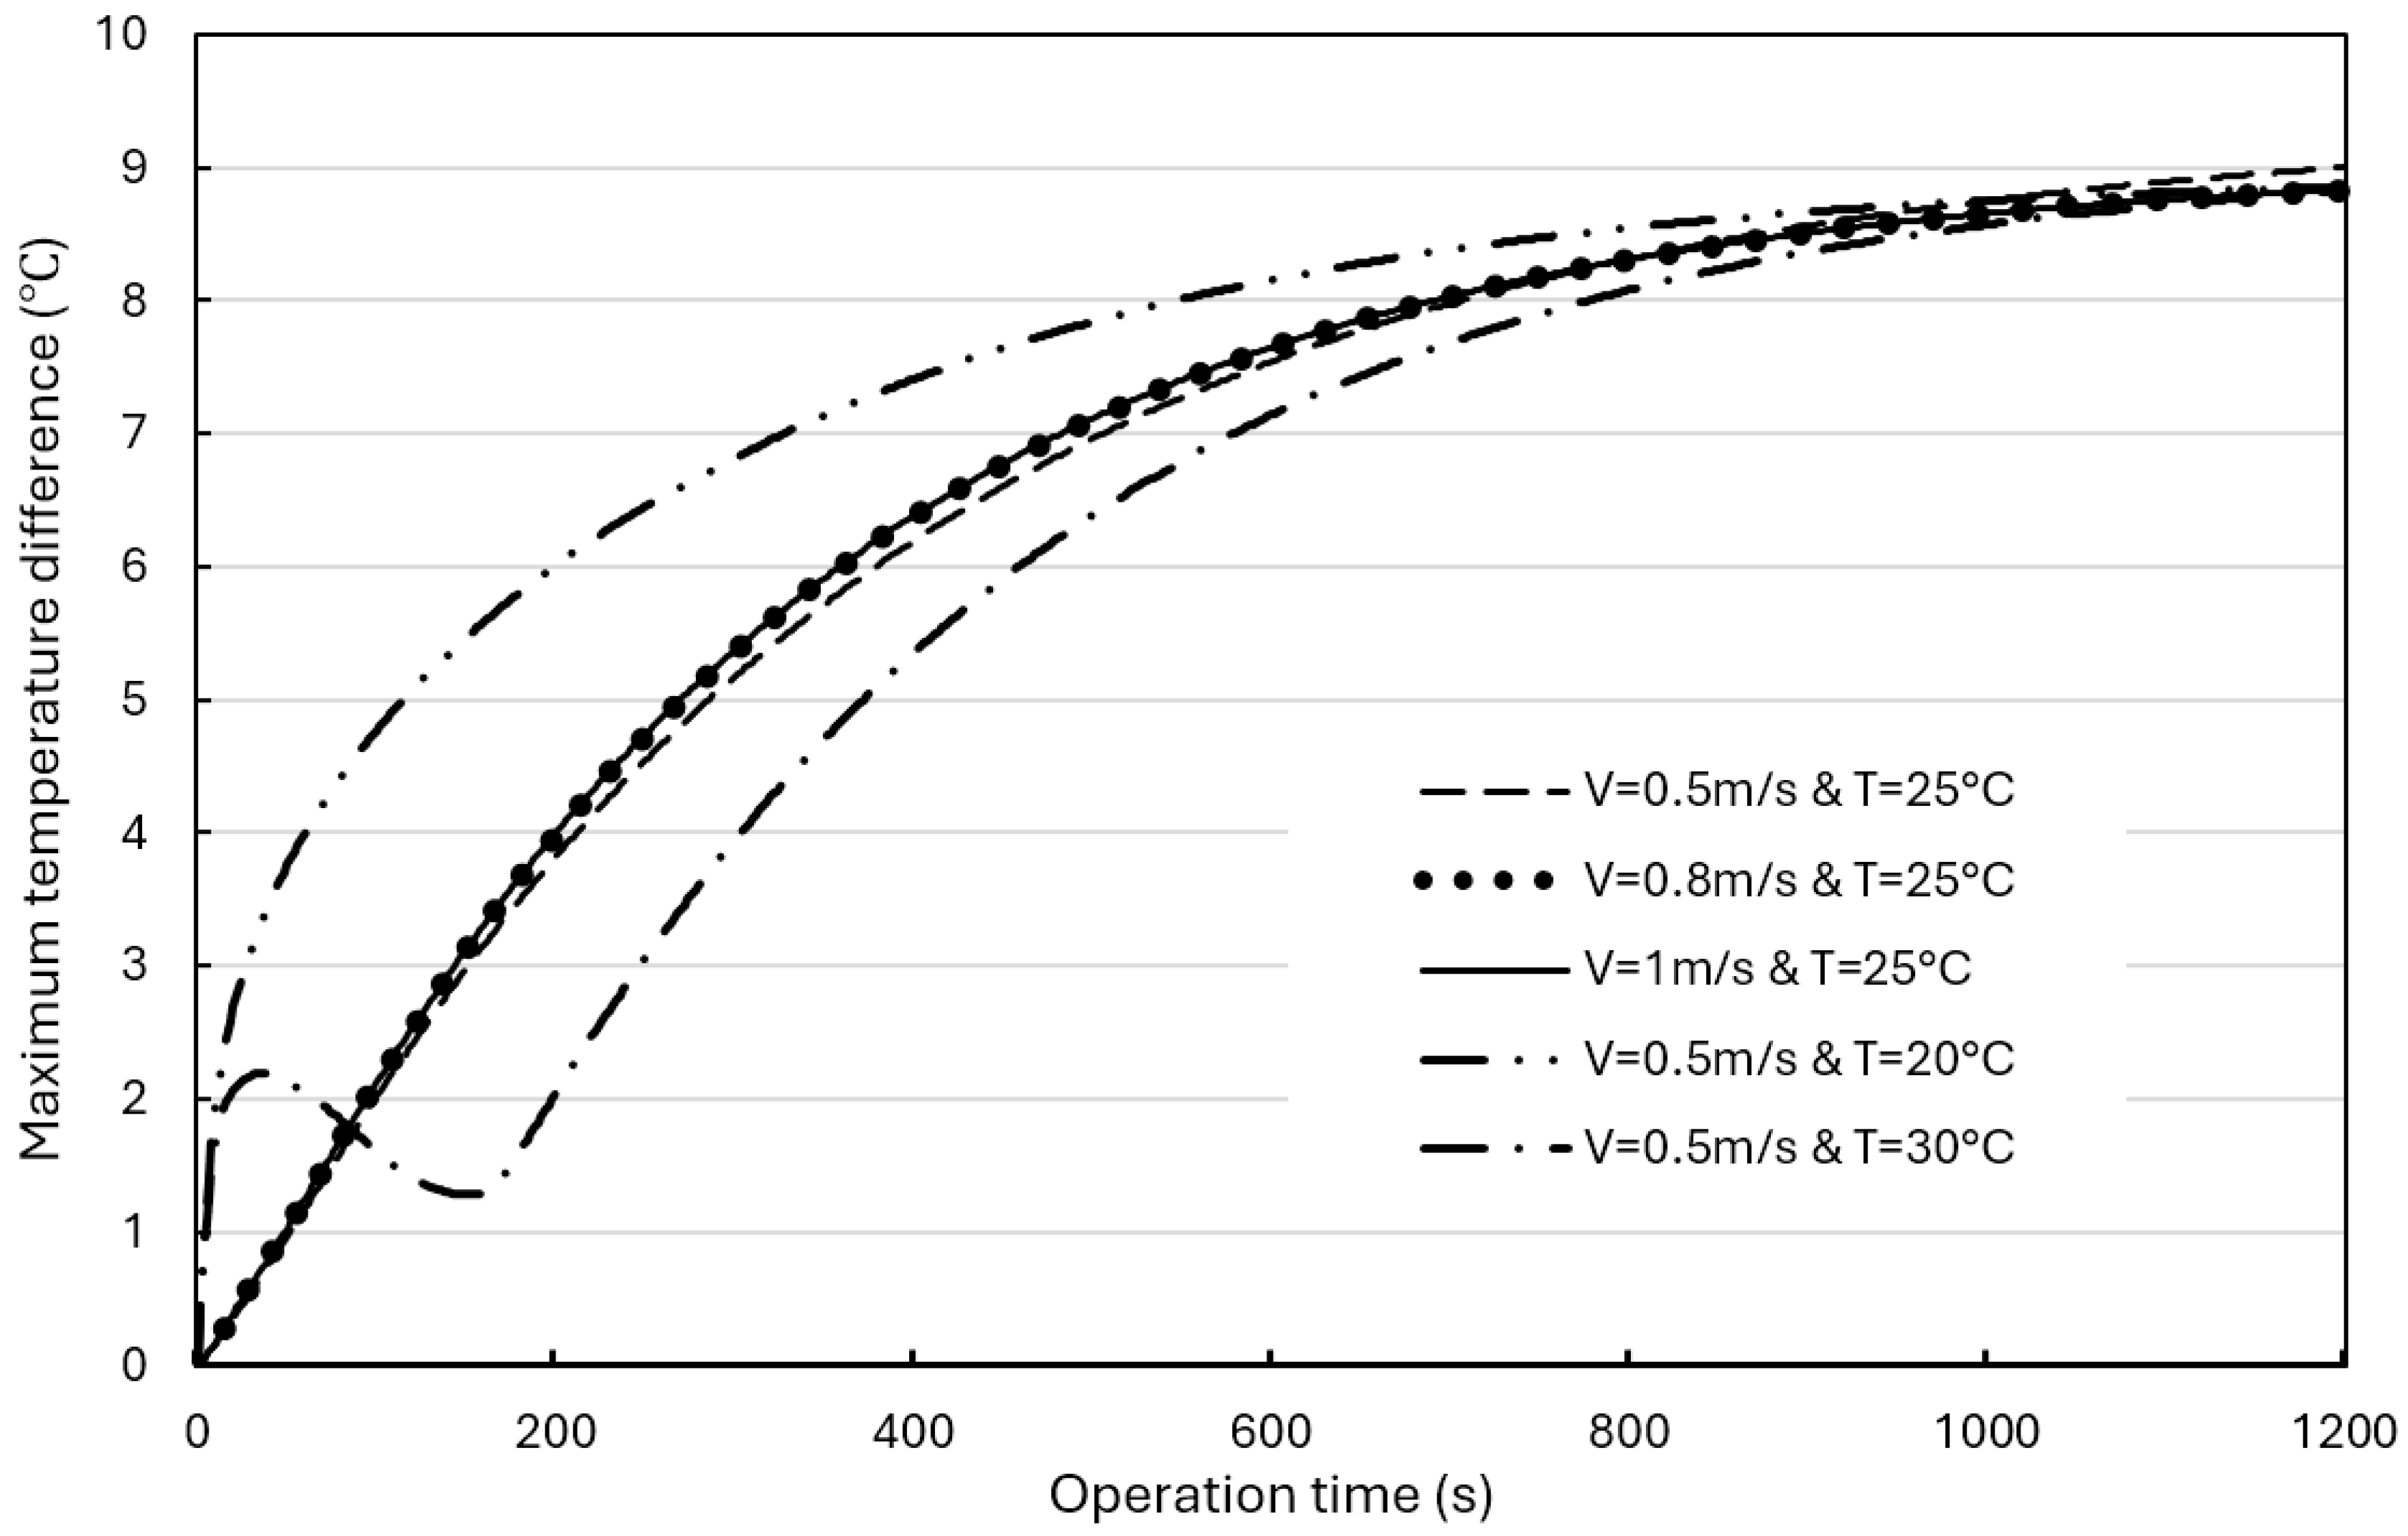
Figure 14 shows the effects of the water coolant flow rate and initial temperature on the maximum BP temperature difference. Although adjusting the water coolant flow rate and initial temperature will produce different effects, it can be seen that at the beginning of the operation time, due to the coolant initial temperature difference between the BP initial temperature and the coolant initial temperature, the coolant initial temperature has a greater impact on the maximum BP temperature difference. However, after about 1000 s, the maximum temperature differences under different operating conditions approach a similar value of about 9 °C, and these differences are negligible, indicating that enhancing the cooling capacity of the water coolant cannot significantly improve the uniformity of the temperature distribution in the BPs, especially on the battery surface. When the coolant’s initial temperature is 30 °C, heat accumulation causes the BP temperature difference to increase rapidly. Similarly, when the coolant’s initial temperature is 20 °C, heat accumulation also occurs, but due to the lower initial temperature, the maximum BP temperature difference increases rapidly and gradually approaches about 9 °C. Therefore, lowering the coolant initial temperature is conducive to lowering the BP temperature, and the temperature difference in the BP eventually will be the same after a certain operation time.
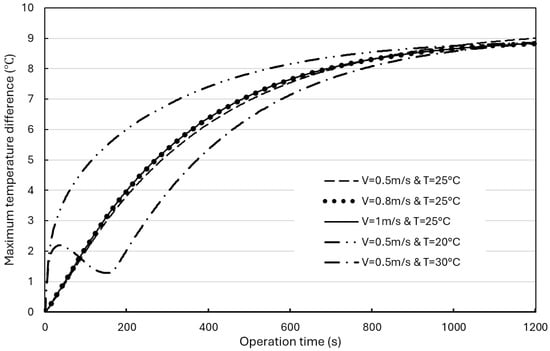
Figure 14.
Maximum temperature difference in the BPs vs. operation time at different water coolant flow rates and initial temperatures with a hybrid BTMS (water cooling and natural air convection).
3.5. Effect of Composite BTMS (Forced Air Cooling Combined with Water Ccooling) on BP Thermal Performance
In the previous subsections, it was concluded that for the designed three-battery-cell BPs, if the BP is without a BTMS (natural air convection only), the temperature distribution in the BP will be much higher than the ROTR (+20 °C ~+35 °C). When the BP is equipped with a hybrid BTMS (adding water coolant cooling to the natural air convection), the water coolant cooling system can effectively enhance the cooling capacity, especially by lowering the coolant’s initial temperature. However, the maximum temperature in the BP is slightly above the upper bound of the ROTR. In addition, keeping the coolant initial temperature below room temperature consumes a considerable amount of energy, which is not conducive to the efficiency and environmental requirements of the EVs. Therefore, further improvement/design of the current hybrid BTMS was considered. In this case, a composite BTMS (a cooling system combining forced air cooling with water coolant cooling) was designed, since the forced air-cooling system has a low cost and a simpler structure (it can be integrated with the vehicle air conditioning system to adjust the BP thermal performance by adjusting fan airflow rate and initial temperature according to the vehicle operating conditions, as shown in Figure 2). The initial conditions of this case were set at an airflow rate of 1 m/s and the initial temperature of 25 °C. Figure 15 shows the temperature changes in BP with operation time using a hybrid BTMS or using a composite BTMS at a discharge rate of 3 C.
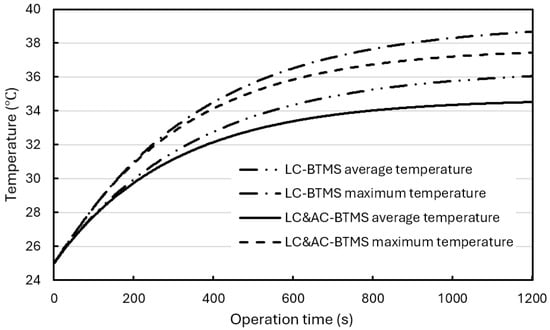
Figure 15.
Temperatures in BPs vs. operation time with a hybrid BTMS (LC-BTMS) or a composite BTMS (LC&AC BTMS) at a discharge rate of 3 C.
As can be seen, compared with BP using a hybrid BTMS, the composite BTMS can lower the maximum temperature and average temperature in the BPs by 1.2 °C and 1.5 °C, respectively. However, both BTMSs can stably maintain the BP temperature below 40 °C and are suitable for high discharge rate conditions.
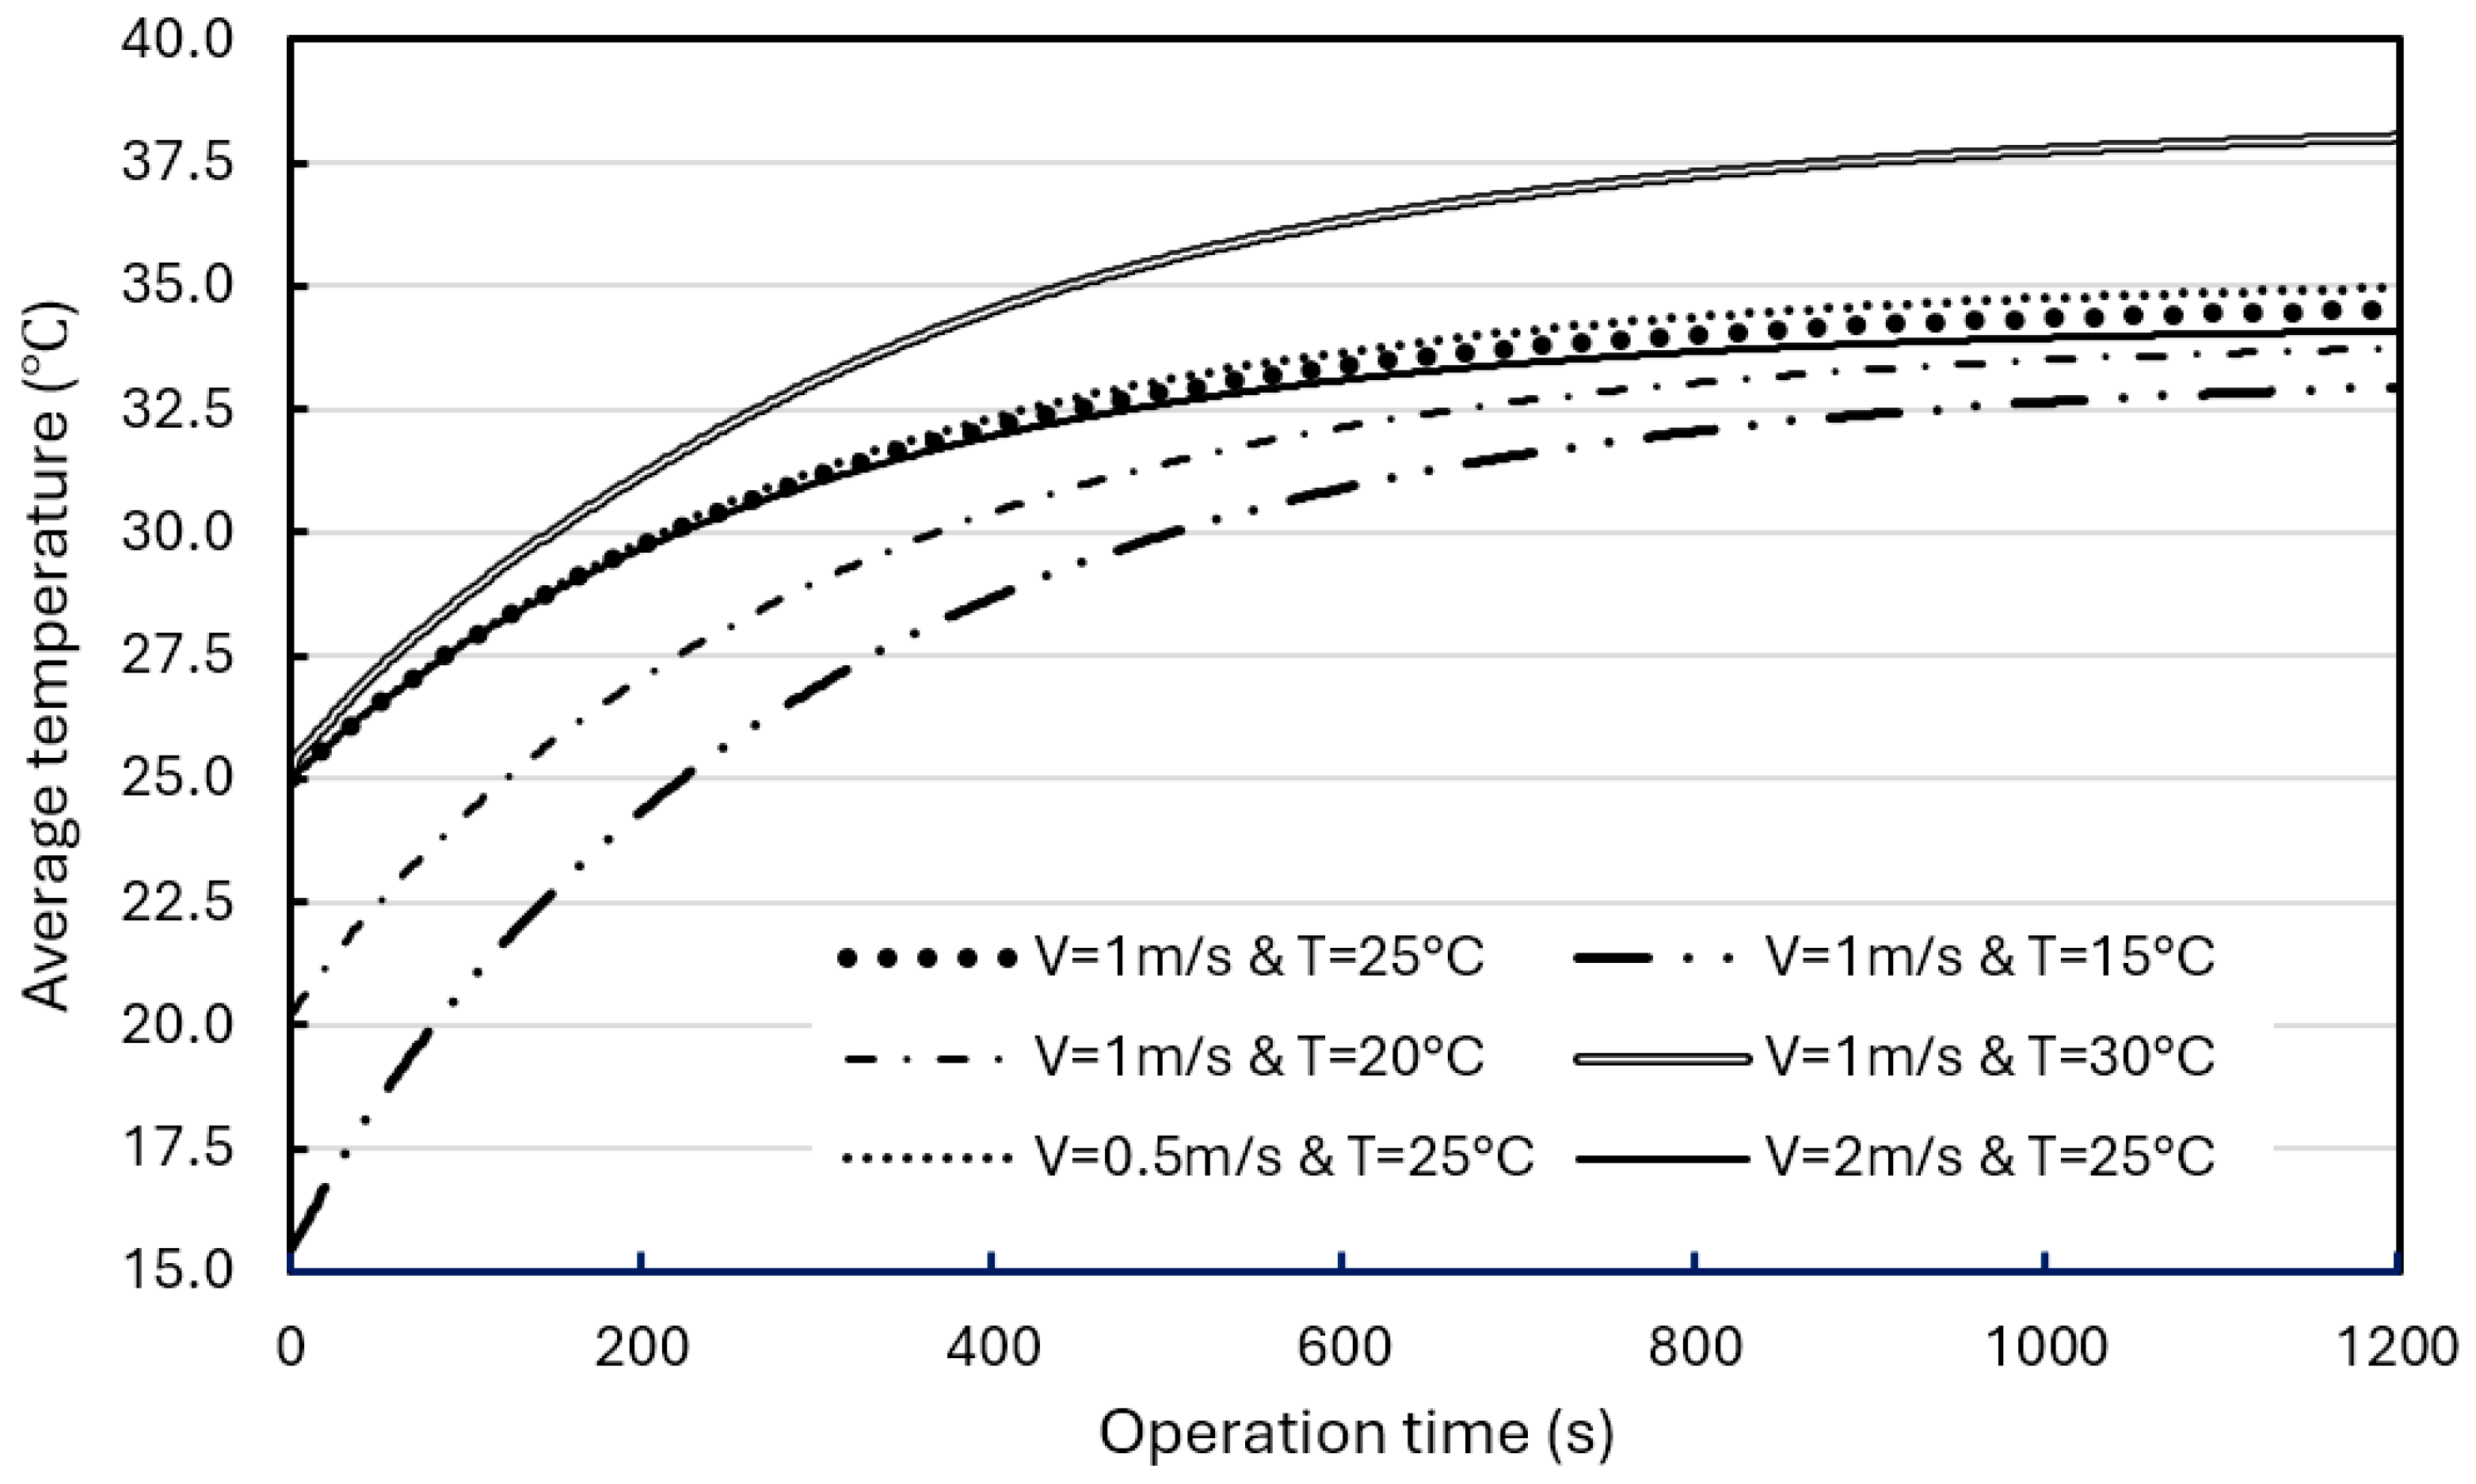
In addition, simulations were performed for different airflow rates (0.5 m/s, 1.0 m/s, and 2.0 m/s) and different air initial temperatures (15 °C, 20 °C, 25 °C, and 30 °C) for further evaluation. Figure 16 shows the effects of airflow rate and initial temperature on the average temperature in BP with a composite BTMS. At the same airflow rate (1 m/s), adjusting the air initial temperature from 30 °C to 15 °C resulted in a 5.1 °C drop in the average temperature in the BP at the operation time of 1200 s. At the same initial air temperature (25 °C), adjusting the airflow rate from 0.5 m/s to 2 m/s did not induce a significant drop in the average BP temperature at the operation time of 1200 s (less than 1 °C). The temperature curves in the BPs tend to be stable after the operation time of 1200 s, and the average BP temperature range with a composite BTMS can be well controlled within the ROTR regardless of the forced airflow rate used in the composite BTMS, even though its maximum temperature is slightly higher than 35 °C (around 37.4 °C).

Figure 16.
Average temperature in the BPs vs. operation time with a composite BTMS at a discharge rate of 3C under different air conditions.
During daily use, EV batteries typically discharge at a higher rate for a shorter period. Even a brief discharge of 1 C or 2 C can significantly increase power output and acceleration. However, frequent high discharge rates can quickly deplete the SOC, especially when accelerating quickly or climbing steep hills, adversely affecting the battery’s chemistry, reducing its energy storage capacity, and potentially causing long-term performance issues. To mitigate these effects, EV battery management systems typically maintain discharge rates between 0.2 C and 0.5 C to balance performance, battery life, and safety. Even with DC ultra-fast (150 kW) charging, such as the Tesla Model S, the maximum C rate per hour is less than 3 C, and this discharge rate is only maintained during the first 15 min of charging [61]. Therefore, the 3 C discharge rates adopted in these simulations reflect extreme discharge conditions.
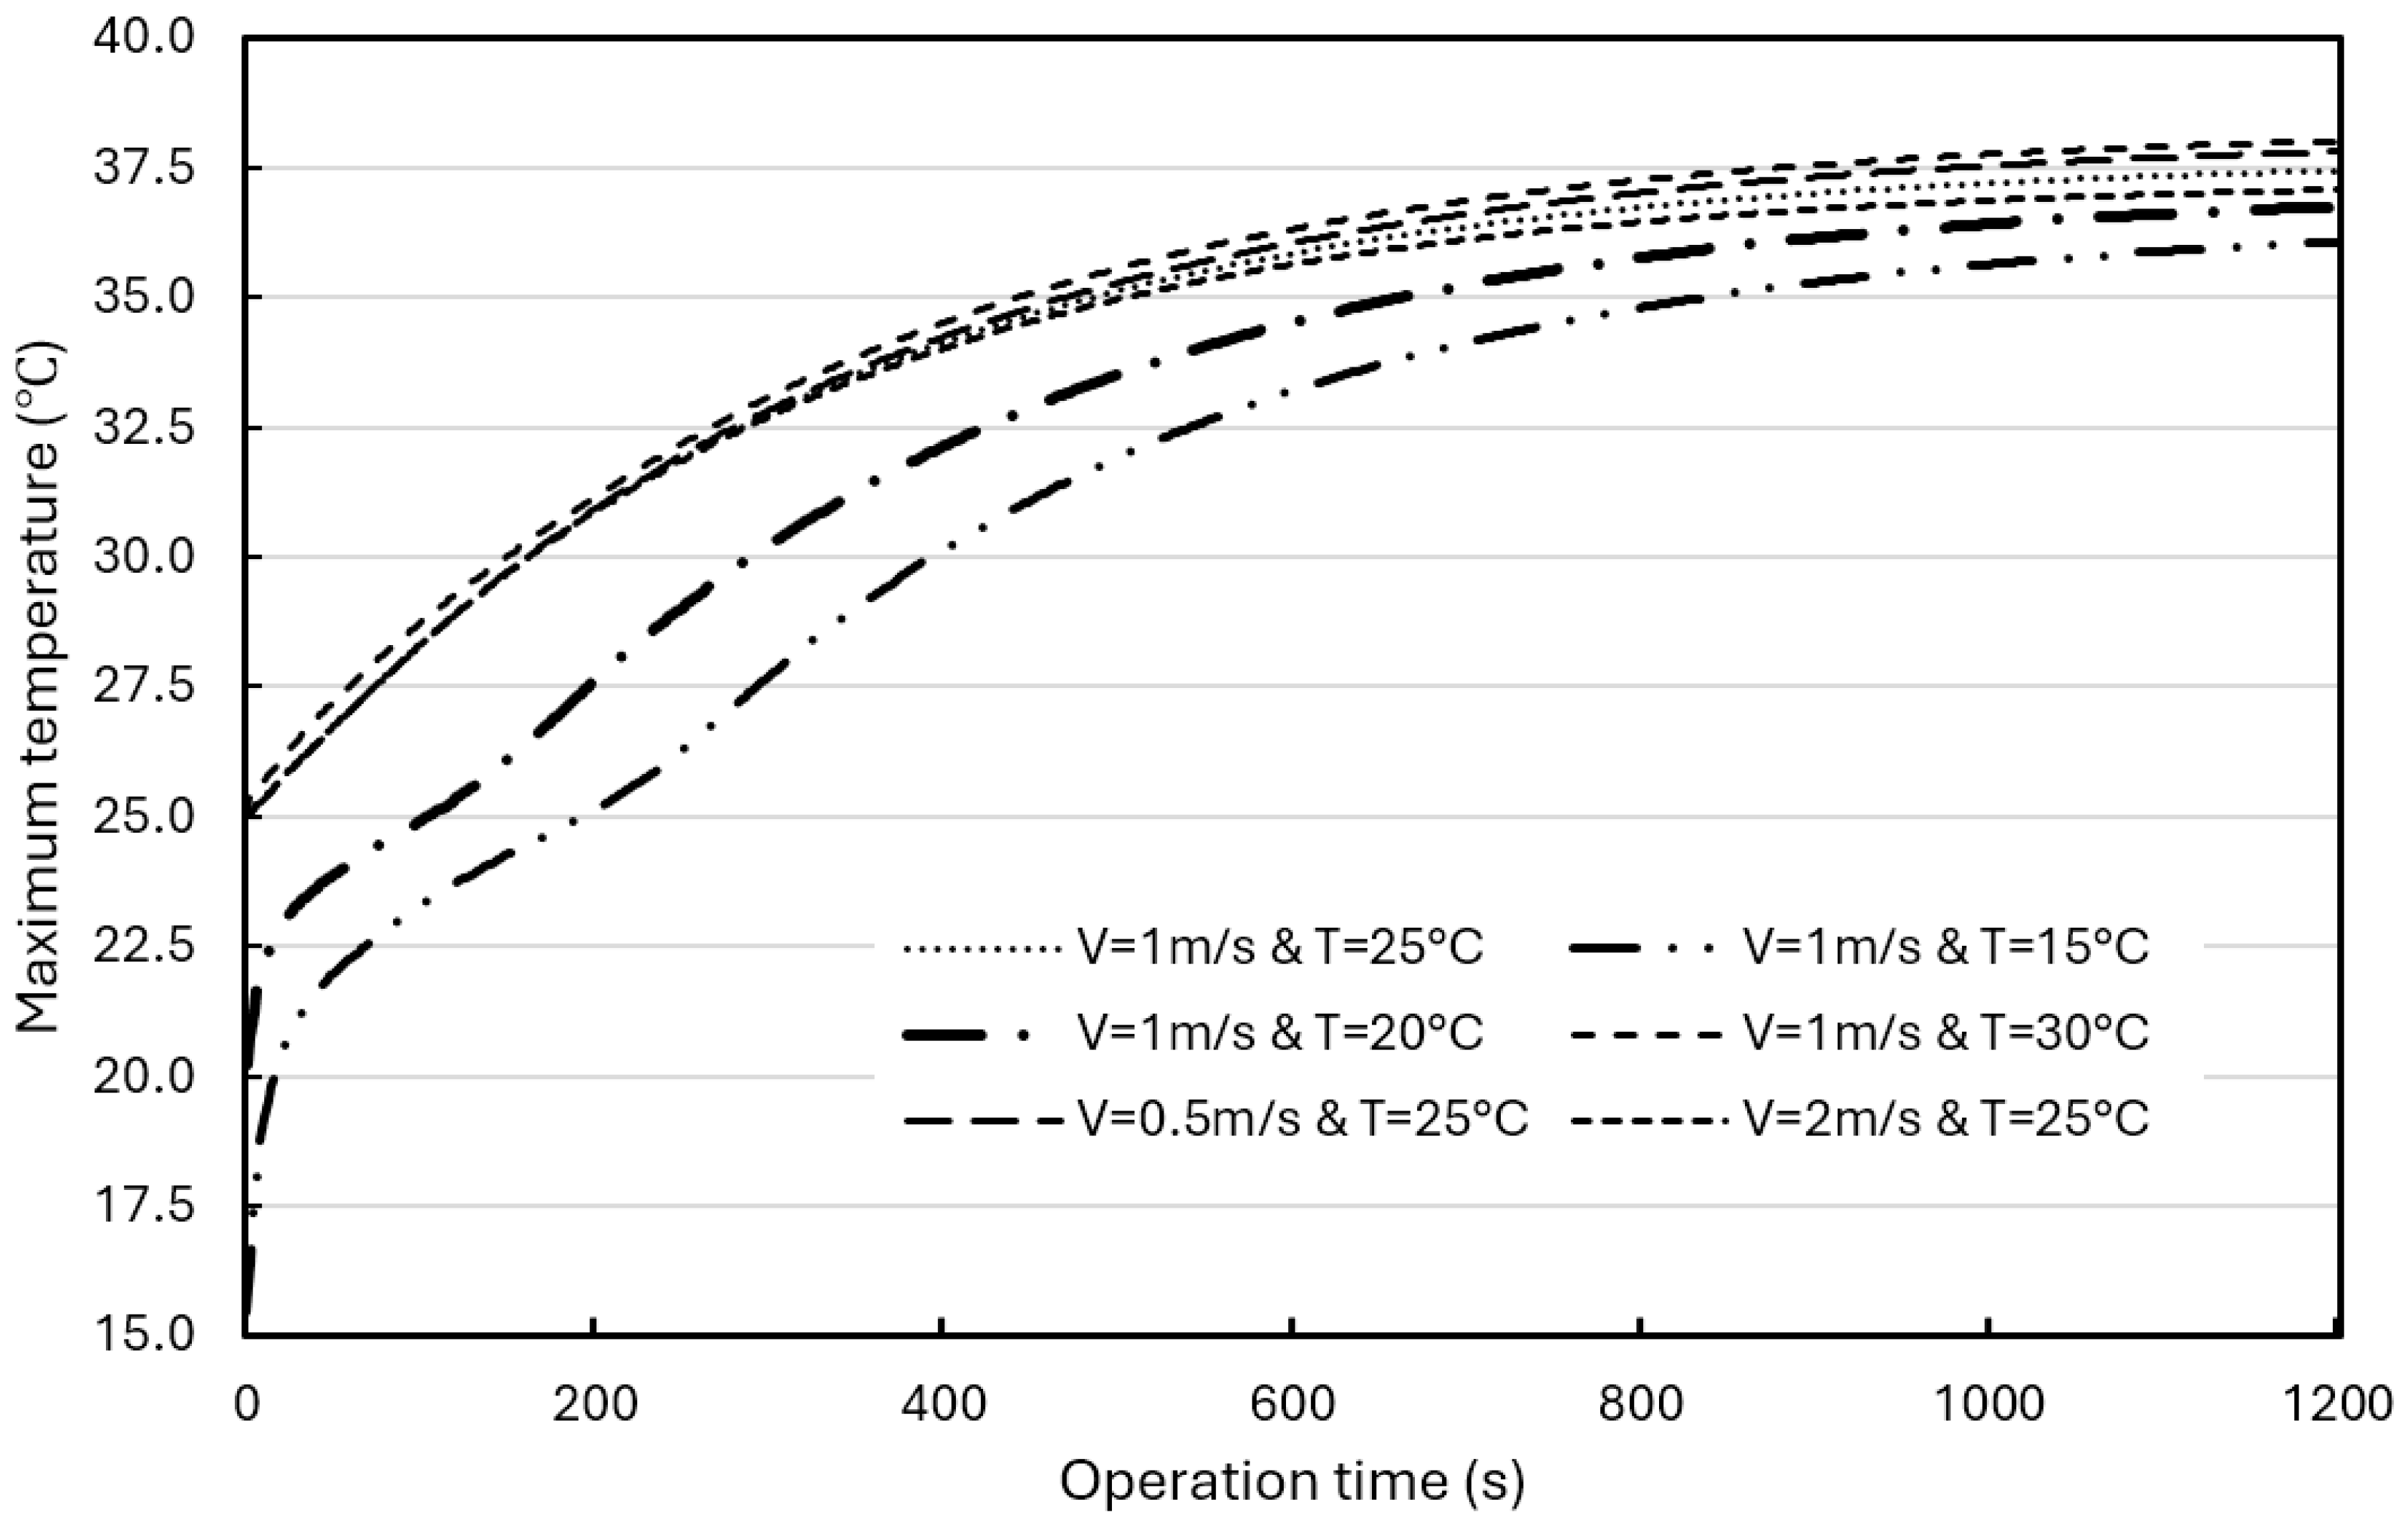
Figure 17 shows the effects of air flow rate and initial temperature on the maximum BP temperature. When the air flows at 1 m/s, the initial air temperature has a significant impact on the maximum BP temperature. Lowering the initial temperature from 30 °C to 15 °C resulted in a 1.7 °C drop in the maximum temperature in the BP. However, the inlet airflow rate has a smaller effect on the maximum BP temperature.
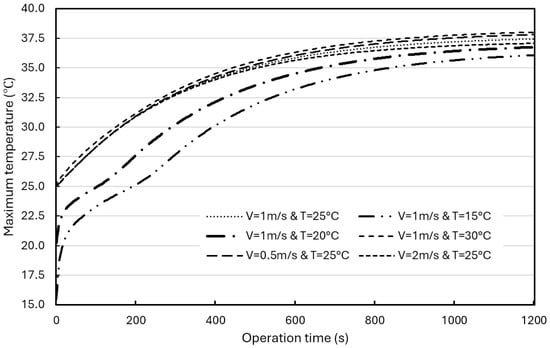
Figure 17.
Maximum temperatures vs. operation time in BPs with a composite BTMS at a discharge rate of 3C under different air conditions.
3.6. Summarizing Thermal Performance Comparison of Different BTMS Designs
So far, the thermal performances of the three-battery-cell BP designed with different cooling systems, such as without a BTMS (natural air convection only), a hybrid BTMS (water coolant cooling with natural air convection), and a composite BTMS (water coolant cooling with forced air cooling), have been simulated and analyzed based on CFD modeling. These thermal performances are summarized and compared in this subsection for a conclusive study, as shown in Figure 18.
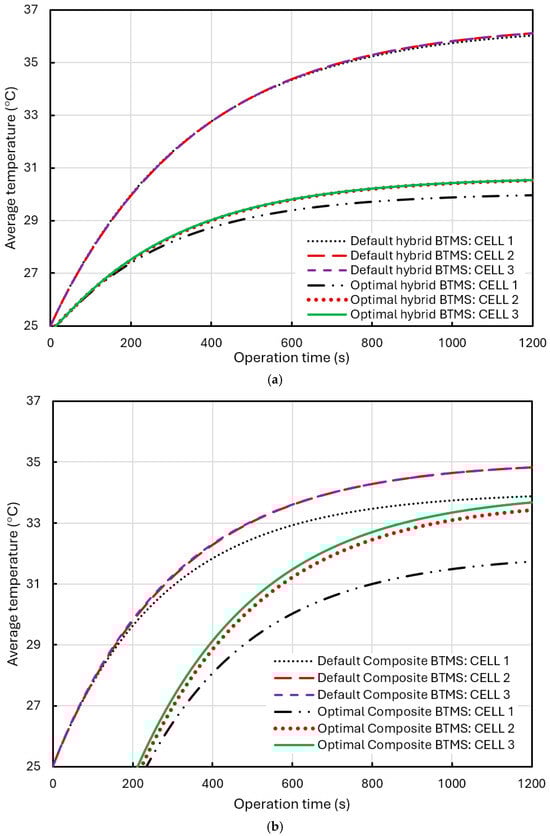
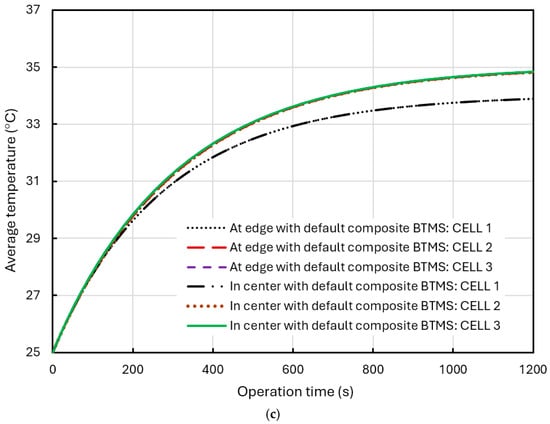
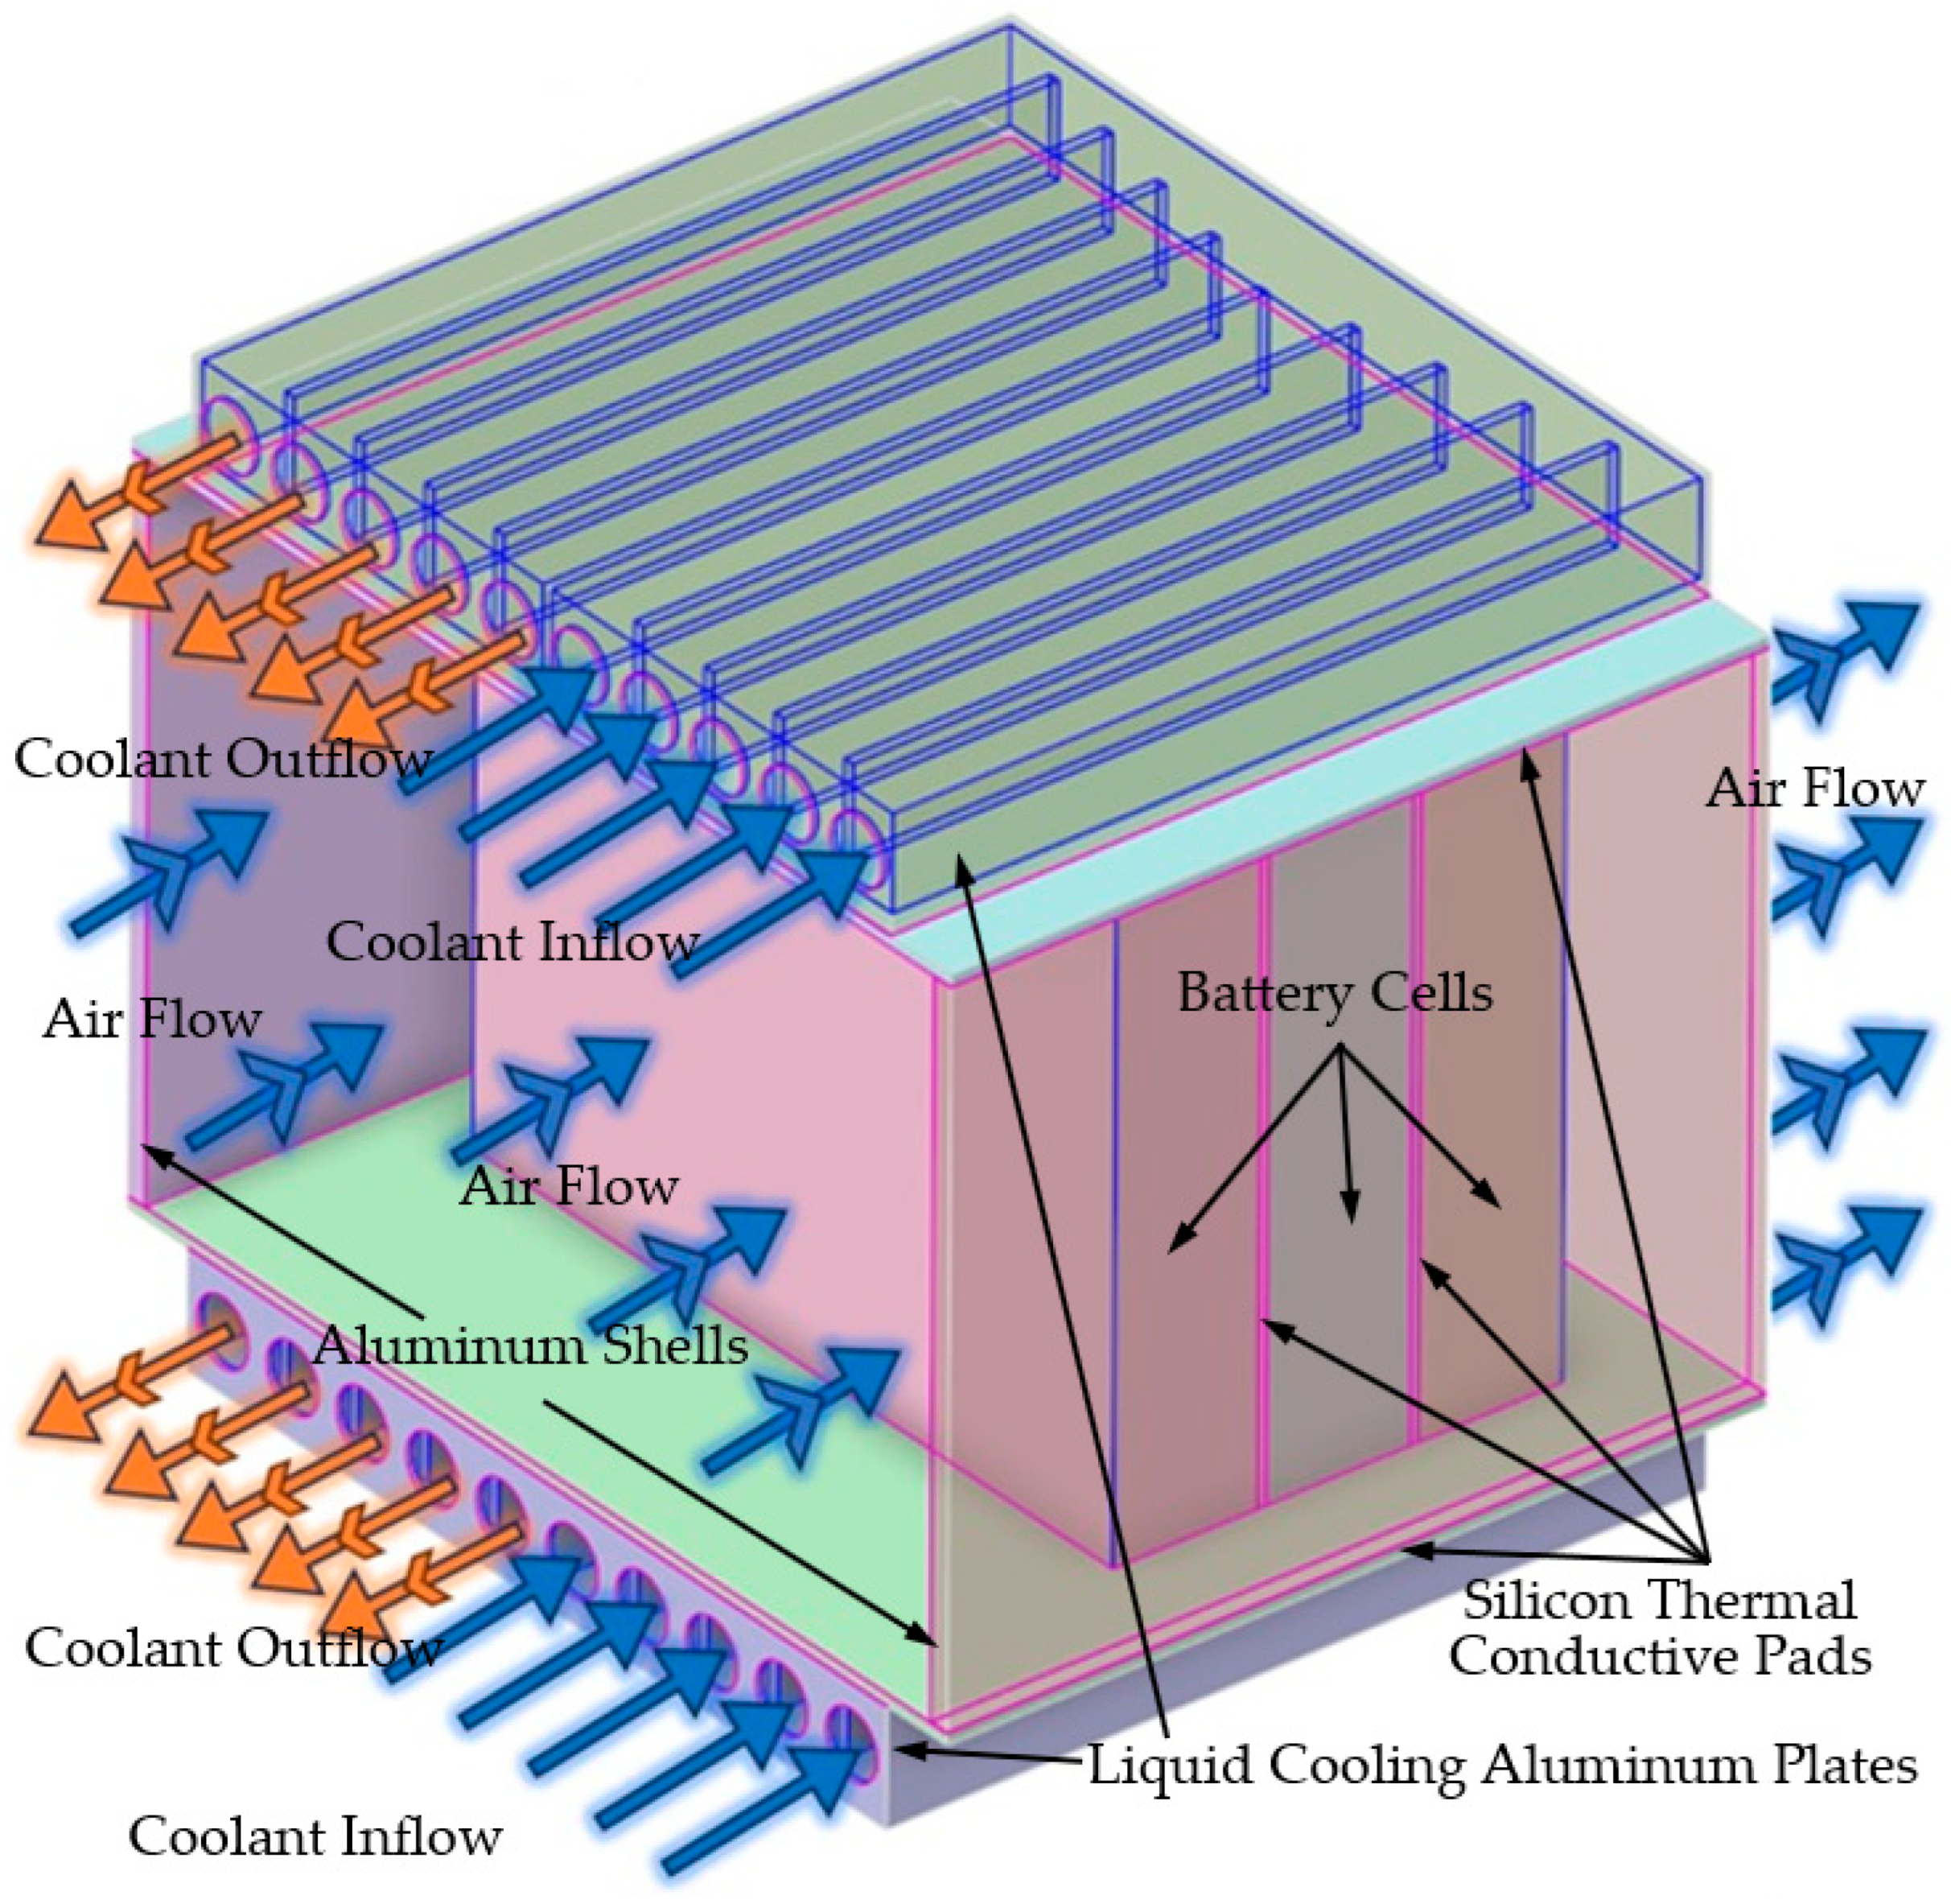
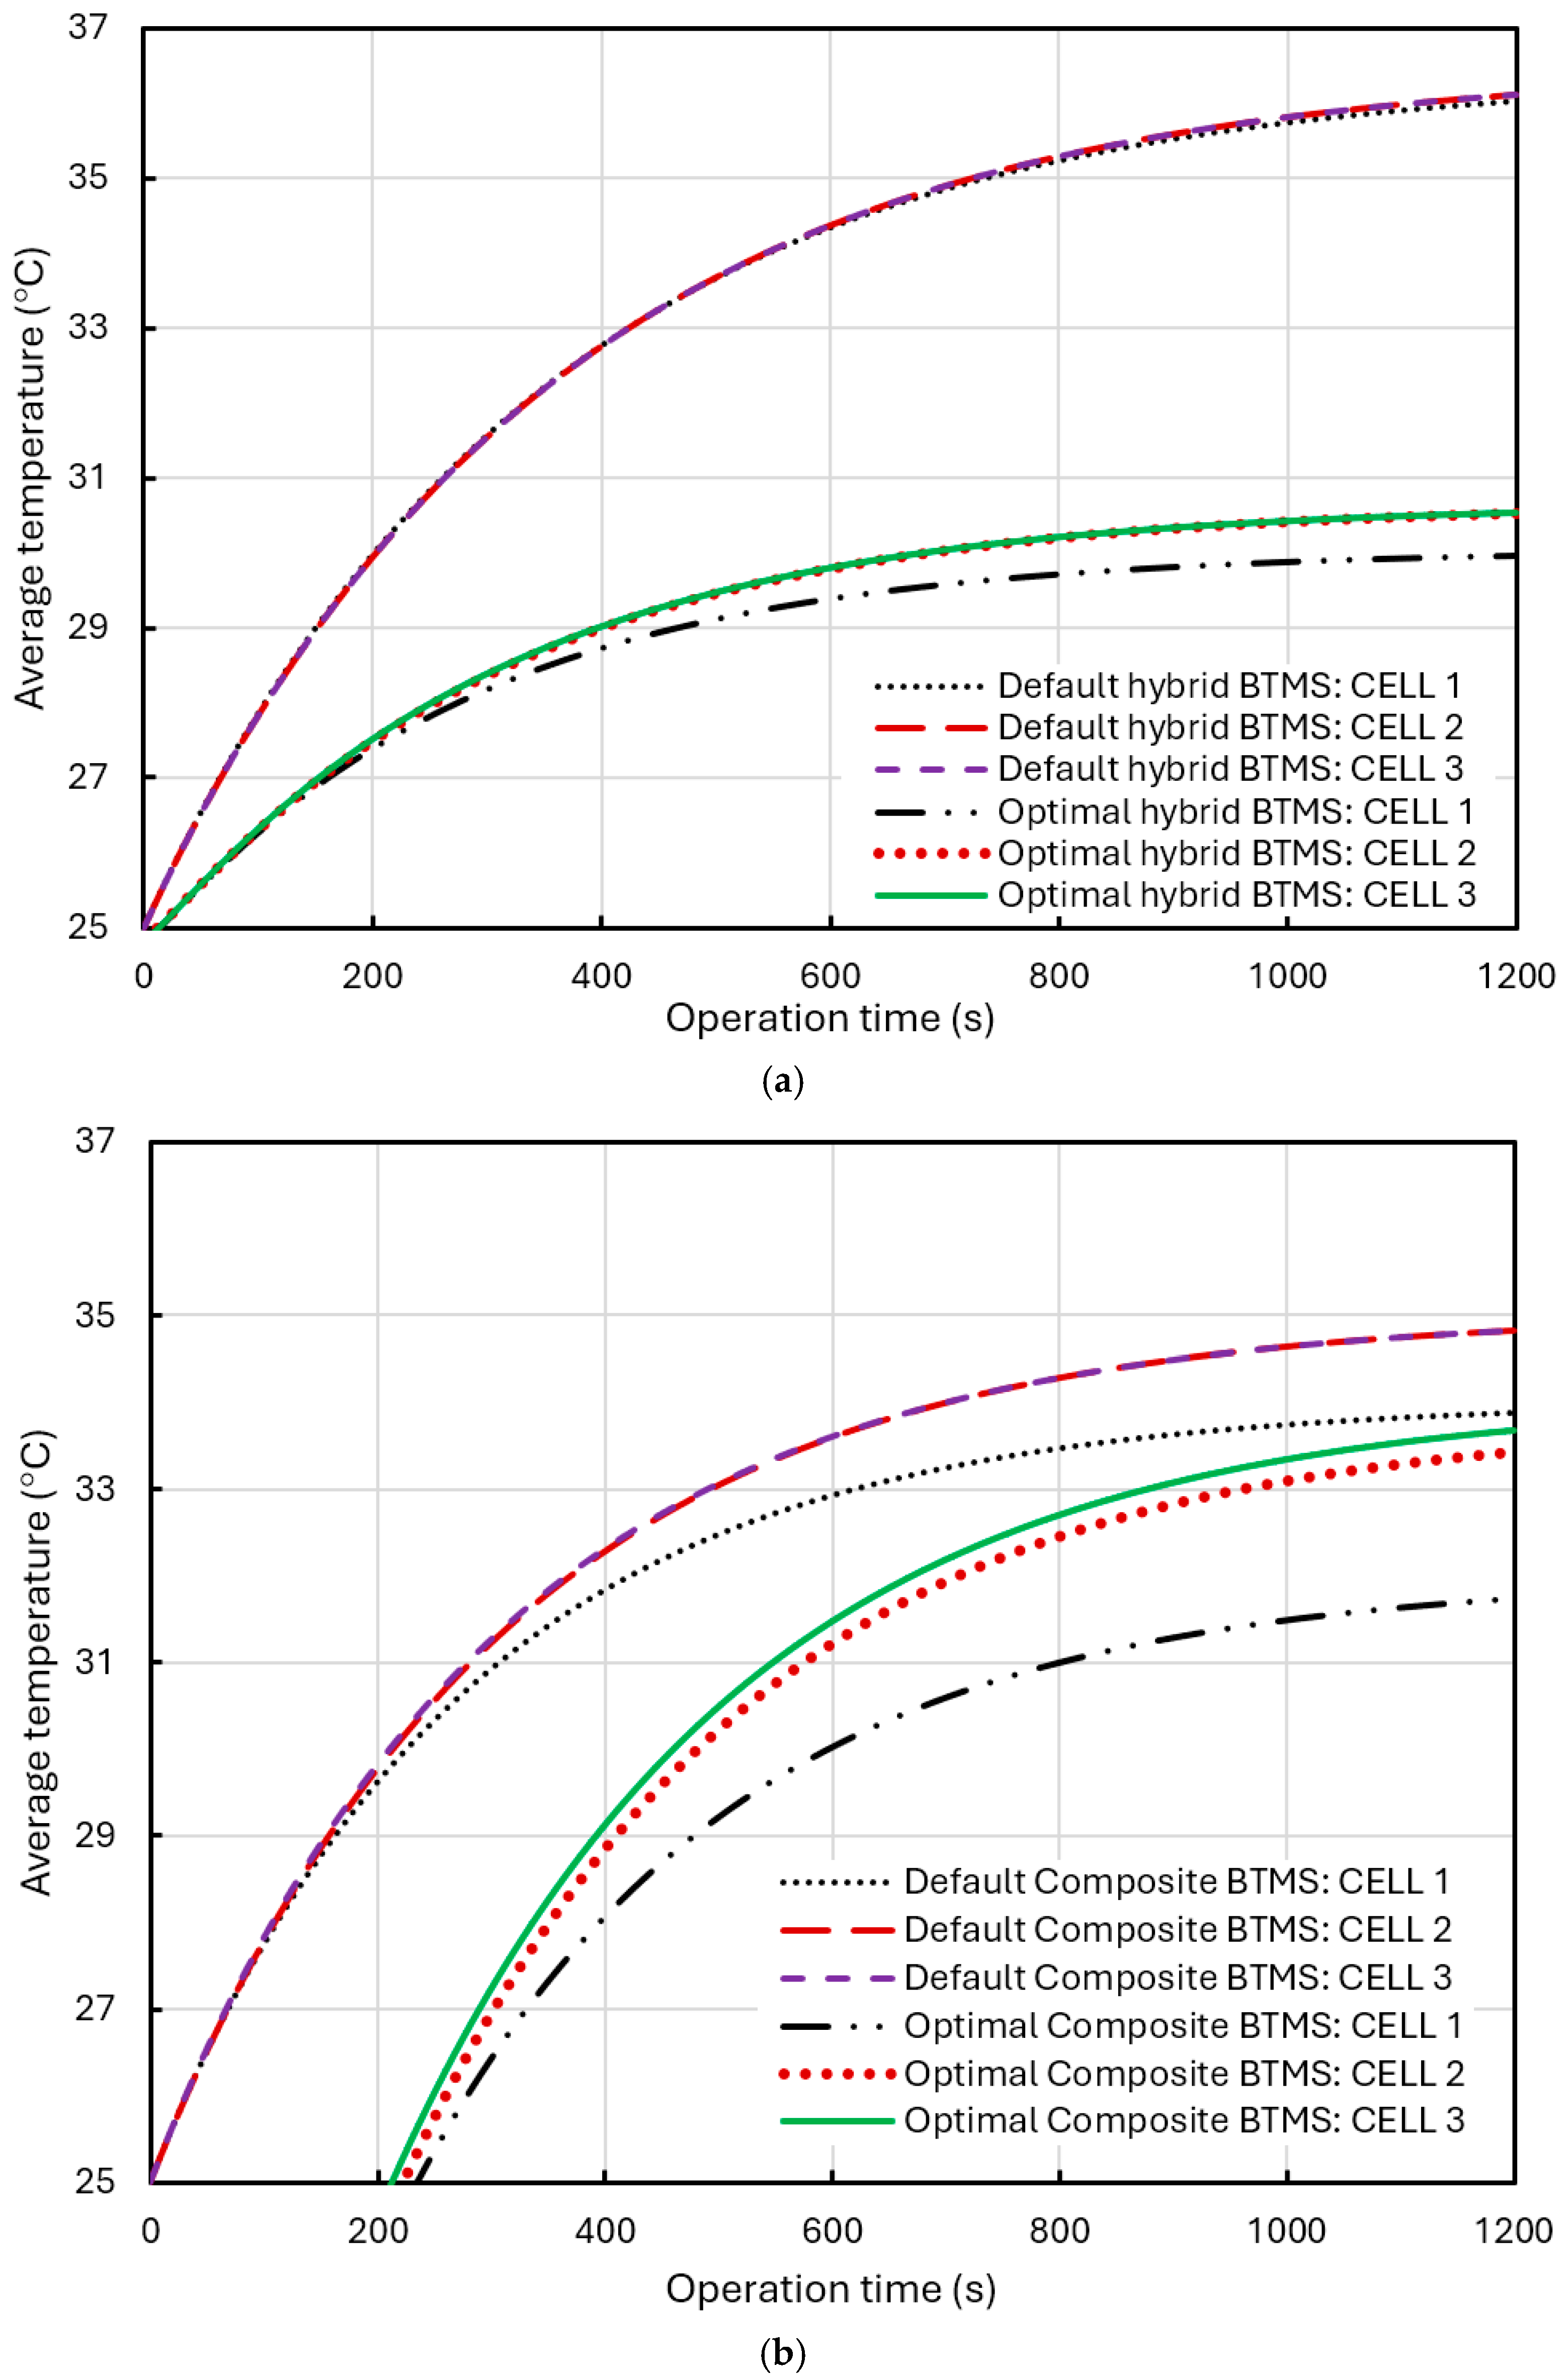
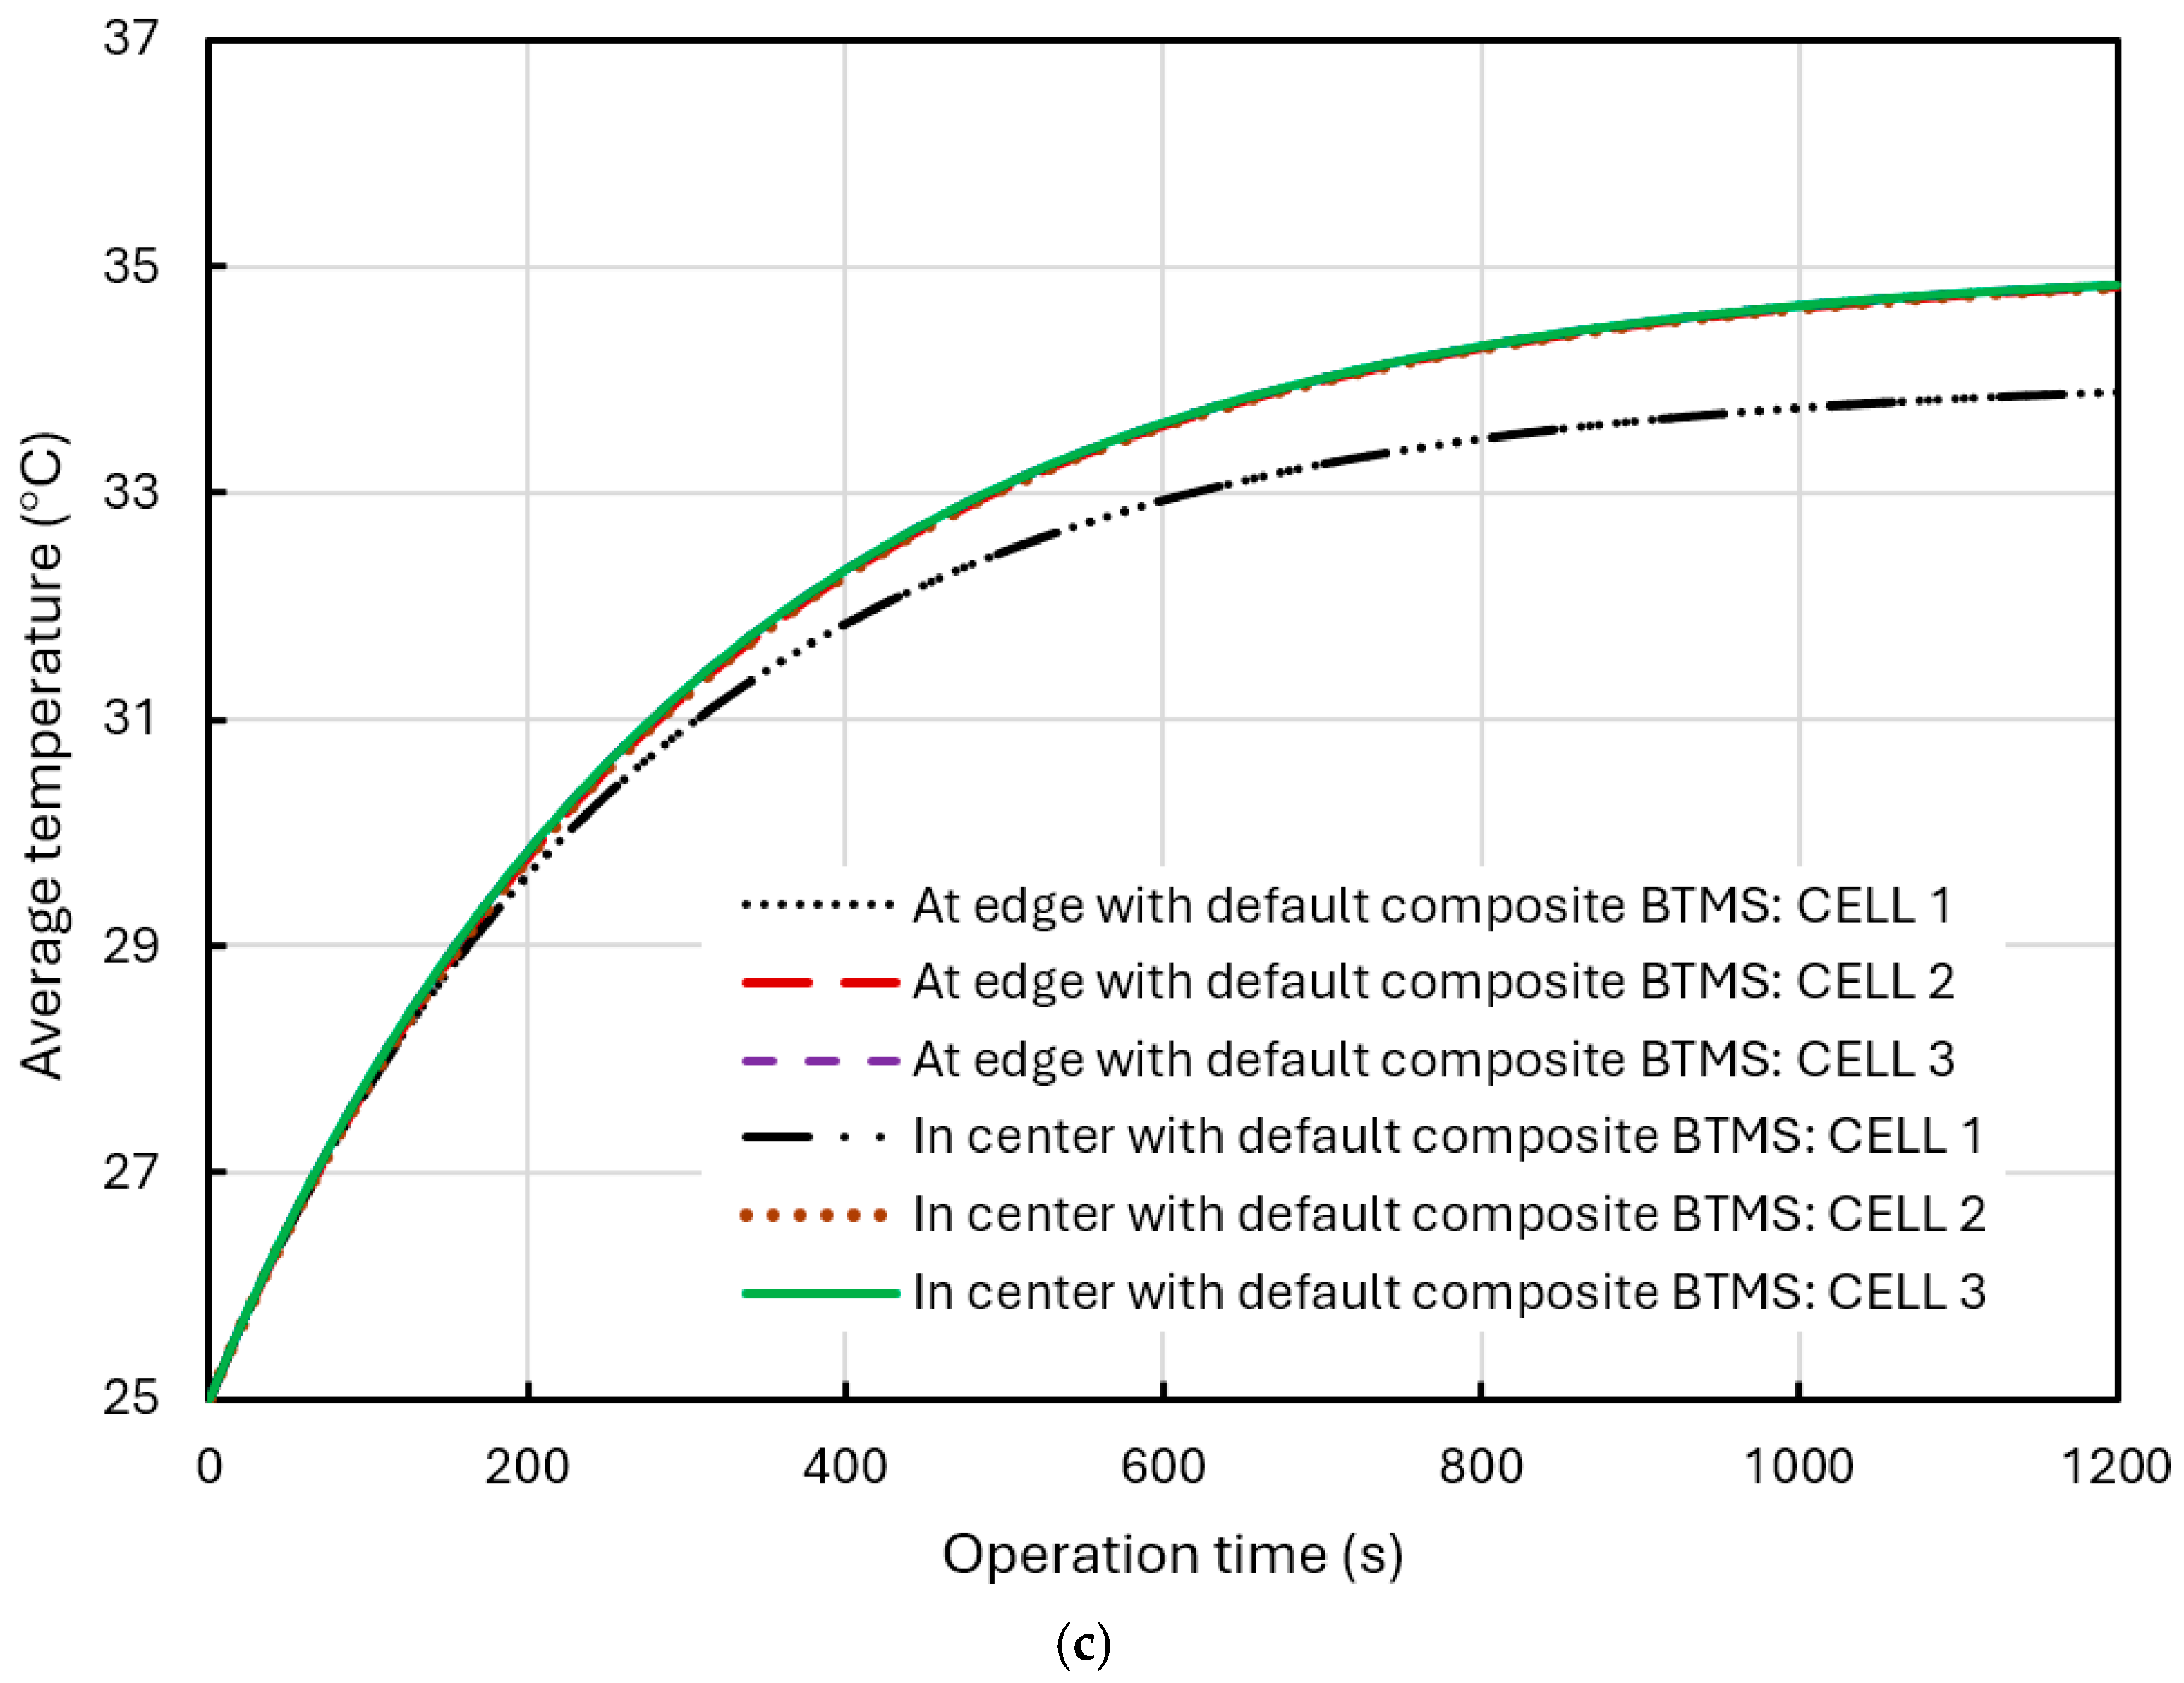
Figure 18.
Comparison of thermal performances of the three-battery-cell BP with different cooling systems of different positions: (a) default hybrid BTMS and optimal hybrid BTMS, (b) default composite BTMS and optimal composite BTMS, and (c) at the edge or in the center of the BP with the default composite BTMS.
Figure 18a shows the comparison of the average temperature in the different cells in the BP with the default hybrid BTMS (water coolant temperature of 25 °C and flow rate of 0.5 m/s) and the optimal hybrid BTMS (water coolant temperature of 15 °C and flow rate of 0.5 m/s). As shown in the figure, the liquid cooling effect is relatively uniform, and the temperatures of the three cells are quite similar. In the case of the default hybrid BTMS, the temperatures in the three different cells are almost the same high. In the case of optimal hybrid BTMS, the small rise in temperature for cell 2 is positioned between cell 1 and cell 3, and consistently higher than that of cell 1 primarily because it is affected by heat generation during operation time and heat transfer from both cell 1 and cell 3. As for the small, elevated temperature in cell 3, there are two reasons: First, the coolant absorbs heat from both cell 1 and cell 2 as it flows through cell 3; second, the U-shaped design of the cooling pipes causes the coolant to undergo a 180° turn above cell 3. When the coolant flows at the U-bend, due to inertia and curvature, the fluid on the outer side accelerates, while the fluid on the inner side decelerates, potentially leading to backflow or stagnation areas. This phenomenon can result in vortices, local stagnation, or reduced flow rates, referred to as fluid stagnation or recirculation. Ultimately, the decrease in flow rate may create a dead zone, thereby reducing the heat dissipation capability. There is a small drop in temperature for cell 1 due to the water coolant pipe being placed over cell 1 and having a better cooling effect on it.
Figure 18b shows the comparison of the average temperature in the different cells in the BP with the default composite BTMS (air flow rate of 1 m/s and initial temperature of 25 °C) and the optimal composite BTMS (air flow rate of 1 m/s and initial temperature of 15 °C). In this case, cell 2 experiences a noticeable temperature rise compared to cell 1 due to its reduced exposure to airflow, and the heat transfers from cell 1 and cell 3, positioned at the edge, have the highest temperature due to limited airflow and heat transfer from cell 2. Optimizing the air-cooling parameters can enhance the overall cooling effect of the BTMS but increased the temperature differences between the cells. However, these temperature differences remain within an acceptable range.
Figure 18c shows the comparison of the average temperature in the different cells and in the different positions of the BP under the default composite BTMS (air flow rate of 1 m/s and temperature of 25 °C). It can be seen as a minimal variation in temperature based on the battery position. The differences were so small that they do not show clearly in the comparative figure.
In Figure 18b,c, the temperature difference in the different cells arises also from the effects of air cooling. Cell 1 is positioned at the windward side of the intake, giving it the largest cooling area. In contrast, cell 2 is subject to heat transfer from both cell 1 and cell 3, resulting in a higher temperature. The temperature arises in cell 3 mainly due to the designed liquid flow in the cooling pipes and its position on the downwind side of the forced air-cooling channel, where airflow carries away heat from cell 1 and cell 2, thus reducing its cooling effectiveness. Moreover, the wind exposure areas for cell 2 and cell 3 are roughly the same, leading to their temperatures being significantly higher than that of cell 1, while cell 3 is slightly warmer than cell 2.
4. Conclusions
In this work, the thermal performances of the three-battery-cell BPs under various operational or environmental conditions were simulated and analyzed, based on the fluid mechanics standard k-ε model and computational fluid dynamics. The following key conclusions have been drawn:
- (1)
- For the BP without a BTMS (Scenario 1—natural air convection cooling only), the temperature in the BP rises rapidly and continuously to reach 63.8 °C, much higher than the upper bound of the ROTR (+20 °C~+35 °C) under the extreme discharge rate of 3 C and even if the discharge rate is 2 C.
- (2)
- For the BP with a hybrid BTMS (Scenario 2—water coolant cooling plus natural air cooling), the temperature in the BP rises much slower and tends to reach converging values after a certain operation time (after 1000 s). The maximum temperature in the BP at the steady state rises to about 38.7 °C, slightly above the upper bound of the ROTR even under the discharge rate of 3 C. Lowering the coolant (water) initial temperature can effectively lower the temperature up to 5.7 °C in the BP, but the water flow rate cannot since the turbulence model.
- (3)
- For the BP with a composite BTMS (Scenario 3—water coolant cooling plus forced air cooling), the temperature in the BP rises much slower and tends to reach converging values after a certain operation time (after 1000 s). Compared with Scenario 2, the temperature at the steady state is lowered up to 1.5 °C under the extreme discharge rate of 3 C. Lowering the coolant initial temperature and air initial temperature can effectively lower the temperatures up to 5.1 °C and 1.0 °C, respectively, in the BP, but the coolant flow rate (due to the turbulence model) and the air flow rate cannot.
- (4)
- Therefore, a hybrid BTMS can meet the cooling needs in BP to some extent. A composite BTME can be slightly better to serve the cooling needs of the BP compared to the hybrid BTMS. In future study, more thermal process parameters, such as pressure-drop, pumping-power, heat generation rate, energy efficiency, and laminar flow and transitional flow models can be analyzed, and experiments should be conducted for comparison and validation. The approach to integrate multiple cooling methods and select/develop new cooling media for further comprehensive improvement of the BTMS should be considered.
Author Contributions
Conceptualization, Y.C. and Z.H.; methodology, Y.C. and Z.H.; software, Y.C.; validation, Y.C. and Z.H.; formal analysis, Y.C. and Z.H.; investigation, Y.C. and Z.H.; resources, Y.C.; data curation, Y.C.; writing—original draft preparation, Y.C. and Z.H.; writing—review and editing, Z.H.; visualization, Y.C. and Z.H.; supervision, Z.H. All authors have read and agreed to the published version of the manuscript.
Funding
This research received no external funding.
Data Availability Statement
Data are contained within the article.
Acknowledgments
This work was supported by the J. J. Lohr College of Engineering and the Department of Mechanical Engineering at South Dakota State University, which is gratefully acknowledged.
Conflicts of Interest
The authors declare no conflicts of interest.
Appendix A
Since the coolant flow in this designed model is turbulent, the commonly used turbulent model in CFD is the standard k-ε model. This method is based on the concept of eddy viscosity. In this type of turbulence model, two transport equations, i.e., the turbulent kinetic energy k and the turbulent eddy dissipation ε, in the form of partial differential equations will be established as follows [47,48,49,50,51]:
where Gk and Gb represent the turbulent kinetic energy based on the mean velocity gradient and the turbulent kinetic energy based on buoyancy, respectively. YM represents the pulsating expansion in the total dissipation rate in compressible turbulence. C1ε, C2ε, and C3ε are constants. σk and σε denote the turbulent Prandtl numbers for and ε, respectively. Sk and Sε are user-defined source terms. ρ and ν are the density and the kinematic viscosity, respectively. The turbulent (or eddy) viscosity, μt, can be calculated based on and [51] as follows:
where is a constant. The model constants are C1ε = 1.44, C2ε = 1.92, Cμ = 0.09, σk = 1.0, and σε = 1.3, respectively.
Since the temperature distribution of the module needs to be obtained, the energy equation is therefore given by [51]
where keff represents the effective thermal conductivity (= , where is the turbulent thermal conductivity of the turbulence model), and is the diffusion flux of species . The first three terms on the right side of Equation (A4) represent the energy transfer due to conduction, species diffusion, and viscous dissipation, respectively. Sh includes the defined volumetric heat sources and the heat generation rate of the chemical reaction. However, this reaction source is not applicable to the overall enthalpy equation. In Equation (A4), the enthalpy h for an ideal gas is defined as follows:
For incompressible materials, h includes the pressure work contribution.
In Equations (A5) and (A6), Yj is the mass fraction of species j, and hj is the enthalpy change due to specific heat of species j.
For the pressure-based solver, is 298.15 K.
The internal energy e for compressible and incompressible materials is uniformly defined as
In Equation (A8), p and pop are gauge pressure and working pressure, respectively. To calculate the enthalpy and internal energy of an incompressible ideal gas can use the following general formula:
For a liquid coolant model, the k-ε model-based Navier–Stokes equations can be used. The conservation equations for the momentum, continuity, and energy terms are, respectively [52],
where ρw, cw, kw, and η represent the density, specific heat, thermal conductivity, and kinematic viscosity of coolant (water), respectively. vw, p, and Tw are the velocity vector, the static pressure, and the temperature of the coolant (water), respectively.
For the air-cooling part, the three conservation equations are [53] as follows:
where ka, Ta, va, cva, and ρ denote the thermal conductivity, temperature, velocity vector, specific heat, and static pressure of air, respectively.
References
- Friedlingstein, P.; O’Sullivan, M.; Jones, M.W.; Andrew, R.M.; Bakker, D.C.E.; Hauck, J.; Landschützer, P.; Le Quéré, C.; Luijkx, I.T.; Peters, G.P.; et al. Global carbon budget 2023. Earth Syst. Sci. Data 2023, 15, 5301–5369. [Google Scholar] [CrossRef]
- Mehmood, K.A.; Hassan, J.; Hassan, A.; Arshad, M.W.; Batool, S. Consumer’s automobile purchase: A concept. Qlantic J. Soc. Sci. Humanit. 2024, 5, 203–207. [Google Scholar] [CrossRef]
- International Energy Agency. Global EV Outlook 2023—Catching Up with Climate Ambitions. 2023. Available online: www.iea.org (accessed on 15 October 2024).
- Xia, G.; Cao, L.; Bi, G. A review on battery thermal management in electric vehicle application. J. Power Sources 2017, 367, 90–105. [Google Scholar] [CrossRef]
- Waldmann, T.; Wilka, M.; Kasper, M.; Fleischhammer, M.; Wohlfahrt-Mehrens, M. Temperature dependent ageing mechanisms in Lithium-ion batteries—A post-mortem study. J. Power Sources 2014, 262, 129–135. [Google Scholar] [CrossRef]
- Song, L.; Zheng, Y.; Xiao, Z.; Wang, C.; Long, T. Review on thermal runaway of lithium-ion batteries for electric vehicles. J. Electron. Mater. 2022, 51, 30–46. [Google Scholar] [CrossRef]
- Shim, J.; Kostecki, R.; Richardson, T.; Song, X.; Striebel, K. Electrochemical analysis for cycle performance and capacity fading of a lithium-ion battery cycled at elevated temperature. J. Power Sources 2022, 112, 222–230. [Google Scholar] [CrossRef]
- Lv, S.; Wang, X.; Lu, W.; Zhang, J.; Ni, H. The influence of temperature on the capacity of lithium ion batteries with different anodes. Energies 2022, 15, 60. [Google Scholar] [CrossRef]
- Al-Zareer, M.; Dincer, I.; Rosen, M.A. A novel approach for performance improvement of liquid to vapor based battery cooling systems. Energy Convers. Manag. 2019, 187, 191–204. [Google Scholar] [CrossRef]
- Song, W.; Chen, M.; Bai, F.; Lin, S.; Chen, Y.; Feng, Z. Non-uniform effect on the thermal/aging performance of Lithium-ion pouch battery. Appl. Therm. Eng. 2018, 128, 1165–1174. [Google Scholar] [CrossRef]
- Klein, M.; Tong, S.; Park, J.W. In-plane nonuniform temperature effects on the performance of a large-format lithium-ion pouch cell. Appl. Energy 2016, 165, 639–647. [Google Scholar] [CrossRef]
- Thawkar, V.; Dhoble, A.S. A review of thermal management methods for electric vehicle batteries based on heat pipes and PCM. J. Braz. Soc. Mech. Sci. Eng. 2023, 45, 90. [Google Scholar] [CrossRef]
- Ma, S.; Jiang, M.; Tao, P.; Song, C.; Wu, J.; Wang, J.; Deng, T.; Shang, W. Temperature effect and thermal impact in lithium-ion batteries: A review. Prog. Nat. Sci. Mater. Int. 2018, 28, 653–666. [Google Scholar] [CrossRef]
- Wu, W.; Wang, S.; Wu, W.; Chen, K.; Hong, S.; Lai, Y. A critical review of battery thermal performance and liquid based battery thermal management. Energy Convers. Manag. 2019, 182, 262–281. [Google Scholar] [CrossRef]
- Li, K.; Yan, J.; Chen, H.; Wang, Q. Water cooling based strategy for lithium-ion battery pack dynamic cycling for thermal management system. Appl. Therm. Eng. 2018, 132, 575–585. [Google Scholar] [CrossRef]
- Kabir, M.M.; Demirocak, D.E. Degradation mechanisms in Li-ion batteries: A state-of-the-art review. Int. J. Energy Res. 2017, 41, 1963–1986. [Google Scholar] [CrossRef]
- Arora, S. Selection of thermal management system for modular battery packs of electric vehicles: A review of existing and emerging technologies. J. Power Sources 2018, 400, 621–640. [Google Scholar] [CrossRef]
- Andwari, A.M.; Pesiridis, A.; Rajoo, S.; Martinez-Botas, R.; Esfahanian, V. A review of Battery Electric Vehicle technology and readiness levels. Renew. Sustain. Energy Rev. 2017, 78, 414–430. [Google Scholar] [CrossRef]
- Kim, J.; Oh, J.; Lee, H. Review on battery thermal management system for electric vehicles. Appl. Therm. Eng. 2018, 149, 192–212. [Google Scholar] [CrossRef]
- Khan, M.R.; Swierczynski, M.J.; Kær, S.K. Towards an ultimate battery thermal management system: A review. Batteries 2017, 3, 9. [Google Scholar] [CrossRef]
- Garud, K.S.; Tai, L.D.; Hwang, S.-G.; Nguyen, N.-H.; Lee, M.-Y. A review of advanced cooling strategies for battery thermal management systems in electric vehicles. Symmetry 2023, 15, 1322. [Google Scholar] [CrossRef]
- Hwang, F.S.; Confrey, T.; Reidy, C.; Picovici, D.; Callaghan, D.; Culliton, D.; Nolan, C. Review of battery thermal management systems in electric vehicles. Renew. Sustain. Energy Rev. 2024, 192, 114171. [Google Scholar] [CrossRef]
- Battery Design—From Chemistry to Pack. Available online: https://www.BatteryDesign.net (accessed on 19 January 2025).
- Rahmani, A.; Dibaj, M.; Akrami, M. Recent advancements in battery thermal management systems for enhanced performance of Li-ion batteries: A comprehensive review. Batteries 2024, 10, 265. [Google Scholar] [CrossRef]
- Tai, L.D.; Garud, K.S.; Hwang, S.-G.; Lee, M.-Y. A review on advanced battery thermal management systems for fast charging in electric vehicles. Batteries 2024, 10, 372. [Google Scholar] [CrossRef]
- Zhao, C.; Zhang, B.; Zheng, Y.; Huang, S.; Yan, T.; Liu, X. Hybrid battery thermal management system in electric vehicles: A review. Energies 2020, 13, 6257. [Google Scholar] [CrossRef]
- Jomde, A.; Patane, P.; Nadgire, A.; Patil, C.; Kolas, K.; Bhojwani, V. Battery Thermal Management System for EVs: A Review. In Energy Storage Systems. Engineering Optimization: Methods and Applications; Mathew, V.K., Hotta, T.K., Ali, H.M., Sundaram, S., Eds.; Springer: Singapore, 2023. [Google Scholar]
- Lin, Y.; Chen, Y.-W.; Yang, J.-T. Optimized thermal management of a battery energy-storage system (BESS) inspired by air-cooling inefficiency factor of data centers. Int. J. Heat Mass Transf. 2023, 200, 123388. [Google Scholar] [CrossRef]
- Al-Zareer, M.; Dincer, I.; Rosen, M.A. Electrochemical modeling, and performance evaluation of a new ammonia-based battery thermal management system for electric and hybrid electric vehicles. Electrochim. Acta 2017, 247, 171–182. [Google Scholar] [CrossRef]
- Zhang, S.; Zhao, R.; Liu, J.; Gu, J. Investigation on a hydrogel based passive thermal management system for lithium-ion batteries. Energies 2014, 68, 854–861. [Google Scholar] [CrossRef]
- Wang, J.; Gan, Y.; Liang, J.; Tan, M.; Li, Y. Sensitivity analysis of factors influencing a heat pipe-based thermal management system for a battery module with cylindrical cells. Appl. Therm. Eng. 2019, 151, 475–485. [Google Scholar] [CrossRef]
- Wu, W.; Liu, J.; Liu, M.; Rao, Z.; Deng, H.; Wang, Q.; Qi, X.; Wang, S. An innovative battery thermal management with thermally induced flexible phase change material. Energy Convers. Manag. 2020, 221, 113145. [Google Scholar] [CrossRef]
- Yue, Q.; He, C.; Jiang, H.; Wu, M.; Zhao, T. A hybrid battery thermal management system for electric vehicles under dynamic working conditions. Int. J. Heat Mass Transf. 2021, 164, 120528. [Google Scholar] [CrossRef]
- Ma, K.; Liu, J. Liquid metal cooling in thermal management of computer chips. Front. Energy Power Eng. China 2007, 1, 384–402. [Google Scholar] [CrossRef]
- Ma, K.-Q.; Liu, J. Heat-driven liquid metal cooling device for the thermal management of a computer chip. J. Phys. D Appl. Phys. 2007, 40, 4722–4729. [Google Scholar] [CrossRef]
- Huo, Y.; Rao, Z. The numerical investigation of nanofluid based cylinder battery thermal management using lattice Boltzmann method. Int. J. Heat Mass Transf. 2015, 91, 374–384. [Google Scholar] [CrossRef]
- Sui, Z.; Lin, H.; Sun, Q.; Dong, K.; Wu, W. Multi-objective optimization of efficient liquid cooling-based battery thermal management system using hybrid manifold channels. Appl. Energy 2024, 371, 123766. [Google Scholar] [CrossRef]
- Wang, J.; Feng, X.; Yu, Y.; Huang, H.; Zheng, M.; Xu, Y.; Wu, J.; Yang, Y.; Lu, J. Rapid temperature-responsive thermal regulator for safety management of battery modules. Nat. Energy 2024, 9, 939–946. [Google Scholar] [CrossRef]
- Zuo, W.; Zhang, Y.; E, J.; Li, J.; Li, Q.; Zhang, G. Performance comparison between single S-channel and double S-channel cold plate for thermal management of a prismatic LiFePO4. Renew. Energy 2022, 192, 46–57. [Google Scholar] [CrossRef]
- Zhang, Y.; Zuo, W.; E, J.; Li, J.; Li, Q.; Sun, K.; Zhou, K.; Zhang, G. Performance comparison between straight channel cold plate and inclined channel cold plate for thermal management of a prismatic LiFePO4 battery. Energy 2022, 248, 123637. [Google Scholar] [CrossRef]
- Wang, T.; Tseng, K.J.; Zhao, J.; Wei, Z. Thermal investigation of lithium-ion battery module with different cell arrangement structures and forced air-cooling strategies. Appl. Energy 2014, 134, 229–238. [Google Scholar] [CrossRef]
- Tang, Y.; Jia, M.; Li, J.; Lai, Y.; Cheng, Y.; Liu, Y. Numerical Analysis of Distribution and Evolution of Reaction Current Density in Discharge Process of Lithium-Ion Power Battery. J. Electrochem. Soc. 2014, 161, E3021–E3027. [Google Scholar] [CrossRef]
- Chacón, X.C.A.; Laureti, S.; Ricci, M.; Cappuccino, G. A review of non-destructive techniques for lithium-ion battery performance analysis. World Electr. Veh. J. 2023, 14, 305. [Google Scholar] [CrossRef]
- Ping, P.; Wang, Q.; Huang, P.; Sun, J.; Chen, C. Thermal behaviour analysis of lithium-ion battery at elevated temperature using deconvolution method. Appl. Energy 2014, 129, 261–273. [Google Scholar]
- Feng, X.; Sun, J.; Ouyang, M.; He, X.; Lu, L.; Han, X.; Fang, M.; Peng, H. Characterization of large format lithium ion battery exposed to extremely high temperature. J. Power Sources 2014, 272, 457–467. [Google Scholar] [CrossRef]
- Aruna, P.; Vasan Prabhu, V.; Krishnakumar, V.; Velmurugan, P. Review on Lithium-Ion Battery Modeling Techniques for Electric Vehicle Applications. In Advances in Communication, Devices and Networking; ICCDN 2022. Lecture Notes in Electrical, Engineering; Dhar, S., Do, D.-T., Sur, S.N., Liu, C.-M., Eds.; Springer: Singapore, 2023; Volume 1037, pp. 551–565. [Google Scholar] [CrossRef]
- Olsen, N.R.B. CFD Algorithms for Hydraulic Engineering; Department of Hydraulic and Environmental Engineering, The Norwegian University of Science and Technology: Trondheim, Norway, 2000; 80p. [Google Scholar]
- Versteeg, H.K.; Malalasekera, W. An Introduction to Computational Fluid Dynamics, 1st ed.; Longman Science & Technical: Harlow, England, 1995. [Google Scholar]
- Shih, T.-H.; Liou, W.W.; Shabir, A.; Yang, A.; Zhu, J. A new k-ε Eddy-viscosity model for high Reynolds number turbulent flows-model development and validation. Comput. Fluids 1995, 24, 227–238. [Google Scholar] [CrossRef]
- Bulat, M.P.; Bulat, P.V. Comparison of turbulence models in the calculation of supersonic separated flows. World Appl. Sci. J. 2013, 27, 1263–1266. [Google Scholar]
- ANSYS, Inc. Ansys Fluent Theory Guide 2022/R1; Ansys, Inc.: Canonsburg, PA, USA, 2022. [Google Scholar]
- Sun, J.; Dan, D.; Wei, M.; Cai, S.; Zhao, Y.; Wright, E. Pack-level modeling and thermal analysis of a battery thermal management system with phase change materials and liquid cooling. Energies 2023, 16, 5815. [Google Scholar] [CrossRef]
- Ye, J.; Aldaher AY, M.; Tan, G. Thermal performance analysis of 18,650 battery thermal management system integrated with liquid-cooling and air-cooling. J. Energy Storage 2023, 72, 108766. [Google Scholar] [CrossRef]
- Xia, B.; Liu, Y.; Huang, R.; Yang, Y.; Lai, Y.; Zheng, W.; Wang, H.; Wang, W.; Wang, M. Thermal analysis and improvements of the power battery pack with liquid cooling for electric vehicles. Energies 2019, 12, 3045. [Google Scholar] [CrossRef]
- EVE, LF50F. Available online: https://evemall.com/ (accessed on 19 April 2024).
- Bernardi, D.; Pawlikowski, E.; Newman, J. A general energy balance for battery systems. J. Electrochem. Soc. 1985, 132, 5–12. [Google Scholar] [CrossRef]
- Sagar, P.; Teotia, P.; Sahlot, A.D.; Thakur, H.C. Heat transfer analysis and optimization of engine fins of varying surface roughness. Mater. Today Proc. 2017, 4, 8565–8570. [Google Scholar] [CrossRef]
- Yu, M.; Modesti, D.; Pirozzoli, S. Direct numerical simulation of flow in open rectangular ducts. J. Fluid Mech. 2023, 977, A32. [Google Scholar] [CrossRef]
- Wang, X.; Liang, X.; Hao, Z.; Chen, R. Comparison of electrical and mechanical water pump performance in internal combustion engine. Int. J. Veh. Syst. Model. Test. 2015, 10, 205–223. [Google Scholar] [CrossRef]
- Zhang, L.; Li, J.; Feng, Z.; Peng, S.; Zhao, S. Research on multi-objective optimization of automotive electronic water pump motor considering the factor of gap viscous loss. Struct. Multidiscip. Optim. 2022, 65, 243. [Google Scholar] [CrossRef]
- Bhagavathy, S.M.; Budnitz, H.; Schwanen, T.; McCulloch, M. Impact of charging rates on electric vehicle battery life. Findings 2021. [Google Scholar] [CrossRef]

Disclaimer/Publisher’s Note: The statements, opinions and data contained in all publications are solely those of the individual author(s) and contributor(s) and not of MDPI and/or the editor(s). MDPI and/or the editor(s) disclaim responsibility for any injury to people or property resulting from any ideas, methods, instructions or products referred to in the content. |
© 2025 by the authors. Licensee MDPI, Basel, Switzerland. This article is an open access article distributed under the terms and conditions of the Creative Commons Attribution (CC BY) license (https://creativecommons.org/licenses/by/4.0/).