Article

Economic Analysis of Supply Chain for Offshore Wind Hydrogen Production for Offshore Hydrogen Refueling Stations

1
CHN Energy Hydrogen Innovation Technology Co., Ltd., Beijing 100007, China
2
Guohua Energy Investment Co., Ltd., Beijing 100007, China
3
School of Economics and Management, North China Electric Power University, Beijing 102206, China
4
State Grid Shanghai Economic Research Institute, Shanghai 200235, China
5
Beijing Key Laboratory of New Energy and Low-Carbon Development, Beijing 102206, China
*
Author to whom correspondence should be addressed.
Energies 2025, 18(3), 483; https://doi.org/10.3390/en18030483
Submission received: 20 November 2024 / Revised: 9 January 2025 / Accepted: 20 January 2025 / Published: 22 January 2025
(This article belongs to the Special Issue Innovative Hydrogen Energy Processes and Technologies II)

Abstract

:
In order to solve the problem of large-scale offshore wind power consumption, the development of an offshore wind power hydrogen supply chain has become one of the trends. In this study, 10 feasible options are proposed to investigate the economics of an offshore wind hydrogen supply chain for offshore hydrogen refueling station consumption from three aspects: offshore wind hydrogen production, storage and transportation, and application. The study adopts a levelized cost analysis method to measure the current and future costs of the hydrogen supply chain. It analyses the suitable transport modes for delivering hydrogen to offshore hydrogen refueling stations at different scales and distances, as well as the profitability of offshore hydrogen refueling stations. The study draws the following key conclusions: (1) the current centralised wind power hydrogen production method is economically superior to the distributed method; (2) gas-hydrogen storage and transportation is still the most economical method at the current time, with a cost of CNY 32.14/kg, which decreases to CNY 13.52/kg in 2037, on a par with the cost of coal-based hydrogen production using carbon capture technology; and (3) at the boundaries of an operating load factor of 70% and a selling price of CNY 25/kg, the offshore hydrogen refueling station. The internal rate of return (IRR) is 21%, showing good profitability; (4) In terms of the choice of transport mode for supplying hydrogen to the offshore hydrogen refueling station, gas-hydrogen ships and pipeline transport will mainly be used in the near future, while liquid organic hydrogen carriers and synthetic ammonia ships can be considered in the medium to long term.

1. Introduction

With the intensification of the global climate change problem, the international community has adopted the Paris Agreement to control the increase in global average temperature to within 2 °C of the pre-industrial level by the end of this century and strive to control it to within 1.5 °C [
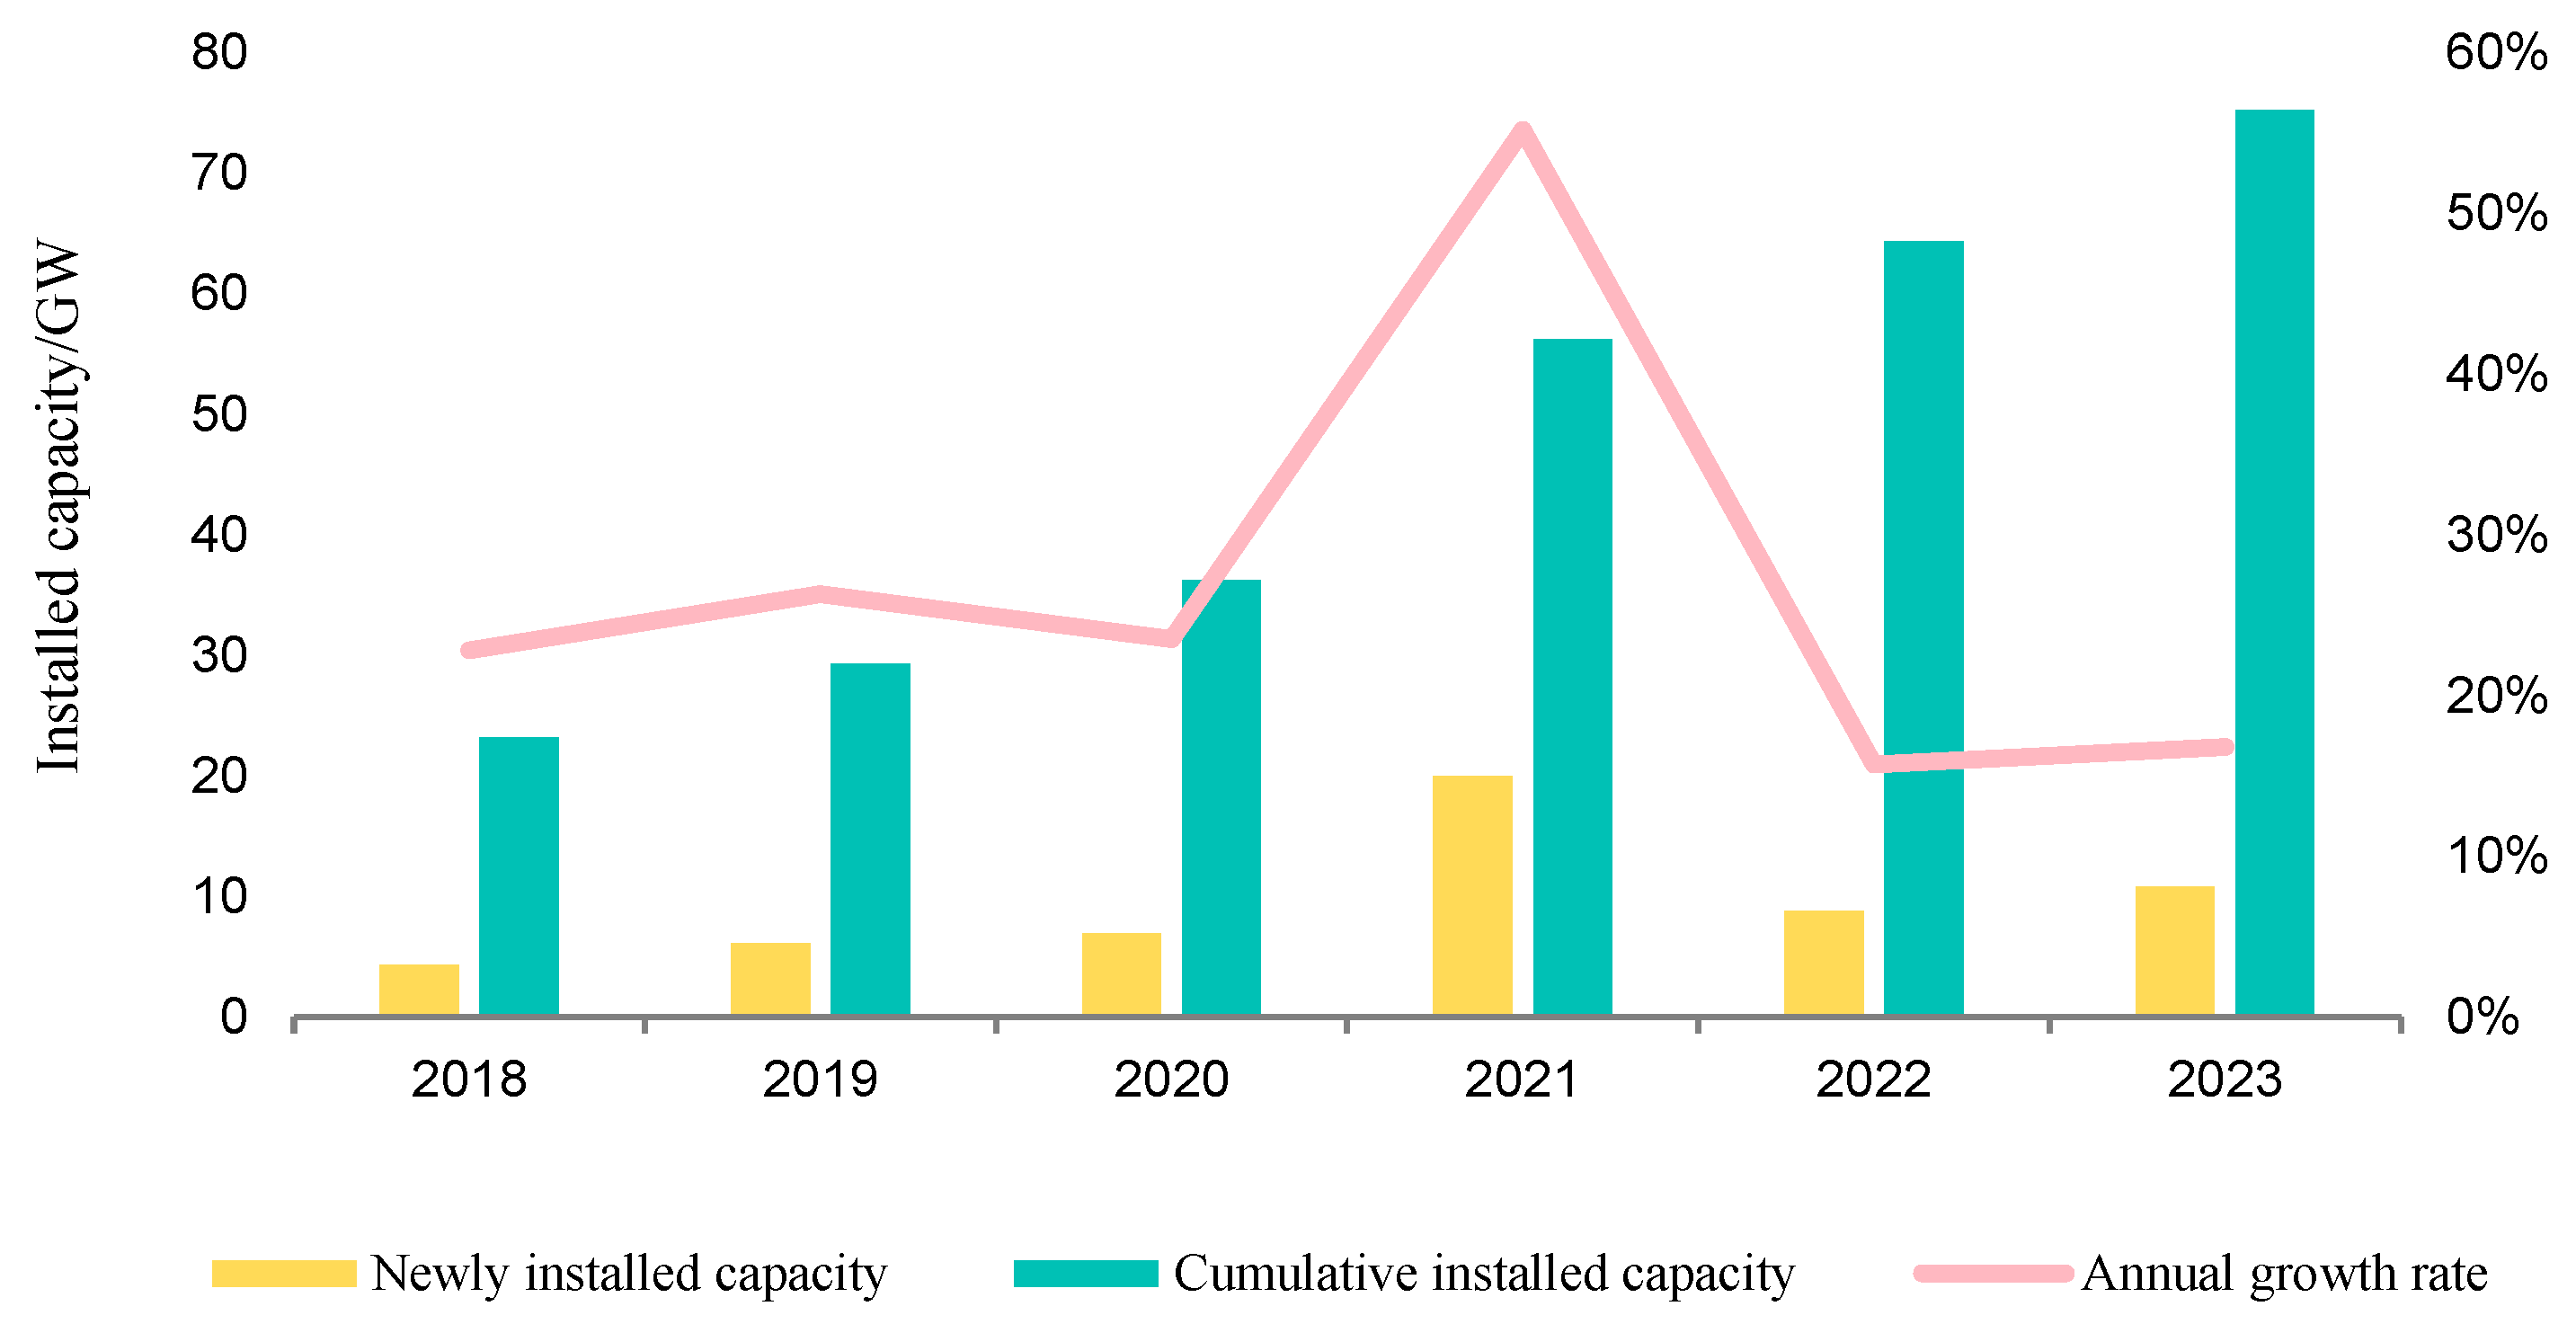
1], while the Chinese government has committed itself to the goal of carbon peaking by 2030 and carbon neutrality by 2060. Against this background, the transition from fossil energy to clean and low-carbon energy has become an urgent need, especially the promotion of the use of renewable energy sources such as solar and wind power. Offshore wind power has gradually become an important direction in the global energy transition due to its high efficiency and low environmental impact. According to the report of the Global Wind Energy Council (GWEC), the global offshore wind power newly installed capacity will reach 10.8 GW in 2023, and the cumulative installed capacity will be 75.2 GW; China’s performance in the field of offshore wind power is outstanding, with the new and cumulative installed capacity ranking first place in the world, as shown in Figure 1. By the end of 2023, China’s cumulative installed capacity of offshore wind power exceeded 30 million kilowatts, accounting for about half of the world’s offshore wind power capacity.
The development of offshore wind power is faced with two significant problems: the high-cost transmission of electricity and large-scale consumption [2]. China’s current offshore transmission network architecture cannot support the transmission capacity of large-scale offshore wind power, which makes the transmission of large-scale offshore wind power subject to double limitations in capacity and distance. Offshore wind power hydrogen technology can effectively alleviate the problem of simultaneous, large-scale grid-connected consumption difficulties, reduce power abandonment, and improve the utilization rate of wind energy; for the high cost of electricity delivery of offshore wind power in the distant sea through electrolysis of water, the use of pipelines or ships will be hydrogen delivery, in terms of cost and cycle time have advantages, but also the use of existing natural gas pipeline doping combustion of hydrogen, to further reduce the cost of hydrogen delivery, and to further promote the development of China’s low-carbon energy system development. Therefore, the study of hydrogen production from offshore wind power is crucial to the development of offshore wind power.
The shipping industry is responsible for approximately 90% of global trade traffic, and reductions in emissions from the shipping industry are critical to combating global climate change. In July 2023, the International Maritime Organization (IMO) adopted a revised Greenhouse Gas Emission Reduction Strategy for Ships, announcing the need for the maritime industry to achieve a 20% reduction in total GHG emissions by 2030 compared to 2008 and a development target of net zero emissions by around 2050. The use of hydrogen-fueled ships is one of the solutions to achieve zero-carbon maritime shipping. The construction of marine hydrogen refueling stations to provide hydrogen sources for hydrogen ships travelling to and from the sea will solve the problem of hydrogen ships’ range [3].
The economic analysis of the offshore wind hydrogen supply chain for an offshore hydrogen refueling station consumption is a complex and multidimensional research field, which involves not only the development level of offshore wind technology, the efficiency and cost of hydrogen production from electrolytic water but also the storage, transport, and final distribution of hydrogen. Despite the enormous potential and advantages of offshore wind hydrogen production technology, such as its proximity to hydrogen consumption centers and its ability to effectively utilize the abundant wind resources offshore, it still faces many challenges in terms of economics. These challenges include, but are not limited to, the high cost of offshore wind power construction and maintenance, the investment and operating costs of electrolytic water hydrogen production equipment, the safety and efficiency issues of hydrogen storage and transport, and the economic burden of hydrogen refueling station construction and operation.
Hydrogen has a wide range of applications in several fields. In the medical field, hydrogen therapy is effective for many diseases such as neurological, respiratory, skin, etc., conditions. Hydrogen released from magnesium metal in medical materials also has a positive effect. In the industrial field, hydrogen plays an indispensable role in the chemical industry, metal processing, welding, and other industries. Nowadays, research on hydrogen consumption has become a hotspot; in particular, its application as a fuel in the field of transportation has attracted much attention. Hydrogen, as a sustainable energy carrier, is valued for its environmentally friendly characteristics, and green hydrogen supply chain design and related infrastructure design analysis have become a research hotspot [4,5,6,7,8,9]. Research focuses on the techno-economic analysis and modeling optimization of renewable energy-based hydrogen supply chains. Literature [10] investigates the cost competitiveness of using renewable hydrogen in 75% of light-duty vehicles in Germany, compared to conventional fuels. Literature [11] analyzes the economics of the hydrogen supply chain for different market penetration rates, exploring the costs and optimal configurations of five hydrogen transport routes. Literature [12] analyzes the system architecture, the requirements of each monitoring subsystem of the onshore hydrogen refueling station, offshore hydrogen production station and offshore wind turbine. In this way, the energy management requirements were stratified. Literature [13] proposes a wind-powered hydrogen supply system planning and optimization method and investigates the configuration and cost of six hydrogen demand scenarios using Jeju Island, South Korea, as an example. Literature [14] develops a hydrogen supply chain optimization model based on wind power generation, taking into account practical factors such as wind speed variations and energy storage, aiming to decarbonize the UK transport sector.
For economic research into wind power hydrogen production technology, literature [15] uses the levelized cost analysis method and internal rate of return method to analyze the cost-benefit changes in hydrogen production, hydrogen storage, and hydrogen transportation, and puts forward an economic analysis model of wind power hydrogen production considering the transmission of the industrial chain, which provides references to the new development mode of the wind power industry in the new energy consumption constrained areas under the background of a comprehensive levelized price and grid access. Literature [16] puts forward four models of self-provided power plants or direct power supply and the local use of hydrogen or access to the natural gas pipeline network, estimates and compares the economics of each model, and draws the preliminary conclusions that the hydrogen market is the most crucial factor for the economics of wind power hydrogen production; the economics of the direct supply of wind power is better than the external transmission of hydrogen, and the access to the natural gas pipeline network of wind power hydrogen production needs the support of economic policies in various aspects, and so on. Ref. [17] analyses the economics of different offshore wind project development models, taking “wind abandonment” as an essential factor, and concludes that the grid-connected electricity sales model has the best economics. In [18] the synergistic operation of an offshore wind farm and a hydrogen production-storage system is investigated, and an optimization model is developed to configure the wind hydrogen production chain to maximize the sales profit. Literature [19] concludes that in the process of actively developing the offshore wind power hydrogen industry, the hidden bottleneck constraints should be guarded against, from the perspective of policy standards, industrial layout, core technology, etc., China should scientifically design and reasonably lay out, to promote the development of the combination of offshore wind power and the hydrogen industry, and to help achieve the carbon peaking and carbon neutrality goals. In literature [20], a feasibility evaluation model for hydrogen production from offshore wind farms was developed to quickly assess or optimize the economics and practicality of hydrogen production systems for dedicated offshore wind farms. Comprehensively, wind power hydrogen production technology has significant economic benefits and application potential in areas with limited new energy consumption, and the cost-effectiveness of wind power hydrogen production is affected by multiple factors, such as hydrogen market demand, the economics of direct wind power supply, and policy support. In the future, the synergistic optimization of offshore wind power and hydrogen production-storage systems and policy support will be the key to promoting the development of wind power hydrogen production technology.
Although numerous studies have initially explored the technology, market, and economics of offshore wind hydrogen production, most of these studies have measured the economics of delivering offshore wind hydrogen to shore. Relatively few studies have been conducted on the economics of offshore wind hydrogen supply chains that are directly orientated towards offshore hydrogen refueling stations for consumption. Furthermore, in the aspect of solid-state hydrogen storage, although relevant studies have been conducted, it is limited by issues such as materials, slow absorption and release rates, and high requirements for temperature and storage and transportation equipment [21]. Based on the current technology, practical application at an acceptable cost has not yet been achieved [22]. Moreover, offshore wind hydrogen production and onshore wind hydrogen production have their own characteristics, as shown in Table 1. It is meaningful work to study the supply chain of hydrogen production from offshore wind power.
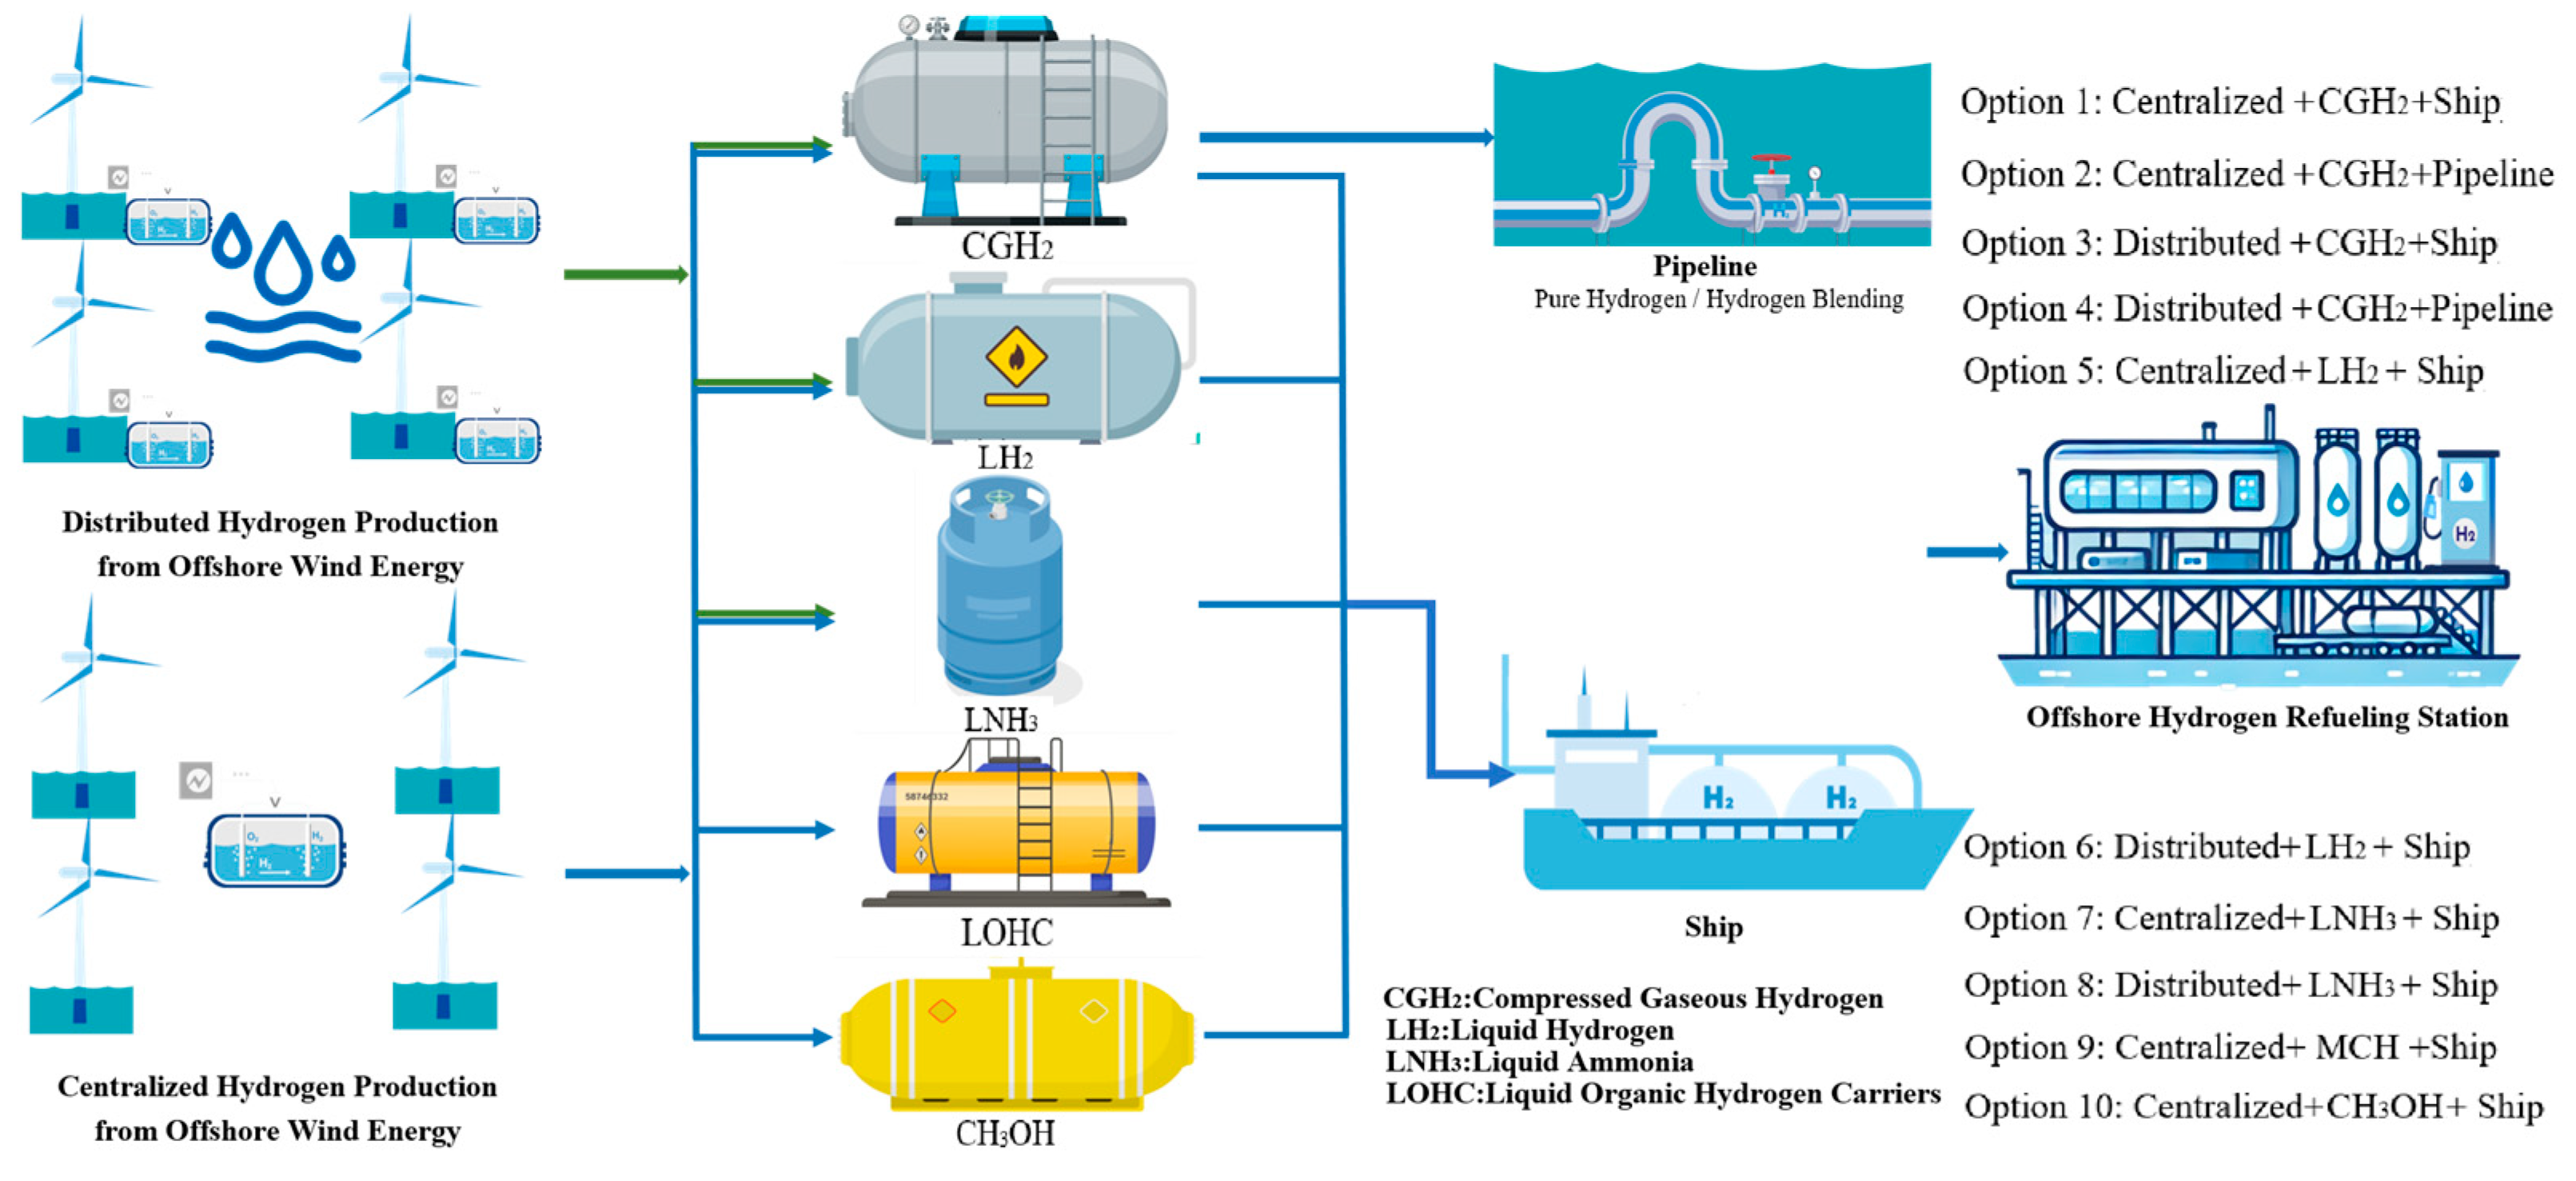
Therefore, this study investigates the economics of the offshore wind power hydrogen supply chain for offshore hydrogen refueling station consumption by proposing 10 feasible options for hydrogen production, storage and transportation, and application, as well as combining different hydrogen carriers. Using a levelized cost analysis method, the cost of the three links in the supply chain is measured, and a comparison of the economics of the 10 scenarios reveals that centralized hydrogen production is more economical than distributed hydrogen production in the current year; gas-hydrogen storage and transportation is still the most economical method; and offshore hydrogen refueling stations are very profitable in the guaranteed demand situation.

2. Introduction to the Offshore Wind Hydrogen Supply Chain

2.1. Boundary of Offshore Wind Hydrogen Supply Chain

The offshore wind power hydrogen system supply chain is a complex network that converts and distributes clean energy from the source to the end user; this study analyzes the offshore wind power hydrogen supply chain to the hydrogen production end, storage and transportation end and the application end of the three links, the comparison with the onshore wind hydrogen supply chain system, with the addition of offshore platforms in the offshore wind hydrogen supply chain system as shown in Figure 2.
Firstly, offshore wind farms make use of the abundant wind resources at sea and convert wind energy into electricity through wind turbines; the electricity produced is transmitted to electrolysis stations through submarine cables, and the electrolysis stations use electrolysis tanks to convert the electricity into hydrogen; in order to facilitate the transport of hydrogen, it is converted into a variety of hydrogen carriers, which are transported to the offshore hydrogen refueling stations through ships or submarine pipelines; the offshore hydrogen refueling stations, as the end link of the supply chain, provide fuel for the hydrogen The marine hydrogen refueling station serves as the end link in the supply chain to provide fuel for hydrogen fuel cell ships traveling at sea.

2.2. Study on the Technical Route of Hydrogen Production from Offshore Wind Power

A total of 10 options have been combined based on different technologies for power generation and storage and transport, as shown in Figure 2. Centralized hydrogen production can take advantage of economies of scale, and distributed hydrogen production reduces the need for long-distance transmission; ship transport faces transport efficiency and cost challenges, while pipeline transport is suitable for wind farms with close offshore distances and is more reliable but with a larger initial investment; liquid organic hydrogen carriers and synthesis of methanol options require larger reactors and separation equipment and have larger platform space requirements, and therefore wind turbine semi-submersible distributed production is not considered as a program; the liquid pipeline transport of liquid hydrogen, liquid ammonia, methanol, and liquid organic hydrogen carriers is not considered, given the high pressure on the walls of the liquid transport pipeline and the high cost of the pipeline.

3. Offshore Wind Hydrogen Supply Chain Economic Analysis Model

3.1. Modeling and Methodology

This study constructs a Levelized Cost of Hydrogen (LCOH) model to calculate the average cost per unit mass of hydrogen to evaluate the economics of the offshore wind hydrogen supply chain. Levelized, i.e., considering the impact of the time value of money on cost, the analysis method of levelized cost is widely used in the economic evaluation of energy projects, and this study calculates the cost of hydrogen in each link according to the characteristics of each link of the supply chain separately. The formula is shown in Equations (1)–(3) [23,24,25,26].
Levelized costing formula for hydrogen production:
L C O H P = t = 1 n C C A P E X R O + C O M + C I N T + C T A X 1 + i t t = 1 n H t 1 + i t
where L C O H P denotes the levelized cost of hydrogen production, CNY/kg; C C A P E X denotes the initial investment (including capital investment such as an offshore wind farm and electrolyzer), CNY; R O denotes the residual value of fixed assets, CNY; C O M , C I N T and C T A X denote the operating cost, interest cost, and tax cost in the t-th year, CNY; t denotes the operating time of the project, years; n denotes the total operating time of the project, years; i denotes the discount rate.
Levelized costing formula for hydrogen transport:
L C O H T = t = 1 n C C A P E X , T R O + C O M , T 1 + i t t = 1 n P H 2 1 + i t
where C C A P E X , T denotes the initial investment cost of the transport facility, CNY; R O denotes the residual value of fixed assets, CNY; C O M , T denotes the operating cost of transport, CNY; P H 2 denotes the total amount of hydrogen transported per year, kg; t denotes the operating time of the project, years; n denotes the total operating time of the project, years; i denotes the discount rate.
Hydrogen refueling levelized costing formula:
L C O H A = t = 1 n C C A P E X R O + C O M + C I N T + C T A X 1 + i t t = 1 n A H 2 1 + i t
where C C A P E X denotes the initial investment cost of the refueling facility of the offshore hydrogen refueling station, CNY; R O denotes the residual value of fixed assets, CNY; C O M denotes the operating cost of the hydrogen refueling station, CNY; A H 2 denotes the total amount of hydrogen refuelled annually, kg.
The learning curve model was used to predict the future costs and the formula was calculated as in Equation (4)
C t = C 0 e a t
where C t denotes the fixed cost investment in year t; C 0 denotes the fixed cost investment in the initial year; and a denotes the technological progress rate. The technological progress rate, or learning rate, which means the annual rate of reduction in fixed cost investment, will change according to the country’s policy preference for offshore wind hydrogen production technology and the intensity of investment in science and technology research and development.

3.2. Hydrogen Production End

The hydrogen production end-use economic model incorporates several factors, including the total number of turbines and the size of the individual turbines to calculate the power resources available for hydrogen production accurately; the total capacity of alkaline electrolyzers and proton exchange membrane electrolyzers to ensure that hydrogen production efficiency and capacity are optimized; the capacity allocation of electrochemical storage to balance the fluctuations in power supply and demand and to further enhance the economics of hydrogen production; and the distance to the shore, which is an essential factor in the cost and infrastructure development for the transport of hydrogen, is also included in the model for comprehensive analysis. Transport costs and infrastructure development are also included in the model for comprehensive analysis.

3.3. Storage and Transport Side

3.3.1. Hydrogen Conversion and Reduction

Hydrogen may need to exist in different forms in different application scenarios. Therefore, hydrogen can be converted in some ways to forms more suitable for storage and transport, such as liquid hydrogen, liquid ammonia, liquid organic light carriers (LOHCs), and methanol. These conversion technologies improve the storage density and transport efficiency of hydrogen by converting it into forms that are easier to handle and transport through chemical or physical processes.

3.3.2. Hydrogen Transport

The transport process is divided into ship transport and pipeline transport, and the specific calculation formula is as follows:
(1)
Ship transport
For the maritime transport of energy, the initial investment costs are related to the purchase of the vessel, and the operating expenses are related to labor, fuel, maintenance, and insurance costs.
The number of days a ship is in transit is related to its operating costs.
t t r a n s = 2 × t o n e   w a y + t l o a d + t m a r g i n
t t r a n s denotes the total number of days of ship transport, t o n e   w a y indicates the number of days for one-way transport, and t l o a d indicates the time required for loading and unloading; t m a r g i n indicates residual time, which means the reaction time of a ship in the case of human factors or changes in the natural environment, etc.
Labor costs: rotation between crews:
O P E X l a b o r = C l a b o r × N l a b o r × 2
Fuel costs:
O P E X f u l e = C f u l e × d × N f u l e + t t r a n s × N u s e
C l a b o r denotes the unit cost of labor. N l a b o r denotes the number of personnel. C f u l e denotes the unit cost of fuel. d denotes the distance travelled. N f u l e denotes the fuel usage per unit mileage. N u s e indicates the daily fuel consumption consumed in daily life while traveling.
(2)
Pipeline transport
The formula for calculating the total installed cost of piping is:
P P L I C = C P P L M + C P P L C + C P P L O × l
Material cost per kilometer of pipeline C P P L M calculated by the formula:
C P P L M = 0.0207982 × P P L p i n × e D P P L · 0.0697
where P P L p i n is the inlet pressure in Pa; D P P L is the pipe diameter in inches.
Construction cost per kilometer of pipeline C P P L C calculated by the formula:
C P P L C = 44.69 × D P P L 2 + 32,288 × D P P L + 14,062
Miscellaneous costs per kilometer of pipeline C P P L O calculated by the formula:
C P P L O = 263.60 × D P P L 2 + 37,846.8 × D P P L + 107,171

3.4. Applications

The offshore hydrogen refueling station is the end link of the supply chain. It is assumed that the offshore hydrogen refueling station is 100 km away from the hydrogen source point, and the hydrogen refueling station is constructed by manually filling in the island. The cost components are shown in Table A4 in Appendix A.
The economics of the options mentioned above were analyzed and measured from various perspectives, supported by data from project research and literature.

4. Results and Analyses

(1)
Supply chain cost measurement results
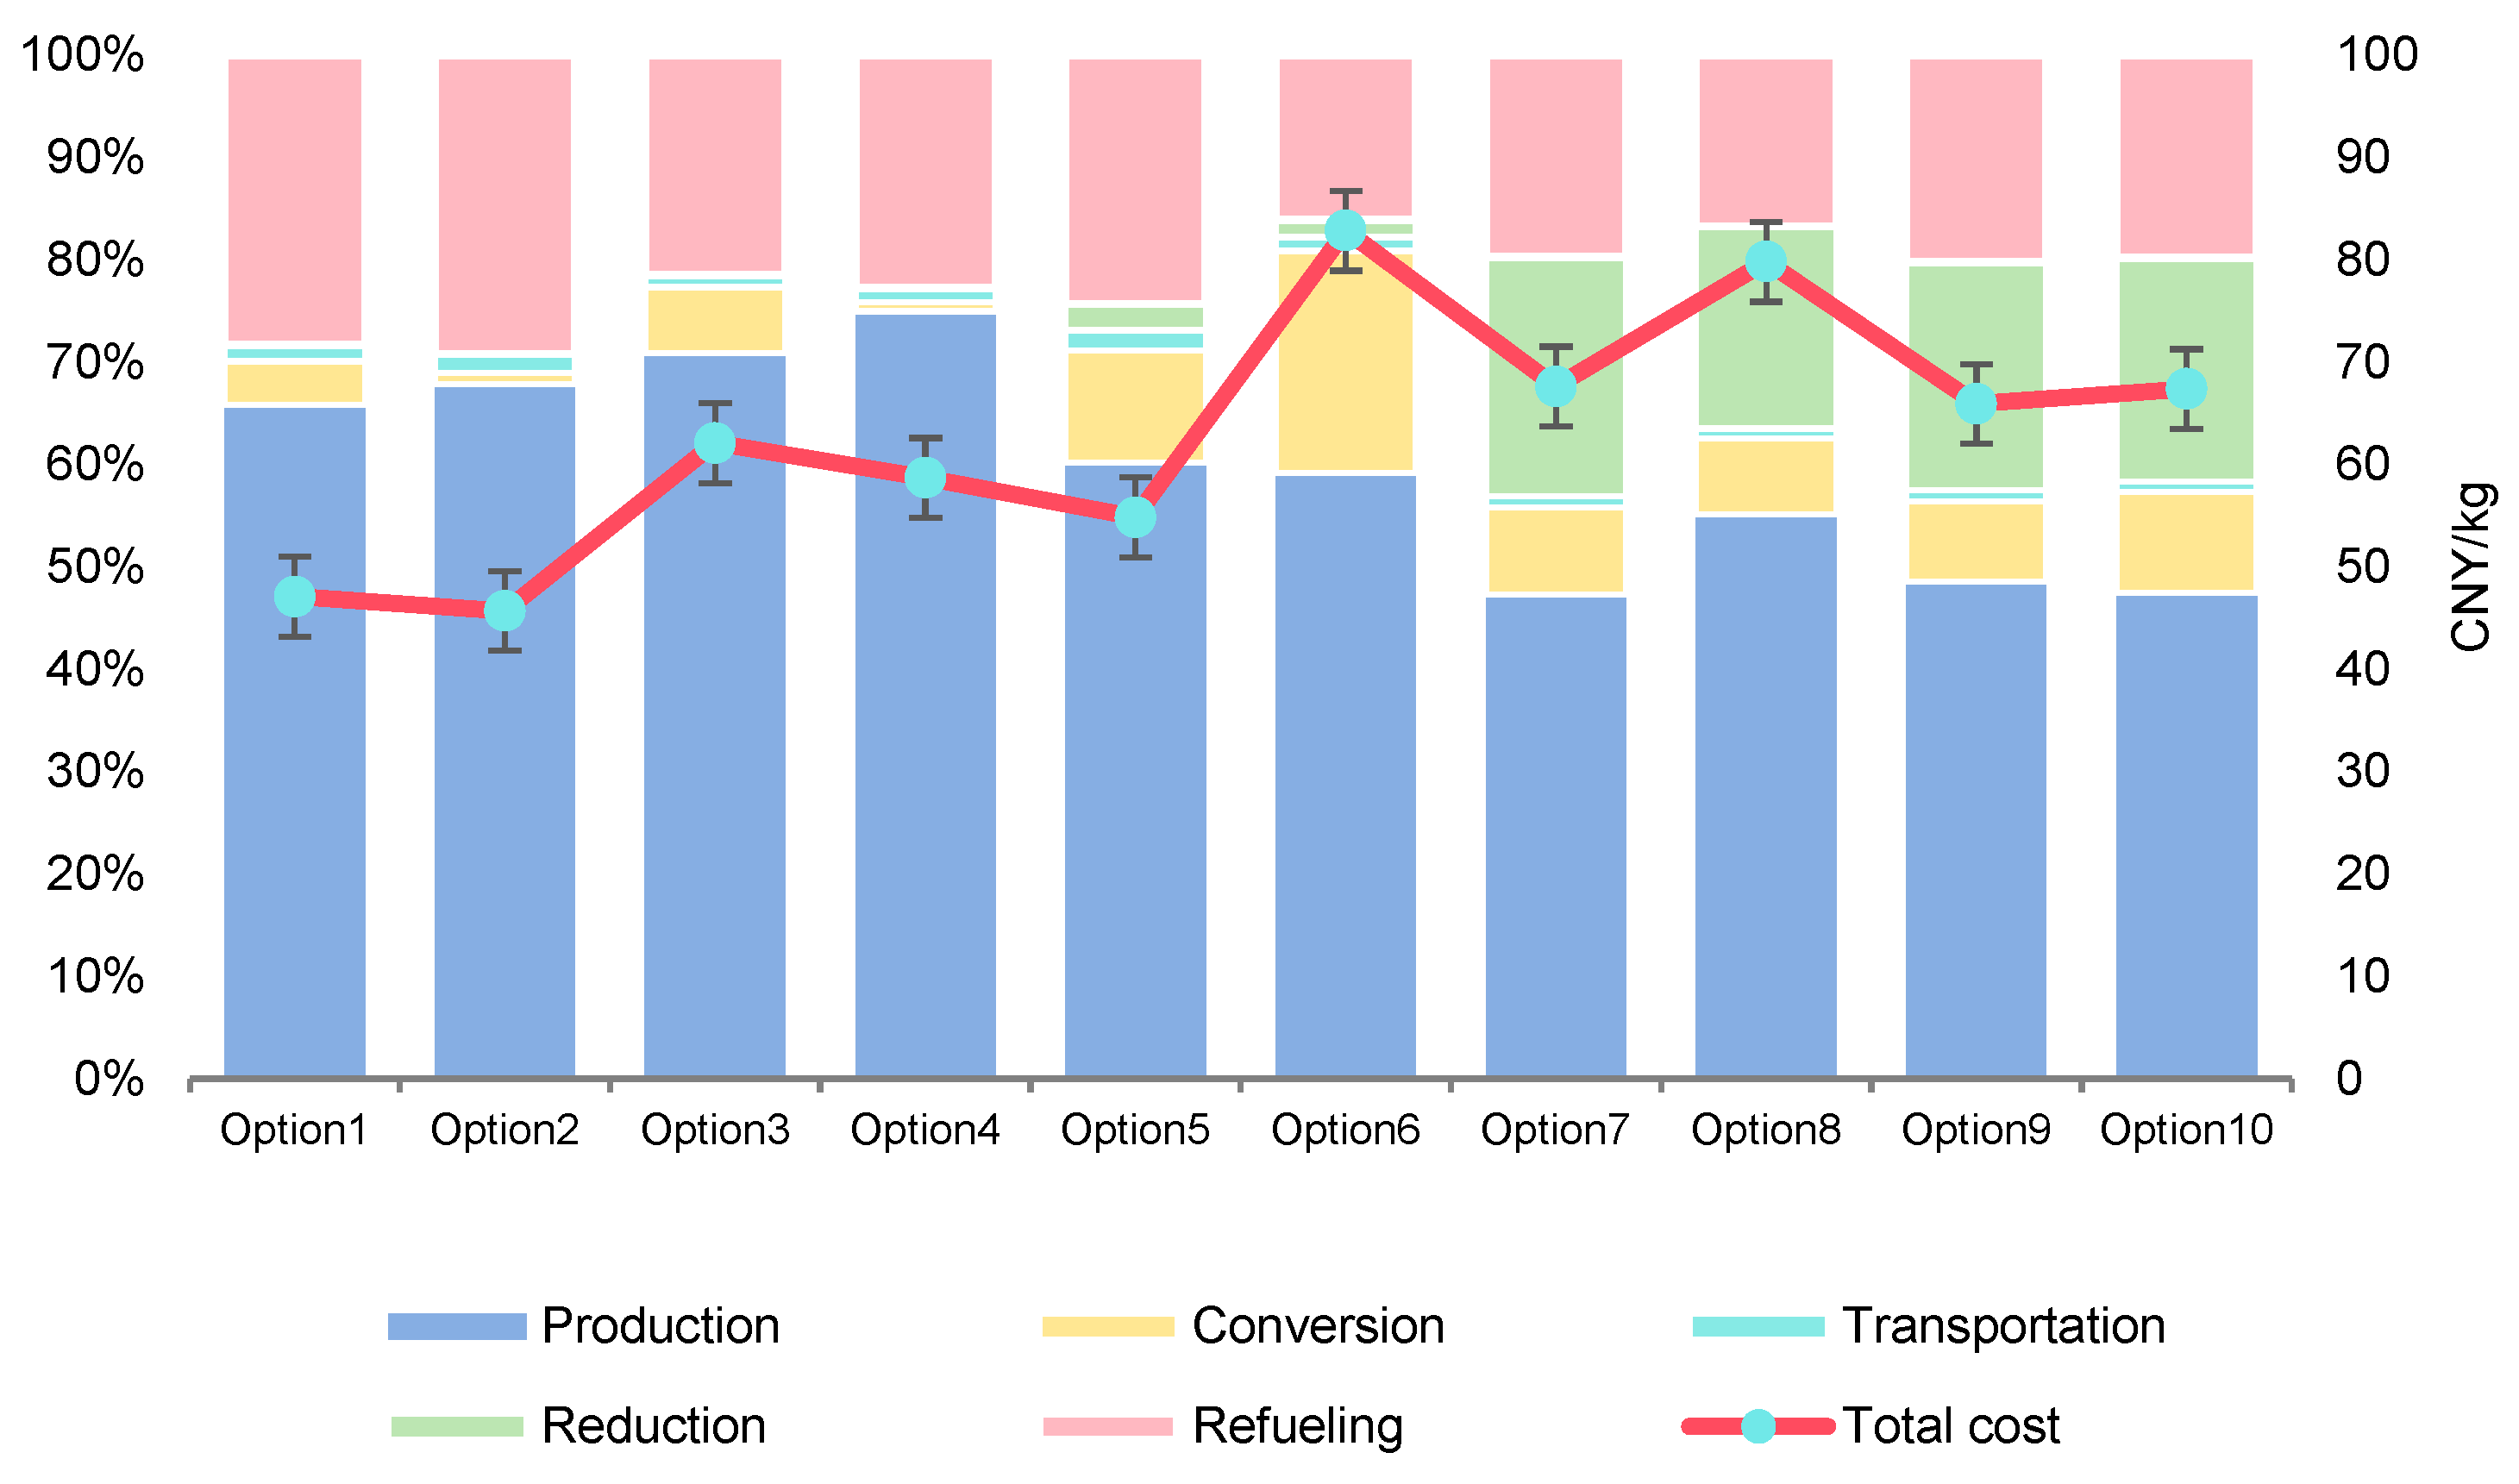
From the results of the supply chain measurements in Figure 3, overall, the supply chain cost of hydrogen production for offshore wind power is higher than that for onshore wind power, but this paper has a unique advantage as it mainly tackles the specific scenario of offshore hydrogen refueling stations and considers the scenario of hydrogen-fueled ships facilitating the consumption of new energy at sea. In terms of specific links, in the hydrogen production end, the centralized hydrogen production cost is lower than the distributed hydrogen production; in the storage and transportation end, the gas-hydrogen pipeline cost is the lowest, and the liquid hydrogen ship cost is the highest; in the application end, the reduction cost of ammonia, MCH, and methanol hydrogen carriers is higher, and, except for the hydrogen carrier reduction link, in the refilling link the refueling cost is the same among the various scenarios due to the stipulation of the daily refueling volume of the offshore hydrogen refueling station.
(2)
Supply chain sensitivity analysis
Since the daily hydrogenation volume is the same at the application end, the impact of different influencing factors on the cost of each scenario, except at the application end, is analyzed.
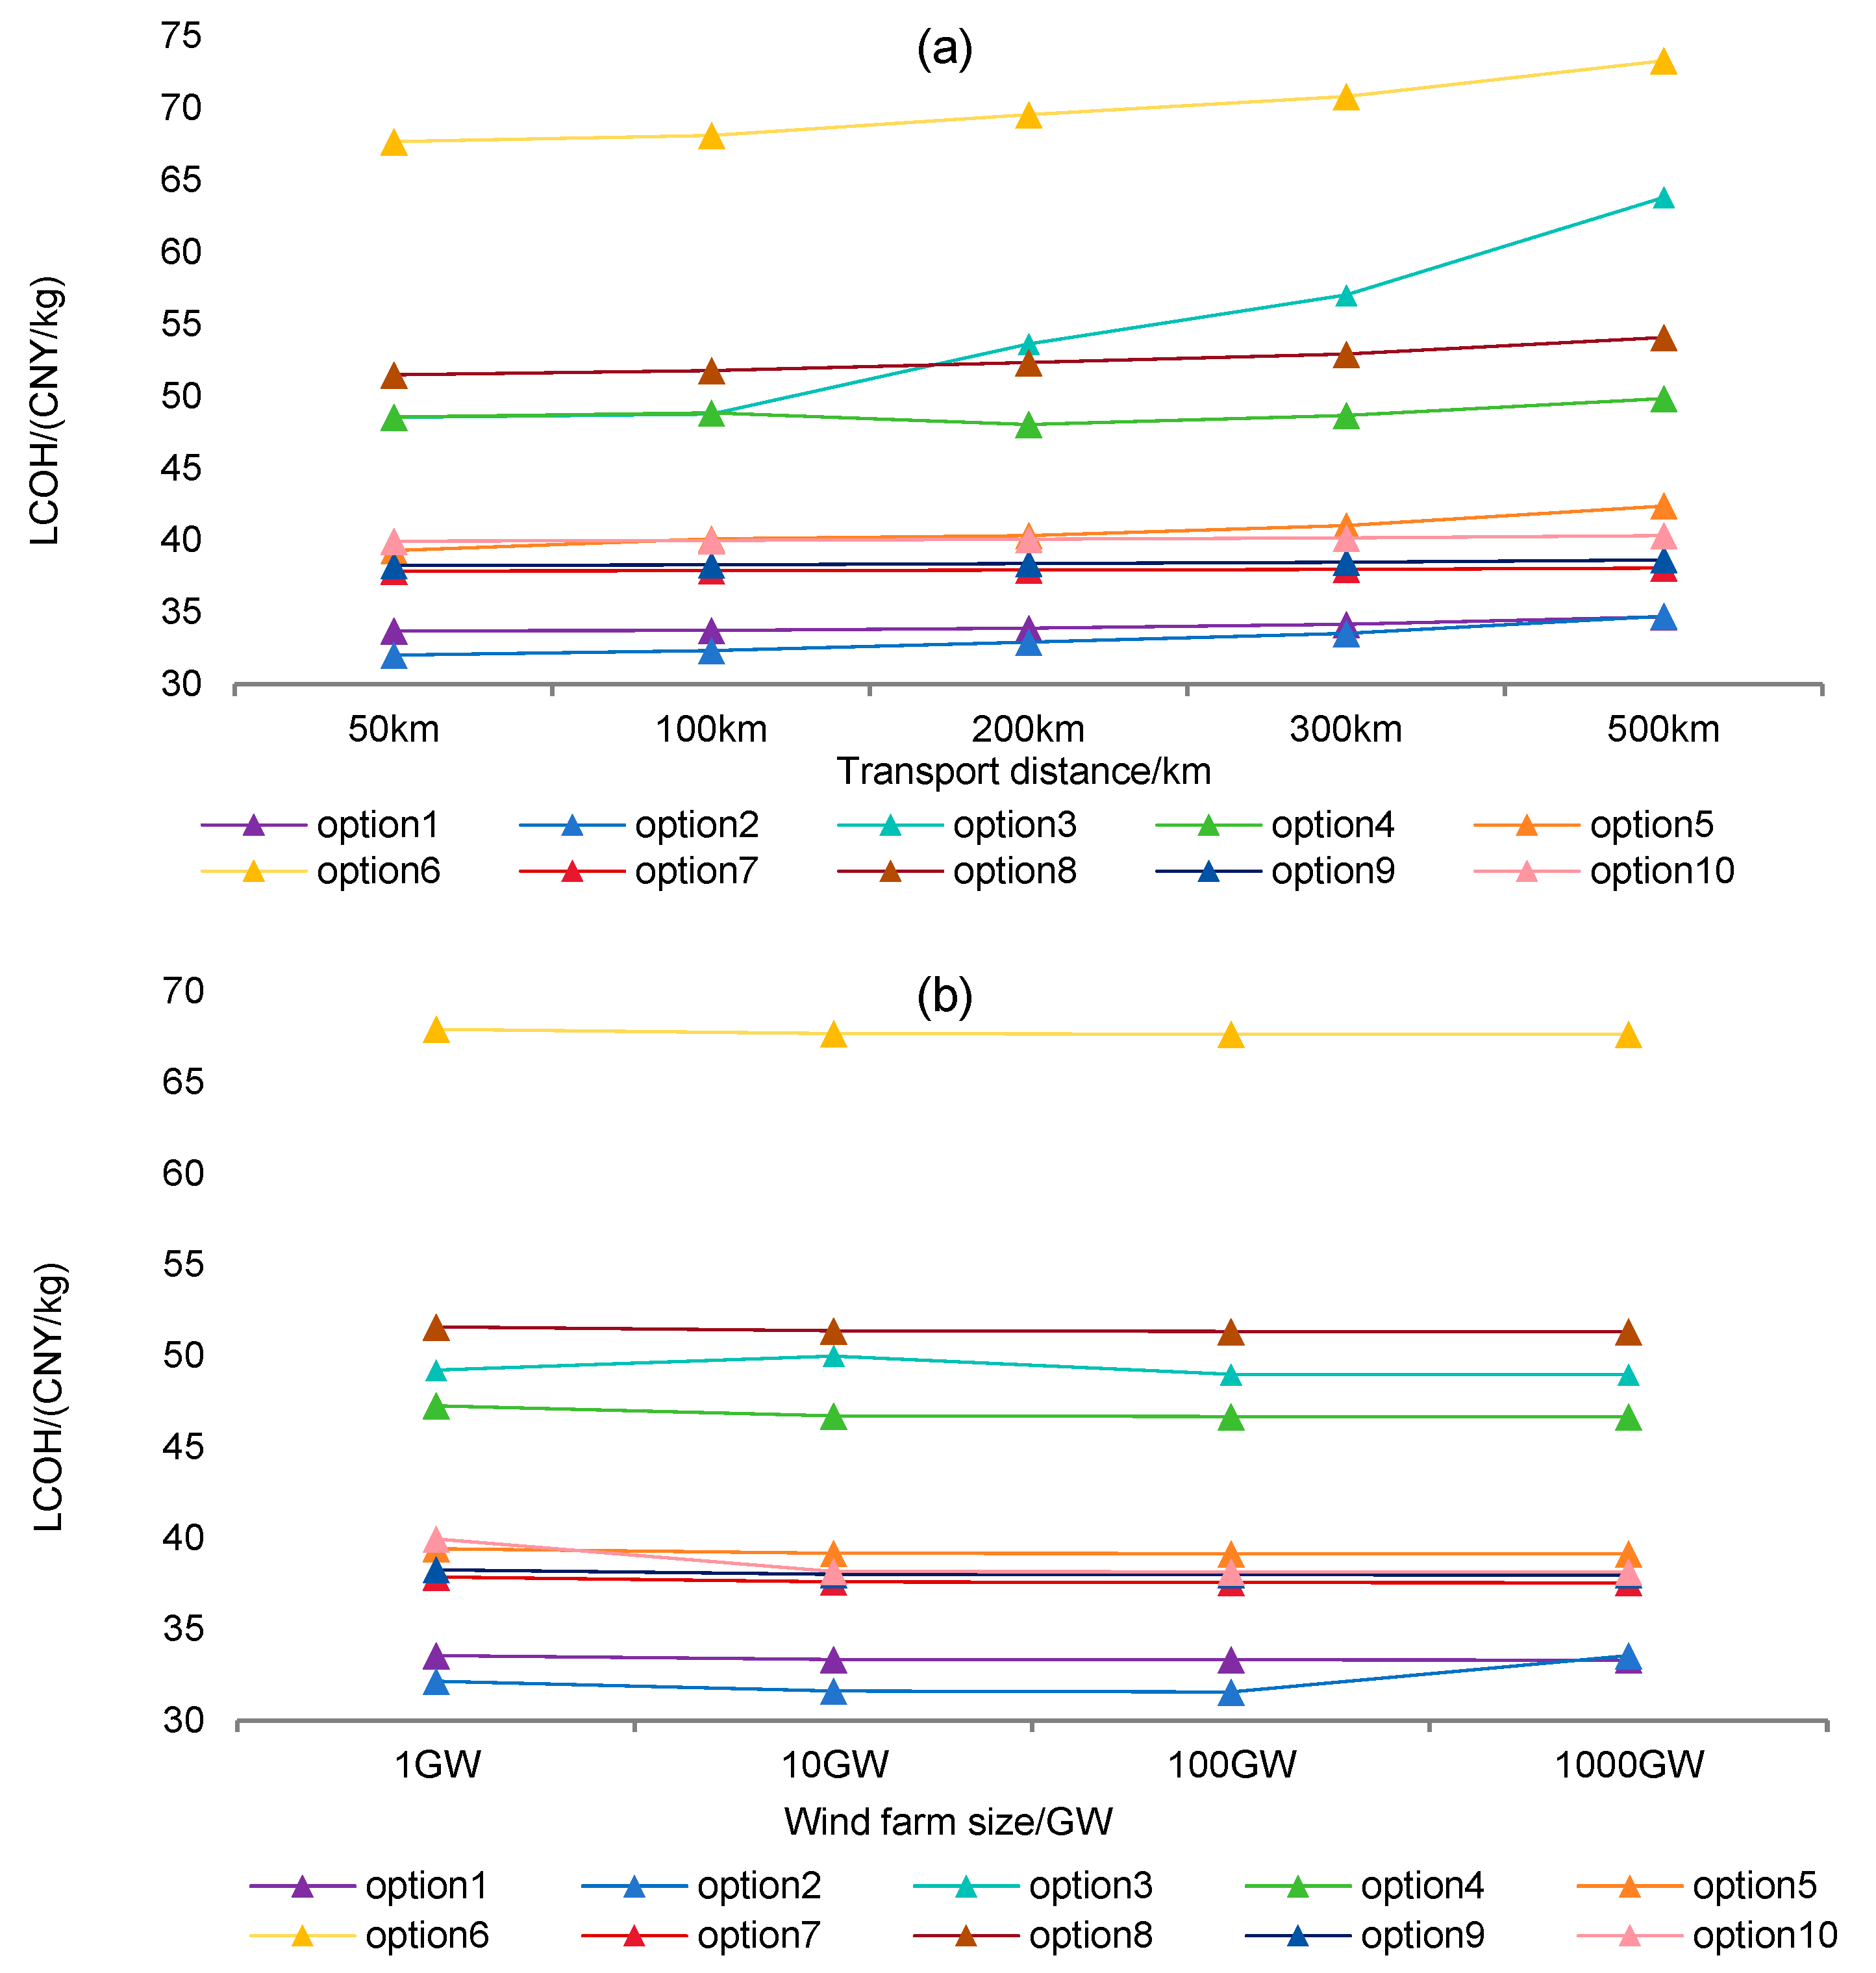
The distance offshore affects the LCOH by influencing the cost outlay for outgoing cables, hydrogen pipelines or transport vessels. With the augmentation in the wind farm size, scale effects will emerge in deep offshore wind hydrogen projects.
From Figure 4, it can be seen that the cost of each option increases with the increase in the offshore distance, where pipeline transport is more suitable for wind farms with a closer offshore distance, while ship transport is appropriate for the long-distance transport of wind farms with greater offshore distances. The cost of the hydrogen pipeline is more sensitive to the offshore distance than the cost of ship transport to the offshore distance.
With the increase in the wind farm size, the cost of each technical solution decreases to different degrees; there is a scale effect, and the LCOH of the hydrogen pipeline model decreases more than that of the ship, while the overall impact on the LCOH is smaller due to the smaller proportion of the hydrogen pipeline. However, the decline is more moderate than the offshore distance, which shows that the wind farm size is not the key influencing factor on the cost of hydrogen production for deep and distant sea wind power.
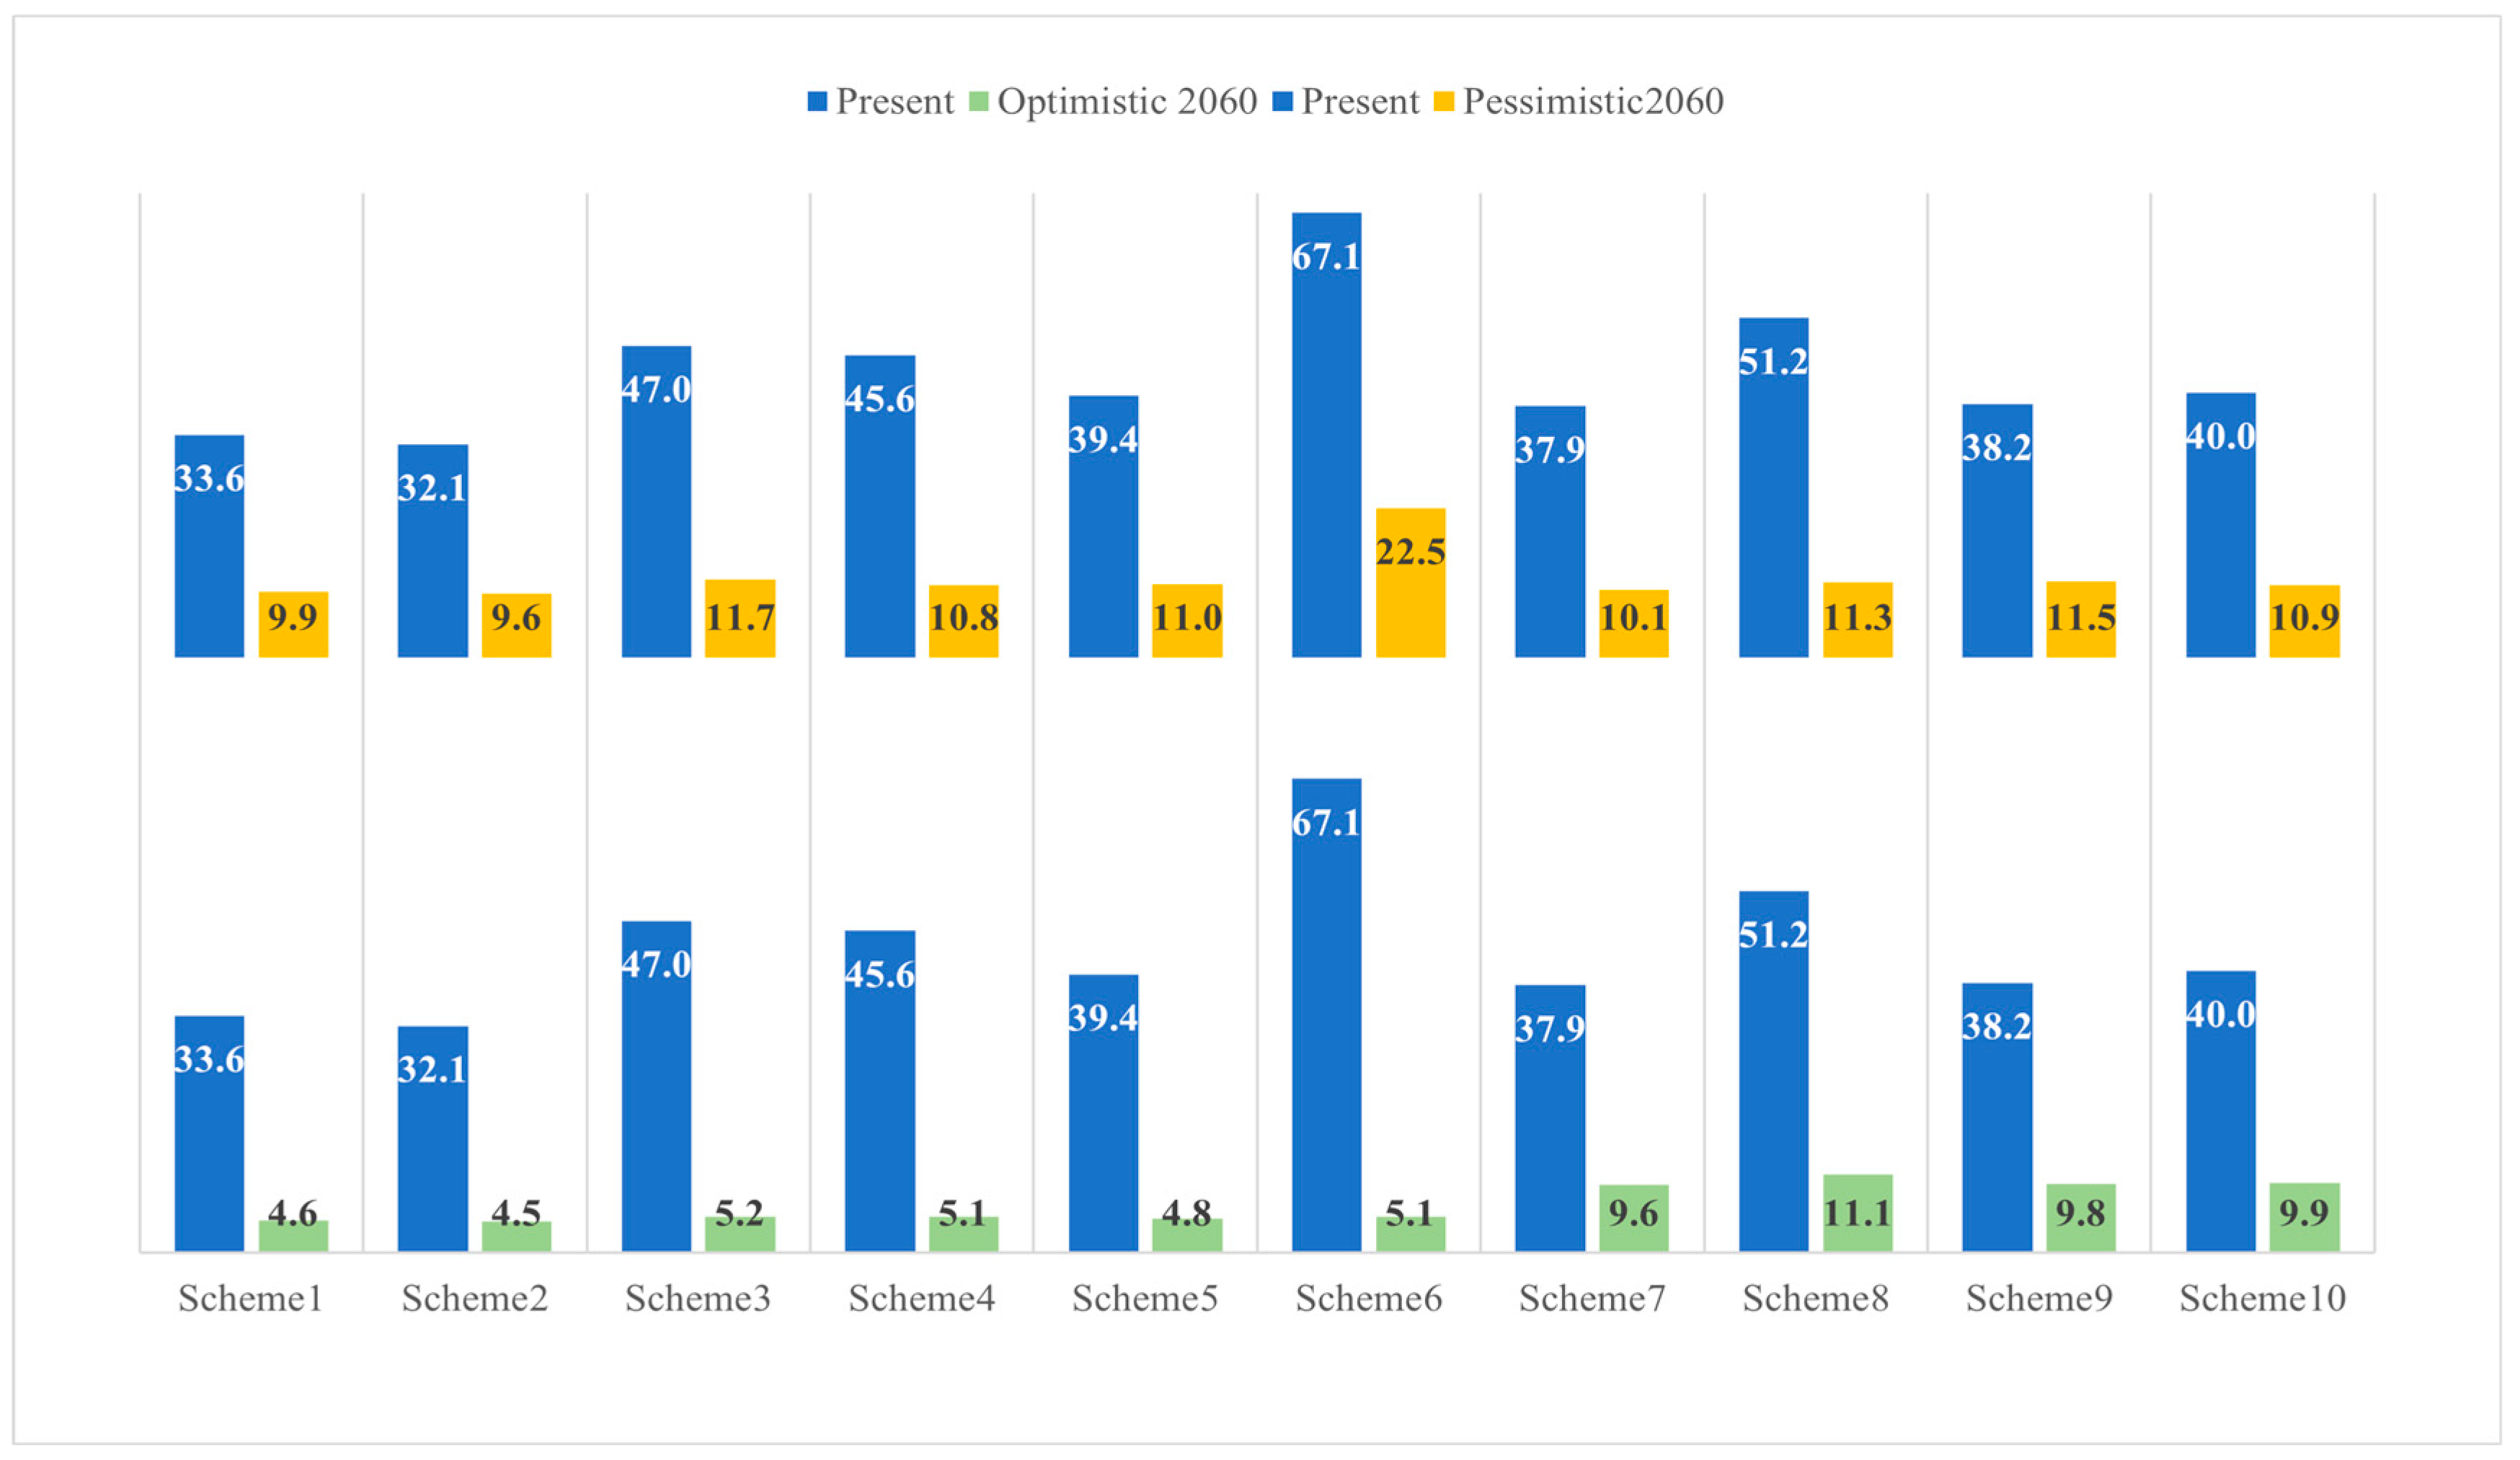
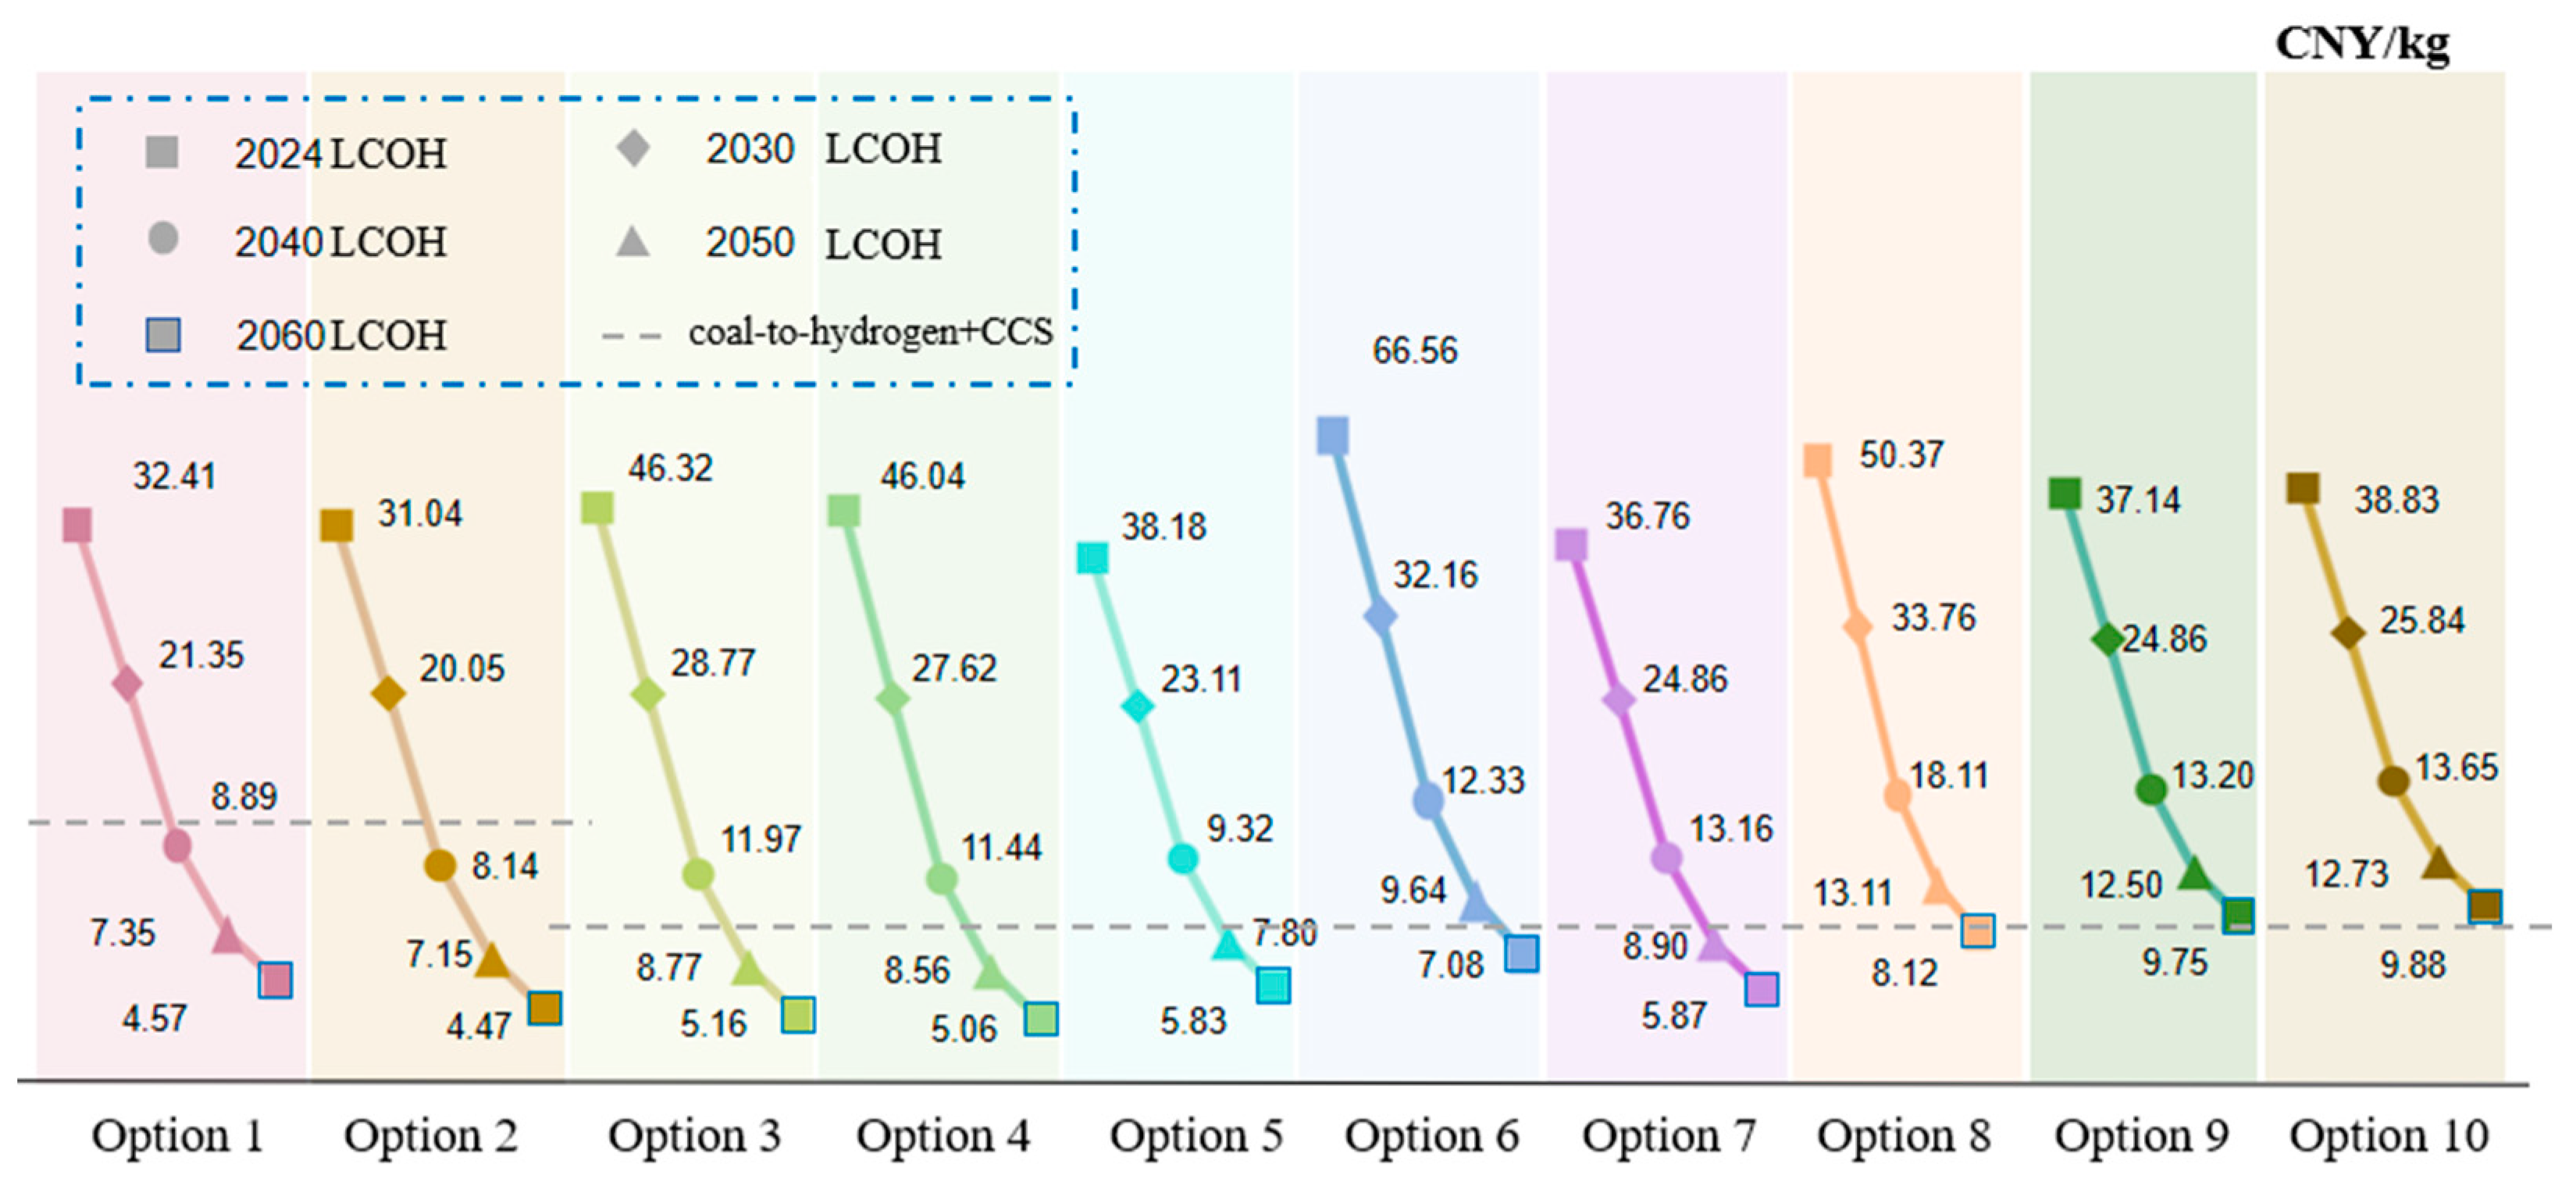
The current cost of offshore wind power hydrogen production compared to onshore hydrogen production method has no economic advantage; therefore, according to the future cost prediction, in the optimistic scenario, offshore wind power hydrogen production has strong policy support and R&D funding, technology R&D enthusiasm is high and can be combined with the equipment technology learning rate based on the degree of maturity of the technology. The cost reduction rate was taken as 6~14%. In the pessimistic scenario, offshore wind power hydrogen production technology R&D difficulty, policy inclination is not high, R&D enthusiasm degree is low, the cost decline is not obvious, and the cost reduction rate was taken as 2~6%, as shown in Figure 5. Predicting the trend of the LCOH change from the present to 2060, the optimistic scenario is expected to be the same as the Coal Hydrogen with CCS method for Scenario 2 in 2037.
Carbon taxes, as one of the most cost-effective carbon abatement tools, have received widespread attention from international organizations and governments. Considering the impact of the carbon tax price on the cost of offshore wind hydrogen production, the carbon emissions reduced through offshore wind hydrogen production can be traded in the carbon trading market, thus bringing additional carbon benefits to the project. Based on various current policy preferences and research results, this paper is biased towards optimism in the development prospects of offshore wind hydrogen production, and therefore adopts an optimistic scenario for the subsequent measurements. As shown in Figure 6, the LCOHs after joining the carbon trading market have all decreased to different degrees. The year of economic advantage over other hydrogen production methods will be advanced, and the LCOH of the optimal offshore wind hydrogen production scheme will be on a par with coal hydrogen production under the CCS method around 2033; and it will have a competitive advantage over all other hydrogen production methods around 2038.
(3)
Sensitivity analysis of offshore hydrogen refueling stations
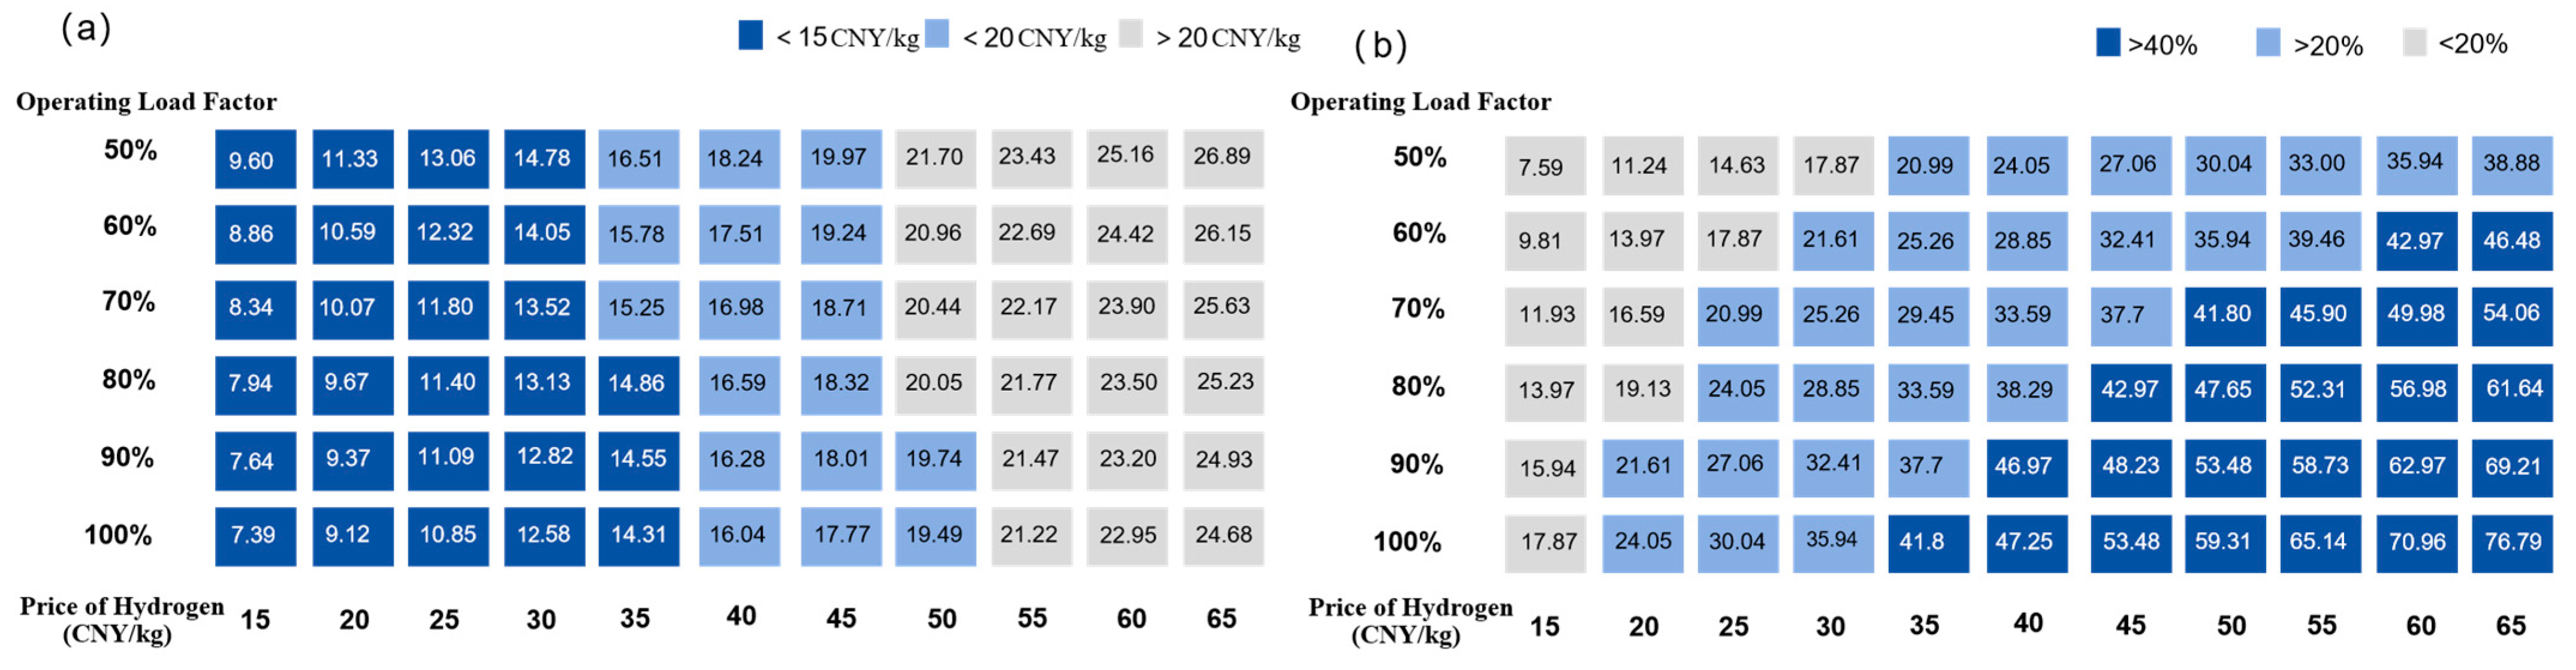
The refueling cost of an offshore hydrogen refueling station is mainly related to the operating rate and the selling price of hydrogen. Considering the actual operation, the offshore hydrogen refueling station has a variable daily hydrogen sales volume, and different operational load rates are set to obtain a clearer picture of the profitability of the hydrogen refueling station. As shown in Figure 7a, the refueling cost decreases as the operating load factor increases; and as the hydrogen price increases, the refueling cost increases slightly due to the rise in various taxes.
As shown in Figure 7b, changes in the operating load factor and hydrogen selling price also have a direct impact on the profitability of hydrogen refueling stations, which increases significantly with the increase in the operating load factor and hydrogen selling price. However, at present, due to the small number of hydrogen fuel cell ships, the current operating rate is less than 100%, and the profitability is a little weak. With the continuous progress in technology and the development of the hydrogen energy market, the development prospects of the offshore hydrogen refueling station are bright and the profitability is very considerable.
(4)
Hydrogen supply to offshore hydrogen refueling stations at different distances
Given the profitability of offshore hydrogen refueling stations and their promising development prospects, such stations are expected to be constructed in diverse regions in the future. Considering the supply of hydrogen to offshore hydrogen refueling stations to varying distances from the hydrogen source, the economy is the main consideration in the choice of the storage and transport method, and the comparison of the storage and transport economy of multi-technology options with different daily transport volumes and transport distances is analyzed.
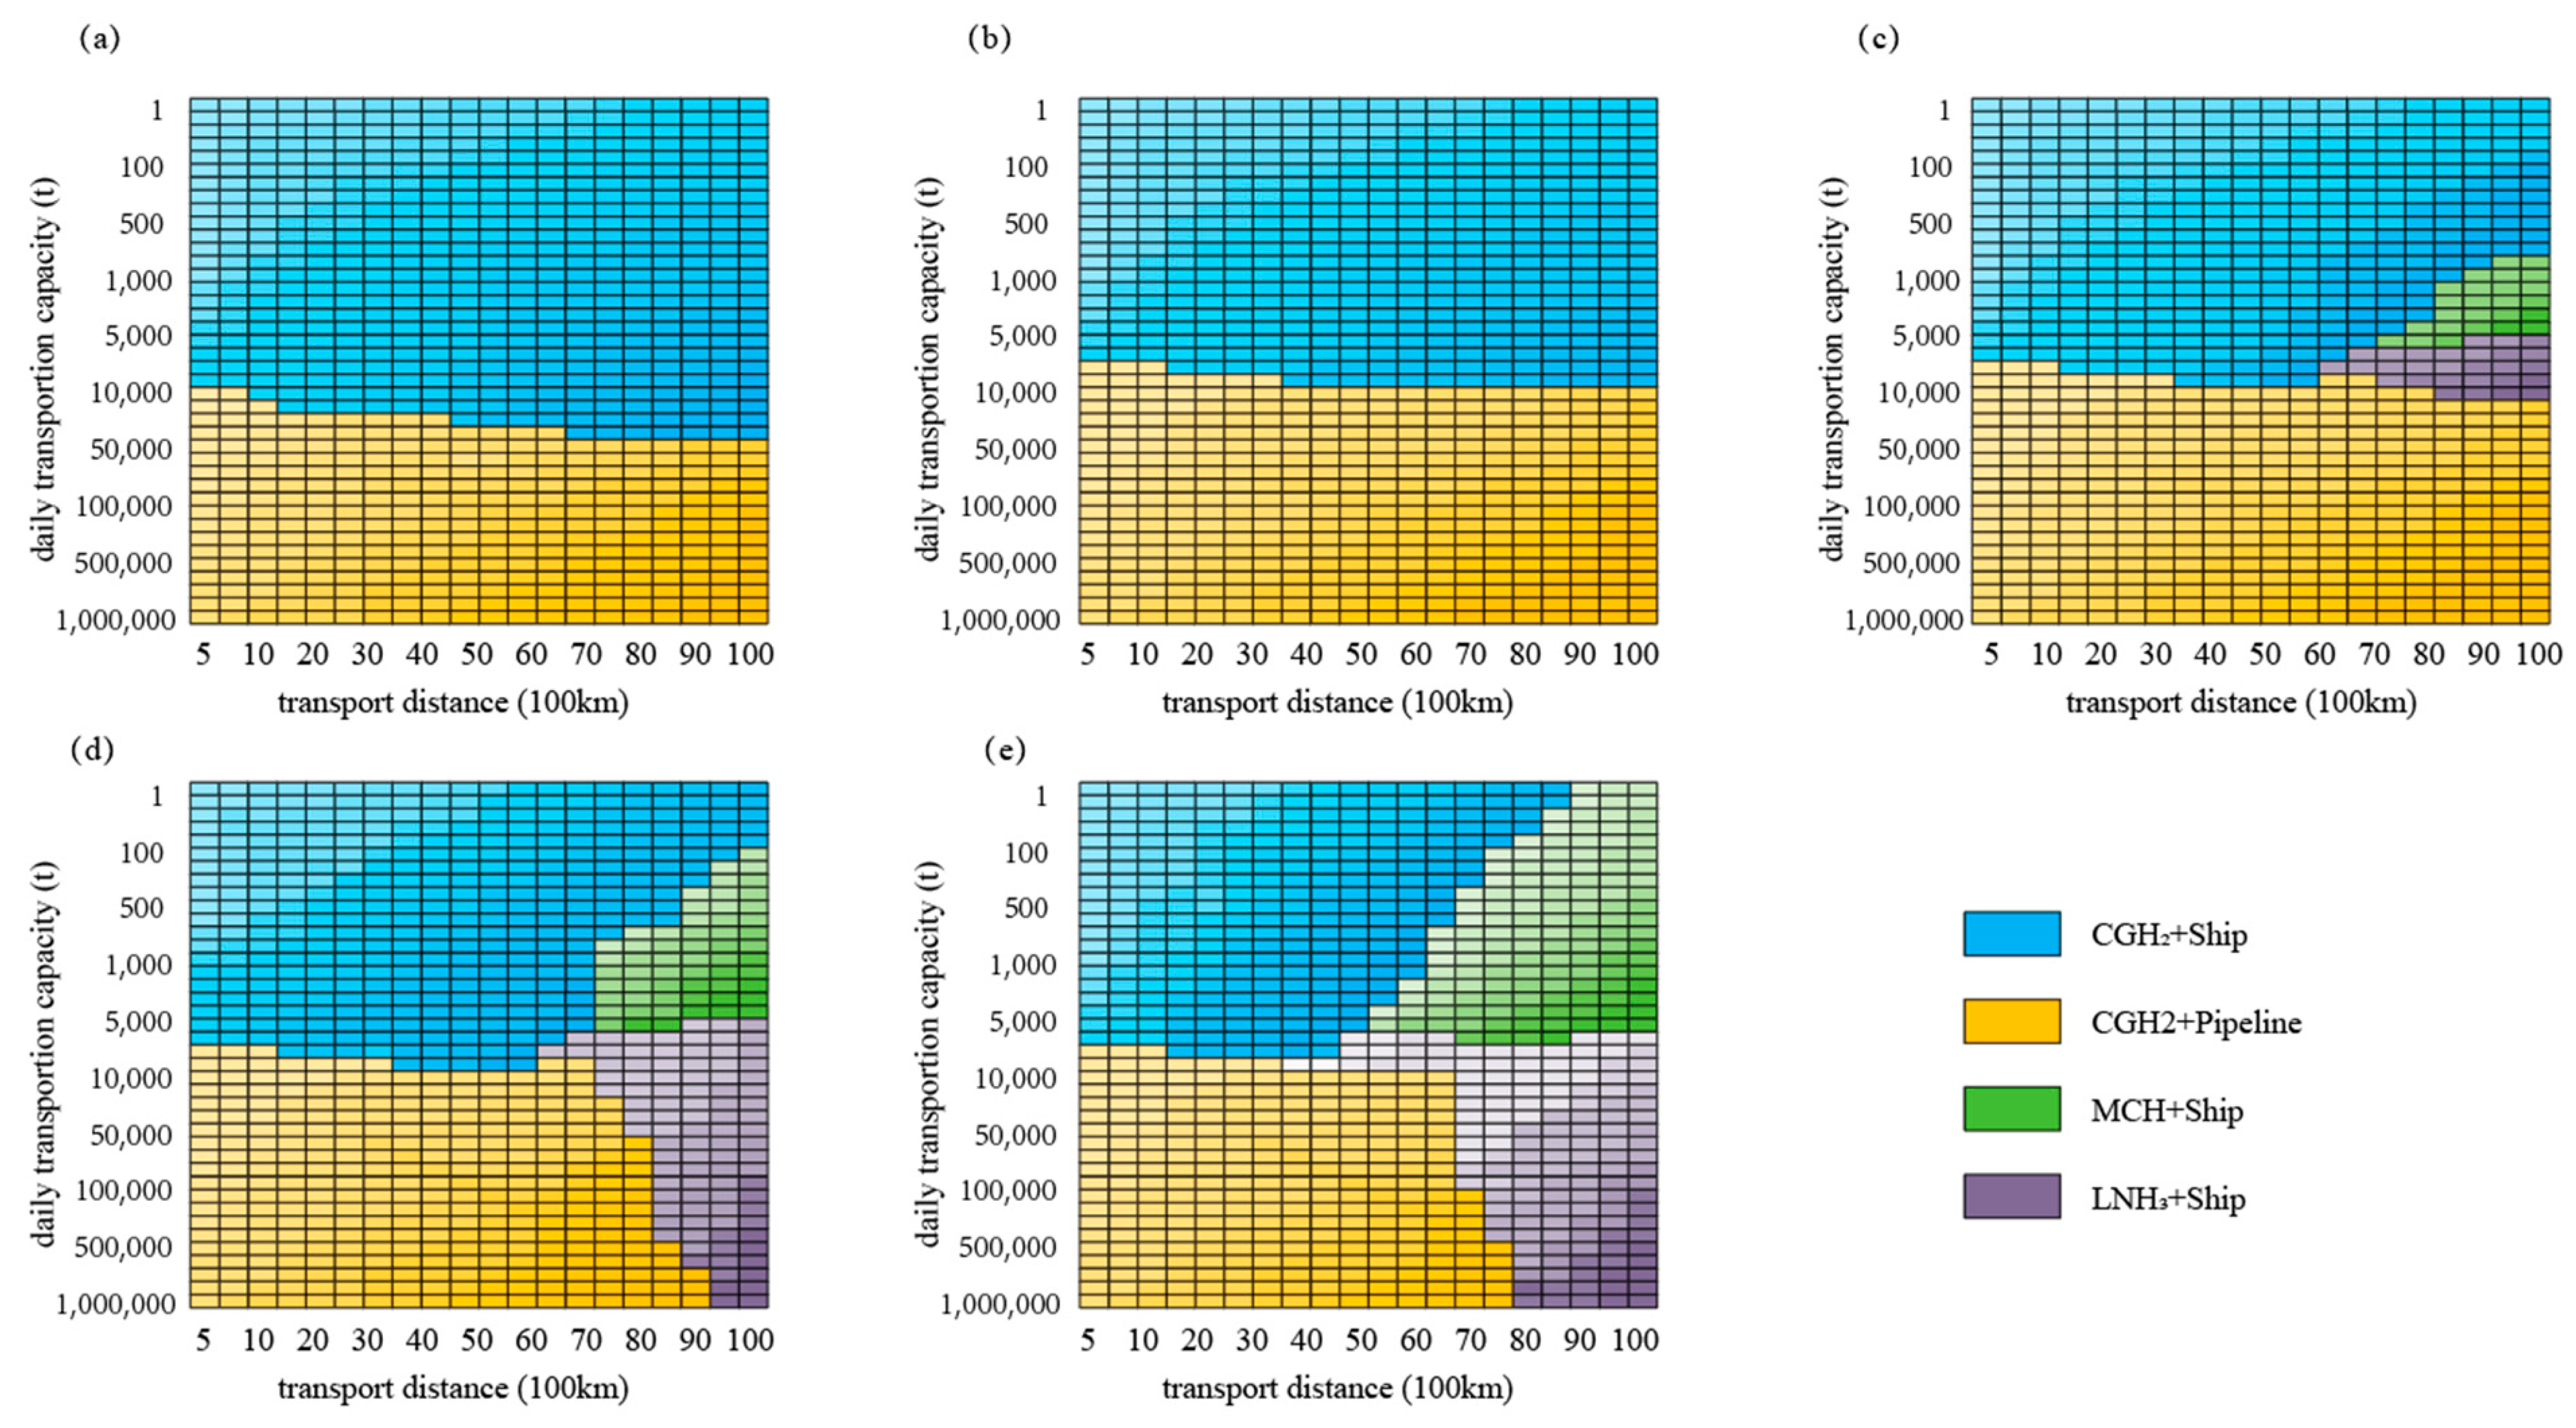
Figure 8a represents the most economical hydrogen carrier transport mode at different transport distances and daily transport quantities. It can be concluded that a pipeline is the most economical way to transport when the offshore hydrogen refueling station is large in scale and far away from the hydrogen source point; when the daily hydrogen refueling scale of the offshore hydrogen refueling station is less than 10,000 t, the gas-hydrogen ship is the most economical way to transport it; the cost of transporting hydrogen carriers, such as liquid hydrogen, synthetic ammonia, MCH, methanol, etc., is not economically advantageous at a distance of 10,000 km and up to 1,000,000 t daily hydrogen refueling. Liquid hydrogen, synthetic ammonia, MCH, methanol and other hydrogen carriers have no economic advantage in the distance of 10,000 km from the hydrogen source point and in the scale of hydrogen refueling up to 1,000,000 t daily. Also based on the development prospects, the future transport distance and daily transport volume costs are predicted in Figure 8b–e below.
The results in Figure 8 show that pipelines are progressively shorter but still suitable for supplying large-scale offshore hydrogen refueling stations; that the economic advantages of ammonia and MCH become apparent after 2040; that the development of ammonia carriers is progressively more suitable for supplying large-scale, long-distance offshore hydrogen refueling stations; and that MCH will be more ideal for supplying small- and medium-sized, long-distance offshore hydrogen refueling stations in future developments. Liquid hydrogen, methanol, and other hydrogen carriers in the future development trend of ship transport costs in the distance of 10,000 km from the hydrogen source point and the hydrogen refueling scale of 1 million tonnes per day still do not have a cost advantage.
Combined with the economic calculation of the storage and transport end, the most economical hydrogen carrier transport method is selected according to the distance of the hydrogen source point and the size of the offshore hydrogen refueling station, which will help the construction and development of the offshore hydrogen refueling station and improve the application end link of the offshore wind hydrogen supply chain.

5. Conclusions

This study addresses the economic benefits of hydrogen production from far-reaching offshore wind power. By developing multiple scenarios and establishing a levelized cost model, the study provides a detailed economic measurement of each link in the supply chain of hydrogen production from far-reaching offshore wind power and draws the following conclusions:
(1)
The cost measurement results of different hydrogen carriers in hydrogen production, storage and transportation, and application show that in hydrogen production, the cost of centralized hydrogen production is lower than that of distributed hydrogen production; in storage and transportation, the cost of a gas-hydrogen pipeline is the lowest at 1.34 CNY/kg, and the cost of a liquid-hydrogen ship is the highest at 19.1 CNY/kg; and in application, the cost is the same among the various scenarios due to the stipulation on the daily refilling quantity of the offshore hydrogen filling station. The cost of each option is the same. When analyzing the options from the perspective of the whole supply chain, the centralized offshore hydrogen production and pipeline transport of gas hydrogen have the lowest cost of 45.69 CNY/kg.
(2)
The sensitivity analysis results show that the cost of each scheme increases with the increase in offshore distance, in which the pipeline transport compared to the cost of ship transport growth trend is more moderate; with the increase in the size of the wind farm, the cost of each technology program has a different degree of decline, there is a scale effect, but compared with the offshore distance, the trend is more moderate. However, the current cost of offshore wind power hydrogen production compared to the onshore hydrogen production method has no economic advantage; combined with the equipment technology learning rate based on the maturity of the technology, the cost reduction rate of 6% to 14%, respectively, the future cost of offshore wind power hydrogen production prediction is expected to 2037 programme two can be equal to the coal hydrogen production with CCS method.
(3)
By studying the relationship between the refueling cost, internal rate of return and daily hydrogen refueling capacity of marine hydrogen refueling stations, it can be observed that as the daily hydrogen refueling capacity increases, the refueling cost gradually decreases and the internal rate of return rapidly increases. However, due to the current limited number of hydrogen fuel cell vessels, the daily refueling capacity of marine hydrogen stations has not yet reached the expected supply, resulting in relatively weak profitability. Similarly, although the safety of the solid-state hydrogen storage technology based on metal hydrides can be guaranteed, the current metal hydrides do not meet all the basic criteria of the practical hydrogen economy. The relevant technology is costly while it is difficult to achieve efficient hydrogen charging and discharging and a large storage capacity. Nonetheless, with the continuous advancement in hydrogen technology and the continued expansion of the hydrogen market, the development prospect of offshore hydrogen refueling stations remains promising, and profitability is expected to improve significantly in the future.
(4)
A study of different hydrogen carrier transports for supplying hydrogen to offshore hydrogen refueling stations at different distances from the source and sizes shows that pipeline transports are currently suitable for supplying hydrogen to large-scale, long-distance offshore hydrogen refueling stations. Projections of future costs show that pipelines will gradually be less suitable for distances but will still be suitable for large-scale offshore hydrogen refueling stations and that after 2040, ammonia and MCH will gradually become economically advantageous, with ammonia being suitable for large-scale, long-distance offshore hydrogen refueling stations, and MCH being more suitable for small- and medium-sized, long-distance offshore hydrogen refueling stations. Other hydrogen carriers, such as liquid hydrogen and methanol, still lack cost advantages in the short term.

Author Contributions

Conceptualization, C.X.; Methodology, R.D. and X.Y.; Investigation, Y.W. (Yanming Wan) and Y.Z.; Data curation, Y.W. (Yue Wang) and C.F.; Writing—original draft, Y.Z. and Y.D.; Writing—review and editing, C.X. and Y.Z.; Visualization, Q.L. and H.M.; Supervision, C.X. All authors have read and agreed to the published version of the manuscript.

Funding

This work was funded by China Hydrogen Alliance Policy Research Project CHA2023RP001.

Data Availability Statement

The original contributions presented in the study are included in the article; further enquiries can be directed to the corresponding author.

Conflicts of Interest

Author Yan Zhang and Yanming Wan were employed by the CHN Energy Hydrogen Innovation Technology Co., Ltd. Author Yanming Wan was employed by the Guohua Energy Investment Co., Ltd. The remaining authors declare that the research was conducted in the absence of any commercial or financial relationships that could be construed as a potential conflict of interest.

Appendix A. Relevant Parameters, Such as Cost Data Used in Supplementary Measurements

Table A1. Related parameters of hydrogen production.
ParametersData
Floating Wind Turbines/(CNY/kW)16,000 [26]
Offshore Platforms/(CNY/kW)815 [26]
35 kV Array Cable/(1 × 104 CNY/km)50
220 kV High Voltage Cable/(1 × 104 CNY/km)450
675–1035 V Rectifier/(CNY/kW)476
Offshore Booster Station/(CNY/kW)500 [27]
Converter Station/(CNY/kW)2000 [28]
Seawater Lifting Pumps/(1 × 104 CNY/unit)5
Desalination Container/(1 × 104 CNY/set)150
Freshwater Purification Systems/(1 × 104 CNY/set)150
Electrochemical Energy Storage/(CNY/kWh)1000 [29]
Alkaline Electrolyzer/(CNY/kW)2100 [30]
Proton Exchange Membrane Electrolyzer/(CNY/kW)5000 [31]
Liquefied Hydrogen/(1 × 104 CNY/t/day)216 [32]
Reduced Hydrogen/(CNY/tNH3/day)7283 [33]
Hydrogen Purification Systems/(1 × 104 CNY/set)50
Hydrogen Buffer Tanks/(1 × 104 CNY/m3)2
Royalties for the use of maritime space/(1 × 104 CNY/ha)300 [34]
Table A2. Hydrogen storage link-related parameters.
Program ParametersCentralizedDistributed
CapacityDataCapacityData
High-pressure hydrogenHydrogen compressors/(1 × 104 CNY/unit)20 MPa; 2000 Nm329020 MPa; 1000 Nm3160
High Pressure Hydrogen Storage Tanks/(1 × 104 CNY/m3)20 MPa; 200 m33.220 MPa; 50 m33.2
Liquid hydrogenHydrogen compressors/(1 × 104 CNY/unit)8 MPa; 2000 Nm32008 MPa; 1000 Nm3120
Liquefaction systems/(1 × 108 CNY/set)5 t/d31.5 t/d1
Spherical liquid hydrogen storage tanks/(1 × 104 CNY/unit)1000 m3150012 m350
AmmoniaHydrogen compressors/(1 × 104 CNY/unit)16 MPa; 2000 Nm329016 MPa; 1000 Nm3160
Variable pressure adsorption nitrogen system/(1 × 104 CNY/set)2870 Nm31200400 Nm3268
Nitrogen buffer tanks/(1 × 104 CNY/m3)3 MPa; 30 m3/10 m3216 MPa; 1000 Nm3/2000 L3.2
Nitrogen compressors/(1 × 104 CNY/unit)16 MPa; 2000 Nm329016 MPa; 400 Nm360
Ammonia system/(1 × 104 CNY/set)2 × 105 t/year16,0002000 t/year200
Spherical liquid hydrogen storage tanks/(1 × 104 CNY/unit)1000 m320012 m35
LOHCHydrogen compressors/(1 × 104 CNY/unit)5 MPa; 2000 Nm3200/
Purchased toluene/(CNY/t)1369 t/d7000/
Methylcyclohexane synthesis system/(1 × 104 CNY/set)1458.33 t/d500/
Methylcyclohexane storage tanks/(CNY/m3)1500 m3750/
CH3OHHydrogen compressors/(1 × 104 CNY/unit)4.5 MPa; 2000 Nm3200/
Direct air capture CO2 system/(1 × 104 CNY/set)2.4 × 105 t/year4200/
CO2 compressor/(1 × 104 CNY/unit)4.5 MPa; 2000 Nm350/
Methanol synthesis system/(1 × 108 CNY/set)1.8 × 105 t/year10/
Methanol storage tanks/(CNY/m3)1500 m3750/
Table A3. Transport link-related parameters.
Parameter AssumptionData
Submarine hydrogen pipeline/(1 × 104 CNY/km)451 [35]
Purchase of hydrogen-carrying vessels/(1 × 104 CNY/unit)129.2 [36]
Table A4. Hydrogenation process-related parameters.
Parameter AssumptionData
Hydrogenation system/1 × 104 CNY1100
Hydrogen storage system/(CNY/m3)160
Island filling area/m21000
Daily hydrogenation capacity/kg5000
Labour costs/(CNY/month)8000
Compression system/1 × 104 CNY30
Cost of island filling/(1 × 104 CNY/m2)4.7
Hydrogen selling price/kg35
Table A5. Hydrogen production link-related capacity parameters.
Parameter Data
Number of fans/unit100
Wind turbine unit size/MW10
Electrolyzer single unit size/MW1
Total capacity of alkaline electrolyzer/MW400
Total capacity of proton exchange membrane electrolyzers/MW400
Electrochemical energy storage capacity/MW50
Distance from shore/km70
Table A6. Transport link-related capacity parameters.
Parameter AssumptionData
Submarine hydrogen pipeline pressure/Mpa3
Distance to offshore hydrogen refueling station/km100
Hydrogen per unit of ship’s cargo/kg98,478.6
Amount of liquid hydrogen transported per unit ship/kg295,644
Ammonia transported per vessel/kg771,000
MCH per unit ship/kg962,500
The volume of methanol transported per vessel/kg997,500
Table A7. Hydrogenation process-related capacity parameters.
Parameter AssumptionData
Daily refueling capacity/kg3000
Hydrogen storage tank capacity/standard cubic meter4000
Island filling area/m21000
Daily hydrogenation capacity/kg5000
Compression system pressure/Mpa20
Compression system capacity/kg/day2400

References

  1. Thommessen, C.; Otto, M.; Nigbur, F.; Roes, J.; Heinzel, A. Techno-economic system analysis of an offshore energy hub with an outlook on electrofuel applications. Smart Energy 2021, 3, 100027. [Google Scholar] [CrossRef]
  2. International Renewable Energy Agency. REthinking Energy: Towards a New Power System; International Renewable Energy Agency: Masdar City, United Arab Emirates, 2014. [Google Scholar]
  3. International Renewable Energy Agency. Renewable Energy Statistics 2018; International Renewable Energy Agency: Masdar City, United Arab Emirates, 2018. [Google Scholar]
  4. Wu, Q.; Hu, Q.; Hang, L.; Botterud, A.; Muljadi, E. Power to Gas for Future Renewable based Energy Systems. J. IET Renew. Power Gener. 2021, 14, 3281–3283. [Google Scholar]
  5. Chao, L.; Tao, L. Key Technologies and Development Status of Hydrogen Energy Utilization Under the Background of Carbon Neutrality. Power Gener. Technol. 2021, 42, 207. [Google Scholar]
  6. Li, Z.; Gao, D.; Chang, L.; Liu, P.; Pistikopoulos, E.N. Hydrogen infrastructure design and optimization: A case studyof China. Int. J. Hydrogen Energy 2008, 33, 5275–5286. [Google Scholar] [CrossRef]
  7. Bae, S.; Lee, E.; Han, J. Multi-Period Planning of Hydrogen Supply Network for Refueling Hydrogen Fuel Cell Vehicles in Urban Areas. Sustainability 2020, 12, 4114. [Google Scholar] [CrossRef]
  8. Yao, R.J.; Gao, X.T. Current Situation and Prospect of Hydrogen Energy Industry Chain and Hydrogen Power Generation Utilization Technology. South. Energy Constr. 2021, 8, 9–15. [Google Scholar]
  9. Dagdougui, H. Models, methods and approaches for the planning and design of the futurehydrogen supply chain. Int. J. Hydrogen Energy 2012, 37, 53185327. [Google Scholar] [CrossRef]
  10. Ehrenstein, M.; Galán-Martín, Á.; Tulus, V.; Guillén-Gosálbez, G. Optimising fuel supply chains withinplanetary boundaries: A case study of hydrogen for road transport in the UK. Appl. Energy 2020, 276, 115486. [Google Scholar] [CrossRef]
  11. Seo, S.K.; Yun, D.Y.; Lee, C.J. Design and optimization of a hydrogen supply chain using acentralized storage model. Appl. Energy 2020, 262, 114452. [Google Scholar] [CrossRef]
  12. Yang, Y.; Chen, L.; Wang, X.; Tan, W. Design of Integrated Offshore Wind Power-hydrogen Energy Monitoring System. South. Energy Constr. 2020, 7, 35–40. [Google Scholar]
  13. Robinius, M.; Otto, A.; Syranidis, K.; Ryberg, D.S.; Heuser, P.; Welder, L.; Grube, T.; Markewitz, P.; Tietze, V.; Stolten, D. Linking the Power and Transport Sectors—Part 2: Modelling a Sector Coupling Scenario for Germany. Energies 2017, 10, 957. [Google Scholar] [CrossRef]
  14. Tlili, O.; Mansilla, C.; Linβen, J.; Reuß, M.; Grube, T.; Robinius, M.; André, J.; Perez, Y.; Le Duigou, A.; Stolten, D. Geospatial modelling of the hydrogen infrastructure inFrance in order to identify the most suited supply chains. Int. J. Hydrogen Energy 2020, 45, 3053–3072. [Google Scholar] [CrossRef]
  15. Kim, M.; Kim, J. An integrated decision support model for design and operation of a wind-based hydrogen supply system. Int. J. Hydrogen Energy 2017, 42, 3899–3915. [Google Scholar] [CrossRef]
  16. Samsatli, S.; Staffell, I.; Samsatli, N.J. Optimal design and operation of integrated wind-hydrogen-electricity networks for decarbonising the domestic transport sector in Great Britain. Int. J. Hydrogen Energy 2016, 41, 447–475. [Google Scholar] [CrossRef]
  17. Zhang, L.; Ye, B.; Yin, C.X. Economic and Development Prospects Analysis of Wind Power Hydrogen Production. Northeast. Electr. Power Technol. J. 2020, 41, 5–9+37. [Google Scholar]
  18. Shi, L.J.; Gao, H.; Wang, H.F. Economic Analysis of Wind Power Hydrogen Production. Energy China J. 2015, 37, 11–14. [Google Scholar]
  19. Jing, Z.E.; Wang, Z.Y.; Li, Y.J.; Wang, Y.; Zhang, J.L. Development status, problems and prospects of offshore windhydrogen production industry in China. South. Energy Constr. 2024, 231, 1–9. [Google Scholar]
  20. McDonagh, S.; Ahmed, S.; Desmond, C.; Murphy, J.D. Hydrogen from offshore wind: Investor perspective on the profitability of a hybrid system including for curtailment. Appl. Energy 2020, 265, 114732. [Google Scholar] [CrossRef]
  21. Boateng, E.; Chen, A. Recent advances in nanomaterial-based solid-state hydrogen storage. Mater. Today Adv. 2020, 6, 100022. [Google Scholar] [CrossRef]
  22. Abe, J.O.; Popoola, A.P.I.; Ajenifuja, E.; Popoola, O.M. Hydrogen energy, economy and storage: Review and recommendation. Int. J. Hydrogen Energy 2019, 44, 15072–15086. [Google Scholar] [CrossRef]
  23. Loisel, R.; Baranger, L.; Chemouri, N.; Spinu, S.; Pardo, S. Economic evaluation of hybrid offshore wind power and hydrogen storage system. Int. J. Hydrogen Energy 2015, 40, 6727–6739. [Google Scholar] [CrossRef]
  24. Cui, D.; Jiang, C.; Shi, Z.; Liu, B.; Sun, H. Research on Array Submarine Cables in Large Offshore Windfarm. South. Energy Constr. 2020, 7, 98–102. [Google Scholar]
  25. Leahy, P.; McKeogh, E.; Murphy, J.; Cummins, V. Development of aviability assessment model for hydrogen production from dedicated offshore wind farms. Int. J. Hydrogen Energy 2021, 46, 24620–24631. [Google Scholar]
  26. Jang, D.; Kim, K.; Kim, K.H.; Kang, S. Techno-economic analysis and Monte Carlo simulation for green hydrogen production using offshore wind power plant. Energy Convers. Manag. 2022, 263, 115695. [Google Scholar] [CrossRef]
  27. Tao, S.; Jiang, F. Optimization of offshore wind farm cluster transmission system topology based on Stackelberg game. Sustain. Energy Grids Netw. 2024, 40, 101542. [Google Scholar] [CrossRef]
  28. Zhao, X.; Liu, Y.; Wu, J.; Xiao, J.; Hou, J.; Gao, J.; Zhong, L. Technical and economic demands of HVDC submarine cable technology for Global Energy Interconnection. Glob. Energy Interconnect. 2020, 3, 120–127. [Google Scholar] [CrossRef]
  29. Jin, C.; Xiao, J.; Hou, J.; Wu, X.; Zhang, J.; Du, E. Flexibility improvement evaluation of hydrogen storage based on electricity–hydrogen coupled energy model. Glob. Energy Interconnect. 2021, 4, 371–383. [Google Scholar] [CrossRef]
  30. Huang, J.; Balcombe, P.; Feng, Z. Technical and economic analysis of different colours of producing hydrogen in China. Fuel 2023, 337, 127227. [Google Scholar] [CrossRef]
  31. IRENA Global Renewables Outlook: Energy Transformation 2050. Available online: https://www.irena.org/publications/2020/Apr/Global-Renewables-Outlook-2020 (accessed on 10 January 2025).
  32. Woznicki, M.; Le Solliec, G.; Loisel, R. Far off-shore wind energy-based hydrogen production: Technological assessment and market valuation designs. J. Phys. Conf. Ser. 2020, 1669, 012004. [Google Scholar] [CrossRef]
  33. Song, S.; Lin, H.; Sherman, P.; Yang, X.; Nielsen, C.P.; Chen, X.; McElroy, M.B. Production of hydrogen from offshore wind in China and cost-competitive supply to Japan. Nat. Commun. 2021, 12, 6953. [Google Scholar] [CrossRef]
  34. Anonymous. The Ministry of Finance and the State Oceanic Administration have issued a notice on adjusting the collection standards for fees for the use of uninhabited islands in the sea area. J. Announc. Minist. Financ. People’s Repub. China 2018, 4, 14–15. [Google Scholar]
  35. d’Amore-Domenech, R.; Meca, V.L.; Pollet, B.G.; Leo, T.J. On the bulk transport of green hydrogen at sea: Comparison between submarine pipeline and compressed and liquefied transport by ship. Energy 2023, 267, 126621. [Google Scholar] [CrossRef]
  36. Lei, J.; Zhang, H.; Pan, J.; Zhuo, Y.; Chen, A.; Chen, W.; Yang, Z.; Feng, K.; Li, L.; Wang, B.; et al. Techno-Economic Assessment of a Full-Chain Hydrogen Production by Offshore Wind Power. Energies 2024, 17, 2447. [Google Scholar] [CrossRef]
Figure 1. The global offshore wind power capacity from 2017 to 2022, both in terms of new installations and cumulative installations.
Energies 18 00483 g001
Figure 2. Boundary of offshore wind power hydrogen supply chain analysis.
Energies 18 00483 g002
Figure 3. Supply chain cost calculation.
Energies 18 00483 g003
Figure 4. (a) Cost sensitivity analysis at different offshore distances; (b) Cost sensitivity analysis with different wind farm sizes.
Energies 18 00483 g004
Figure 5. Future cost projections under optimistic and pessimistic scenarios (Unit: CNY/kg).
Energies 18 00483 g005
Figure 6. The LCOH decline of each option after taking into account carbon cost.
Energies 18 00483 g006
Figure 7. (a) Cost of offshore hydrogen refueling stations with different operating load rates and hydrogen selling price; b. Internal rate of return of offshore hydrogen refueling stations with different operating load rates and hydrogen selling prices. Return of offshore hydrogen refueling stations with different operating load rates and hydrogen selling prices; (b) Internal rate of return of offshore hydrogen refueling stations with different operating load rates and hydrogen selling prices.
Energies 18 00483 g007
Figure 8. (a) Comparison of daily hydrogen transport quantity and transport distance of different hydrogen carriers; (b) Comparison of daily hydrogen transport volume and transport distance of different hydrogen carriers in 2030; (c) Comparison of daily hydrogen transport volume and transport distance of different hydrogen carriers in 2040; (d) Comparison of daily hydrogen transport volume and transport distance of different hydrogen carriers in 2050; (e) Comparison of daily hydrogen transport volume and transport distance of different hydrogen carriers in 2060.
Energies 18 00483 g008
Table 1. Comparison of supply chains for hydrogen production from offshore and onshore wind power.
ProjectHydrogen from Offshore WindHydrogen from Onshore Wind
Generation modeOff-gridOff-grid/Grid-connected
Utilization hours of power generation3000–3500 h2200–2500 h
TransportationPipeline/shipPipe/tube trailer
Consumption ScenarioOffshore hydrogen refueling stationOnshore hydrogen refueling station, hydrogen metallurgy
Cost differenceLow technological maturity, high equipment costHigh technological maturity, low equipment cost
High O&M costsLow O&M costs
Special requirementsAnticorrosive materialsHydrogen embrittlement materials
Disclaimer/Publisher’s Note: The statements, opinions and data contained in all publications are solely those of the individual author(s) and contributor(s) and not of MDPI and/or the editor(s). MDPI and/or the editor(s) disclaim responsibility for any injury to people or property resulting from any ideas, methods, instructions or products referred to in the content.

