Article

Assessment of Overall and Module-Specific Performance Comparisons for Residential Grid-Tied Photovoltaic Systems in the Maldives

by
Khalid Adil Ali Mohamed
1,
Hussain Shareef
1,2,*,
Ibrahim Nizam
3,
Ayodele Benjamin Esan
1 and
Ahmad K. ALAhmad
4
1
Department of Electrical and Communication Engineering, College of Engineering, United Arab Emirates University, Al Ain P.O. Box 15551, United Arab Emirates
2
National Water and Energy Center, United Arab Emirates University, Al Ain P.O. Box 15551, United Arab Emirates
3
Renewable Energy Department, State Electric Company Limited, K. Malé 20349, Maldives
4
Institute of Power Engineering, Universiti Tenaga Nasional (UNITEN), Putrajaya Campus, Jalan IKRAM-UNITEN, Kajang 43000, Selangor, Malaysia
*
Author to whom correspondence should be addressed.
Energies 2025, 18(23), 6272; https://doi.org/10.3390/en18236272 (registering DOI)
Submission received: 1 October 2025 / Revised: 18 November 2025 / Accepted: 25 November 2025 / Published: 28 November 2025
(This article belongs to the Section A2: Solar Energy and Photovoltaic Systems)

Abstract

Global restrictions related to climate change and the increasing demand for electricity are accelerating the transition from conventional energy sources, such as oil, gas, and coal, to renewable options like wind, solar, and biomass. Among these, solar photovoltaic (PV) systems are highly promising, offering clean and reliable electricity generation. In support of the Maldives’ target to achieve net-zero emissions by 2030, the deployment of PV systems has significantly increased. However, there is still a lack of detailed operational performance assessment specific to the Maldives. This study aims to address this gap and fulfill three main objectives. Firstly, to evaluate the real performance of six selected rooftop grid-connected PV systems installed in the Greater Malé region, Maldives. Secondly, the ideal performance ignoring shading, soiling, and aging effects of the selected systems on the islands are simulated, and the optimal orientation angles are estimated. Finally, the real and predicted performances are compared, and a module-level analysis is conducted to pinpoint the area for improving the performance of the rooftop PV systems installed on the island. The well-known International Electro-Technical Commission (IEC) standard, IEC 61724, is used for operational performance assessment, in addition, the PVsyst simulation tool and the S-Miles microinverters monitoring system are implemented for simulation and module-level analysis, respectively. In 2023, the six studied sites recorded annual daily averages of 2.52–4.45 kWh/kWp/day for yield factor, 0.98–2.9 h/day for total loss, 45.19–82.13% for performance ratio (PR), 10.51–18.55% for capacity utilization factor (CUF), and 7.69–15.94% for system efficiency. The actual performance was found to be lower than the simulated ideal values. The main reasons for this reduction were near-shading and microinverter connection issues. The orientation study showed that a 5° tilt angle with an azimuth between −25° and 5° gives the best results for fixed PV installations. These findings can guide better PV system design and operation in the Maldives and other similar climates.

1. Introduction

Electricity generation and transmission are undergoing significant changes due to technological advancements and growing environmental considerations. Decentralized systems such as microturbines, photovoltaic (PV) systems, fuel cells, and wind energy conversion systems offer decreased emissions and potential cost savings [1]. Grid-connected solar PV generation plays a crucial role as a decentralized renewable energy source (RES) because of its various advantages, such as zero fuel cost, minimal noise, no pollution, and reduced maintenance requirements [2]. The performance of grid-connected PV systems in converting solar energy into usable electricity that can be fed into the grid can vary significantly due to various factors. The key factors include the PV module technology, inverter efficiency, solar irradiance, tilt angle and orientation, ambient and cell temperature, and miscellaneous system losses and degradation [3].

1.1. Motivation

The Maldives’ government is making great strides toward its ambitious goal of having net-zero emissions by 2030, and PV systems are gaining popularity as a sustainable energy source. Thus, rooftop grid-connected PV system installations have increased significantly during the past five years. The main reasons are land limits and public acceptance that PV systems can be installed to reduce the high electricity rate [4]. Despite the expansion, there is a significant gap in the real performance evaluation of the adopted rooftop grid-connected PV systems in the Maldives to assess the operational aspects and highlight areas that need improvement.

1.2. Literature Review

1.2.1. Evaluating Hybrid Renewable Energy Solutions for the Maldives: Challenges and Opportunities

During their initial research, Sark et al. were the first to present a hybrid PV–diesel power system with a battery backup system in the Maldives [5]. Using HOMER, the suggested system was designed and simulated. However, the system’s failure to operate as planned was primarily caused by an abrupt increase in load demand. Moreover, the system’s dependence on diesel generators made it unsustainable. Aphen et al. conducted a techno-economic study using multi-criteria analysis to evaluate the potential of renewable energy (RE) options [6]. A power system that was solely dependent on RE was not appropriate for the Maldives due to the high cost of RE technologies at the time. In a related research study involving five Maldives islands, a hybrid solar–diesel system with a battery energy storage system (BESS) was proposed and explored, demonstrating both ecological and economic appeal as a sustainable energy solution [7]. Given the limited land area on the islands, Ali et al. delved into the potential of rooftop solar PV on the island of Hulhumalé, Maldives. They conducted techno-economic analysis and concluded that the most suitable RE generation choice for the examined system is a hybrid solar–diesel system with BESS [8,9]. Jung et al. conducted a similar study to determine grid parity for hybrid solar PV and BESSs using techno-economic analysis. Despite the current high cost of BESS, it was suggested that grid parity could be achieved over the project’s lifespan [10].

1.2.2. Performance Analysis of Grid-Connected PV Systems: Insights from Global Studies

Grid-connected PV systems, which range in size from kW to MW, have been the subject of numerous studies on their performance and feasibility in different locations. To this end, Zaghba et al. evaluated the performance of a 2.25 kWp PV system composed of micro-morph thin-film solar modules over five years [11]. Performance metrics that were measured included performance ratio (PR) (80.2%) and degradation ratio (DR) (0.22%). Haffaf et al. investigated a 2.4 kWp grid-connected PV system installed outdoors at the IUT in France that was constructed using mc-Si technology. It demonstrates that the outcomes produced by the suggested systems fall within the range of values documented worldwide [12]. In another study, an extensive analysis was carried out to assess the technical performance of an integrated PV system using real-time data. Technical performance metrics such as final yield, system efficiency (13.29%), PR (78%), and capacity utilization factor (CUF) (21%), were calculated using a year’s worth of data collected from the site [13]. In a 2022 study conducted in Lucknow, India, three rooftop PV systems with a combined capacity of 467.2 kWp were assessed using operational data from 2018 to 2020 [14]. Between 80.68% and 82.04% was the average PR, while the CUF was 15.25%. PR, CUF, and system efficiency were 14.4%, 74.4%, and 14.31%, respectively, in a related study that was recently published in Manipur, India [15]. The decreased PR was attributed to weather variations, such as fog. In [16], Dobaria et al. evaluated system losses for a 5.05 kWp grid-tied PV plant due to soiling, dirt, array and cell mismatch, temperature, module quality, and irradiance angle. The performance of a 5 kWp rooftop PV system in northern India was examined in [17] with cell temperature and other meteorological conditions. Similarly, the performance of a grid-connected PV system was investigated in New Zealand with a capacity of 10 kWp. With a PR of 76% to 79%, the system’s final yield varied from 1.1 to 4.9 h/d [18]. In a related work, Arora et al. examined a ground-mounted 186 kWp grid-connected PV system in Gurugram, India, in 2018, adhering to the IEA 61724 standard [19]. The system exhibited robust PR (82.7%) and CUF (17.8%). The study in [20] investigated the performance and degradation of two distinct solar PV technologies—polycrystalline silicon PV (Poly-Si PV) and monocrystalline silicon PV (Mono-Si PV)—in the tropical climate of eastern India. The authors concluded that Mono-Si PV outperformed Poly-Si PV counterpart in terms of yield results and losses. Mono-Si PV is 9% less expensive to produce energy than Poly-Si PV, and Poly-Si PV deteriorates more quickly. Aarich et al. used data from 20 grid-connected PV systems located in 20 higher education institutions in Morocco to analyze and compare the DC performance ratio maps of three distinct silicon PV technologies: monocrystalline, polycrystalline, and amorphous silicon solar cells [21]. It was discovered that the yearly average of daily DC PRs of polycrystalline, monocrystalline, and amorphous silicon solar cells were 90.64%, 90.10%, and 87.30%, respectively.
Table 1 presents a summary of previous works performed and highlights the various assessment types performed across different locations.

1.2.3. Research Gaps and Contributions

Grid-connected PV systems (kW–MW) have been widely assessed for performance and feasibility. In the Maldives, early work centered on HOMER-modeled PV–diesel–battery hybrids [5,6]. These studies established techno-economic potential but were largely simulation-based; deployed systems often underperformed due to abrupt load changes and continued diesel reliance [5,7,8]. Later analyses of rooftop PV, PV–diesel with BESS, and grid parity showed that hybrid configurations deliver economic and environmental gains [8,9,10].
Globally, performance evaluations span sizes and technologies. A 2.25 kWp micro-morph thin-film system reported PR = 80.2% and DR = 0.22% over five years [11], while a 2.4 kWp mc-Si system in France aligned with international benchmarks [12]. Studies from India, New Zealand, and Morocco report PRs of 74–90%, efficiencies of 13–15%, and CUFs of 14–21% [13,14,15,16,17,18,19,20,21]. Comparative analyses of poly- and monocrystalline modules highlight differences in yield, losses, degradation, and cost-effectiveness [20,21].
According to the literature, most studies; both in the Maldives and globally have focused on system-level performance assessments, with module-level analyses largely lacking. Moreover, most prior works have relied on simulation-based or techno-economic analyses, with limited evaluation of actual operational performance. This represents a critical research gap, particularly for the Maldivian context, where climatic conditions, small-scale installations, and island-specific operational factors may significantly affect PV system performance.
The present study aims to address this gap by conducting a comprehensive operational performance assessment of PV systems installed across the Maldivian islands, providing empirical insights into both system and module-level behavior to support accurate performance evaluation, optimization, and sustainable deployment.

2. Materials and Data

2.1. The Site and Meteorological Data

In this study, operational monitoring data for six different residential grid-connected PV systems installed in K. Malé, Maldives, were analyzed. The information for the selected sites is shown in Figure 1 and Table 2. Moreover, Table 3 lists the specifics of the PV system installation at each location.

2.2. PV Systems Configuration and Specifications

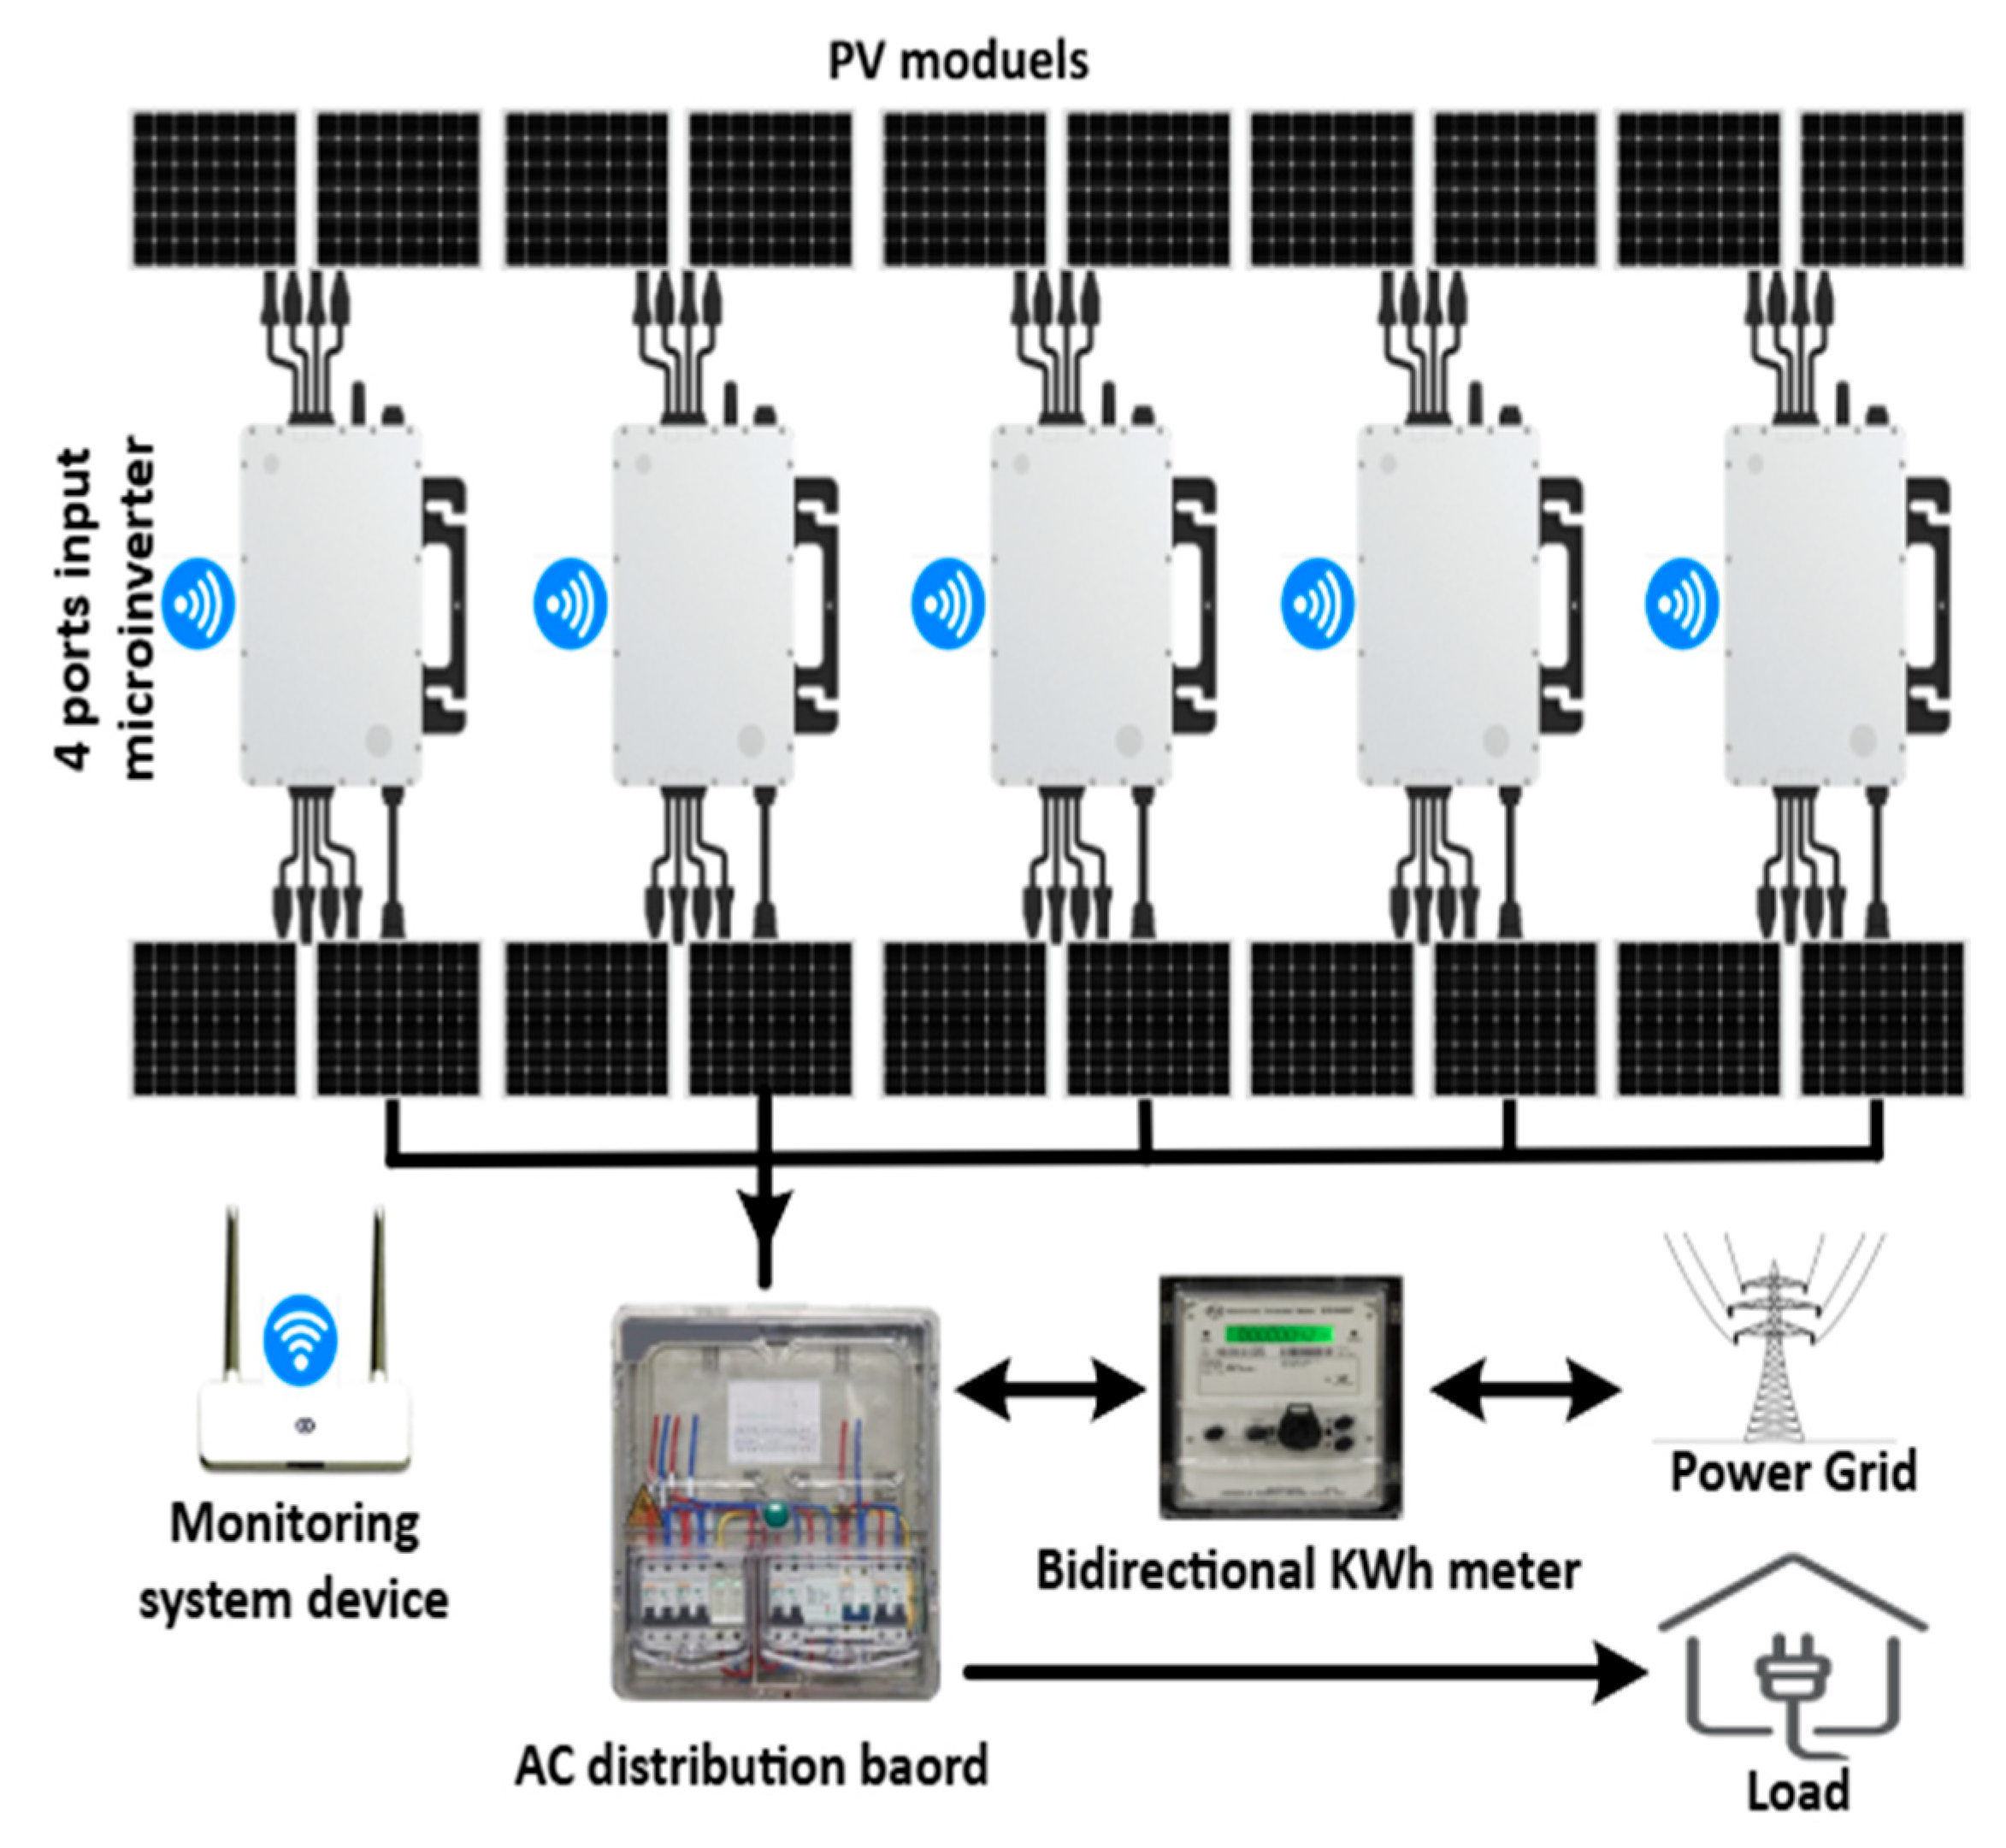
In 2020, the Maldivian State Electric Company Limited (STELCO) established a new solar center to provide PV solutions, solar generation, and installation services throughout the country. Figure 2 illustrates the typical configuration used in PV system installations on the islands, where a technology featuring four-port input microinverters is implemented to optimize energy output. A Maximum Power Point Tracking (MPPT) controller is integrated into each microinverter input port to individually manage the power generated by each connected PV module, enhancing the overall efficiency of the system. Two types of Jinko solar PV modules are employed in PV systems at selected sites for this study, JKM330PP-72-V POLYCRYSTALLINE MODULE and JKM340M-60H MONO PERC HALF CELL MODULE. Table 4 provides the key manufacturing specifications for the Jinko solar modules and Hoymiles four-port microinverters typically used for PV systems installation on the island.

2.3. Meteorological and Energy Production Data Collection and Processing

The monthly average recorded weather conditions in 2023, as shown in Table 5 for the capital of the Maldives, K. Malé, has been collected from the Maldives Meteorological Service at Velana International Airport, Hulhulé. The data collected were complete and does not require a special technique to process any missing data.
The Hoymiles DTU-W100 monitoring system is used to track the microinverters’ electrical energy output parameters in real time as they feed into the power distribution board at intervals of 15 min. The data for energy production from the sites was collected using Hoymiles’ cloud monitoring system S-Miles, which enables the user to view and download the relevant energy data.
The weather data and energy production data were processed and converted into a daily and monthly average format to enable consistent comparison with PVsyst simulation results. The global horizontal irradiance (GHI) data were obtained from Velana International Airport at 15 min intervals and then arranged and averaged daily. Other weather parameters, including ambient temperature, relative humidity, sunshine hours, and rainfall, were collected as daily averages from the Maldives Meteorological Services. The daily energy production for each system was retrieved from the S-Miles monitoring cloud platform, which provides the option to obtain a daily average energy for each PV module. As the S-Miles platform reports daily DC energy at the module level, the simulation losses on the AC side were set to zero in PVsyst to maintain consistency with the measured data. This assumption is acceptable, as all systems employ similar microinverter configurations with minimal AC wiring losses, ensuring a fair comparison between measured and simulated DC energy production. We did not apply any exclusion criteria because it may affect the operational performance assessment. In addition, in the idle operational performance those days with curtailment or grid outages were excluded for idle performance assessment.

2.4. Performance Assessment Methodology

This section discusses a methodology for assessing the performance of the rooftop grid-connected PV systems in the capital of Maldives using IEC61724 standard parameters [22]. The data for weather conditions and PV systems real data monitored in 2023 were used for the assessment. In addition, a software tool PV system is implemented to simulate the performance of the PV systems on the island and estimate the optimal orientation for the fixed-tilt angle PV systems on the island. This section also discusses the method for performing the module-level assessment for the area of low performance, which results from the site’s simulations.

2.4.1. IEC 61724 Evaluation Parameters

The IEC 61724 standard, first published in 1998, provides a comprehensive framework for assessing the performance of PV systems. Five key operational performance parameters are used for the assessment, namely the yield factor, total loss, PR, CUF, and overall system efficiency. These parameters offer valuable insights into the system’s operational performance. Table 6 illustrates the standard operational performance assessment parameters’ definitions and formulas.
In this study, Ht represents the total global horizontal irradiance (GHI). The actual GHI data were obtained from the Maldives Meteorological Service, providing complete datasets for 2023. For PVsyst simulations, POA irradiance was derived by transposing this GHI to the module plane using the Perez transposition model. The diffuse component was modeled with the Perez–Meteonorm anisotropic approach, with the circumsolar component treated separately. A free horizon and no near-shading were assumed, and the ground-reflected component was calculated with an albedo of 0.20. The incidence-angle modifier (IAM) followed the default PVsyst model. The reference irradiance (Hr) used in the calculation of the reference yield (Yr) was 1 kW m−2, consistent with standard test conditions (STC).

2.4.2. PVsyst Software for Ideal System Performance Evaluation

PVsyst 7.4 is a system design software known for its ability to optimize PV system energy production. This software is configured to forecast energy output at a specific site and predict the performance of the PV system under ideal conditions, thus illustrating the feasibility of the PV system at the chosen location. To maintain the accuracy of the projected results, various input parameters such as the site parameters in Table 2 and Table 3, PV system specifications in Table 4, and the meteorological data specific to the site presented in Table 5 are considered to simulate the performance of the PV systems under study. However, some environmental operational factors such as shading effect, dusting and soiling effect, and aging effect are not considered in the simulations. Subsequently, the simulated results are compared to the real operational performance data obtained in 2023. This comparative analysis provides valuable insight into the accuracy and reliability of the actual performance when compared with ideal results neglecting the losses due to shading, soiling, and aging. Moreover, the predicted performance highlights the low actual performance areas for improvement.

2.4.3. Optimal Orientation Estimation Method

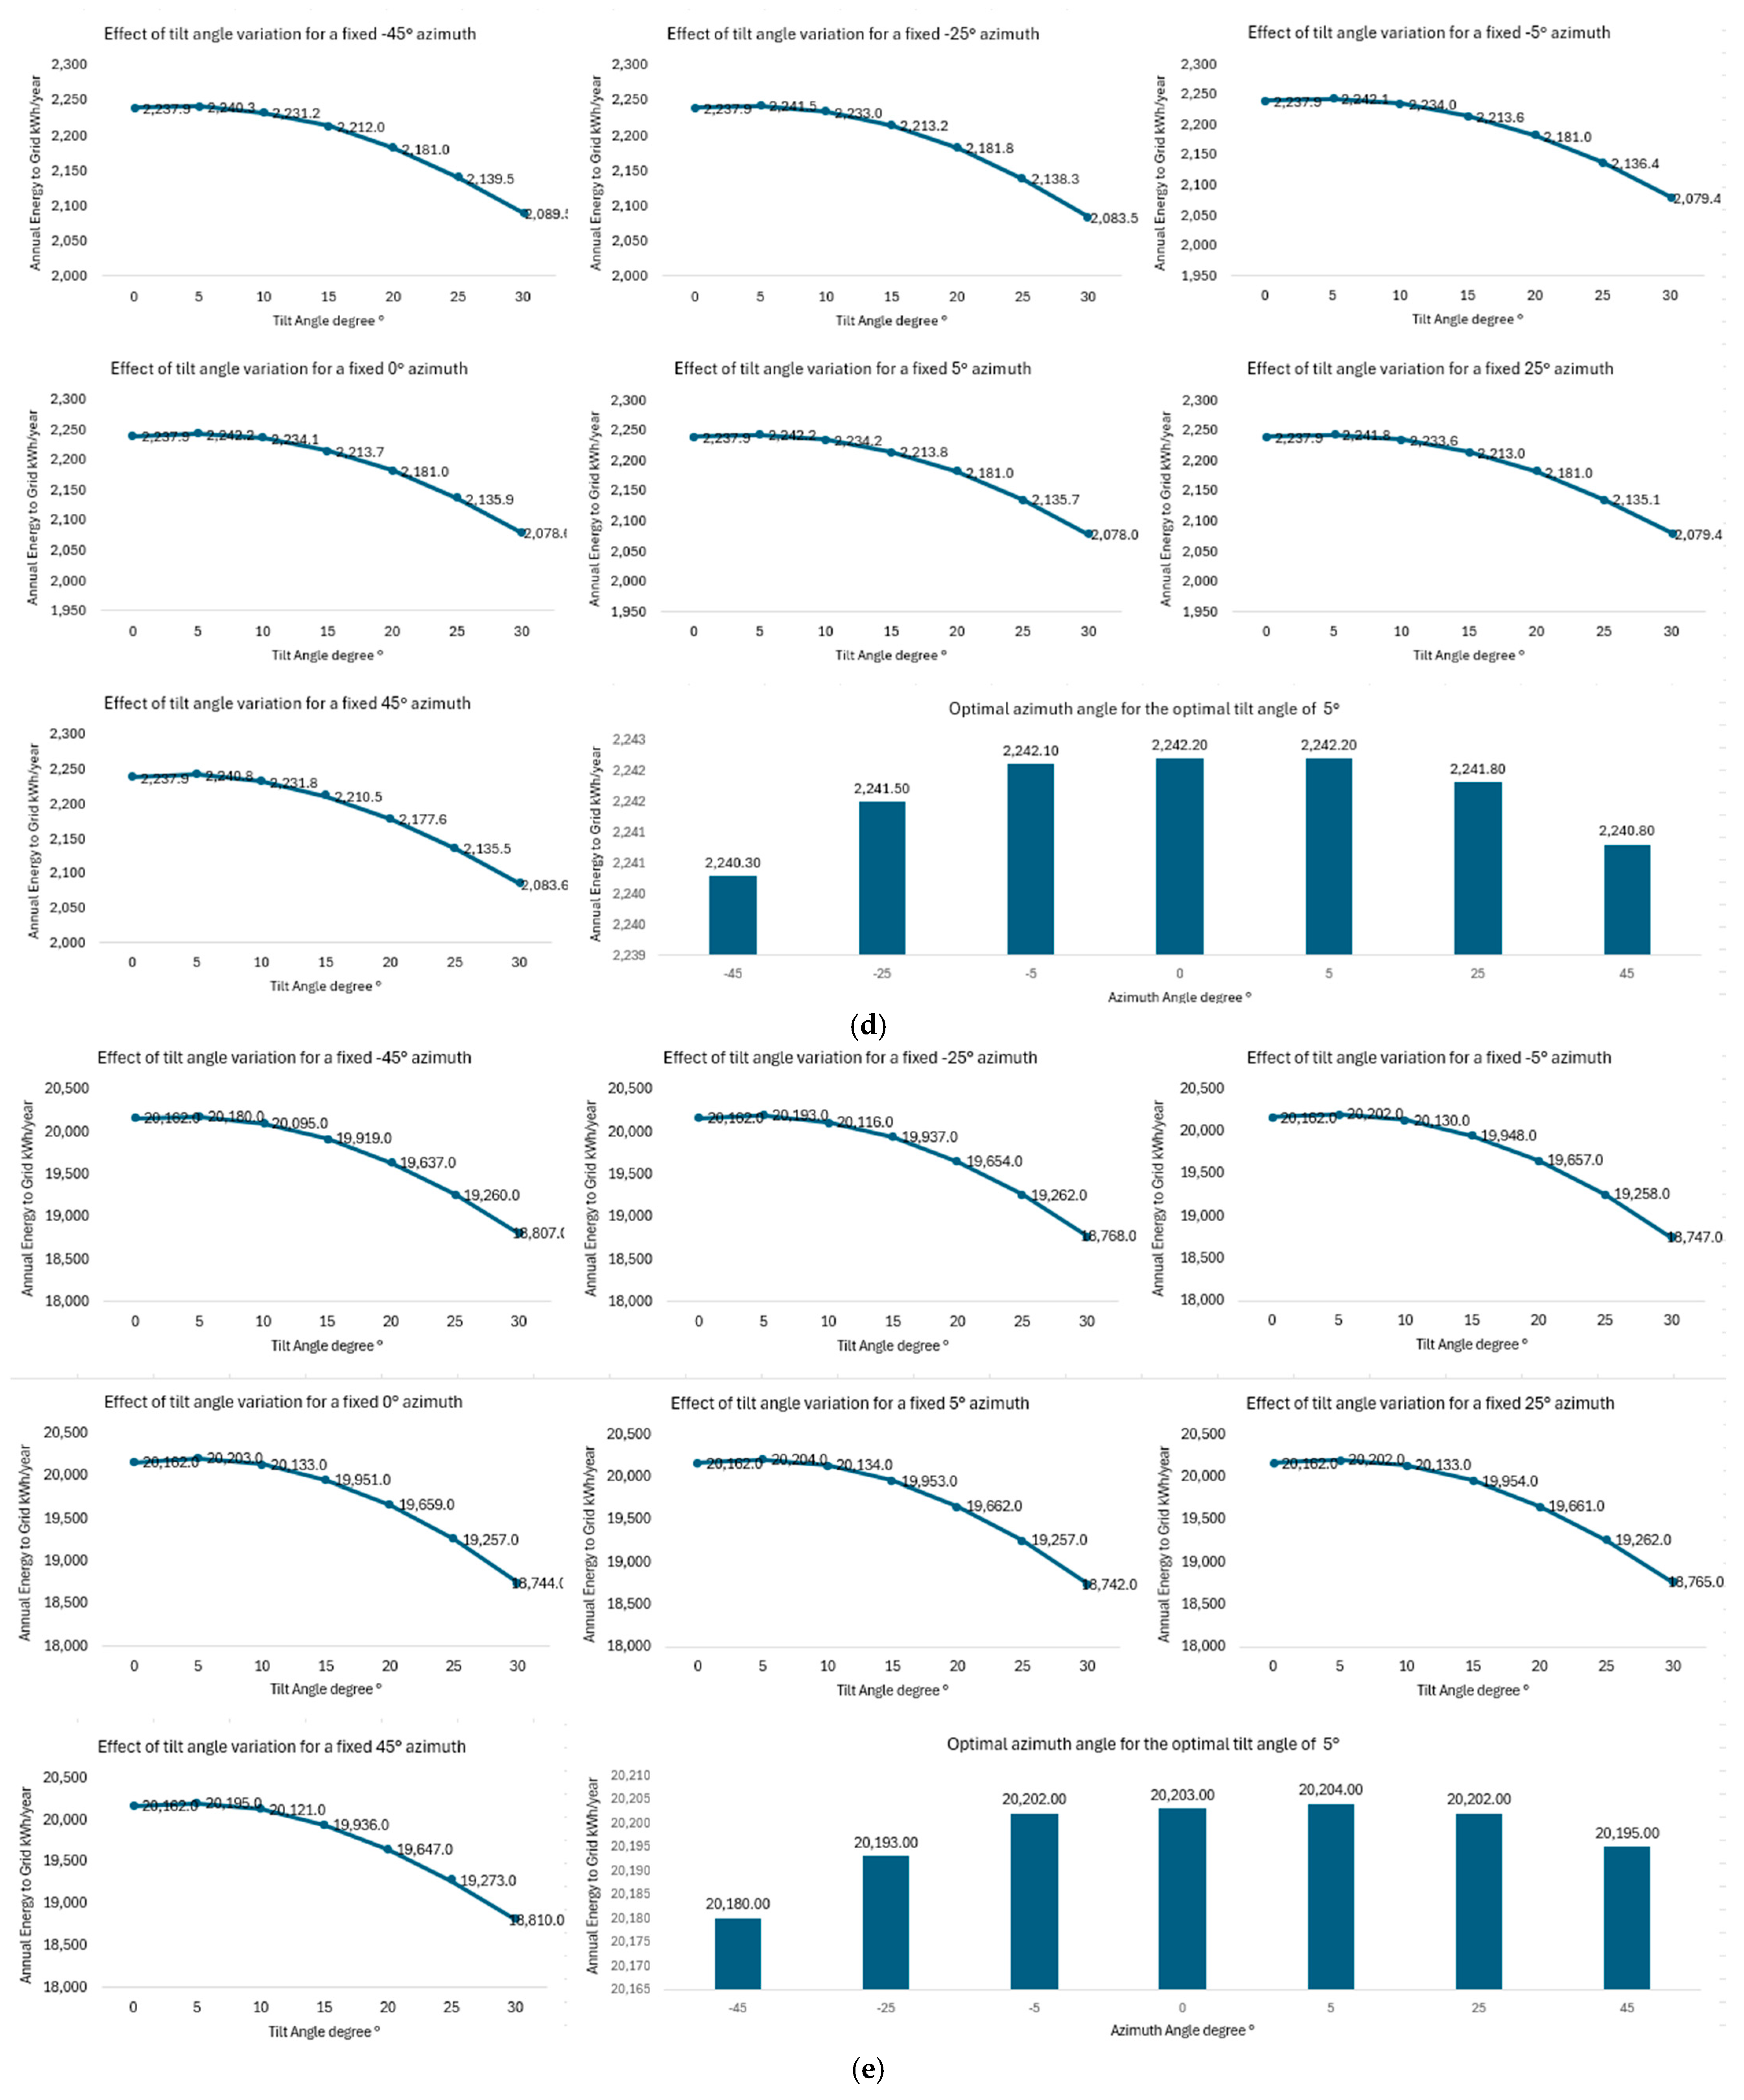
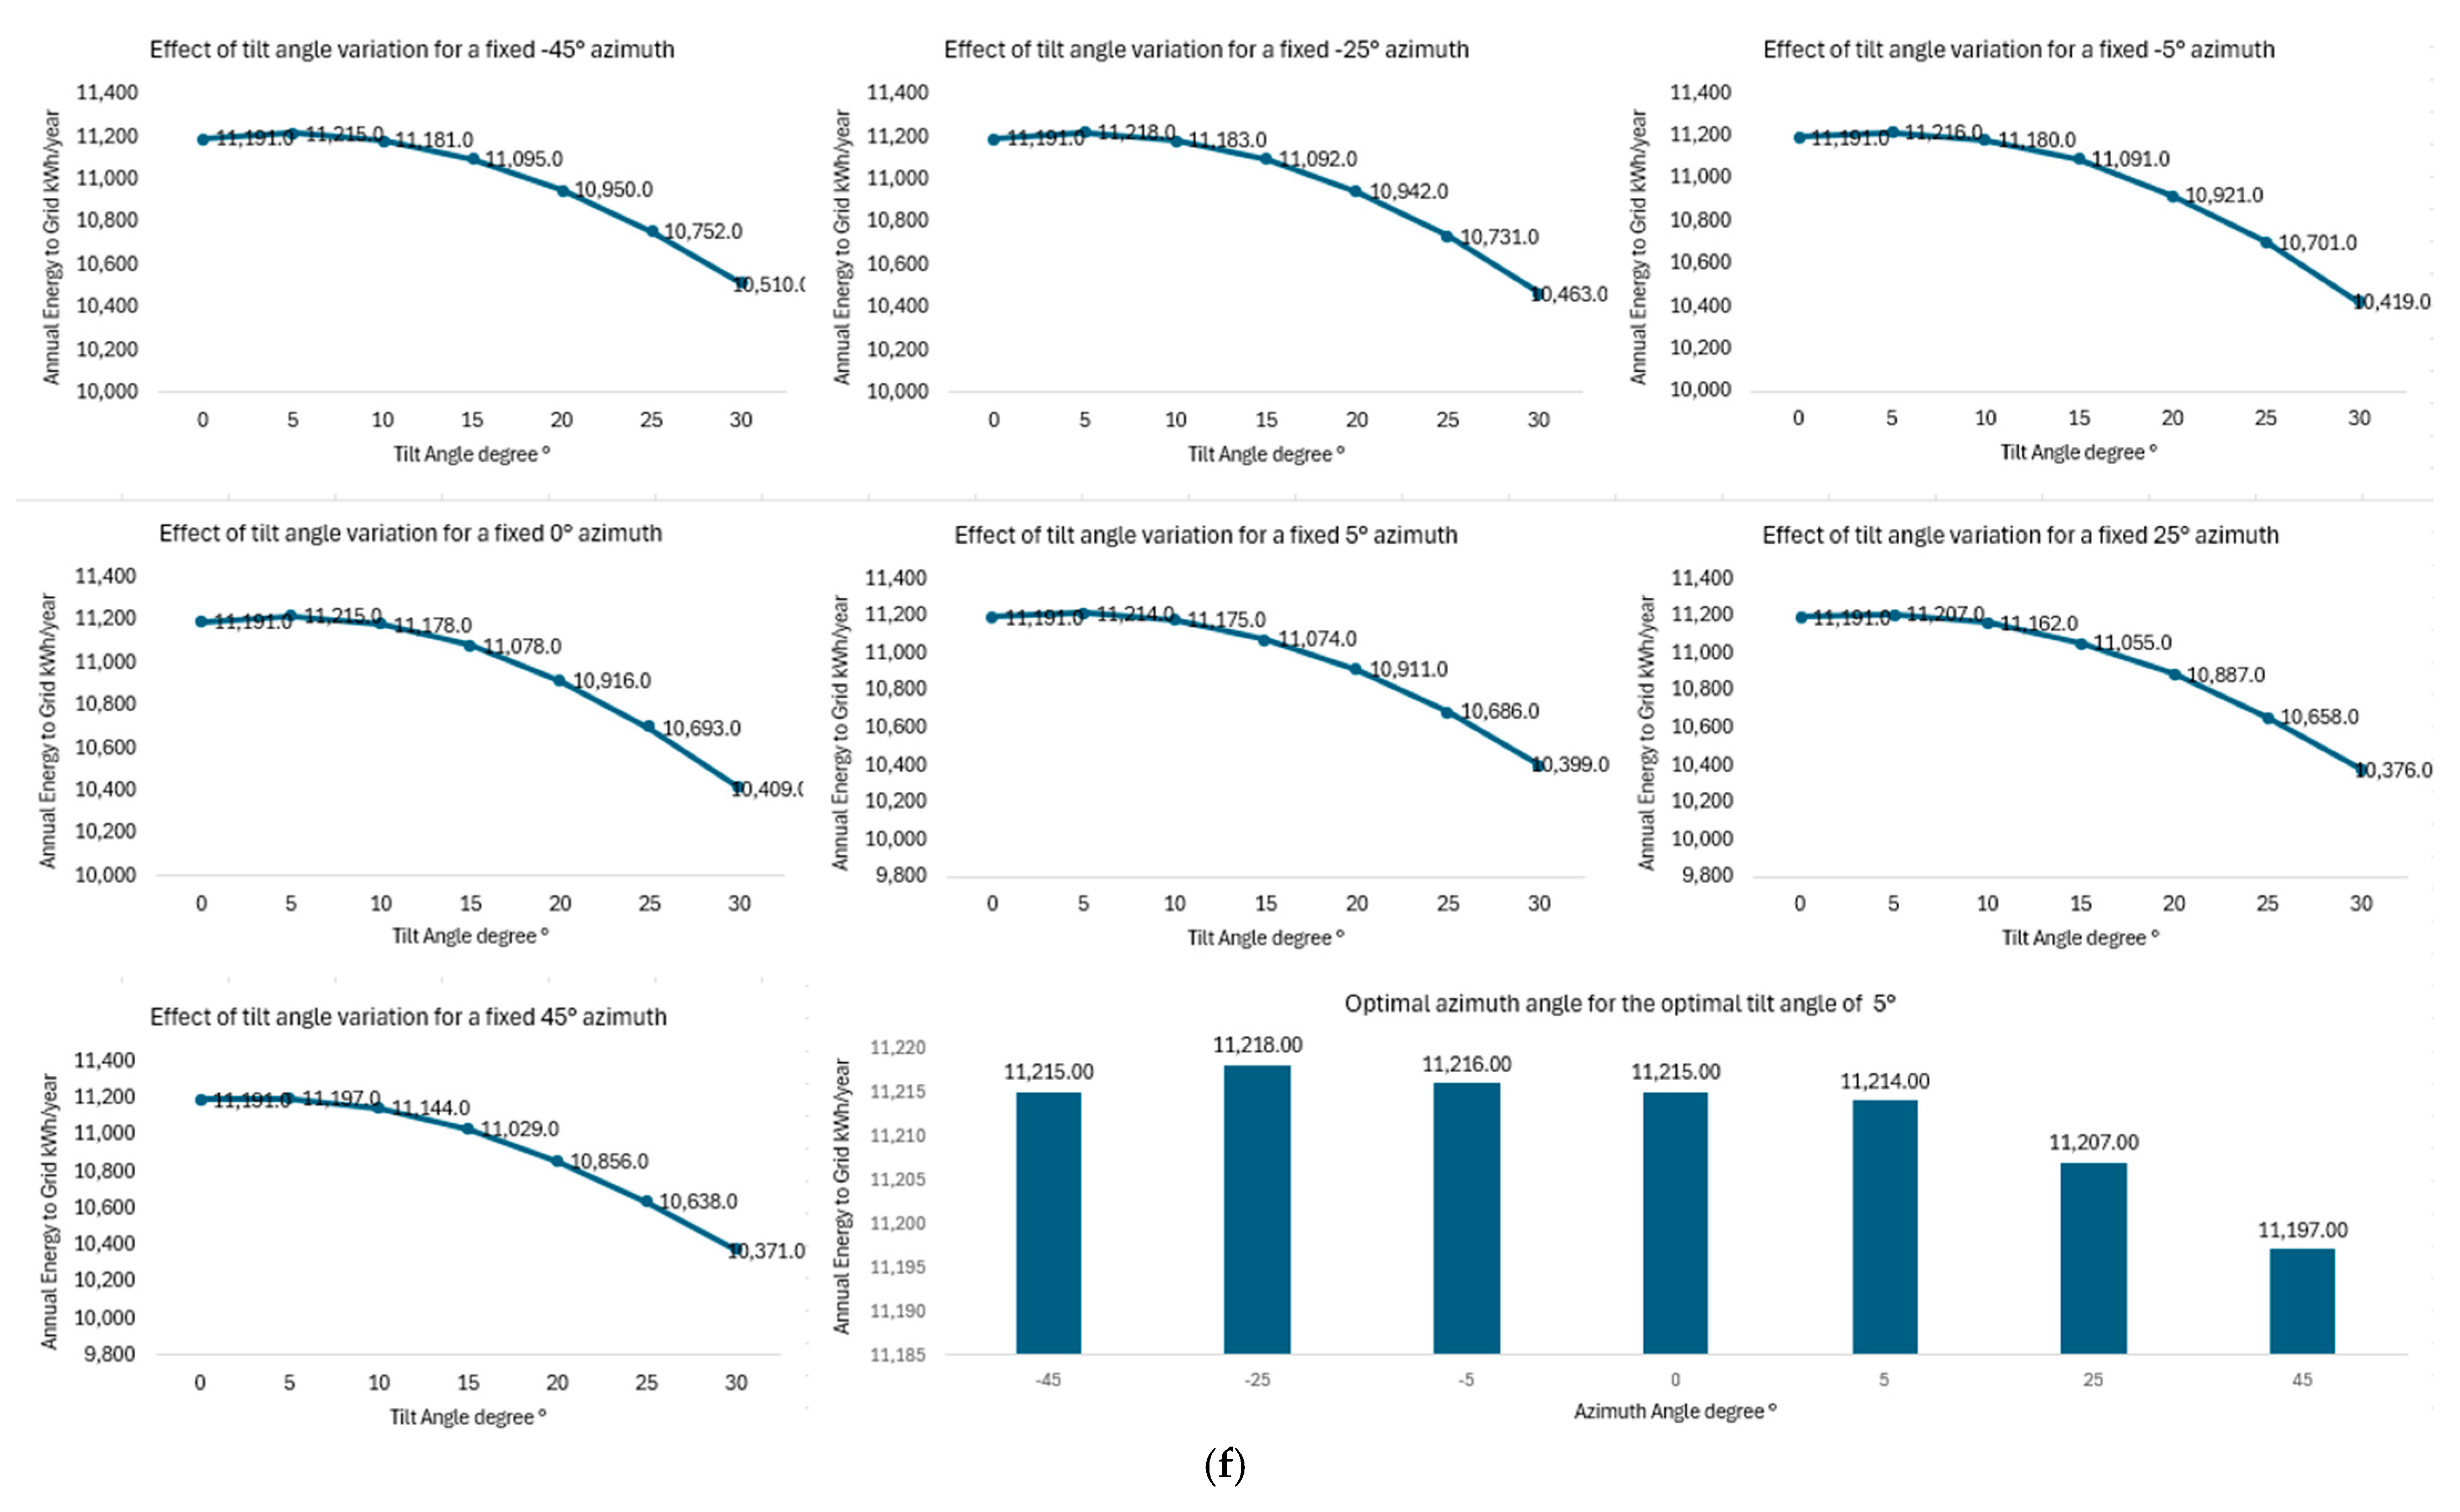
The tilt and orientation (azimuth) angles primarily dictate the orientation of the PV installation. The literature has demonstrated that two installation factors that affect PV system performance are tilt angle orientation and near-shading. The ideal tilt angle roughly corresponds to the latitude of the installation site. The PVsyst software simulation model for the PV systems for 2023 was used to find the optimal orientation. The optimal tilt was determined by examining each site’s annual energy product by varying the installation fixed tilt angle from 0° to 30° for different orientations from −45° to 45° facing south. For each site, the ideal tilt angle was used to determine the optimal orientation (azimuth angle) for maximum annual production.

2.5. Module-Level Daily Energy Performance Evaluation

Using the cloud monitoring system S-Miles, the daily energy performance of the PV module for each site in 2023 was investigated. Using the performance observations derived from the comparison analysis between the actual and predicted performance, the areas that require improvement were noted and highlighted. Figure 3 shows the overall research methodology.
The methodical procedure used to assess and improve a photovoltaic (PV) system’s performance is depicted in the flowchart in Figure 3. In compliance with the IEC 61724 standard, the process combines performance modeling, comparative analysis, and site-specific data collecting. Each of the steps depicted in Figure 3 is described succinctly in the five steps listed below:
  • Step 1: Data collection and site selection
In order to ensure that the photovoltaic (PV) system site reflects normal meteorological and operating characteristics for the region of interest, the study started with its selection. Global horizontal irradiance, ambient temperature, and measured energy output were among the pertinent meteorological and system performance data that were gathered. The gathered daily datasets were modified to reflect monthly daily averages in order to guarantee temporal consistency and lessen short-term variability. These processed data served as the foundation for later modeling and performance assessment.
  • Step 2: IEC 61724 Standard Performance Evaluation
The IEC 61724 standard, which establishes criteria for assessing PV system energy yield and losses, was used to evaluate the system’s performance. Important metrics were calculated for both real and simulated situations, including performance ratio (PR), final yield (Yf), reference yield (Yr), and array yield (Ya). In this stage, initially actual performance was directly derived from operations records and measured site data. Parallel to actual performance, predicted performance was acquired by simulating and modeling the system with the PVSyst program under comparable environmental conditions without some environmental factors such as shading, soiling, and aging effect. This is considered as ideal performance assessment.
  • Step 3: Modeling and Simulation with PVSyst
To study system behavior and determine the ideal setup settings that maximize energy yield, the PVSyst simulation program was utilized. There were two phases to the modeling process:
Tilt Angle Optimization: The orientation (azimuth) angles were adjusted across −45°, −25°, −5°, 0°, 5°, 25°, and 45° throughout a series of simulation iterations where the tilt angle varied from 0° to 30° in 5° increments. The ideal tilt angle that maximizes annual energy output was found by analyzing the performance curves that resulted from recording the annual energy yield (kWh) for each configuration.
Azimuth Angle Optimization: The optimal tilt angle that had been previously established was used in subsequent simulations, with the orientation angles being varied within the same range. To determine the ideal azimuth angle, annual energy yield results for each orientation were plotted.
  • Step 4: Comparative Evaluation of Predicted, Optimal, and Actual Performance
In this stage a thorough comparison study was conducted between, the performance that was really measured, the performance anticipated by the model, and the simulation-derived optimal performance. This comparison made it possible to assess the system inefficiencies and calculate the possible improvement that could be attained by making the best configuration changes.
  • Step 5: S-Mile Cloud System Monitoring Data Validation
S-Mile system monitoring data was used to support the analysis and validate the simulated outcomes. The system’s monthly and daily energy production over the course of the year was examined using these statistics. Verification of the anticipated performance trends and agreement between modeled and actual outcomes was made possible by the results, which offered an independent evaluation of the system’s module-level performance.
The process guarantees a methodical and repeatable framework for evaluating and improving PV system performance at the module and system levels. This methodical approach offers a solid basis for assessing system performance, verifying simulation models, and directing upcoming design enhancements.

3. Results and Discussion

3.1. Weather Condition Variations

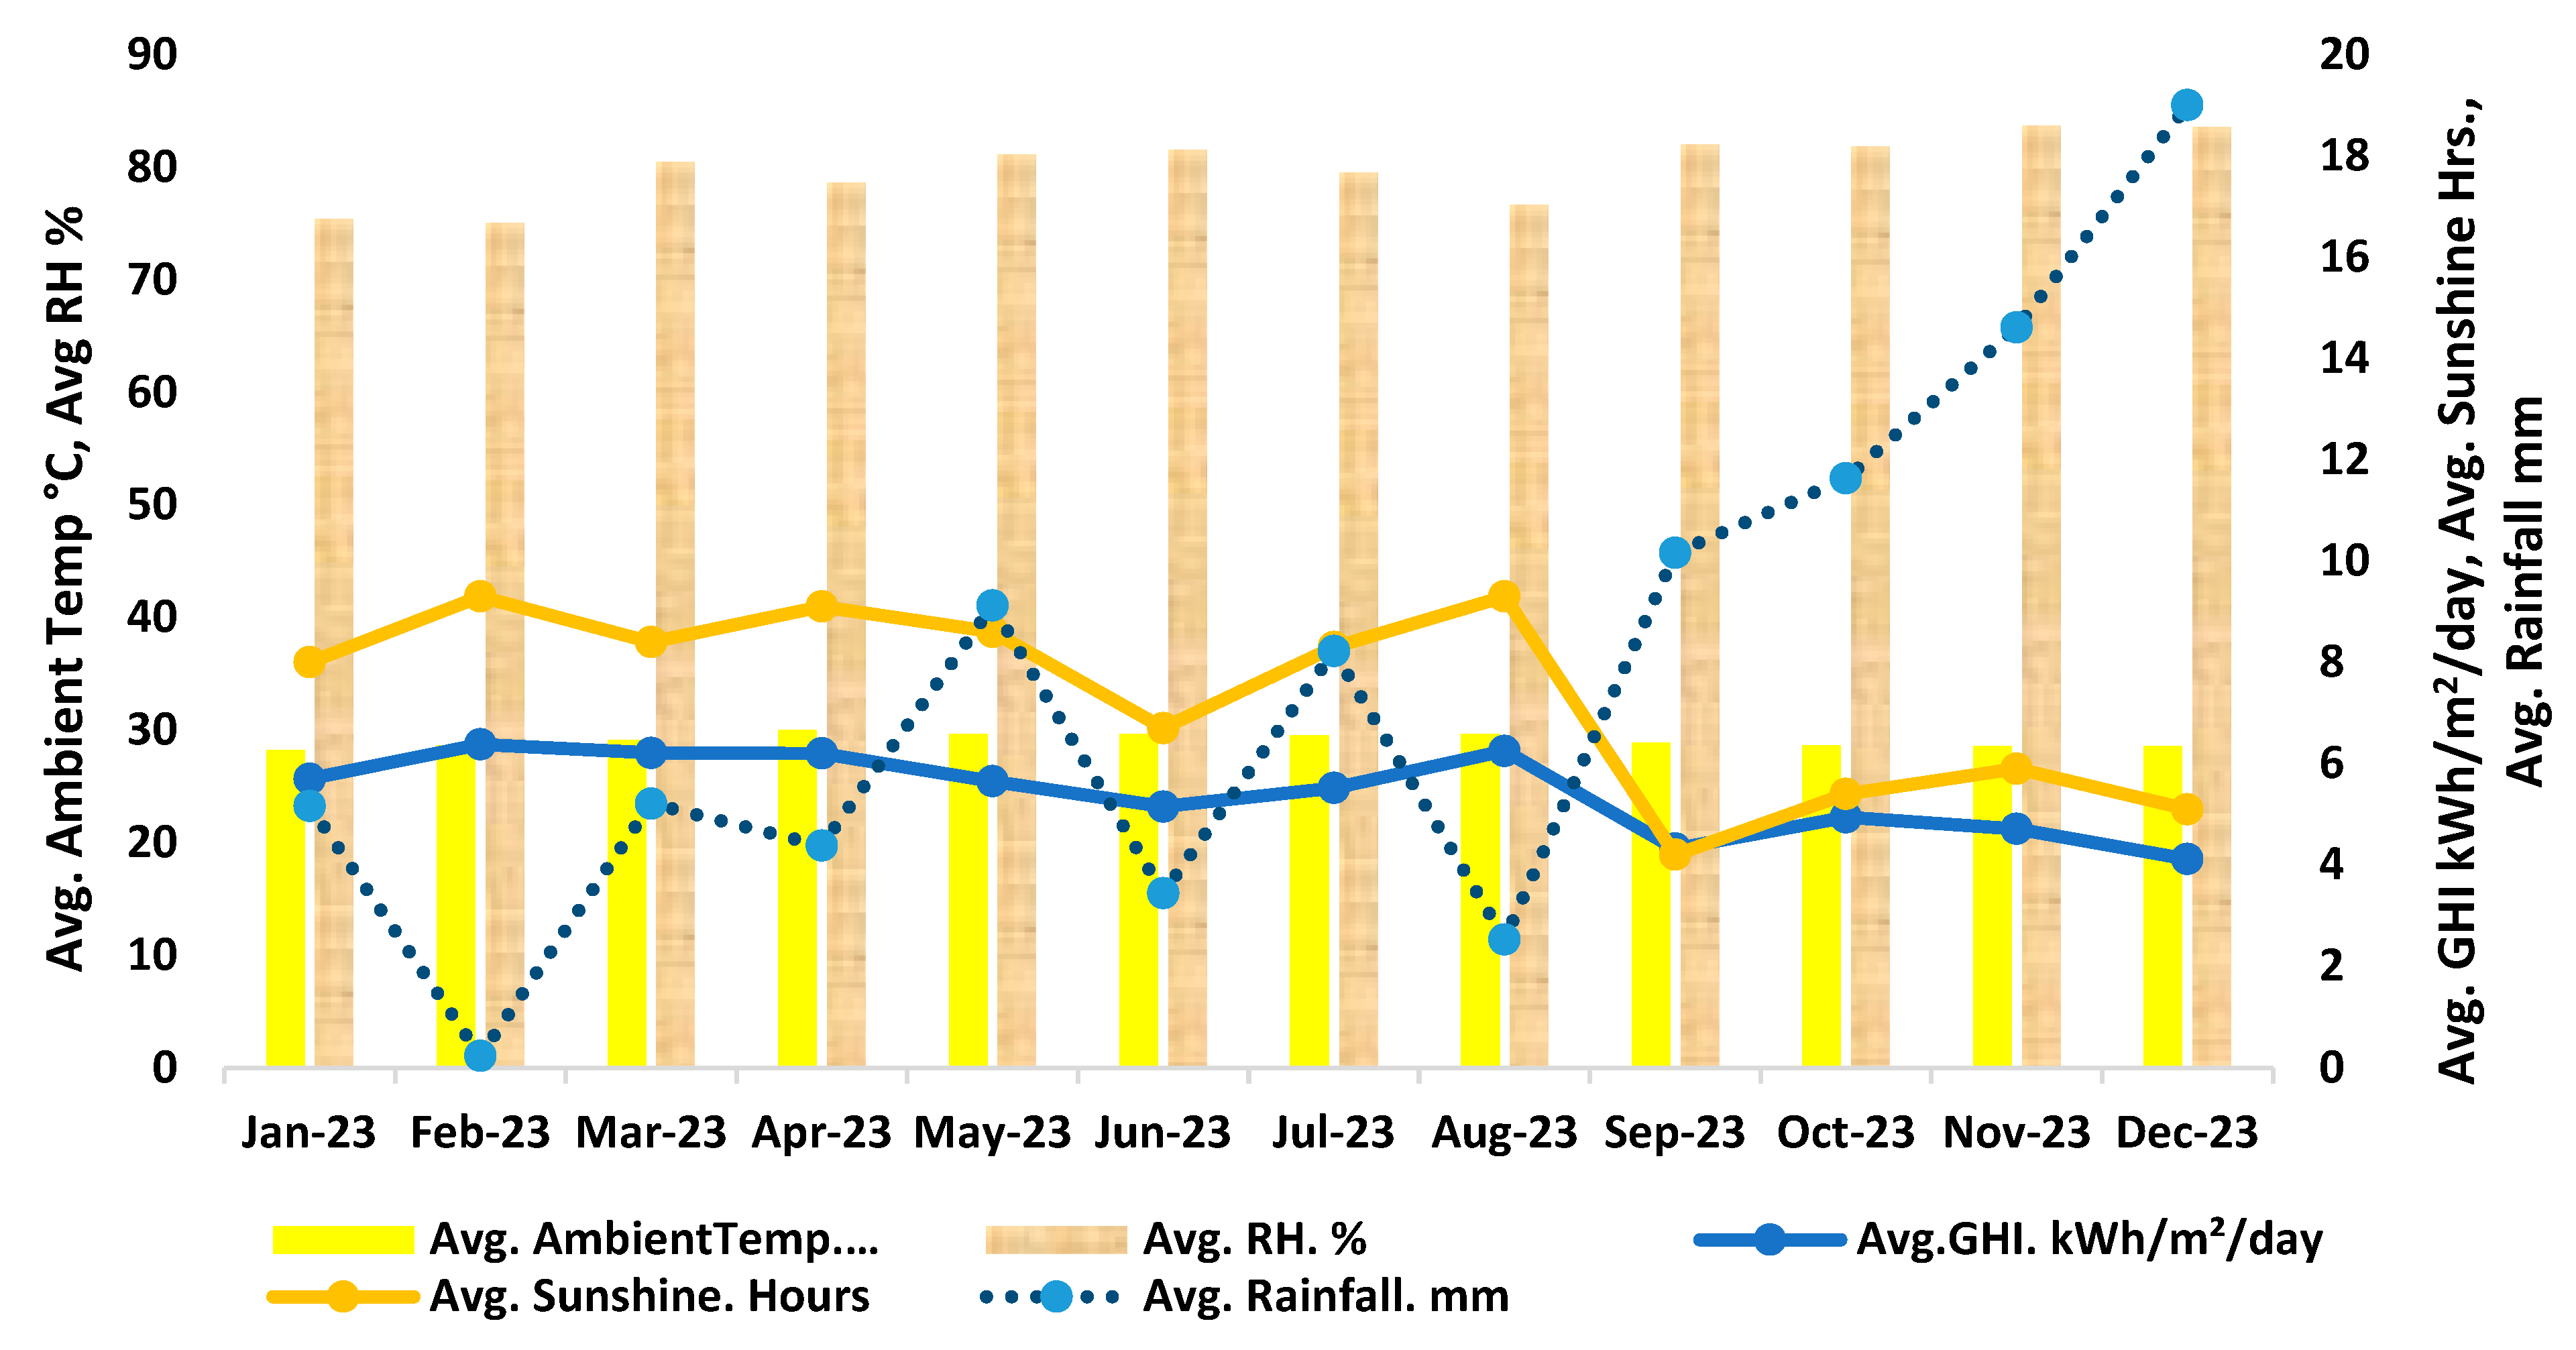
Figure 4 illustrates the variation in weather conditions in 2023. The daily monthly average GHI in 2023 varies from 4.12 kWh/m2/day in December to 6.38 kWh/m2/day in February. The daily monthly average ambient temperature varies from 28.20 °C in January to 29.99 °C in April. The daily monthly average relative humidity varies from 75.04% in February to 83.67% in November. The daily monthly average sunshine hours vary from 9.3 hours in February to 4.2 hours in September. The daily monthly average rainfall varies from 0.23 mm in February to 19.00 mm in December. In general, the months of February, March, April, and August show the most appropriate weather conditions for PV systems production, with high GHI extended sunshine hours and low values in rainfall and relative humidity. In contrast, the months of September through December show the worst weather conditions for PV systems production, with low values in GHI and sunshine hours and significant increases in rainfall and relative humidity. The ambient temperature was approximately constant with slight variation throughout the year.

3.2. Operational Performance Assessment

3.2.1. Yield Factors, Predicted vs. Actual

Table 7 displays the predicted yield factor changes in 2023. Following the GHI in 2023, it is predicted that all sites will have high yield factors for February, March, April, and August. September through December is predicted to have lower yield factors, with December 2023 having the lowest value overall. The actual yield factor and the GHI are directly correlated. As shown in Table 8, for all sites, the actual yield factor is substantially higher in February, March, April, and August. On the other hand, actual yield factors are lower from September through December. The actual yield factors have different variations from site to site, with a high measured yield factor for Ocean Front Residence 11F-PH1 that varies from 3.35 kWh/kWp/day in December to 5.17 kWh/kWp/day in February, with an average of 4.45 kWh/kWp/day. In contrast, the Aabin Lift site had the worst yield factor, which varied from 0.78 kWh/kWp/day to 3.58 kWh/kWp/day in February.

3.2.2. Total Loss, Predicted vs. Actual

Table 9 illustrates the predicted variations in total loss in 2023. In general, the total loss for the PV systems on the island is predicted to be high for the months with the high GHI. On the other hand, the months with lower GHI are predicted to have a lower value for the total system loss. The overall total loss for the island PV systems is predicted to range from 0.68 h/day to 1.23 h/day, with an annual average of 0.98 h/day. Table 10 shows the actual variations in total loss in 2023. With the lowest yield factor, the Aabin Lift site recorded the highest total loss that varied from 2.55 h/day in May to 3.34 h/day in December, with an annual average of 2.91 h/day. The Ocean Front Residence 11F-PH1 site recorded a low total loss which varied from 0.69 h/day in September to 1.29 h/day in January, with an annual average of 0.98 h/day.

3.2.3. Performance Ratios, Predicted vs. Actual

Table 11 illustrates the predicted variations in the PR for 2023. PV systems on the island are predicted to have an average PR of 82.10%, with a range of 77.26% to 87.04%. Table 12 shows the actual variations in the PR for 2023. Even though the Maavehi site recorded the highest PR of 89.56% in December, the Ocean Front Residence 11F-PH1 site had the highest annual average PR of 82.13%, with PR ranging from 77.32% in January to 85.34% in May. In contrast, the Aabin Lift had the worst PR, averaging 45.19% annually and ranging from 18.82% in December to 56.12% in February.

3.2.4. Capacity Utilization Factors, Predicted vs. Actual

Table 13 illustrates the predicted variations in the CUF in 2023. The overall annual average CUF for the island was predicted to be 18.60%. Table 14 shows the actual variations in the CUF in 2023. It demonstrates, as predicted, that the CUF is proportional to the yield factor. The Maavehi site recorded the highest CUF of 21.69% in February. However, the Ocean Front Residence 11F-PH site CUF varied from 13.95% in December to 21.55% in February and had the highest annual average CUF of 18.55%. On the other hand, the Aabin Lift had the worst CUF variations, with an annual average of 10.51%.

3.2.5. Systems Efficiency, Predicted vs. Actual

Table 15 illustrates the predicted variations in system efficiency in 2023. The system’s efficiency was predicted to follow the system’s PR variations. Generally, the system efficiency for sites implementing the monocrystalline PV module technology (i.e., Samraahi, Fehigiri, and Maavehi) was predicted to have higher efficiency than those implementing the polycrystalline PV module technology (i.e., Aabin Lift, Velima 4th-Floor, and Ocean Front Residence 11F-PH). Table 16 shows the actual variations in the system’s efficiency in 2023. The Maavehi site recorded the highest system efficiency of 18.03% in December. However, the Fehigiri site’s system efficiency varied from 14.81% in April to 16.68% in December and had the highest annual average system efficiency of 15.94%. On the other hand, the Aabin Lift had the worst system efficiency, which varied from 3.20% in December to 9.55% in February, with an annual average of 7.69%.

3.3. Orientation Analysis

This section illustrates the simulation-based analysis for estimating the optimal orientation for the PV systems installation on the island to optimize energy performance. The orientation of a PV system is primarily defined by its tilt and azimuth angles. The ideal tilt angle roughly corresponds to the latitude of the installation site and whether it is facing the south or northern hemisphere locations. Malé, Maldives, located at approximately 4° north latitude, is expected to provide the best solar energy yield. Using the PVsyst software, the 2023 system simulation models were used to find the optimal orientation. The simulation was performed by varying the orientation (azimuth angle) from −45° to 45° facing south and the tilt angle from 0° to 30°.
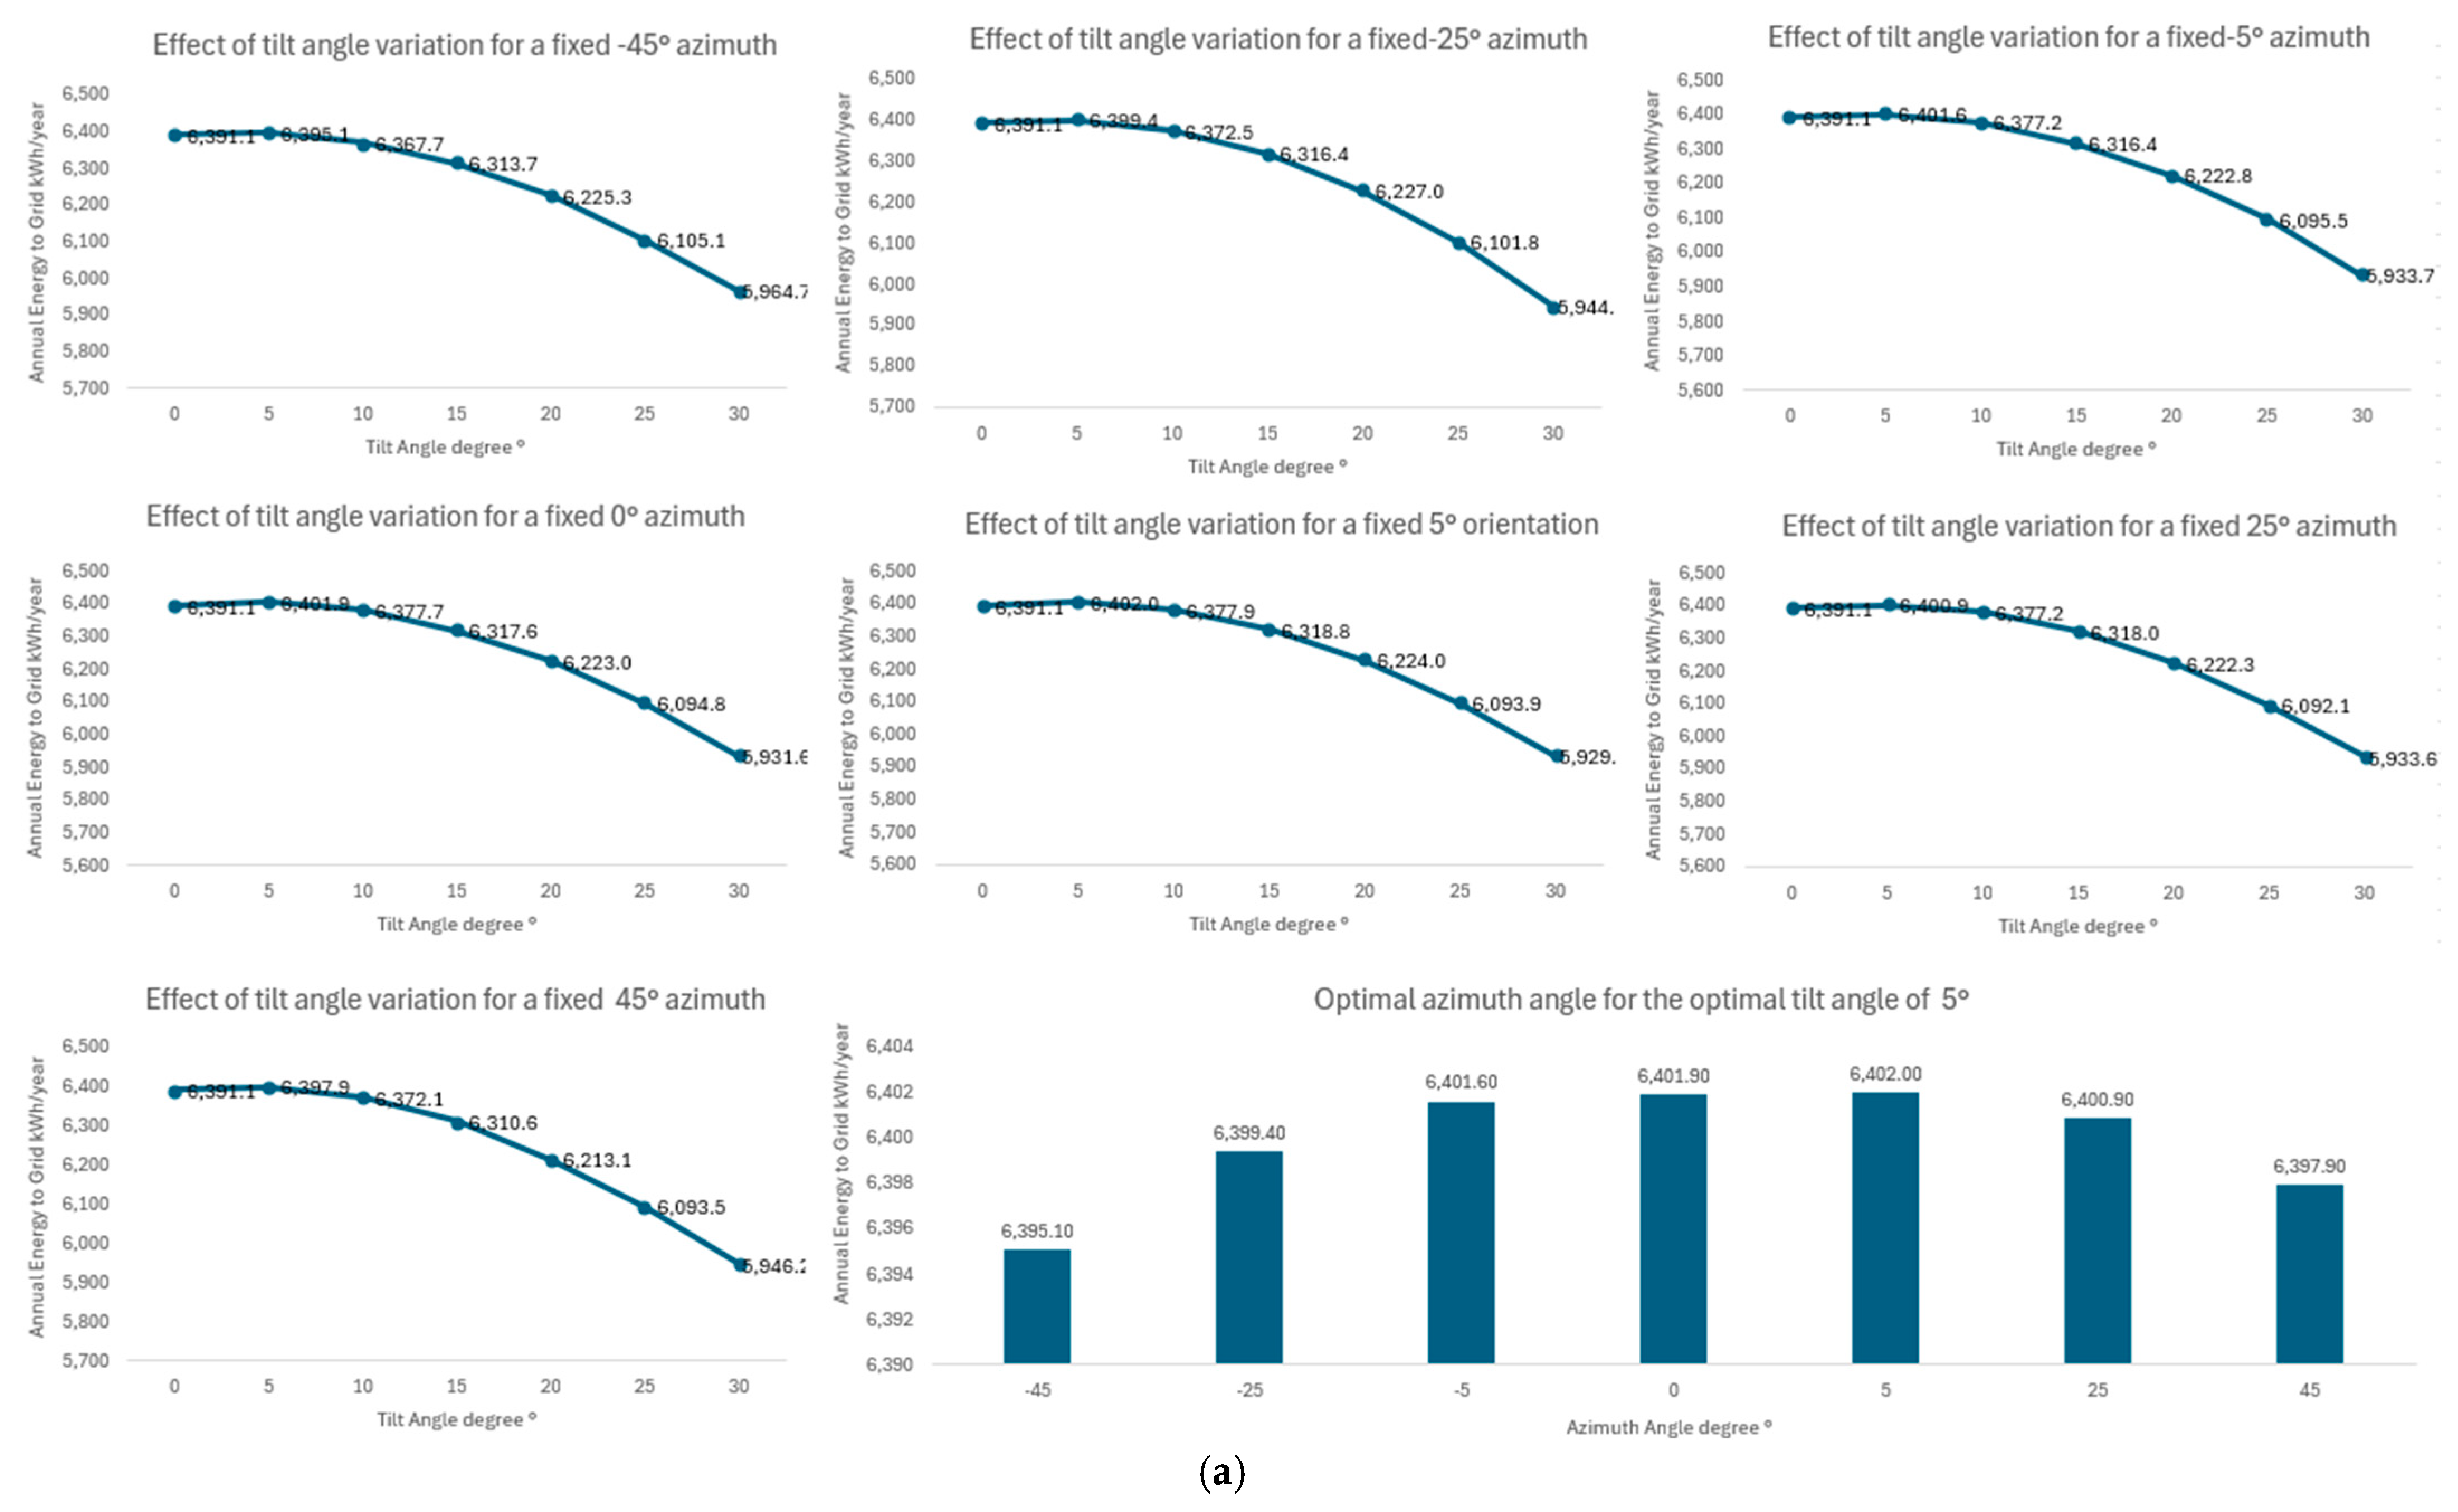
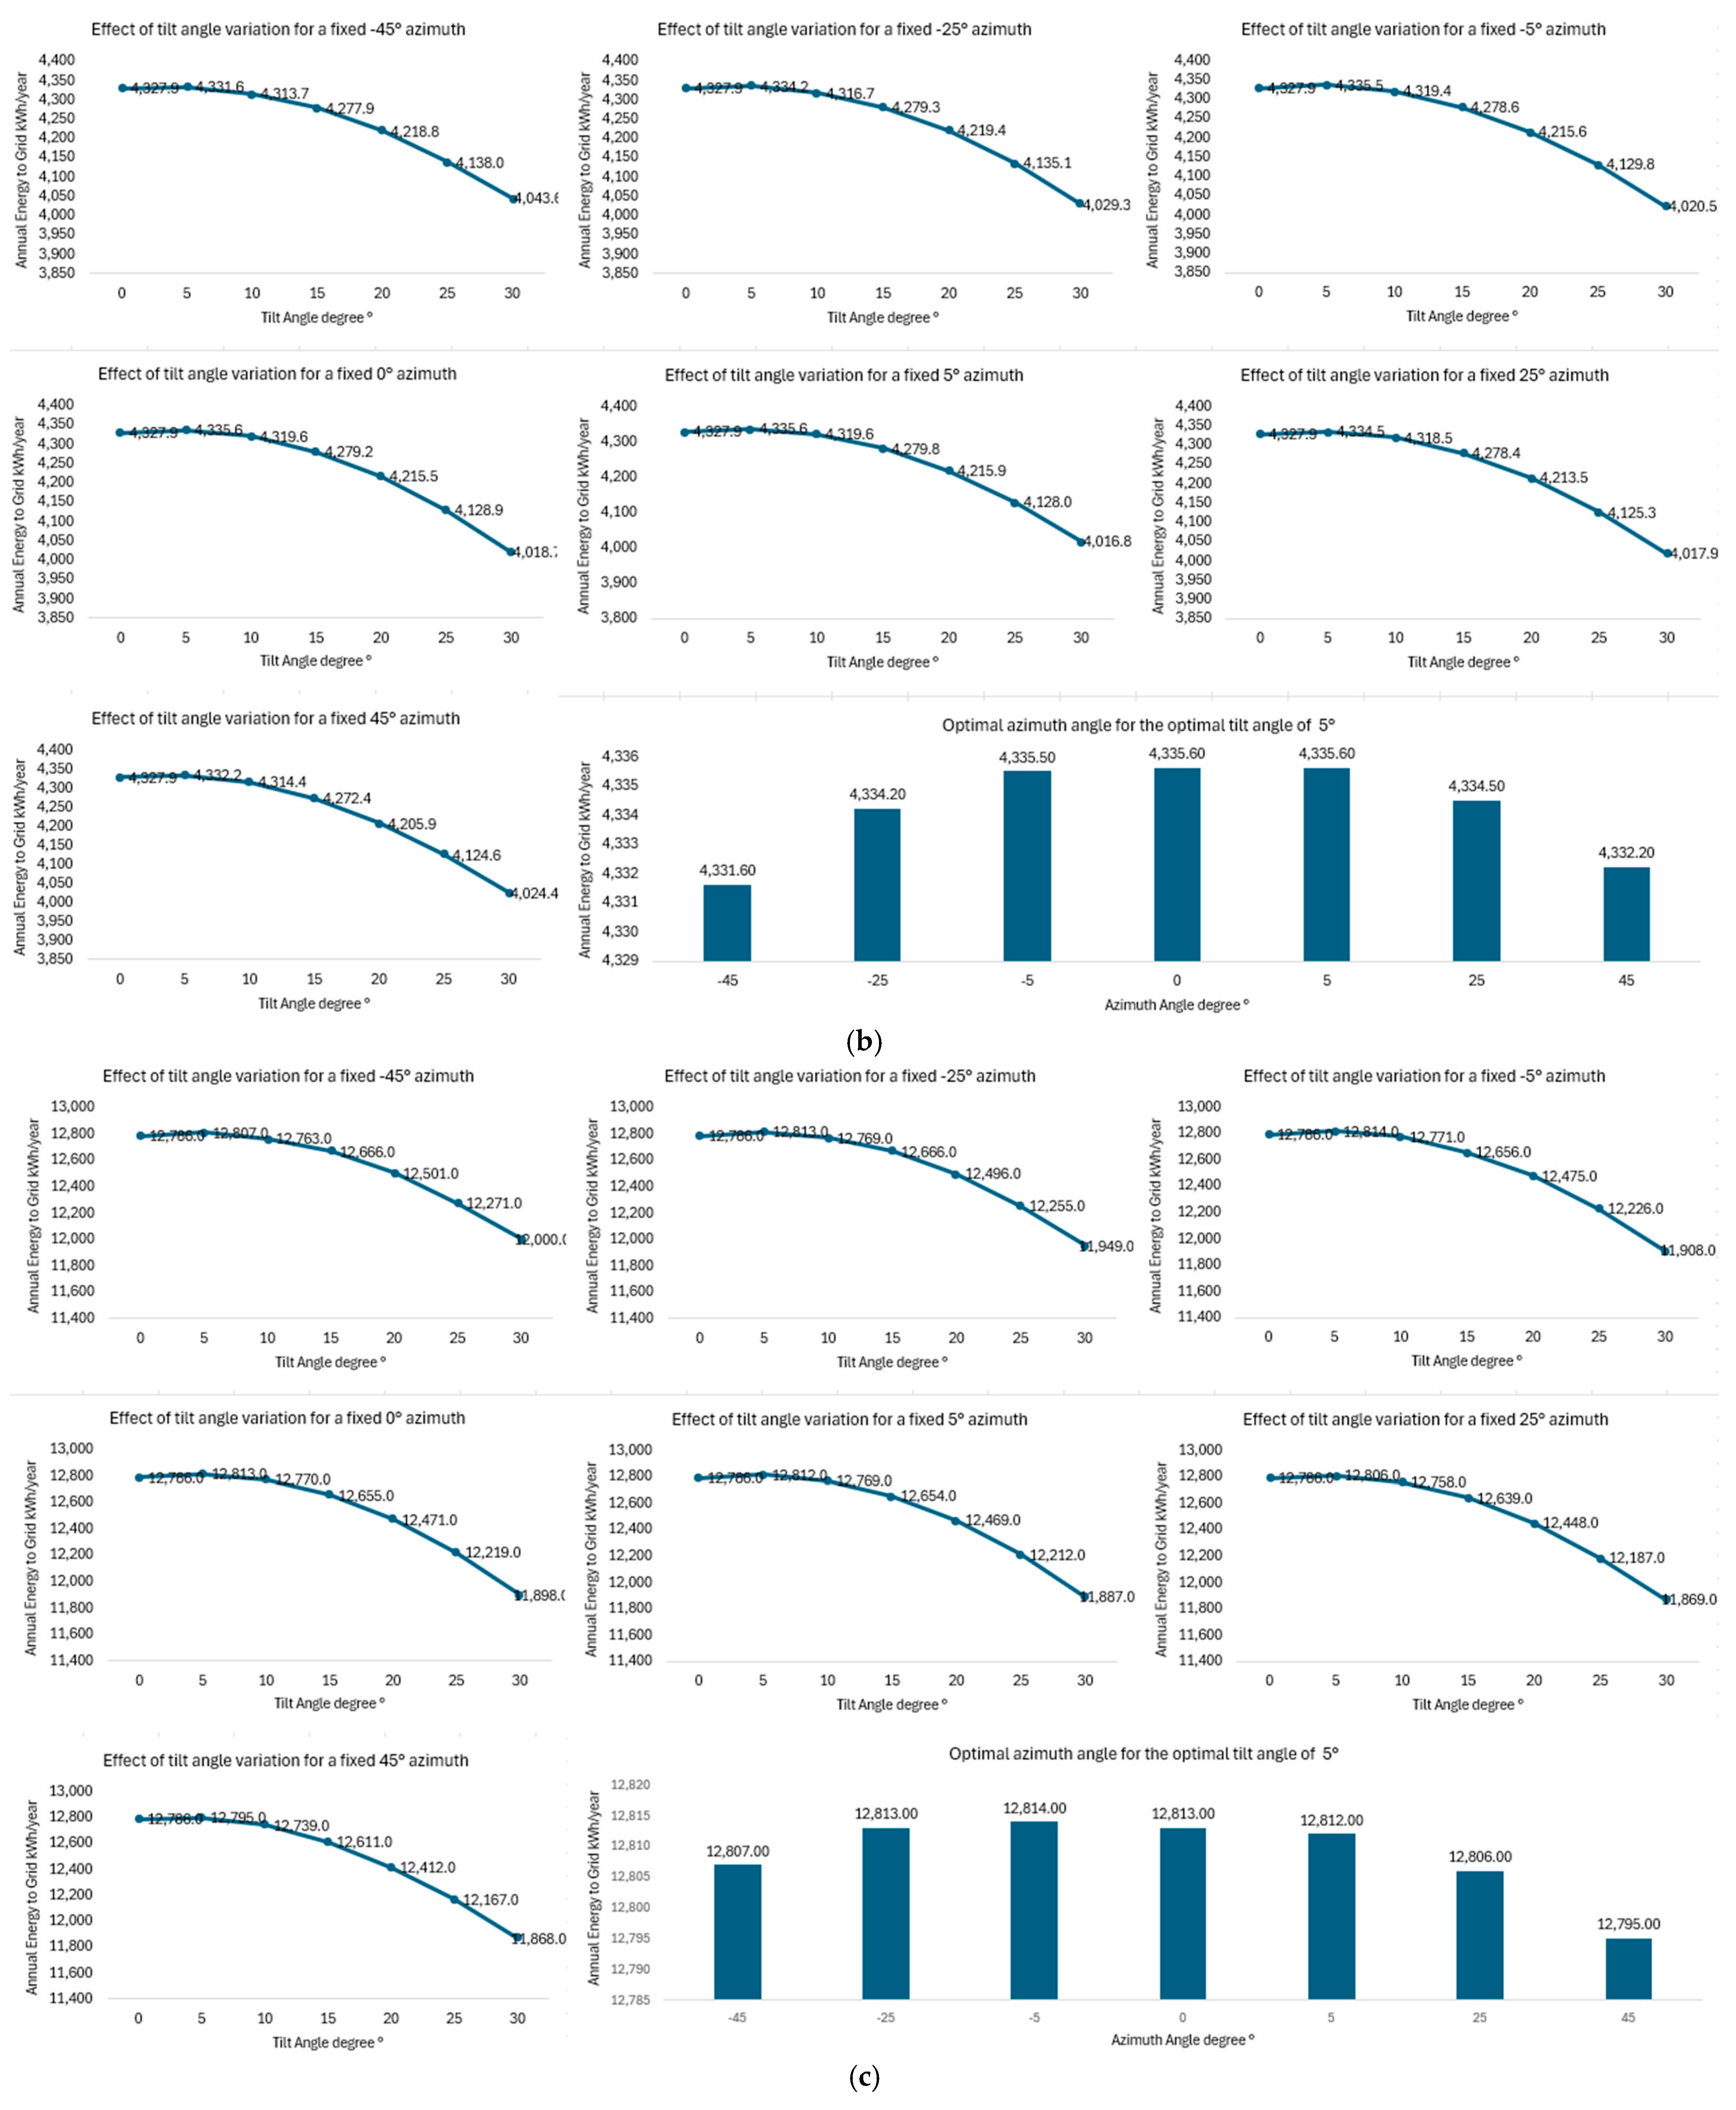
Figure 5 illustrates the tilt angle analysis for each site studied using the 2023 simulation model. However, it should be noted that for all sites, the tilt angle varied from 0° to 10° based on roof structure. To find the optimal tilt angle, this angle is from 0° to 30° with a fixed azimuth angle. As seen in the figure, the tilt angle of 5° is the optimal tilt angle for the fixed-tilt PV systems installation on the island. From the figure it can also be noted that changing the azimuth angle does not significantly change the energy yield and the optimal azimuth angle ranges from −5° to +5°. In each site location of the figure, the plot at the bottom right of each site depicts the various outputs with respect to the azimuth angle at the optimal tilt angle of 5°.
This result also varies the fact that the ideal tilt angle roughly corresponds to the latitude of the installation site and facing the south for northern hemisphere locations where the Maldives lies close to the equator (around 3–7° N latitude). The sun passes almost directly overhead throughout the year. As a result, solar irradiance is nearly uniform across all orientations (east, west, or south), since sunlight strikes panels from a high angle for most of the days.
As shown in Table 17, the “optimal” orientation (tilt 5°, azimuth −25° to +5°) increases simulated annual energy by less than 2%, which is smaller than typical inter-annual variability.

3.4. Module-Level Performance Assessment

This section examines the daily energy production per module in 2023 for each site to highlight the key observations that caused the actual performance to be below the prediction.

3.4.1. Aabin Lift

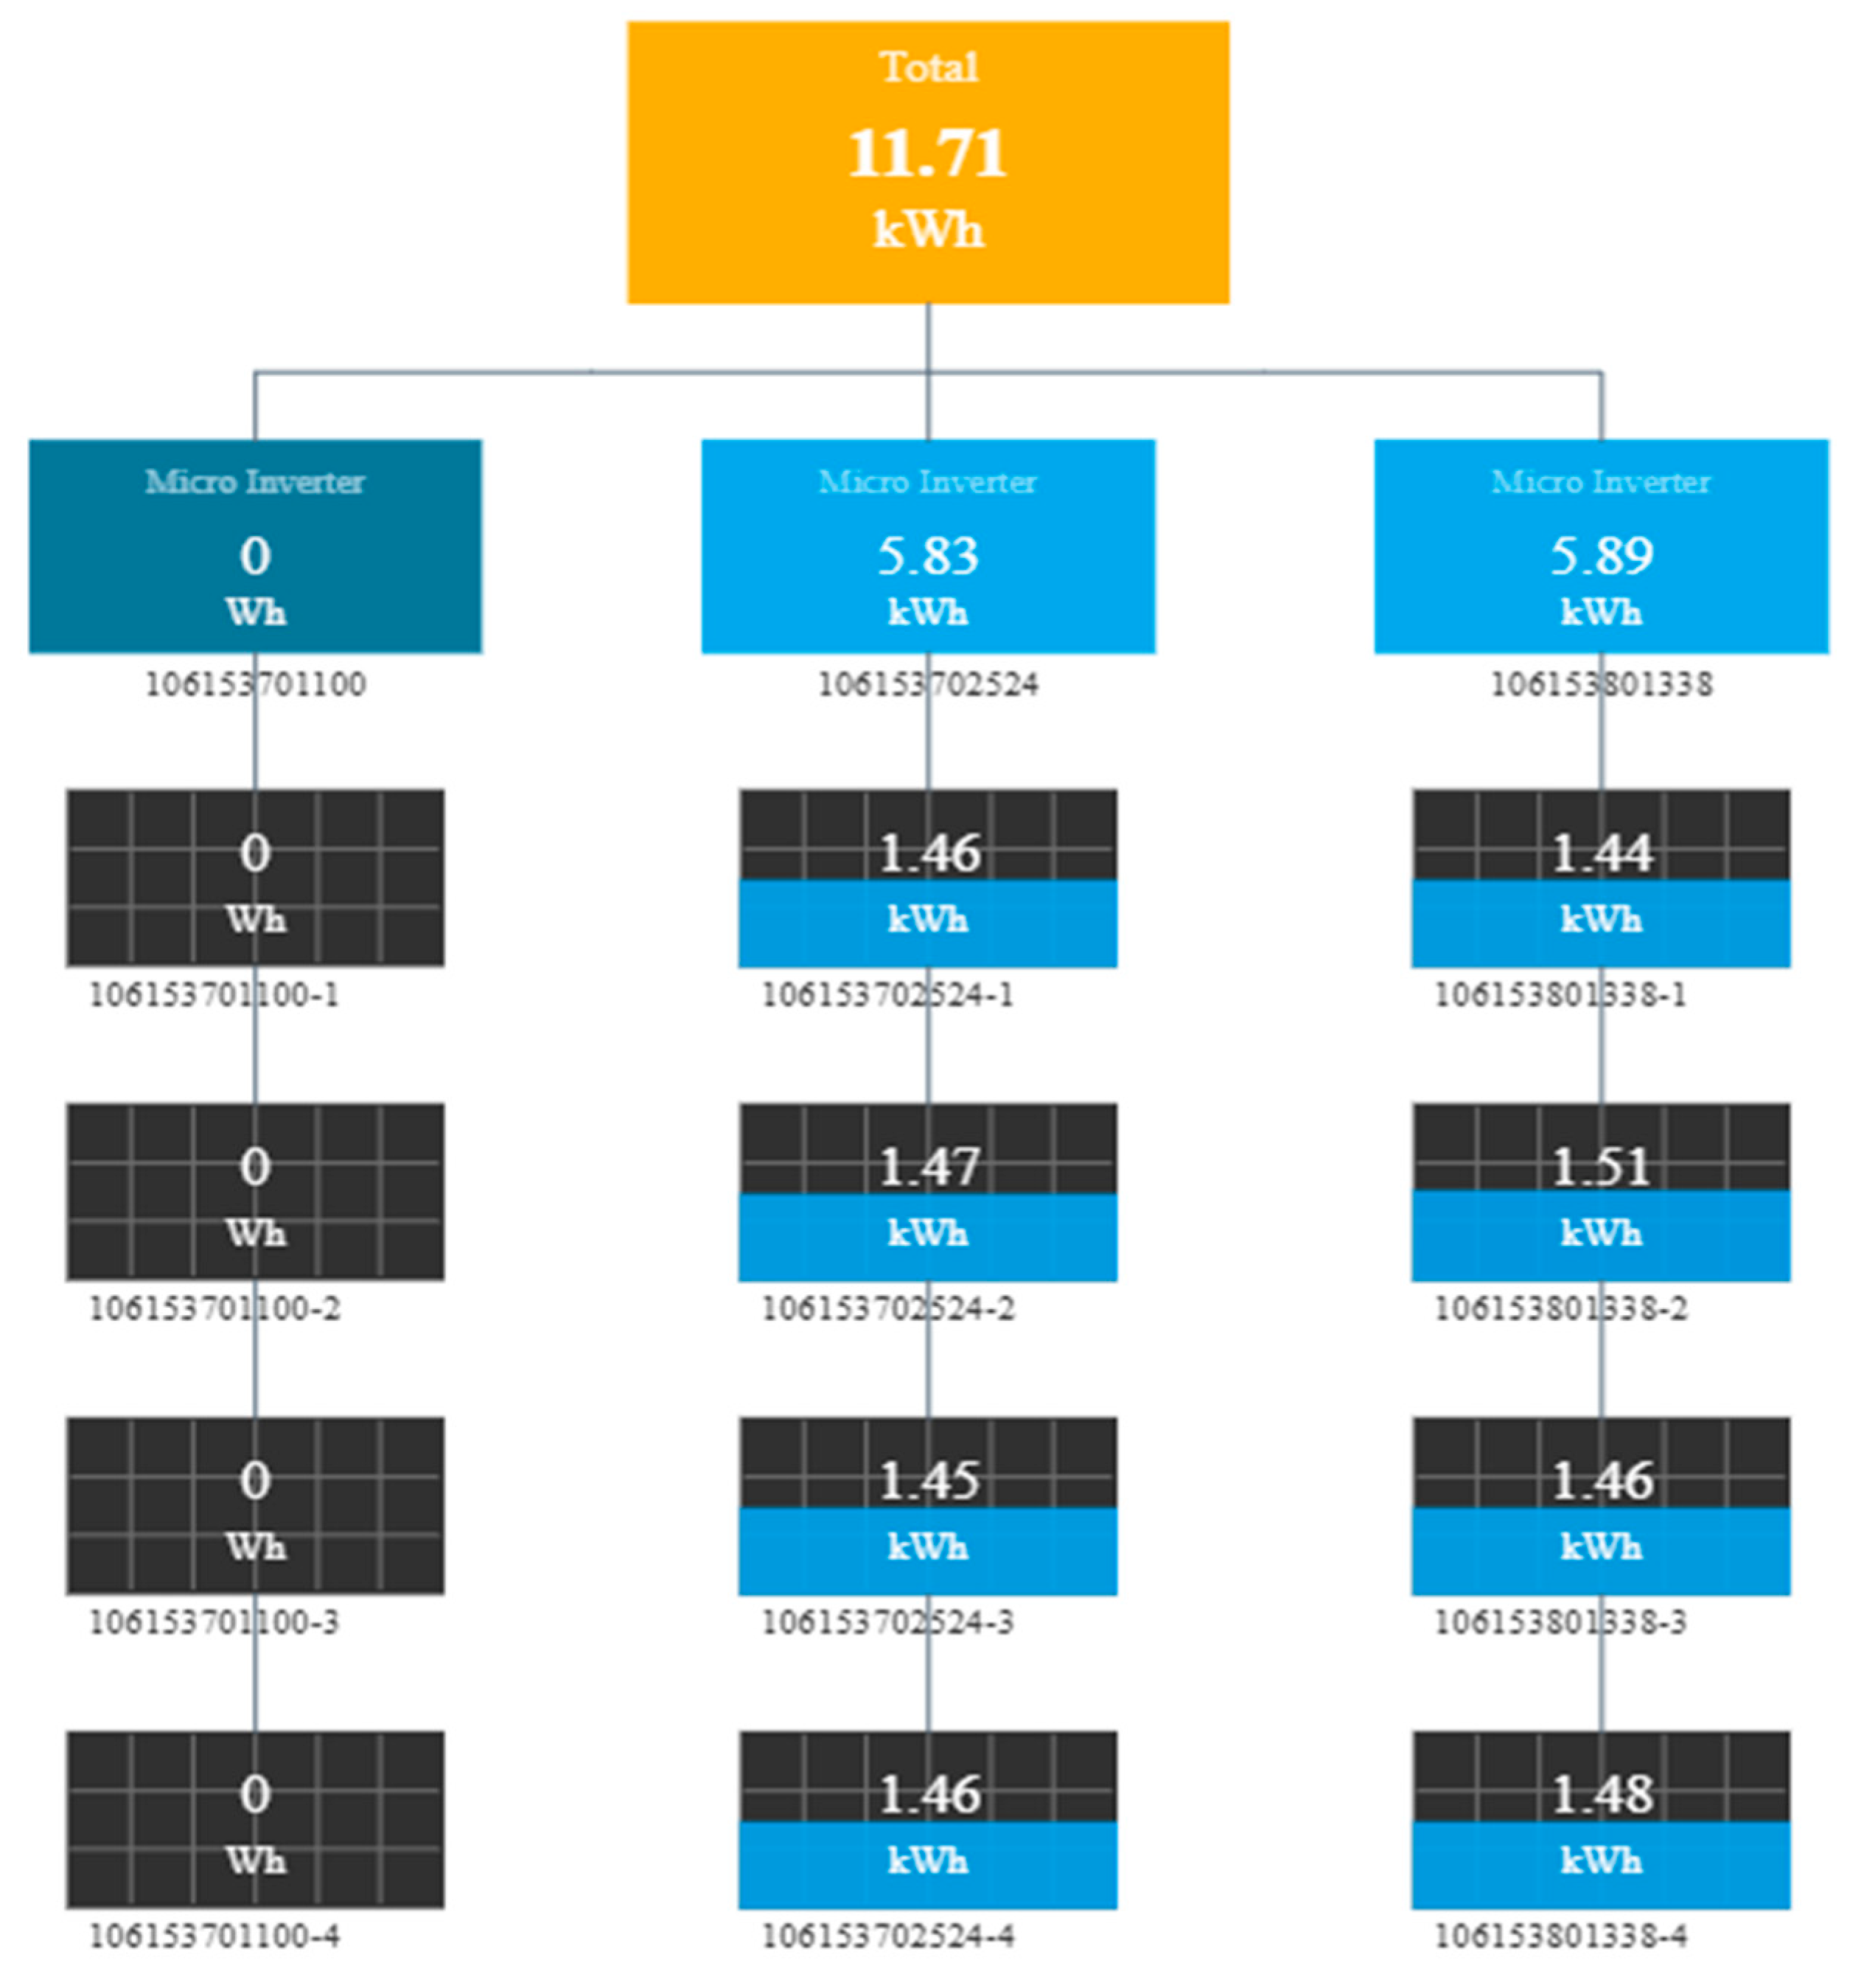
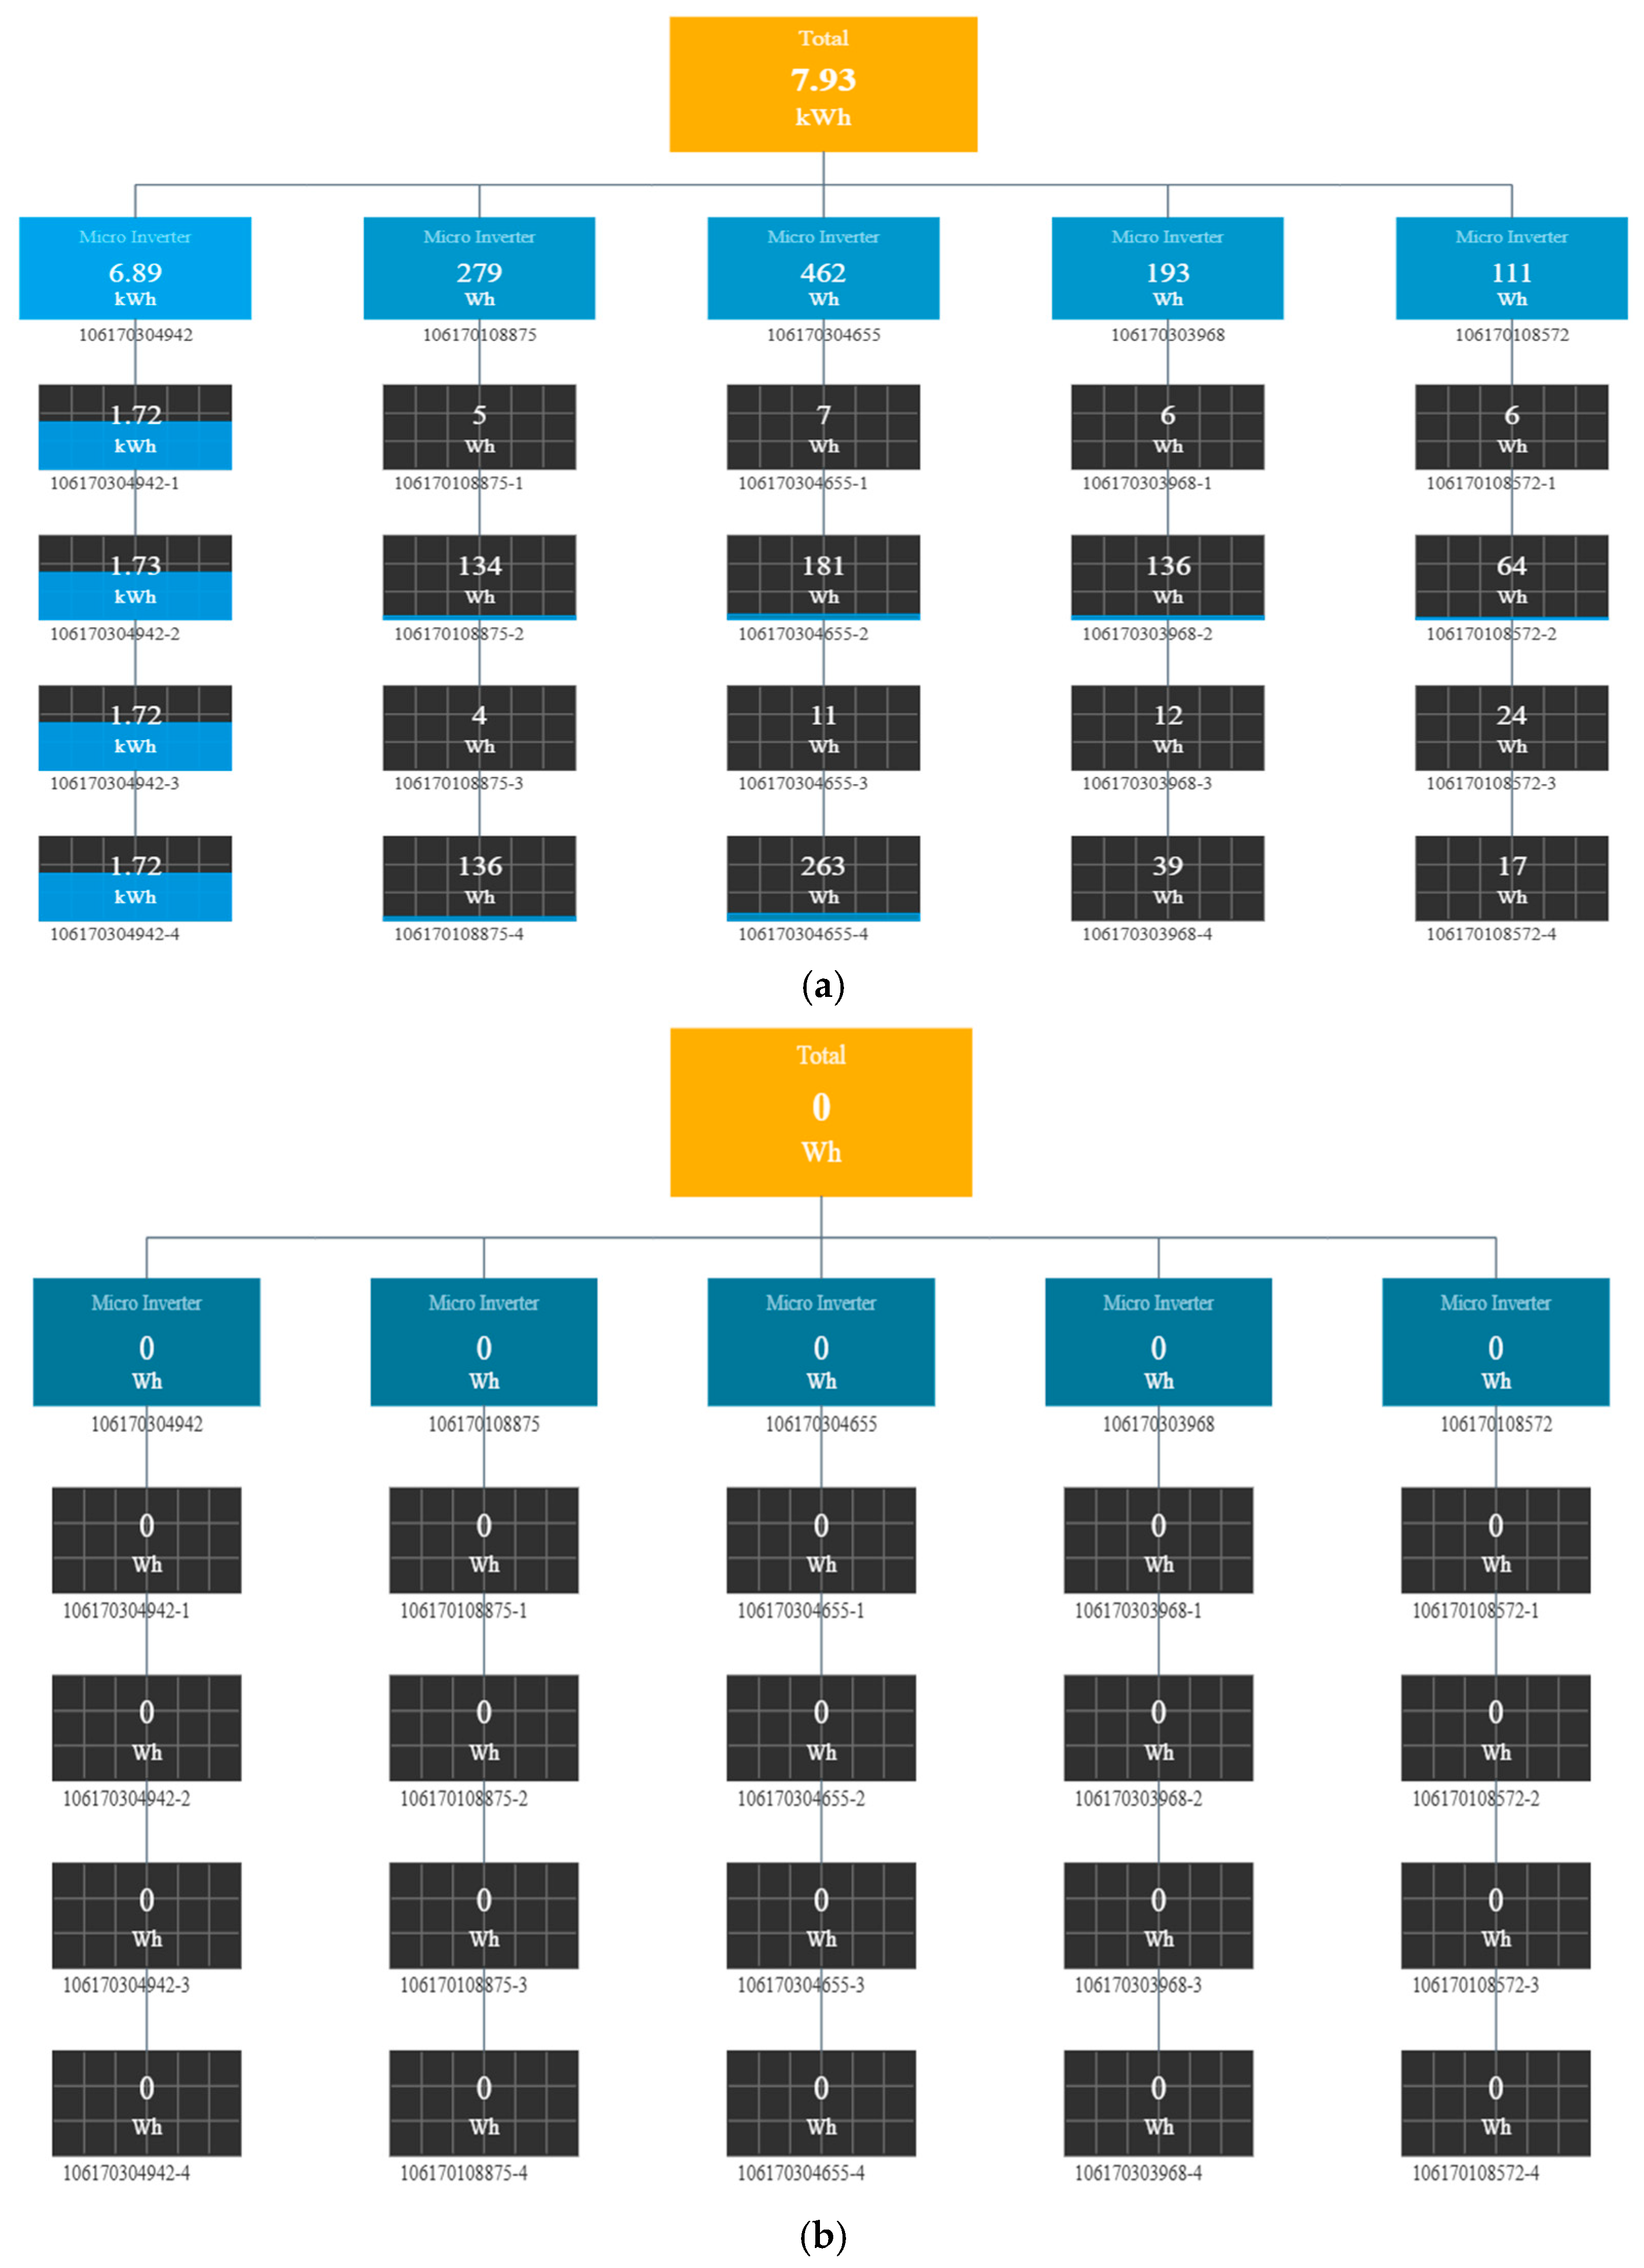
The Aabin Lift site is found to be the worst system performance with a significant difference between the predicted and actual performance parameters. The module level of daily energy production showed that for most of the days, the partial modules are not performing at all, and on other days partial modules are working. Figure 6 illustrates different samples from 2023 for the microinverter problem.

3.4.2. Velima 4th-Floor

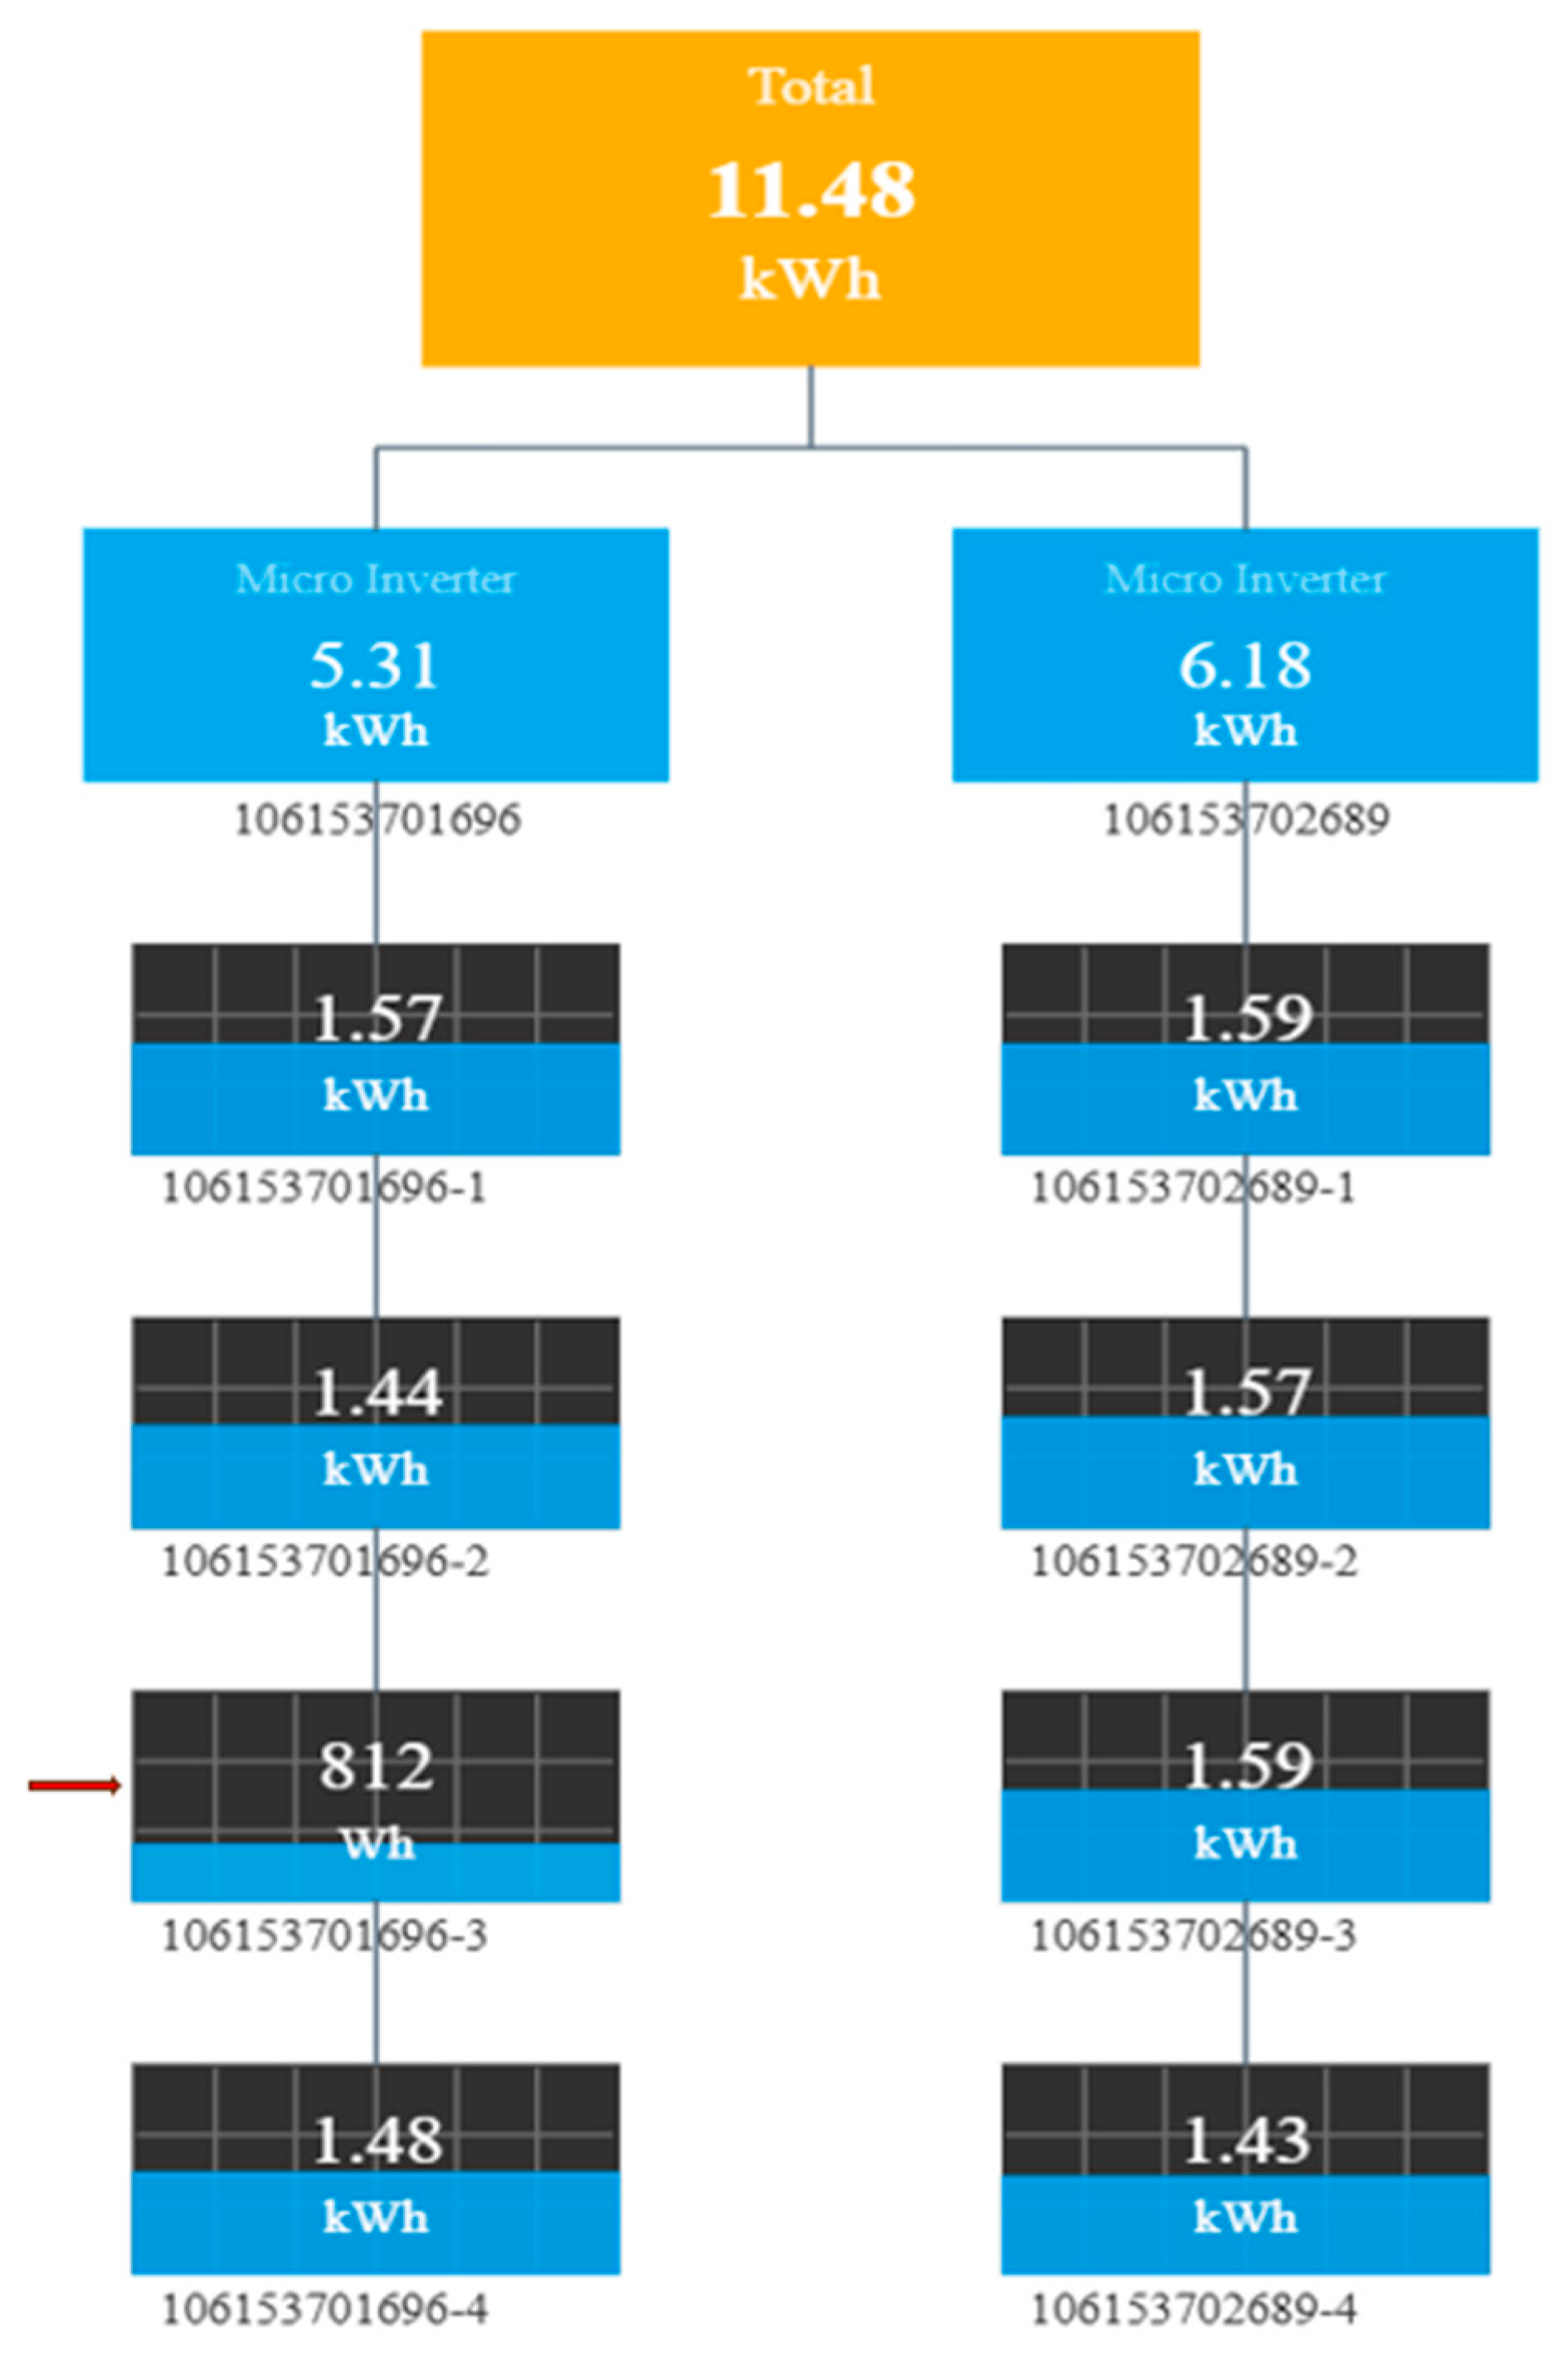
The energy production for the Velima 4th-floor site compared to Ocean Front Residence 11F-PH1 is somehow low due to the shading effect ignored in the PVsyst simulation model. For instance, as shown in Figure 7, for the PV module with No. 53701696-3 and due to significant shading, its production for January, February, November, and December is almost half the energy production for other modules.

3.4.3. Ocean Front Residence 11F-PH1

All modules for the Ocean Front Residence 11F-PH1, as shown in Figure 8, had constant energy production throughout the year as the systems have 0° tilt with no effect for near-shading. The Ocean Front Residence 11F-PH1 performance may be further enhanced by implementing the optimal determined orientation (i.e., 5° tilt and 5° orientation angles).

3.4.4. Samraahi

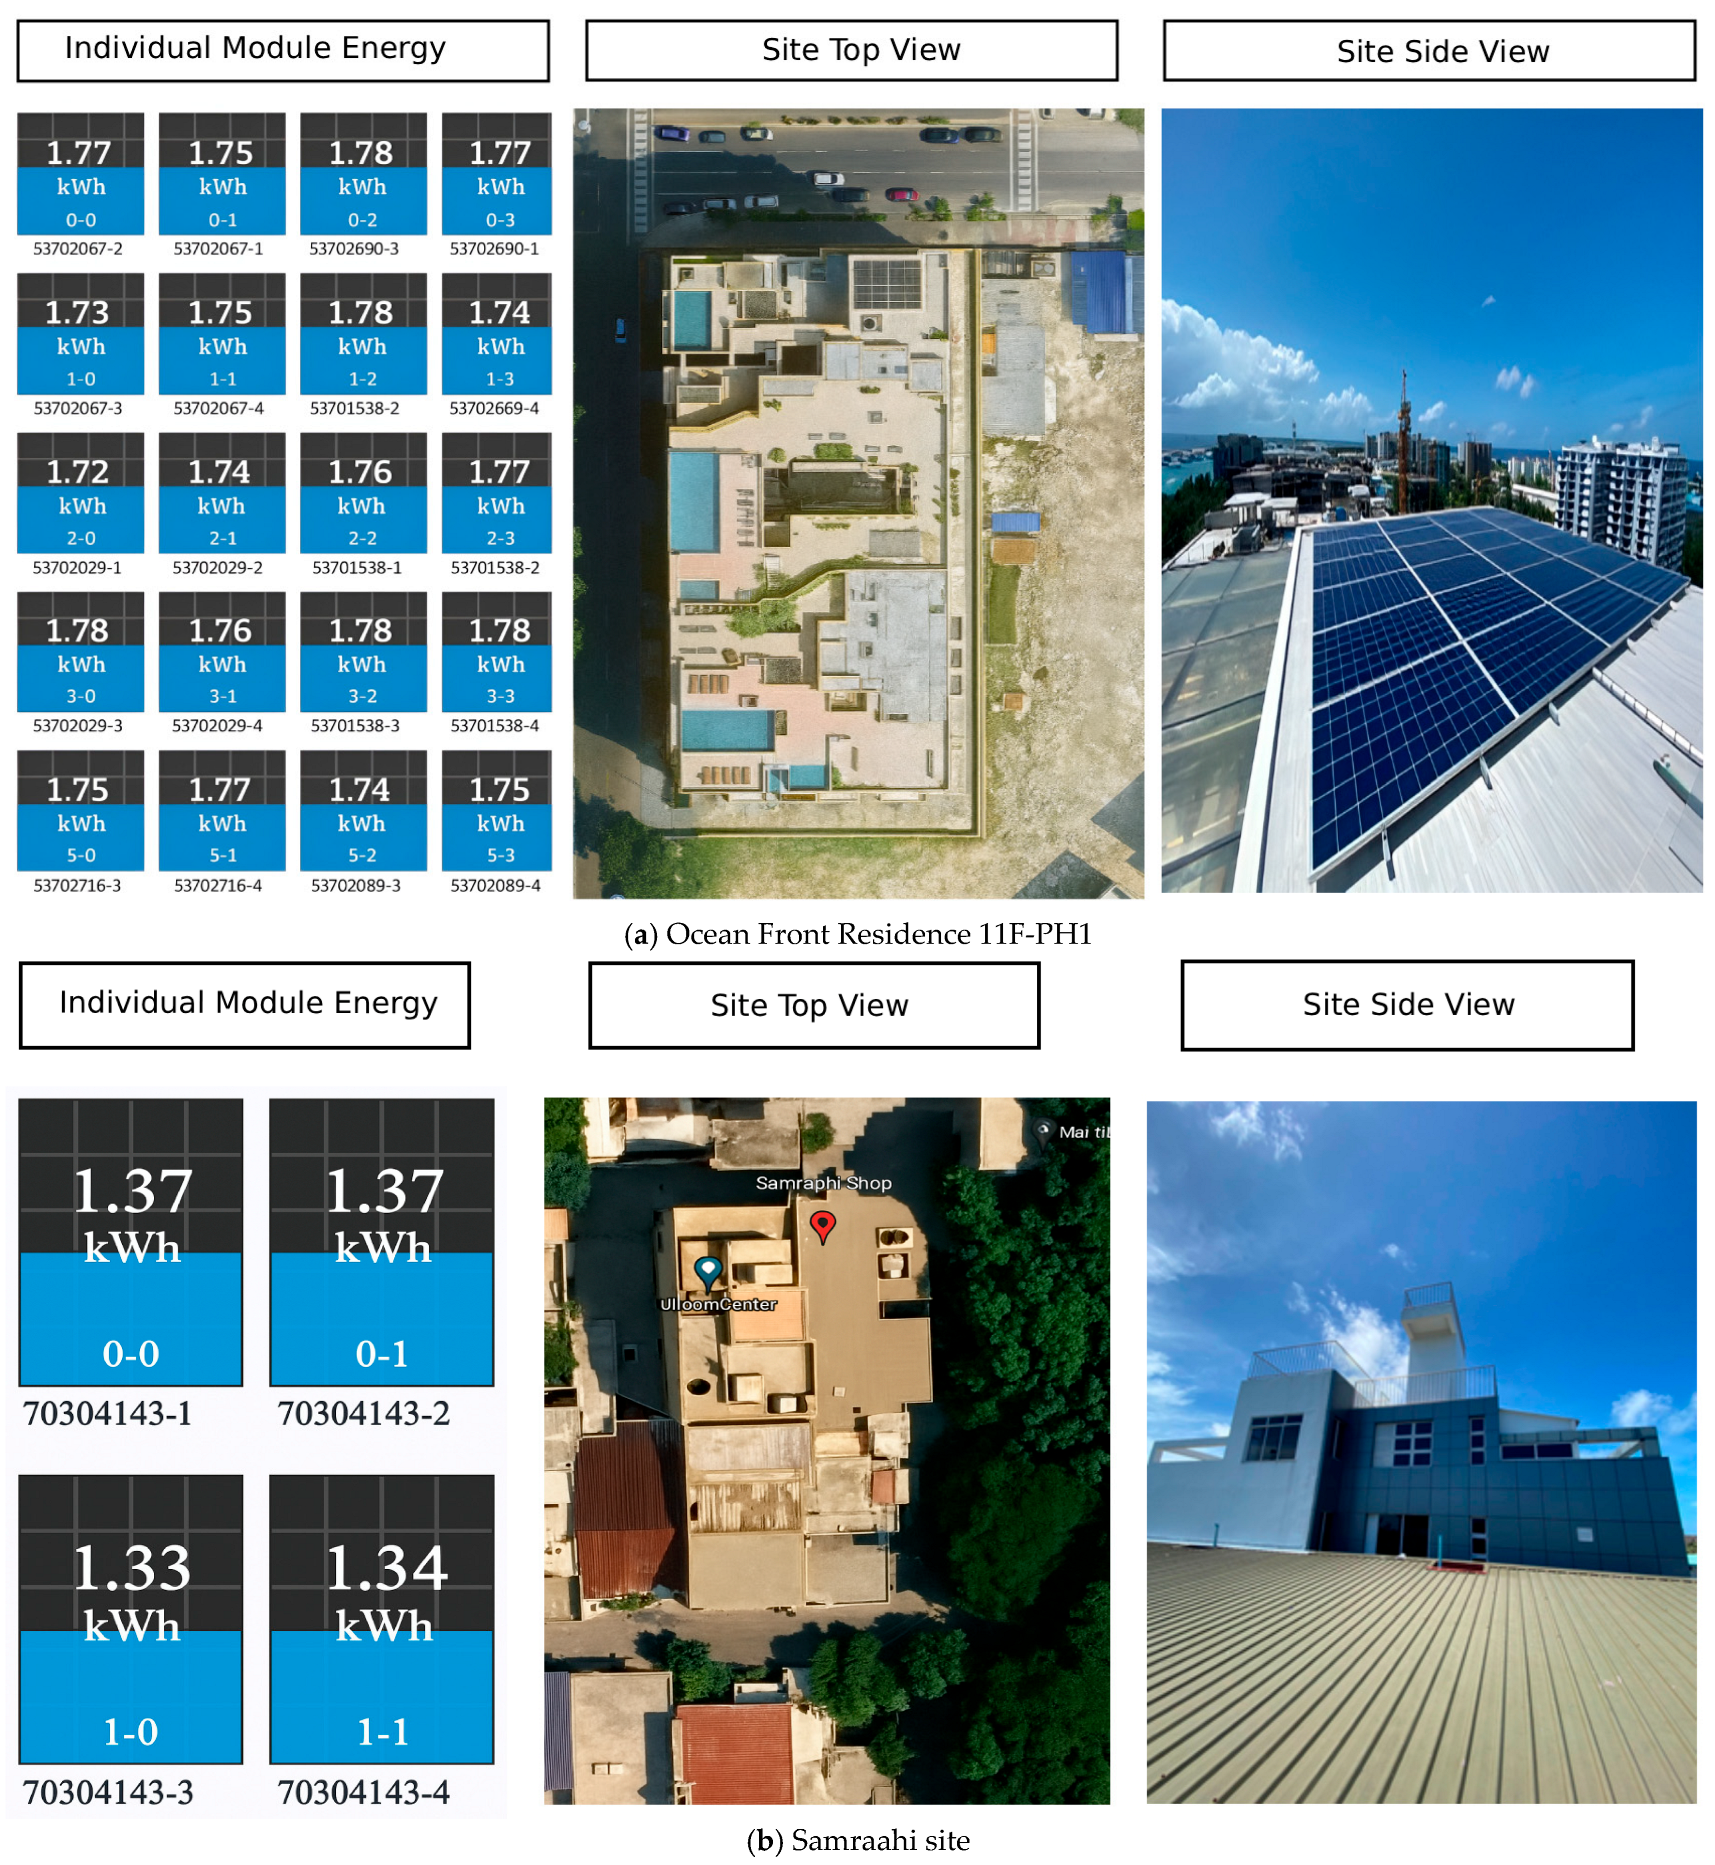
The predicted yield factor for the Samraahi site from January to April is significantly higher than the recorded yield factor, although the PV modules are working well all month, because of system installation orientation and due to the near-shedding effect, which caused the actual yield factor to be lower. So, the performance of the Samraahi site can be enhanced by implementing the optimal orientation angles. For instance, Figure 9 illustrates a comparison between energy production for Ocean Front Residence 11F-PH1 and Samraahi sites on 26 January 2023.
As shown in Figure 9, which presents a one-day sample comparison between the Samraahi and Ocean Front Residence 11F-PH1 sites, the results demonstrate the influence of site-specific factors on energy production. Although all PV modules at the Samraahi site performed well throughout the year, the actual yield factor from January to April was notably lower than the predicted values. This discrepancy is mainly attributed to the system’s installation orientation and near-shading, which reduced the effective irradiance on the modules. In contrast, the Ocean Front Residence 11F-PH1 site, despite using PV modules of slightly lower efficiency, achieved a higher actual yield factor because it was free from near-shading effects as seen in Figure 9a. This comparison highlights how shading conditions and installation geometry significantly affect the real performance of PV systems.

3.4.5. Fehigiri

The predicted yield factor for the Fehigiri site is significantly higher than the actual yield factor for the months from January to May and October to November. The module-level daily energy showed that four PV modules with serial numbers 53702719-1, 53702719-3, 53702518-2, and 53702518-4 experienced a near-shading effect that reduced their yield for January, February, October, November, and December, Figure 10 illustrates samples with reduced performance for the mentioned PV modules during those months. In addition, Figure 11 illustrates a sample where on some days (12 and 18 of May 3, 4, 7, 24 of November, and 22 of December) only the highlighted eight PV modules performed well, whilst all others were affected by shading.

3.4.6. Maavehi

The predicted yield factor for the Maavehi site showed that the system was expected to perform better than the actual in the months from January to May. The module-level daily energy production showed a variation in energy production for the Maavehi site’s PV modules throughout the year, for instance, the energy production for the four modules with the orientation of −170° is less than the other sixteen modules with the orientation of 10° for January, February, November, and December, whereas its energy is higher for the months from May to August. Also, some modules observed due to shading have less energy production than others; for example, the energy performance for PV modules with serial numbers 70304655-2, 70304655-4, and 70108572-1 is slightly less than other PV modules with the same orientation angles. In addition, the systems experienced both partial death for days from 15–22 January, and full death from 12–18 May. Figure 12 illustrates samples for the operation observations.

4. Conclusions

This study covers an operational performance evaluation for the rooftop grid-connected PV systems in K. Malé, the capital of the Maldives. This research has three objectives, namely, (1) to assess the operational performance of the rooftop grid-connected PV systems in K. Malé, the capital of the Maldives; (2) to simulate the ideal performance for the PV systems on the island, and to estimate the optimal orientation; and (3) to conduct a module-level performance evaluation to address the key factors affecting the performance of the systems. To complete the first objective, the well-known International Electro-Technical Commission (IEC) standard, IEC 61724, was used for operational performance assessment. The assessment was based on the real weather conditions recorded on the island in 2023 and real energy production data collected from six different residential rooftop grid-connected PV systems in K. Malé, the capital of the Maldives. To accomplish the second objective, the widely adopted simulation tool, PVsyst, was employed to predict the system’s performance and examine the optimal system orientation. The ideal predicted performance was found to be higher than the actual performance metrics. With an average yield factor of 4.45 kWh/kWp/day, total losses of 0.98 h/day, 82.1% PR, 18.6% CUF, and 15.3% efficiency, the island is expected to have acceptable operational performance parameters. The real analysis, however, revealed variation across the six sites. The analysis showed that in 2023, the actual daily average for the six sites is between 2.52 and 4.45 kWh/kWp/day for the yield factor, 0.98 and 2.9 h per day for the total loss, 45.19% and 82.13% for the PR, 10.51% and 18.55% for the CUF, and 7.69% and 15.94% for system efficiency.
The result from the simulation analysis allowed for a comparative study between the ideal predicted performance and the actual one. To achieve the third objective, the Hoymiles S-Miles monitoring cloud was used to assess the daily energy performance of the PV module for each site in 2023. The comparison analysis was conducted to pinpoint and emphasize the areas that require improvement by comparing the energy production between the PV modules within the same site and the performance of PV modules with other sites. According to the module-level evaluation, the primary reasons for this low performance are the microinverter connection problem and the near-shading effect. In addition, the orientation analysis also showed that the optimal tilt for the fixed tilt angle for the PV systems installation on the island is 5°, with orientation (azimuth angle) ranging from −25° to 5°.

Author Contributions

Conceptualization, K.A.A.M.; Methodology, K.A.A.M., H.S., A.B.E. and A.K.A.; Software, K.A.A.M., H.S., I.N. and A.B.E.; Validation, A.B.E.; Formal analysis, K.A.A.M. and A.K.A.; Investigation, K.A.A.M., I.N. and A.K.A.; Resources, H.S.; Data curation, K.A.A.M. and I.N.; Writing – original draft, K.A.A.M.; Writing – review & editing, I.N., A.B.E. and A.K.A.; Supervision, H.S.; Project administration, H.S. and I.N.; Funding acquisition, H.S. All authors have read and agreed to the published version of the manuscript.

Funding

This research received no external funding.

Data Availability Statement

The raw data supporting the conclusions of this article will be made available by the authors on request.

Acknowledgments

This work was supported by the Renewable Energy Department, State Electric Company Limited, K. Malé 20349, Maldives, by providing necessary data, and the National Water and Energy Center, United Arab Emirates University.

Conflicts of Interest

Author Ibrahim Nizam was employed by the company State Electric Company Limited. The remaining authors declare that the research was conducted in the absence of any commercial or financial relationships that could be construed as a potential conflict of interest.

Declaration of Generative AI and AI-Assisted Technologies in the Writing Process

During the preparation of this work the authors used ChatGPT 4o in order to edit the English language professionally. After using this tool, the authors reviewed and edited the content as needed and take full responsibility for the content of the publication.

References

  1. Maharaja, K.; Balaji, P.P.; Sangeetha, S.; Elakkiya, M. Development of bidirectional net meter in grid connected solar PV system for domestic consumers. In Proceedings of the 2016 International Conference on Energy Efficient Technologies for Sustainability (ICEETS), Nagercoil, India, 7–8 April 2016; pp. 46–49. [Google Scholar] [CrossRef]
  2. Kouro, S.; Leon, J.I.; Vinnikov, D.; Franquelo, L.G. Grid-connected photovoltaic systems: An overview of recent research and emerging PV converter technology. IEEE Ind. Electron. Mag. 2015, 9, 47–61. [Google Scholar] [CrossRef]
  3. Hasan, K.; Yousuf, S.B.; Tushar, M.S.H.K.; Das, B.K.; Das, P.; Islam, M.S. Effects of different environmental and operational factors on the PV performance: A comprehensive review. Energy Sci. Eng. 2022, 10, 656–675. [Google Scholar] [CrossRef]
  4. Hameed, H. The adoption of PV systems in the Maldives: A technological review. Maldives Natl. J. Res. 2015, 3, 52–73. [Google Scholar] [CrossRef]
  5. van Sark, W.G.J.H.M.; Lysen, E.H.; Cocard, D.; Beutin, P.; Merlo, G.F.; Mohanty, B.; van den Akker, J.; Razzak Idris, A.; Firag, A.; Waheed, A.; et al. The first PV–diesel hybrid system in the Maldives installed at Mandhoo Island. In Proceedings of the 21st European Photovoltaic Solar Energy Conference, Dresden, Germany, 4–8 September 2006; Available online: https://www.researchgate.net/publication/46691530 (accessed on 12 September 2025).
  6. van Alphen, K.; van Sark Wilfried, G.J.H.M.; Hekkert, M.P. Renewable energy technologies in the Maldives—Determining the potential. Renew. Sustain. Energy Rev. 2007, 11, 1650–1674. [Google Scholar] [CrossRef]
  7. Wijayatunga, P.; George, L.; Lopez, A.; Aguado, J.A. Integrating clean energy in small island power systems: Maldives experience. Energy Procedia 2016, 103, 274–279. [Google Scholar] [CrossRef]
  8. Ali, I.; Shafiullah, G.M.; Urmee, T. A preliminary feasibility of roof-mounted solar PV systems in the Maldives. Renew. Sustain. Energy Rev. 2018, 83, 18–32. [Google Scholar] [CrossRef]
  9. Wang, Y.; Song, J.; Yin, C.; Yan, J.; Zhang, Z. Techno-economic assessment of implementing photovoltaic water villas in Maldives. iScience 2023, 26, 106658. [Google Scholar] [CrossRef] [PubMed]
  10. Jung, T.Y.; Kim, D.; Moon, J.; Lim, S.K. A scenario analysis of solar photovoltaic grid parity in the Maldives: The case of Malahini resort. Sustainability 2018, 10, 4045. [Google Scholar] [CrossRef]
  11. Zaghba, L.; Khennane, M.; Mekhilef, S.; Fezzani, A.; Borni, A. Long-term outdoor performance of grid-connected photovoltaic power plant in a desert climate. Energy Sustain. Dev. 2023, 74, 430–453. [Google Scholar] [CrossRef]
  12. Haffaf, A.; Lakdja, F.; Abdeslam, D.O.; Meziane, R. Monitoring, measured and simulated performance analysis of a 2.4 kWp grid-connected PV system installed on the Mulhouse campus, France. Energy Sustain. Dev. 2021, 62, 44–55. [Google Scholar] [CrossRef]
  13. Alazazmeh, A.; Ahmed, A.; Siddiqui, M.; Asif, M. Real-time data-based performance analysis of a large-scale building applied PV system. Energy Rep. 2022, 8, 15408–15420. [Google Scholar] [CrossRef]
  14. Minai, A.F.; Usmani, T.; Alotaibi, M.A.; Malik, H.; Nassar, M.E. Performance analysis and comparative study of a 467.2 kWp grid-interactive SPV system: A case study. Energies 2022, 15, 1107. [Google Scholar] [CrossRef]
  15. Singh, T.S.D.; Shimray, B.A.; Singh, A.B.; Meitei, S.N. Performance measurement of 5 kWp rooftop grid-connected SPV system in moderate climatic region of Imphal, Manipur, India. Energy Sustain. Dev. 2023, 73, 292–302. [Google Scholar] [CrossRef]
  16. Dobaria, B.; Pandya, M.; Aware, M. Analytical assessment of 5.05 kWp grid tied photovoltaic plant performance on the system level in a composite climate of western India. Energy 2016, 111, 47–51. [Google Scholar] [CrossRef]
  17. Yadav, S.K.; Bajpai, U. Performance evaluation of a rooftop solar photovoltaic power plant in Northern India. Energy Sustain. Dev. 2018, 43, 130–138. [Google Scholar] [CrossRef]
  18. Emmanuel, M.; Akinyele, D.; Rayudu, R. Techno-economic analysis of a 10 kWp utility interactive photovoltaic system at Maungaraki school, Wellington, New Zealand. Energy 2017, 120, 573–583. [Google Scholar] [CrossRef]
  19. Arora, R.; Arora, R.; Sridhara, S.N. Performance assessment of 186 kWp grid interactive solar photovoltaic plant in Northern India. Int. J. Ambient. Energy 2022, 43, 128–141. [Google Scholar] [CrossRef]
  20. Pramanick, D.; Kumar, J. Performance and degradation assessment of two different solar PV cell technologies in the remote region of eastern India. e-Prime-Adv. Electr. Eng. Electron. Energy 2024, 7, 100432. [Google Scholar] [CrossRef]
  21. Aarich, N.; Bennouna, A.; Erraissi, N.; Raoufi, M.; Asselman, A.; Barhdadi, A.; Boukhattem, L.; Cherkaoui, A.; Darmane, Y.; Doudou, A.; et al. Assessment the long-term performance ratio maps of three grid-connected photovoltaic systems in the Moroccan climate. Energy Sustain. Dev. 2024, 79, 101388. [Google Scholar] [CrossRef]
  22. IEC Standard 61724; Photovoltaic System Performance Monitoring-Guidelines for Measurement, Data Exchange and Analysis. International Electrotechnical Commission (IEC): Geneva, Switzerland, 1998. Available online: https://law.resource.org/pub/in/bis/S05/is.iec.61724.1998.pdf (accessed on 12 September 2025).
  23. Yakubu, R.O.; Quansah, D.A.; Mensah, L.D.; Ahiataku-Togobo, W.; Acheampong, P.; Adaramola, M.S. Comparison of ground-based and floating solar photovoltaic systems performance based on monofacial and bifacial modules in Ghana. Energy Nexus 2023, 12, 100245. [Google Scholar] [CrossRef]
  24. Anang, N.; Azman, S.N.A.S.N.; Muda, W.M.W.; Dagang, A.N.; Daud, M.Z. Performance analysis of a grid-connected rooftop solar PV system in Kuala Terengganu, Malaysia. Energy Build. 2021, 248, 111182. [Google Scholar] [CrossRef]
  25. Sharma, R.; Goel, S. Performance analysis of an 11.2 kWp rooftop grid-connected PV system in Eastern India. Energy Rep. 2017, 3, 76–84. [Google Scholar] [CrossRef]
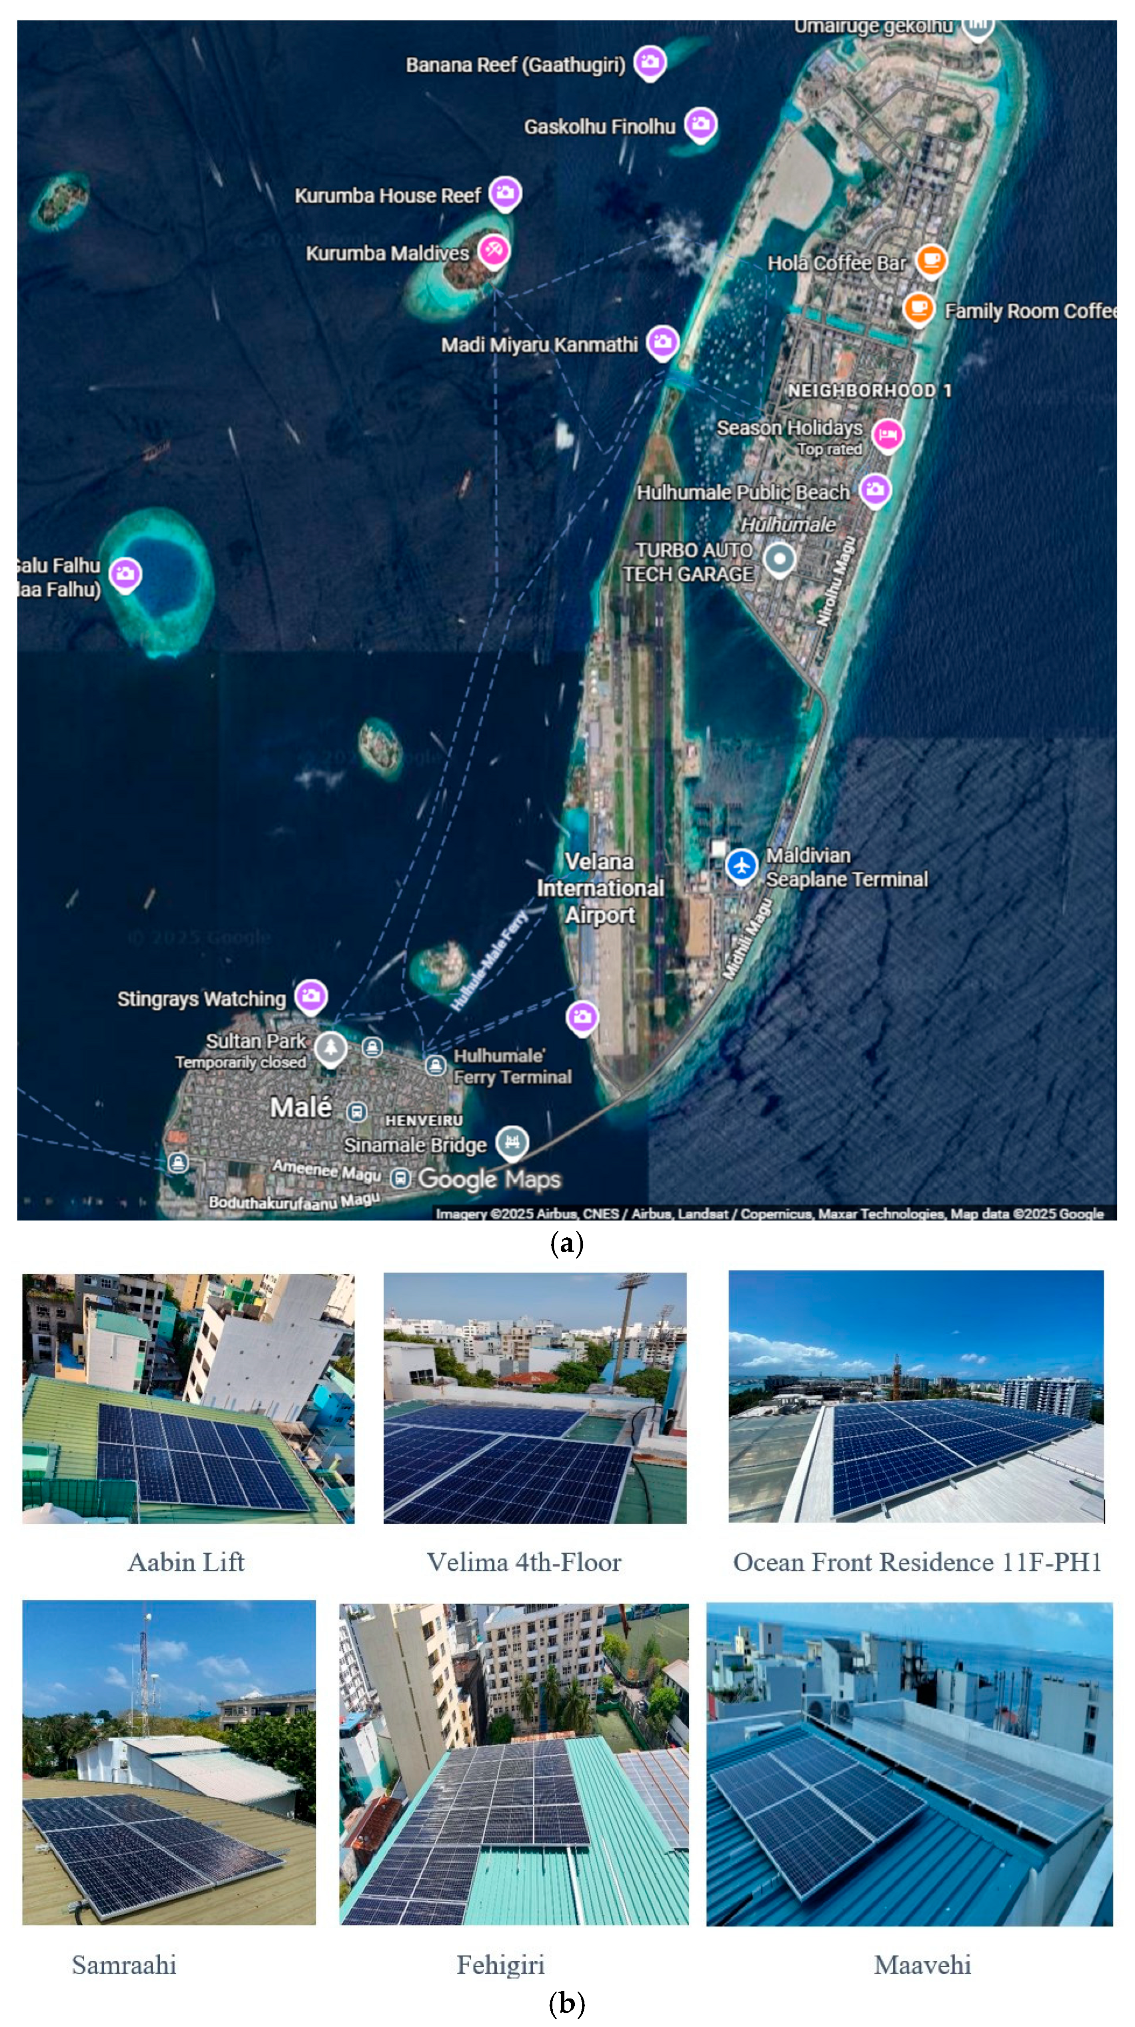
Figure 1. (a) Geographical locations; (b) Site photos.
Energies 18 06272 g001
Figure 2. The typical configuration for PV systems in the Maldives.
Energies 18 06272 g002
Figure 3. Research methodology flow chart.
Energies 18 06272 g003
Figure 4. Monthly avg. recorded weather condition variations in 2023.
Energies 18 06272 g004
Figure 5. Optimal tilt angle analysis. (a) Aabin Lift. (b) Velima 4th-Floor. (c) Ocean Front Residence 11F-PH1. (d) Samraahi. (e) Fehigiri. (f) Maavehi.
Energies 18 06272 g005aEnergies 18 06272 g005bEnergies 18 06272 g005cEnergies 18 06272 g005d
Figure 6. Aabin Lift microinverter problem sample energy production on 7 January 2023.
Energies 18 06272 g006
Figure 7. Velima 4th-floor sample for shading affects the PV module with No. 53701696-3.
Energies 18 06272 g007
Figure 8. Ocean Front Residence 11F-PH1 modules energy sample on 22 April 2023.
Energies 18 06272 g008
Figure 9. Comparison of energy production on 26 January 2024 between (a) Ocean Front Residence 11F-PH1 and (b) Samraahi.
Energies 18 06272 g009
Figure 10. Illustrates samples with reduced performance for 53702719-1, 53702719-3, 53702518-2, and 53702518-4 on 26 November 2023.
Energies 18 06272 g010
Figure 11. Samples where only eight PV modules performed well, whilst all others were affected by shading samples on 18 May 2023.
Energies 18 06272 g011
Figure 12. Samples for the operation observations: (a) partial dead sample on 16 January and (b) fully dead sample on 15 May.
Energies 18 06272 g012
Table 1. A summary of various renewable energy assessment studies conducted in various regions.
Ref./YearLocationMain ObjectiveSystem ConfigurationTools/ModelsKey OutcomesSimulation-BasedPerformance-BasedOverall System LevelModule Level
[5]/2005Mandhoo Island, MaldivesDesign and implement a pilot hybrid PV–diesel systemPV + Diesel + BatteryHOMEROptimal 12 kWp PV with 108 kWh battery and diesel units (31 kW, 21.6 kW) met ~207 kWh/day; pilot failed due to component faults.
[6]/2007K. Malé, Fehendhoo, Uligam, Hanimadhoo Islands, MaldivesEvaluate renewable resource potential and hybrid feasibilityPV, PV + Wind, Diesel + PV, Diesel + WindHOMERFully renewable systems not viable; hybrid PV–diesel reduces cost by 5–10 ¢/kWh.
[7]/2016Addu City, Villingili, Khurendhoo, Goidhoo, Buruni Islands, MaldivesDevelop hybrid diesel–PV–battery models for small islandsPV + Diesel/PV + Diesel + BatteryHOMER, PSCADHybrid PV–diesel–battery improves reliability and energy security for island grids.
[8]/2018Hulhumalé Island, MaldivesAssess rooftop PV potential and hybrid configurationsRooftop PV + Diesel/PV + Diesel + BatteryHOMER, RETScreenRooftop PV can supply 34–57% of demand; PV–diesel–battery system most cost-effective.
[9]/2023Three resort islands, MaldivesAssess PV integration on resort water villasRooftop PVExcel-based assessmentPotential PV capacity 86.3 MW, generation 124.6 GWh/year; payback ≈ 7 years.
[10]/2018Kuda Bandos Island, MaldivesCompare off-grid system alternatives for grid parityDiesel, Diesel + PV, Diesel + PV + BatteryHOMERPV–diesel viable; grid parity within 20 years; ESS costly.
[11]/2021Ghardaïa, AlgeriaLong-term outdoor performance of thin-film PV2.25 kWp Grid PV (a-Si/μc-Si)PVsyst, PVGIS, PVWattsPR 75–80%; degradation 0.22%/year; stable under high temp; yield 3.1–3.7 MWh/year.
[12]/2021Mulhouse, FranceCompare measured and simulated small-grid PV output2.4 kWp Rooftop (Mono-Si)PVGIS, PVWatts, HOMERYF 3.75 kWh/kWp; CUF 15.6%; PVWatts/HOMER matched field data; CO2 avoided 4.17 t.
[13]/2023Dhahran, Saudi ArabiaReal-time evaluation of large BIPVBuilding-integrated Grid PVSCADA/MonitoringReal-time PR and CUF tracking for large-scale BIPV.
[14]/2022Lucknow, IndiaAnalyze multi-building rooftop PV performance467.2 kWp Rooftop (Poly-Si)PVsyst, SCADAPR ≈ 78%; CUF ≈ 17%; consistent output; major CO2 reduction.
[15]/2023Imphal, IndiaCompare measured and simulated rooftop PV5 kWp Rooftop (Poly-Si)PVsyst + MonitoringPR 74.4%; CUF 14.3%; confirms PV suitability in moderate climates.
[16]/2016Rajkot, IndiaEvaluate performance and losses in small-grid PV5.05 kWp Grid-tied (Poly-Si)PVWatts + MonitoringPR 68–83%; yield 1636 kWh/kWp/year; total losses 26%.
[17]/2018Lucknow, IndiaAssess annual performance of rooftop PV5 kW Rooftop PVMonitored dataYf 3.99 kWh/kWp/day; PR 77%; CUF 16%; CO2 avoided 7.03 t/year.
[18]/2016Wellington, New ZealandEvaluate technical and financial PV performance10 kWp Grid-connected PVSAM, MonitoringPR 76–79%; CF 12.5%; ηsys 12%; good seasonal stability.
[19]/2024Bihar, IndiaAssess hybrid RE configurationsPV + Wind + Biomass + Diesel + BatteryHOMEROptimal: 86.7 kW PV, 30 kW wind, 50 kW diesel; demand 615.6 kWh/day met reliably.
[20]/2024Eastern IndiaCompare Mono-Si and Poly-Si PV under tropical climateMono-Si vs. Poly-Si PV ArraysHOMER + MonitoringMono-Si: PR 77.5%, CF 16.8%; Poly-Si: PR 72.4%, CF 15.4%; degradation ~0.7%/year.
[21]/2024MoroccoCompare DC PR of different PV technologiesGrid-connected PV (Mono, Poly, a-Si)Performance monitoringAvg. DC PR: Poly 90.6%, Mono 90.1%, a-Si 87.3%; minor variation.
Table 2. The key sites’ data.
Plant NameLocation CoordinatesOnline DateSystem Capacity (kW)
Aabin Lift4°10′21.0″ N
73°30′48.1″ E
21 January3.96
Velima 4th-Floor4°10′29.5″ N
73°30′43.7″ E
21 March2.64
Ocean Front Residence 11F-PH14°13′10.2″ N
73°32′20.4″ E
21 September7.92
Samraahi4°10′20.5″ N
73°29′06.2″ E
22 January1.36
Fehigiri4°10′20.9″ N
73°30′14.9″ E
22 February12.24
Maavehi4°10′18.2″ N
73°30′49.6″ E
22 July6.8
Table 3. The key PV systems’ data.
Plant NameModule
Technology
#PV Modules#MicroinvertersTilt AngleAzimuth
Aabin LiftPolycrystalline 12 × 330   W p 310°−85°
Velima 4th-FloorPolycrystalline 8 × 330   W p 210°−150°
Ocean Front Residence 11F-PH1Polycrystalline 24 × 330   W p 6−150°
SamraahiMono Perc Half Cell 4 × 340   W p 110°−90°
FehigiriMono Perc Half Cell 36 × 340   W p 910°−80°
MaavehiMono Perc Half Cell 20 × 340   W p 510°−170°, 10°
Table 4. PV modules and microinverter specifications.
PV ModulesMicroinverter
ParametersSpecificationParametersSpecification
Module typeJKM330PP-72-V
JKM340M-60H
ModelHME-1200-AU
Pmax (W)330340Input (DC)
Imp (A)8.749.95Commonly used module power (W)240 to 405+
Vmp (A)37.834.2Maximum input voltage (V)60
Isc (A)9.1410.82MPPT voltage range (V)16–60
Voc (V)46.941.7Maximum input current (A)4 × 11.5
Temperature coefficient of Pmax (%/°C)−0.38−0.36Output AC (V)230
Nominal operating cell temperature (NOCT) (°C)45 ± 245 ± 2Rated output power (VA)1200
Module area (m2)1.941.69Rated output current (A)5.22
No. of cells72 (6 × 12)120 (6 × 20)Nominal output voltage/range (V)230/180–275
Efficiency (STC) (%)17.0120.15Nominal frequency50
Weight/module (kg)22.519.0Efficiency (%)96.70
Table 5. Monthly average recorded weather conditions in 2023.
DateAvg. GHI. (kWh/m2/day)Avg. Ambient Temp.
(°C)
Avg. RH.
(%)
Avg. Sunshine. (h)Avg. Rainfall.
(mm)
23 January5.7028.2075.398.05.16
23 February6.3828.6175.049.30.23
23 March6.2129.1380.458.45.21
23 April6.2029.9978.609.14.38
23 May5.6529.6181.138.69.12
23 June5.1529.6281.516.73.44
23 July5.5229.5379.528.38.22
23 August6.2529.6276.619.32.53
23 September4.3228.8482.004.210.16
23 October4.9428.6481.815.411.63
23 November4.7128.5583.675.914.61
23 December4.1228.5983.555.119.00
Table 6. The IEC 61724 parameters.
ParameterDefinitionFormulaReference
Reference yieldThe maximum theoretical solar energy that can be harnessed at a specific location (kWh/kW/day). Y R = H t H r [23]
Yield
factor
The amount of daily AC energy the PV system produces (kWh/day) per unit (1 kWp) capacity of the PV system installed. Y F = E A C , d a y P p v , r a t e d [15]
Total
energy losses
The difference between the reference yield (YR) and the yield factor (YF). These losses are due to mismatched photovoltaic losses, ohmic wiring, array temperature, irradiance level, and module quality. L T = Y R Y F [24]
Performance ratioThe ratio of actual to theoretical energy outputs of the PV plant. It shows the overall impact of losses on the rated output caused by temperature changes in PV modules, inefficient inverters, improper wiring, soiling, or component failure. P R = Y F Y R × 100 [25]
Capacity utilization factorThe ratio of the PV system’s actual annual energy production to its annual energy production at full-rated power for a full year. C U F = E A C , a n n u a l P p v , R A T E × 8760 [25]
System efficiencyThe ratio of AC energy output from the PV system to solar radiation energy that is present in the PV system’s plane. γ s y s = E A C , d a y H t   A a × 100 [15]
Table 7. Daily monthly average predicted yield factor variations in 2023.
MonthMalé_GHIAabin LiftVelimaOcean FrontSamraahiFehigiriMaavehi
23 January 5.704.544.404.674.774.834.95
23 February 6.385.174.995.175.265.315.41
23 March 6.214.975.005.025.075.095.15
23 April 6.204.955.135.005.075.035.00
23 May 5.654.554.844.604.664.684.52
23 June 5.154.174.484.224.274.234.11
23 July 5.524.444.764.514.554.504.42
23 August 6.254.975.235.085.095.095.06
23 September 4.323.493.553.533.533.563.57
23 October 4.944.104.014.054.154.134.17
23 November 4.713.883.713.873.953.984.04
23 December 4.123.383.233.393.423.443.56
Table 8. Daily monthly average actual yield factor variations in 2023.
MonthMalé_GHIAabin LiftVelimaOcean FrontSamraahiFehigiriMaavehi
23 January5.702.753.724.414.074.263.36
23 February 6.383.584.245.174.784.815.21
23 March 6.213.414.284.974.734.915.02
23 April 6.203.034.035.024.674.564.61
23 May 5.653.104.144.824.694.543.51
23 June 5.152.183.894.334.244.154.34
23 July 5.522.944.044.494.544.414.44
23 August 6.253.164.395.175.075.055.17
23 September 4.321.603.223.633.643.533.53
23 October 4.942.103.434.133.873.954.09
23 November 4.711.653.333.953.803.863.96
23 December 4.120.782.933.353.283.423.69
Table 9. Daily monthly average predicted total loss variations in 2023.
MonthMalé_GHIAabin LiftVelimaOcean FrontSamraahiFehigiriMaavehi
23 January 5.701.161.301.030.930.870.75
23 February 6.381.211.391.211.121.070.97
23 March 6.211.241.211.191.141.121.06
23 April 6.201.251.071.201.131.171.20
23 May 5.651.100.811.050.990.971.13
23 June 5.150.980.670.930.880.921.04
23 July 5.521.080.761.010.971.021.10
23 August 6.251.281.021.171.161.161.19
23 September 4.320.830.770.790.790.760.75
23 October 4.940.840.930.890.790.810.77
23 November 4.710.831.000.840.760.730.67
23 December 4.120.740.890.730.700.680.56
Table 10. Daily monthly average actual total loss variations in 2023.
MonthMalé_GHIAabin LiftVelimaOcean FrontSamraahiFehigiriMaavehi
23 January 5.702.951.981.291.661.442.34
23 February 6.382.802.141.211.591.571.17
23 March 6.212.801.931.241.561.301.19
23 April 6.203.172.171.181.991.641.59
23 May 5.652.551.510.831.721.112.14
23 June 5.152.971.260.822.151.000.81
23 July 5.522.581.481.031.551.111.08
23 August 6.253.091.861.082.011.201.08
23 September 4.322.721.100.692.030.790.79
23 October 4.942.841.510.812.030.990.85
23 November 4.713.061.380.762.300.850.75
23 December 4.123.341.190.772.570.700.43
Table 11. Daily monthly average predicted performance ratio variations in 2023.
MonthMalé_GHIAabin LiftVelimaOcean FrontSamraahiFehigiriMaavehi
23 January 5.7079.6477.2681.8983.6884.7586.80
23 February 6.3881.0678.2081.0082.4983.1984.79
23 March 6.2180.0480.4680.8781.6281.9982.88
23 April 6.2079.8882.7480.5881.7181.0880.72
23 May 5.6580.6185.7381.4682.5382.8979.93
23 June 5.1580.9487.0481.8982.9182.1279.86
23 July 5.5280.4786.3181.6882.4681.5980.10
23 August 6.2579.6083.6881.3381.5281.3880.91
23 September 4.3280.7382.1681.7481.7682.3982.61
23 October 4.9482.9381.0882.0484.0383.6084.51
23 November 4.7182.3578.7382.1283.8884.5985.76
23 December 4.1282.1378.3082.3583.0783.5486.47
Table 12. Daily monthly average actual performance ratio variations in 2023.
MonthMalé_GHIAabin LiftVelimaOcean FrontSamraahiFehigiriMaavehi
23 January 5.7048.2465.2277.3271.4074.7458.95
23 February 6.3856.1266.5081.0774.9275.3981.66
23 March 6.2154.9168.8780.0476.1779.0780.84
23 April 6.2048.8664.9380.9275.3273.5574.35
23 May 5.6554.9073.3285.3483.0180.3562.12
23 June 5.1542.2575.6084.0482.3380.5884.27
23 July 5.5253.2373.1781.3882.2579.8980.43
23 August 6.2550.6170.2982.6781.1280.8082.72
23 September 4.3236.9874.5084.0184.2681.7181.71
23 October 4.9442.4469.3483.6478.3479.9682.79
23 November 4.7134.9470.6983.8280.6881.9584.08
23 December 4.1218.8271.0581.2879.6183.0189.56
Table 13. Daily monthly average predicted capacity utilization factor in 2023.
MonthMalé_GHIAabin LiftVelimaOcean FrontSamraahiFehigiriMaavehi
23 January 5.7018.9218.3519.4519.8720.1320.62
23 February 6.3821.5520.7921.5321.9322.1122.54
23 March 6.2120.7120.8220.9221.1221.2221.45
23 April 6.2020.6421.3820.8221.1120.9520.85
23 May 5.6518.9820.1819.1819.4319.5118.82
23 June 5.1517.3718.6817.5717.7917.6217.14
23 July 5.5218.5119.8518.7918.9718.7718.42
23 August 6.2520.7321.7921.1821.2321.1921.07
23 September 4.3214.5314.7914.7114.7214.8314.87
23 October 4.9417.0716.6916.8917.3017.2117.39
23 November 4.7116.1615.4516.1216.4616.6016.83
23 December 4.1214.1013.4414.1414.2614.3414.84
Table 14. Daily monthly average actual capacity utilization factor in 2023.
MonthMalé_GHIAabin LiftVelimaOcean FrontSamraahiFehigiriMaavehi
23 January 5.7011.4615.4918.3616.9417.7514.02
23 February 6.3814.9217.6821.5519.9120.0321.69
23 March 6.2114.2117.8220.7119.7220.4520.93
23 April 6.2012.6216.7720.9019.4519.0219.19
23 May 5.6512.9217.2620.0919.5518.9014.62
23 June 5.159.0716.2218.0317.6717.2818.06
23 July 5.5212.2416.8318.7218.9018.3918.48
23 August 6.2513.1818.3021.5321.1121.0221.53
23 September 4.326.6613.4115.1215.1814.7114.73
23 October 4.948.7414.2717.2216.1416.4517.05
23 November 4.716.8613.8716.4515.8516.1016.51
23 December 4.123.2312.2013.9513.6614.2415.38
Table 15. Daily monthly average predicted system efficiency in 2023.
MonthMalé_GHIAabin LiftVelimaOcean FrontSamraahiFehigiriMaavehi
23 January 5.7013.5513.1413.9316.8417.0517.46
23 February 6.3813.7913.3013.7816.5916.7417.06
23 March 6.2113.6213.6913.7616.4216.5016.67
23 April 6.2013.5914.0713.7116.4416.3116.24
23 May 5.6513.7114.5813.8616.6016.6816.08
23 June 5.1513.7714.8013.9316.6816.5216.07
23 July 5.5213.6914.6813.8916.5916.4216.11
23 August 6.2513.5414.2313.8316.4016.3716.28
23 September 4.3213.7313.9813.9016.4516.5816.62
23 October 4.9414.1113.7913.9516.9016.8217.00
23 November 4.7114.0113.3913.9716.8817.0217.25
23 December 4.1213.9713.3214.0116.7116.8117.40
Table 16. Daily monthly average actual system efficiency in 2023.
MonthMalé_GHIAabin LiftVelimaOcean FrontSamraahiFehigiriMaavehi
23 January 5.708.2111.0913.1514.3515.0411.88
23 February 6.389.5511.3113.7915.0715.1616.42
23 March 6.219.3411.7113.6215.3415.9016.27
23 April 6.208.3111.0413.7615.1514.8114.95
23 May 5.659.3412.4714.5216.7116.1512.49
23 June 5.157.1912.8614.3016.5716.2016.94
23 July 5.529.0512.4513.8416.5316.0916.17
23 August 6.258.6111.9614.0616.3116.2416.63
23 September 4.326.2912.6714.2916.9716.4416.46
23 October 4.947.2211.7914.2315.7816.0716.67
23 November 4.715.9412.0214.2616.2416.5016.93
23 December 4.123.2012.0913.8316.0116.6818.03
Table 17. Orientation analysis for the six sites considered.
SitesAabin LiftVelima 4th-Floor Ocean Front Residence 11F-PH1 Samraahi FehigiriMaavehi
Site Coordinates4°10′21.0″ N
73°30′48.1″ E
4°10′29.5″ N
73°30′43.7″ E
4°13′10.2″ N
73°32′20.4″ E
4°10′20.5″ N
3°29′06.2″ E
4°10′20.9″ N
73°30′14.9″ E
4°10′18.2″ N
73°30′49.6″ E
Azimuth(−) 85°(−) 150° (−) 150°(−) 90°(−) 80°(−) 170°
10°
Tilt10°10°10°10°10°
Annual E_Grid kWh6352.94280.412,786.02224.020,042.011,151.0
Optimal orientation (Tilt°, Azimuth°)(5°, 5°)(5°, 0°) &
(5°, 5°)
(5°, −5°)(5°, 0°) &
(5°, 5°)
(5°, 5°)(5°, −25°)
% Increase with optimal orientation0.77%1.29%0.22%0.82%0.81%0.60%
Disclaimer/Publisher’s Note: The statements, opinions and data contained in all publications are solely those of the individual author(s) and contributor(s) and not of MDPI and/or the editor(s). MDPI and/or the editor(s) disclaim responsibility for any injury to people or property resulting from any ideas, methods, instructions or products referred to in the content.