1. Introduction
The decarbonisation of the heating sector is a critical component of global efforts to achieve net-zero greenhouse gas (GHG) emissions and mitigate climate change [
1]. Residential heating accounts for a substantial portion of energy consumption and CO
2 emissions in many countries. The United Kingdom (UK) faces a significant challenge, with approximately 85% of homes heated by natural gas, contributing to around 14% of the UK’s total carbon emissions [
2]. Achieving meaningful decarbonisation in this sector requires shifts towards enhanced energy efficiency and pervasive energy-conservation practices.
The North of Tyne (NoT) region in North East England exemplifies these challenges, with a high reliance on natural gas, diverse consumption patterns, and a notable prevalence of fuel poverty. In 2018, the region consumed 17.3 TWh of gas—about 1% of total UK energy use—with the domestic sector being a major contributor [
3]. Transitioning this demand to low-carbon alternatives demands technological innovation, economic viability, and social acceptance, while prioritising pathways that maximise energy efficiency and conservation.
This study prioritises pathways that maximise energy efficiency, energy conservation, and overall system-wide effectiveness, capturing both primary energy use and heat delivered to end-users within a multi-system, stakeholder-informed planning framework. This framework explicitly accounts for competitive stakeholder interactions and strategic investment trade-offs beyond traditional centralised cost-minimisation approaches.
1.1. Related Works
Several pathways are being explored for heating decarbonisation, including electrification (e.g., heat pumps), district heating, and the use of low-carbon gases such as hydrogen and biomethane [
4]. Hydrogen, produced via electrolysis using renewable electricity (green hydrogen) or from natural gas with carbon capture and storage (CCS) (blue hydrogen), is gaining attention as a potential direct replacement or blend for natural gas in existing networks [
5]. While hydrogen offers a low-carbon fuel option, its overall system efficiency, particularly when compared to direct electrification, is a crucial consideration for energy conservation.
Dedicated studies focusing on hydrogen blending in existing gas networks [
6,
7,
8,
9,
10,
11,
12,
13,
14,
15] identify it as an effective bridge technology that (1) utilises existing infrastructure with minimal upgrades, (2) reduces emissions incrementally while scaling up green hydrogen production, and (3) builds public and industry familiarity with hydrogen as a fuel. These studies predominantly analyse network operation, pressures, flows, and gas quality from the supply or demand perspective, rather than the overall energy conversion efficiency of the integrated system.
Recent operational analyses reaffirm that up to a 20% volumetric hydrogen can be blended without major pressure or efficiency impacts, though higher proportions pose significant challenges [
15]. However, few studies explicitly evaluate system-wide efficiency implications, considering both primary energy consumption for hydrogen production and the end-use efficiency in residential heating. Broader system-level studies have also highlighted the economic and environmental benefits of integrating hydrogen across electricity, heating, and transport sectors [
16], while multi-model analyses point to the cost-effectiveness of combining heat pumps and hydrogen boilers to balance flexibility and investment needs [
17].
Further advancing the understanding of integrated energy systems, Hosseini et al. [
18] presented a framework for the techno–economic–environmental (TEE) analysis of smart multi-energy grids, including geothermal energy storage (GES). Their work underscores the role of various low-carbon energy sources and heat pumps in decarbonising heat loads and improving TEE performance. Similarly, the impact of uncertainty on the TEE performance of integrated gas and electricity networks (IGENs) and storage devices was evaluated by Hosseini et al. [
19]. They highlighted the importance of robust TEE assessment under various uncertainties (e.g., loads, renewable generation, economic and environmental factors) for informing resilient design choices towards net-zero targets. These previous works provide a foundational basis for integrated energy-system analysis, informing our detailed efficiency and conservation-focused investigation within a specific regional context.
However, the role of hydrogen, its production costs, infrastructure implications, and integration with other solutions like heat pumps remain subjects of ongoing research and debate [
20]. This study complements existing work by explicitly quantifying system-wide efficiency across different hydrogen-blending levels, illustrating the trade-offs between energy conversion, demand-side measures, and decarbonisation pathways, which remain underexplored in the current literature. Social interventions, such as improving building insulation standards and encouraging behavioural changes (e.g., adjusting heating setpoints), continue to play a vital role in reducing overall energy demand [
21,
22].
Furthermore, our study complements existing work by explicitly quantifying system-wide efficiency across different hydrogen-blending levels, combining both primary energy inputs and delivered heat, while integrating socio-technical interventions and technology adoption. This approach provides insights into how end-use energy conversion, demand reductions, and infrastructure choices jointly influence efficiency, a perspective not captured in traditional PEF or overall efficiency analyses. The integrated MSP and game-theoretic framework further allows assessment of strategic interactions among stakeholders, capturing both technical feasibility and economic outcomes in regional planning.
1.2. Objectives and Contributions
This study addresses key questions regarding optimal strategies for decarbonising residential heating in the NoT region, with a particular emphasis on energy efficiency improvements and conservation potentials. The primary objectives are summarised as follows:
To evaluate the impact of social interventions on decarbonising the heating sector in the NoT region, quantifying their contribution to energy conservation and demand reduction.
To assess how stakeholder willingness to adopt new technologies and behaviours influences the effectiveness of transition strategies, considering the adoption of more energy-efficient technologies.
To determine the required investment in hydrogen production and renewable energy under different levels of social intervention and technology adoption, analysing the primary energy efficiency implications of these investments.
To optimise the integration of heating setpoint adjustments, insulation upgrades, heat pumps (HPs), and hydrogen boilers (HBs) to maximise system-wide energy efficiency and minimise carbon emissions.
To identify strategies that promote stakeholder acceptance and adoption of new heating technologies, considering affordability and comfort, as well as their role in achieving a more energy-efficient and sustainable heating system.
In a nutshell, our study presents a novel system-level view of heating decarbonisation, linking social, technical, and economic dimensions to evaluate efficiency, cost, and emission trade-offs across various hydrogen adoption scenarios. By integrating the game-theoretic model (GTM), this study captures how competitive investment decisions shape efficiency, hydrogen deployment, and decarbonisation pathways.
To achieve these objectives, this paper develops and applies a novel multi-system-perspective (MSP) modelling framework [
23]. This framework soft-links qualitative scenario development, reflecting stakeholder perspectives and social acceptance, with quantitative energy-system modelling to evaluate various decarbonisation pathways up to 2050. This study provides insights into the technical, economic, and societal implications of different strategies, aiming to inform policy and investment decisions for a sustainable heating transition in the NoT region and other similar contexts, underpinning the critical role of both energy efficiency and conservation.
The remainder of this paper is organised as follows.
Section 2 details the case study context, MSP modelling framework, scenario development, and quantitative analysis methods.
Section 3 applies the proposed framework to the North of Tyne (NoT) region, outlining the regional energy characteristics, techno-economic assumptions, and evaluation metrics used to assess alternative heating decarbonisation pathways.
Section 4 presents and discusses the findings from the scenario analyses, including energy demand projections, CO
2 emissions, and economic assessments, with emphasis on the interplay between hydrogen blending, socio-technical interventions, and system-wide efficiency. Finally,
Section 5 summarises the comparative performance of heating pathways to 2050, highlighting cost, emission, and system-wide efficiency trade-offs among heat pumps, hydrogen, hybrid, and socio-technical options.
2. Methodology
This study employs a multi-system-perspective (MSP) framework to model and analyse hydrogen-based decarbonisation strategies for residential heating in the North of Tyne (NoT) region. The methodology integrates qualitative scenario development with quantitative energy-system modelling, drawing on a game-theoretic optimisation framework previously developed to capture stakeholder interactions and strategic decision-making in multi-vector energy systems [
23]. The MSP framework provides a holistic approach to understanding the interdependencies among generation, networks, and end-use systems across multiple energy vectors—electricity, gas, and heat—thereby enabling the evaluation of social, technical, and economic factors influencing heating decarbonisation.
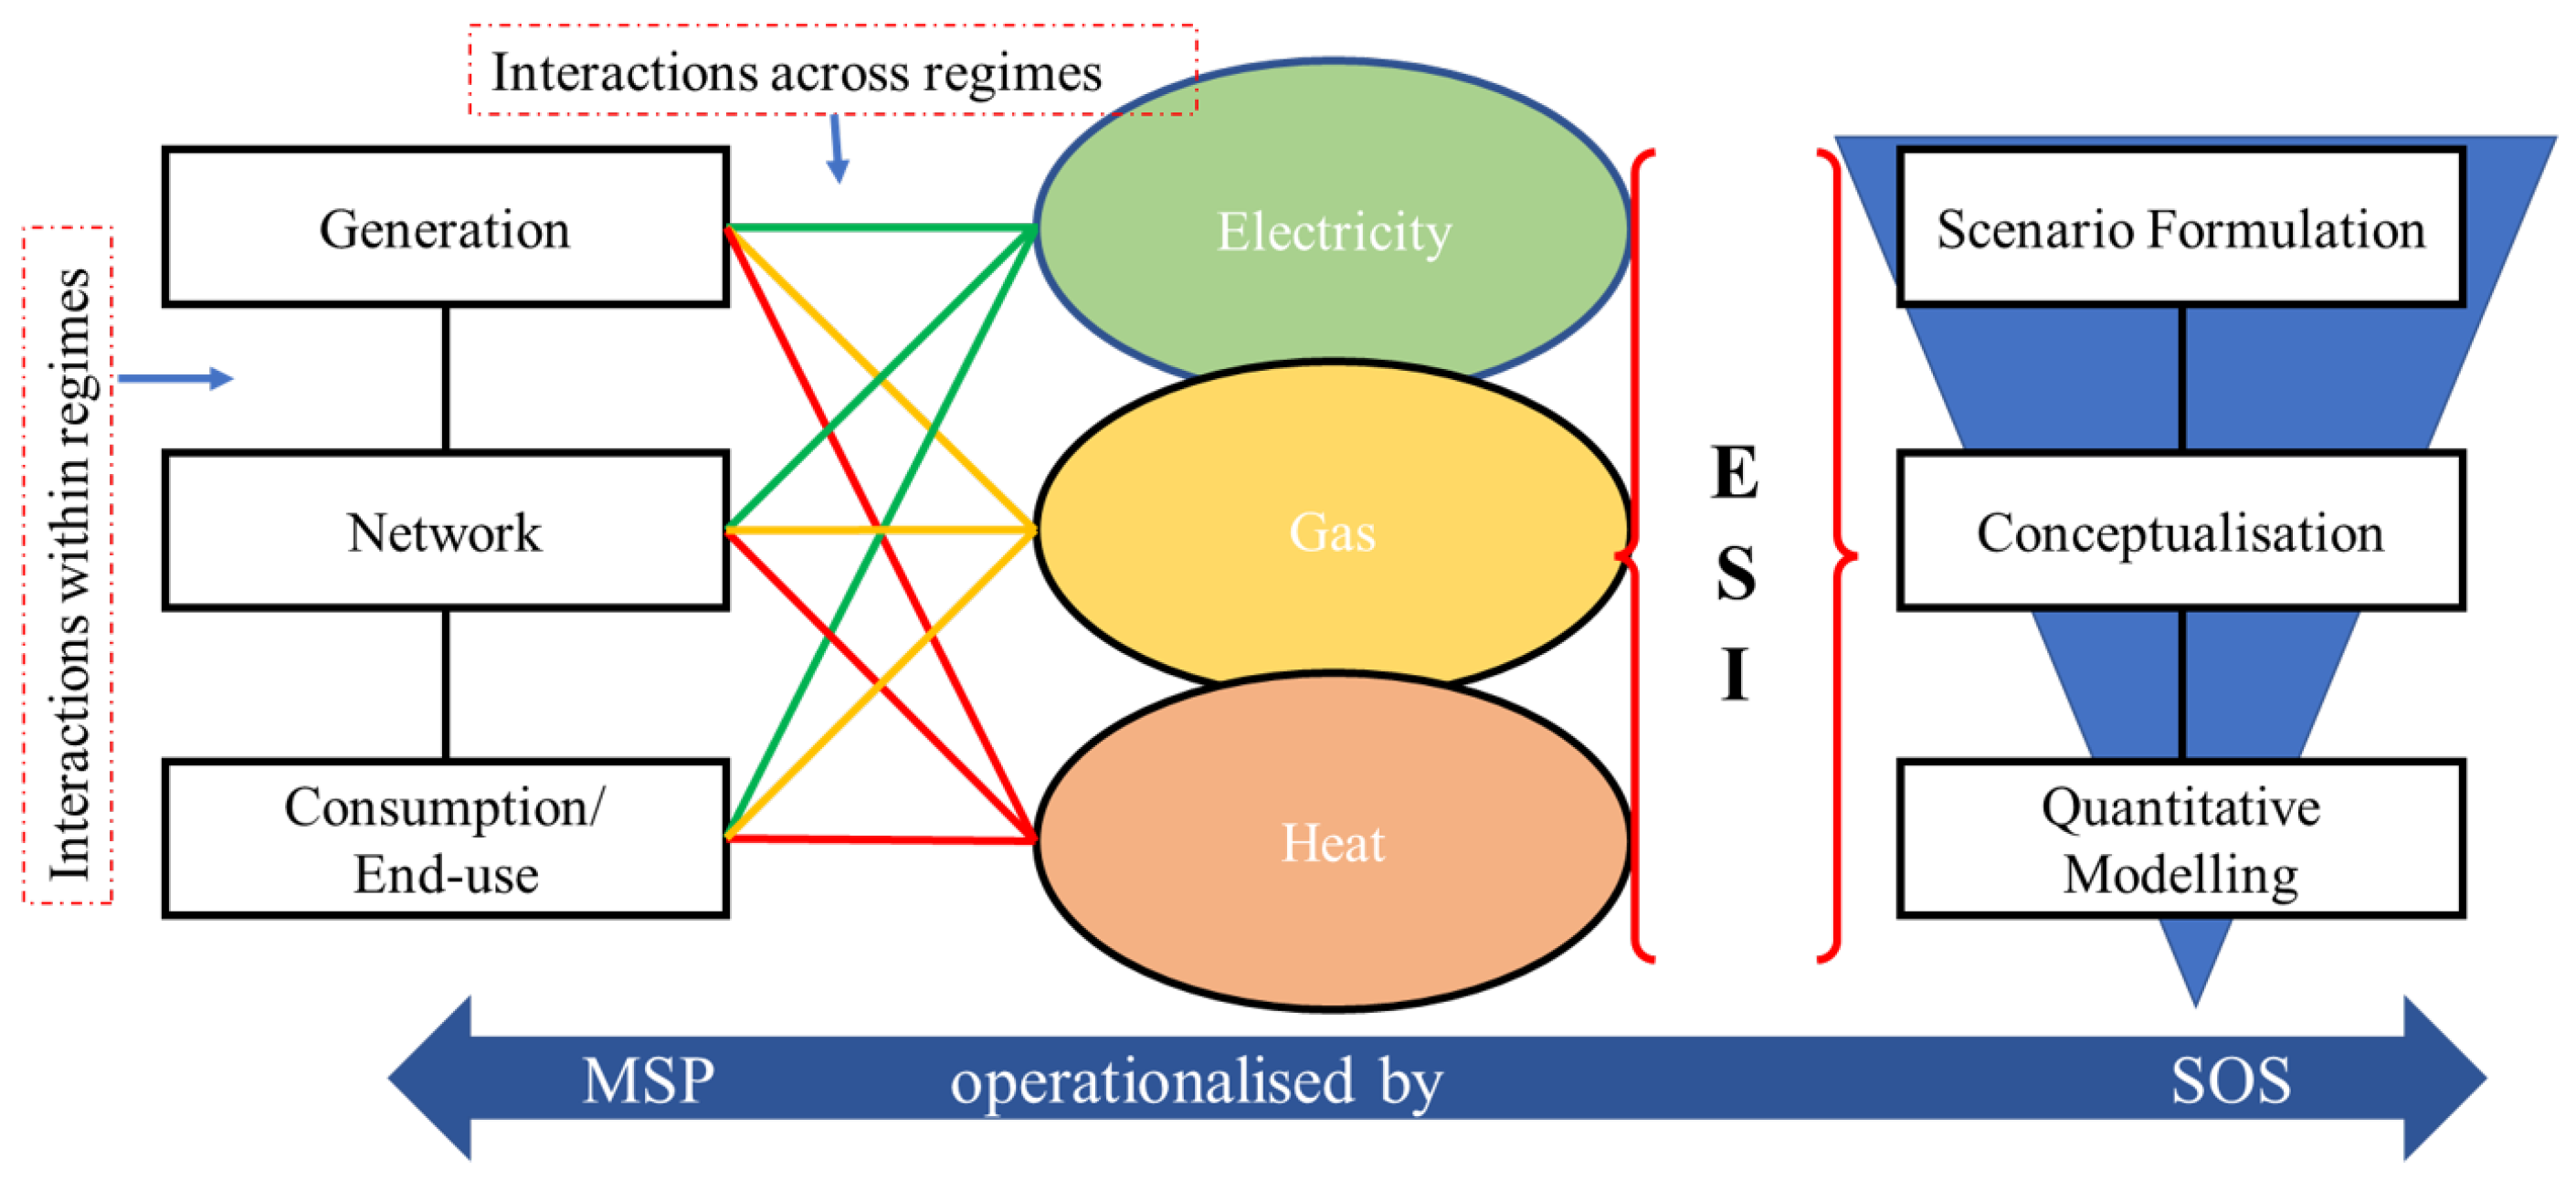
As illustrated in
Figure 1, the MSP framework captures the complex interactions among generation, network, and consumption layers across interconnected systems of electricity, gas, and heat. This perspective supports an integrated assessment of physical infrastructures, behavioural factors, and market mechanisms relevant to heating transitions in the NoT region. It facilitates the identification of leverage points for decarbonisation by linking social interventions (e.g., heating setpoint adjustments, insulation upgrades, and adoption of heat pumps or hydrogen boilers) to systemic energy and emission outcomes.
The scenario formulation within this MSP framework is operationalised through Monte Carlo simulation to capture uncertainties related to technology adoption and behavioural change. The subsequent quantitative modelling employs a two-stage analytical process comprising the game-theoretic model (GTM) and the optimal power and gas flow (OPGF) model. This combined approach enables the evaluation of investment requirements in hydrogen production and renewable energy deployment under varying social intervention and technology adoption scenarios, thereby supporting robust decision-making for regional heating decarbonisation.
A central aspect of this methodology is the rigorous quantification of how various interventions influence energy demand and conversion efficiency.
2.1. Modelling Framework
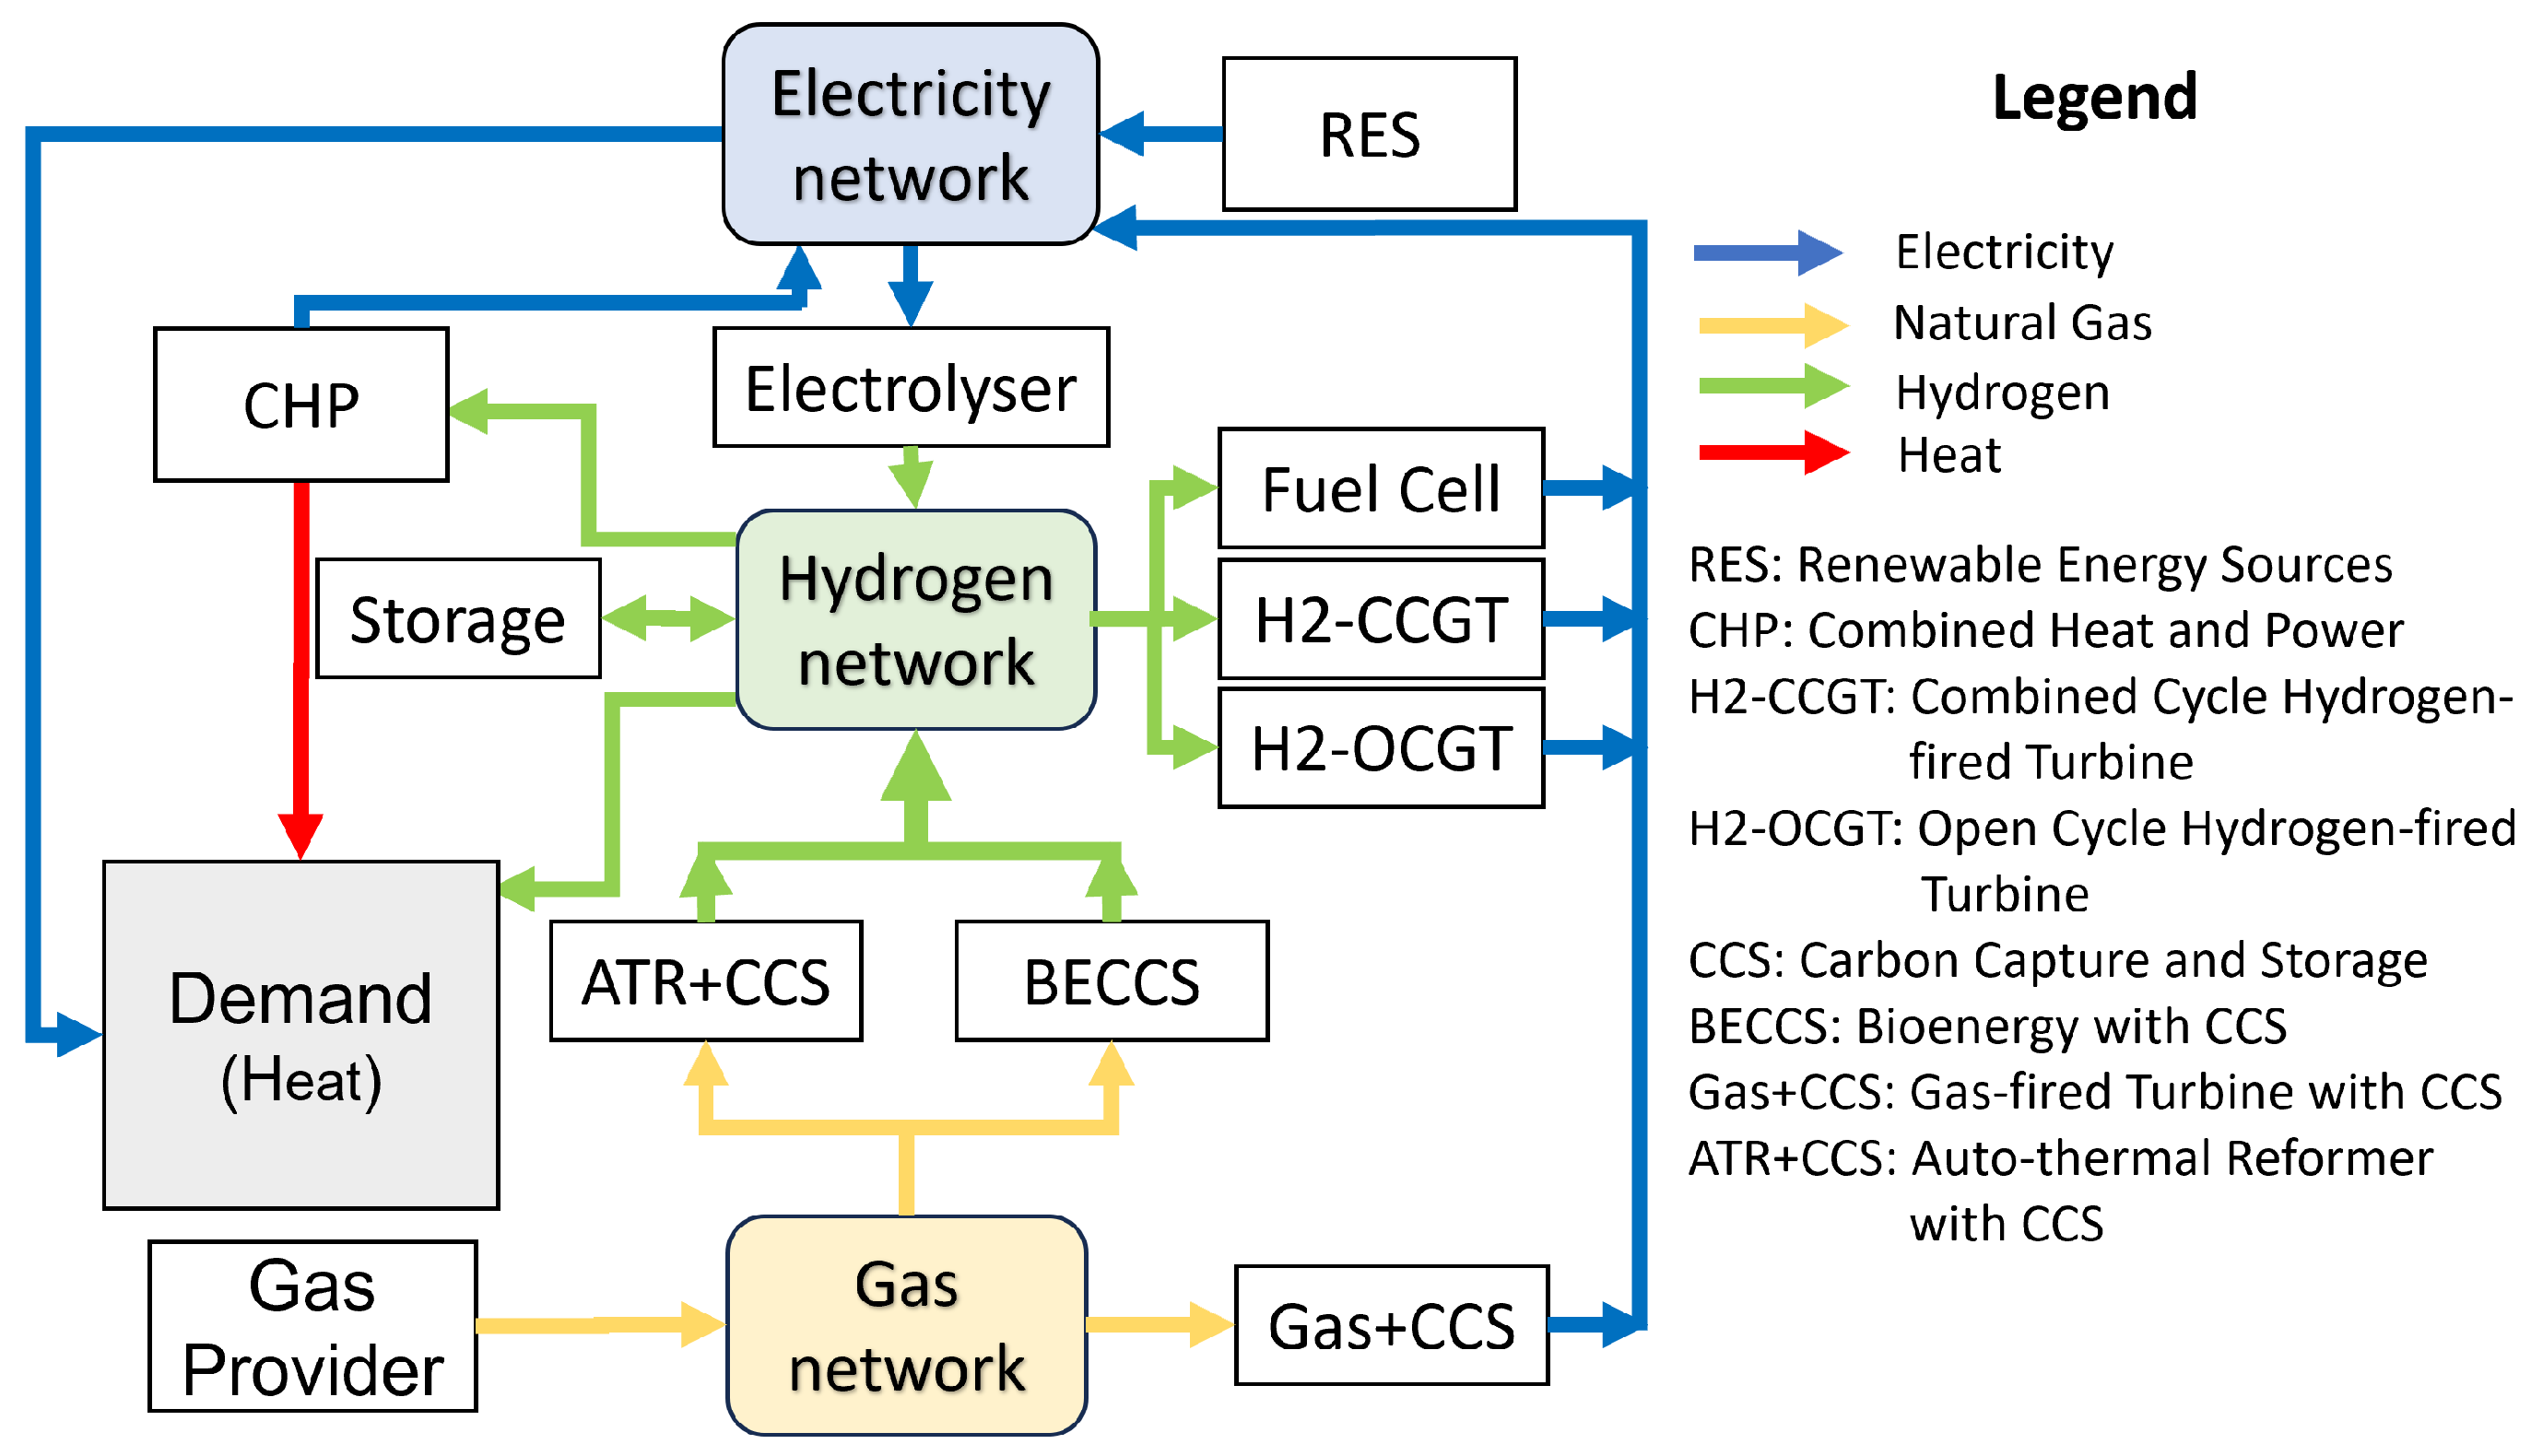
The core of the methodology is a high-level resources–technology model, depicted in
Figure 2. This model considers energy resources (electricity, natural gas), conversion technologies (water electrolysers for hydrogen production, H2 reformers if blue hydrogen is considered), energy networks (electricity, natural gas, H2), storage (H2 storage), and heat consumers (heat pumps, H2 boilers, H2-based district heating, NG boilers). Social interventions, such as improved insulation standards and smart controls, are explicitly integrated as demand-side energy-conservation measures.
2.2. Electric Network Modelling
The electricity network is represented through nodal power-balance equations, which ensure that the active and reactive power injections match the respective demands at each bus while respecting network constraints. This provides a steady-state snapshot of the network, which is crucial for integrating with hydrogen-based energy systems. In this work, the power flow equations are solved using the open-source Pandapower tool [
24], which enables efficient and reproducible simulation of large-scale electricity networks.
2.2.1. Active Power Flow
The active power balance at bus
i is given by
where
is the active power generation,
is the active load,
and
are the voltage magnitudes at buses
i and
j,
and
are the line conductance and susceptance, and
,
are the voltage angles.
2.2.2. Reactive Power Flow
The reactive power balance at bus
i is expressed as
where
is the reactive power generation,
is the reactive load, and all other variables are as defined above.
2.3. Hydrogen Blending in the Gas Network
Hydrogen can be injected into the existing natural gas network to reduce carbon emissions while utilising existing infrastructure. Pandapipes [
25] provides functionalities to simulate gas mixtures and model the steady-state operation of gas networks, while Pandapower [
24] is employed for the simulation and optimisation of coupled electrical systems. Such capabilities are crucial for advancing more efficient and sustainable energy-management practices. In this study, hydrogen is considered as a blend in the low-pressure natural gas network of the North of Tyne region, and its impact on the network is analysed in terms of flow, pressure, and gas quality. The impact on the volumetric and energy efficiency of the gas distribution is carefully accounted for through modified gas properties.
The hydrogen-blending process is modelled by representing the gas-mixture properties as functions of the hydrogen fraction,
, defined as the molar proportion of hydrogen in the total gas mixture [
26]. The key properties of the mixture, such as density, dynamic viscosity, compressibility, and gross calorific value (GCV), are calculated using established mixing rules:
The mass-weighted average of density is given by
The complex function of molar properties for dynamic viscosity is given by
The molar-fraction-weighted average of the compressibility factor is given by
The molar-fraction-weighted gross calorific value, adjusted by compressibility, is given by
where
are the mass fractions of component
i,
are the molar masses, and
are the molar fractions. The flow of the blended gas in each network branch is governed by a modified steady-state gas flow equation:
where
is the volumetric flow rate in branch
k [m
3/s],
and
are the pressures at the upstream and downstream nodes [Pa],
D is the pipe diameter [m],
L is the pipe length [m],
f is the Darcy–Weisbach friction factor (dimensionless),
Smix is the gas-mixture-specific gravity relative to air,
T is the gas temperature [K],
and
are the normalisation temperature and pressure [K, Pa],
is the compressibility factor of the gas mixture, and
is the universal gas constant for air [J/(kg·K)].
The nodal balance ensures mass conservation at each junction:
The coupling with the electricity system is captured through Power-to-Gas (P2G) units, which convert electrical energy into hydrogen injected into the network. The energy content of the hydrogen produced (
, in equivalent volumetric flow or energy per unit time) is given by
Here,
is the electrical power consumed by the P2G unit,
is its efficiency, and
is the gross calorific value of pure hydrogen, used to convert electrical energy to the equivalent hydrogen energy. The efficiency of the P2G process (
) is a critical parameter in assessing the overall energy efficiency of hydrogen pathways, as it dictates the primary energy input required to produce a given amount of hydrogen.
This formulation allows the model to account for the effect of hydrogen blending on network pressures, energy content, and operational feasibility while maintaining compatibility with the existing natural gas infrastructure, providing a comprehensive view of energy flows and transformations.
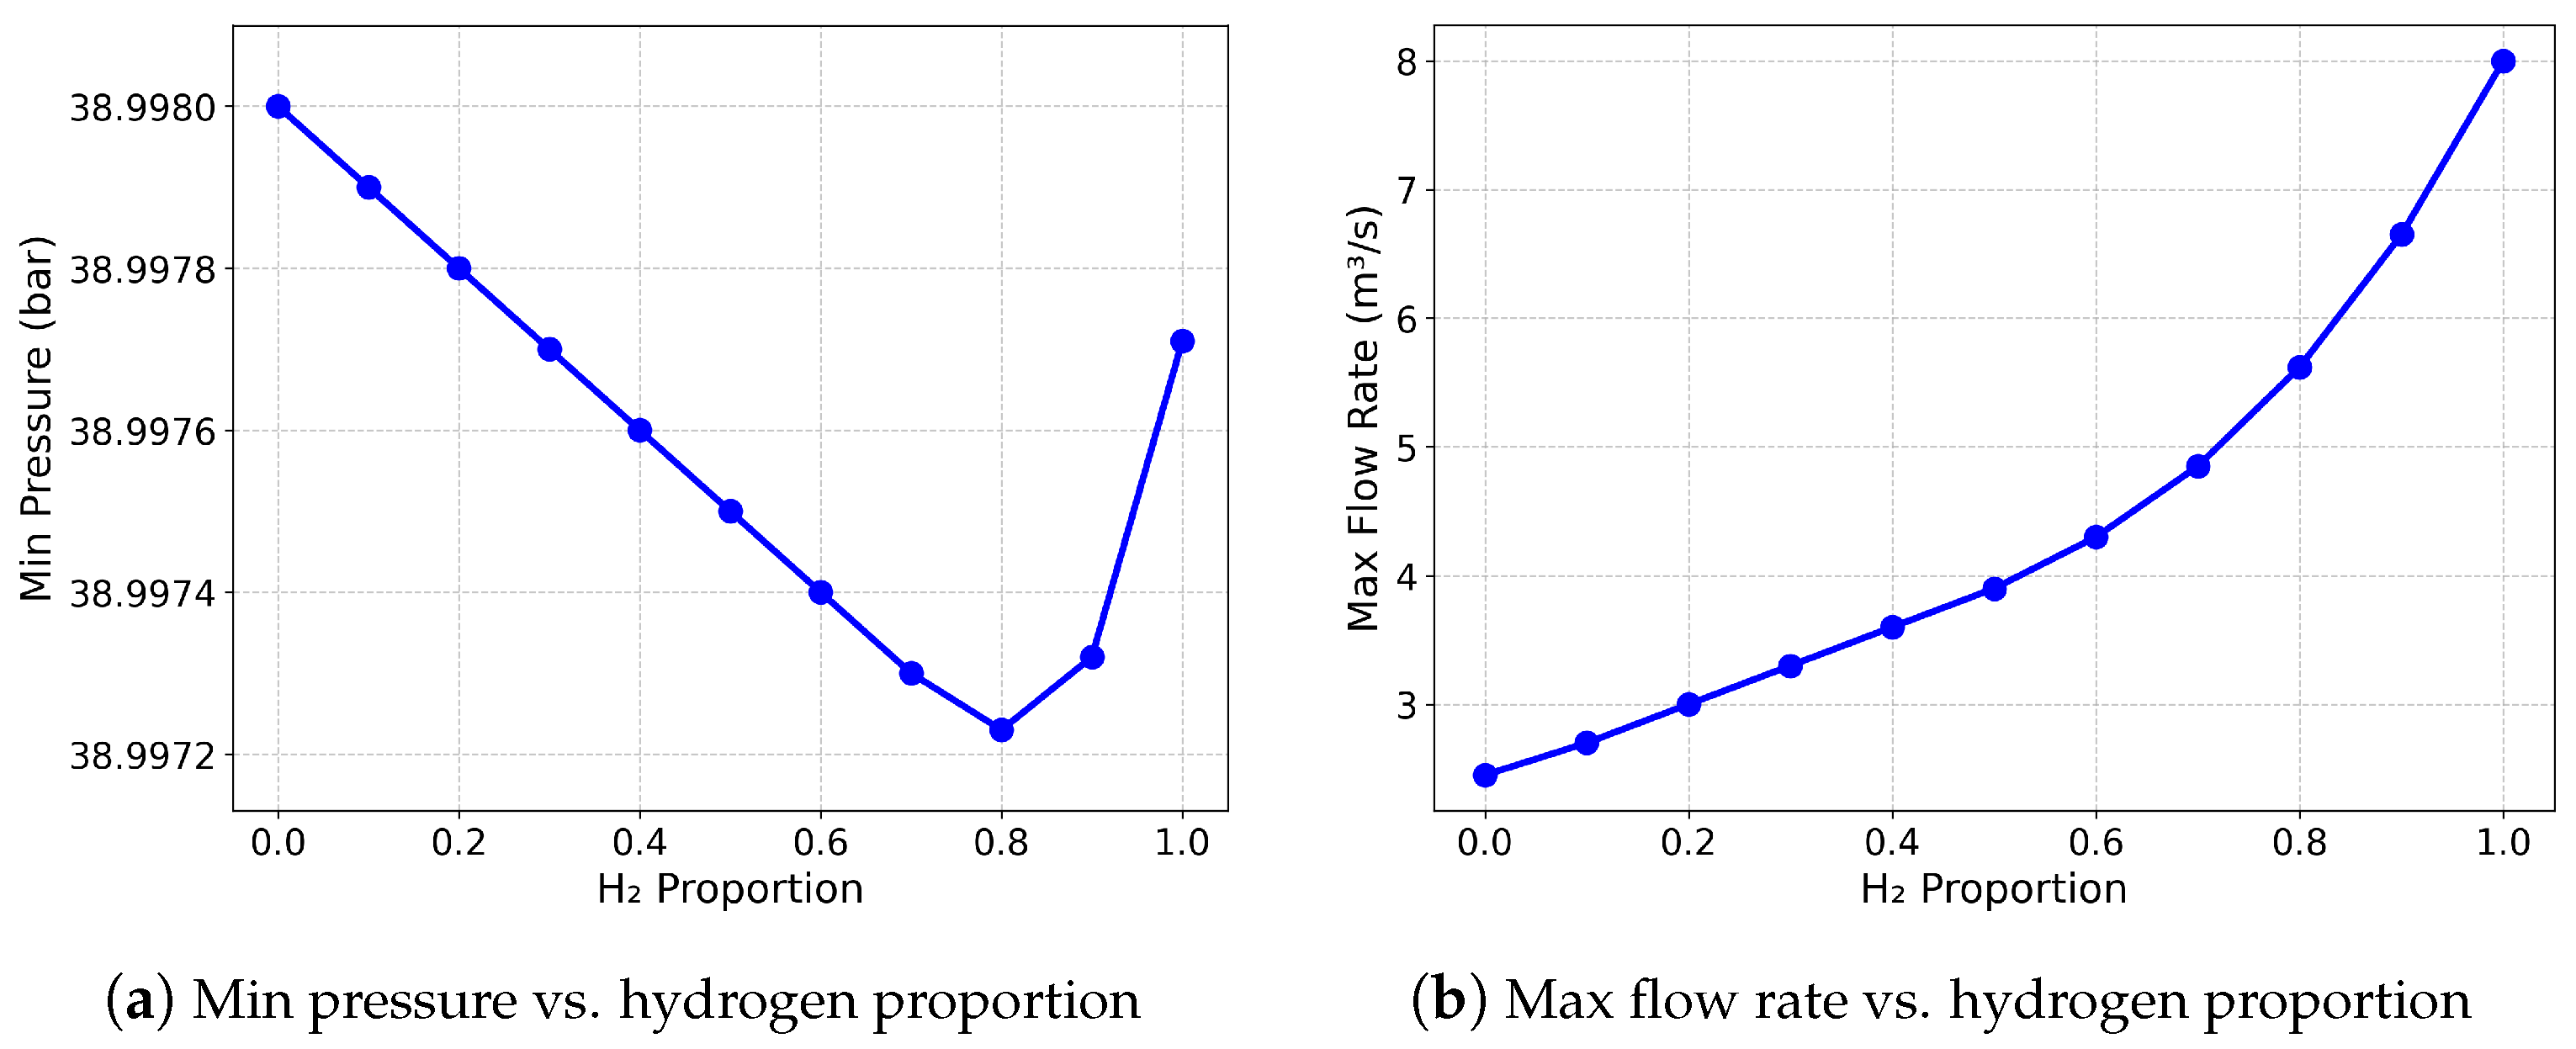
Figure 3 showcases the operational implications of hydrogen blending within a low-pressure natural gas network.
Figure 3a reveals that as the hydrogen proportion increases, the minimum network pressure initially dips before recovering at higher blend ratios, as the lower gas density at higher hydrogen fractions reduces flow resistance, partially offsetting the initial pressure drop, necessitating careful pressure management to ensure supply integrity. Concurrently,
Figure 3b shows that the maximum volumetric flow rate increases with higher hydrogen fractions. Increasing the hydrogen fraction also affects the Wobbe Index (WI), which is defined as
where GCV
mix is the gross calorific value of the gas mixture and SG
mix is its specific gravity relative to air. A lower WI due to hydrogen’s low molecular weight and energy density constrains the maximum safe blending ratio (commonly around 20%) to ensure stable appliance operation [
27]. This, together with variations in network pressure and volumetric flow, defines the operational limits for hydrogen injection in existing natural gas networks.
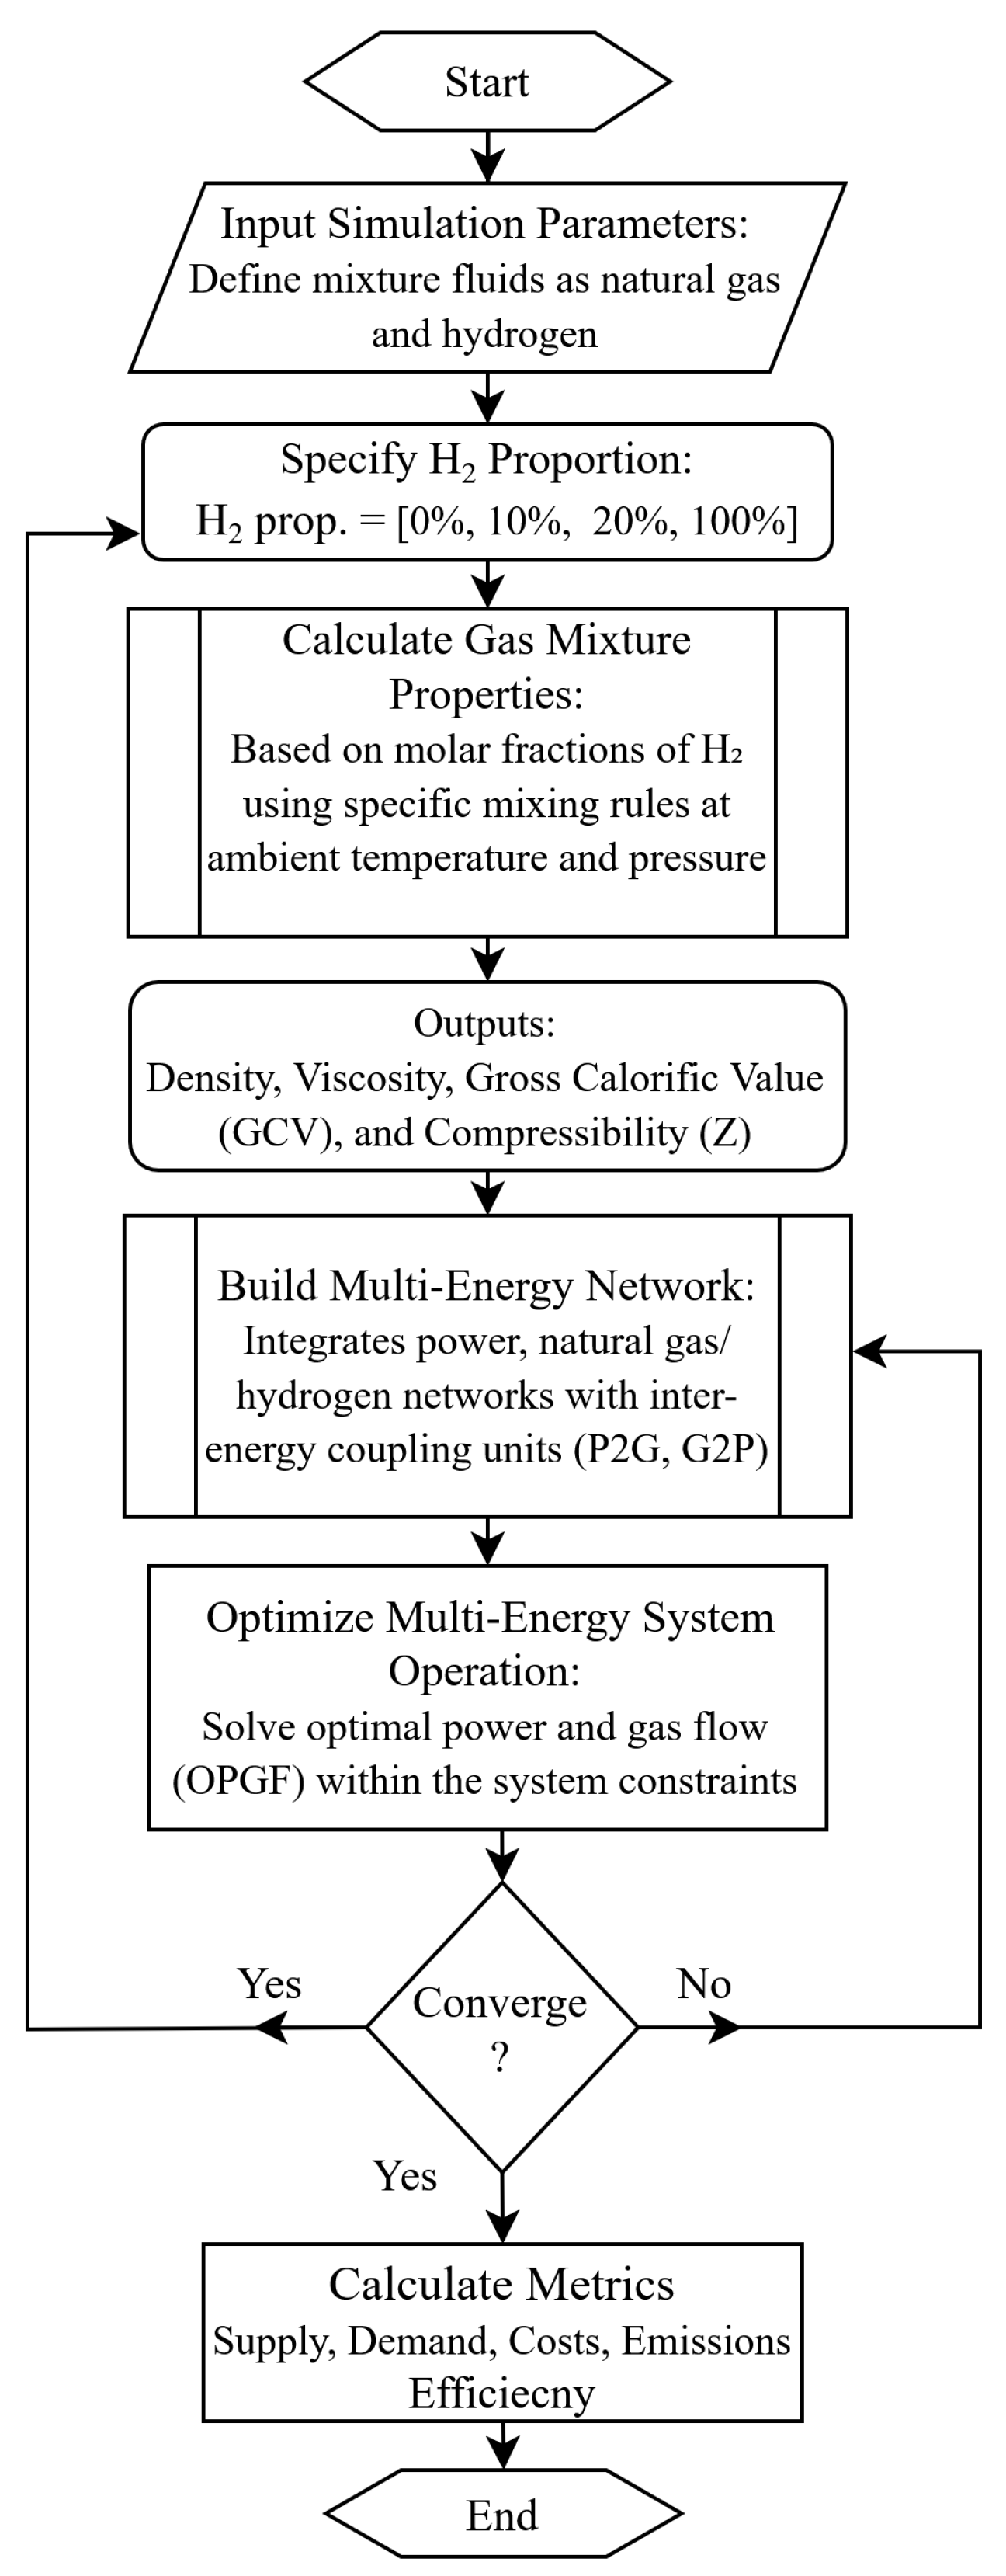
Figure 4 summarises the methodological framework adopted for hydrogen-blending analysis, linking the definition of gas-mixture properties with the integrated optimisation of the multi-energy network.
2.4. Socio-Technical Interventions and Demand Modelling
A set of six socio-technical interventions (STIs) was identified from the literature review, and their demand impacts were quantified from empirical studies [
21,
22,
28], as shown in
Table 1.
These interventions are explicitly defined as energy-conservation measures designed to reduce end-use energy demand for residential heating. They include decreasing heating setpoints, improving building insulation, delaying the start of the heating season, using radiator valves for zonal heating, adopting heat pumps, and adopting hydrogen boilers.
Heat pumps are assumed to have a coefficient of performance (COP) of 3. Their individual impacts on gas and electricity demand were estimated as percentage changes.
The 77% reduction represents an upper-bound value from deep retrofit modelling of the Salford Energy House in the United Kingdom [
28]. Our Monte Carlo simulation probabilistically applies these interventions across the housing stock, yielding realistic aggregate reductions below 30%.
2.5. Monte Carlo Simulation for Demand Profiles
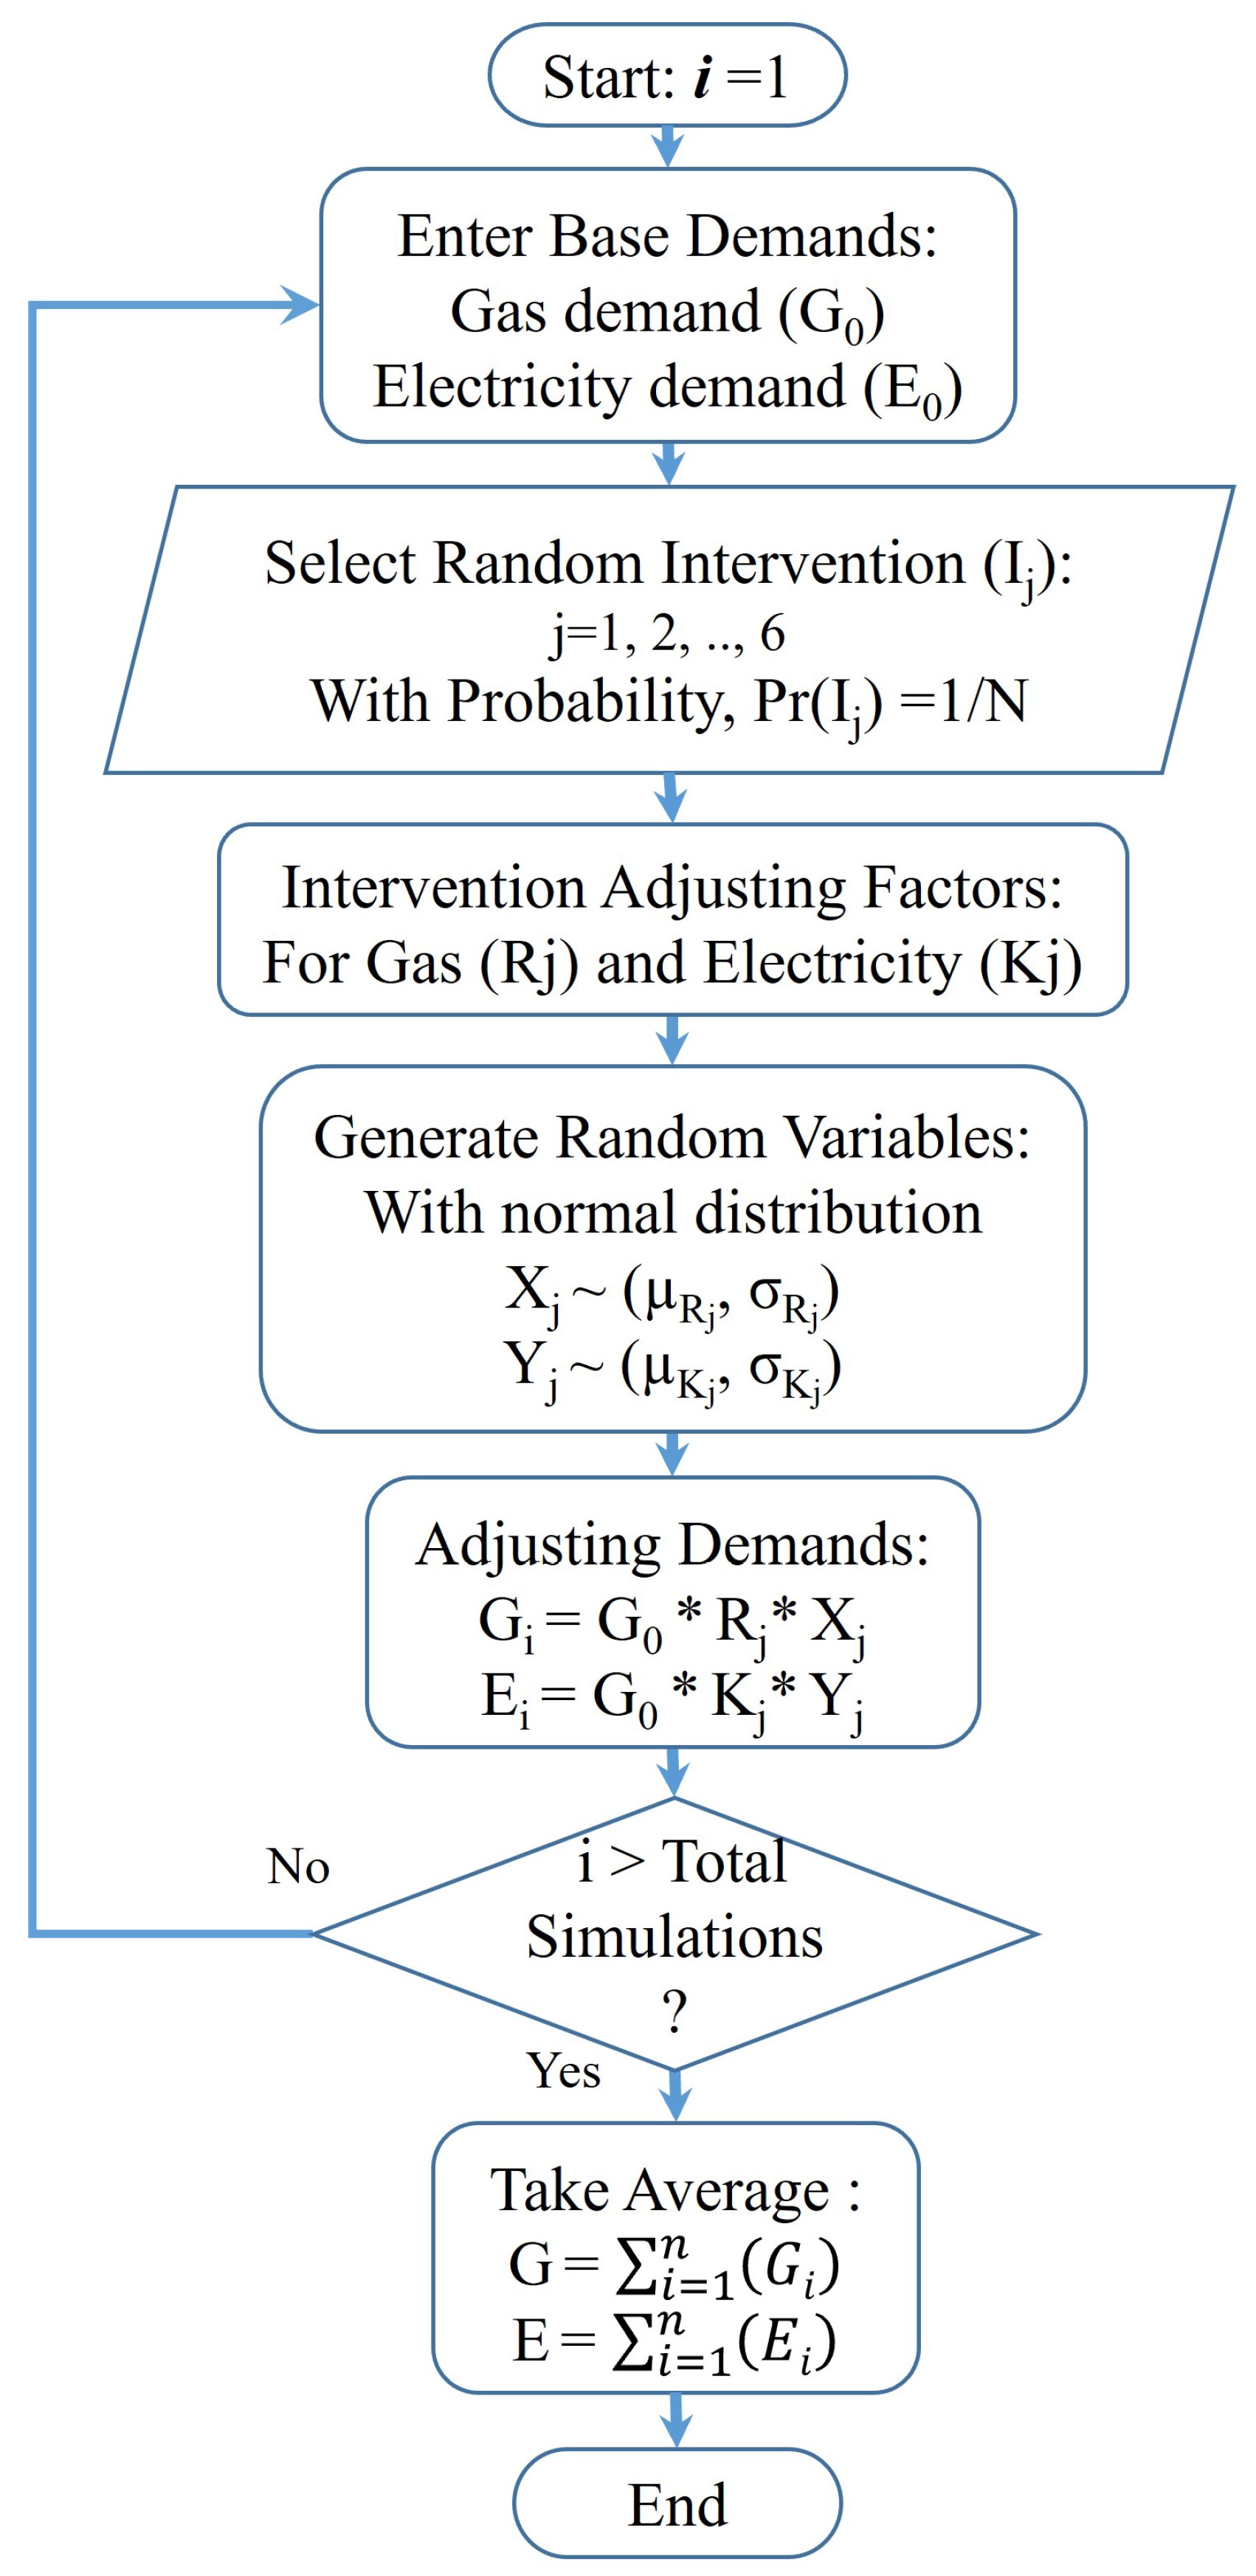
The purpose of the Monte Carlo simulation in this study is to characterise the uncertainty and variability of residential heating demand on a representative cold day, rather than to re-run the entire 2025–2050 pathway analysis probabilistically. It provides a micro-level depiction of how diverse socio-technical interventions translate into aggregate demand variability across the housing stock, supporting broader system-level decarbonisation modelling. To account for uncertainties and evaluate the impact of various interventions on energy demands, a Monte Carlo simulation approach is employed to generate gas and electricity demand profiles for a representative cold day.
Let
and
represent the baseline hourly gas and electricity demands, respectively. The adjusted demands,
G and
E, after applying a random intervention,
, are calculated as
where
n is the total number of simulation iterations;
N is the total number of interventions (here,
N = 6); Pr(
Ij) is the probability of selecting intervention
j (assumed
for equal likelihood in some scenarios);
and
are the adjusting factors for gas and electricity demands for intervention
j, respectively (derived from
Table 1); and
and
are random variables from normal distributions representing uncertainty regarding the impact of intervention
j on gas and electricity changes,
and
.
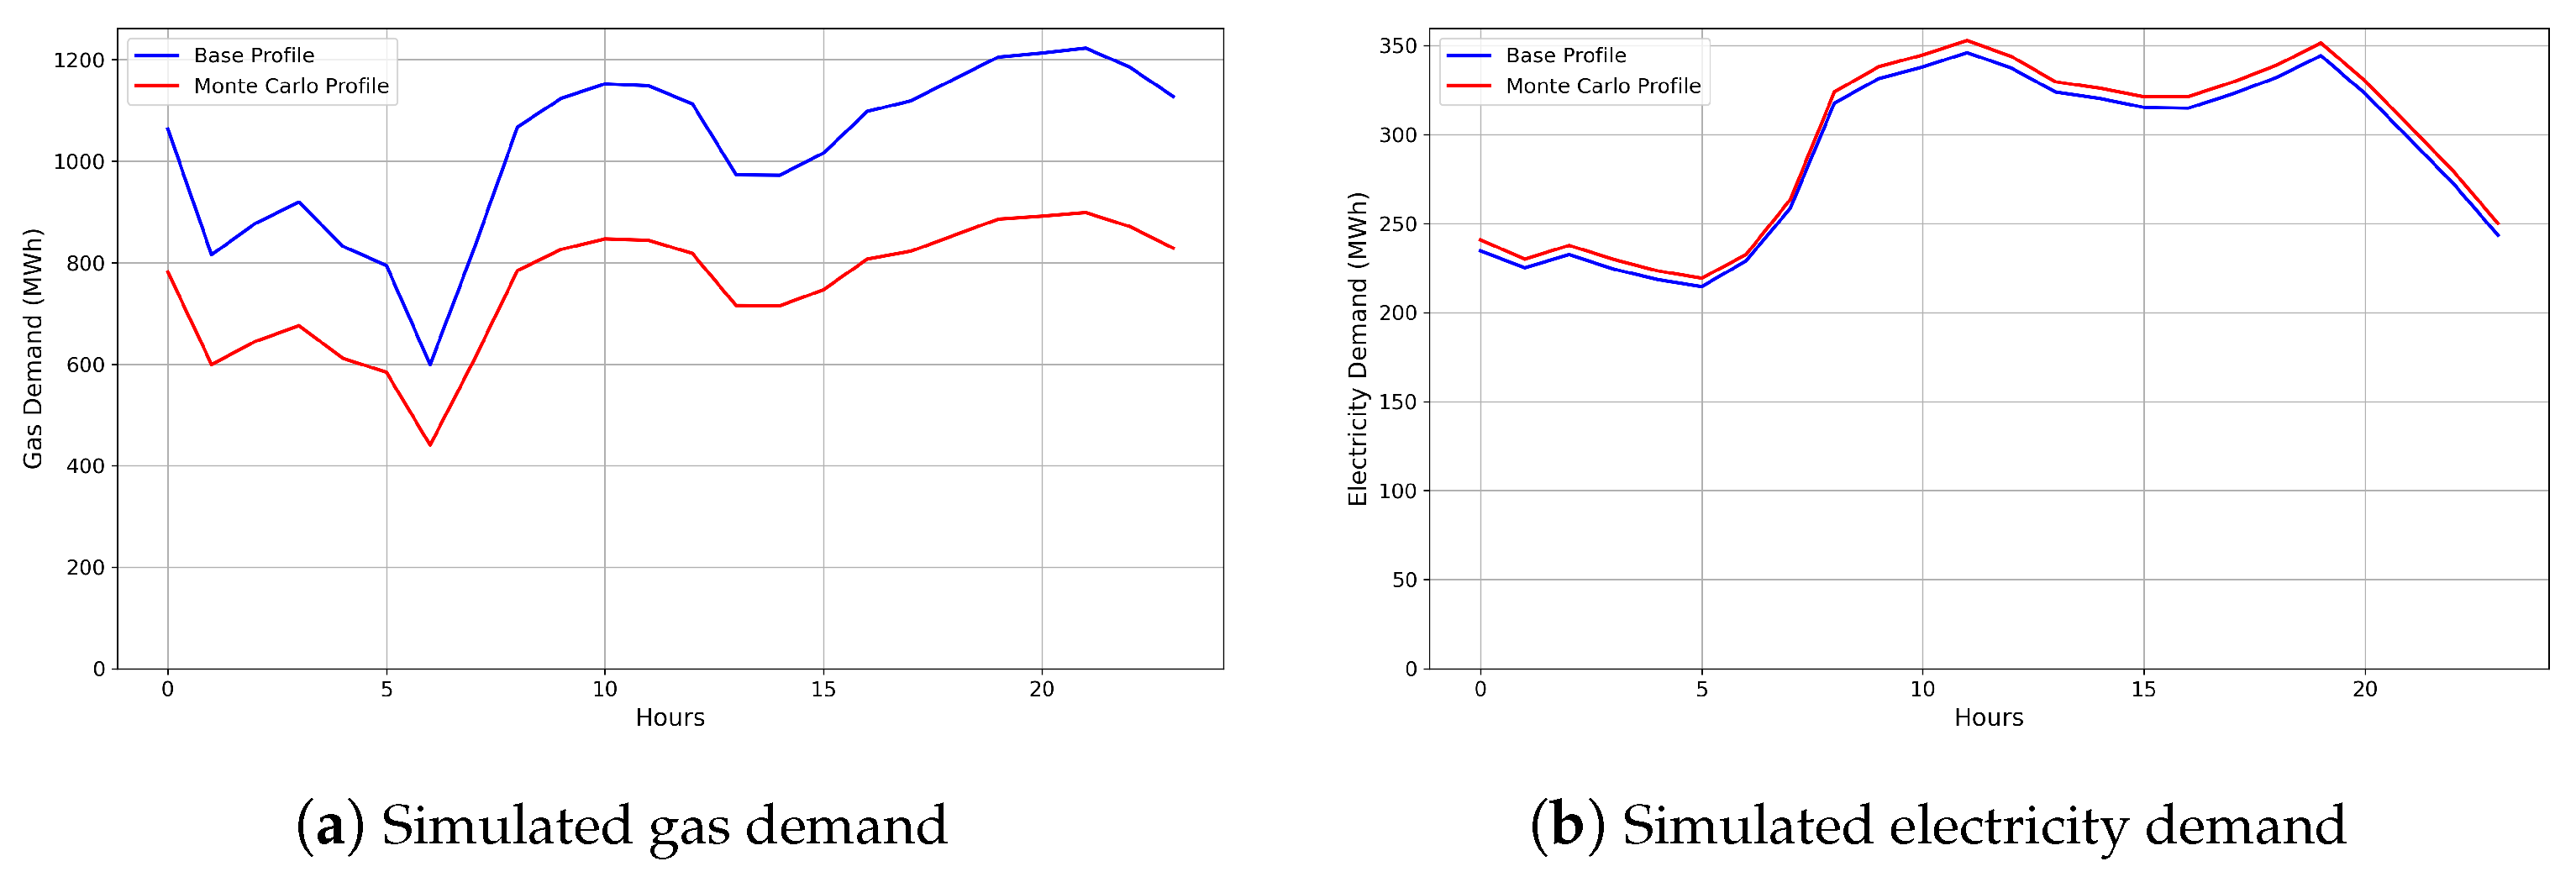
As shown in
Figure 5, the Monte Carlo simulation generates gas and electricity demand profiles for a representative cold day.
The Monte Carlo simulation flowchart is shown in
Figure 6.
2.6. Game-Theoretic Model Framework
A game-theoretic investment planning model (GTM) is employed to capture high-level strategic interactions among stakeholders, including electricity generators and hydrogen-based storage operators, within a competitive multi-vector energy system [
23]. In this study, the GTM is used primarily to inform feasible investment pathways and their implications for system-wide efficiency, supporting the evaluation of residential heating decarbonisation strategies. The model integrates long-term investment planning (covering 2025–2050 in five-year intervals) and short-term operational decisions, enabling stakeholders to maximise returns under technical and market constraints. Investments considered include energy generation technologies (e.g., gas turbines, CHP, wind, solar, biomass) and hydrogen production (electrolysers, H2 reformers) to meet projected heating demands while achieving decarbonisation targets. Although the GTM employs a game-theoretic formulation, the focus here is on its application to energy efficiency and decarbonisation outcomes rather than on developing new game-theoretic methodology.
The core objective of the model is to maximise the Net Present Value (NPV) of energy-system cash flows, considering revenues, operational costs, carbon emissions costs, and investment outlays:
where
is the annuity factor,
is the revenue,
is the operational cost,
is the carbon cost,
represents fixed costs, and
is the net investment. This formulation ensures that investment and operational decisions are jointly optimised across the planning horizon, implicitly prioritising efficient resource allocation and energy use within the system.
Generation and investment decisions are subject to capacity constraints and market-clearing conditions, formulated as complementarity conditions that guarantee non-negative production and investment aligned with the Nash–Cournot equilibrium.
The GTM is solved iteratively in coordination with the short-term optimal power and gas flow (OPGF) model. The solution algorithm, illustrated in
Figure 7, follows these steps:
Initialise system parameters and decision variables.
Run the GTM to determine optimal investment and generation decisions under strategic and complementarity constraints.
Use GTM outputs as input to the OPGF model to check short-term operational feasibility under technical network constraints.
Check convergence: the process iterates until the difference between successive energy mixes from the OPGF model and the GTM falls below a predefined tolerance, , i.e., .
If convergence is not met, feedback from the OPGF model (including capacity adjustments and operational feasibility) is used to update GTM decisions, and the process repeats.
Upon convergence, final metrics, including supply, demand, costs, and emissions, are computed, enabling assessment of system-wide efficiency for the analysed heating decarbonisation pathways.
In the GTM, stakeholders include electricity generators and operators of hydrogen-based technologies, who make investment and operational decisions while anticipating competitors’ actions. Strategic behaviour is captured using the Nash–Cournot equilibrium, where each stakeholder optimises their returns under capacity and market constraints. This explicitly reflects competitive interactions and investment trade-offs rather than assuming a centralised cost-minimisation planner, as in traditional cost-based approaches.
In this work, the GTM is applied at a high level to capture strategic interactions between electricity generators and hydrogen-based storage operators. Its purpose is not to develop new game-theoretic methodology but to maintain methodological consistency with prior work [
23] while informing feasible investment pathways and operational scenarios. Full reproducibility is ensured through openly available datasets and model scripts. The source codes for the GTM model are available at
https://github.com/MohamedAbuella/Heating_Decarb_NoT (accessed on 17 November 2025).
4. Results and Discussion
Table 3 and
Table 4 summarise the simulation results for heating pathways in 2035 and 2050, selected to represent a peak-demand day under contrasting CCS scenarios: 2035 without CCS deployment and 2050 with full CCS deployment.
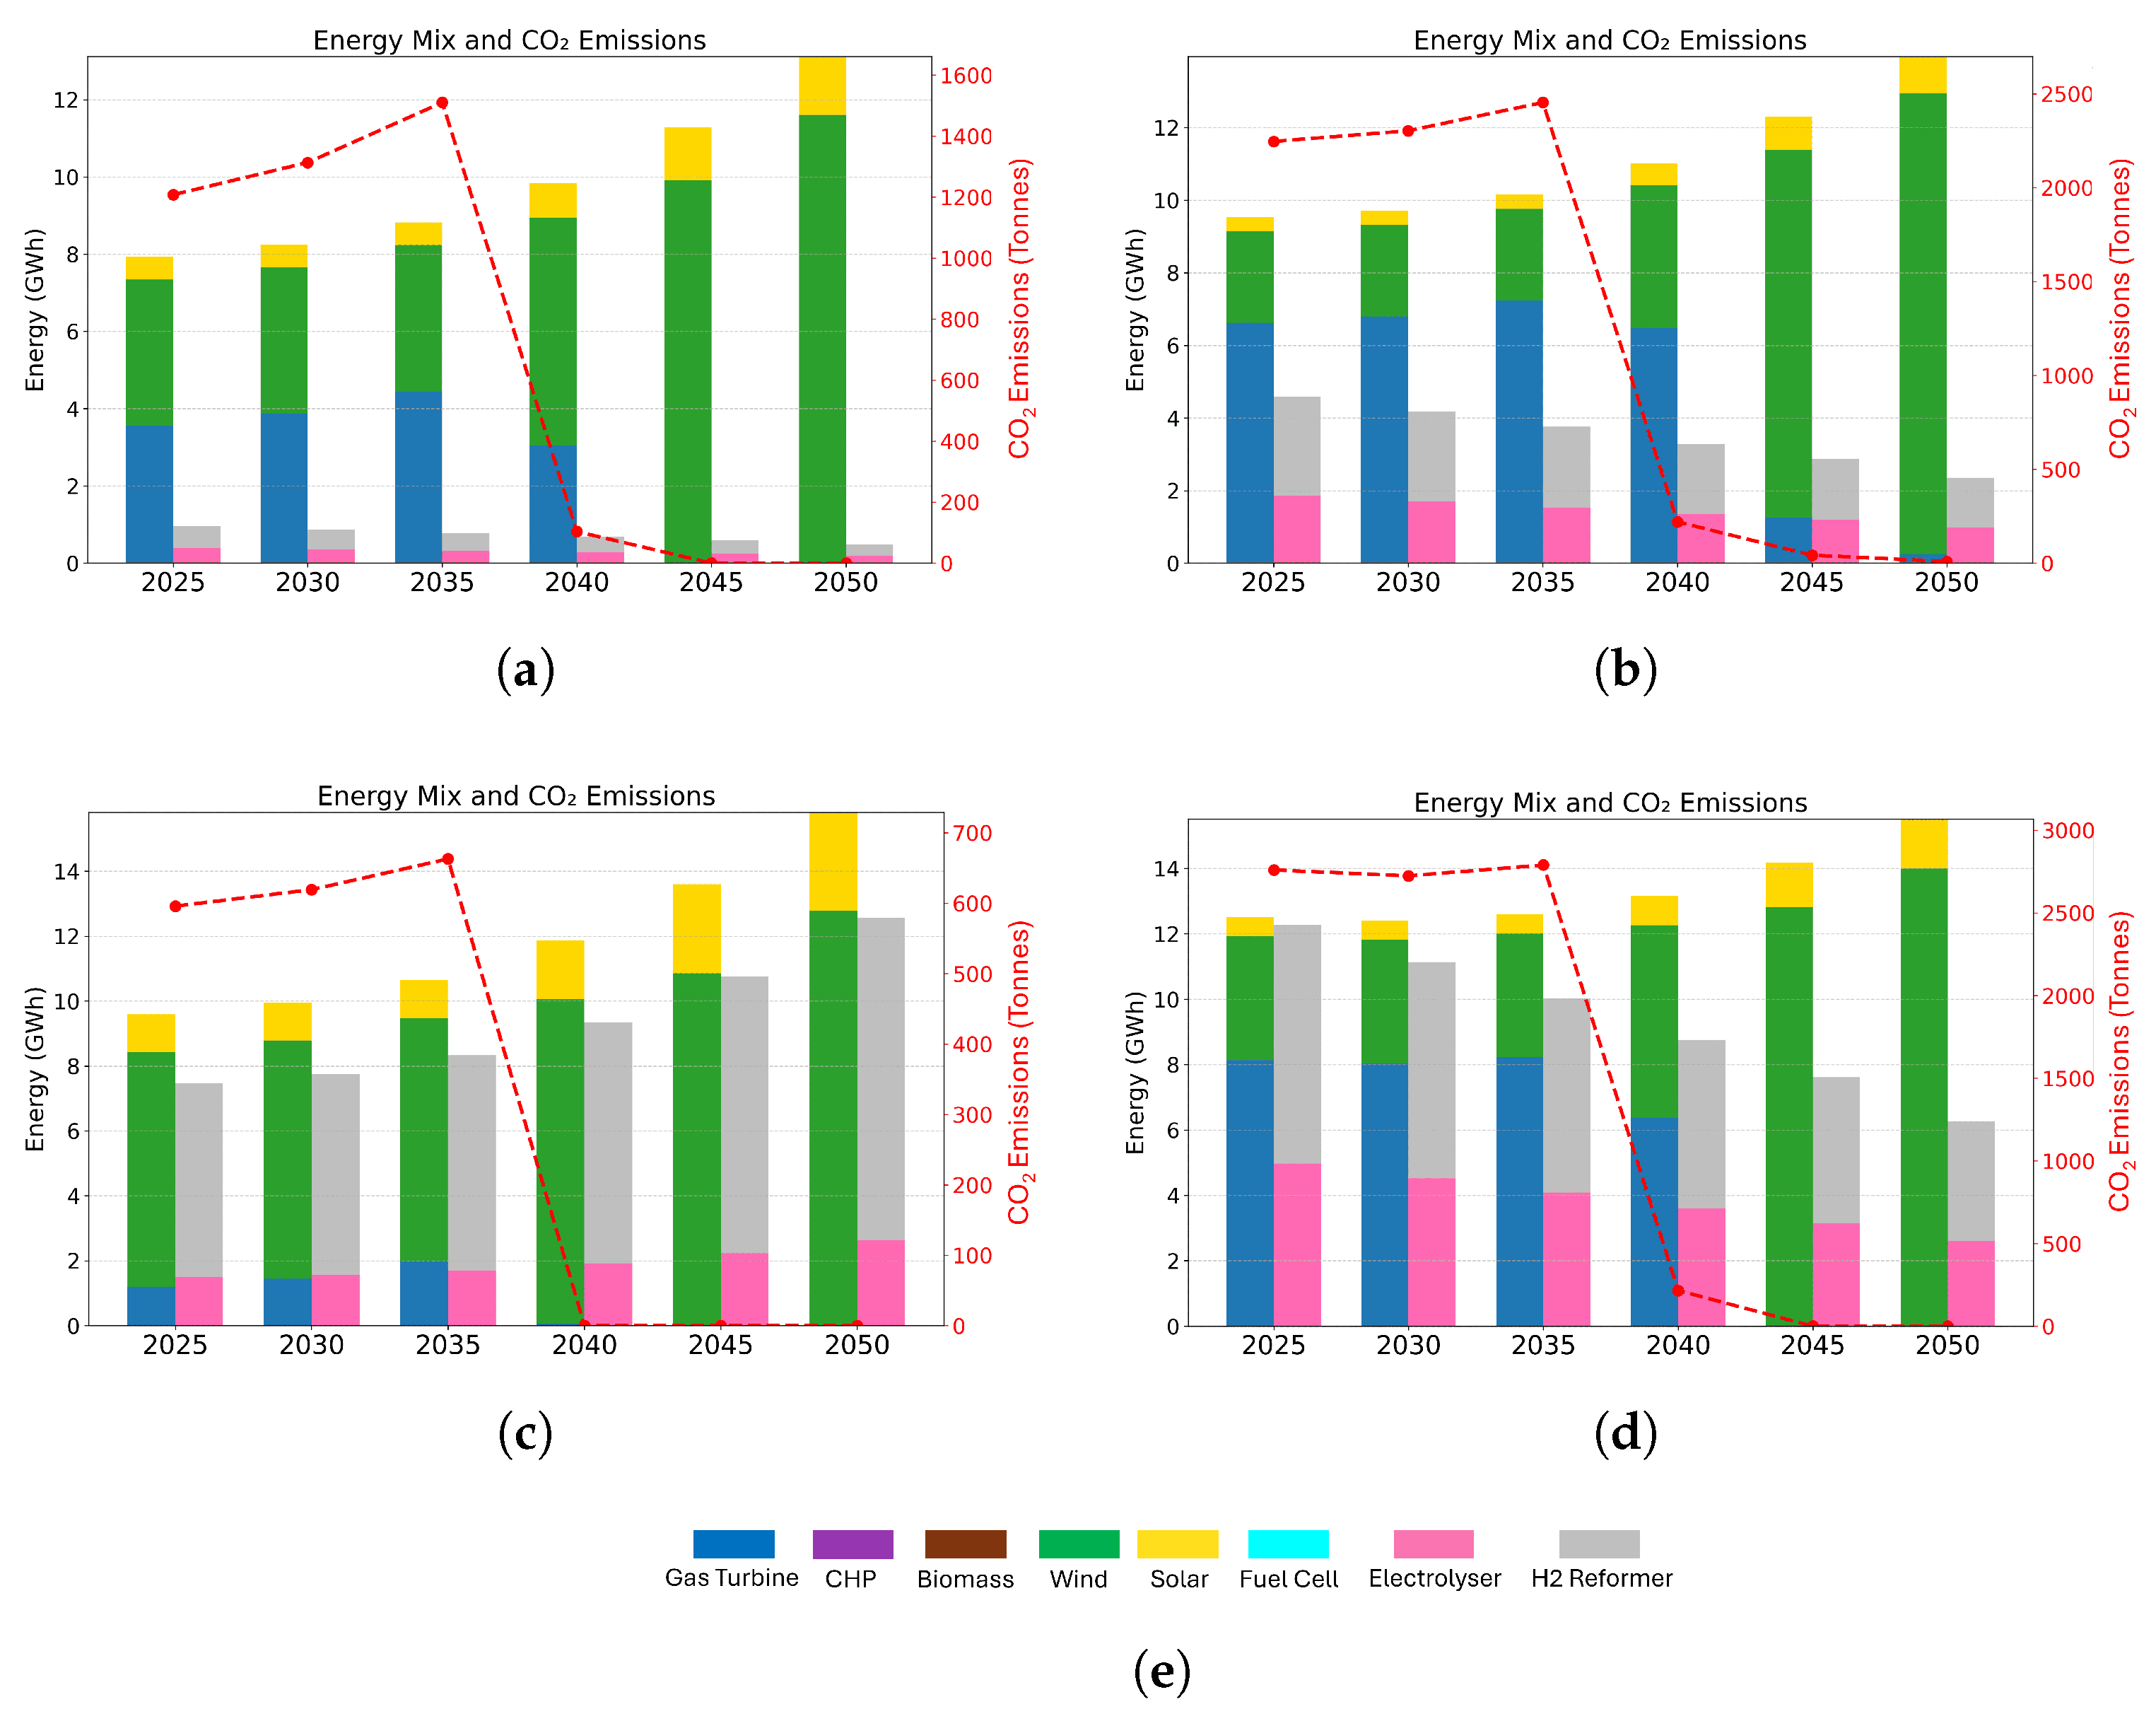
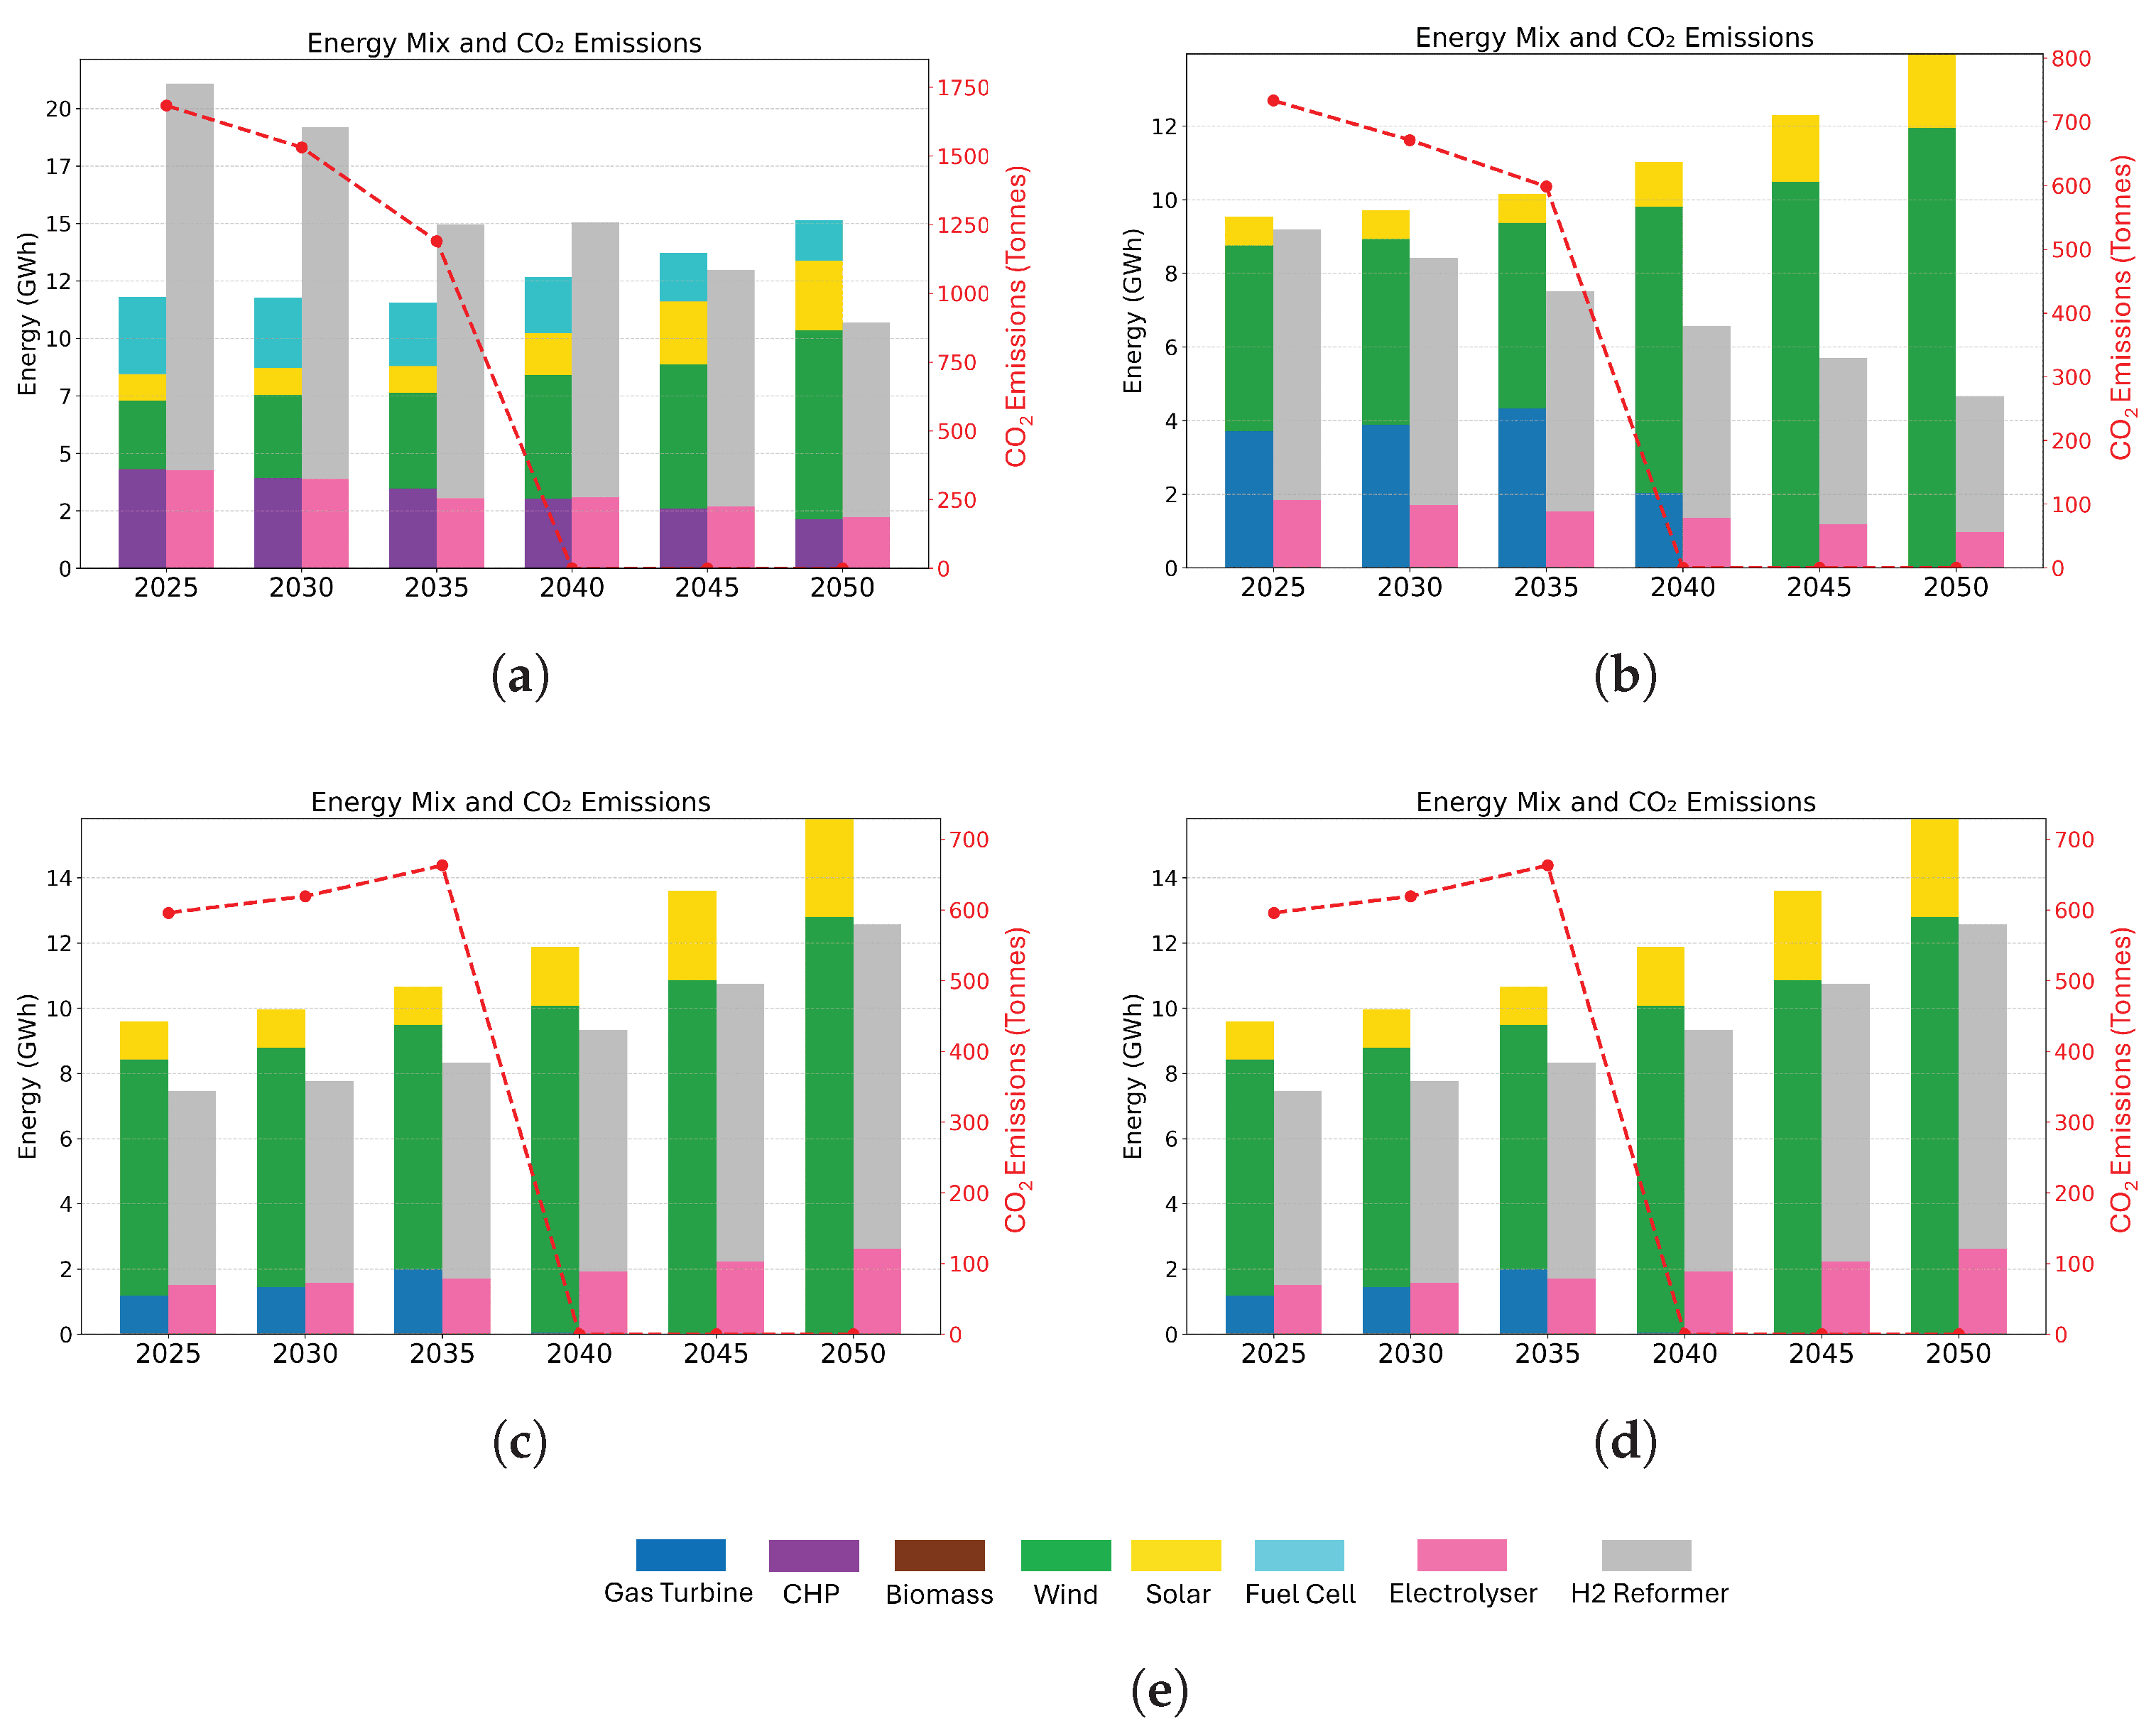
Figure 8 and
Figure 9 illustrate energy mixes and investment planning for extreme blending cases (0% and 100% hydrogen) on the peak day over six discrete years between 2025 and 2050.
In 2035, as shown in
Table 3, without CCS, all scenarios of heating and hydrogen blending retain residual CO
2 emissions due to fossil-fuel-based sources such as gas turbine (GT) operation and reformer-based hydrogen production. Heat pumps remain the most cost-effective option (GBP 0.76–0.80 million), with low emissions (1475–1553 tonnes) and high system-wide efficiency (102–107%), reflecting effective energy conversion. Hydrogen boilers are still the most expensive (GBP 1.92–2.81 million) and carbon-intensive (2578–2789 tonnes), with low efficiency (around 42%), while mixed pathways and STIs offer intermediate operational costs (GBP 0.80–1.52 million), representing a balance between affordability, emissions, and system-wide efficiency.
By 2050, with full CCS deployment and high renewable penetration, operational emissions are effectively eliminated across all scenarios. Heat pumps continue to provide the lowest operational costs (GBP 0.60–1.95 million) while achieving high system-wide efficiency (98–103%). STIs remain cost-competitive (GBP 0.64–2.03 million) and maintain maximum efficiency in the base case (100%), demonstrating the energy effectiveness of socio-technical measures. Mixed HP–HB pathways show moderate costs (GBP 0.82–1.10 million) with complete emissions abatement, maintaining 83% efficiency, whereas hydrogen boilers, although slightly cheaper than in 2035, remain relatively expensive (GBP 1.16–1.93 million) and less efficient (62–63%), reflecting the energy-intensive nature of hydrogen-only heating. Across all pathways, system-wide efficiency generally declines with increasing hydrogen-blending levels, owing to additional energy conversion between natural gas and hydrogen. Moreover, under 100% H2 blending, operational costs for the 50/50 HB–HP hybrid pathway are lower (GBP 1.10 million), while those for 100% HPs are higher (GBP 1.95 million), illustrating a case where hydrogen heating can be economically advantageous.
For clarity of interpretation,
Table 4 reports all emissions values, including those associated with the 100% hydrogen-boiler scenarios, explicitly as zero (0). No cells are left blank, as full CCS deployment yields an identical zero-emission outcome across all modelled cases.
However, under the 100% hydrogen-blending scenario, the 100% HP pathway shows a slightly higher operational cost (GBP 1.95 million) than both the hybrid HP–HB (GBP 1.10 million) and HB-only (GBP 1.93 million) cases. This outcome reflects the associated drop in system-wide efficiency under full decarbonisation, as well as the strong influence of electricity prices, which rise under full hydrogen deployment due to conversion inefficiencies in hydrogen-based power generation compared to the 0% hydrogen case. The hybrid HP–HB pathway benefits from operational flexibility, allowing it to achieve a balance between hydrogen and electricity use, thus resulting in lower overall costs. This finding highlights that while heat pumps remain the most energy-efficient option, their operational cost depends critically on the relative price dynamics between electricity and hydrogen in fully decarbonised systems.
Collectively, the results can be interpreted from multiple perspectives, reflecting the trade-offs between short-term operational costs, CO2 emissions, and system-wide efficiency. These aspects jointly provide insights for strategic planning of decarbonisation pathways under varying hydrogen-blending levels.
Energy-mix outcomes are shown in
Figure 8 (0% blending) and
Figure 9 (100% blending). Across all scenarios, wind and solar capacity expand substantially, reflecting their role as backbone technologies.
In the 0% hydrogen-blending case (
Figure 8), pathways diverge markedly by 2050. Heat pumps (c) require no hydrogen, achieving the lowest total demand (13 GWh) and representing the most efficient option. Hydrogen boilers (d) increase demand to 15 GWh and necessitate significant hydrogen production. Hybrid HP–HB pathways (b) occupy an intermediate position in terms of hydrogen use and overall demand, unlike the STI scenario (a), which maintains low hydrogen production.
In the 100% hydrogen-blending case (
Figure 9), total energy demand varies notably across pathways by 2050. The hybrid heat-pump–hydrogen-boiler (HP–HB) pathway achieves the lowest total demand (13 GWh), reflecting the benefits of combining efficient electrification with flexible hydrogen use. In contrast, the 100% heat-pump (HP) scenario exhibits the highest demand (15.5 GWh), primarily due to the large electricity requirements for heat generation. The 100% hydrogen-boiler (HB) and socio-technical intervention (STI) pathways show intermediate results: both require high hydrogen production, but overall demand remains lower than in the HP case owing to efficiency gains and demand-side measures.
By 2040, with full CCS deployment, direct CO2 emissions are effectively eliminated across all cases, although emissions persist beforehand from unabated fossil-fuel sources, particularly reformer-based hydrogen production.
The results demonstrate a robust transition towards a low-carbon energy system by 2050, primarily driven by the significant integration of renewable energy, including extensive deployment of CCS from 2040. While the overall decarbonisation trajectory is broadly consistent across different intervention strategies and hydrogen-blending levels, the 100% hydrogen scenarios require substantial investment in electrolysers and reformers, which, based on the NPV, appear likely to pay off in the long term, whereas heat pumps rely predominantly on direct grid electricity and remain the most efficient option in terms of operating costs and overall energy efficiency.
These investment planning outcomes reflect the strategic interactions captured by the GTM: each stakeholder’s capacity expansion and technology adoption decisions are influenced by competitor behaviour and market dynamics. Consequently, the GTM results go beyond conventional cost-optimisation, providing insights into how competitive decision-making shapes system-wide efficiency, hydrogen deployment, and decarbonisation pathways across the eight technology types represented in the energy mix (wind, solar, gas turbine, CHP, biomass, fuel cell, electrolyser, and hydrogen reformer).
Table 5 summarises the system-wide efficiency (
) of each heating pathway in 2050, calculated as the ratio of heat demand in the base case (STIs at H
2 blending 0%) to the total primary energy supplied in each scenario. This approach provides a normalised measure of how effectively each pathway converts supplied energy into useful heat, allowing direct comparison across technologies and hydrogen-blending levels.
The system-wide efficiency results in
Table 5 highlight distinct performance trends across heating pathways. The 100% heat-pump (HP) scenario achieves the highest efficiency under low hydrogen blending, reaching 103% at 0% H
2, owing to the high coefficient of performance (COP) of heat pumps. Its efficiency declines sharply under full hydrogen blending (48%), reflecting additional conversion losses and the electricity demand for hydrogen production.
The hybrid HP–HB configuration maintains moderate and stable efficiency across hydrogen levels, from 83% at 0% H2 to 73% at 100% H2, illustrating a balanced trade-off between electrification efficiency and hydrogen flexibility. Hydrogen-boiler (HB) systems consistently show the lowest efficiency, ranging from 63% at 0% H2 to 49% at 100% H2, limited by the thermodynamic efficiency of hydrogen combustion and cumulative conversion losses.
The socio-technical intervention (STI) pathway, used as the reference (100% at 0% H2), retains relatively high efficiency under partial hydrogen blending but falls to 53% under full hydrogen integration. Overall, these results highlight the higher system-wide efficiency of electrification-dominant pathways at low hydrogen-blending levels, alongside a marked decline in overall efficiency as hydrogen penetration increases.
To further examine the robustness of the modelling outcomes, a sensitivity analysis was conducted on the coefficient of performance (COP) of heat pumps under both 0% and 100% hydrogen-blending scenarios by 2050 with full CCS deployment, with COP values of 2, 3, and 4 to reflect potential operational and technological uncertainties in heat-pump performance, as shown in
Table 6.
Table 6 summarises the resulting changes in operational cost and system-wide efficiency under varying heat-pump coefficients of performance (COP = 2 − 4). The results show a consistent improvement in both metrics as COP increases. In particular, the all-heat-pump (HP) configuration demonstrates a substantial reduction in operational cost—from GBP 0.99 m to GBP 0.26 m at 0% H
2 and from GBP 3.06 m to GBP 0.78 m at 100% H
2, accompanied by a significant rise in system-wide efficiency (from 59% to 215% and from 27% to 104%, respectively). The hybrid HP–HB scenario also benefits moderately from higher COP values, while the hydrogen-boiler (HB)-only configuration remains largely unaffected. Interestingly, under 100% hydrogen blending, the 100% HP scenario transitions from the highest cost and lowest system-wide efficiency (GBP 3.06 m, Eff. = 27%) at COP = 2 to the lowest cost and highest system-wide efficiency (GBP 0.78 m, Eff. = 104%) at COP = 4, highlighting the critical influence of heat-pump performance on both system-wide efficiency and operational cost outcomes.
Overall, these findings highlight that while the system-wide benefits scale strongly with heat-pump performance, particularly under fully hydrogen-based operation, broader energy-system coordination remains key to achieving cost-effective decarbonisation of the North of Tyne energy system.
5. Conclusions
This study assessed hydrogen-based and alternative decarbonisation strategies for residential heating in the North of Tyne region from 2025 to 2050, considering operational costs, CO2 emissions, and system-wide efficiency.
By 2035, without CCS, all pathways retain residual CO2 emissions from unabated fossil-fuel sources such as gas turbines and reformer-based hydrogen production. Heat pumps remain the most cost-effective option (GBP 0.76–0.80 million), with low emissions (1475–1553 tonnes) and high system-wide efficiency (102–107%), reflecting effective energy conversion. Hydrogen boilers are the most expensive (GBP 1.92–2.81 million) and carbon-intensive (2578–2789 tonnes), with low efficiency (42%), while mixed pathways and socio-technical interventions (STIs) offer intermediate trade-offs between operational costs (GBP 0.80–1.52 million), emissions, and system-wide efficiency.
By 2050, with full CCS deployment and high renewable penetration, operational emissions are effectively eliminated across nearly all scenarios. Heat pumps continue to deliver the lowest operational costs (GBP 0.60–1.95 million) while achieving the highest system-wide efficiency (98–103%). STIs achieve moderate costs (GBP 0.64–2.03 million) and maintain maximum efficiency in the base case (100%), demonstrating the energy effectiveness of demand-side and socio-technical measures. Hybrid HP–HB pathways are moderately priced (GBP 0.82–1.10 million) and maintain moderate efficiency (73–83%), whereas hydrogen boilers remain the most expensive (GBP 1.16–1.93 million) and less efficient (62–63%), reflecting the energy-intensive nature of hydrogen heating. Notably, under 100% H2 blending, operational costs for the 50/50 HB–HP hybrid are lower (GBP 1.10 million), while those for 100% HPs are higher (GBP 1.95 million), highlighting a situation in which hydrogen heating could be advantageous in terms of OpEx.
The system-wide efficiency results emphasise that electrification-dominant pathways, particularly heat pumps, deliver the highest useful heat per unit of input energy. Hydrogen integration, while providing flexibility, reduces overall efficiency compared to natural gas due to additional conversion, storage, and utilisation steps. Hybrid and socio-technical pathways achieve intermediate efficiency, reflecting trade-offs between technology choice and energy conversion losses. Even with extensive heat-pump deployment, increasing hydrogen penetration imposes a measurable efficiency penalty.
Our findings have direct relevance for current UK policy frameworks, including the Heat and Buildings Strategy and Hydrogen Strategy, by emphasising the need to prioritise electrification and targeted hydrogen deployment in regions such as the North of Tyne. The socio-technical interventions analysed here could be practically advanced through retrofit incentives, public engagement, and local energy education programmes to strengthen behavioural change and improve technology adoption.
Overall, the findings highlight that a resilient, low-carbon heating future relies on a combination of demand reduction, large-scale electrification via heat pumps, CCS, and renewable energy deployment, with hydrogen serving as a complementary option to enhance system flexibility while balancing efficiency and operational cost.
Strategically speaking, hydrogen should be seen as a pathway that complements rather than dominates the regional heating transition. While laying the groundwork for the integration of hydrogen and CCS after 2040, the immediate focus should continue to be on speeding up electrification and demand-side management. Hydrogen can play vital roles in balancing the power system and decarbonising the heating sector as renewable capacity grows and electrolysis costs decrease. The promotion of hydrogen in the North of Tyne ultimately necessitates concerted efforts in the fields of technology, economics, and policy, connecting green hydrogen production, electrification, and carbon capture within a comprehensive whole-energy framework.
While this study provides valuable insights for the North of Tyne region, several limitations should be acknowledged. The analysis is region-specific, and assumptions regarding future technology costs, socio-technical intervention effectiveness, and stakeholder acceptance may limit the generalisability of the findings. Moreover, alternative thermal engineering solutions, such as solar and biogas hybrid heating systems with integrated heat storage, were outside the scope of this study but represent relevant decarbonisation pathways for future investigation. Consequently, although the results are directly applicable to UK policy and regional planning, broader applicability requires comparative studies across different regions and heating technologies.
The Monte Carlo simulation adopted in this study provides a partial, quantitative representation of household-level demand uncertainty for a representative day within the STI scenario rather than a fully stochastic analysis of the 2025–2050 pathways. This approach is therefore limited in capturing broader adoption uncertainty and long-term behavioural variability. Ongoing work involves collecting expert survey responses from regional stakeholders to perform a qualitative scenario analysis of progressive, technological, policy, and net-zero-target futures, which will serve as a complementary and more comprehensive approach to the Monte Carlo simulation in future research.
