1. Introduction
The decarbonization of the building stock by 2050 represents one of the most ambitious challenges set by the European Union within the framework of the Green Deal. Achieving this objective requires a profound transformation of energy systems, still largely dependent on fossil fuels, with wide-ranging economic and social implications. Within this transition, energy poverty (EP) emerges as a central barrier: households living in inefficient dwellings and struggling to afford energy costs risk being excluded from a fair and inclusive energy transition [
1,
2,
3].
In 2022, more than 41 million European citizens reported being unable to keep their homes adequately warm [
4], with direct consequences for well-being, health, and social inclusion. EP is commonly defined as “the inability to access adequate energy services” [
5,
6] and is recognized as a complex and multidimensional condition, resulting from the interaction of insufficient household income, high energy expenditures, and poor efficiency of buildings and technical systems. Additional factors such as housing precarity, unemployment, health problems, or the presence of dependent children and elderly people can further exacerbate household vulnerability [
7,
8].
1.1. Legislative Framework and Policy Initiatives
The issue of EP was first introduced into the European regulatory framework with Directive 2009/72/EC, which incorporated the concept into energy policies. Since then, the European Union has progressively reinforced its attention to this phenomenon, recognizing its social and structural implications. With the Energy Efficiency Directive 2012/27/EU [
9] and the Energy Performance of Buildings Directive (EPBD) 2018/844/EU [
10], the reduction in EP was explicitly linked to building renovation policies, promoting measures to improve the performance of the existing building stock [
11].
A major step forward is represented by the recent recast of the EPBD (Directive 2023/2407) [
12], adopted in March 2024, which requires Member States to implement specific instruments to address EP. These include transparent monitoring systems, targeted incentives for the worst-performing buildings, and financial support for vulnerable households. The focus is therefore not only on improving energy efficiency, but also on ensuring a just transition, acknowledging that many households lack the financial capacity to cover upfront renovation costs and cannot fully benefit from tax deduction mechanisms [
13,
14,
15].
Despite this regulatory progress, EP remains widespread, with particularly high incidence in some countries: Bulgaria (27%), Lithuania (23%), and Greece (17%) [
4]. In Italy, the National Observatory on EP estimated that by the end of 2021 the phenomenon affected 2.2 million households (8.5% of the total), a percentage that further increased in 2022 due to rising energy prices [
16].
Similar socio-technical dynamics have also been observed in non-European contexts, where energy poverty and energy deprivation are increasingly framed within broader debates on energy justice and housing inequality [
17,
18].
Policy responses among Member States have been heterogeneous, partly due to the absence of a shared definition [
19]. The most common instrument used to fight EP is direct subsidies to households, which is considered a temporary measure [
20]. Alongside these, more structural incentives have been introduced, which allow households to recover part of the energy renovation costs over the years [
21]. Nevertheless, these measures are often not fully accessible to low-income households, given the need to anticipate expenses.
Overall, while such policies provide immediate relief and stimulate long-term investments, they often do not allow a precise identification of the most vulnerable households, nor a full understanding of the mechanisms driving EP. This suggests the importance of developing robust measurement methods capable of analyzing EP at a finer scale, thereby supporting more targeted and effective policy interventions.
At EU level, several dedicated initiatives have been launched to support the identification and mitigation of energy poverty, including Horizon 2020 projects focusing on monitoring and policy design. A notable example is the ENPOR project (“Actions to Mitigate Energy Poverty in the Private Rented Sector”) [
22], which develops guidelines, support schemes and an Energy Poverty Dashboard to identify and address energy poverty in the private rented sector across seven Member States. However, these initiatives mainly operate at program and territorial level and do not provide a standardized, field-based diagnostic framework at the scale of individual buildings. This reinforces the need for operational micro-scale methodologies, such as the one proposed in this paper, which can generate building-level evidence to complement EU monitoring tools.
1.2. Literature Framework and Measurement Insights
The lack of uniformity among European countries, both in the definition of EP and in the strategies adopted to address it, reflects country-specific socio-economic conditions and policy priorities [
23]. This heterogeneity is also evident in the scientific literature [
24]. Early studies mainly focused on quantifying the diffusion of the phenomenon, with particular attention to the share of energy expenditure in household income or to the inability to meet basic energy needs due to supply constraints. A fundamental contribution in this regard is that of Boardman (1991), who defined EP as the condition in which a household spends more than 10% of its income on energy bills [
25]. This indicator, still widely used today, represented a turning point in the debate by explicitly linking energy issues with social welfare.
Over the past three decades, the debate has broadened across multiple disciplines, generating a wide range of definitions that reflect economic, sociological, and technical perspectives [
23,
26]. Some studies have proposed methods and indicators to measure the incidence of EP [
27], while others have focused on the socio-demographic characteristics of affected households, thereby contributing to a more articulated understanding of the issue [
28].
To provide a clearer analytical structure, the existing literature on energy poverty can be broadly grouped into two main scales of analysis. Macro-scale approaches rely on national and European datasets (EU-SILC, Eurostat, ARERA), enabling territorial comparisons and long-term monitoring. Micro-scale approaches, by contrast, are based on direct field data as household surveys, interviews, utility bills and building inspections, and allow for a detailed socio-technical understanding at the dwelling level. The review presented below follows this macro–micro distinction.
Macro-scale approaches have been widely used to produce urban or regional maps of energy vulnerability [
29,
30,
31]. A notable example is the study of Bologna [
32], which combined EUROSTAT data, municipal EPC records, and information from the Italian regulatory authority (ARERA) to identify the most vulnerable areas.
More recently, Desvallées [
33] and colleagues have demonstrated how geospatial mapping techniques, when based on household- and neighborhood-level data, can effectively support policy planning. However, when only aggregated data are available, it becomes difficult to identify the specific households experiencing EP.
Micro-scale approaches, by contrast, are based on the direct collection of data through questionnaires, interviews, and building surveys [
6,
33,
34,
35]. This perspective allows researchers to capture the interplay between technical, economic, and social factors, providing a more detailed representation of household conditions. Several contributions have demonstrated that the building scale is particularly suitable for integrating socio-economic conditions with the physical and energy characteristics of dwellings [
36].
For instance, Grdenić et al. [
37] analyzed 102 households in Croatia, showing how combining socio-economic and technical data enables the identification of targeted solutions; while Fabbri and Camboni [
30,
32] highlighted, in the case of social housing, how building inefficiencies directly affect vulnerability and how renovation strategies must be aligned with residents’ needs.
Other authors have experimented with multidimensional approaches. At the European level, Menyhért showed that the use of different indicators (10% threshold, LIHC, subjective measures) [
38] leads to the identification of different vulnerable groups, thereby underlining the challenges of comparability across contexts.
A recurring issue thus concerns not only the lack of consistency across methodologies, but also the heterogeneity of measurement criteria, which can lead to divergent and difficult-to-compare results [
39]. In this context, datasets derived from national statistical surveys, while useful for territorial comparisons, often provide an overly approximate representation of EP. An alternative is offered by building-scale surveys, which, through questionnaires, interviews, and technical assessments, make it possible to collect more detailed information, closer to the actual living conditions of households.
Although micro data cannot fully replace large-scale statistical analyses, they provide an essential contribution by highlighting their limitations and suggesting measurements more closely aligned with everyday reality. From this perspective, direct surveys should not be considered as an isolated approach, but as a complementary and potentially more effective tool to support targeted policies and intervention strategies that are genuinely responsive to the needs of households.
Within this macro–micro landscape, the present study adopts a micro-scale perspective, relying on detailed household-level data that cannot be captured through aggregated statistical indicators.
1.3. The Role of Building Quality in EP
Several studies have shown that the physical characteristics of buildings, and, in particular, the performance of the building envelope, have a significant impact on the risk of EP. Dwellings with poor insulation or inadequate energy performance lead to higher energy consumption and costs, which are often unsustainable for households and exacerbate situations of social vulnerability.
A number of authors have underlined that the inefficiency of the existing building stock is one of the main structural drivers of EP in Europe [
40]. In particular, buildings constructed before the introduction of thermal performance regulations are characterized by high levels of heat loss, making it difficult to ensure minimum comfort conditions without excessive expenditure.
Fabbri et al. (2023) [
41], analyzing a social housing complex in Italy, demonstrated that progressively increasing the insulated surface of the building envelope results in a marked reduction in heating demand and, consequently, of EP risk, although with different effects between winter and summer seasons. Gradual renovation scenarios can represent a realistic strategy for the existing building stock, especially in social housing contexts where resources are limited and interventions must minimize disruption for residents.
Empirical evidence from various European countries further confirms that inadequate housing conditions, such as small dwellings, dampness, thermal dispersion, and poor construction quality, are strongly correlated with higher levels of EP. This indicates that tackling EP requires not only income support measures but also structural interventions to improve housing conditions.
From this perspective, the joint assessment of households’ socio-economic characteristics and the technical quality of buildings, as proposed in this study, is essential to develop targeted intervention strategies that are both effective and socially equitable.
1.4. Objectives and Contributions of the Research
As discussed above, the building scale represents a meaningful level of analysis where the technical characteristics of dwellings and the socio-economic conditions of households converge. This research builds on this perspective by proposing a building-scale approach to measuring EP, based on the direct collection of field data. The methodology is explicitly conceived as a micro-scale approach, relying on surveys, interviews, utility bills and technical inspections carried out directly at household and dwelling level. This fine-grained evidence enables an analysis of socio-technical mechanisms that remain invisible in macro-scale indicators.
The innovative aspect lies in the systematic integration of technical, energy, and socio-economic information, which enables a close examination of how building features and household conditions interact in shaping vulnerability.
The case study is located in Turin (Piedmont, Italy) and concerns a representative early 20th-century private multi-family building. Within this context, socio-economic, technical, and energy information was systematically collected through surveys, interviews, and documentary research. This dataset enables the assessment of EP incidence and the identification of the main factors influencing vulnerability, while also providing a concrete basis for developing potential intervention scenarios.
The main contributions of the research can be summarized as follows:
Methodological: presentation of a building-scale approach capable of integrating technical, energy, and socio-economic dimensions within a single interpretative framework.
Empirical–applicative: analysis of a residential building representative of the historic housing stock found in many European cities, offering insights into the relationship between building quality and energy vulnerability.
Operational: demonstration of how field data can be directly translated into actionable intervention strategies, linking building renovation options with the actual conditions and needs of residents.
From this perspective, the study contributes to bridging the gap between analysis and action, providing tools to support more targeted and effective policies for reducing EP.
2. Materials and Methods
2.1. Methodological Framework
The methodology adopted in this study relies on a direct field approach aimed at collecting reliable and multidimensional data on EP at the building scale. It integrates information on the architectural and physical features of dwellings, household energy consumption and technical systems, together with socio-economic characteristics such as family composition, income, and household size.
The methodological process was structured into six main phases:
Case study identification and selection;
Household survey and utility bills collection (combining socio-economic, behavioral, and technical information);
Reconstruction of household energy balance;
Definition and Calculation of EP Indicator (using the Boardman 10% threshold);
Indicators and calculation procedure;
Identification of potential mitigation strategies.
This stepwise organization ensures clarity and replicability, making the methodology adaptable to different contexts and building stocks.
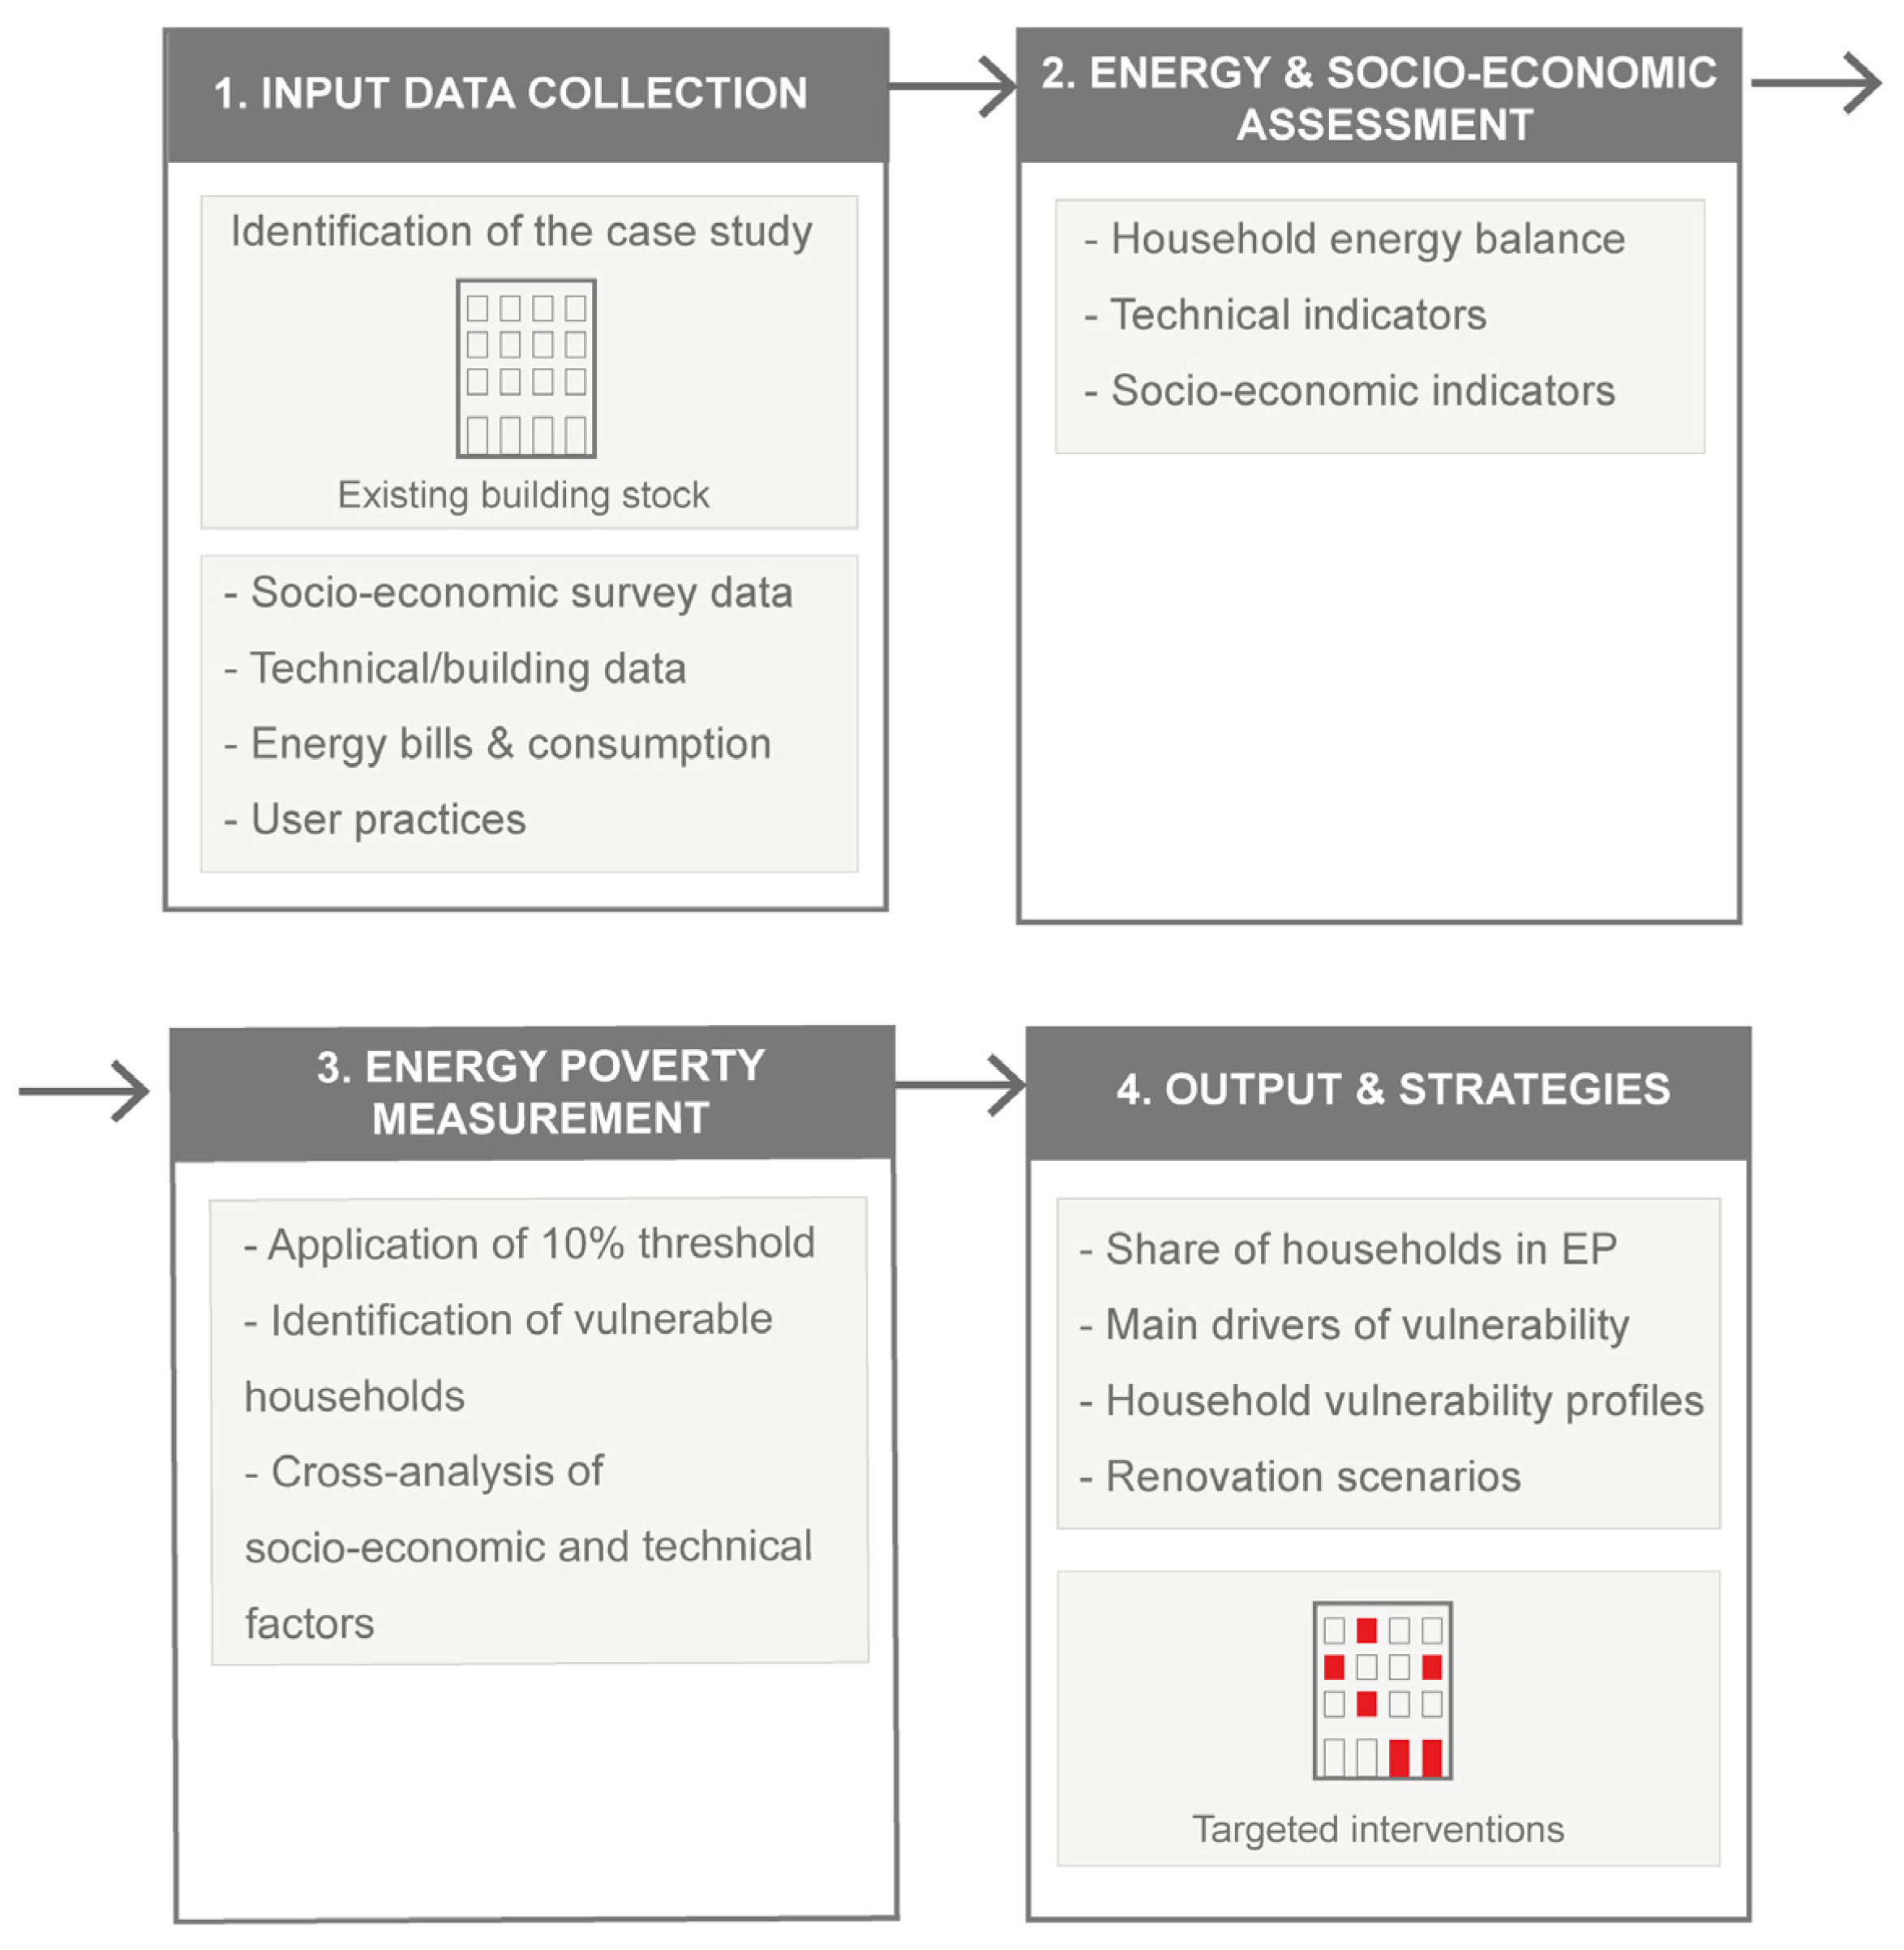
The overall process is illustrated in
Figure 1, which summarizes the input data, the assessment phases, the EP measurement, and the resulting output strategies.
Some limitations should be acknowledged. The method relies on the active cooperation of households and on the availability of socio-economic and energy data. Missing information (e.g., incomplete meter readings or unavailable criteria for heat cost allocation) and uneven participation may reduce completeness. Nevertheless, even under partial participation, the methodology demonstrated robustness and feasibility, generating datasets suitable for both targeted interventions and comparative research.
Overall, the methodology has a twofold value: it enables the identification of practical and targeted strategies by linking consumption profiles with socio-economic vulnerability, while at the same time producing micro-scale datasets that can complement and validate national or regional statistics, thus enhancing the transferability of results. It should also be emphasized that the methodology was primarily conceived for application in the private residential sector. In the case of public housing, the approach could be replicated; however, the interaction with public authorities may affect data collection processes. Specifically, certain information, such as original design documents, historical records, and consumption data, may be more readily available due to the existence of institutional archives, thereby potentially facilitating the implementation of the method.
2.2. Case Study Identification and Selection
The identification of a suitable case study represents an essential step, as it directly influences both the methodological approach and the type of results obtained. Two main criteria were adopted for the selection process. The first criteria concerned the representativeness of the building stock. Since a large share of the European residential heritage was constructed before the introduction of energy efficiency regulations, it was considered essential to focus on a building that could reflect these characteristics. According to national statistics, more than 70% of the housing stock in Italy was built before 1980 and approximately 25% before 1945 [
42]. Before any regulatory requirements on thermal performance were established. The choice of an early 20th-century multi-family building therefore ensured that the analysis would be relevant for a wide segment of the national context.
The second criterion related to the feasibility of data collection. The methodology relies on the active cooperation of residents, who are required to provide both socio-economic and energy-related information. Previous field-based studies on EP have shown that successful data collection is strongly conditioned by local trust and willingness to collaborate, sometimes supported by institutional actors [
43]. For this reason, particular attention was given to selecting a case where such cooperation was achievable. While participation can remain uneven, leading to potential gaps or inconsistencies in the dataset, this approach allows for the acquisition of detailed information that would otherwise be unattainable through purely statistical or indirect methods.
2.3. Household Survey and Utilitybills Collection
Household data were collected through semi-structured questionnaires and interviews, administered directly to at least one member of each family. The survey design was informed by previous research on EP [
27,
37,
43] and articulated into three thematic sections:
Energy use: Past electricity and gas consumption, heating and cooling practices, appliance stock, and operating habits.
Perceptions of the energy crisis: Household awareness of rising energy expenditure and behavioral strategies adopted to reduce consumption.
Socio-economic data: Household composition, education, employment status, monthly income, and arrears in energy bill payments.
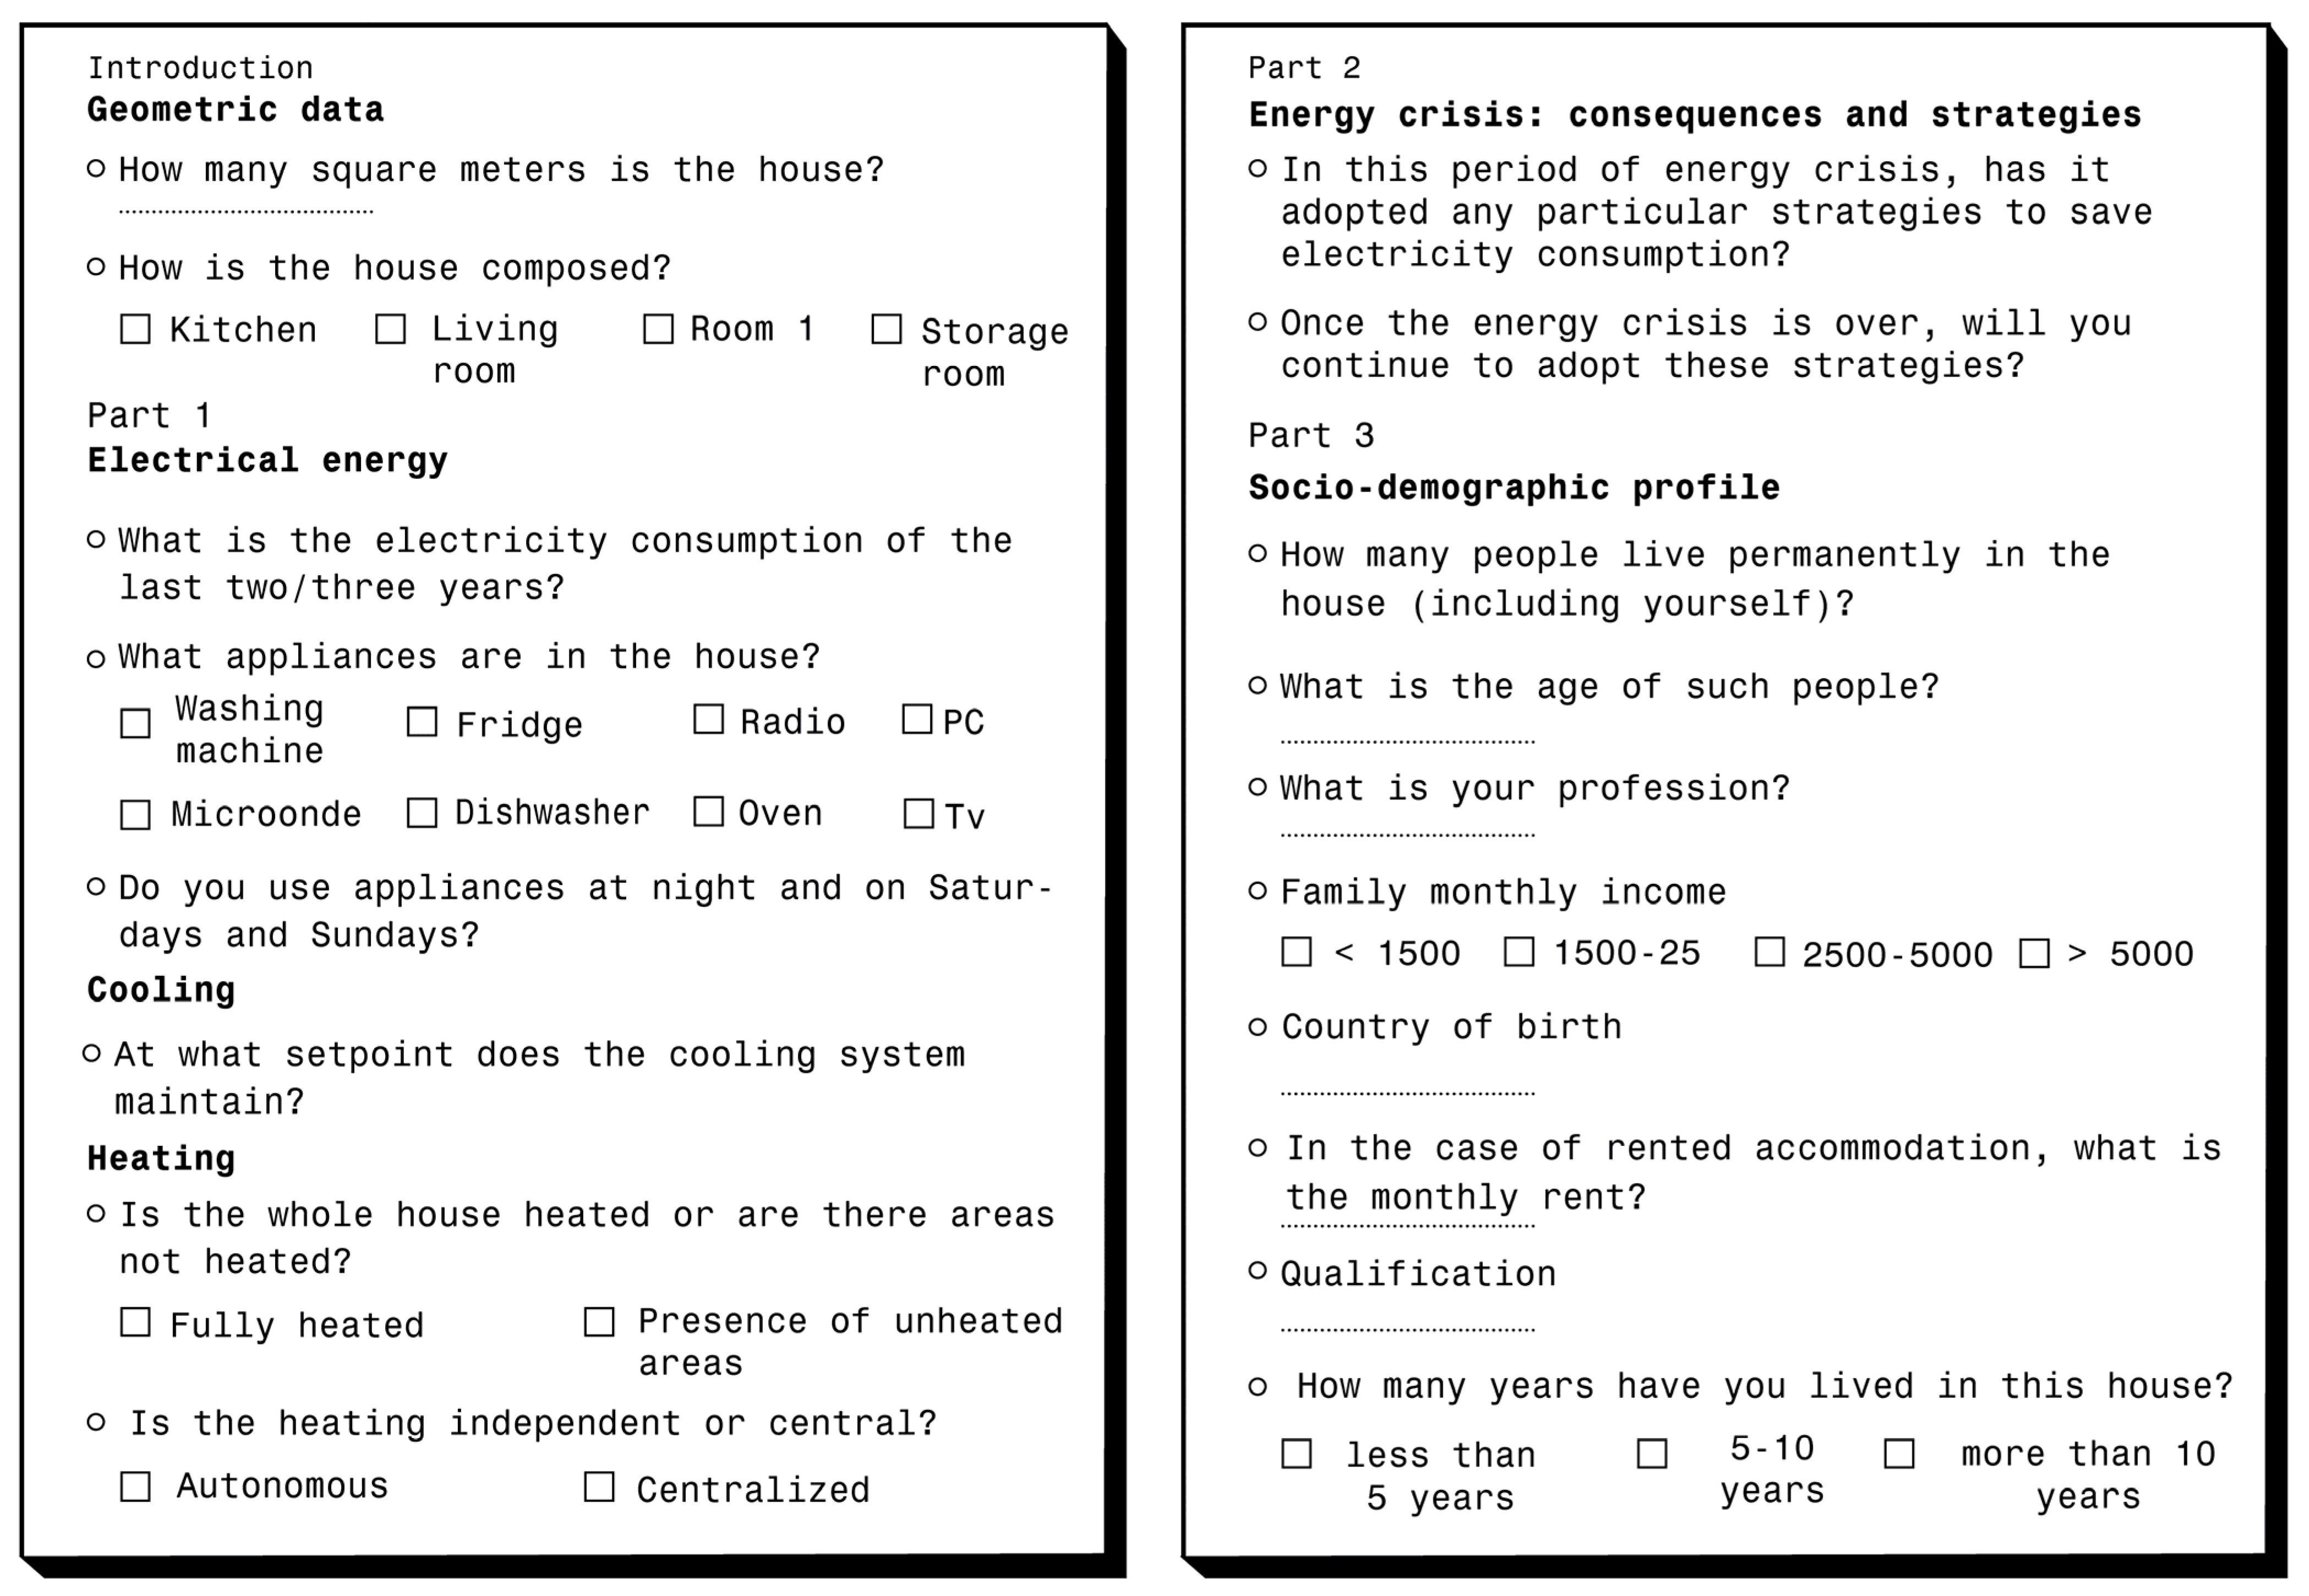
The questionnaire, developed at the FULL Laboratory of the Polytechnic of Turin, consisted of about 130 questions and combined closed and open-ended items, ensuring comparability across households while allowing for additional qualitative insights. Each session lasted 20–35 min and included the collection of utility bills. An extract of the questionnaire structure is provided in
Figure 2, illustrating the comprehensiveness of the survey design.
Utility bills served as the primary source of quantitative data on household energy use, providing annual values of consumption and associated costs. These were cross-checked and complemented with questionnaire responses to identify installed systems (heating, cooling, and domestic hot water) and their patterns of use. Special attention was devoted to appliances: respondents provided details on type, efficiency class, and operating hours, which allowed electricity demand to be estimated in a way that reflected actual household behavior rather than relying solely on standardized assumptions.
This integration of survey information and bills provided a coherent dataset for reconstructing household energy balances. This approach made it possible to distinguish the contributions of different energy carriers:
gas for heating, cooking, and hot water;
electricity for appliances and lighting.
In cases where electricity was used for cooking or hot water, these components were isolated to avoid distortions in the allocation of end uses.
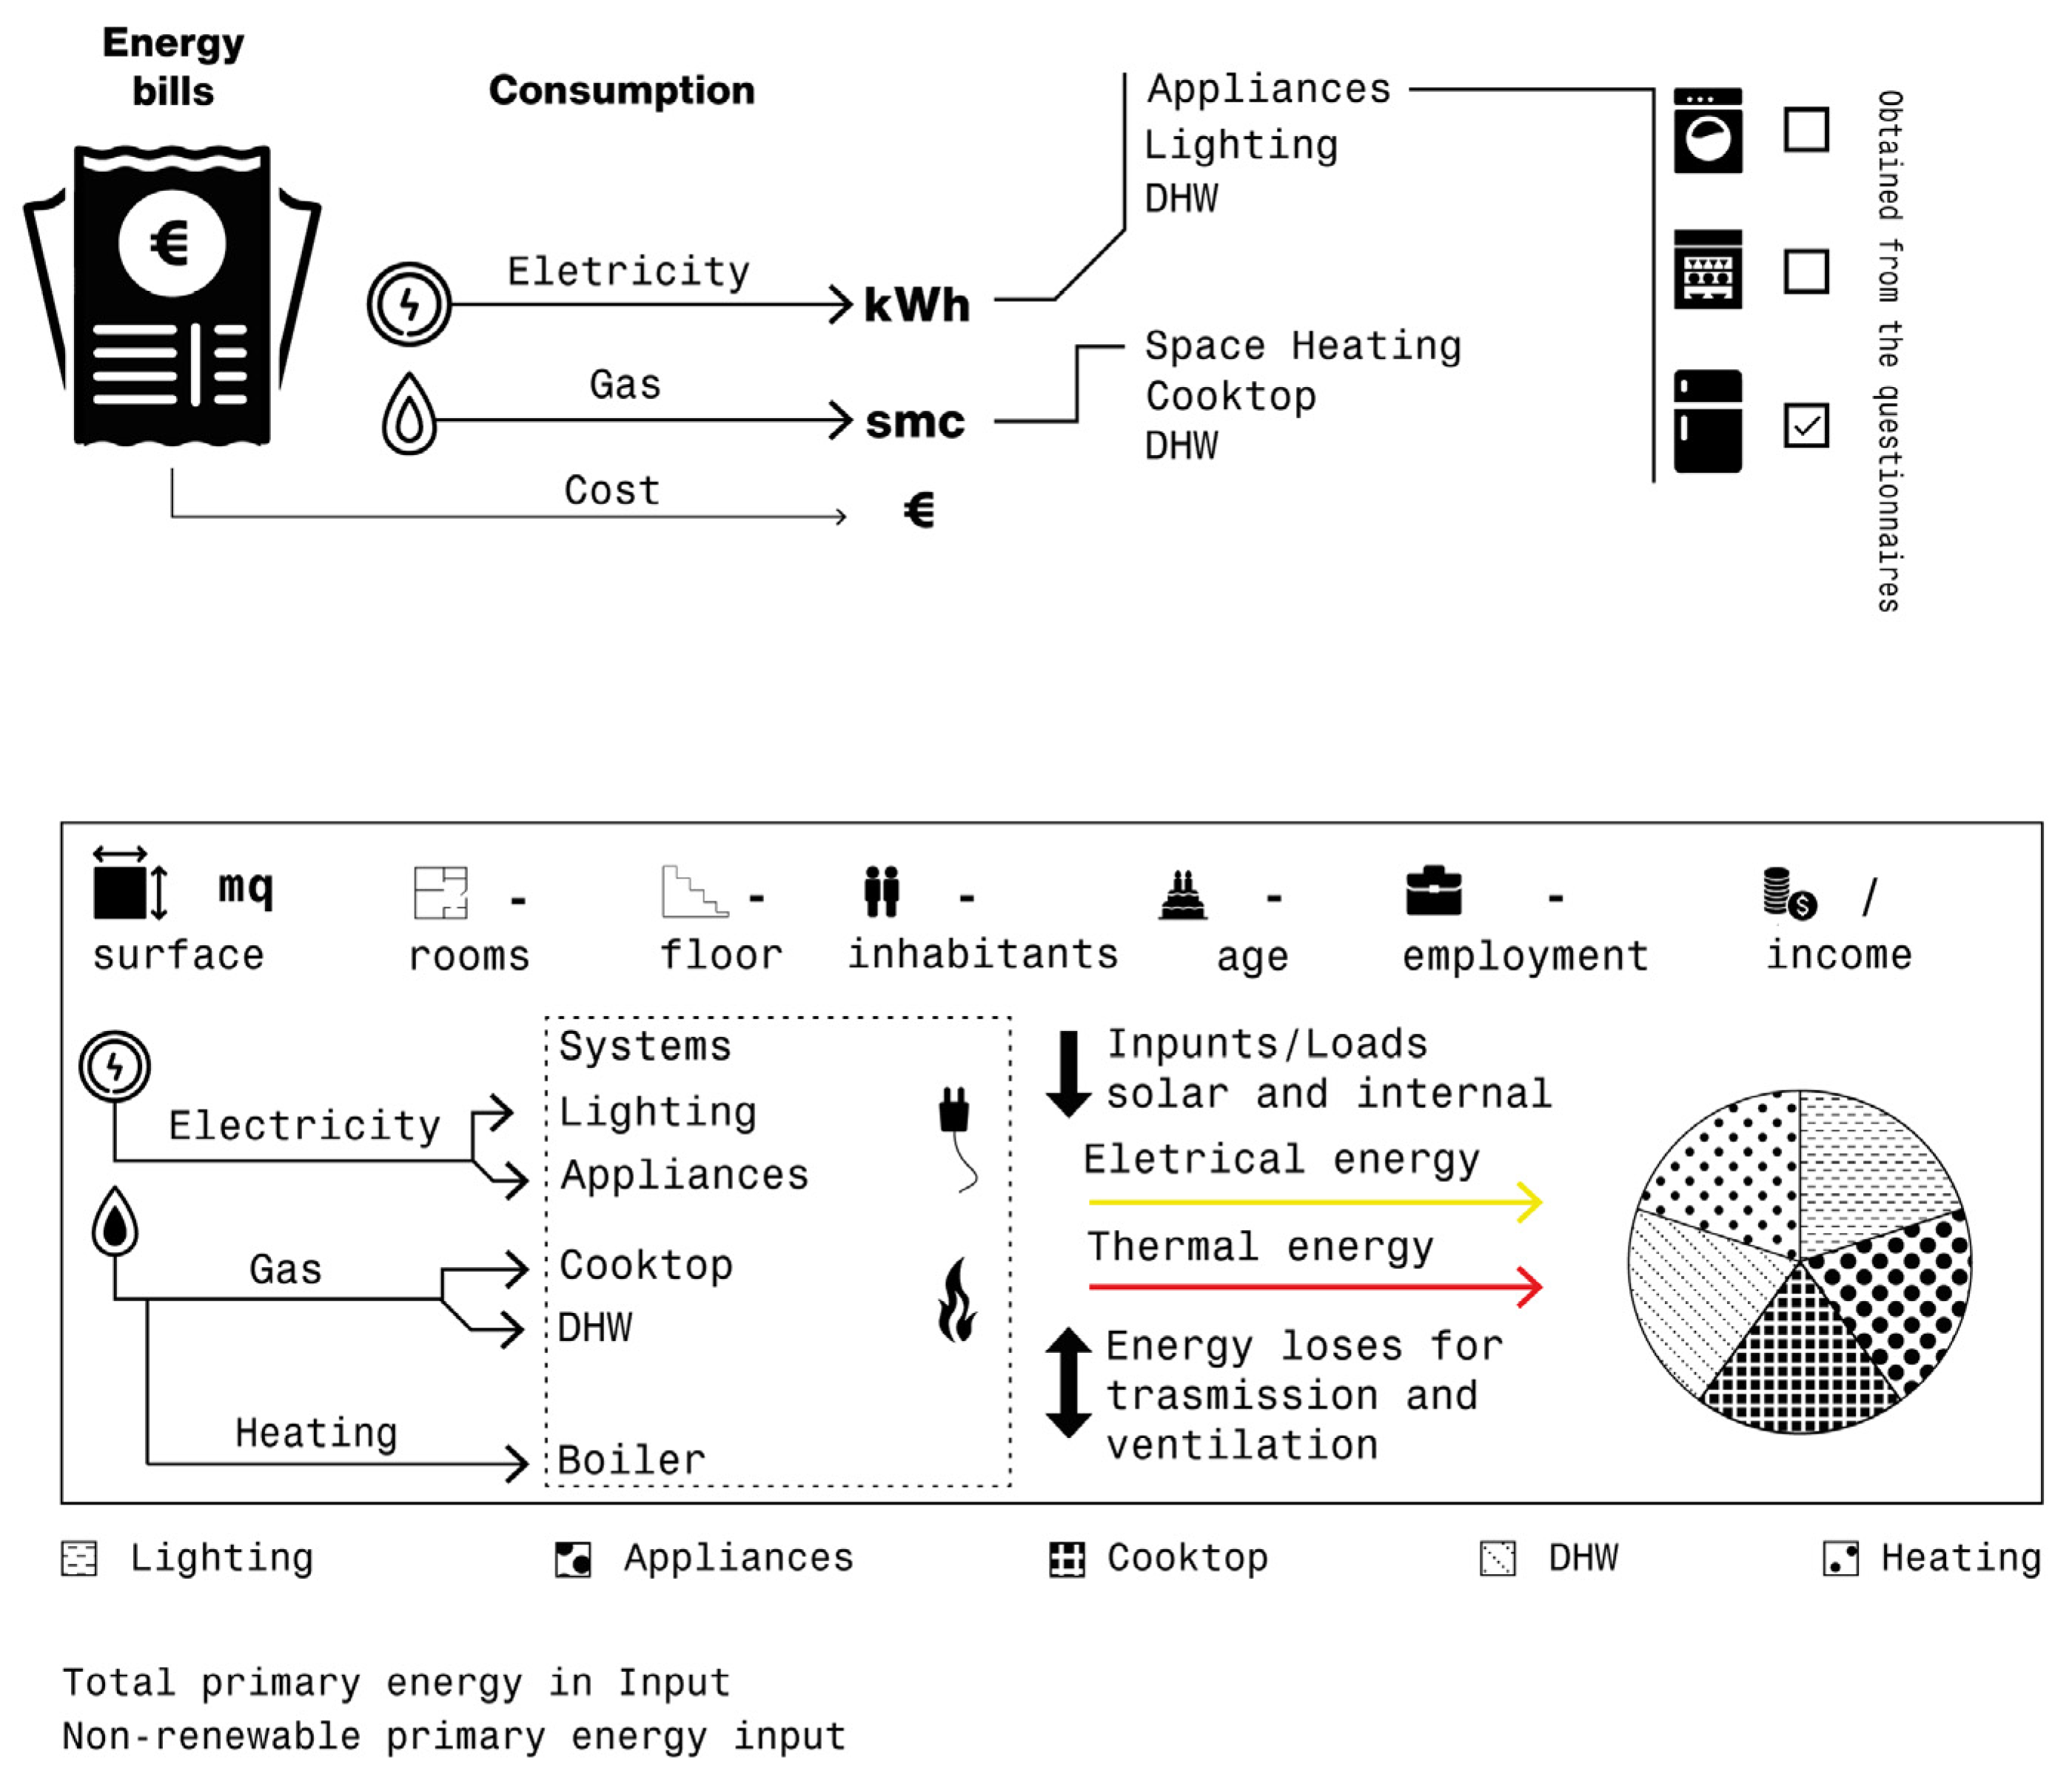
Figure 3 illustrates the framework for household energy balance, highlighting the flow from energy carriers to end uses.
2.4. Energy Balance Reconstruction
Household energy balances were reconstructed by combining bill-derived consumption values with the efficiencies of technical systems, thus estimating delivered energy for each end use.
Electricity demand associated with appliances was refined using the additional appliance data (type, efficiency, and daily use). In households with induction cooking or electric water heating, these loads were calculated separately to ensure correct allocation. This step provided a comprehensive overview of household consumption profiles, linking technical system performance with behavioral and socio-economic factors.
2.5. Definition and Calculation of EP Indicator
Once all data had been collected, the analysis phase was carried out to measure EP. This study applied the indicator proposed by Boardman [
25], which defines a household as being in EP if it spends more than 10% of its income on energy services, including costs for space heating, domestic hot water, lighting, appliances, and cooking. To apply this threshold, both household income and total energy-related expenditures were required. This is a widely used indicator in international literature, offering a clear and comparable benchmark, although it does not capture all dimensions of the phenomenon.
It should be acknowledged that, while the Boardman threshold remains a robust and historically significant reference, it only reflects the share of energy expenditure relative to household income. As such, it does not account for other dimensions of EP, such as thermal comfort, arrears on energy bills, or non-monetary forms of deprivation.
Nevertheless, the comprehensive design of the questionnaire, which collected information on household perceptions, payment arrears, and comfort levels, provides the potential to construct additional multidimensional indicators of EP. Although these were not applied in the present study, they represent an important extension of the methodology and could be exploited in future research.
To further characterize household energy profiles, primary energy values were also calculated for each dwelling, using the national conversion factors established by DM 26-06-2015 Requisiti Minimi [
44]. This step complemented the economic assessment with a technical indicator, providing a more comprehensive representation of household energy conditions.
2.6. Indicators and Calculation Procedure
The measurement follows the following steps.
The definition of a limit income, which represents the risk of ending up in EP, defined as
where
IEPR is the limit income EP risk [€/year];
I is the annual family income [€/year];
tep is the EP risk threshold, set to 10% from the Boardman’s definition.
Annual energy expenditure for electrical and thermal uses
where
CENE is the total Energy expenditure for electrical and thermal uses;
C
ENE,gas is the obtained from the sum of consumption dedicated to heating, cooktop and DHW if presented as
where
Qh is the heating consumption [kWhg];
Qcook is the cooktop consumption [kWhg];
QDHW is the domestic hot water consumption [kWhg];
Cgas is the natural gas cost factor [€/kWhg];
C
ENE,ele is the obtained from the sum of consumption dedicated to appliances, lighting and DHW if presented as
where
Eapp is the electricity consumption dedicated to appliances [kWhe];
ELight is the electricity consumption dedicated to lighting [kWhe];
EDHW is the electricity consumption dedicated to domestic hot water [kWhe];
Cele is the energy cost factor [€/kWhe].
If CENE > IEPR possible risk of EP.
Additional indicators considered are the total primary energy (E
p,gl,tot) of the energy carriers, which incorporates both the non-renewable component (E
P,gl,nren) and the renewable component (E
P,gl,ren). To calculate the total primary and non-renewable energy input, the household’s electricity and gas consumption are multiplied by the corresponding conversion factors indicated in DM 26-06-2015 Requisiti Minimi [
44].
Primary energy is obtained by multiplying the input energy vector by its own conversion factor
where
EENE,gas is the natural gas input energy carrier [kWhg/m2a];
ƒP,nren,gas is the natural gas non-renewable conversion factor of 1,05 [-];
ƒP,ren,gas is the natural gas renewable conversion factor of 0 [-];
ƒP,tot,gas is the natural gas total conversion factor of 1.05 [-];
and
EENE,ele is the electricity input energy carrier [kWhe/m2a];
ƒP,nren,ele is the electricity non-renewable conversion factor of 1.95;
ƒP,ren,ele is the electricity renewable conversion factor of 0.47;
ƒP,tot,ele is the electricity total conversion factor of 2.42.
2.7. Identification of Potential Mitigation Strategies
The final step of the methodology concerns the identification of potential strategies to mitigate EP. This step builds directly on the previous phases, as it relies on the integrated analysis of household profiles, socio-economic vulnerability, and building quality. In particular, the identification of households experiencing EP, together with the assessment of their dwelling characteristics and system performance, provides the basis for defining suitable intervention options.
The process does not aim to prescribe specific measures in advance, but to establish a structured framework that connects the evidence collected, including energy balances, building envelope quality, system efficiencies, and socio-economic indicators, to possible response strategies. These may range from technical measures on the building and its systems, to behavioral recommendations or financial support mechanisms adapted to household capacity. The concrete outcomes of this step are inherently case-specific and are presented in the Development of strategies section. Methodologically, however, its relevance lies in showing how field-based micro-scale evidence can be operationalized into a decision-support framework that moves beyond the measurement of EP and towards the formulation of actionable solutions.
3. Case Study
3.1. Building Characteristics
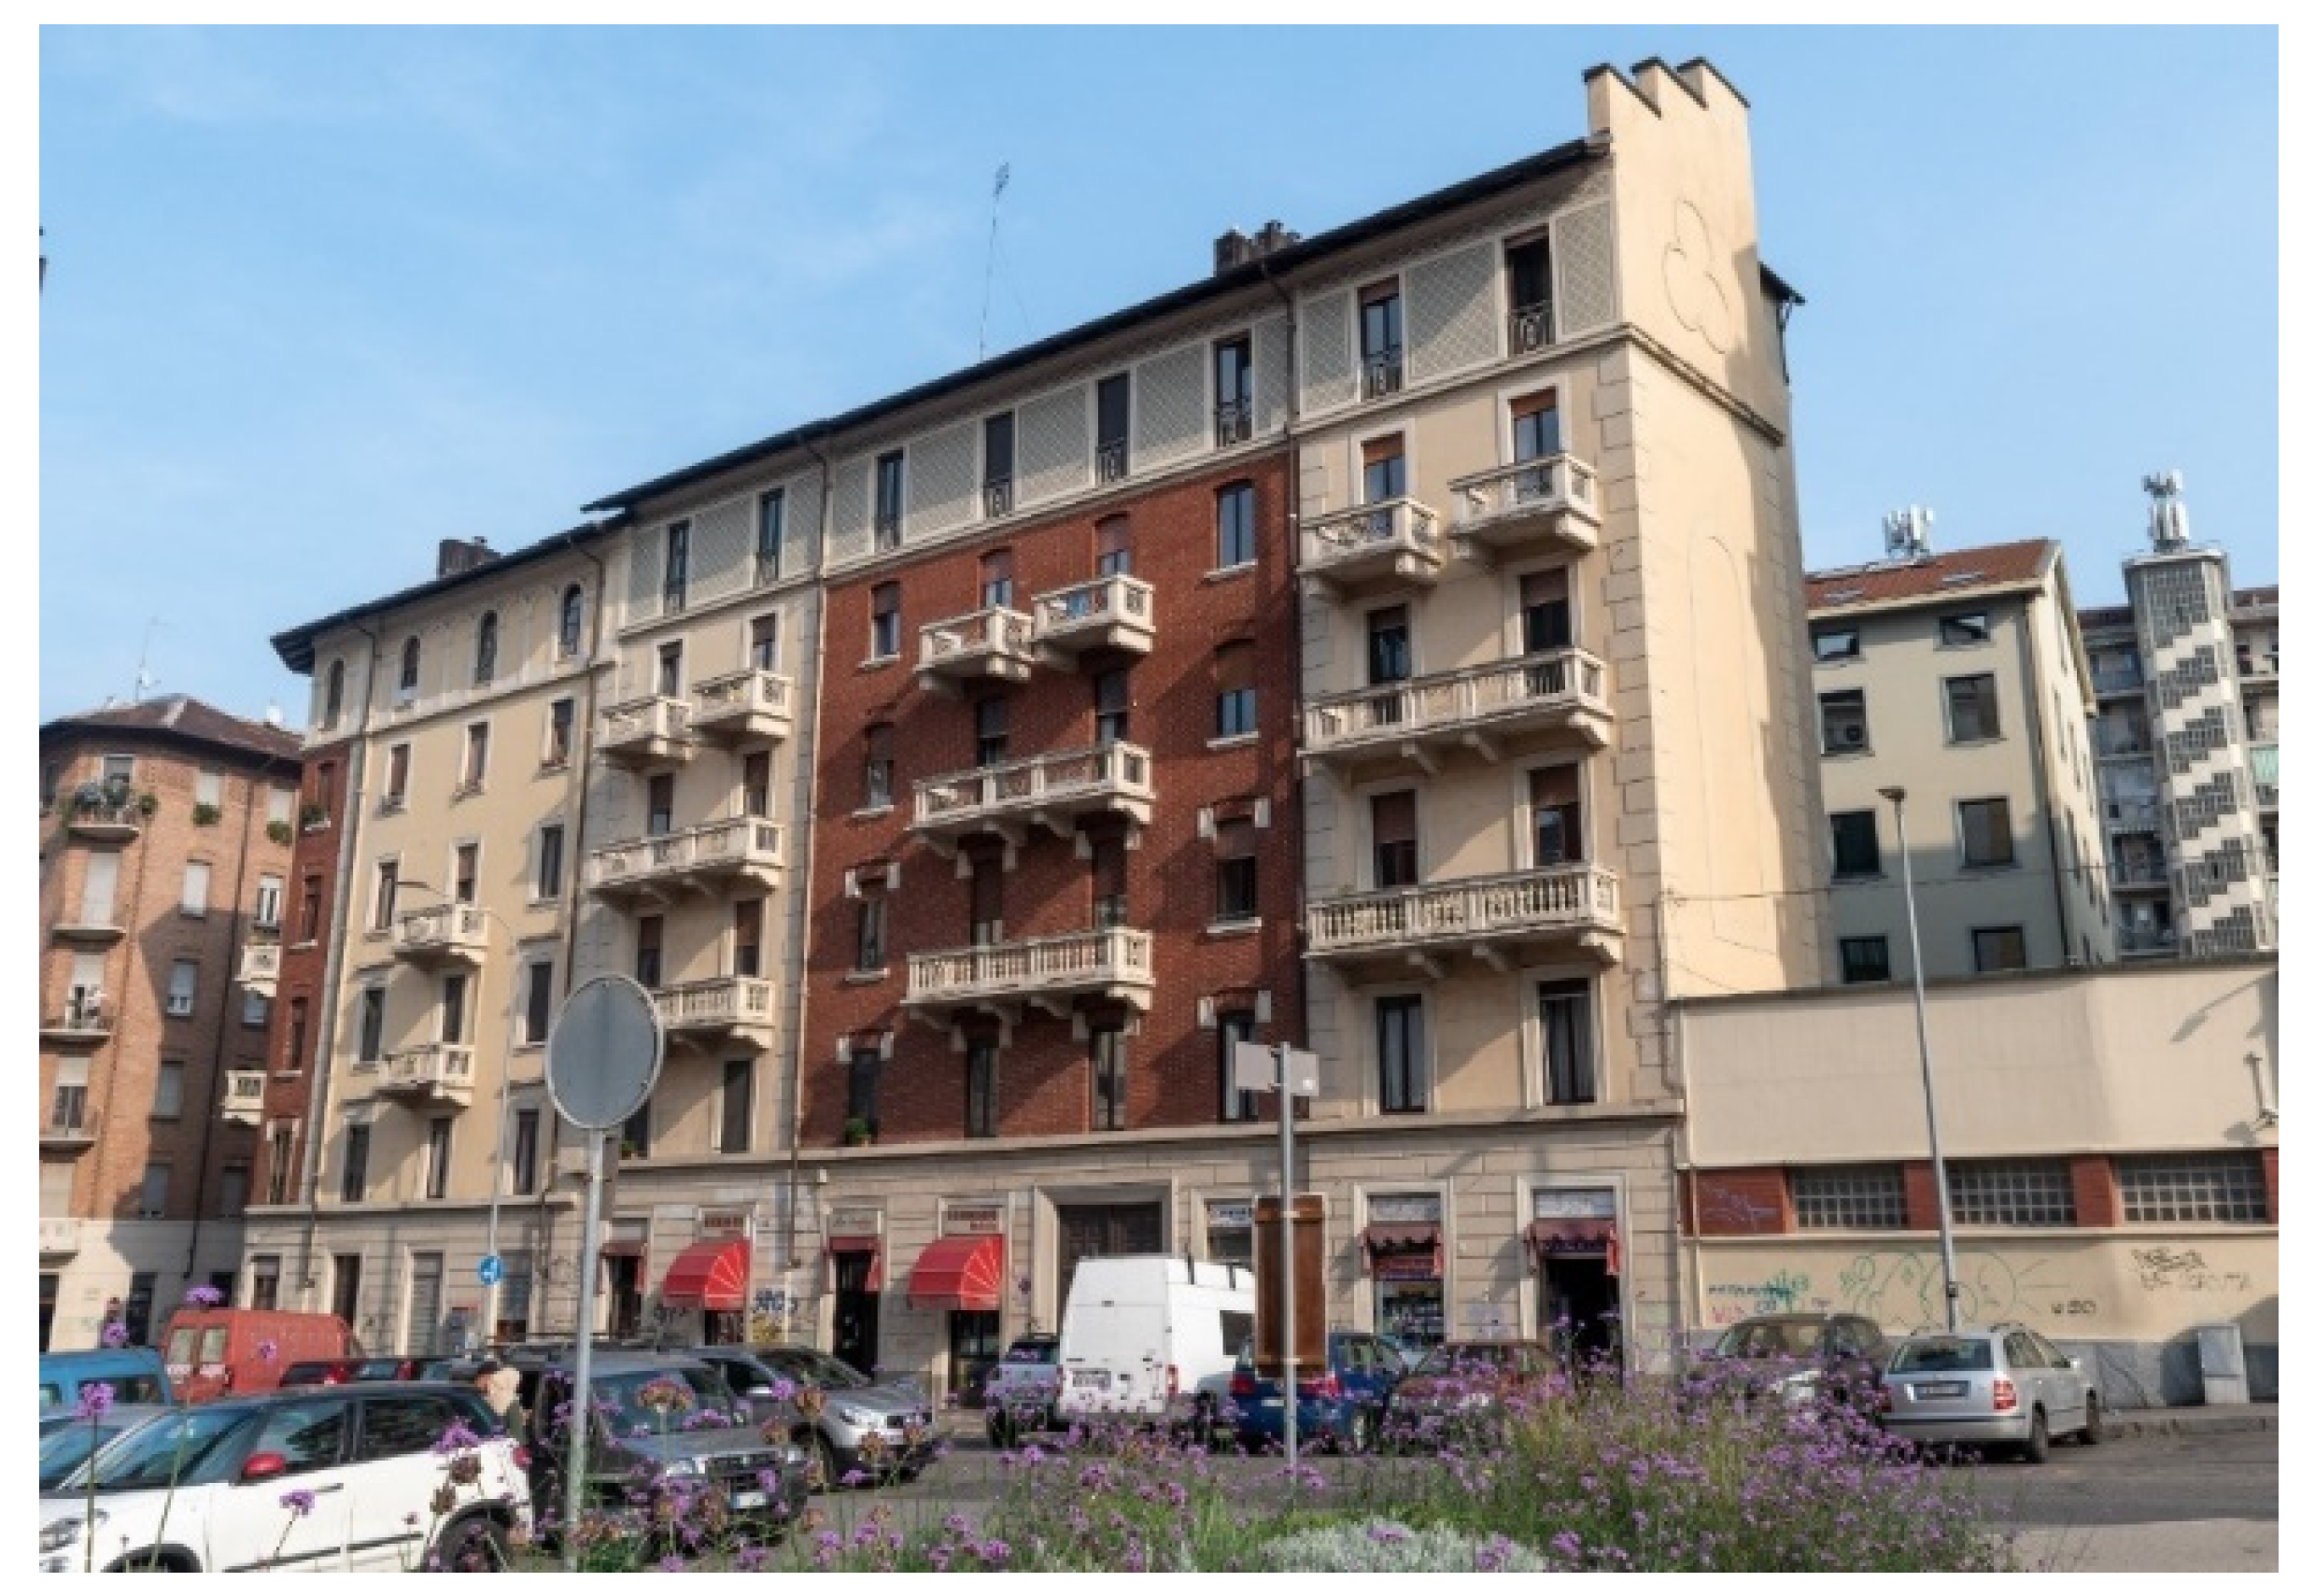
The case study concerns a six-story masonry private multi-family building located in Turin, originally built in 1928 by the Molini Dora company (Torino, Italy). The building comprises a total of 30 apartments (five per floor) with mixed residential and commercial use.
Figure 4 illustrates the exterior of the building, which has two main entrances due to the slope of the ground. The overall condition is generally acceptable, although several deficiencies were observed, including deteriorated balconies, plaster detachment, and aluminum window frames with poor thermal performance.
The main physical and technical features of the building are summarized in
Table 1. In addition to its morphological characteristics, the building is equipped with a centralized heating system. For the estimation of domestic hot water efficiency, typical coefficients were assumed: 0.82 for gas water heaters and 1.0 for electric water heaters, reflecting the heterogeneous technological solutions currently in place.
3.2. Architectural History and Transformations
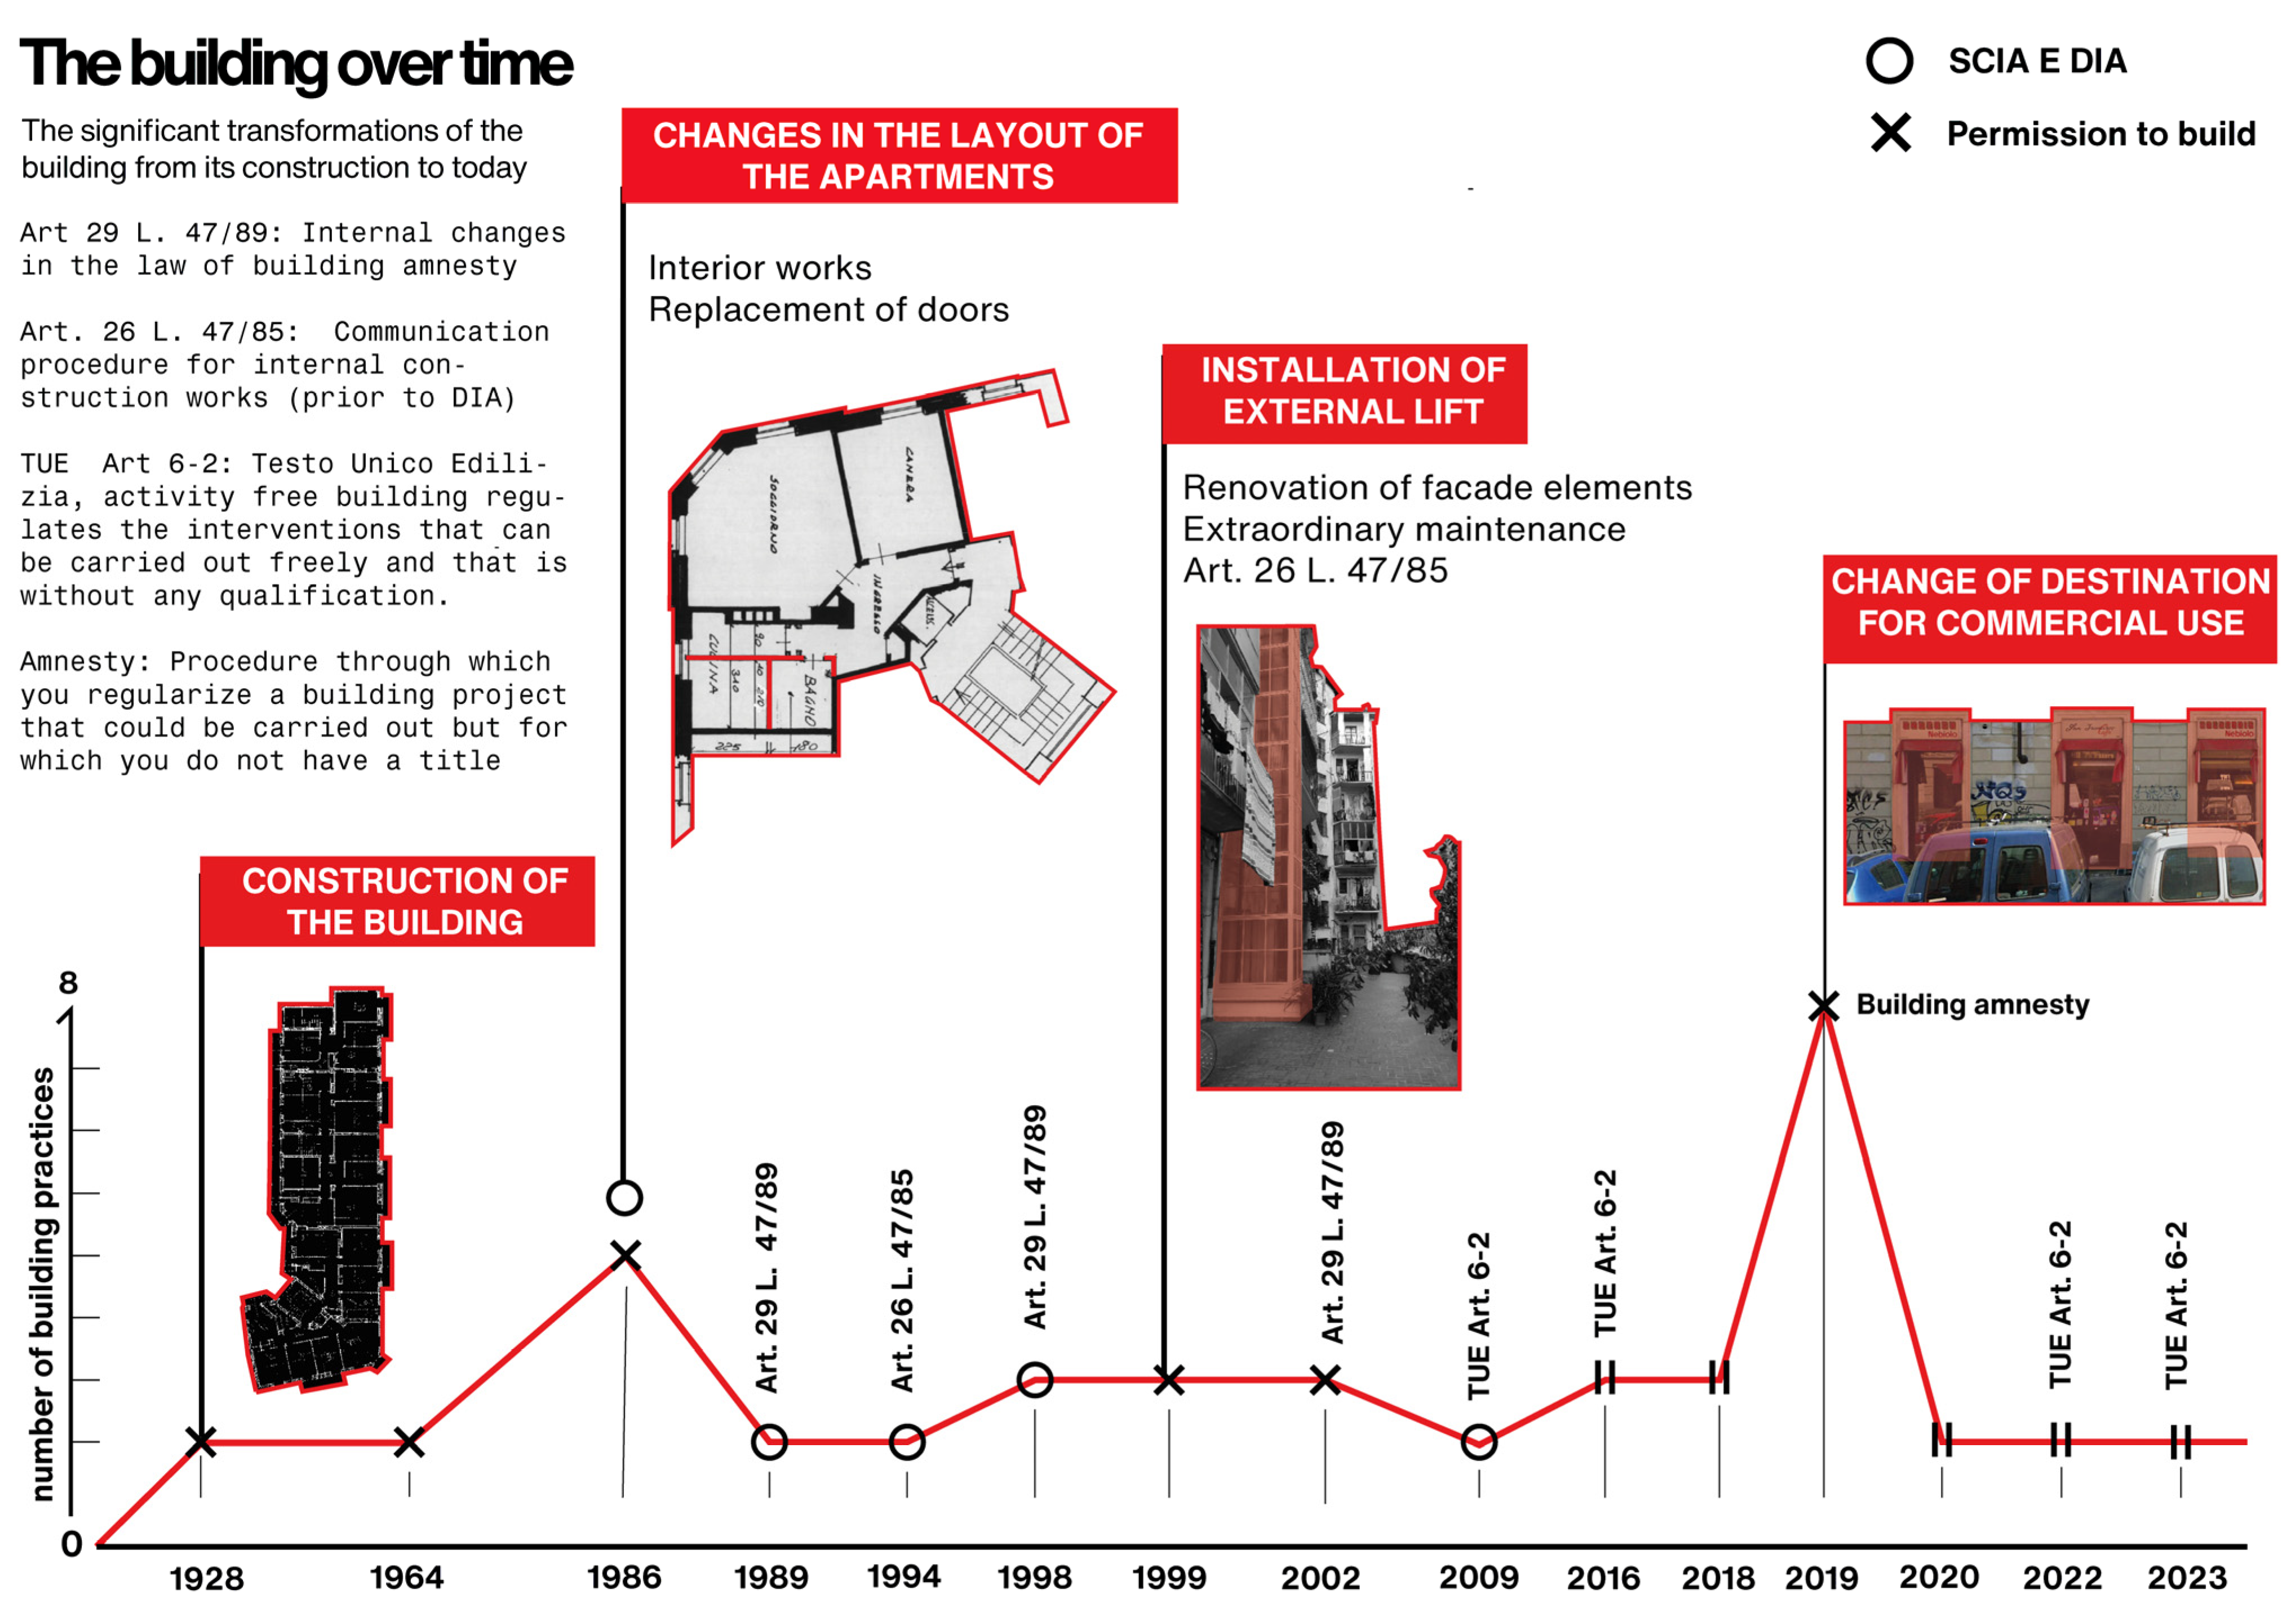
An extensive archival investigation was conducted to reconstruct the history and transformations of the building. Original project drawings preserved in the municipal archives, building permits (SCIA, DIA), and other official records were analyzed, complemented by on-site surveys and direct consultation with residents.
The main changes documented over time include, the following:
Subdivision of internal spaces to create additional dwellings;
Increase in the number of units per floor;
Installation of an external elevator;
Conversion of the ground floor from residential to commercial use.
These transformations are illustrated in
Figure 5, which presents the timeline of modifications. Importantly, the historical analysis revealed that no energy retrofitting interventions have ever been carried out. This strongly suggests that the building still performs with very limited energy efficiency, in line with its original construction characteristics.
4. Results
4.1. Survey Participation and Socio-Demographic Profile
The survey achieved a participation rate of 55%, corresponding to 16 households and 31 individuals. This level of response was considered sufficient to capture both the social and energy-related dimensions of the case study.
In terms of household structure, 30% were single-person households and 37% were couples, indicating a predominance of small household sizes. The age distribution revealed a concentration in the youngest and oldest groups, highlighting two segments of the population typically associated with higher vulnerability. Occupational status reflected a similar pattern, with 31% of respondents being retired individuals and 24% students.
Tenure status represented an additional dimension of potential vulnerability: 56% of households were tenants and 44% were homeowners. This distinction has direct implications for energy retrofitting, as tenants generally have limited capacity to influence investment decisions. The average annual household income was €21,150, a value that already points to economic fragility and may restrict access to renovation incentives.
4.2. Energy Balance at Household Scale
All apartments were connected to a centralized gas-fired heating system, while domestic hot water (DHW) production was more heterogeneous. Some households relied on individual gas boilers, others on electric water heaters, introducing variability that later proved significant in the analysis of consumption profiles.
To illustrate the analytical process adopted in this study, Household 5 was selected as a representative example, since its values were close to the sample average. The case provides a practical demonstration of how consumption data were collected, disaggregated, and integrated into a comprehensive household energy balance.
Electricity consumption, reconstructed from utility bills, is reported in
Table 2. The household displayed a stable monthly demand of approximately 110 kWh, with a total cost of €176.25 over the three months considered. This corresponded to an annual specific demand of 29.3 kWh
e/m
2.
Natural gas consumption for cooking and DHW (excluding space heating) is summarized in
Table 3. Annual demand amounted to 39.14 kWh
g/m
2, with an associated cost of about €190. When space heating is included, total gas consumption increases substantially, confirming the dominant role of heating in the overall household energy balance.
Beyond aggregated electricity use, the methodology allowed a detailed disaggregation by end use, thanks to the integration of questionnaire information on appliances and operating habits. As shown in
Table 4, appliances accounted for the majority of electricity demand (23.5 kWh
e/m
2a), while lighting represented a smaller but non-negligible component (5.7 kWh
e/m
2a).
The complete household energy balance is illustrated in
Figure 6. The diagram shows the flow of energy carriers (input), technical systems, and final end uses. The accompanying pie chart highlights that heating represented by far the largest share of energy demand, overshadowing all other end uses combined.
4.3. Energy Balance at Building Scale
Extending the analysis to all 16 households confirmed the trends observed at household level. Average electricity demand was 19.6 kWh
e/m
2a, while natural gas demand reached 326 kWh
g/m
2a (
Table A1,
Appendix A). Energy expenditure, reconstructed from utility bills and centralized heating records, is summarized in
Table A2 (
Appendix A). On average, heating represented by far the largest financial burden, with an annual cost of €1333 per household. Variations in other end uses were smaller and largely explained by appliance ownership and supplier tariffs.
Primary energy demand, calculated according to national conversion factors [
44] ranged from 95.53 to 257.49 kWh/m
2a, with an average value of 172.68 kWh/m
2a (
Table A3,
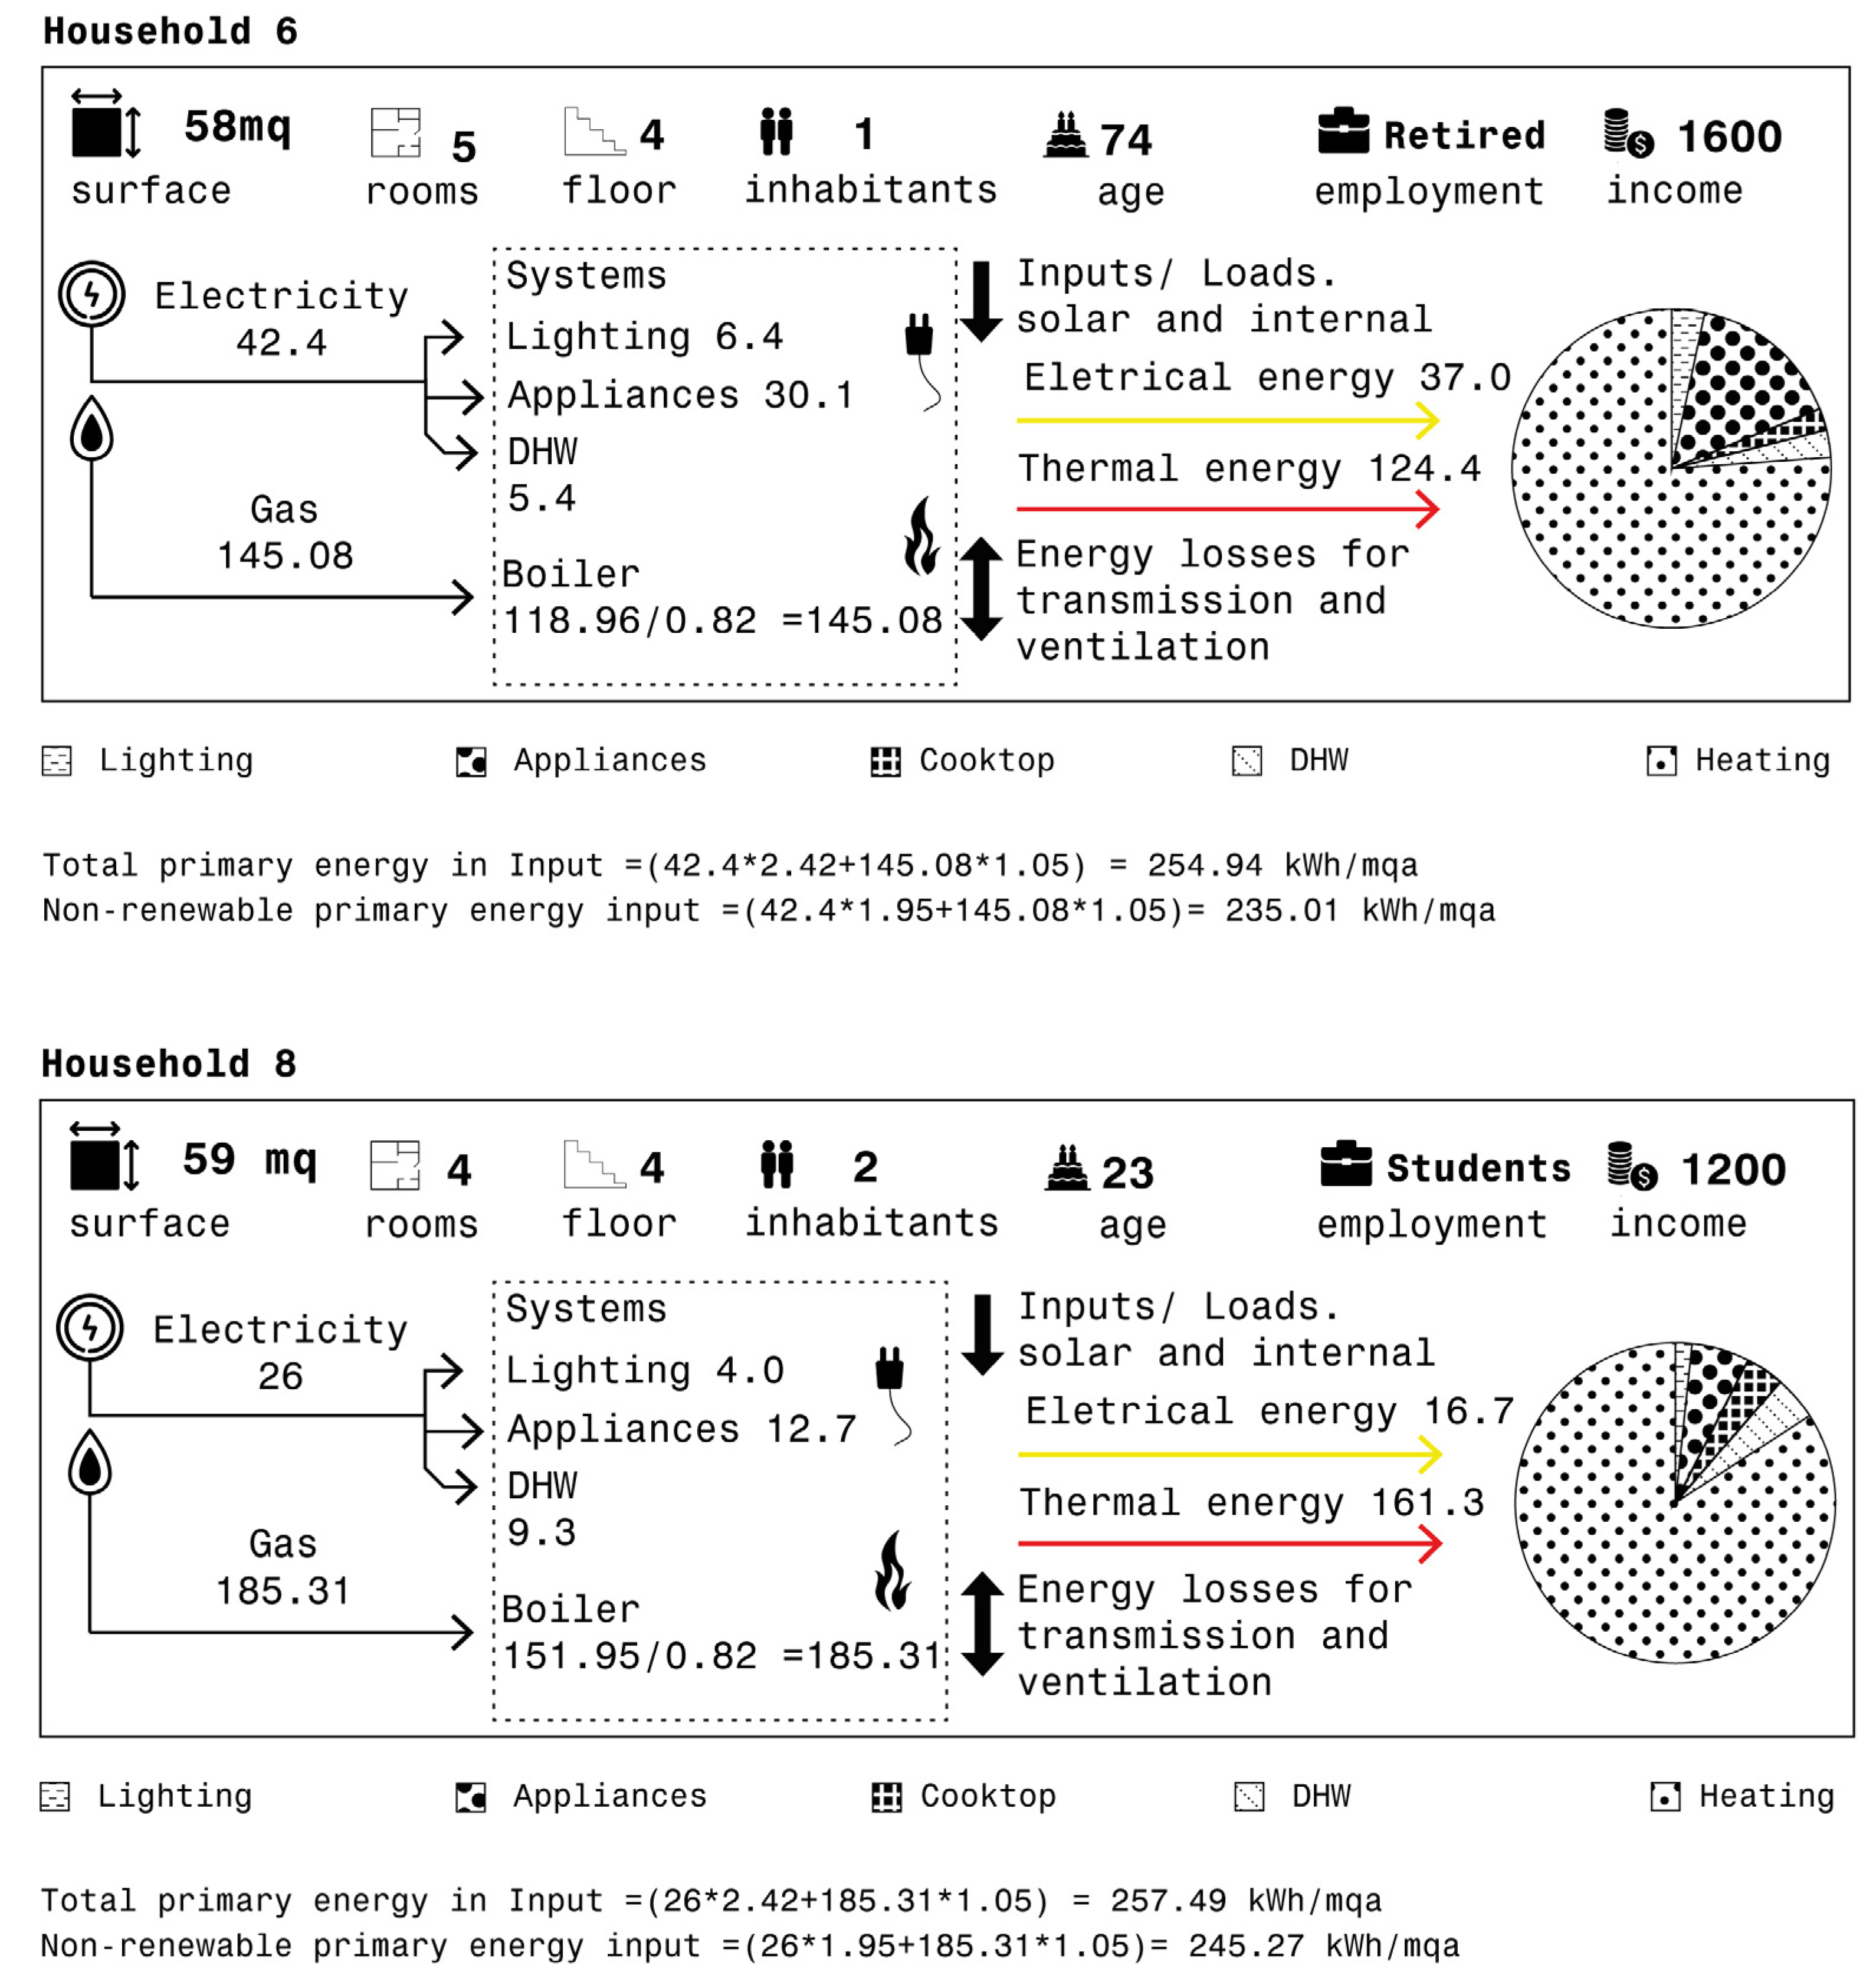
Appendix A). This variability reflects both technical factors, such as system efficiency and envelope quality, and behavioral aspects, including occupancy patterns and user practices. For completeness, additional representative examples of household energy balances are provided in
Appendix A (
Figure A1).
4.4. Measuring EP
The integration of socio-economic and technical data enabled a direct assessment of EP at the household level.
Table 5 reports the key variables required for the calculation, including household size, income, energy consumption, and annual energy expenditure. Applying the Boardman 10% threshold [
25], five households, corresponding to 31% of the sample, were identified as energy poor. Among these, the share of income spent on energy ranged from 10.2% to a maximum of 12.3%, confirming that for some household’s energy costs represent a substantial economic burden. Households in energy poverty that exceed the 10% threshold are shown in bold in the table.
A closer look at the socio-demographic characteristics of the affected households highlights important patterns of vulnerability. As illustrated in
Figure 7, energy-poor households were concentrated among the youngest (<30 years) and oldest (>70 years) residents, suggesting a dual age-related fragility. Educational attainment also emerged as a relevant factor, with the majority of vulnerable households having at most a high school diploma. In terms of tenure status, 60% of energy-poor households were tenants, reflecting limited decision-making power regarding energy retrofits. Finally, income distribution shows that 40% of vulnerable households reported monthly earnings below €1500, underlining the overlap between EP and broader economic fragility.
4.5. Correlations
To further investigate the relationship between socio-economic and technical variables, a set of correlation analyses was carried out. The objective was to assess whether simple parameters, such as income or dwelling size, could sufficiently explain household vulnerability to EP.
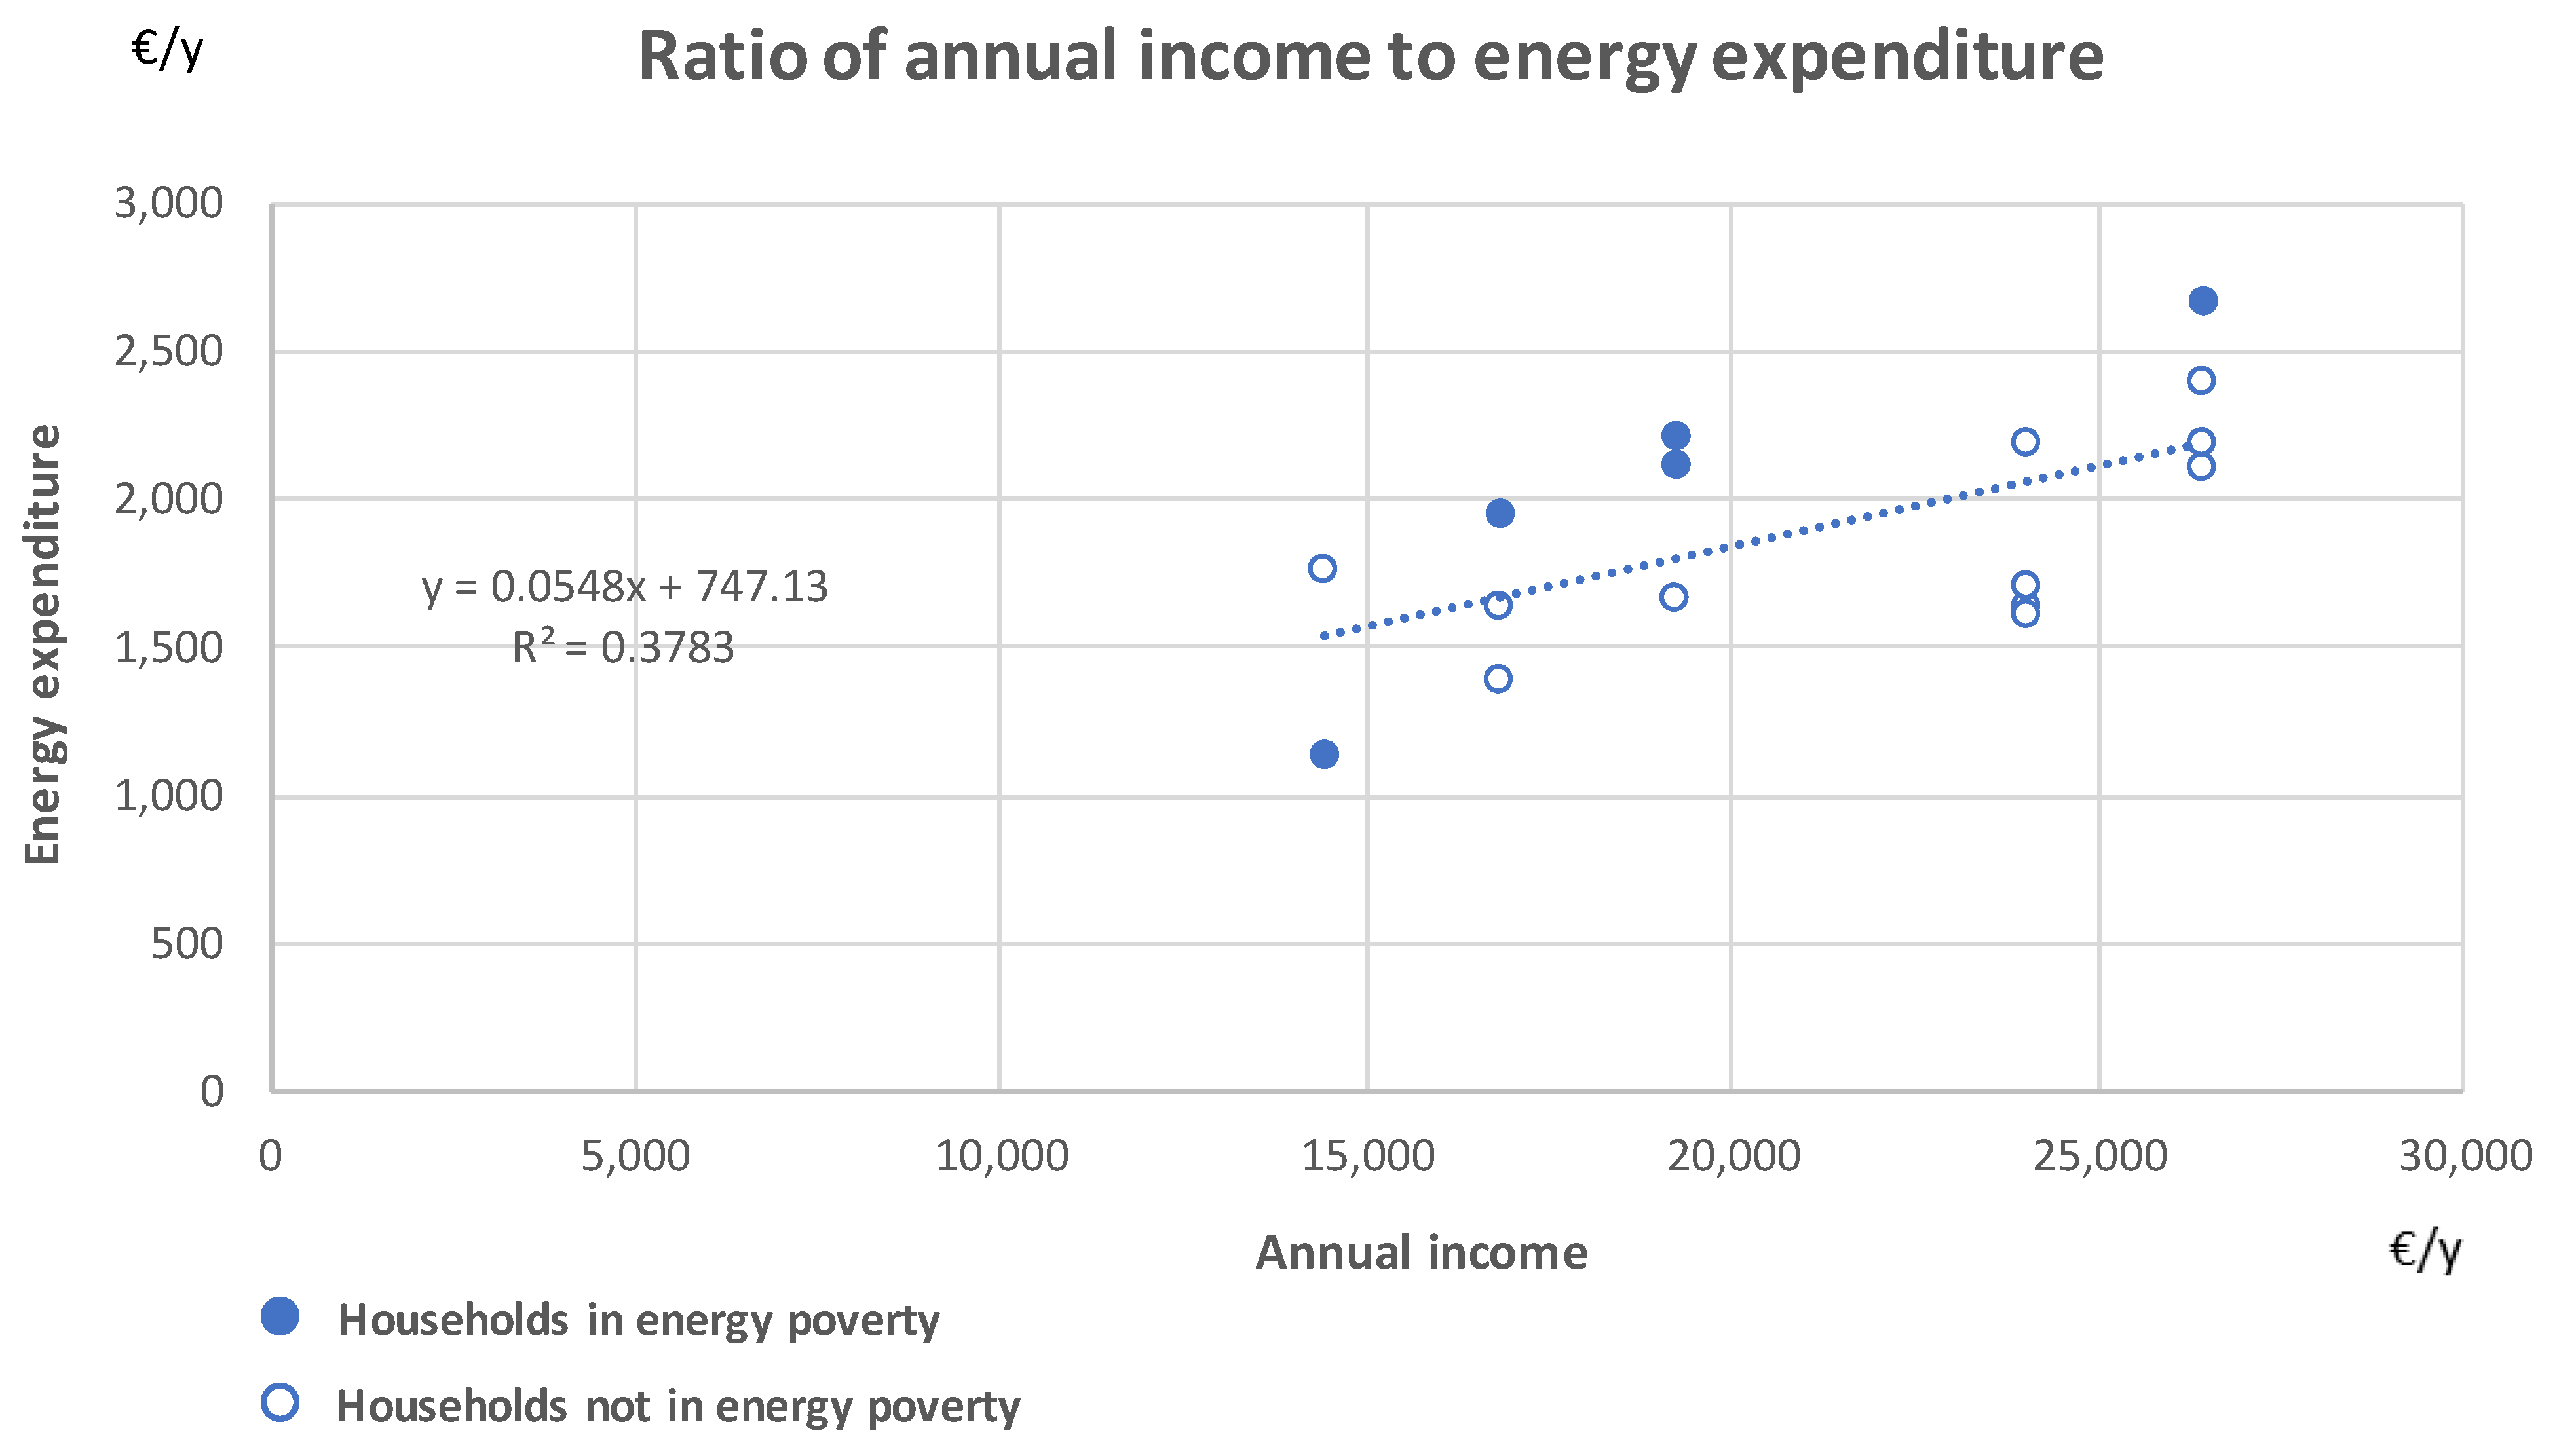
Figure 8 presents the relationship between annual income and total energy expenditure. A moderate positive correlation was observed (R
2 = 0.38), indicating that higher-income households generally spend more on energy. However, the blue dots representing households in EP consistently lie above the regression line, meaning that their energy expenditure represents a disproportionate burden relative to their available income. This result confirms that absolute expenditure levels alone are not sufficient to identify vulnerable households.
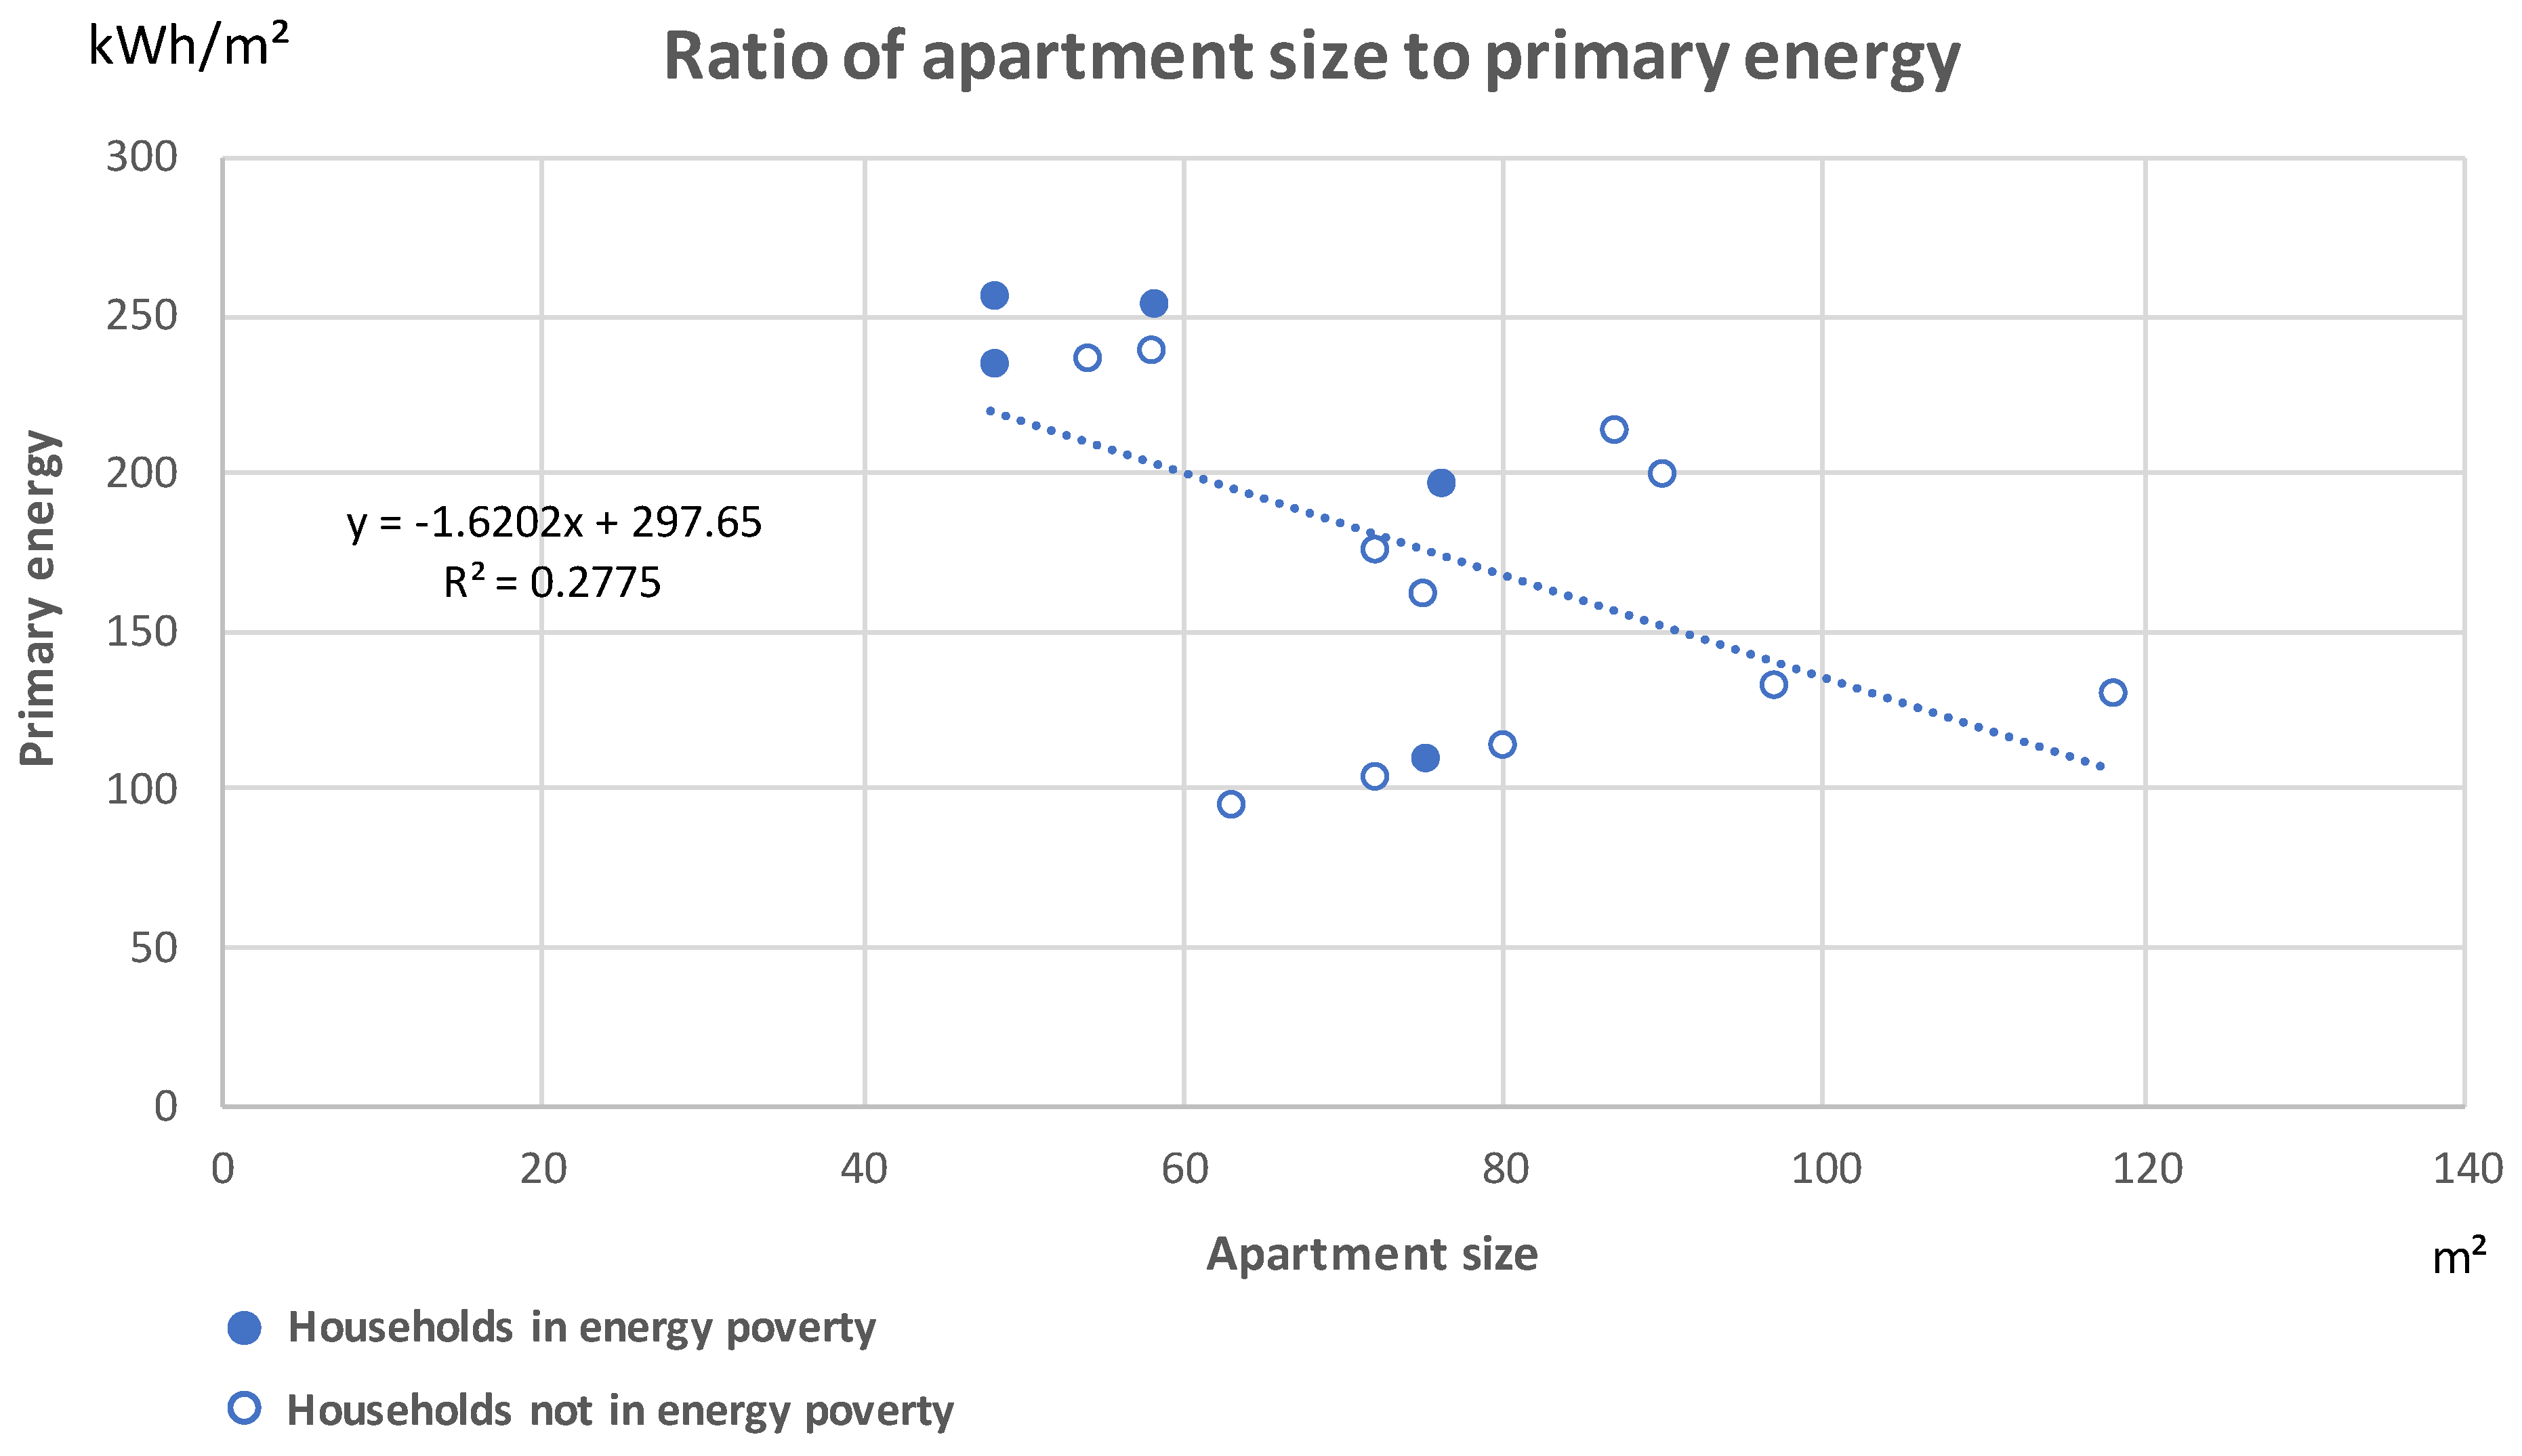
The comparison between apartment size and primary energy consumption, shown in
Figure 9, does not reveal a strong linear relationship (R
2 = 0.28). Apartments of similar size exhibited markedly different levels of specific primary energy demand. Since the building envelope and construction quality are common to all dwellings in the private multi-family building, these differences are more likely to result from factors such as the number of occupants, operational patterns of heating and hot water systems, and household energy behaviors. This indicates that apartment size, while an easily accessible parameter, is not sufficient to explain household vulnerability, which instead derives from the interaction between socio-economic conditions and technical characteristics shared across the building.
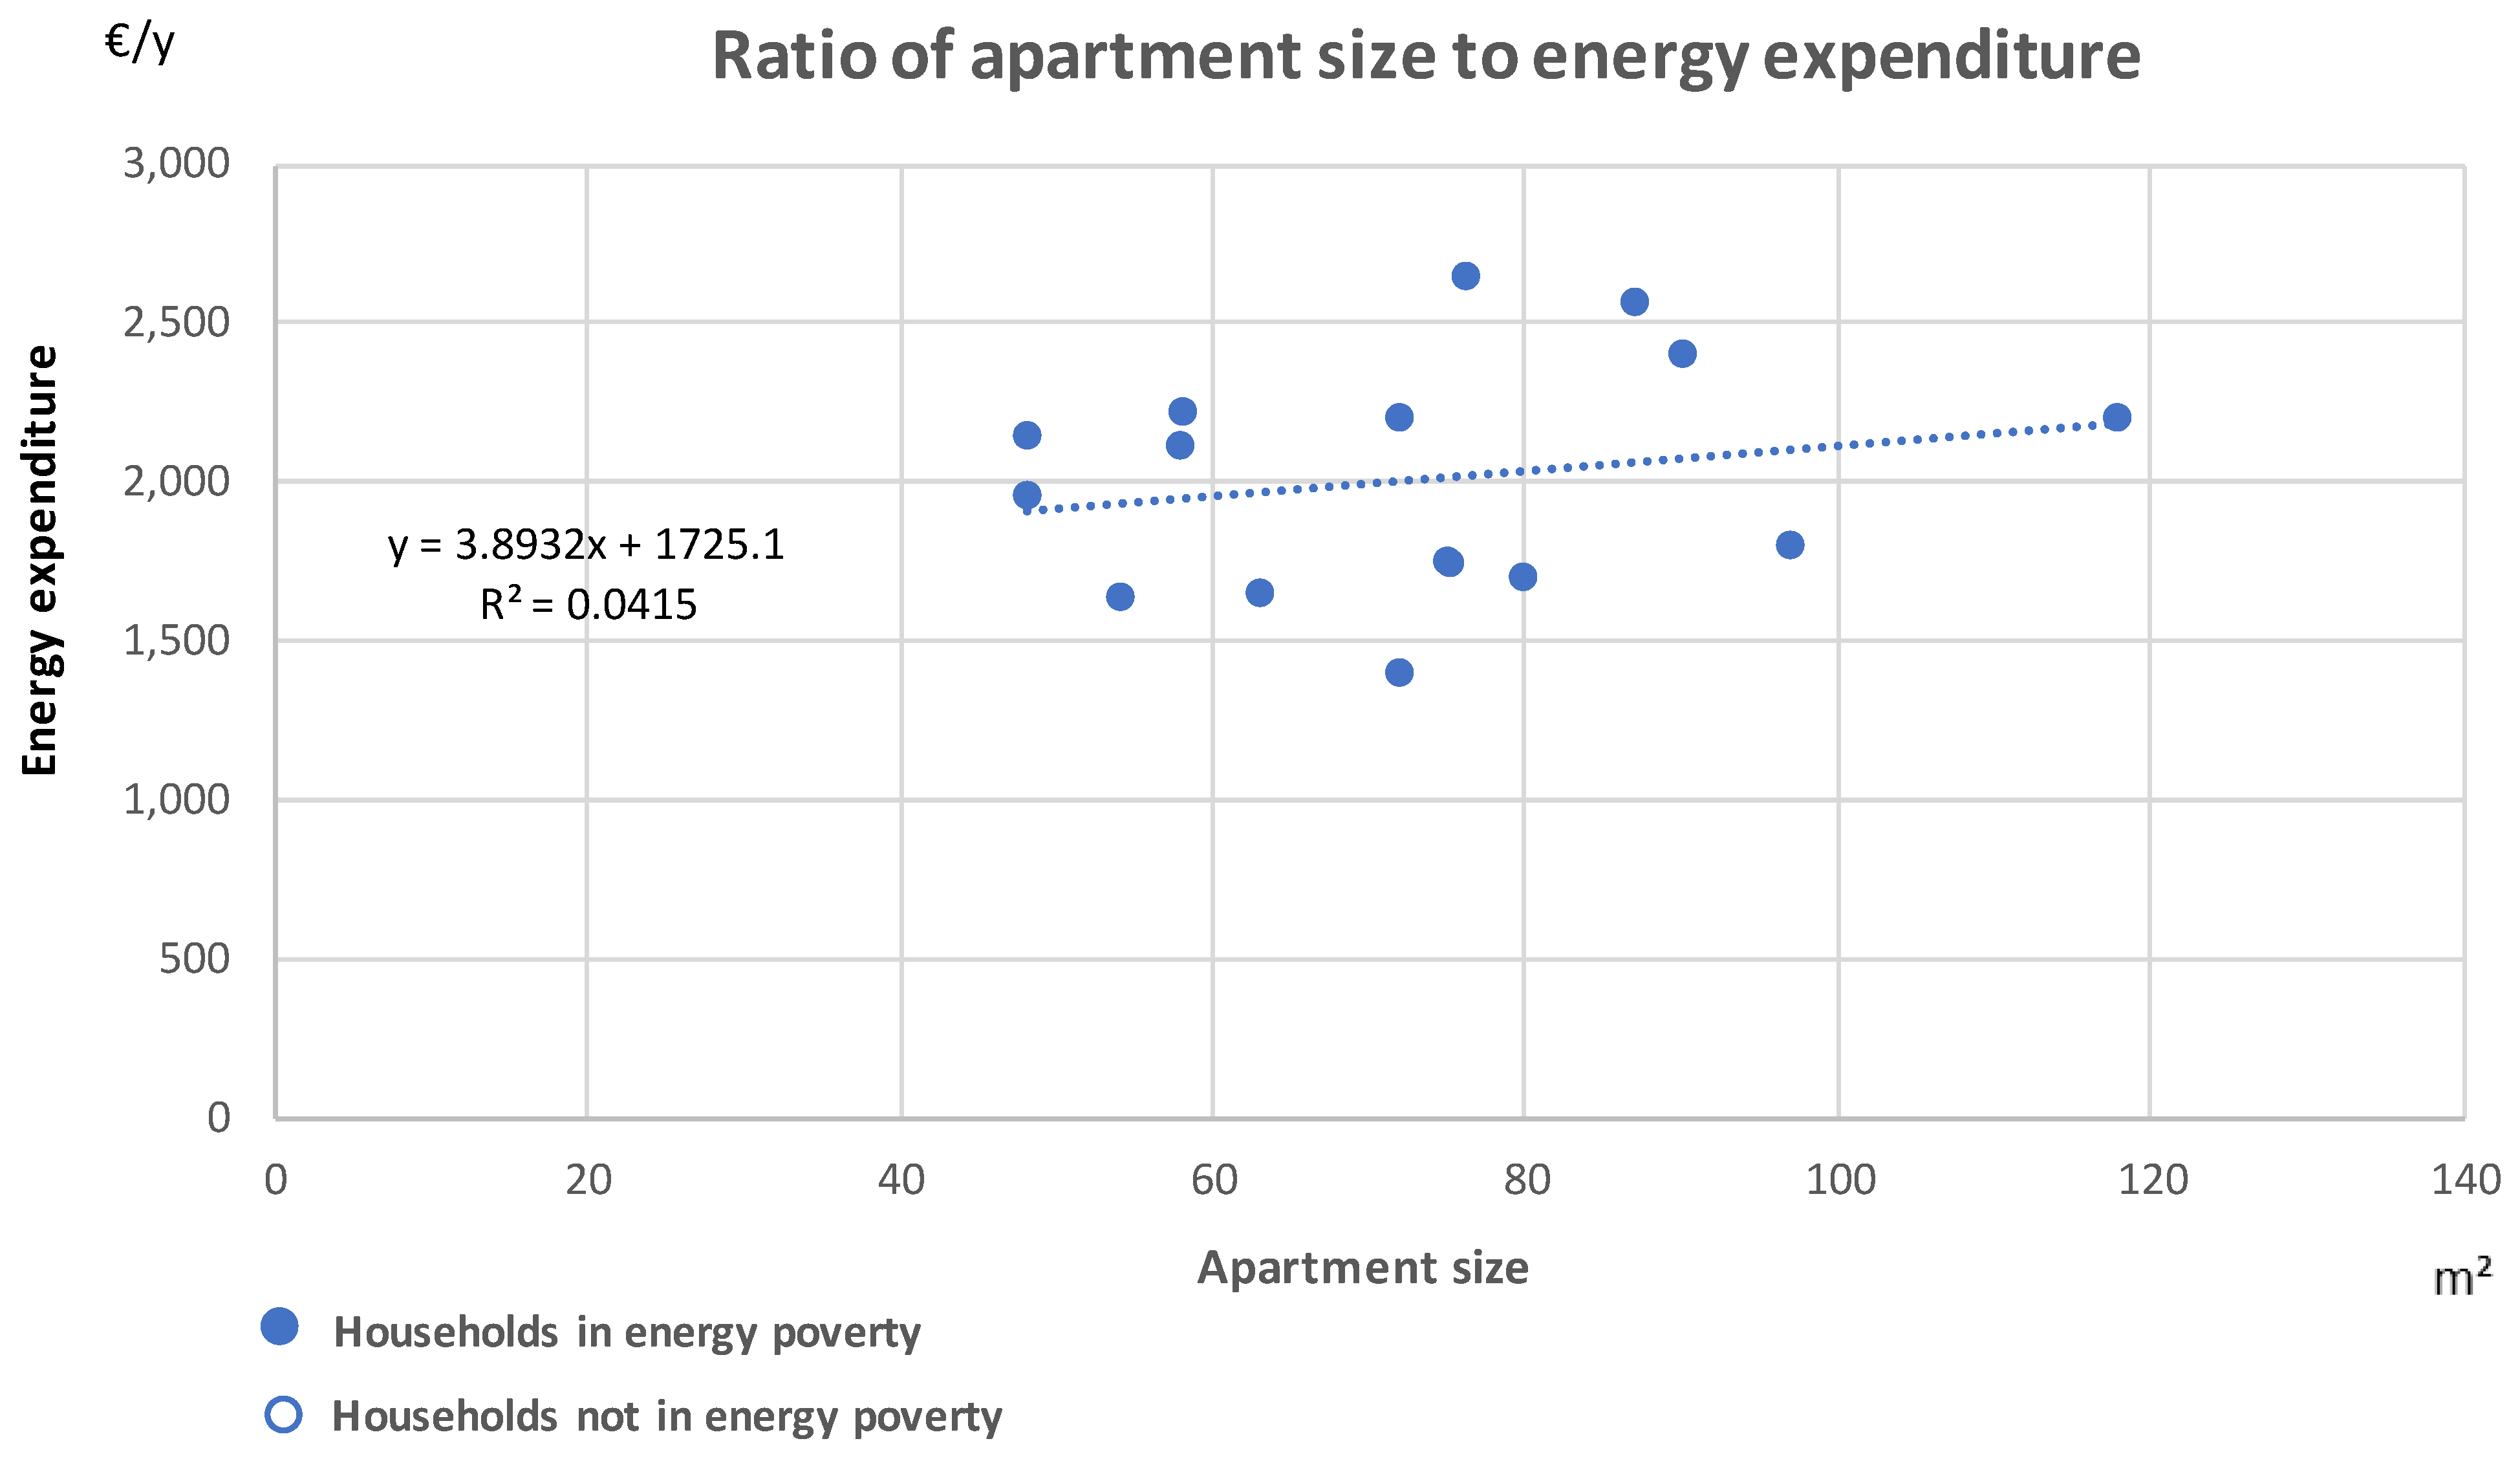
The relationship between apartment size and total energy expenditure, reported in
Figure 10, further illustrates this complexity. The correlation is extremely weak (R
2 = 0.04), showing that units of similar size may sustain very different energy expenditure depending on income levels, efficiency of domestic systems, and user behavior. Once again, the blue dots representing households in EP stand out with higher relative burdens than the rest of the sample.
Overall, these analyses confirm that no single parameter can adequately explain household vulnerability. Income, dwelling size, and energy demand interact with technical conditions and socio-demographic characteristics, underscoring the necessity of an integrated approach. This multidimensional perspective provides the basis for linking the diagnosis of EP with the formulation of mitigation strategies that are not only technical, but also responsive to the specific needs of households.
5. Development of Strategies
5.1. Proposed Interventions
The development of intervention strategies was guided by evidence that emerged from the results, both on the socio-demographic and energy side. The survey highlighted that most households are composed of one or two people, often living in dwellings oversized compared to their actual needs. This discrepancy opens up the opportunity to optimize living spaces, for instance, by dividing larger apartments into smaller units such as studios or two-room flats. These transformations can be carried out without altering ownership boundaries or compromising the load-bearing structure of the building, allowing individual owners a certain degree of autonomy in their implementation. This approach is particularly suitable in privately owned multi-family buildings, where residents can act independently on their property.
From an energy perspective, the balance analysis clearly showed that heating represents the most significant component of household expenditure, primarily due to the simple masonry walls and outdated windows. Based on these considerations, four design strategies were proposed:
Reconfiguration of apartments, subdividing oversized units to align living spaces with actual household composition.
Insulation of the opaque envelope, with the addition of a 12.5 cm layer of insulation, reducing transmittance from Uop = 0.816 W/(m2K) to Uop = 0.208 W/(m2K).
Improvement of the transparent envelope, by replacing windows, lowering transmittance from Utra = 5.70 W/(m2K) to Utra = 0.88 W/(m2K).
Installation of a photovoltaic system on the roof, reducing dependence on the electricity grid from 100% to 59% and producing 10.1 kWh/m2a.
The choice of photovoltaics instead of solar thermal was motivated by the high heterogeneity of domestic hot water systems in the building, which made a centralized solar solution less effective.
It should be noted that these interventions are not necessarily intended to be implemented simultaneously as a single package. Rather, they can be carried out progressively, depending on the specific technical, regulatory, and economic constraints that may arise in real renovation processes.
This flexibility is particularly important in the context of existing private multi-family buildings, where the feasibility of interventions is often conditioned by ownership structures, financial resources, and the capacity of residents to invest over time. Framing the strategies in this way allows them to serve both as an integrated long-term vision and as a set of modular actions that can be adopted step by step, according to priorities and available resources.
Table 6 summarizes the four proposed strategies, comparing the state of the art with the design assumptions.
Using the updated transmission coefficients, the heating demand was recalculated according to UNI 11300 [
45], assuming a heating period of 183 days (October–April). The results, reported in
Appendix B, show a reduction from 154.6 kWh/m
2 in the current state to 51.4 kWh/m
2 after the interventions, corresponding to a 67% improvement.
Combined with photovoltaic production, this reduction indicates that households currently identified as energy poor, slightly above the 10% threshold, with excess values ranging between 0.2% and 2.3% could potentially be brought below the critical limit. It is worth stressing that apartment reconfiguration within private ownership boundaries represents an intervention that allows owners to directly adapt their dwelling to personal needs (e.g., creating a studio to rent out). Such transformations thus hold significant potential in private buildings, as they can be undertaken independently by individual households.
5.2. Critical Issues and Limitations
While the proposed interventions demonstrate clear potential in mitigating EP, several critical issues and limitations should be acknowledged.
First, the reconfiguration of apartments poses legal, financial, and organizational challenges. Although technically feasible without altering the building’s structural system, subdivision requires agreement within the private multi-family building assembly, administrative approvals, and potentially high upfront costs. Moreover, the social implications of densifying the building through smaller units, such as increased occupancy or changes in the resident profile, should be carefully considered.
Second, the energy retrofitting measures (insulation of the opaque and transparent envelopes) imply substantial investment. Although they provide the highest energy savings, low-income households, precisely those most affected by EP, may lack the financial resources or access to credit to afford these renovations. Without targeted support mechanisms, such as subsidies or third-party financing, the risk of exclusion remains high.
Third, the installation of a photovoltaic system faces both technical and governance constraints. Roof availability, shading, and multi-family building level decision-making may limit implementation. Furthermore, while self-consumption significantly reduces grid dependence, it does not directly address heating demand, which remains the primary driver of vulnerability.
Finally, it should be emphasized that the calculated reduction in heating demand (67%) and the potential lifting of households out of EP are theoretical projections based on standardized models (UNI 11300) [
45]. Real-world outcomes may diverge due to behavioral factors, rebound effects, or variations in energy prices.
In summary, the strategies presented here highlight the technical and social potential for reducing household vulnerability but also underline the need for supportive policy instruments, financial tools, and participatory governance to ensure their feasibility and equitable implementation.
6. Discussion
The findings of this study highlight both the potential and the limitations of adopting a direct, field-based methodology to assess EP at the building scale. Compared to approaches that rely exclusively on aggregated statistical data, this method allows for a more detailed understanding of household conditions, as it integrates socio-economic characteristics, building features, and real consumption profiles. This multidimensional perspective not only measures the incidence of EP but also sheds light on its underlying causes, offering a robust basis for targeted interventions.
A first important outcome is the systematic confirmation that space heating represents the most significant component of household energy expenditure, outweighing all other final uses. While this finding is consistent with the literature, the detailed reconstruction of household energy balances carried out here enriches the analysis by showing how heating demand is conditioned by the interplay between building quality, system efficiency, and user practices. Such nuances are often invisible in macro-scale studies, underlining the added value of micro-scale approaches.
However, several limitations must be acknowledged. The methodology is based on the active cooperation of households and their willingness to provide socio-economic and energy information. In this case study, a participation rate of 55% was achieved, supported by a favorable climate of trust and cohesion. Yet, some households, especially elderly residents, declined to participate, while others withheld utility bills after initially filling in the questionnaire. This partial fragmentation of data inevitably reduces completeness and highlights the practical challenges of field-based research.
Another limitation relates to the data sources. No direct meter readings were collected; instead, consumption was reconstructed from utility bills and self-reported information. While this proved sufficiently robust for analytical purposes, it introduces margins of approximation, particularly in the absence of standardized criteria for allocating centralized heating costs.
Furthermore, the study adopted Boardman’s 10% indicator as the primary benchmark for identifying households in EP. While this indicator is widely recognized and allows comparability across contexts, it only captures the relationship between energy expenditure and income. Other relevant dimensions, such as thermal comfort, arrears on energy bills, or service disconnections, were not systematically included. It should be emphasized that the chosen field methodology, based on interviews and questionnaires, makes it difficult to collect such sensitive information in a structured and comparable way, thereby limiting the possibility of adopting more complex, multidimensional indicators.
Despite these constraints, the approach has proven effective not only as a diagnostic tool for local interventions but also as a valuable complement to national and regional statistics. The generation of detailed micro-scale datasets provides a ground-truth reference that can be used to validate and refine macro-scale indicators, which often rely on overly aggregated assumptions. In this way, field-based methodologies contribute to bridging the gap between quantitative measurement and lived household experiences, ensuring that EP policies are designed with greater accuracy and fairness.
Finally, the case study illustrates the operational relevance of this methodology for policy and practice. By combining technical data with socio-economic conditions, it becomes possible to move beyond generalized subsidies and to design more targeted measures. The identification of heating as the main expenditure burden, for example, points directly to the need for interventions on building envelopes and heating systems, ideally supported by financial mechanisms calibrated to household economic capacity. Embedding this type of micro-scale evidence into decision-making processes would not only increase the effectiveness of EP alleviation strategies but also strengthen their social legitimacy.
7. Conclusions
Ensuring a fair energy transition remains one of the key challenges for the European Union. The recent revision of the EPBD (March 2024) explicitly emphasizes the need to tackle EP through structural measures, prioritizing the renovation of buildings with poor energy performance. In this perspective, the availability of reliable and disaggregated data is essential to design interventions that are not only technically effective but also socially fair, targeting the households most at risk of vulnerability.
This study contributes to this debate by presenting a direct, field-based methodology that integrates socio-economic and technical information at the building scale. Applied to a private multi-family building, the approach enabled the collection of detailed data on household composition, income, and energy consumption, complemented by architectural reconstruction of the building and its systems. On this basis, household energy balances were elaborated, and the incidence of EP was measured using Boardman’s 10% indicator. The results showed that 31% of households fell into EP, confirming the vulnerability of pre-regulation housing stock.
Beyond diagnosis, the methodology supported the design of a redevelopment scenario including spatial reconfiguration of dwellings, insulation of opaque and transparent envelopes, and the installation of a photovoltaic system. These measures, while requiring significant upfront investment, have the potential to substantially reduce heating demand (−67%) and to promote partial energy self-sufficiency, thereby lifting households slightly above the EP threshold out of this condition.
The study highlights two broader contributions. First, it demonstrates how micro-scale, field-based evidence can provide insights into the socio-technical roots of EP, which are often hidden in aggregated statistical analyses. Second, it shows the operational relevance of linking household-level data with targeted mitigation strategies, thus offering policymakers concrete tools to prioritize structural interventions over temporary income support.
At national and European level, this type of micro-scale evidence can be aligned with existing policy frameworks that aim to identify and prioritize worst-performing buildings and vulnerable households. The methodology proposed in this paper can provide an operational complement to instruments such as the recast EPBD, national long-term renovation strategies and dedicated energy poverty observatories, by supplying building-level data that help to target renovation programs, define eligibility criteria for financial support, and assess whether public incentives effectively reach those most in need.
Nevertheless, the research also acknowledges some limitations. The reliance on household participation implies partial representativeness and occasional data gaps. The use of the Boardman indicator, while ensuring comparability, does not capture non-monetary dimensions of EP such as arrears or comfort levels, which could not be systematically collected through interviews. These constraints underline the need for future studies to experiment with integrated indicators and to broaden the scale of field-based research.
Looking ahead, the methodology can be extended from the scale of a single private multi-family building to larger building complexes, particularly in the context of public housing, where the presence of a single managing body facilitates large-scale renovations. Such an expansion would allow the formulation of incentive schemes that combine technical efficiency with social equity, ensuring that the energy transition is not only environmentally sustainable but also socially inclusive.
Although the empirical application is rooted in the Italian context, the stepwise process, combining household socio-economic data, technical building information and detailed energy balances, is not country-specific and can, in principle, be adapted to other regulatory environments and building stocks.
In conclusion, the proposed approach provides a replicable framework for assessing and addressing EP at the micro scale, while also offering valuable inputs for policy design at the macro level. Embedding such methodologies in policy-making processes would strengthen the fairness, effectiveness, and legitimacy of EP alleviation strategies across Europe.
