Article

Numerical Analysis of Heavy Oil-Water-Air Flow in a Horizontal Pipe Using Core Annular Flow Adapting Large Eddy Simulations

by
Salim Al. Jadidi
1,
Satheesh Anbalagan
2 and
Shivananda Moolya
1,*
1
Department of Engineering, College of Engineering and Technology, University of Technology and Applied Sciences, Muscat 133, Oman
2
School of Mechanical Engineering, Vellore Institute of Technology, Vellore 632014, Tamil Nadu, India
*
Author to whom correspondence should be addressed.
Energies 2025, 18(23), 6188; https://doi.org/10.3390/en18236188
Submission received: 29 May 2024 / Revised: 18 September 2024 / Accepted: 20 September 2024 / Published: 26 November 2025
(This article belongs to the Section J1: Heat and Mass Transfer)

Abstract

This study focuses on the suitability of Core Annular Flow (CAF) technologies for transporting heavily viscous oil lubricated with water in a horizontal conduit. Using Computational Fluid Dynamics (CFD) and Large Eddy Simulation (LES) techniques with ANSYS Fluent software (Ansys 2022 R2), the research aims to analyze the flow behaviour of heavy oil-water mixtures in horizontal pipes. Specifically, the study examines turbulent CAF to gain insights into how gravity influences the three-phase flow of heavy oil, water, and air. The simulations consider standard horizontal pipes and explore the impact of temperature variations and the presence of air on the annular flow’s behaviour and pressure gradients. The study’s findings, supported by both simulated and experimental results from literature, demonstrate consistent outcomes and contribute to understanding the effectiveness of LES in modelling such complex flows. Overall, this work is novel because it uses an integrated approach to apply advanced numerical techniques, such as LES, to heavy oil, water, and air flows in a horizontal pipe. This approach advances both fundamental understanding and real-world applications in industrial contexts.

1. Introduction

Heavyweight oils are oils identified by their high kinematic viscosity and greater specific gravity. As indicated by Bannwart et al. [1], for oil to be deemed heavy, it should have an API gravity of between 10° API and 20° API, a density of more than 900 kg/m3, a viscosity of approximately 0.1 Pa·s, and a viscosity greater than 100 cP. Due to the recent fall in light oil production, the importance of heavy oil is predicted to increase. However, the high viscosity of heavy oil is a major obstacle to its utilization; in particular, it is difficult to transport, and refinement costs are high due to its greater density. The principal challenge during transportation is the potential for a significant pressure drop and high friction, resulting from the viscous effects of heavy oil in flow. Therefore, the transportation of high-density oil from the manufacturing area to the refinement area and then into the place of consumption is an important obstacle currently affecting the scale of heavy oil production. Trevisan [2] mentioned these points, and possibilities for overcoming these obstacles by reducing the pressure drop during flow using various alternative types of technology mentioned in the literature review. Thus, it has been established by Trevisan [2] that it is possible to reduce viscosity. However, each of these techniques mentioned in the literature review was subject to limitations, either technical or financial. CAF is recognized as one of the most important technologies used to transport heavy oil, and it has great efficiency when compared to the remainder of the techniques used in this field. This technique involves injecting water, which is less viscous, near the pipe surface to prevent contact between the high-density oil and the inner side of the pipe wall. This technique provides a marked result in pressure drop reduction throughout the flow and thus reduces transportation costs. Bannwart [3] described the problems users of the CAF technique can encounter during practical application; for example, if contact arises between the inside surface of the pipe and the heavy oil, this leads to a substantial rise in the pressure drop within the transportation system, with observable impact. However, the most important feature of this technology is the lack of modification required; therefore, a change in the viscosity of an oil is not required, but the pressure drop during transportation significantly reduces the cost. In the literature review, many studies and research works connected to the development and improvement of CAF were mentioned, e.g., Anand et al. [4], Bensakhria et al. [5], Crivelaro et al. [6], Gosh et al. [7], Raghvendra et al. [8] and Rodriguez et al. [9]. Furthermore, it is crucial to explore and investigate the effect of the presence of air, considered the third level in CAF (along with water and oil) to measure the resulting decrease in pressure. Therefore, heavy oil, water, and air are considered the three phases of CAF. Some researchers mentioned in the literature review described three-phase CAF. These were all conducted experimentally and involved modeling techniques, e.g., Ferreira et al. [10], Bannwart et al. [1], Poesio et al. [11], Strazza et al. [12] and Trevisan, [2].
Flow patterns and the drop in pressure for a heavy oil-water-air flow are achieved in crystal tubing of a diameter of 2.84 cm, heavy oil at 3.4 Pa·s viscosity, and 970 kg/m3 at 20 °C temperature, water with air under various incorporations of distinct compositions, horizontal, vertical, and inclined pipes was conducted by Bannwart et al. [1]. Nine flow patterns were established and verified in this study. Their investigation obtained that, when related to the flow of two-phase heavy oil-water only, the presence of air increases the speed of the mixture and, accordingly, a greater drop in pressure. A further experimental investigation linked CAF and a novel database for liquid-liquid-gas three-phase flow to propose a modest model for locating and determining a pressure drop, as conducted and presented by Poesio et al. [11]. Their study observed the impact of injecting air into a controlled pressure drop with liquid-liquid in an annular flow. In addition to this, they detected an error rate of below ±15% in the measurement data linked to the proposed model. An additional experimental study of heavy water-oil-air three-phase flow was conducted by Strazza et al. [12]. They focused on the effect of gas present in a two-phase liquid-liquid core annular flow. The flow map they created based on their results revealed that the rise in air flow, and the reliability of the oil core, result in separation in a chaotic flow model. The drop in pressure values obtained was related to the suggested hypothetical model for the flow of highly viscous oil, water, and air core three-phase flow. Finally, they acquired a variation among the experimental and projected drop of 20%. Heavy oil-water-air three-phase flow in a horizontal pipe has been analyzed using the CAF technique. Identification of an optimal number of grids to achieve the highest precision is accomplished using a grid independent method. The primary goal of the investigation described in this study is to numerically estimate the flow of heavy water-oil-air under varied thermal and air volume fraction circumstances. This study examines the factors that encourage core flow to occur in pipes because it is a practical necessity for heavy oil production and transportation.

2. Methodology and Numerical Formulation

The LES model is used to perform small-scale simulations and to produce information and data on SGS models for high-concentration impacts. Consequently, the SGS model requires greater accuracy to be effective and to be suited to changing local conditions. Therefore, the LES model is used in a straight horizontal pipe in this study. The results obtained from the model were validated with the results stated by Ferreira et al. [10], who described how to obtain proper results and design a model, and how to manage accurate effects to produce accurate and useful information.

2.1. LES for CAF Simulation Using CFD in the Horizontal Pipe

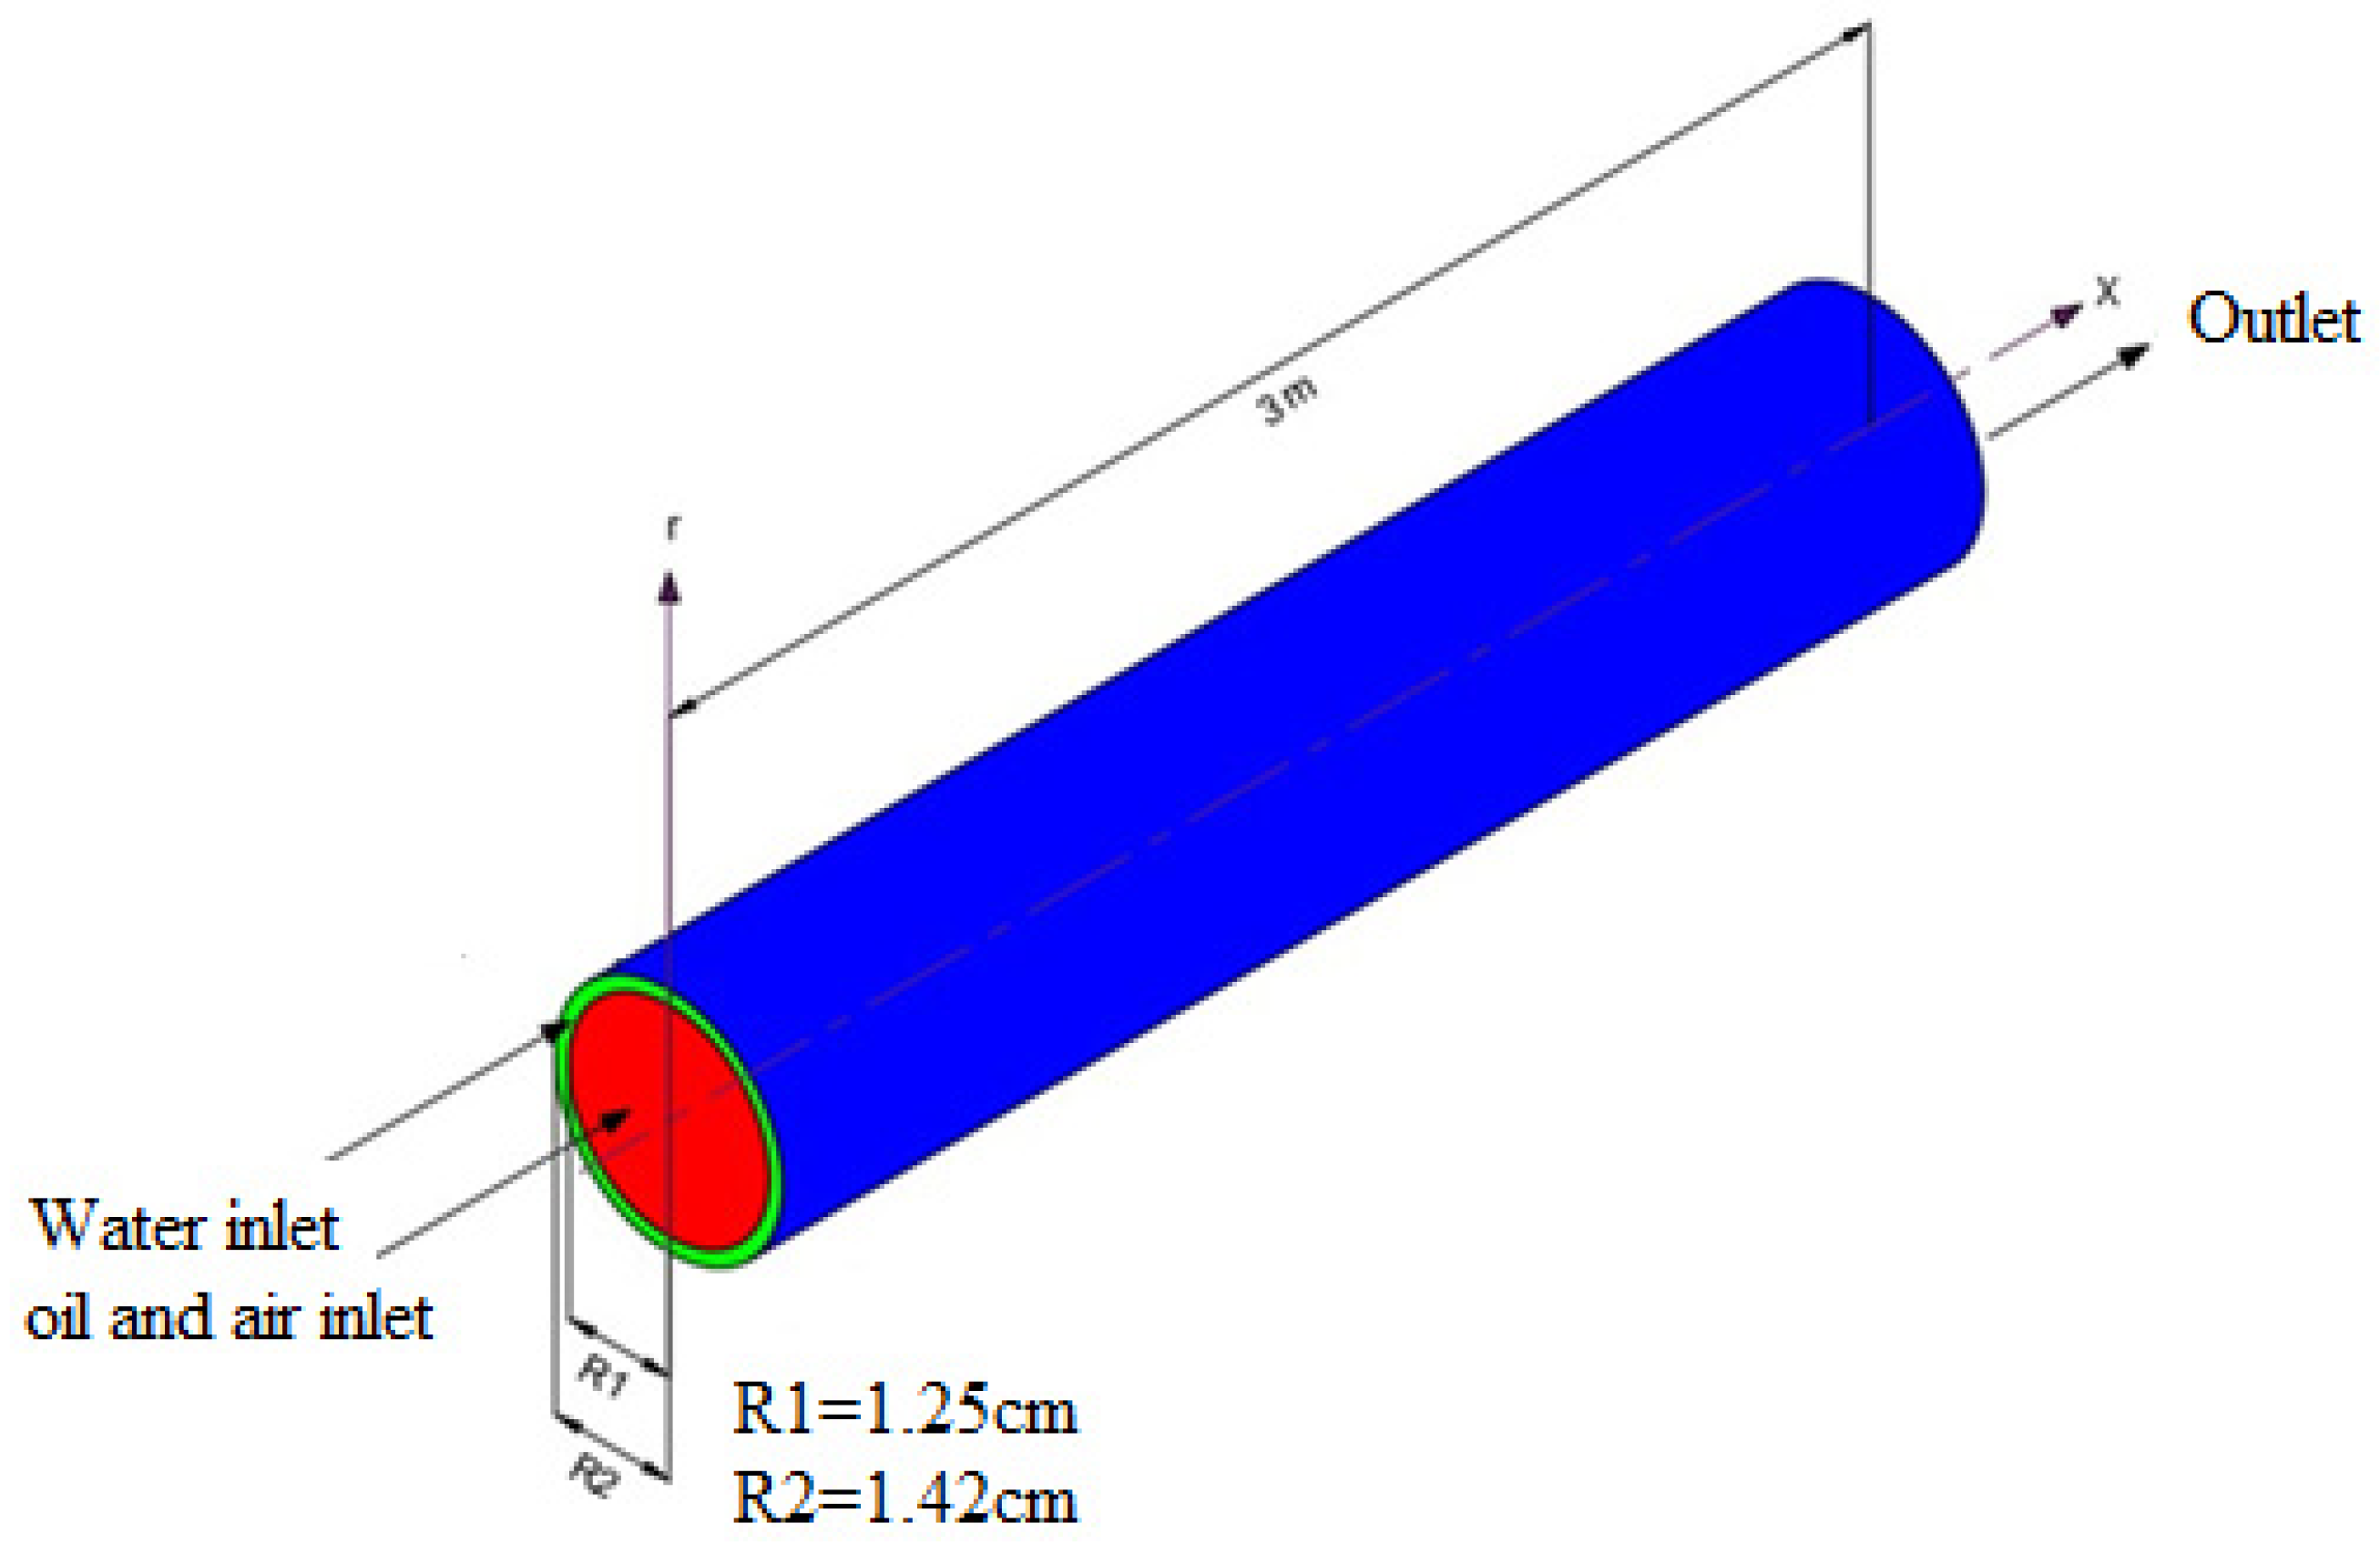
Figure 1 shows the three-phase flow in a selected pipe created from a 3D-dimensional model. It should be underlined that incoming liquids included heavy crude oil, water, and air. After that, the straight pipe was modeled. It is important to create a mesh of the geometry using hexahedral structured components to quantitively examine the behavior of the CAF for an oil-water mixture in the presence of air. Table 1 shows the thermophysical properties of water, oil, and air at 25 °C.
The dimensions of the model selected for the analysis is shown in Table 2.
Using the formulae listed in Table 3, which were derived from various bases, the viscosity of the three phases for the CAF model flow was computed. Kreith and Bohn [13], Santana et al. [14], and Trevisan [2] provided the formulae needed to calculate the viscosity of water, air, and heavy oil. The following equations were applied to determine the viscosities of water-heavy oil-air three-phase fluid:
The equation used to calculate the fluid properties relies on statistics given by Kreith and Bohn [13]. The choice of temperature is in the range of 0 °C ≤ T ≤ 100 °C.

2.2. VOF Model

The VOF model is based on three multiphase flow models that use the Euler-Euler technique. The phases in the VOF model are made for two or more unmixable fluids, in which the location of the fluid interface is of concern. In the selected VOF model, the volume fraction continuity equation in one or more phases is solved with a single set of momentum equations, and is calculated as follows:
𝜕 ( ρ k α k ) 𝜕 t + · ρ k α k u = 0
where α k is the volume fraction for an auxiliary status. The volume fraction for the status contains a value of 1 when a control volume is filling up with the k t h liquid, a value of 0 when the control volume is unfilled with the k t h liquid, and a value between 0 and 1 if an interaction is used for the cell. The status of the volume fraction does not recognize interaction. Subsequently, various interact arrangements could be matched to a similar value for the status of volume fraction, and numerous systems were proposed to follow the interaction precisely,
When the boundary length scales get close to the computing grid scale, the VOF model’s accuracy decreases. The VOF model can therefore be thought of as general modeling for usage in situations where the interface length scale is considerable. The VOF model is regarded as an adequate and suitable model for simulating CAF in a pipe because the interface relating to heavy oil and water is, in terms of approach magnitude, larger than the pipe diameter.

2.3. Development of Model and LES Method

Physical Model

A model study was selected from the literature review (Ferreira et al. [10]) for reproduction, with some minor simplifications and modifications. The 3D model of the selected three phases for the CAF model for the selected pipe was built as indicated in Figure 2. Initially, the horizontal pipe contains two inlets, and water is injected near the pipe wall and oil with air into the core of the pipe. High-density crude oil and water are the inflow fluids. The horizontal straight pipe geometry, dimensions, and properties are shown in Table 1 and Table 2. Three-phase flow in the horizontal pipe depends on various parameters; e.g., diameter, pipe roughness, pipe material, friction pressure gradient, velocity, and physical properties. The ANSYS Fluent package was used to solve this model. In addition, the SGS model and the governing equations are discretized using FVM. The governing equations were then resolved using a segregated solver. The computation was then accomplished for turbulent unsteady flows to examine the underlying improvements before studying the initial development of CAF. Additionally, this study investigated unsteady streams, non-miscible liquid pairs, constant fluid characteristics, and the co-axial entry of liquids. The length of the computational flow field in horizontal pipes is 3 m long and 0.0284 m is the inside diameter of the pipe selected, while high-density oil forms the core (viscosity μ = 0.64 Pa·s and density ρ = 971 kg/m3) and water is taken as the annular fluid (viscosity μ = 0.001375 Pa·s and density ρ = 997.2 kg/m3).

2.4. Governing Equations

In the present study of the three-phase CAF approach in the straight pipe, for heavy oil, water, and airflow, the following conditions were considered during the simulation:
  • The model should be incompressible and support transient flow.
  • There should be no chemical reactions between the oil and water during the simulation.
  • Gravitational and drag impacts should be presented.
  • The viscosities of the heavy oil, air, and water should be presented as temperature functions.
  • The interfacial transport of mass between the oil, water, and air phases is zero.
Regarding the points mentioned above, the conservation equations for energy, mass, and momentum were utilized for the multiphase flow of highly viscous oil, water, and air (H. K. Versteeg and W. Malalasekera [15].
A low conservation of mass is applied to derive the continuity equation. Therefore, the continuity equation can be defined thus:
𝜕 u i 𝜕 t = 0
where u i is the velocity field and i is in the set {1, 2, 3, etc.}. Repeated indices are summarized according to Einstein’s summation convention.
Viscosity is assumed to be of constant viscosity, all types of bodily forces will be neglected, and the momentum equation or Navier-Stokes equation is considered in the form below:
𝜕 u i 𝜕 t + 𝜕 x j ( u i u j ) = 1 ρ 0 𝜕 P 𝜕 x i + 𝜕 𝜕 x j   [ v   ( 𝜕 u i 𝜕 x j + 𝜕 u j 𝜕 x i ) ]
where ρ, P , and v are the density, pressure, and kinematic viscosity, respectively. This vector equation, together with the continuity equation, is called the Navier-Stokes equation (N-S equation).
Specific heat c p is presumed to be constant, and the energy and temperature relationship is e = c p T. The energy equation can be calculated as:
𝜕 T 𝜕 t + 𝜕 u j T 𝜕 x j = v P r   𝜕 2 T 𝜕 x j 𝜕 x j
where the Prandtl number is calculated and introduced as Pr = c p v ρ k , and k is thermal conductivity. Therefore, if the Reynolds number is high, the computational cost will also be high. Therefore, this method is required to reduce the requirement for a full solution, by introducing a model that incorporates turbulent behavior on the smallest spatial scales. This model is an LES, with a spatial filtering process that softens and smooths turbulent behavior by removing the smallest spatial scales applied. After applying the filter, the resulting equations then contain an SGS stress tensor. Therefore, the continuity equation, the N-S equation, and energy after filtering are obtained in the form below:
𝜕 u ¯ i 𝜕 x i = 0
𝜕 u ¯ i 𝜕 t + 𝜕 𝜕 x j ( u ¯ i u ¯ j ) = 1 ρ 0 𝜕 P ¯ 𝜕 x i + 𝜕 𝜕 x j   [ v   ( 𝜕 u ¯ i 𝜕 x j + 𝜕 u ¯ j 𝜕 x i ) + τ i j ]
where the SGS stress tensor τ i j is given by:
τ i j   =   u ¯ i u ¯ j     u i u j ¯ ,
The LES model addresses unstable fields in space and time if Δx is small enough. The majority of SGS models make an eddy viscosity assumption (Boussinesq’s hypothesis) when modeling the SGS stress tensor:
τ i j = 2   v t   S ¯ i j + 1 3   τ l l δ i j
where,
S ¯ i j = 1 2   ( 𝜕 u ¯ i 𝜕 x j + 𝜕 u ¯ j 𝜕 x i )
Therefore, the LES Equation (3) becomes:
𝜕 u ¯ i 𝜕 t + u ¯ j 𝜕 u ¯ i 𝜕 x j = 1 ρ 0 𝜕 P ¯ 𝜕 x i + 2   𝜕 𝜕 x j   [ ( v + v t )   S ¯ i j ]
The modified pressure P ¯ = p ¯ − (1–3) ρ 0 τ i j was introduced, and will be decided with the help of a filtered continuity Equation (2), by examining the deviation of Equation (7). This implies variations of the eddy viscosity ( v t ).
Under generally non-restrictive assumptions made by Leonard [16], filtering and differentiation are replaced as:
𝜕 u 𝜕 x ¯ = 𝜕 u ¯ / 𝜕 x
An equation for u ¯ is obtained by applying N-S equations with the same spatial filter function:
𝜕 u ¯ 𝜕 t +   ·   u u ¯ = P ¯ + v 2 u ¯
Consequently, for constant density flow, P = p/ρ. Because filtered non-linear terms ( u u ¯ ) cannot be expressed in terms of known resolved components ( u ¯ ) , nonlinear terms are not closed, much like in conventional turbulence modeling.
To prevent this problem, an SGS stress is initiated, such that:
u u ¯   =   u ¯ u ¯ + τ .
Then the momentum equation becomes:
𝜕 u ¯ 𝜕 t +   ·   u u ¯ = P ¯ + v 2 u ¯   · τ
The turbulence modeling goal seeks to measure the SGS stress ( τ ) from the determined velocity field ( u ¯ ) .
Filtering incompressible N-S equations can be defined thus:
𝜕 u i ¯ 𝜕 t + 𝜕 ( u i ¯ u j ¯ ) 𝜕 x j = 𝜕 P ¯ 𝜕 x i + v   𝜕 2 u i ¯ 𝜕 x j 2 𝜕 ( u i u j ¯ u i ¯ u j ¯ ) 𝜕 x j
The SGS stress tensor is defined thus:
τ i j = u i u j ¯ u i ¯   u j ¯
The equation above is similar to the original equation except for the last part, which is the SGS contribution of the unresolved/sub-grid filter field to the resolved/filtered field.
The energy equation is computed as:
𝜕 T ¯ 𝜕 t + 𝜕 u i ¯ T ¯ 𝜕 x j = 𝜕 𝜕 x j   [ v P r + v t P r t 𝜕 T ¯ 𝜕 x j ]
where a ¯ represents an amount spatially filtered, and v t is an unknown quantity connected to the SGS scales, which must be modeled.
When the N-S equations are combined with the energy equation, the energy equation will be given as:
𝜕 T ¯ 𝜕 t + ( u i ¯ T ¯ ) 𝜕 x i = 1 R e ·   P r   × 𝜕 2 T ¯ 𝜕 x i 2 𝜕 q i 𝜕 x i
where Re indicates the Reynolds number, and Pr is the Prandtl number. q i are the SGS heat flux, w is modeled by the SGS model, and the constant value of 0.85 is utilized for the turbulent Prandtl number. The SGS heat flux in the energy equation is calculated as follows:
q i = c s V P r T S ¯ 𝜕 T ¯ 𝜕 x i
where P r T is the turbulent Prandtl number.
In this chapter, the Smagorinsky-Lilly model is also applied, as in the other chapters in this study.

2.5. Numerical Methodology

In the present work, the PISO technique for the LES model was used. For the LES model’s diffusion terms, a linear central differentiation scheme with an unlimited second order was adopted. The superficial Reynolds numbers (Reso) for heavy oil, water, and air were computed as follows:
R e s o = D U s o ρ o μ o ,   R e s w = D U s w ρ w μ w   and   R e s a = D U s a ρ a μ a
where the letters o, w, and a stand for the phases of oil, water, and air, respectively, and the letter s stands for surface conditions. The inlet diameter of the pipe, density, viscosity, and velocity are denoted by the letters D, ρ, μ, and U respectively. As determined by the Reynolds Transport Theorem, the principles of the laws of conservation apply to fluid dynamics. The LES model uses the N-S equations to operate and typically lowers processing costs by narrowing the scale for the solution length.

2.6. Selected Boundary Conditions

  • At pipe inlet
    In the present model, high-density oil and air velocities are indicated in the core space of the horizontal pipe. Simultaneously, the water velocity is indicated in the horizontal pipe’s annular space as shown in Figure 2.
    The inlet boundary conditions are:
    (a)
    In the annular space representing the water inlet, the mean velocity and volume fraction of water in the direction of x are presented as follows:
    R i < γ < R e , a t x = 0 ; u w 0 v w = w w = 0 u o = v o = w o = 0 u a = v a = w a = 0 r o = r a = 0 r w = 1 T = T w
    where u, v, e, v denote vector components of velocity in the x, y, and z directions, w, o, and a denote water, oil, and air phases, respectively, and T is the temperature.
    (b)
    The core space representing the oil inlet, the mean velocity component, and the volume fraction of oil and air in the x-axis was taken as:
    0 < y < R i , a t x = 0 ; u 0 = u a 0 v 0 = w 0 = 0 v a = w a = 0 u w = v w = w w = 0 r o = 0.95 r a = 0.05 r w = 0 T = T 0 = T a
  • At pipe outlet
A pressure outlet is used at the outlet, and the diffusion fluxes for variables in the exit position were set at zero.
3.
Pipe wall boundary conditions.
A no-slip stationary and no-penetration boundary was inserted on the wall pipe as shown in Table 4:
U z = 0   ( No - slip )   and   U r = 0   ( No - penetration )
y = R e , a t   0 x L ;   u w = v w = w w = 0 u o = v o = w o = 0 u a = v a = w q = 0 T = T p = 288   K
The gradient for the quantities near the wall was mostly high and essentially required additional fine grids close to the wall to capture the change in quantities, and subsequently to make the calculation appear more expansive, though time-consuming. In addition to the need for a large memory, the computer processing must be fast and require complex equations. In this study, the focus of a fine mesh on the wall will be increased as the study develops.
A boundary layer was applied in this study on the wall to advance the performance of the wall function and to meet the requirement of a dimensionless wall distance ( y + ).
The y + is calculated as:
y + = ρ   u τ   y μ
where u τ   is the friction velocity at the nearest wall, y is the distance to the nearest wall, and μ is the local kinematic viscosity of the fluid:
u τ = τ ω ρ ,   τ ω = C f .   1 2 ρ ( U f r e e s t r e a m   v e l o c i t y ) ,   C f = [ 2   log 10 ( R e x ) 0.65 ] 2.3 , Re = ρ · U f r e e s t r e a m   v e l o c i t y · L b o u n d e d   l a y e r μ
Therefore, the selected boundary conditions and the ANSYS fluent boundary condition must match for the analytical calculations. Oil and water are permitted to flow from the inlet at a uniform speed of 1.5 and 2.2 m/s, respectively. At the outlet section (x = L), a constant mean pressure pest = 101,325 Pa, was specified, where L is the pipe length.
In this work, a root means square (RMS) residue equal to 10−7 kg/s was set as the convergence standard. The thermophysical properties of the liquids utilized in the simulation are given in Table 1, Table 2 and Table 3.

2.7. Discretization Result Systems and Computational Set-Up

The solution techniques utilized when the solver was running are illustrated in Table 5 and Table 6. Additionally, the relaxation factors began at very low numbers (0.1–0.3) and evaded divergence. As the LES flow produced initially at 100 steps, the relaxation factors were moderately expanded as they approached unity, with scaled residuals used in the order of 1 e 7 continuity for momentum. Screens were made available to track the velocity at focal points and secure places along the pipe once the simulations attained measurably stable and factually strong states. The implicit time-stepping plan was considered and approved for the time step, and the time step size was set to be identical to 0.001. Using a second-order central differencing strategy, the diffuse phrases were discretized. A convection boundedness basis was mostly used in the first-order upwind plan. With no specific wall treatment in the SGS model, a no-slip condition was applied to the solid walls. As per the study by Ferreira et al. [10], numerical values for the inflow velocities, density, and viscosity were calculated, as shown in Table 1 and Table 2. The characteristics of the simulation set-up are given in Table 6. Initial velocity and the pressure field for the LES simulation were acquired. In addition, the velocity inlet profile was obtained.
The default value of 1 is the under-relaxation factor retained for density and body force.

3. Results and Discussion

3.1. Air Phase Impact

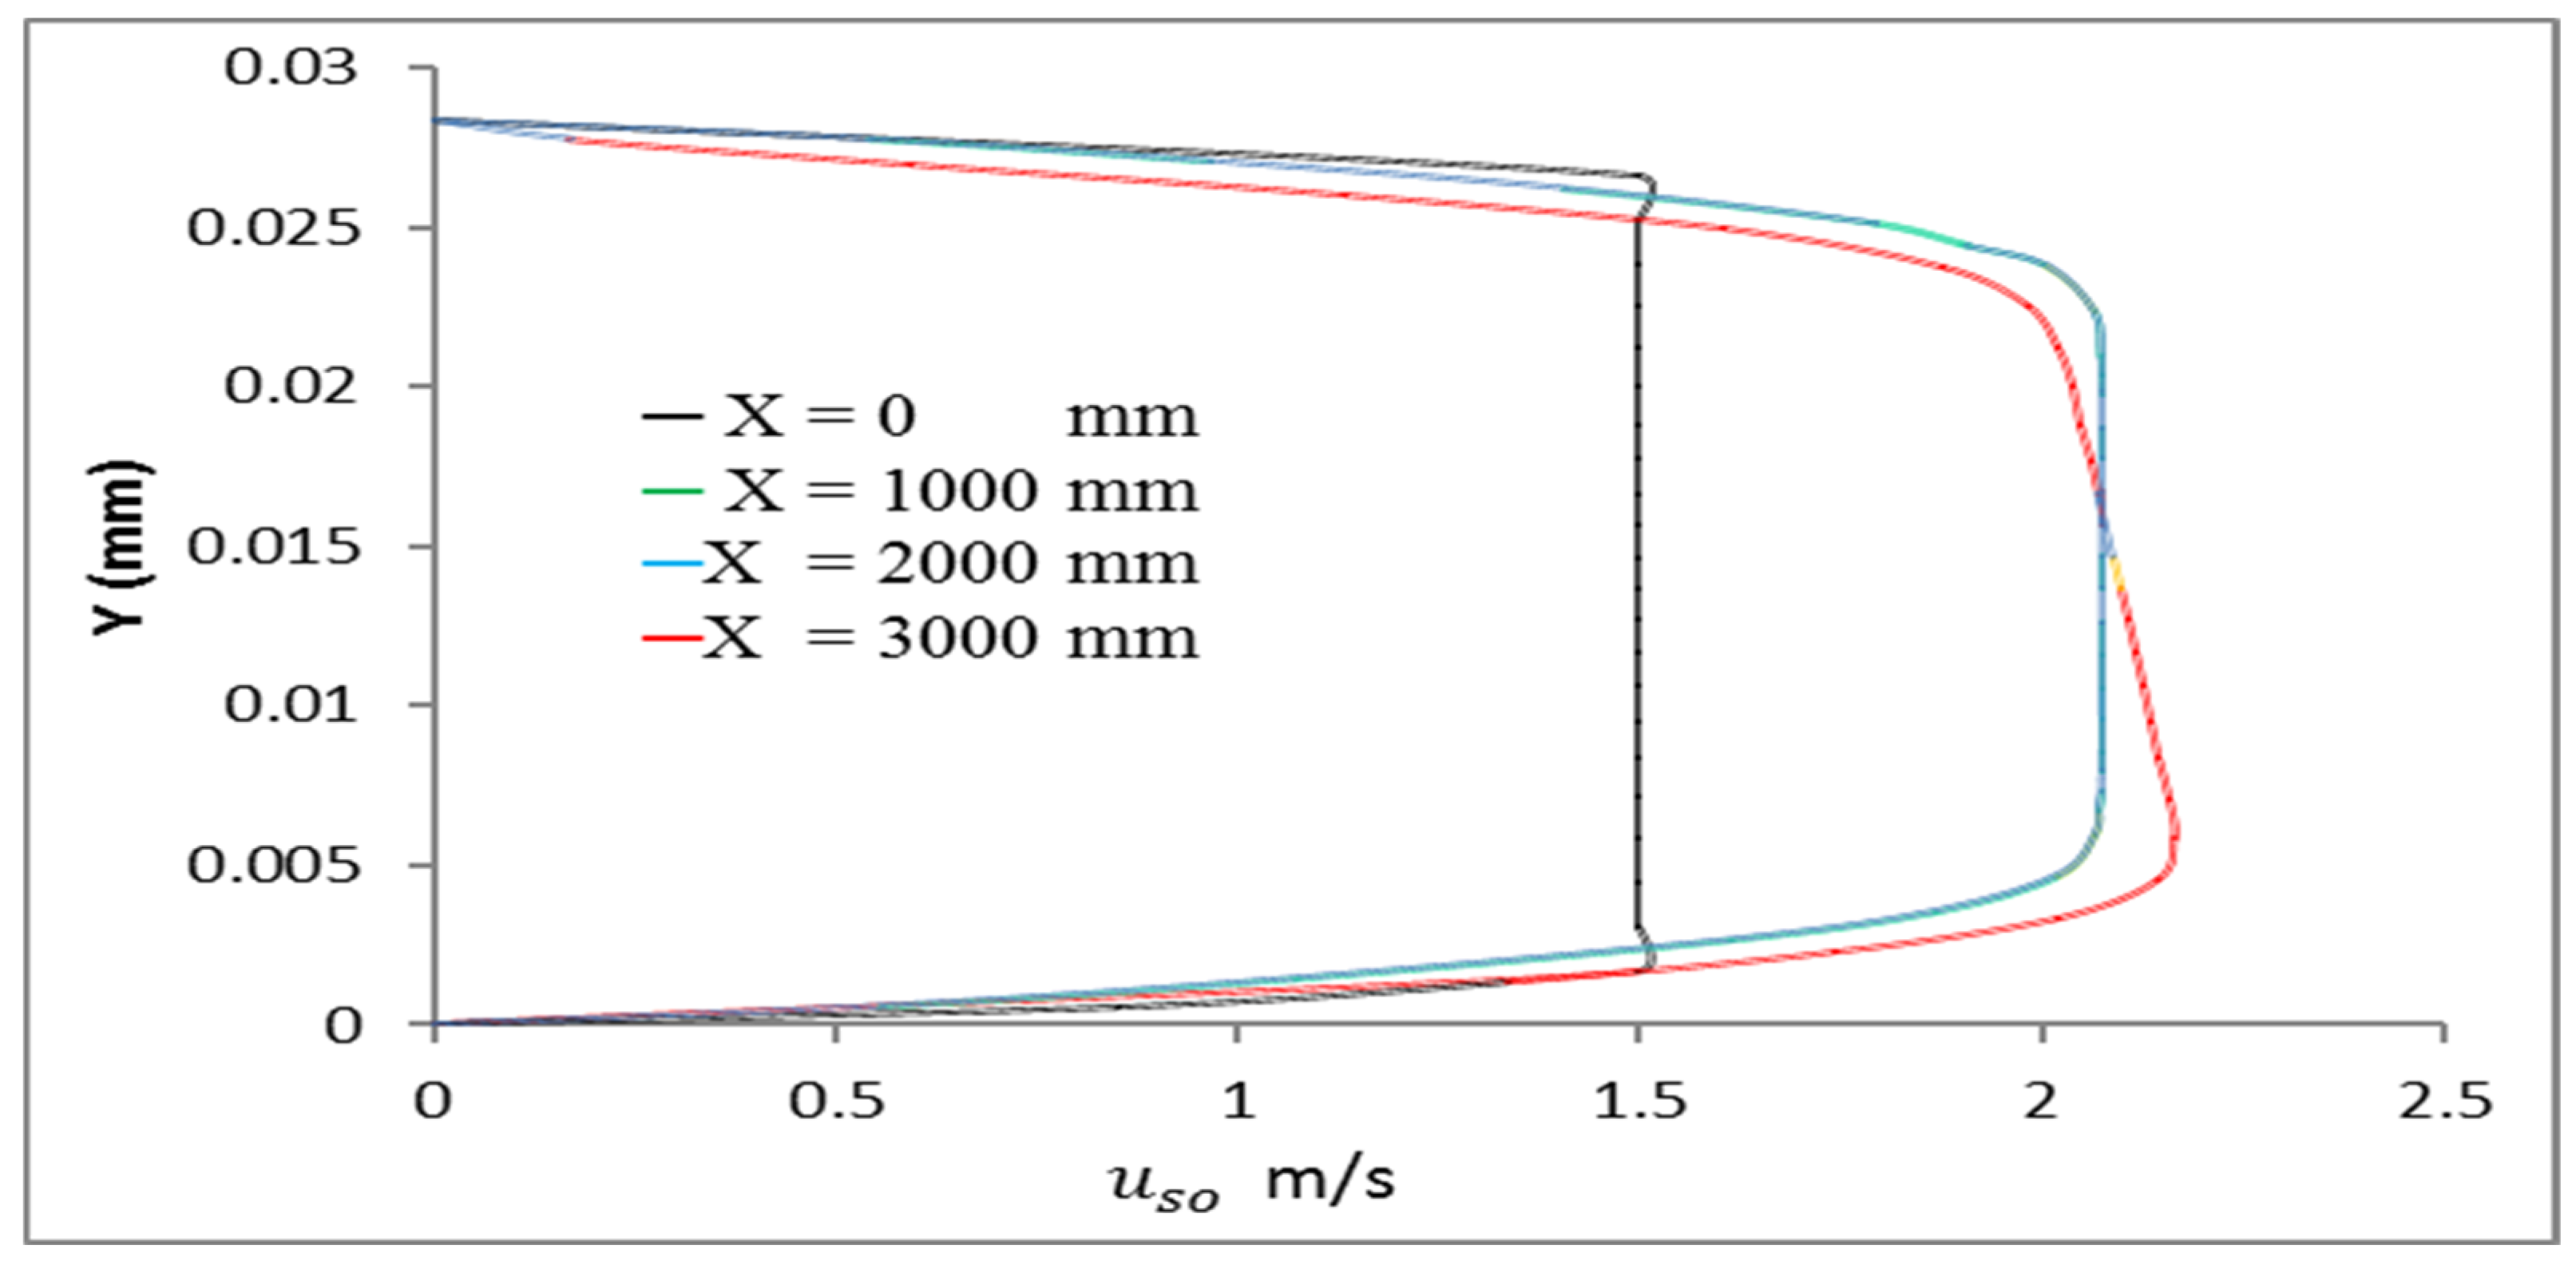
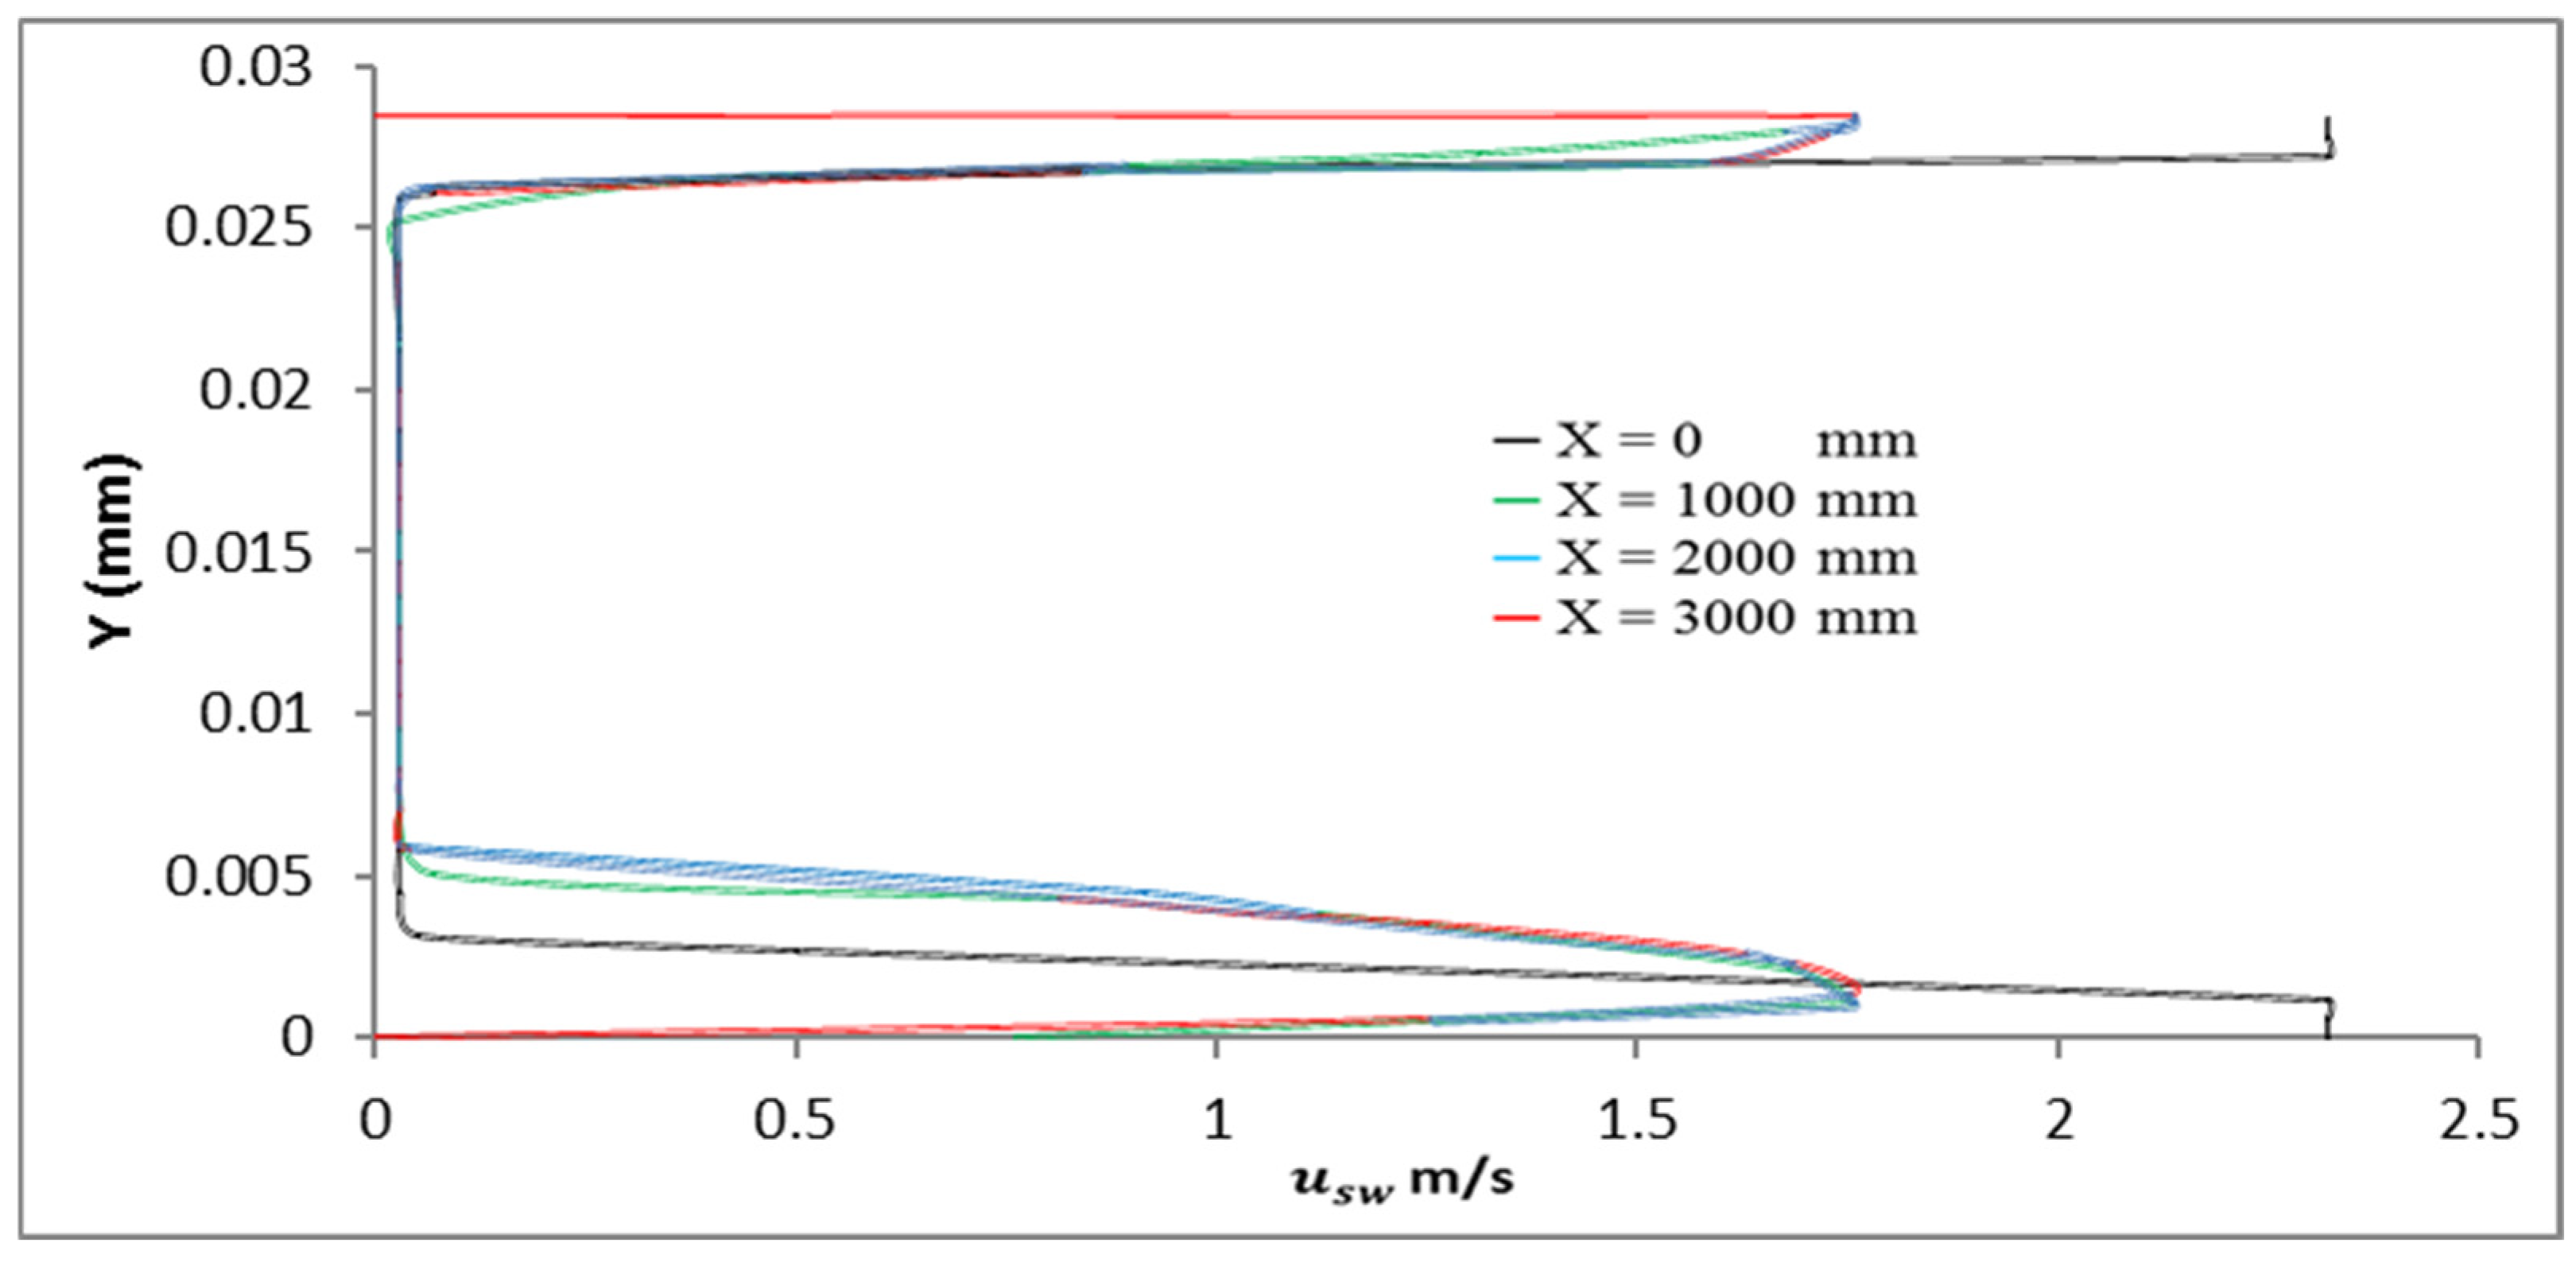
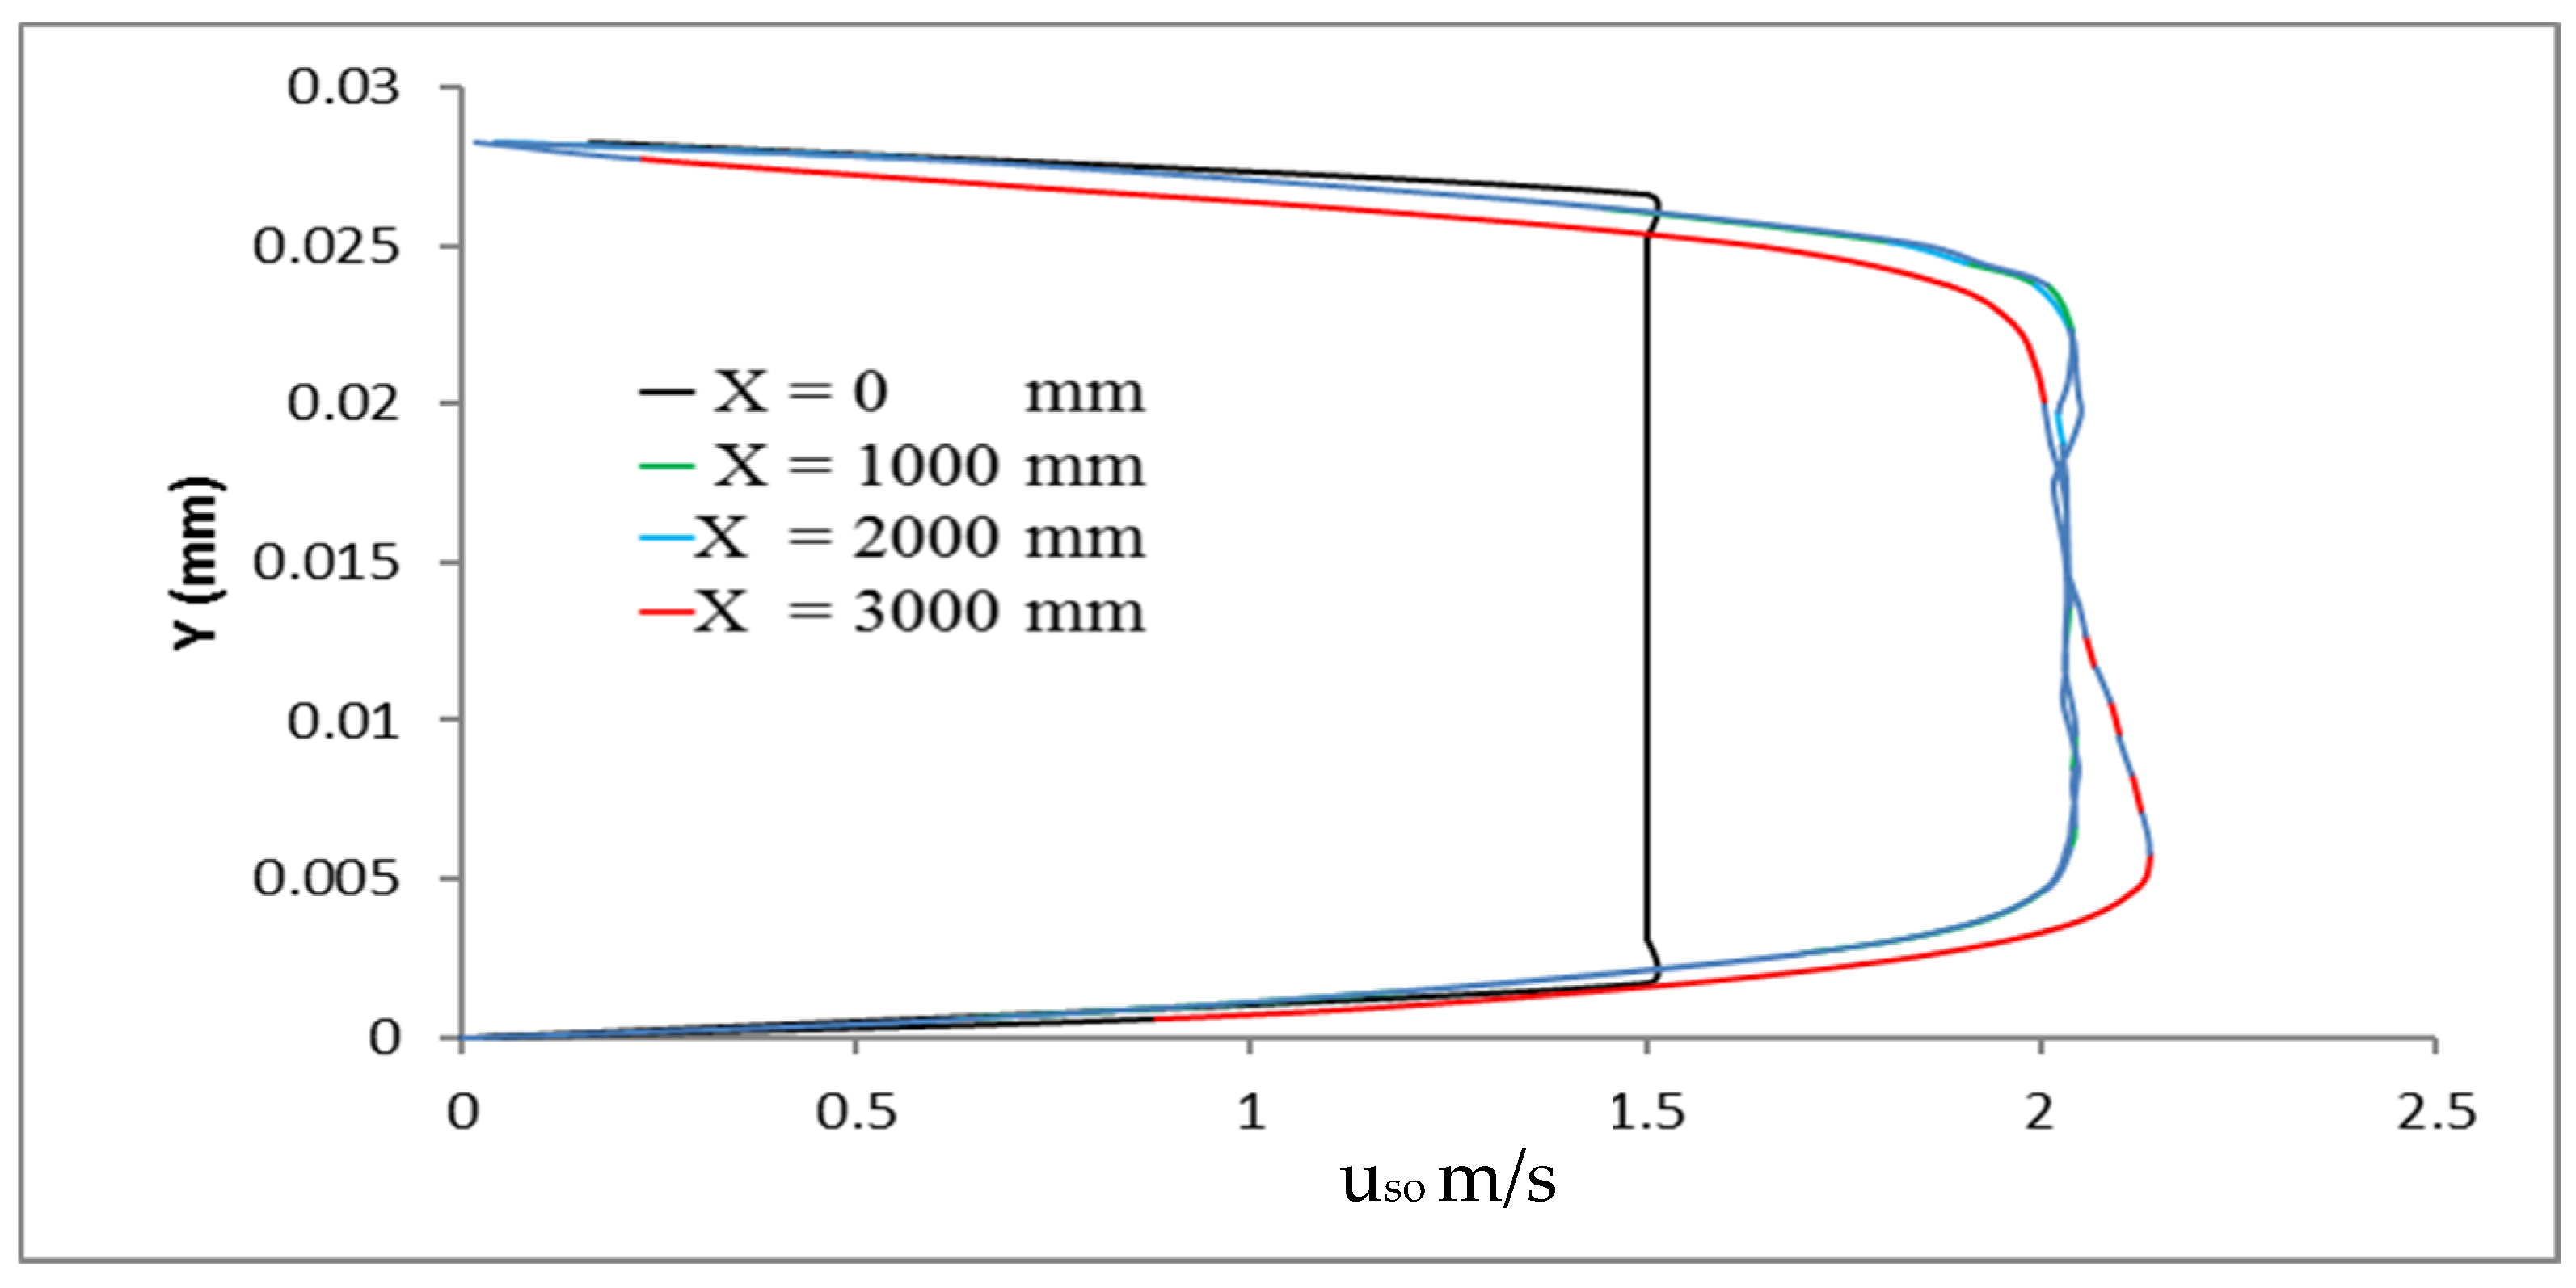
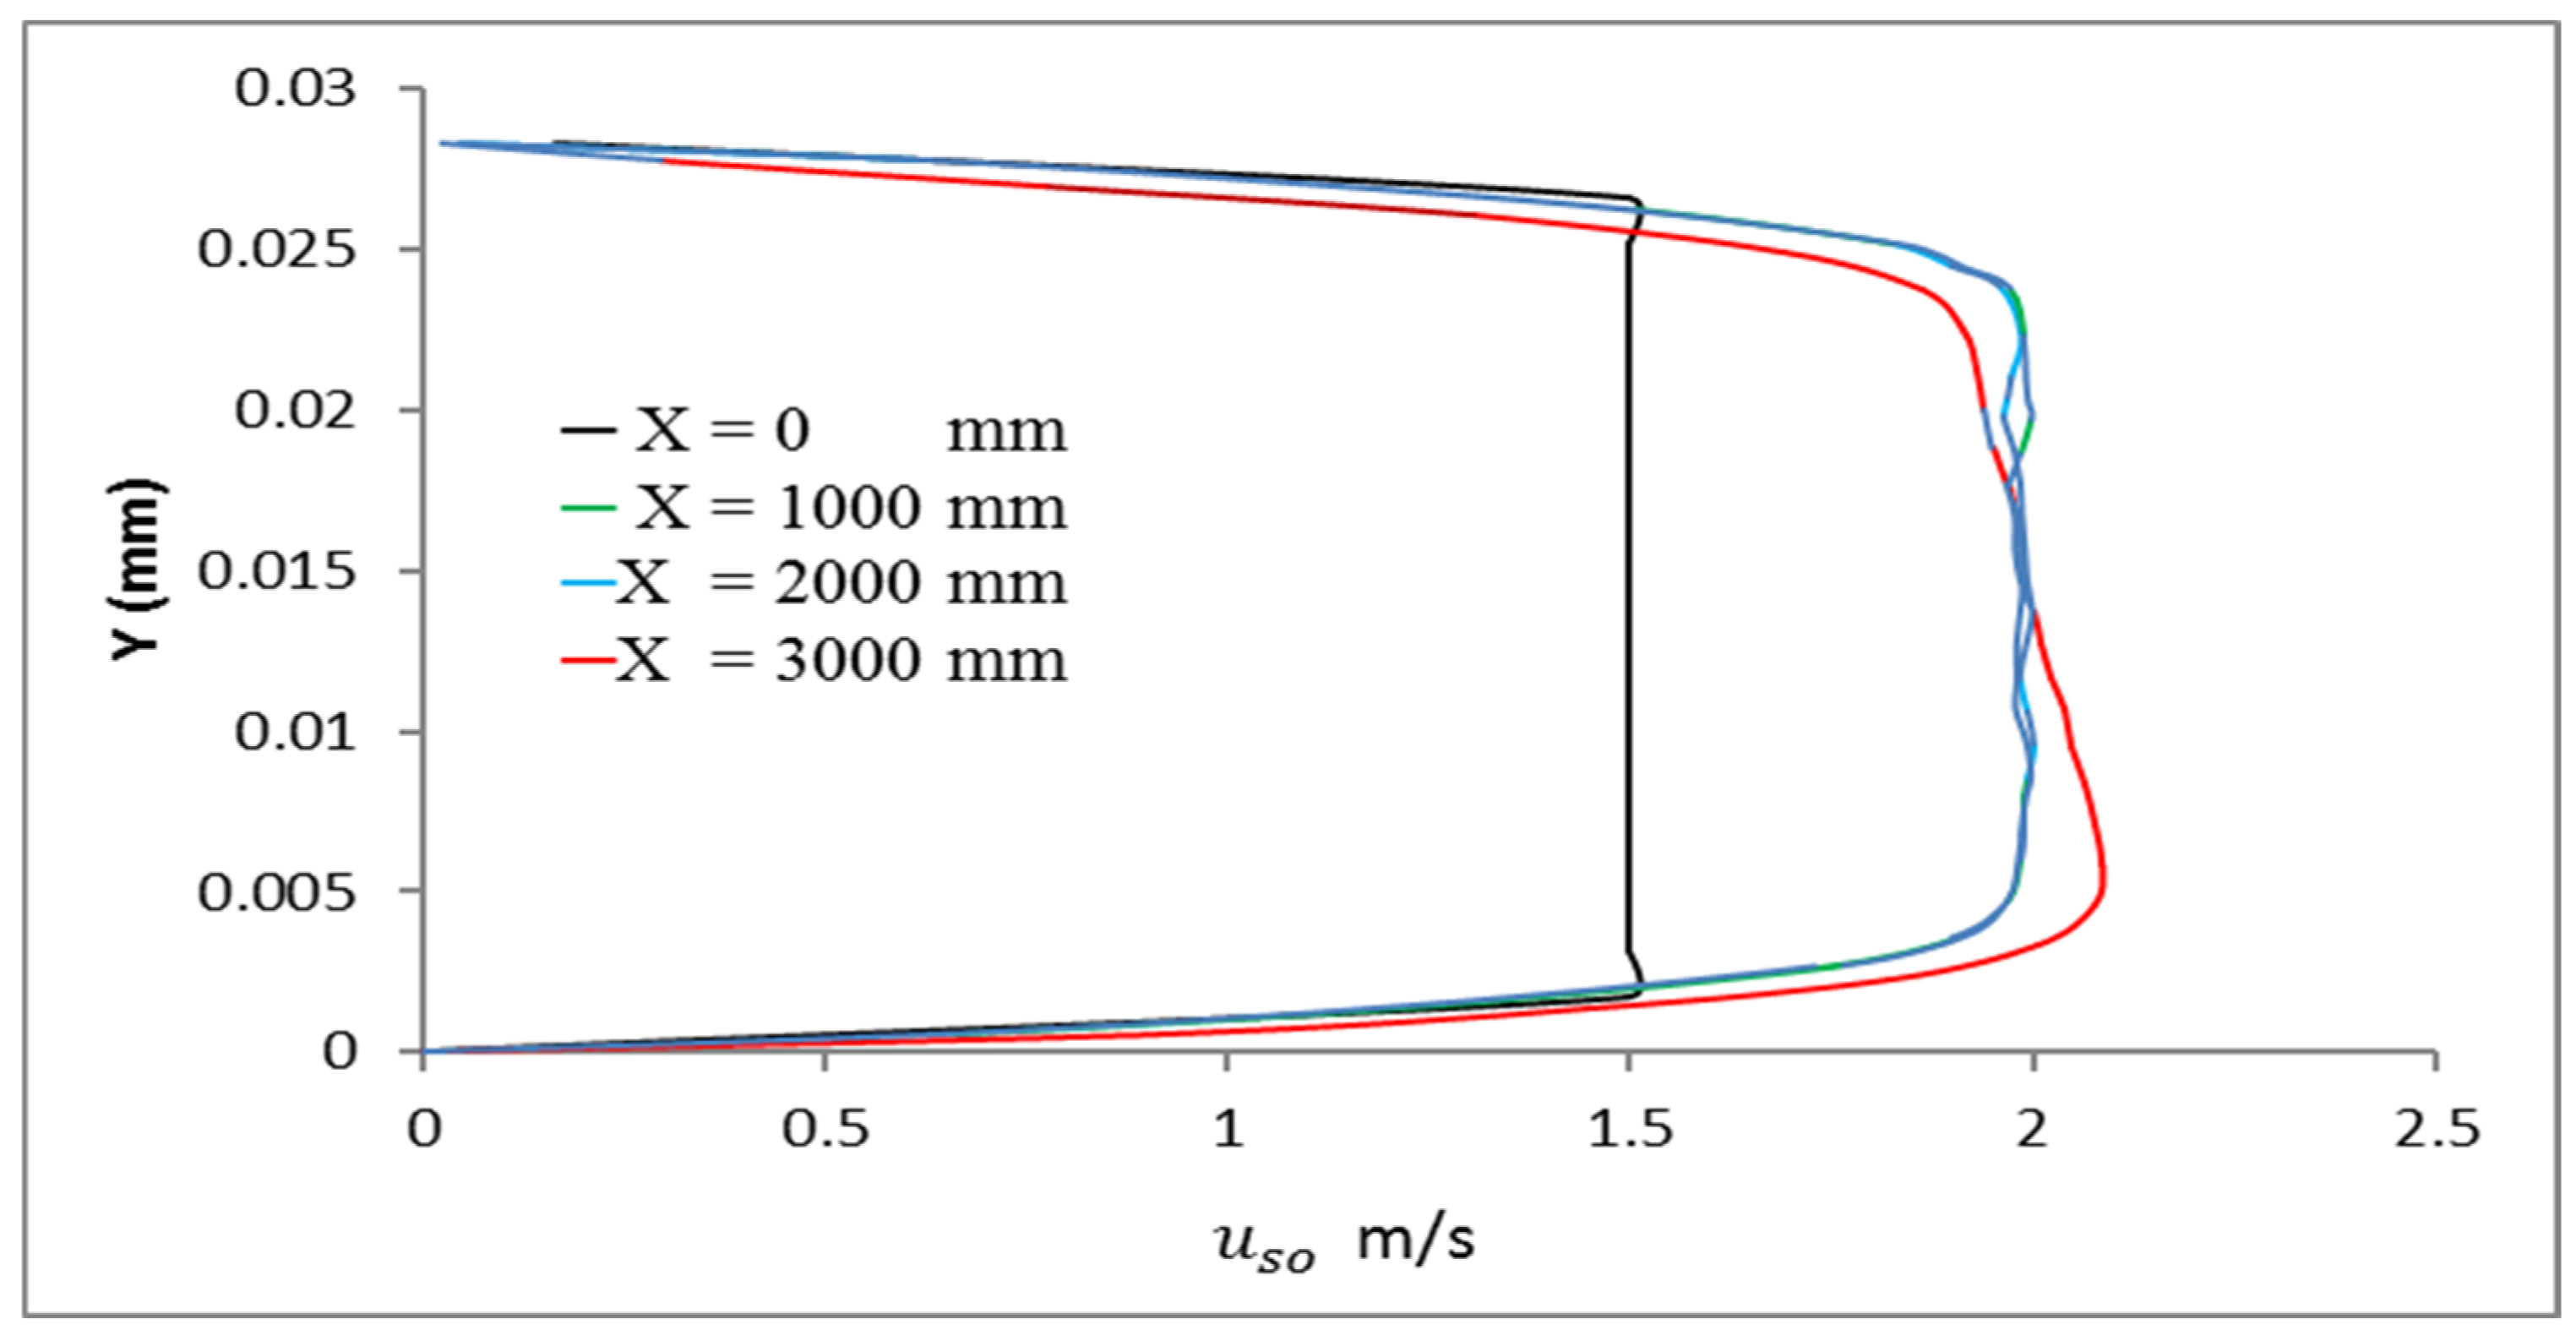
The oil-water flow and the oil-water-air flow at four places in the axial axis, Z = 0 m, were both accomplished under the same conditions and are both described and shown as superficial velocity profiles in Figure 3, Figure 4, Figure 5 and Figure 6.
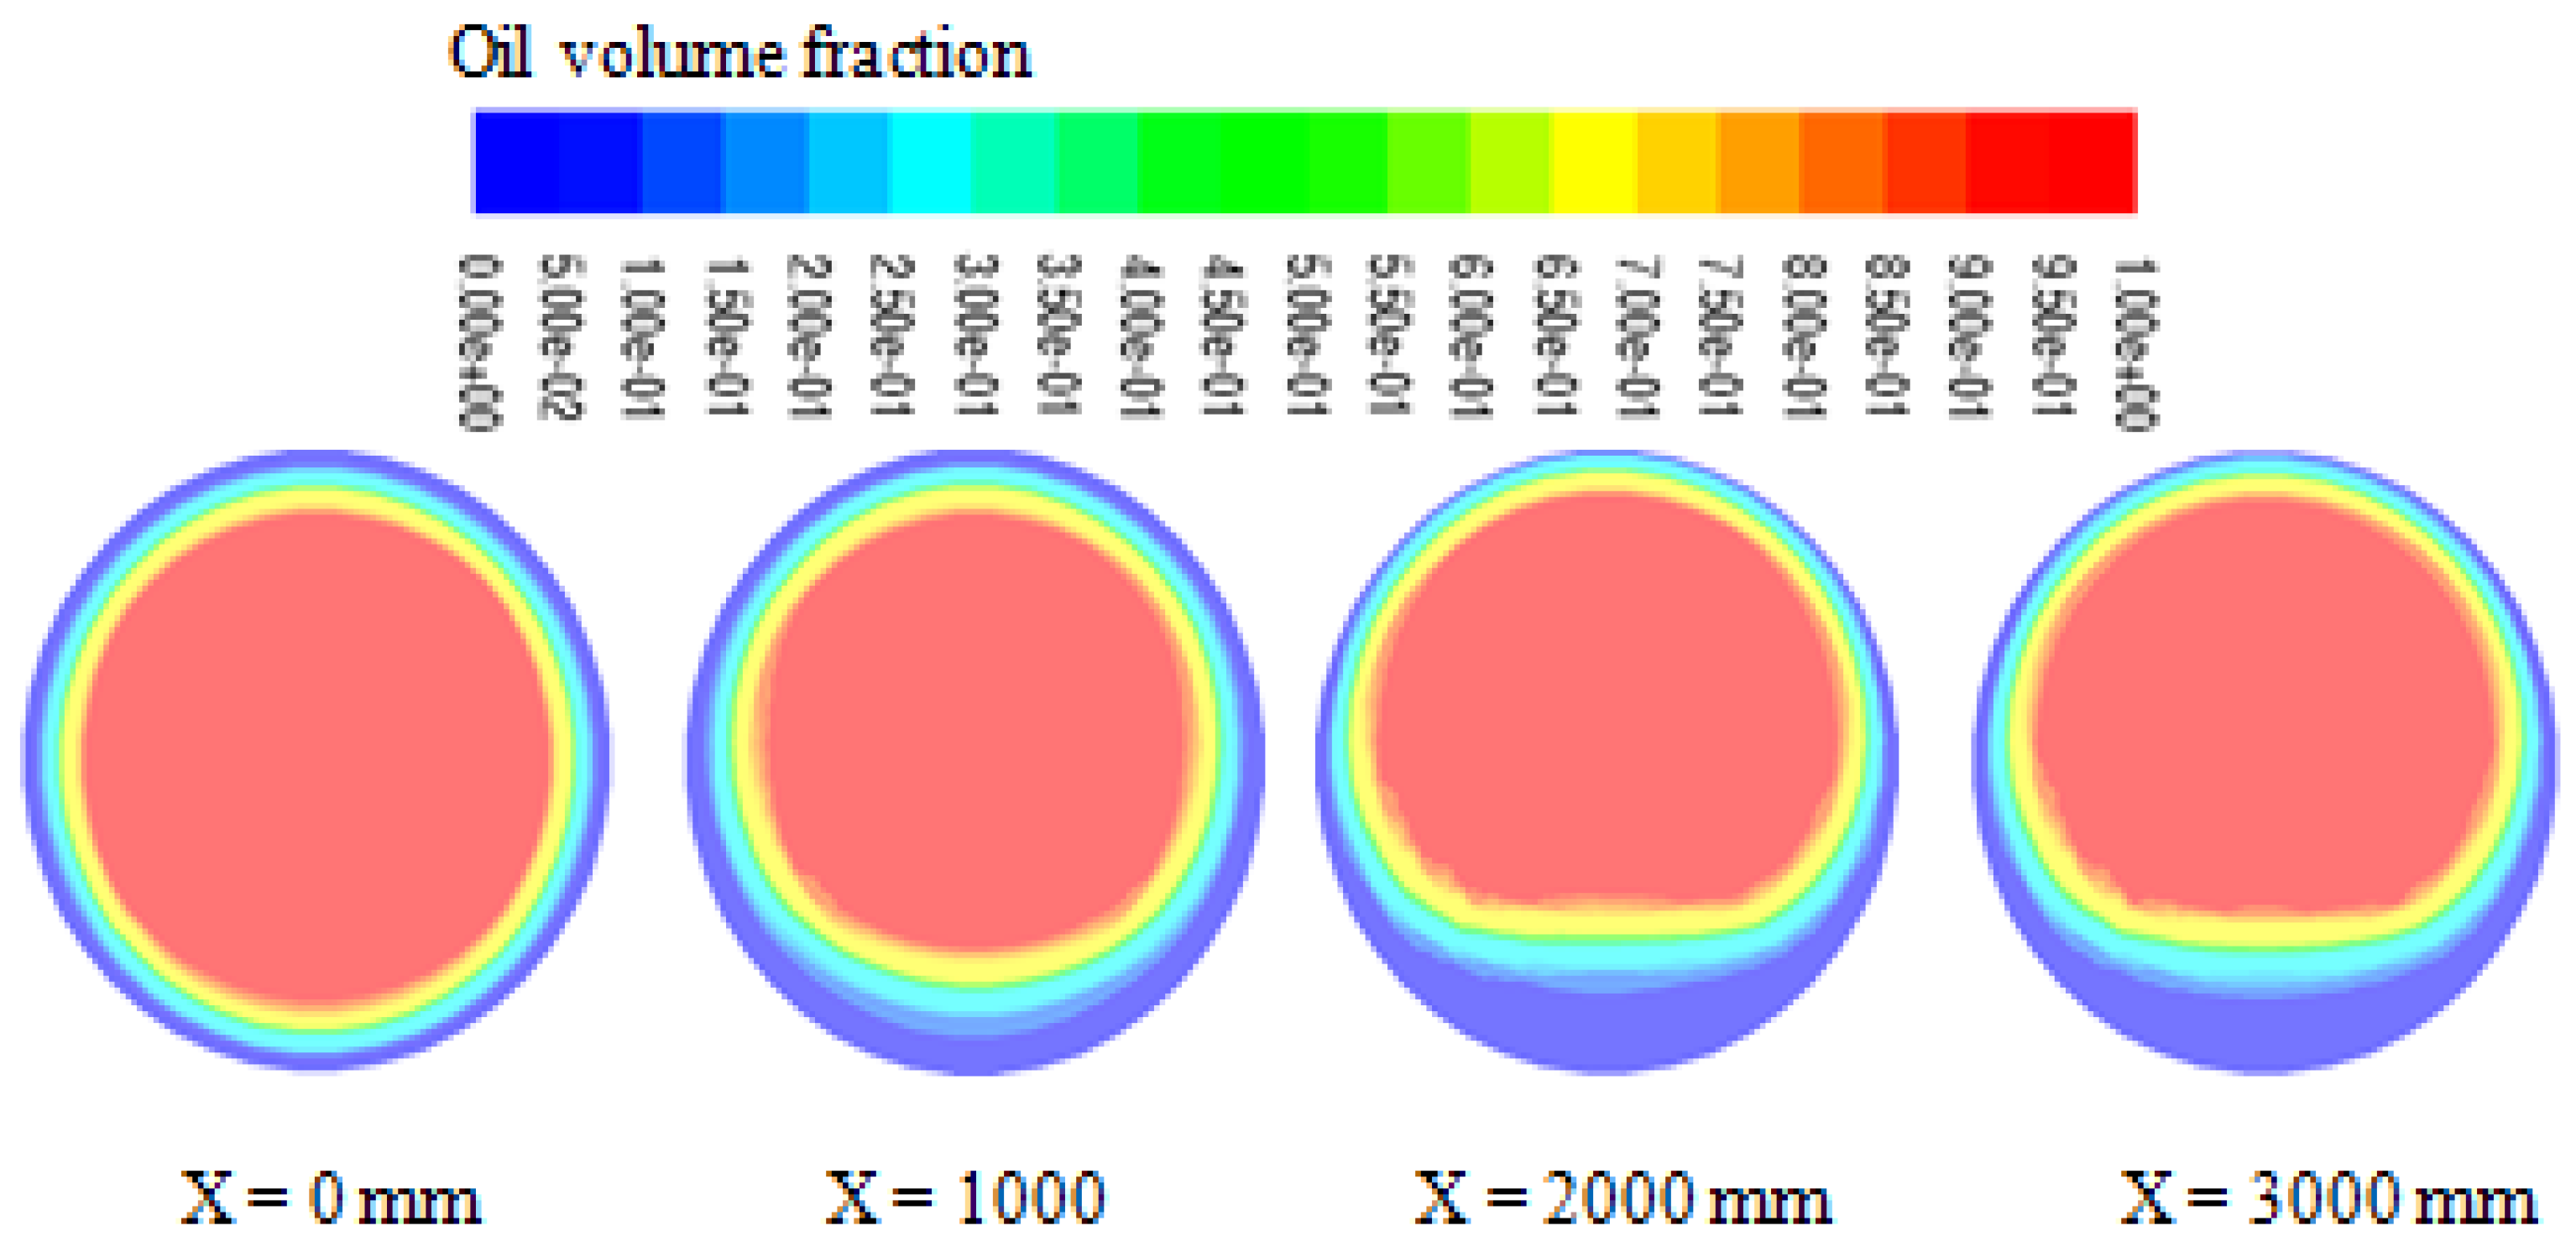
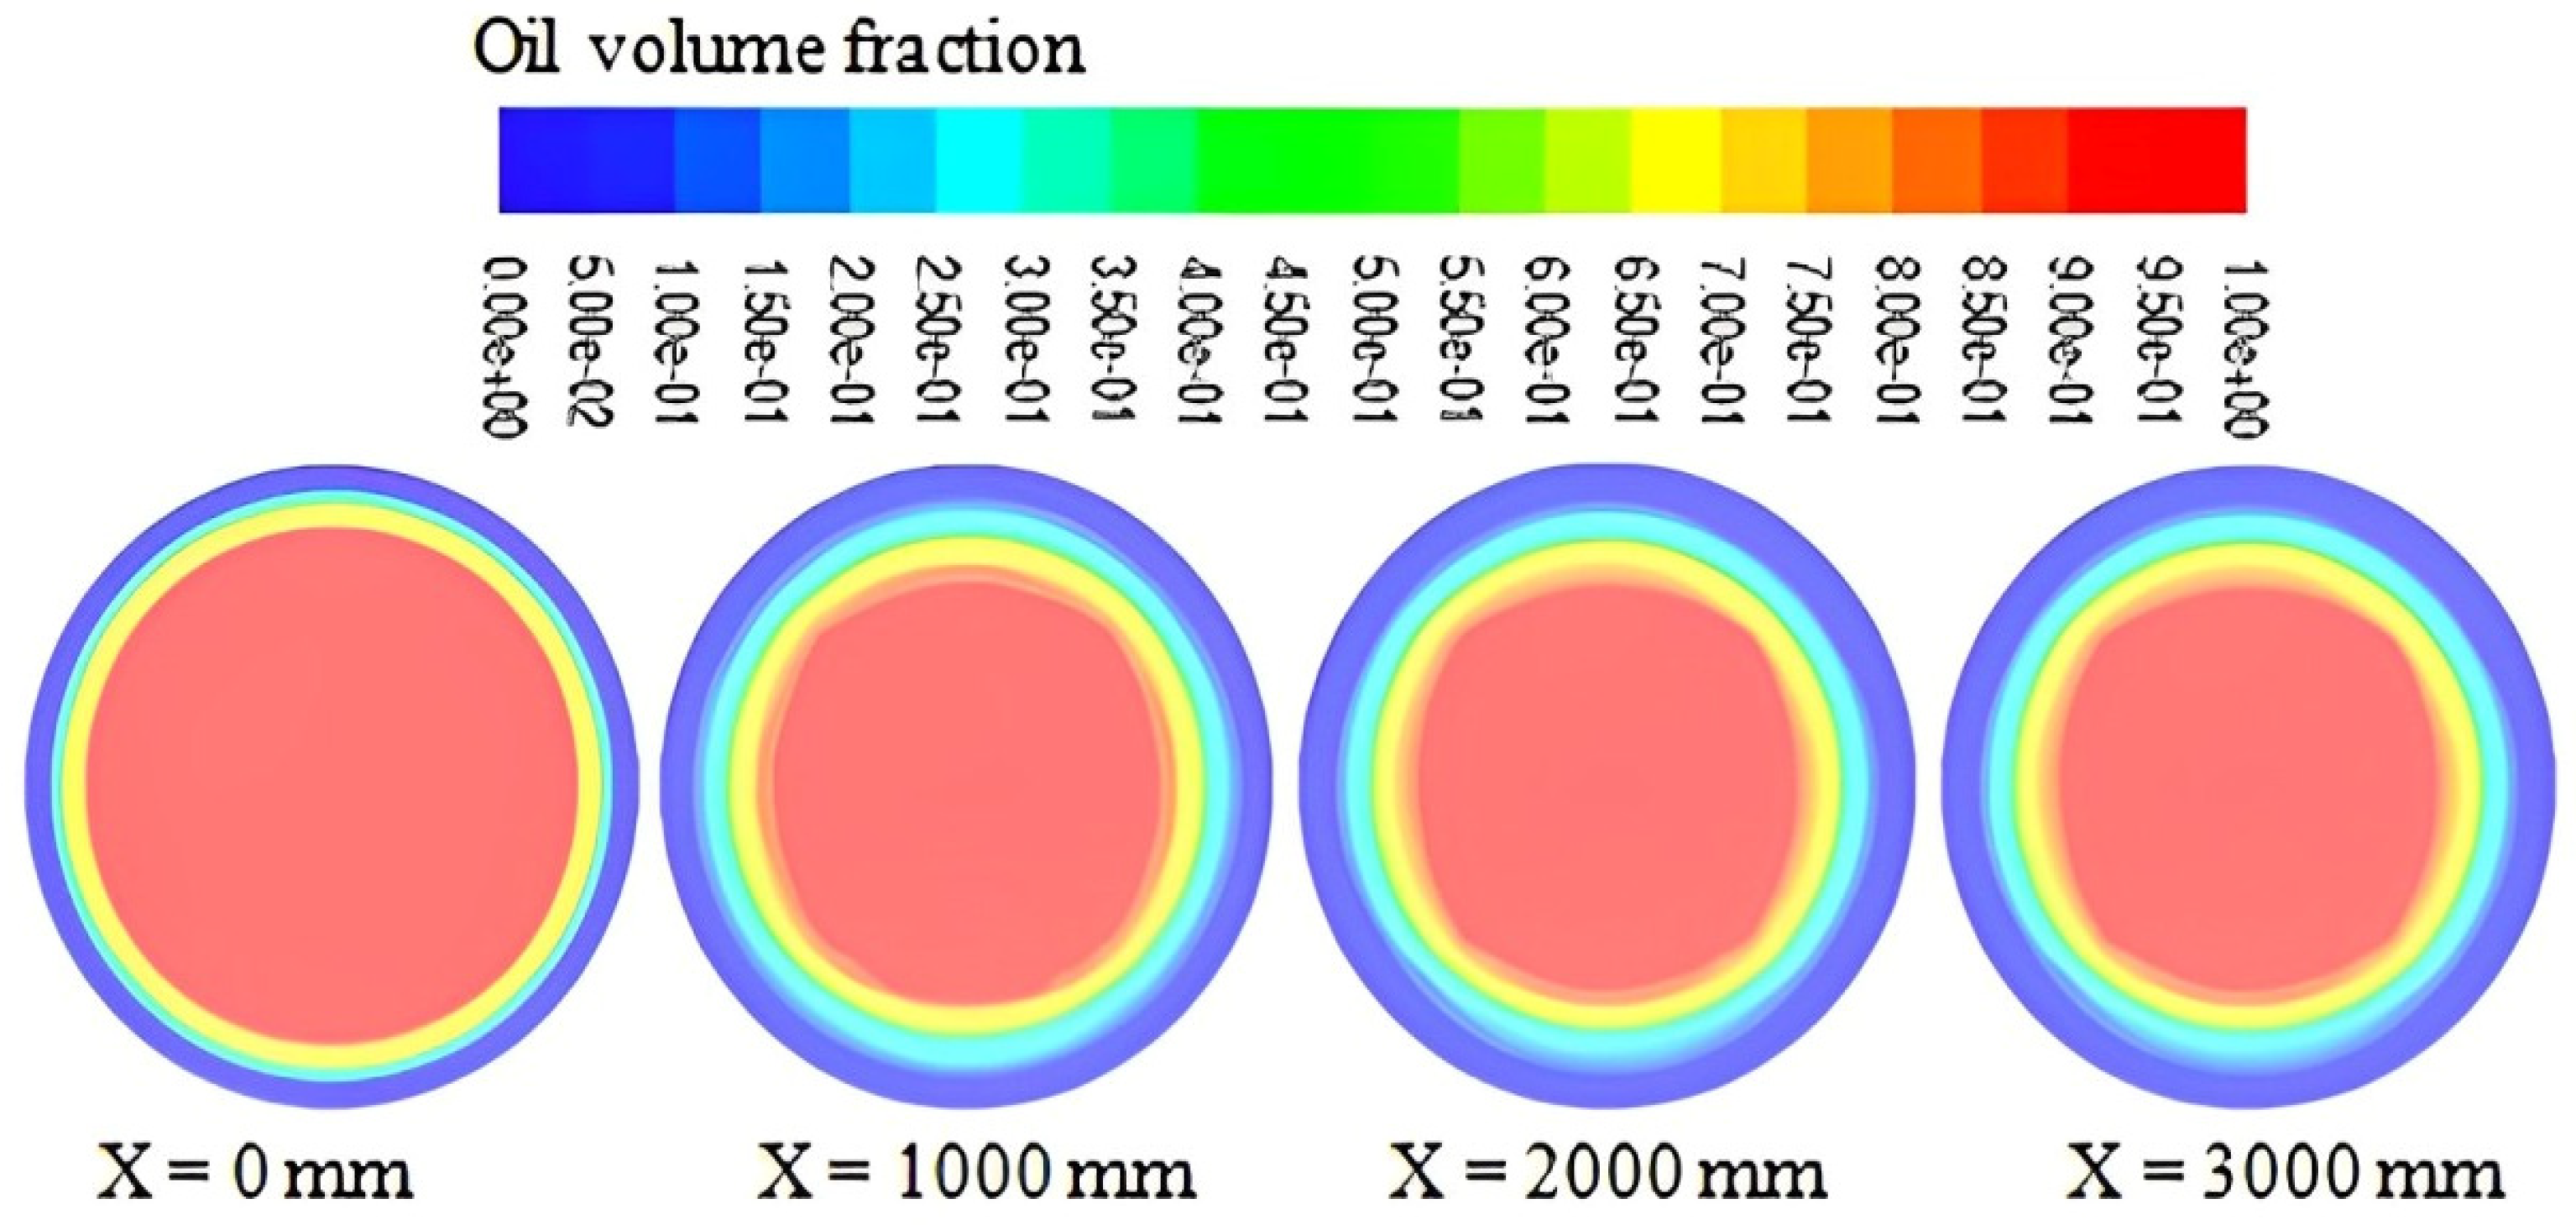
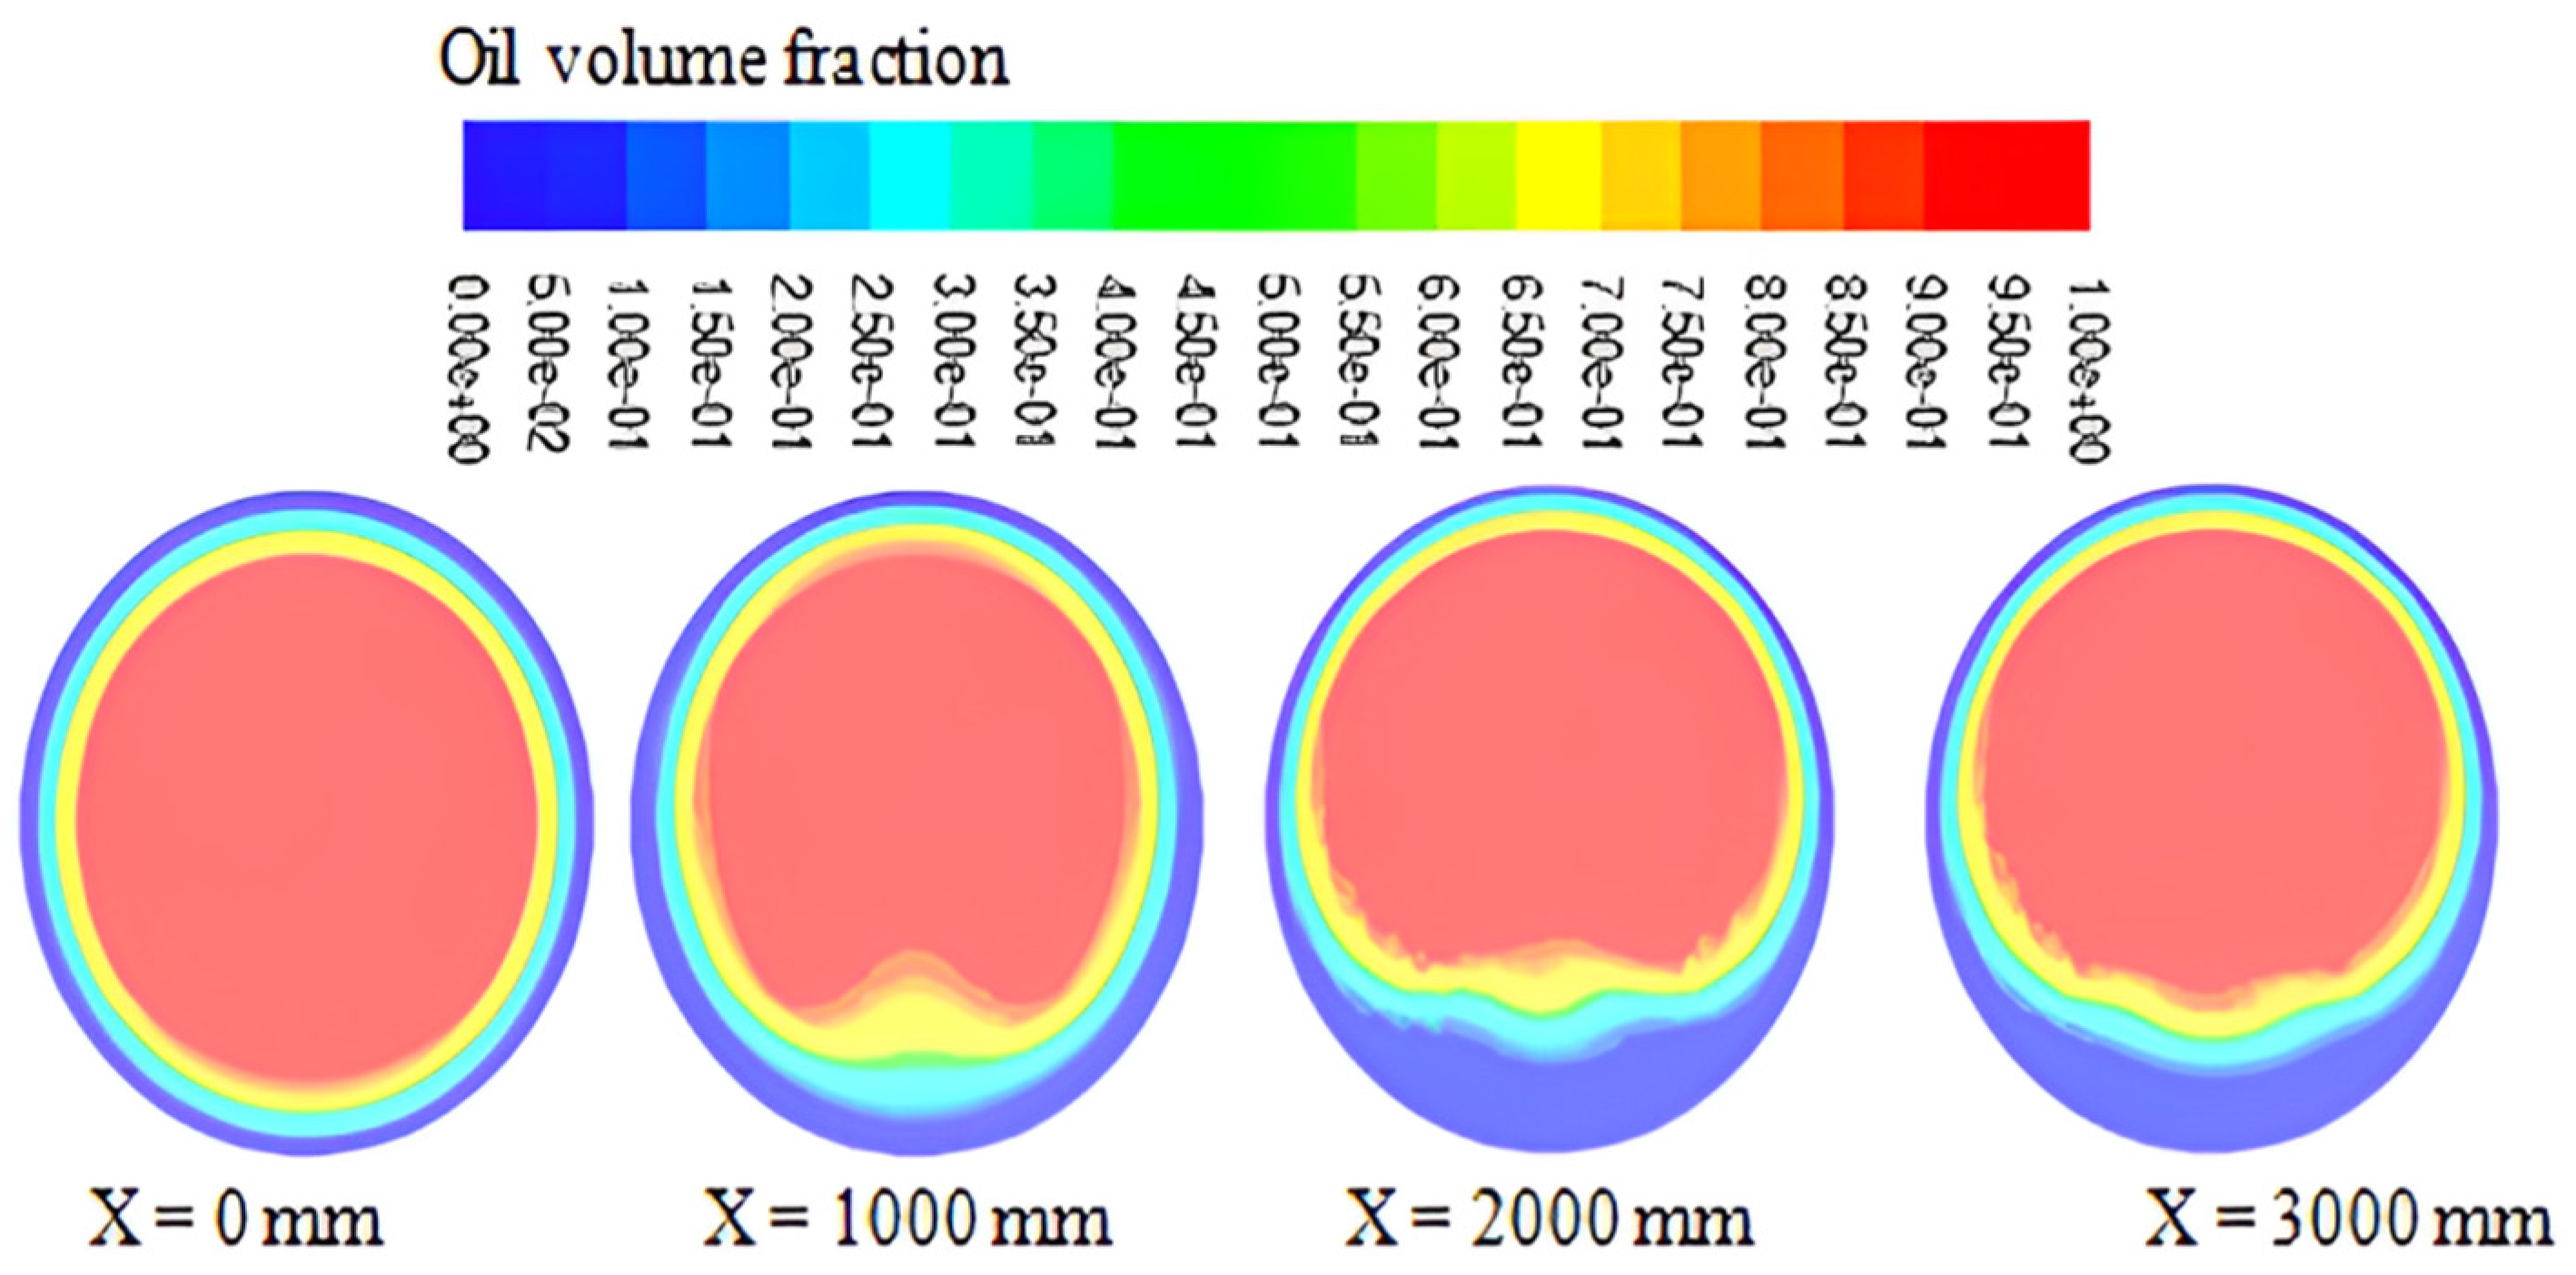
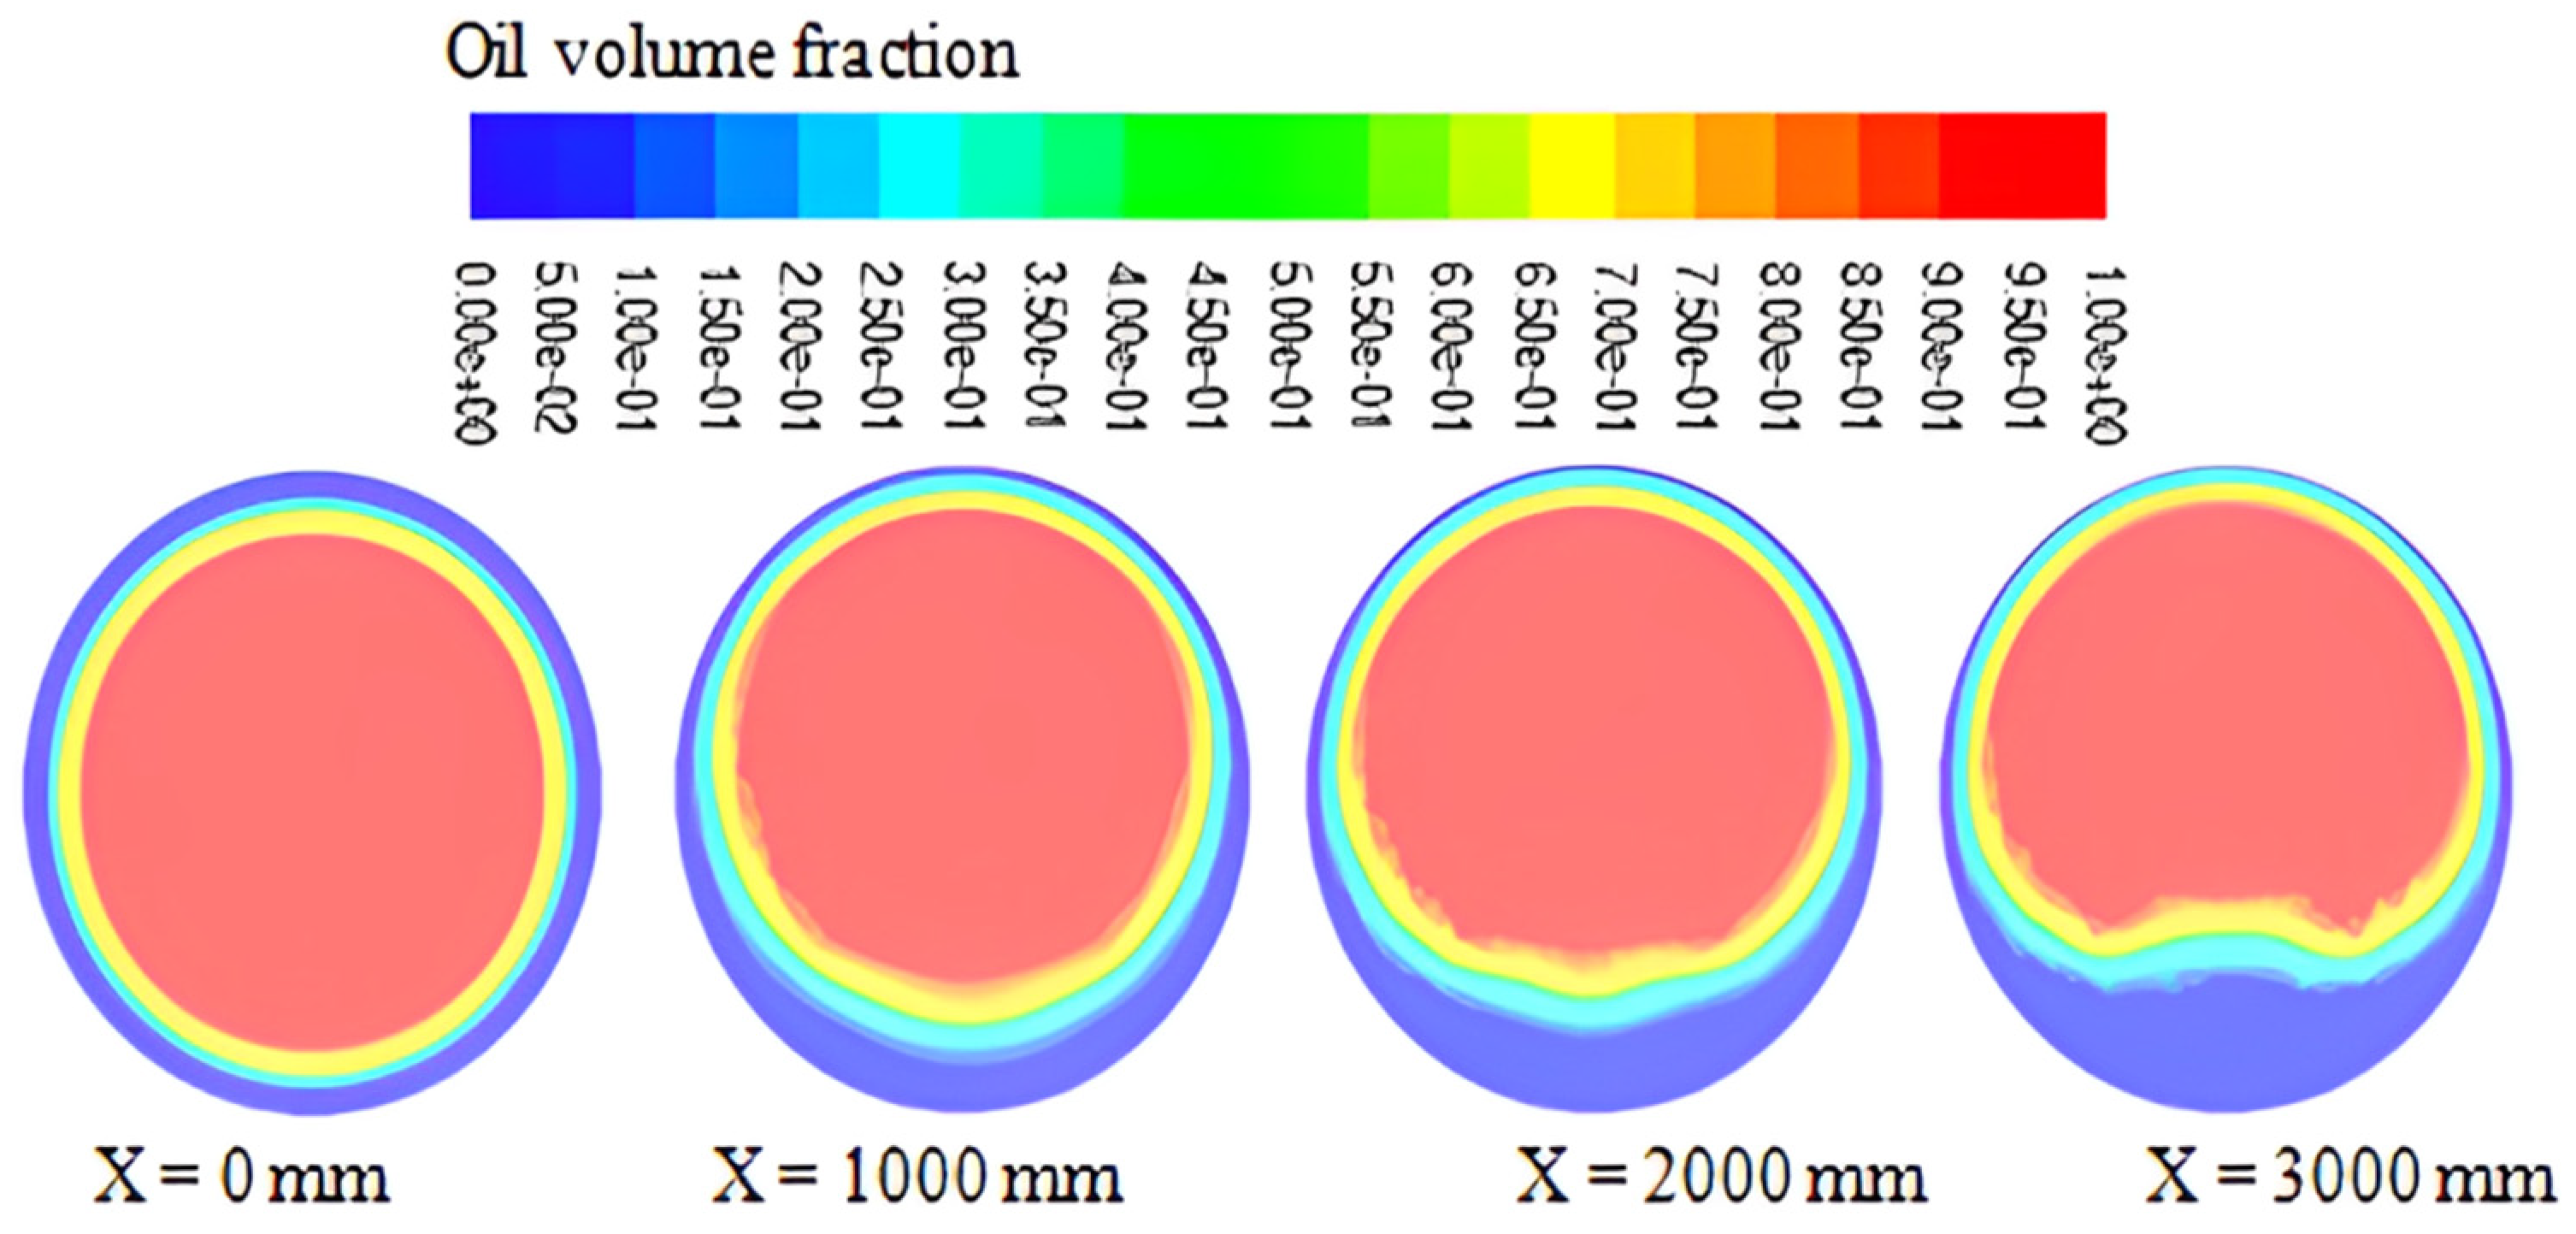
According to the velocity profiles that were obtained and shown in Figure 3, Figure 4, Figure 5 and Figure 6, the introduction of the air phase to heavy oil-water flow results in significant modifications to the fluid dynamics of the water and oil phases. Due to the increase in water flow in that area, it affects the velocity gradient in the lower portion of the pipe. Bannwart et al. [1], Poesio et al. [17,18], and Strazza et al. [12] all independently noted this behavior. Figure 5 and Figure 6, which depict the performance of the volumetric fraction field of oil in the pipe at various axial points, also clearly show an impact. In essence, the presence of air causes the heavy oil to be elevated more effectively, increasing the area filled by the annular section of water in the bottom portion of the pipe, which is closest to the wall. As a result, with three-phase flow as opposed to two-phase flow, the divergence between buoyancy and lubricating forces is more pronounced. In addition, the behavior and the impact of the air phase are evident in Figure 7, Figure 8 and Figure 9, which show results at different temperatures.

3.2. Temperature Change Impact

Figure 10 shows the surface velocity profiles for the three phases of high-viscosity heavy oil, water, and air at different temperatures (288.15 K, 303.15 K, and 323.15 K) when measured at axial points equal to X = 1000 mm and Z = 0 mm. It has been noted that a tiny difference in the oil phase’s surface velocity occurs when the temperature of the phases increases at the pipe’s entrance because of a change in viscosity.
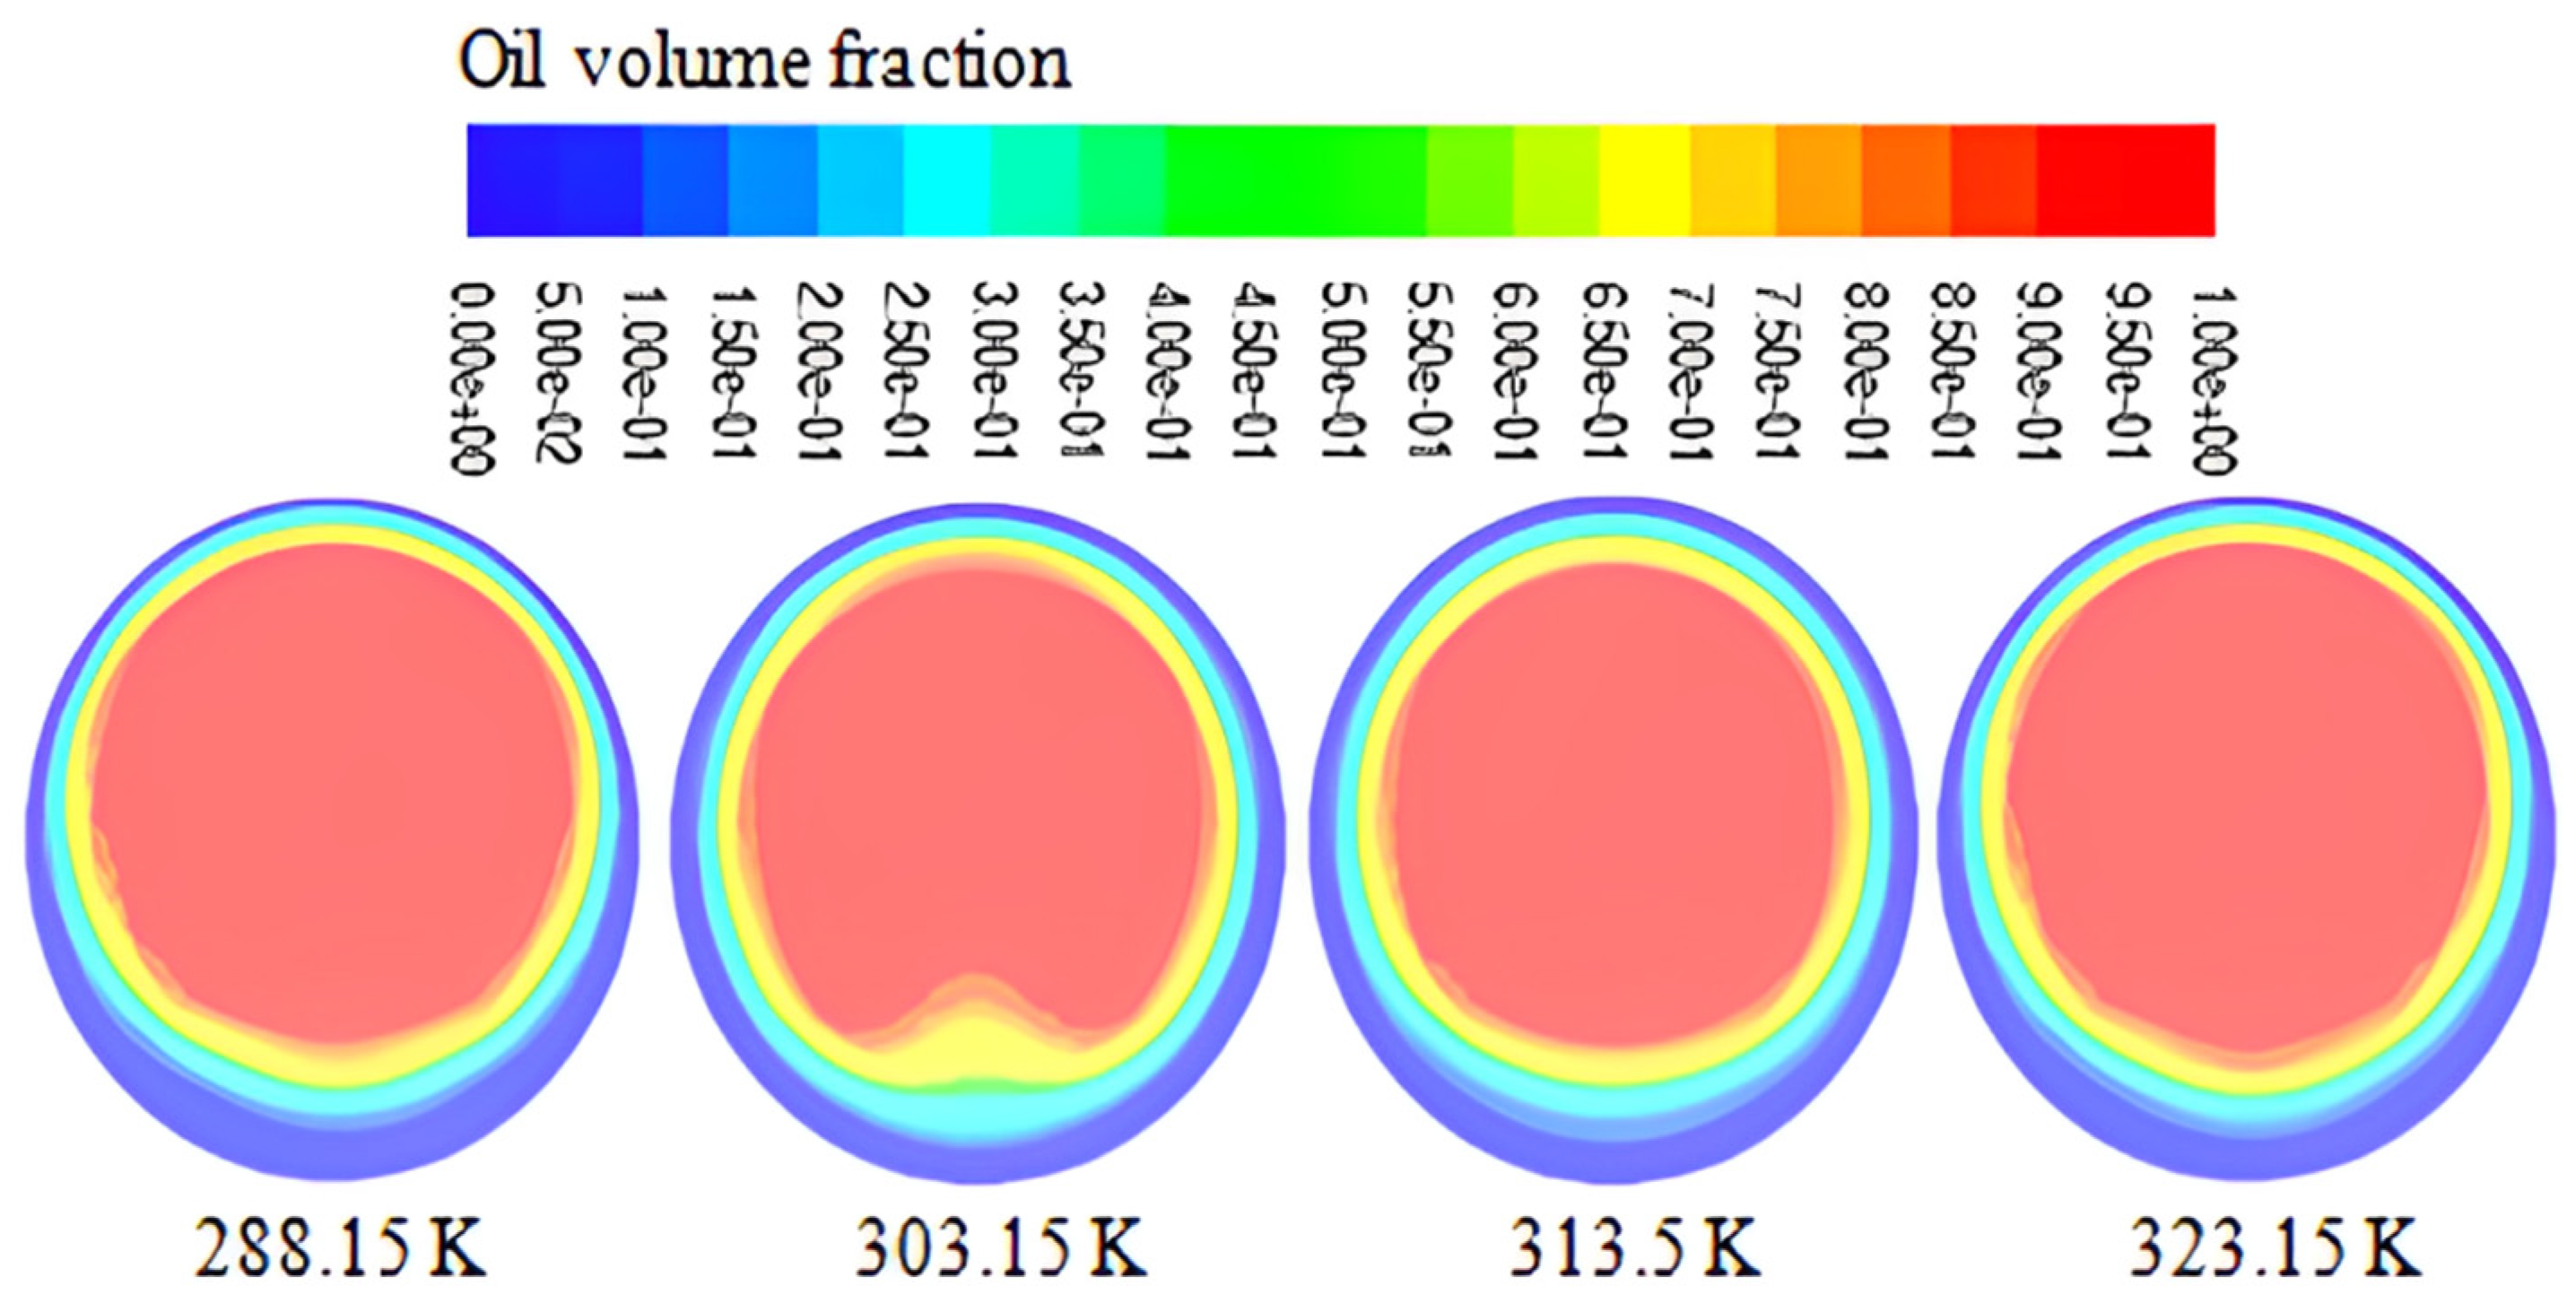
Figure 11 shows the volume percentage of the oil phase at X = 1000 mm at different phase temperatures (288.15 K, 303.15 K, 313.15 K, and 323.15 K) at the pipe entry. The level of oil in the core is expected to rise as the temperature rises. Oil viscosity decreases as a result of temperature changes, but viscous forces that hinder the flow of this fluid are also minimized and reduced.

3.3. Effect of Temperature and the Presence of Air on Pressure Drop

For two-phase flow and heavy oil-water-air flow, Table 7 provides values for the pressure drop as a function of temperature (288.15 K, 303.15 K, 313.15 K, and 323.15 K for To, Tw, and Ta) (313.15 K for Tw and To alone). In the temperature range between 288.15 K and 313.15 K, the pressure drop, P, for heavy oil-water-air appears to decrease as the temperature rises. As the temperature rises, the oil and water lose some of their viscosity, which lowers the pressure drop and minimizes flow resistance in the pipe. The viscosity of the air likewise increases with temperature, but at a lower volume fraction, therefore the effect is less significant than in the case of the heavy oil-water mixture. The presence of air increases the flow’s pressure drop when the heavy oil-water flow (313.15 K for Tw and To only) is contrasted with heavy oil-water-air (313.15 K for To, Tw, and Ta). The simultaneous flow of heavy oil, water, and gas is affected by a similar behavior, as illustrated and discussed by Bannwart et al. [1] and Trevisan [2]. These outcomes were attained, in a nutshell, because the fluid’s velocity is increased by the presence of air. Additionally, the velocity increase causes the friction factor to climb even more, which raises the pressure drop in the heavy oil-water flow.

3.4. Temperature Profile Fields

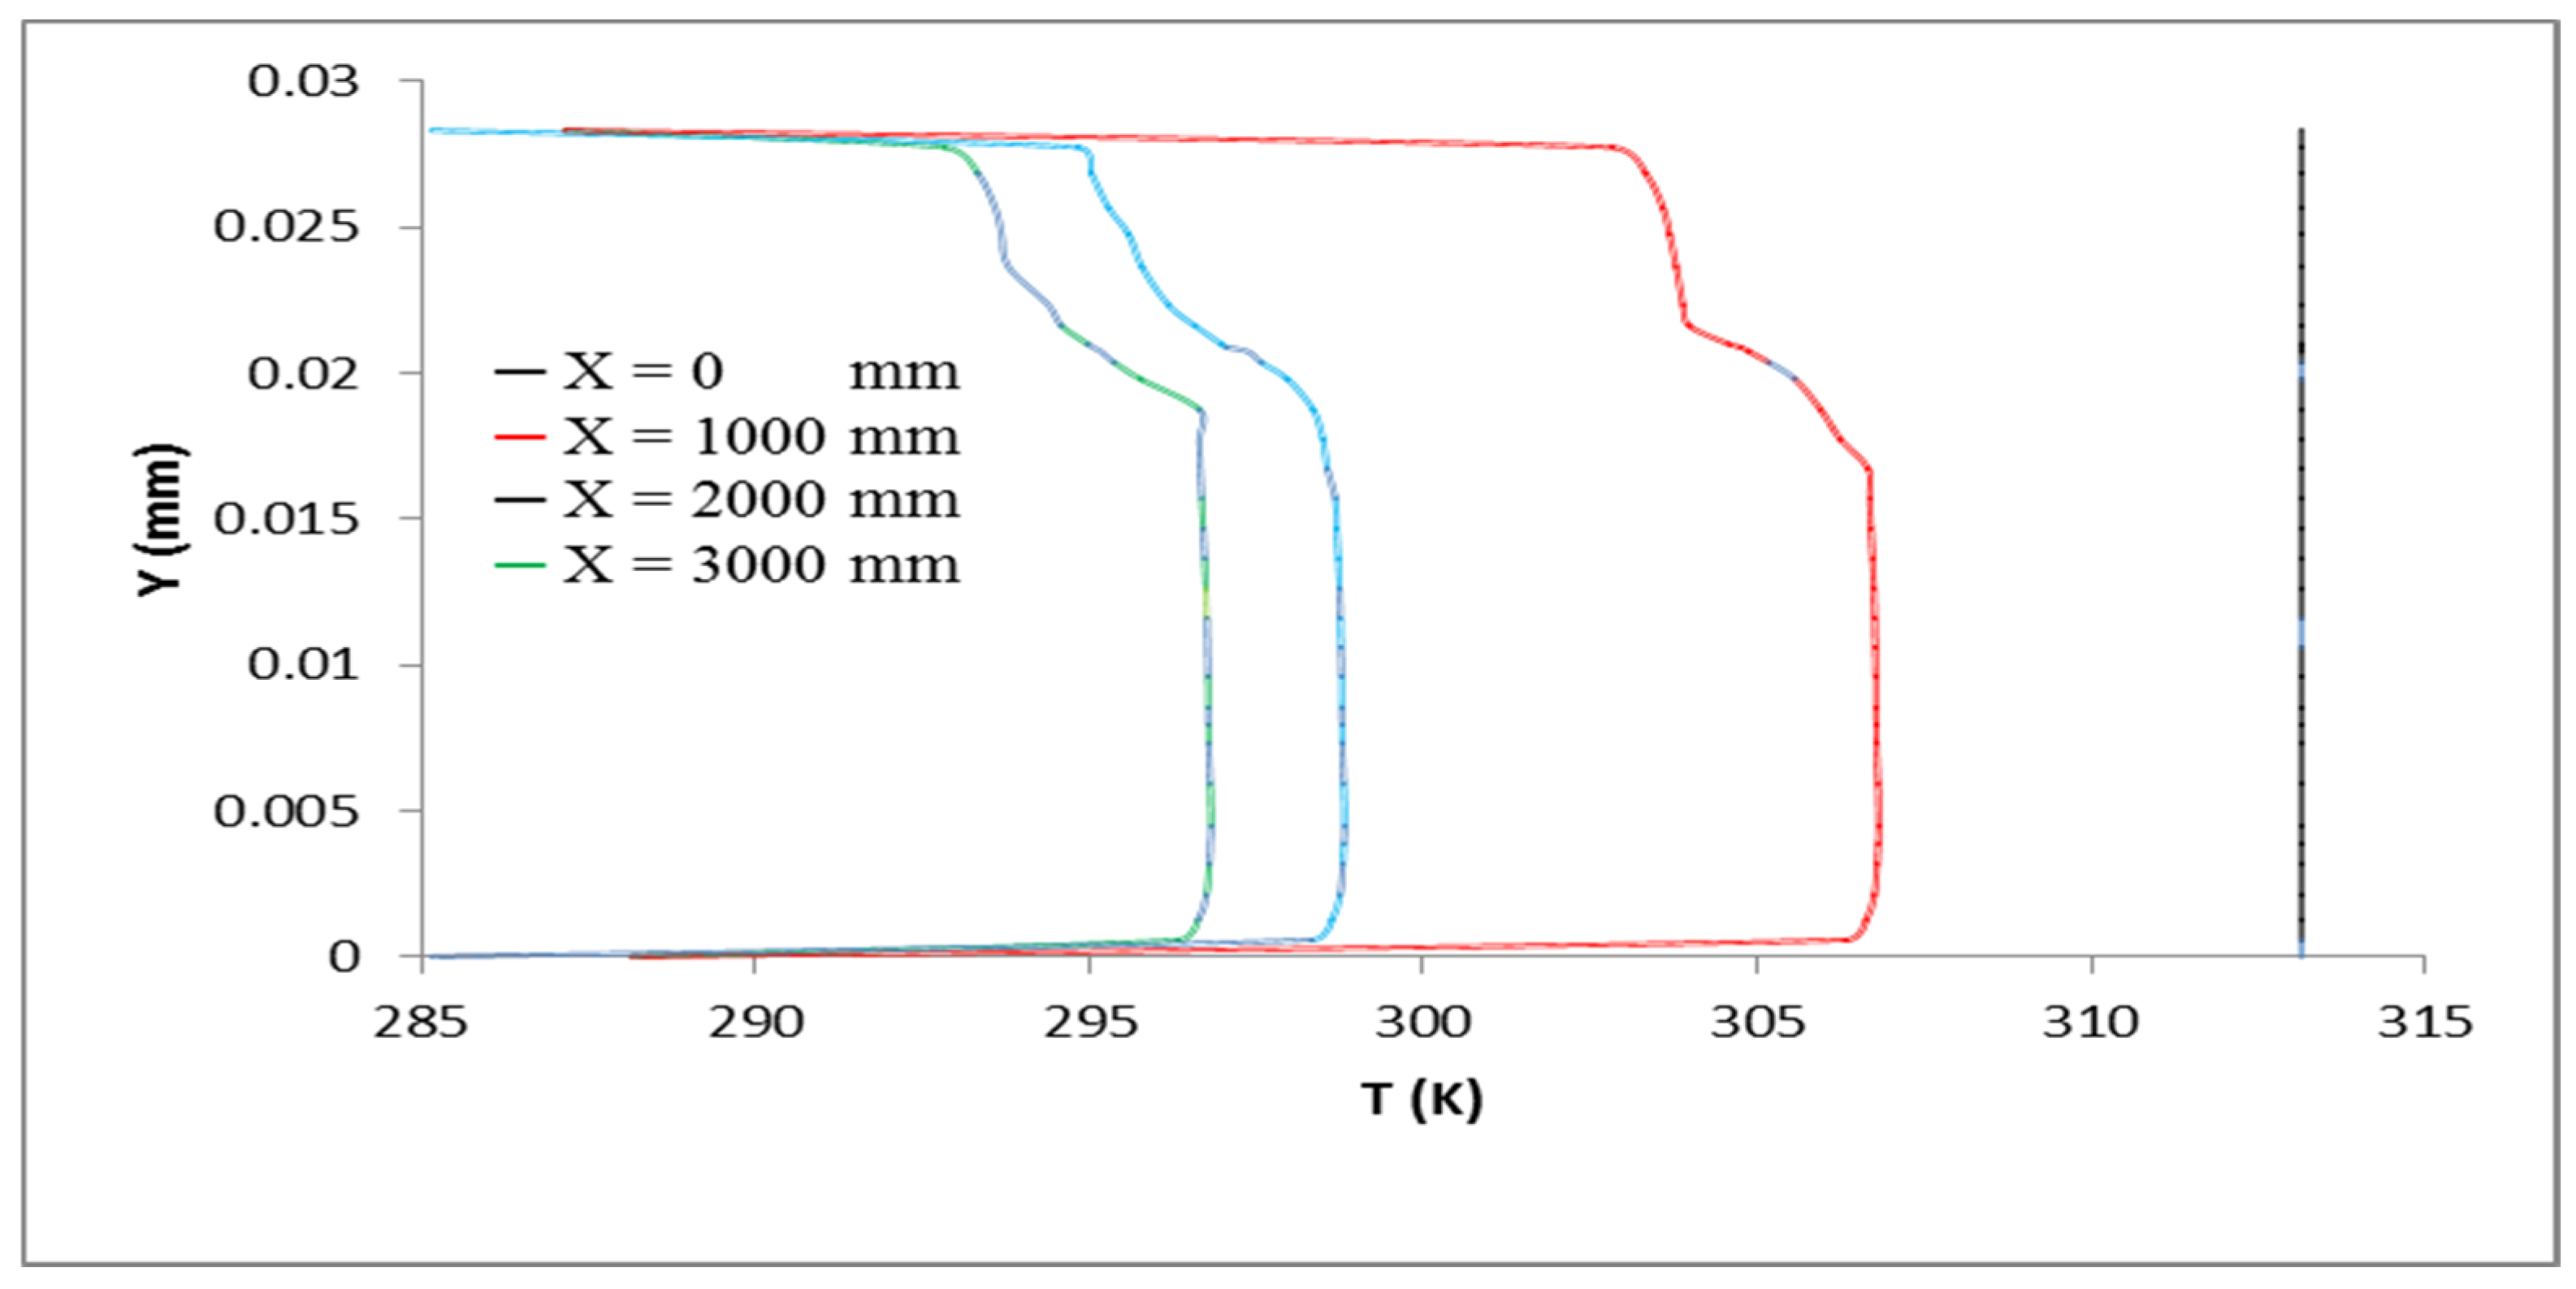
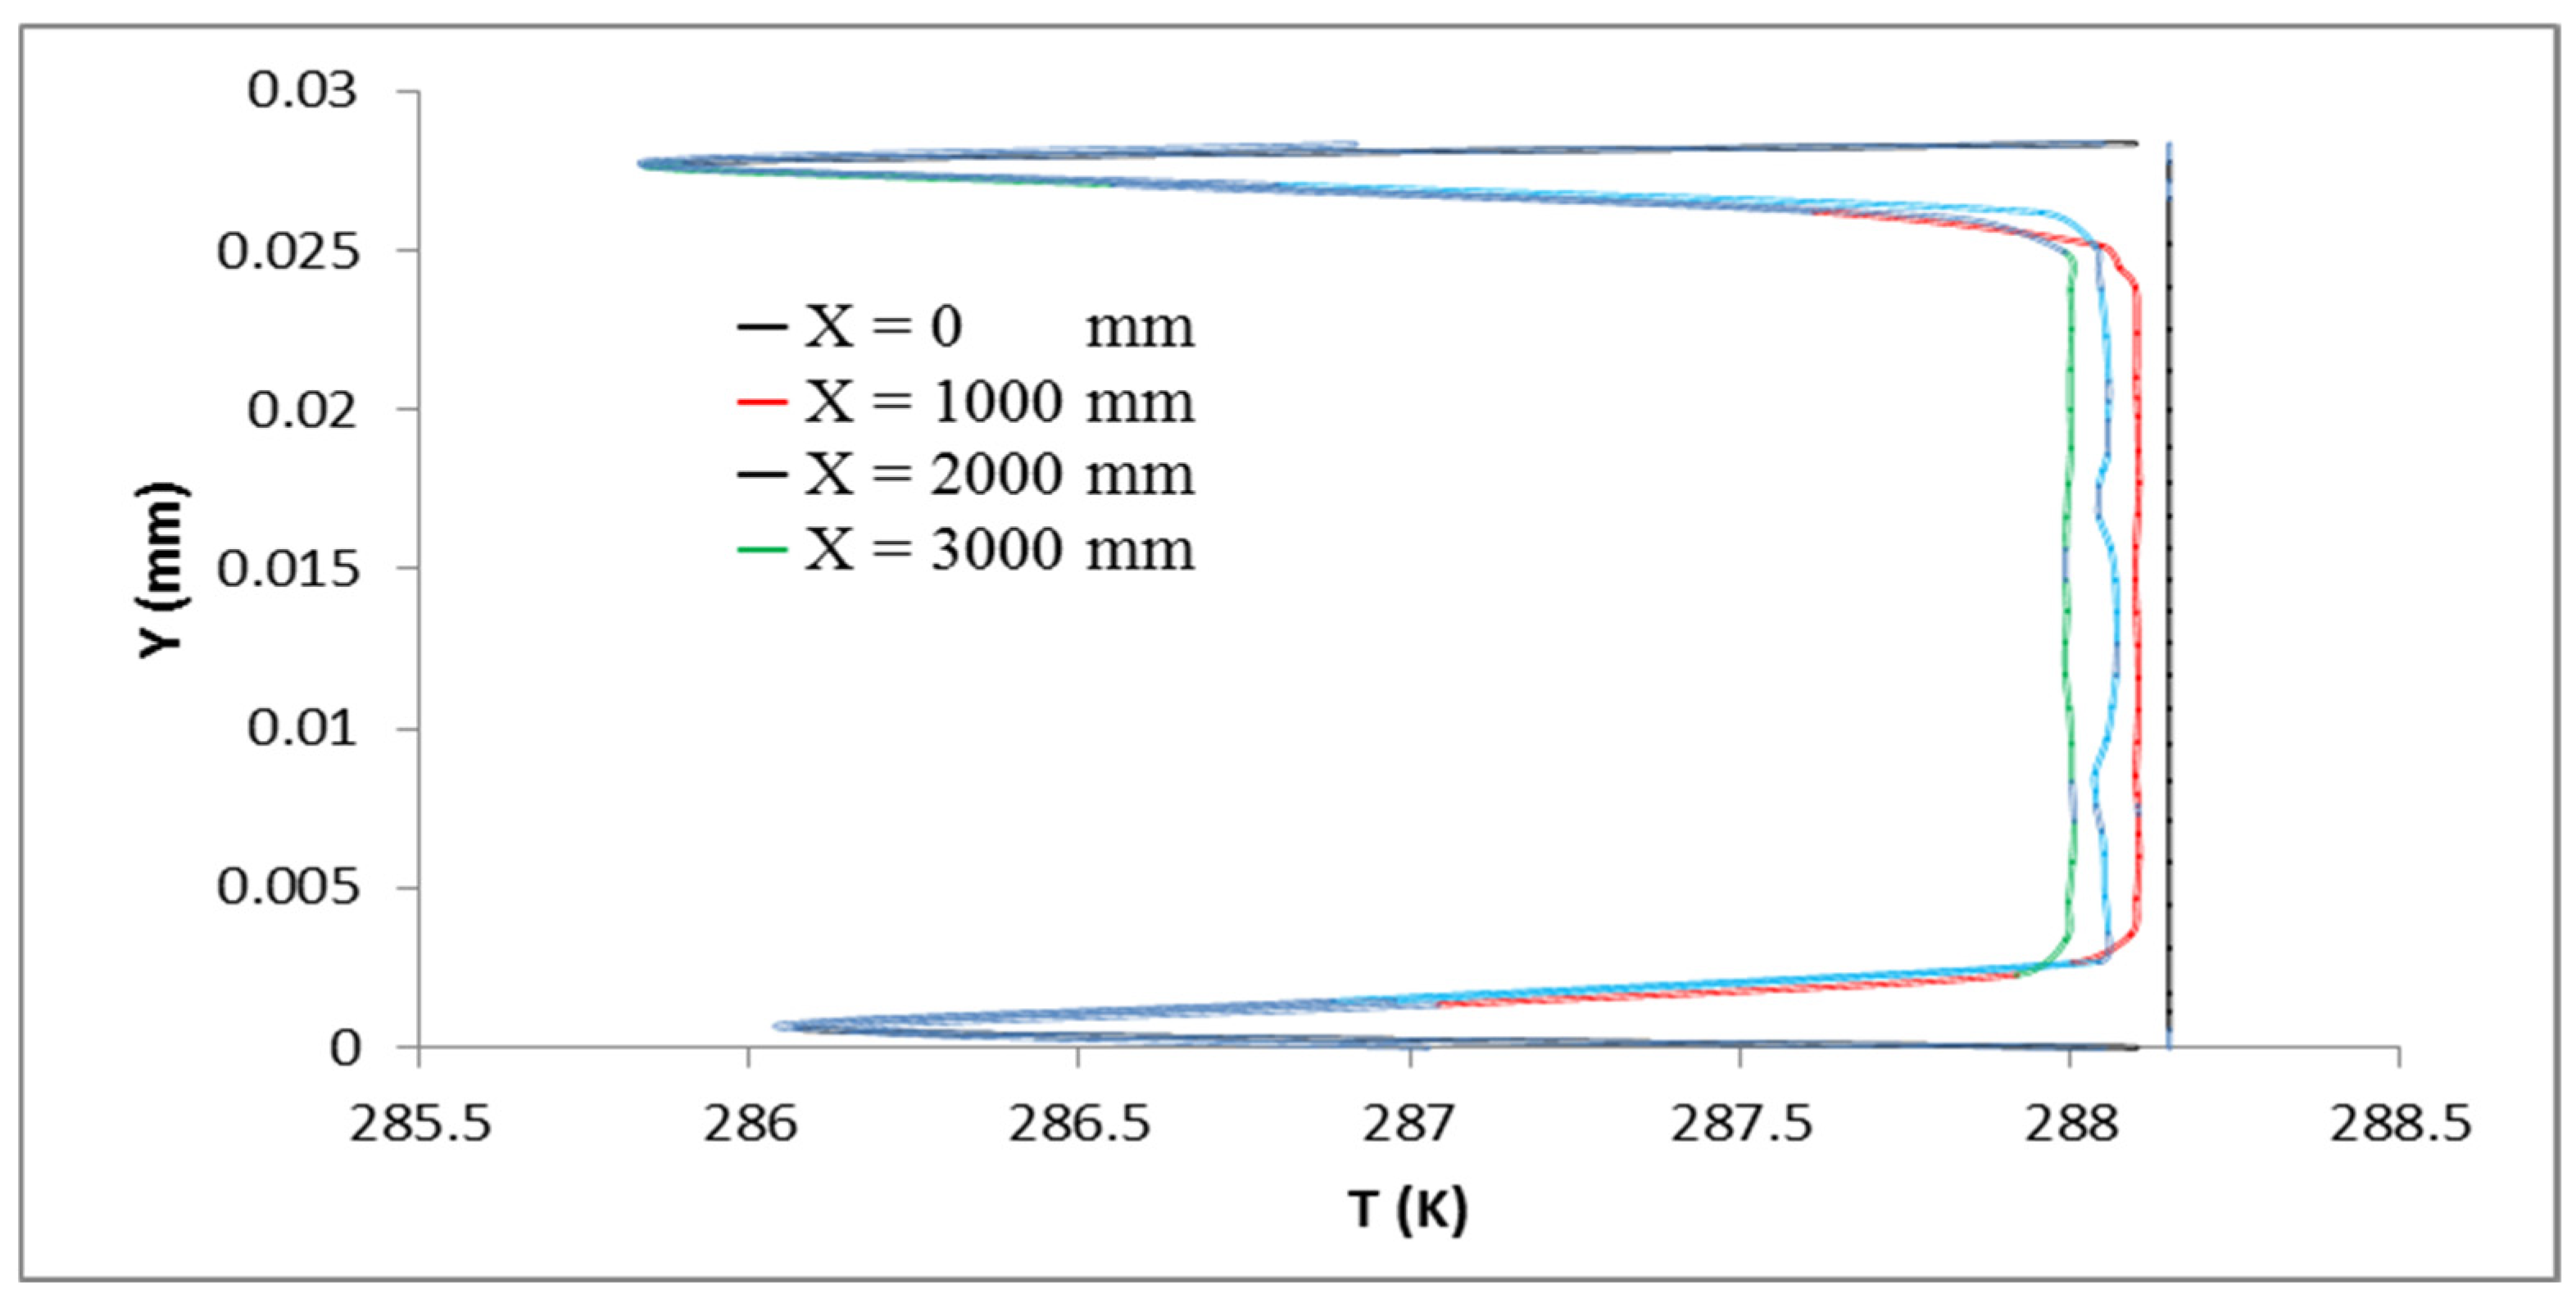
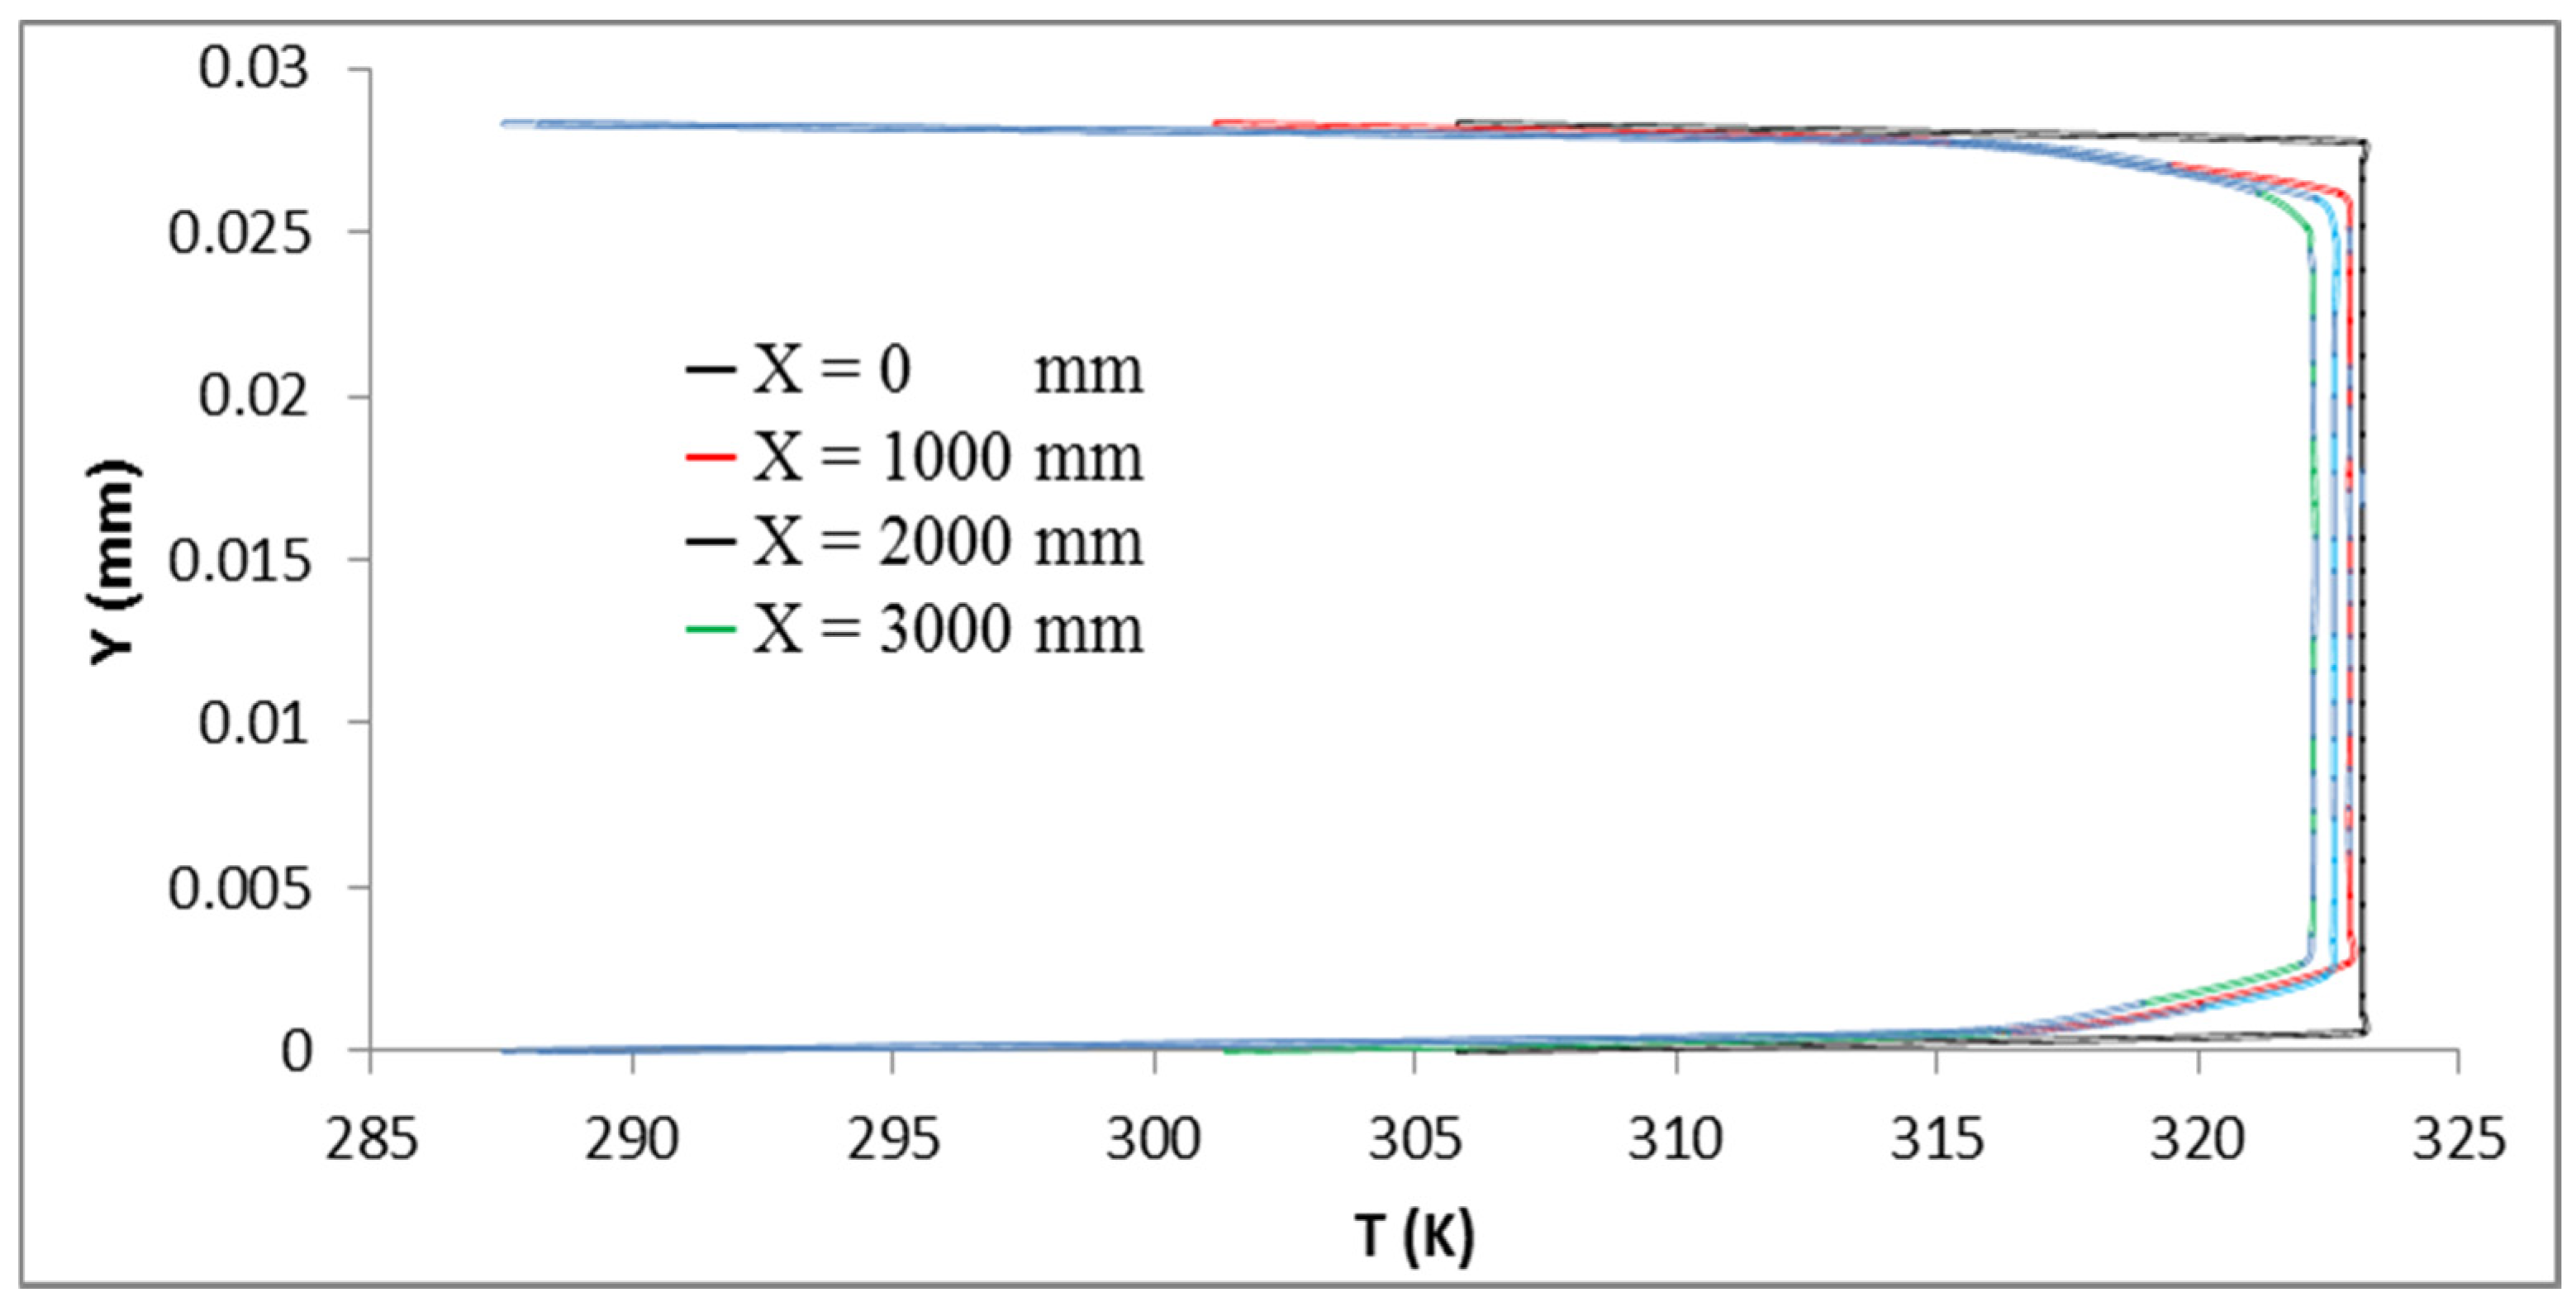
Figure 12 and Figure 13 show the temperature profiles (313.15 K) for oil and water at axial points (0 mm, 1 mm, 2 mm, and 3 mm) along the pipe. The boundary conditions shown in the picture make it obvious that the water temperature at the pipe inlet (0 m) is generally uniform. The temperature begins to drop as fluids are moved out of the pipe input area. Due to the boundary circumstances, it is also possible to see an active, intense, and strong temperature gradient close to the pipe wall. Figure 12 explains the oil temperature profile along the pipe, which demonstrates uniform conduct in the pipe’s middle. However, a slight temperature drop can be seen when the oil begins to move farther from the pipe’s entry. The fact that the temperature of the pipe wall is lower than the temperature of the oil can be attributed to heat transfer. Figure 13 depicts the water temperature profile along the pipe and demonstrates that the upper part of the pipe is where the water encounters the biggest drop in temperature. This is due to the propensity of water to collect at the lower region, where the water film framed above the flow is slightly thinner. As a result, this film has a more noticeable effect at the low temperatures specified for the pipe wall. Figure 12 and Figure 13 can be compared, and it becomes clear that the oil is hotter than the water at the pipe’s exit. This is due to the proximity of the water to the pipe wall, which keeps the oil from coming into direct contact with the pipe wall. As a result, the water performs the role of a thermal insulator. The oil temperature profiles (288.15 K, 303.15 K, and 323.15 K) along the pipe are further clarified and explained in Figure 14, Figure 15 and Figure 16, demonstrating the presence of uniform conduits in the pipe’s center as well. However, a slight temperature drop can be seen when the oil begins to move farther from the pipe’s entry.
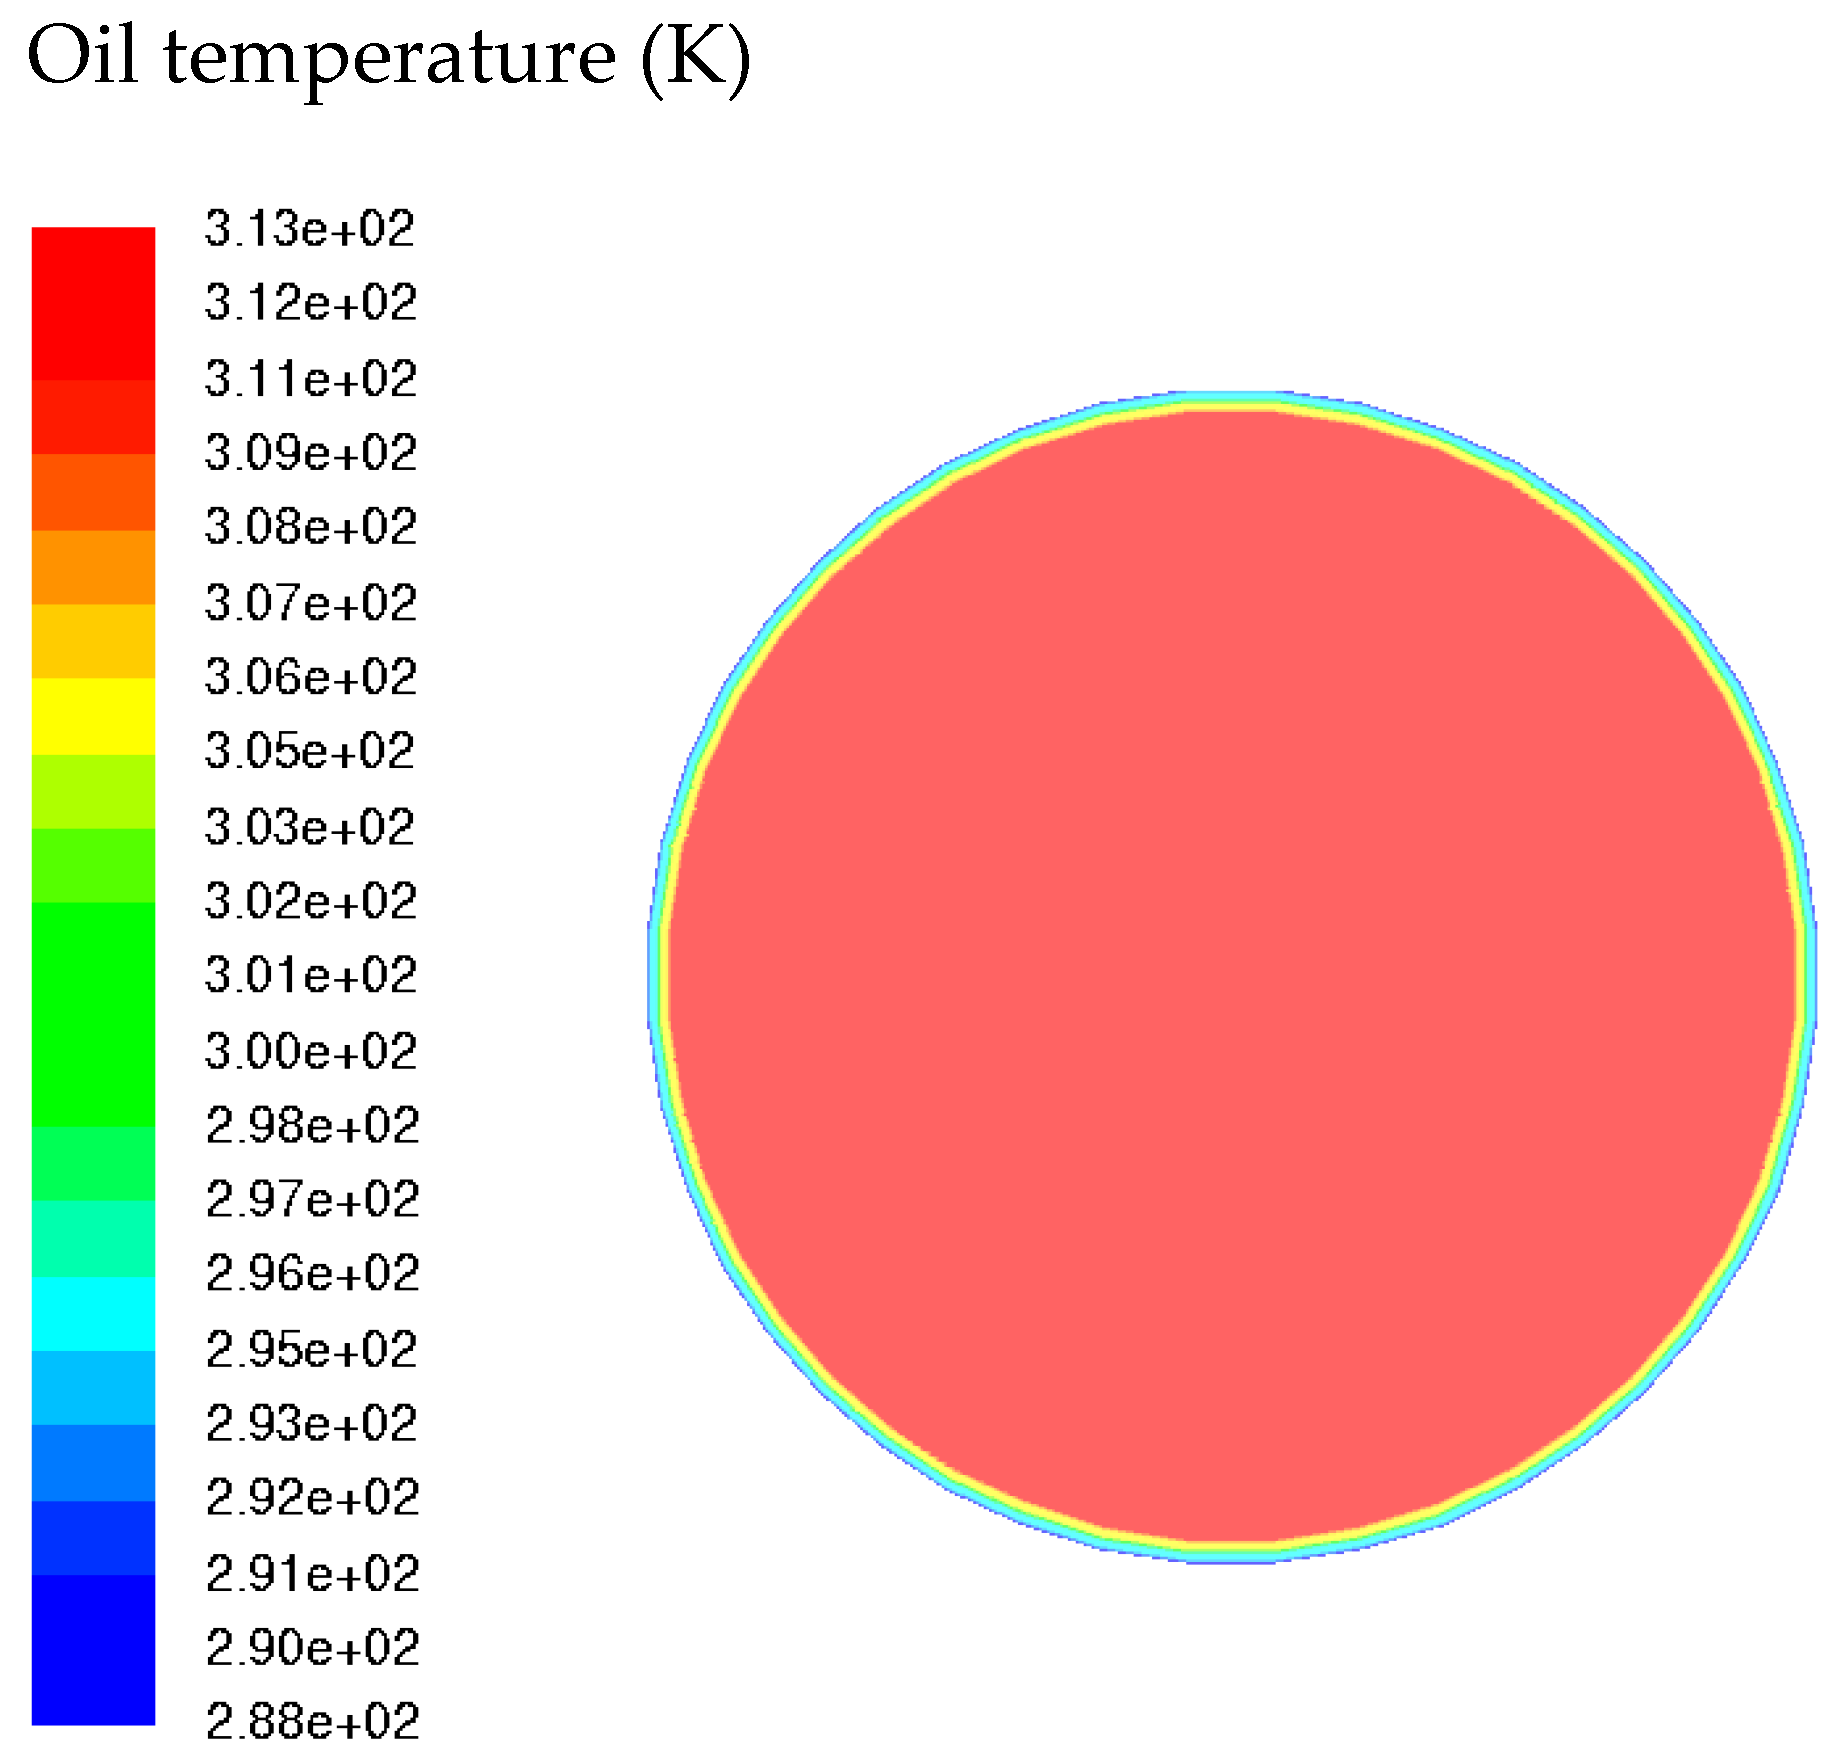
Figure 17 and Figure 18 provide a detailed illustration of the temperature fields for oil and water (313.15 K) along the pipe at X = 1000 mm. Figure 19, Figure 20 and Figure 21, on the other hand, show the oil temperature fields along the pipe at X = 1000 mm (323.15 K, 303.15 K, and 288.15 K, respectively). The section regions close to the pipe wall are where the majority of temperature variations take place. It is therefore likely that a thermal boundary layer has formed next to the pipe entrance as a result of the temperature difference between the pipe wall and the surrounding fluids. Figure 17 and Figure 18 support this conclusion by showing that the temperature distributions in the oil and water phases fluctuate along the pipe and that the water is susceptible to the largest variation and temperature drop. Regarding the temperature of the air phase, which is dispersed and abundant in the oil core, the profile of the air temperature is comparable to that of the heavy oil, showing a uniform position in the pipe’s center and focal point.

4. Summary

(1)
The developed numerical model predicts how a non-isothermal three-phase flow of water, oil, and air behaves in a straight pipe.
(2)
Despite temperature variations, the continuous aqueous film (CAF) is created and sustained. The unconventional core of the oil-air mixture tends towards stratification, avoiding the pipe wall and forming due to a fine water film.
(3)
This investigation demonstrated that the presence and proximity of air in a dense two-phase flow of water and oil significantly influence the distribution of oil inside the straight pipe and the velocity profiles of the phases. However, the CAF maintains its characteristic formation.
(4)
The viscosity of the water and oil decreases with increasing temperature during fluid flow through the pipe, resulting in a reduced pressure drop. Conversely, the presence of air causes an increase in pressure drop.
(5)
The profiles of the temperature of the water, heavy oil, and air phases alongside the pipe revealed an expected lesser temperature near the pipe surface, which lowers the temperature of the liquids by the time they depart the pipe. Due to its proximity to the pipe wall, annular water experiences this temperature drop more dramatically.
(6)
The research outcomes, backed by simulations and experimental evidence from existing literature, consistently show results that enhance our understanding of how well LES can model intricate flow dynamics like those studied in this investigation.
(7)
Comprehending the characteristics of heavy oil-water-air flows is essential for numerous industrial uses, including the transportation and processing of oil. Improved design and operational techniques for pipelines and processing facilities handling heavy oils under multi-phase flow circumstances may result from the study’s conclusions.
(8)
Overall, this work is novel because it uses an integrated approach to apply advanced numerical techniques, such as LES, to heavy oil, water, and air flows in a horizontal pipe. This approach advances both fundamental understanding and real-world applications in industrial contexts.

Author Contributions

S.A.J.: conceptualization, investigation, methodology, validation, postprocessing, writing the first draft. S.M.: paper writing, Corrections. S.A.: writing, review and editing, formal analysis and improving the manuscript. All authors have read and agreed to the published version of the manuscript.

Funding

The authors declare that no funding was received.

Data Availability Statement

Data will be made available upon request.

Conflicts of Interest

The authors declare that they have no known competing financial interest or personal relationship that could have appeared to influence the work reported in this paper.

References

  1. Bannwart, A.C.; Rodriguez, O.M.H.; Trevisan, F.E.; Vieira, F.F.; de Carvalho, C.H.M. Experimental investigation on liquid-liquid-gas flow: Flow patterns and pressure-gradient. J. Pet. Sci. Eng. 2009, 65, 1–13. [Google Scholar] [CrossRef]
  2. Trevisan, F.E. Flow Patterns and Pressure Drop in three Phase Horizontal Flow of Heavy Oil, Water and Air. Master’s Thesis, Petroleum Science and Engineering, Faculty of Mechanical Engineering, State University of Campinas (UNICAMP), Campinas, Brazil, 2003. [Google Scholar]
  3. Bannwart, A.C. Modelling aspects of oil-water core annular flows. J. Pet. Sci. Eng. 2001, 32, 127–143. [Google Scholar] [CrossRef]
  4. Desamala, A.B.; Dasamahapatra, A.K.; Mandal, T.K. Oil-water two-phase flow characteristics in horizontal pipeline—A comprehensive CFD Study. Int. J. Chem. Nucl. Mater. Metall. Eng. 2014, 8, 336–340. [Google Scholar]
  5. Bensakhria, A.; Peysson, Y.; Antonini, G. Experimental study of the pipeline lubrication for heavy oil transport. Oil Gas Sci. Technol.—Rev. IFP 2004, 59, 523–533. [Google Scholar] [CrossRef]
  6. Crivelaro, K.C.O.; Damacena, Y.T.; Andrade, T.H.F.; Lima, A.G.B.; Farias, S.R. Numerical simulation of heavy oil flows in pipes using the core-annular flow technique. WIT Trans. Eng. Sci. 2009, 63, 193–203. [Google Scholar]
  7. Ghosh, S.; Mandal, T.K.; Das, G.; Das, P.K. Review of oil water core annular flow. Renew. Sustain. Energy Rev. 2009, 13, 1957–1965. [Google Scholar] [CrossRef]
  8. Gupta, R.; Turangan, C.K.; Manica, R. Oil-water coreannular flow in vertical pipes: A CFD study. Can. J. Chem. Eng. 2016, 94, 980–987. [Google Scholar] [CrossRef]
  9. Rodriguez, O.; Bannwart, A.C.; de Carvalho, C. Pressure loss in core-annular flow: Modelling, experimental investigation and full-scale experiments. J. Ofpetroleum Sci. Eng. 2009, 65, 67–75. [Google Scholar] [CrossRef]
  10. Gadelha, A.J.F.; de Farias Neto, S.R.; Swarnakar, R.; de Lima, A.G.B. Thermo-hydrodynamics of core-annular flow of water heavy oil and air using CFX. Adv. Chem. Eng. Sci. 2013, 3, 37–45. [Google Scholar] [CrossRef]
  11. Poesio, P.; Sotgia, G.; Strazza, D. Experimental investigation of three-Phase oil-water-air flow through a pipeline. Multiph. Sci. Technol. 2009, 21, 107–122. [Google Scholar] [CrossRef]
  12. Strazza, D.; Chiecchi, D.; Poesio, P. High viscosity oil-water-air three phase flows: Flow maps, pressure drops and bubble dynamics. In Proceedings of the 7th International Conference on Multiphase Flow—ICMF, Tampa, FL, USA, 30 May–4 June 2010; pp. 1–7. [Google Scholar]
  13. Kreith, F.; Bohn, M.S. Principles of Heat Transfer; Editora Edgard Blücher: São Paulo, Brazil, 1977. (In Portuguese) [Google Scholar]
  14. Santana, C.W.S.; Tôrres, E.G.; de Lacerda, I.S. Adjustment equations for kinematic viscosity of petroleum products depending on the temperature. In Proceedings of the 3rd Brazilian Congress of R & D in Petroleum and Gas 3rd PDPETRO, Rio de Janeiro, Portuguese, 2–5 October 2004. [Google Scholar]
  15. Versteeg, H.K.; Malalasekera, W. Introduction to Computational Fluid Dynamics, 2nd ed.; Pearson Education: Harlow, UK, 2007. [Google Scholar]
  16. Leonard, A. Energy cascade in large-eddy simulations of turbulent fluid flows. Adv. Geophys. 1974, 18 Pt A, 237–248. [Google Scholar]
  17. Poesio, P.; Strazza, D.; Sotgia, G. Two- and three-phase mixtures of highly-viscous-oil/water/air in a 50 mm id. pipe. Appl. Therm. Eng. 2011, 49, 41–47. [Google Scholar] [CrossRef]
  18. Poesio, P.; Strazza, D.; Sotgia, G. Very-viscous-oil/water/air flow through horizontal pipes: Pressure drop measurement and prediction. Chem. Eng. Sci. 2009, 64, 1136–1142. [Google Scholar] [CrossRef]
Figure 1. 3D unstructured grid at the inlet (blue) and outlet (red).
Energies 18 06188 g001
Figure 2. Schematic representation of the flow field CFD model.
Energies 18 06188 g002
Figure 3. Superficial velocity profiles for oil in the heavy oil-water flow.
Energies 18 06188 g003
Figure 4. Superficial velocity profiles of the water in the heavy oil-water phase at various positions in axial directions.
Energies 18 06188 g004
Figure 5. Superficial velocity profiles of the oil in the heavy oil-water-air flow at different locations by axial direction and where T = 313.15 K.
Energies 18 06188 g005
Figure 6. Superficial velocity profiles of the oil in the heavy oil-water-air flow at various positions by axial distances at T = 323.15 K.
Energies 18 06188 g006
Figure 7. Superficial velocity profiles of the oil in the heavy oil-water-air at various positions by axial distances at T = 303.15 K.
Energies 18 06188 g007
Figure 8. Superficial velocity profiles of the oil in the heavy oil-water-air flow at various positions by axial distances at T = 288.15 K.
Energies 18 06188 g008
Figure 9. Oil volume fraction field at T = 313.15 k in heavy oil-water-air flow at various YZ cross sections along the pipe, contours of oil volume fraction from CFD simulations; the red depicts water and the blue depicts oil.
Energies 18 06188 g009
Figure 10. Oil volume fraction field at T = 313.15 k in heavy oil-air flow at various YZ cross sections along the pipe.
Energies 18 06188 g010
Figure 11. Oil volume fraction field at T = 323.15 k in heavy oil-water flow at various YZ cross sections.
Energies 18 06188 g011
Figure 12. Oil volume fraction field at T = 303.15 k in heavy oil-water air at various YZ cross-sections.
Energies 18 06188 g012
Figure 13. Oil volume fraction field at T = 288.15 k in heavy oil-water air flow at various YZ cross-sections.
Energies 18 06188 g013
Figure 14. Superficial velocity profiles for oil at various temperatures at X = 1000 mm and Z = 0.
Energies 18 06188 g014
Figure 15. Volumetric fraction field of oil for various temperatures on a YZ plane at 1000 mm from the entrance.
Energies 18 06188 g015
Figure 16. Temperature profiles (oil) at directions (X), at Z = 0 m and T = 313.15 K.
Energies 18 06188 g016
Figure 17. Temperature profiles (water) at four directions (X), at Z = 0 m and T = 313.15 K.
Energies 18 06188 g017
Figure 18. Temperature profiles (oil) at four directions (X), at Z = 0 m and T = 288.15 K.
Energies 18 06188 g018
Figure 19. Temperature profiles (oil) at four directions (X), at Z = 0 m and T = 303.15 K.
Energies 18 06188 g019
Figure 20. Temperature profiles (oil) at four directions (X), at Z = 0 m and T = 323.15 K.
Energies 18 06188 g020
Figure 21. Oil temperature contour (313.15 K) in the YZ plane at X = 1 m.
Energies 18 06188 g021
Table 1. Fluid thermophysical properties at 25 °C.
PropertyWater PhaseOil PhaseAir Phase
Density (ρ), kg/m3997.29710.778
Viscosity (μ), Pa·s0.0013750.641.794e−0.5
Specific heat (J/kg·K)4,181,7001,800,0001025,766
Interfacial Tension N/m0.0190.0190.019
Table 2. Dimensions of the horizontal pipe.
LengthDiameter
3 m0.0284 m
Table 3. Equations used in the present study to find the viscosities of three fluids.
PhasesEquationsUnits
Heavy oil μ o = 0.6402 + 18.9612 × e ( 0.07444 × T ) Pa·s
Water μ w = ( 997.2 2.443299 × 10 2 × T 6.153676 )Pa·s
Air μ g = 2.8 × 11 7 × T 0.735476 Pa·s
Table 4. Pipe wall boundary condition.
MotionStationary
Shear conditionNo slip
Table 5. Solution control method used in ANSYS Fluent.
Momentum Explicit Relaxation Factor0.3
Pressure Explicit Relaxation Factor0.3
Table 6. Computational setup used for computation.
Turbulent ModelLES, Smagorinsky-Lilly model
Materialoil, water, and air
Numerical Details
Pressure-Velocity CouplingPISO
Descretisation MomentumBounded Central differencing
PressurePRESTO
GradientLeast square cells based
TimeBounded second order implicit
Boundary conditions
Inletvelocity
outletpressure
Simulation factor
Total simulation time80–190 s
Start data sampling40 s
Time step0.001
courant numberBetween 0.5–0.85 in all simulations
Residual Criteria1 × 107
Table 7. Pressure drop at different temperatures.
CasesTo, Tw and Ta (K)ΔP
Pa/m
Two-phase313.15 (To and Tw)1191.15
Three-phase288.151582.81
Three-phase303.151469.338
Three-phase313.151462.23
Three-phase313.151434.72
Disclaimer/Publisher’s Note: The statements, opinions and data contained in all publications are solely those of the individual author(s) and contributor(s) and not of MDPI and/or the editor(s). MDPI and/or the editor(s) disclaim responsibility for any injury to people or property resulting from any ideas, methods, instructions or products referred to in the content.