Article

Optimizing Reservoir Characterization with Machine Learning: Predicting Coal Texture Types for Improved Gas Migration and Accumulation Analysis

1
PetroChina Huabei Oilfield Company, Renqiu 062550, China
2
Hubei Provincial Key Laboratory of Oil and Gas Exploration and Development Theory and Technology, China University of Geosciences, Wuhan 430074, China
*
Author to whom correspondence should be addressed.
Energies 2025, 18(23), 6185; https://doi.org/10.3390/en18236185
Submission received: 30 October 2025 / Revised: 19 November 2025 / Accepted: 22 November 2025 / Published: 26 November 2025

Abstract

Coal texture is an important factor in optimizing the characterization of coalbed methane (CBM) reservoirs, directly affecting key reservoir properties such as permeability, gas content, and production potential. This study develops an advanced methodology for coal texture classification in the Zhengzhuang Field of the Qinshui Basin, utilizing well-log data from 86 wells. Initially, 13 geophysical logging parameters were used to characterize the coal seams, resulting in a dataset comprising 2992 data points categorized into Undeformed Coal (UC), Cataclastic Coal (CC), and Granulated Coal (GC) types. After optimizing and refining the data, the dataset was reduced to 8 parameters, then further narrowed to 5 key features for model evaluation. Two primary scenarios were investigated: Scenario 1 included all 8 parameters, while Scenario 2 focused on the 5 most influential features. Five machine learning classifiers Extra Trees, Gradient Boosting, Support Vector Classifier (SVC), Random Forest, and k-Nearest Neighbors (kNN) were applied to classify coal textures. The Extra Trees classifier outperformed all other models, achieving the highest performance across both scenarios. Its peak performance was observed when 20% of the data was used for the test set and 80% for training, where it achieved a Macro F1 Score of 0.998. These findings demonstrate the potential of machine learning for improving coal texture prediction, offering valuable insights into reservoir characterization and enhancing the understanding of gas migration and accumulation processes. This methodology has significant implications for optimizing CBM resource evaluation and extraction strategies, especially in regions with limited sampling availability.

1. Introduction

Coal texture is an important factor in optimizing the characterization of CBM reservoirs, which directly affects key reservoir properties such as permeability, gas content, and production potential. The texture of coal reflects its structural characteristics shaped by mechanical deformation, which can vary from undeformed coal to more altered forms, including cataclastic and granulated coal types. Understanding these textures is important for accurate reservoir modeling, as they impact the efficiency of gas migration and accumulation processes within CBM fields [1,2,3].
These different textures can affect the coal’s porosity and permeability, which in turn influence how easily gas can be extracted from the reservoir. For instance, undeformed coal generally has lower permeability, while cataclastic and granulated coal are typically more fractured and offer higher permeability, being more favorable for CBM extraction [4,5]. Accurate classification of coal textures is thus essential for effective resource evaluation, extraction planning, and the optimization of mining techniques [6,7,8,9].
The Zhengzhuang Field, located in the southern part of the Qinshui Basin in China, presents a unique geological setting with significant CBM reserves. This field is characterized by complex coal types and textures, influenced by tectonic movements and variations in burial depth [3]. The coal seams in this field exhibit substantial heterogeneity in terms of coal textures, which directly impacts the permeability and gas production potential of the reservoir [3]. The ability to accurately classify these textures is fundamental for assessing the field’s CBM potential and optimizing extraction strategies. Given the complex geological conditions, including faulting and folding, coal texture classification becomes even more challenging. Therefore, advanced techniques are necessary to effectively characterize coal textures in such heterogeneous environments, with well-logging data providing a valuable tool for the classification process [10].
Several studies have investigated coal texture classification and CBM reservoir characterization using machine learning and other advanced techniques. For example, Li et al. (2022) employed machine learning algorithms, such as K-means clustering and KNN, to classify coal textures based on well-log data [2]. These studies demonstrated the feasibility of using well-log parameters, including gamma-ray (GR), density (DEN), and resistivity (LLD), for accurate coal texture classification. Despite these advancements, limitations remain in data coverage, accuracy, and the ability to account for geological complexities. Cao et al. (2020) further highlighted the importance of in situ stress in influencing coal texture and permeability [11]. Their work emphasizes the role of stress distribution in coal structure and fracture patterns, which are critical for CBM extraction. These findings suggest that integrating geological factors such as stress and deformation into coal texture models could significantly improve prediction accuracy, particularly in challenging geological settings like Zhengzhuang. Additionally, Yan et al. (2024) applied deep-ensemble learning to reflectance spectra images to identify coal types, achieving high classification accuracy [6]. These approaches represent a shift toward image-based techniques for coal classification. In coal-rock recognition, Xu et al. (2024) used neural texture synthesis with deep convolutional networks (CNNs) to generate synthetic coal-rock images, addressing data scarcity issues and improving recognition model performance in real-world mining conditions [12]. Moreover, Zhao et al. (2022) explored machine learning techniques, including Random Forest and K-Nearest Neighbors, to predict coal slime flotation behavior [7]. Their study showed that the RF model performed best in simulating particle migration, highlighting the importance of particle size and composition in optimizing flotation efficiency. This research is essential for improving the processing of coal slurry and enhancing the overall quality of coal extraction. Cheng et al. (2025) demonstrated how CNNs could estimate coal ash content, emphasizing the importance of color and texture features in improving the accuracy of coal quality assessments for CBM exploration [13]. Zhang et al. (2024) also utilized Convolutional Neural Networks (CNN), Vision Transformers (ViT), and Graph Convolution Networks (GCN) to estimate coal ash content based on image data [14]. Their study demonstrated that color features contributed significantly to the accuracy of the model, with CNN achieving the highest estimation precision. This highlights the growing role of deep learning in coal quality estimation, which is critical for industrial coal use. Embaby et al. (2023) [15] studied the use of machine learning algorithms, geostatistical techniques, and GIS analysis to estimate phosphate ore grade at the Abu Tartur Mine in the Western Desert, Egypt. Their research highlighted the effectiveness of various modeling approaches for improving phosphate resource estimation and mining efficiency [15]. Hao et al. (2025) combined Raman spectroscopy and X-ray fluorescence (XRF) spectroscopy with machine learning to improve the classification accuracy of complex coal samples [4]. Their model demonstrated that combining both organic and inorganic spectral information provided a more accurate classification than using single-spectral methods. This study is significant in refining coal classification techniques for more efficient industrial applications. Cui et al. (2021) proposed a methodology for quantifying coal macro lithotypes, such as bright and semi-dull coal, by combining geophysical logging data with Principal Component Analysis (PCA) [16]. The study applied this model to the Zhengzhuang field in the Qinshui Basin, revealing that coal with lower S-Index values (bright coal) is more likely to form long fractures during hydraulic fracturing. This finding enhances the understanding of coal texture’s influence on CBM production potential.
Despite these advancements, there remain significant gaps in fully characterizing coal textures in complex geological settings like Zhengzhuang. Many studies have relied on limited datasets or failed to fully account for regional variations in coal texture distributions and geological stress factors, which can significantly affect coal permeability and fracture development. Furthermore, while machine learning and geophysical methods have been applied, there is still a need for more robust models that integrate geological theories and data analytics to improve the accuracy of coal texture classification over large areas.
This study aims to address these gaps by developing a more comprehensive and accurate method for coal texture classification in the Zhengzhuang Field. By integrating well-log data, advanced machine learning techniques, and geological insights, this research seeks to improve the understanding of coal textures and enhance the prediction accuracy for CBM exploration. Additionally, this study will explore the use of more refined feature selection techniques and incorporate geological theories, such as stress and tectonic movement, to better characterize coal textures and their impact on CBM reservoirs. Our approach will not only improve the efficiency of coal texture classification but also contribute to optimizing CBM extraction methods, particularly in complex geological settings like Zhengzhuang.
This study offers a novel approach to coal texture classification by leveraging advanced machine learning (ML) techniques applied to well-log data from the Zhengzhuang Field in the Qinshui Basin. By integrating multiple geophysical parameters and employing a rigorous data preprocessing pipeline, this research enhances the predictive modeling of the coal texture types UC, CC, and GC, which are essential for CBM reservoir characterization. The novelty of this work lies in the use of machine learning classifiers, such as Extra Trees and Gradient Boosting, to predict coal texture with high accuracy, providing valuable insights into the underlying geological structures. The contributions of this paper are as follows:
  • Development of a robust methodology for coal texture classification using well-log data, with a focus on UC, CC, and GC types.
  • Application of five of machine learning models, including Extra Trees and Gradient Boosting, to accurately predict coal textures types for Zhengzhuang Field in the Qinshui Basin, thus enhancing the efficiency of CBM exploration.
  • Provision of a comprehensive analysis of the impact of test/train size splits on model performance, offering a reliable framework for future CBM reservoir assessments.
Overall, these innovations contribute significantly to the accuracy and robustness of coal texture classification models.

2. Methodology

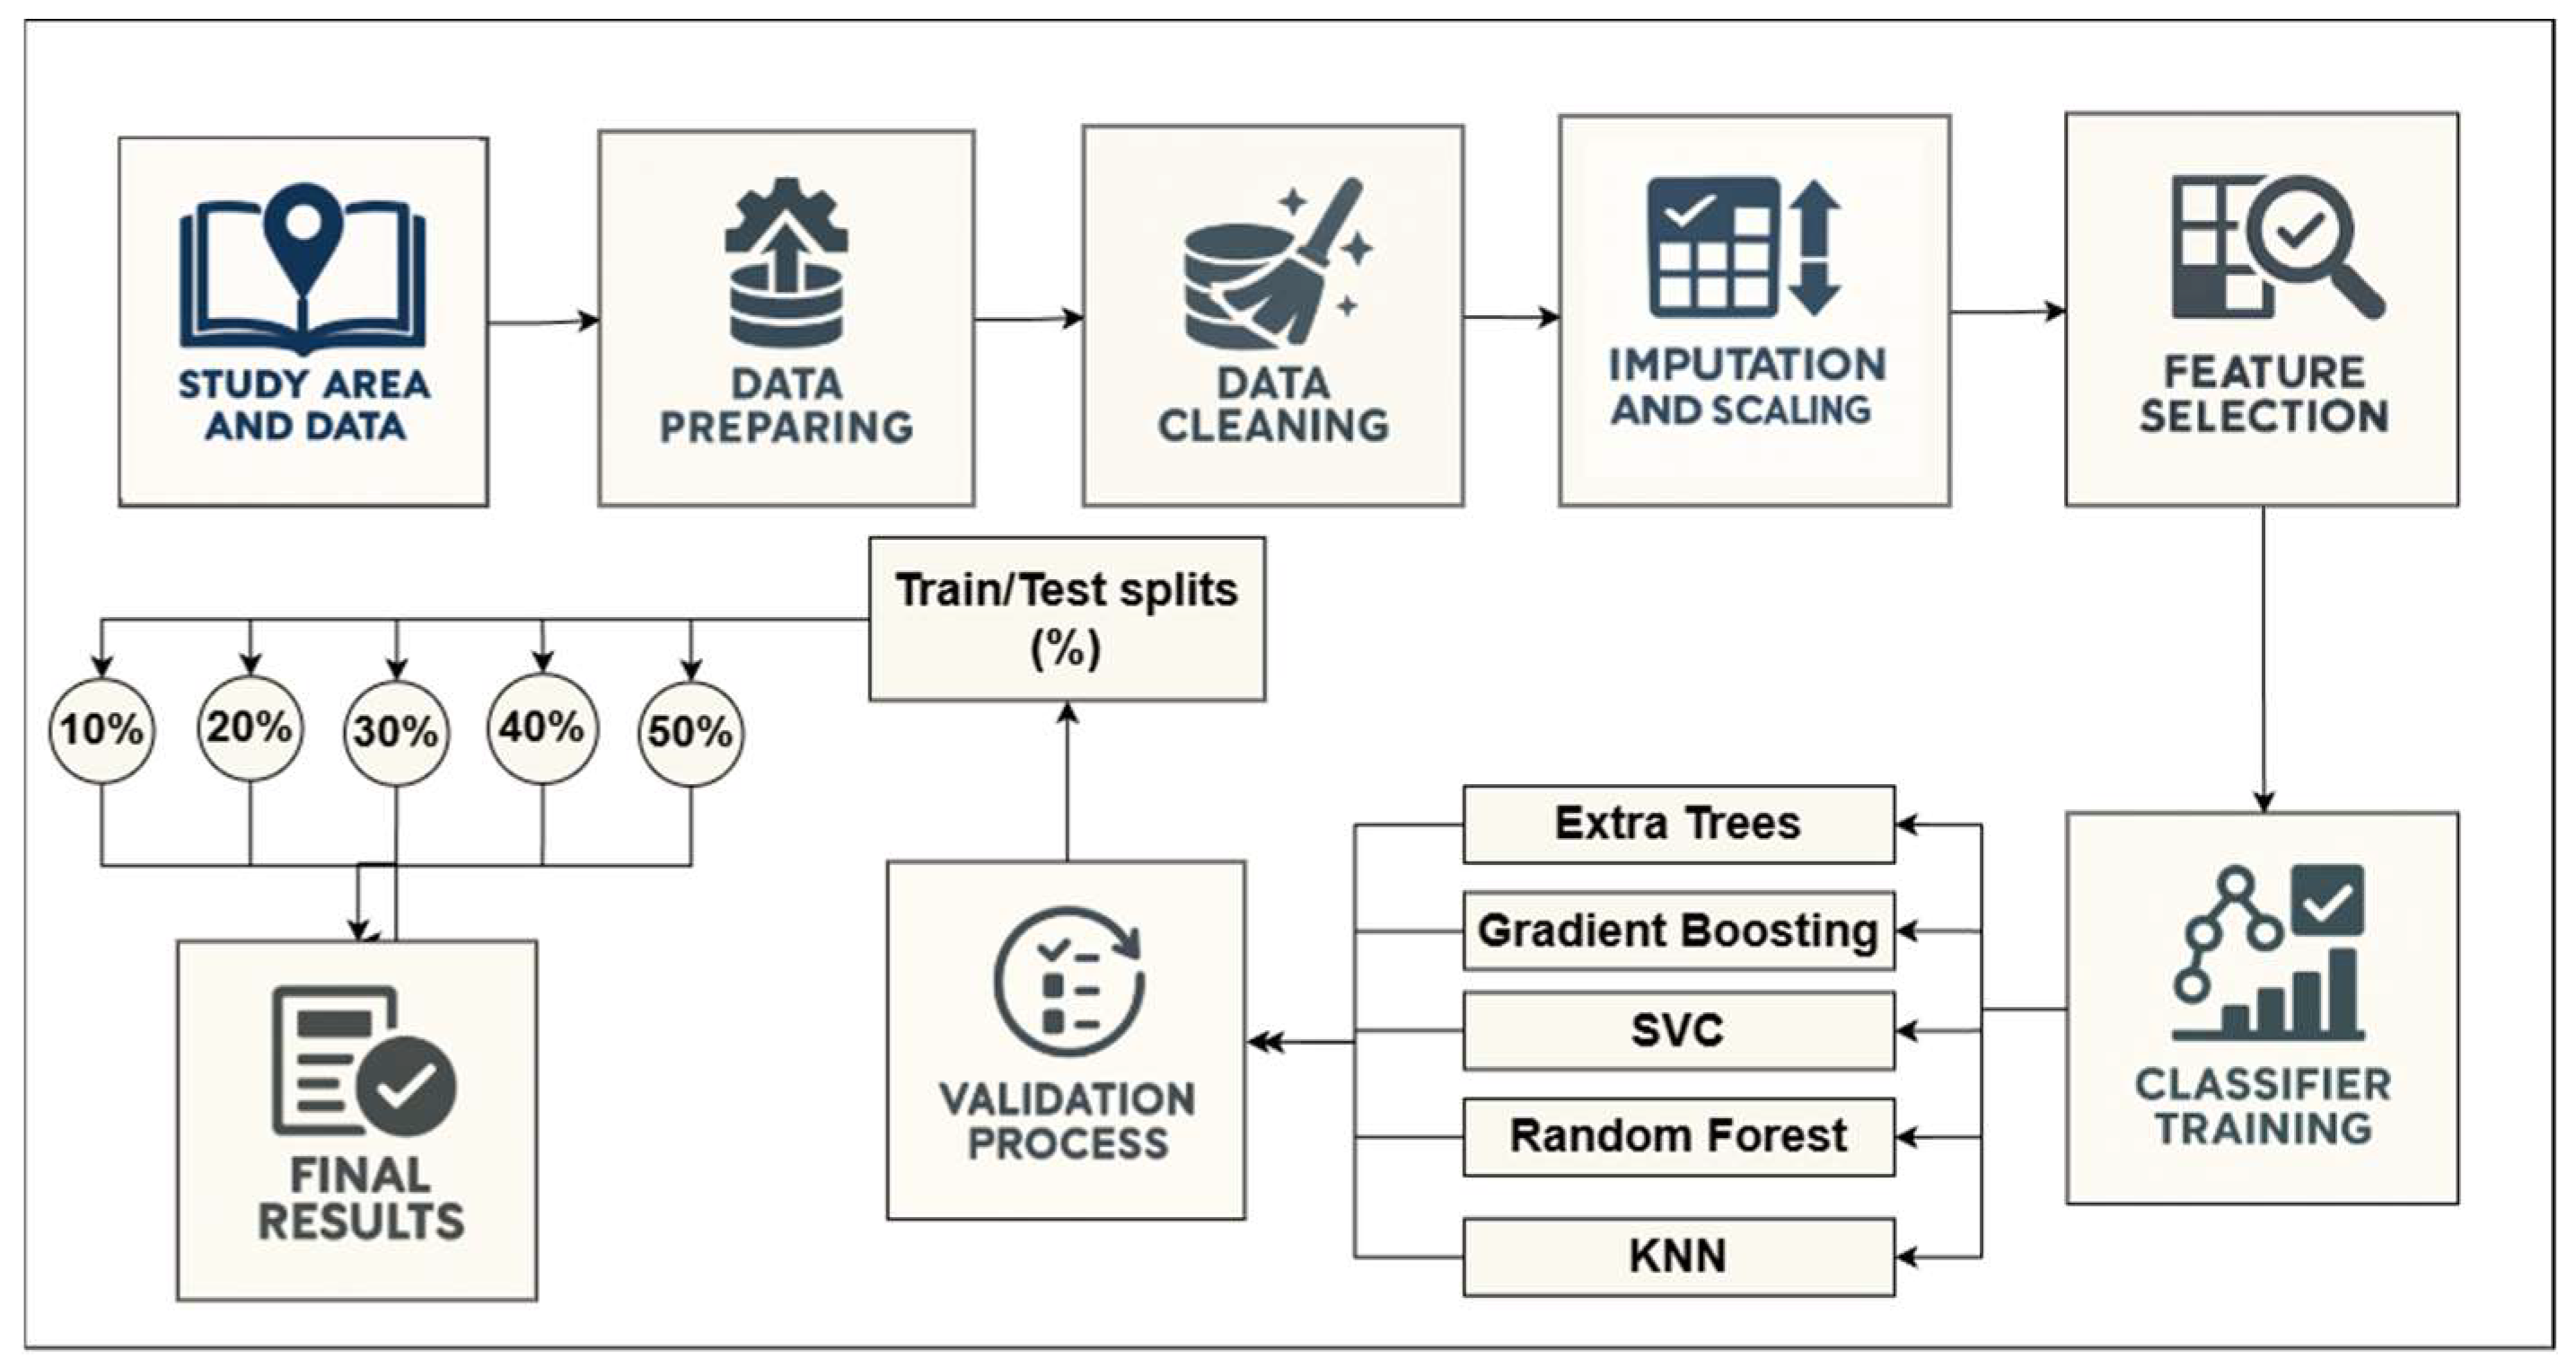
Figure 1 illustrates the methodology of this study, which follows a structured workflow that integrates geological data by preparing the well logging data from the Zhengzhuang Field and using machine learning classification techniques (using Python programming language version 3.11.9) to predict coal texture types. The workflow also includes selecting the most effective classifier with the most effective test train split size that can predict coal texture types with high performance.

2.1. Study Area Overview

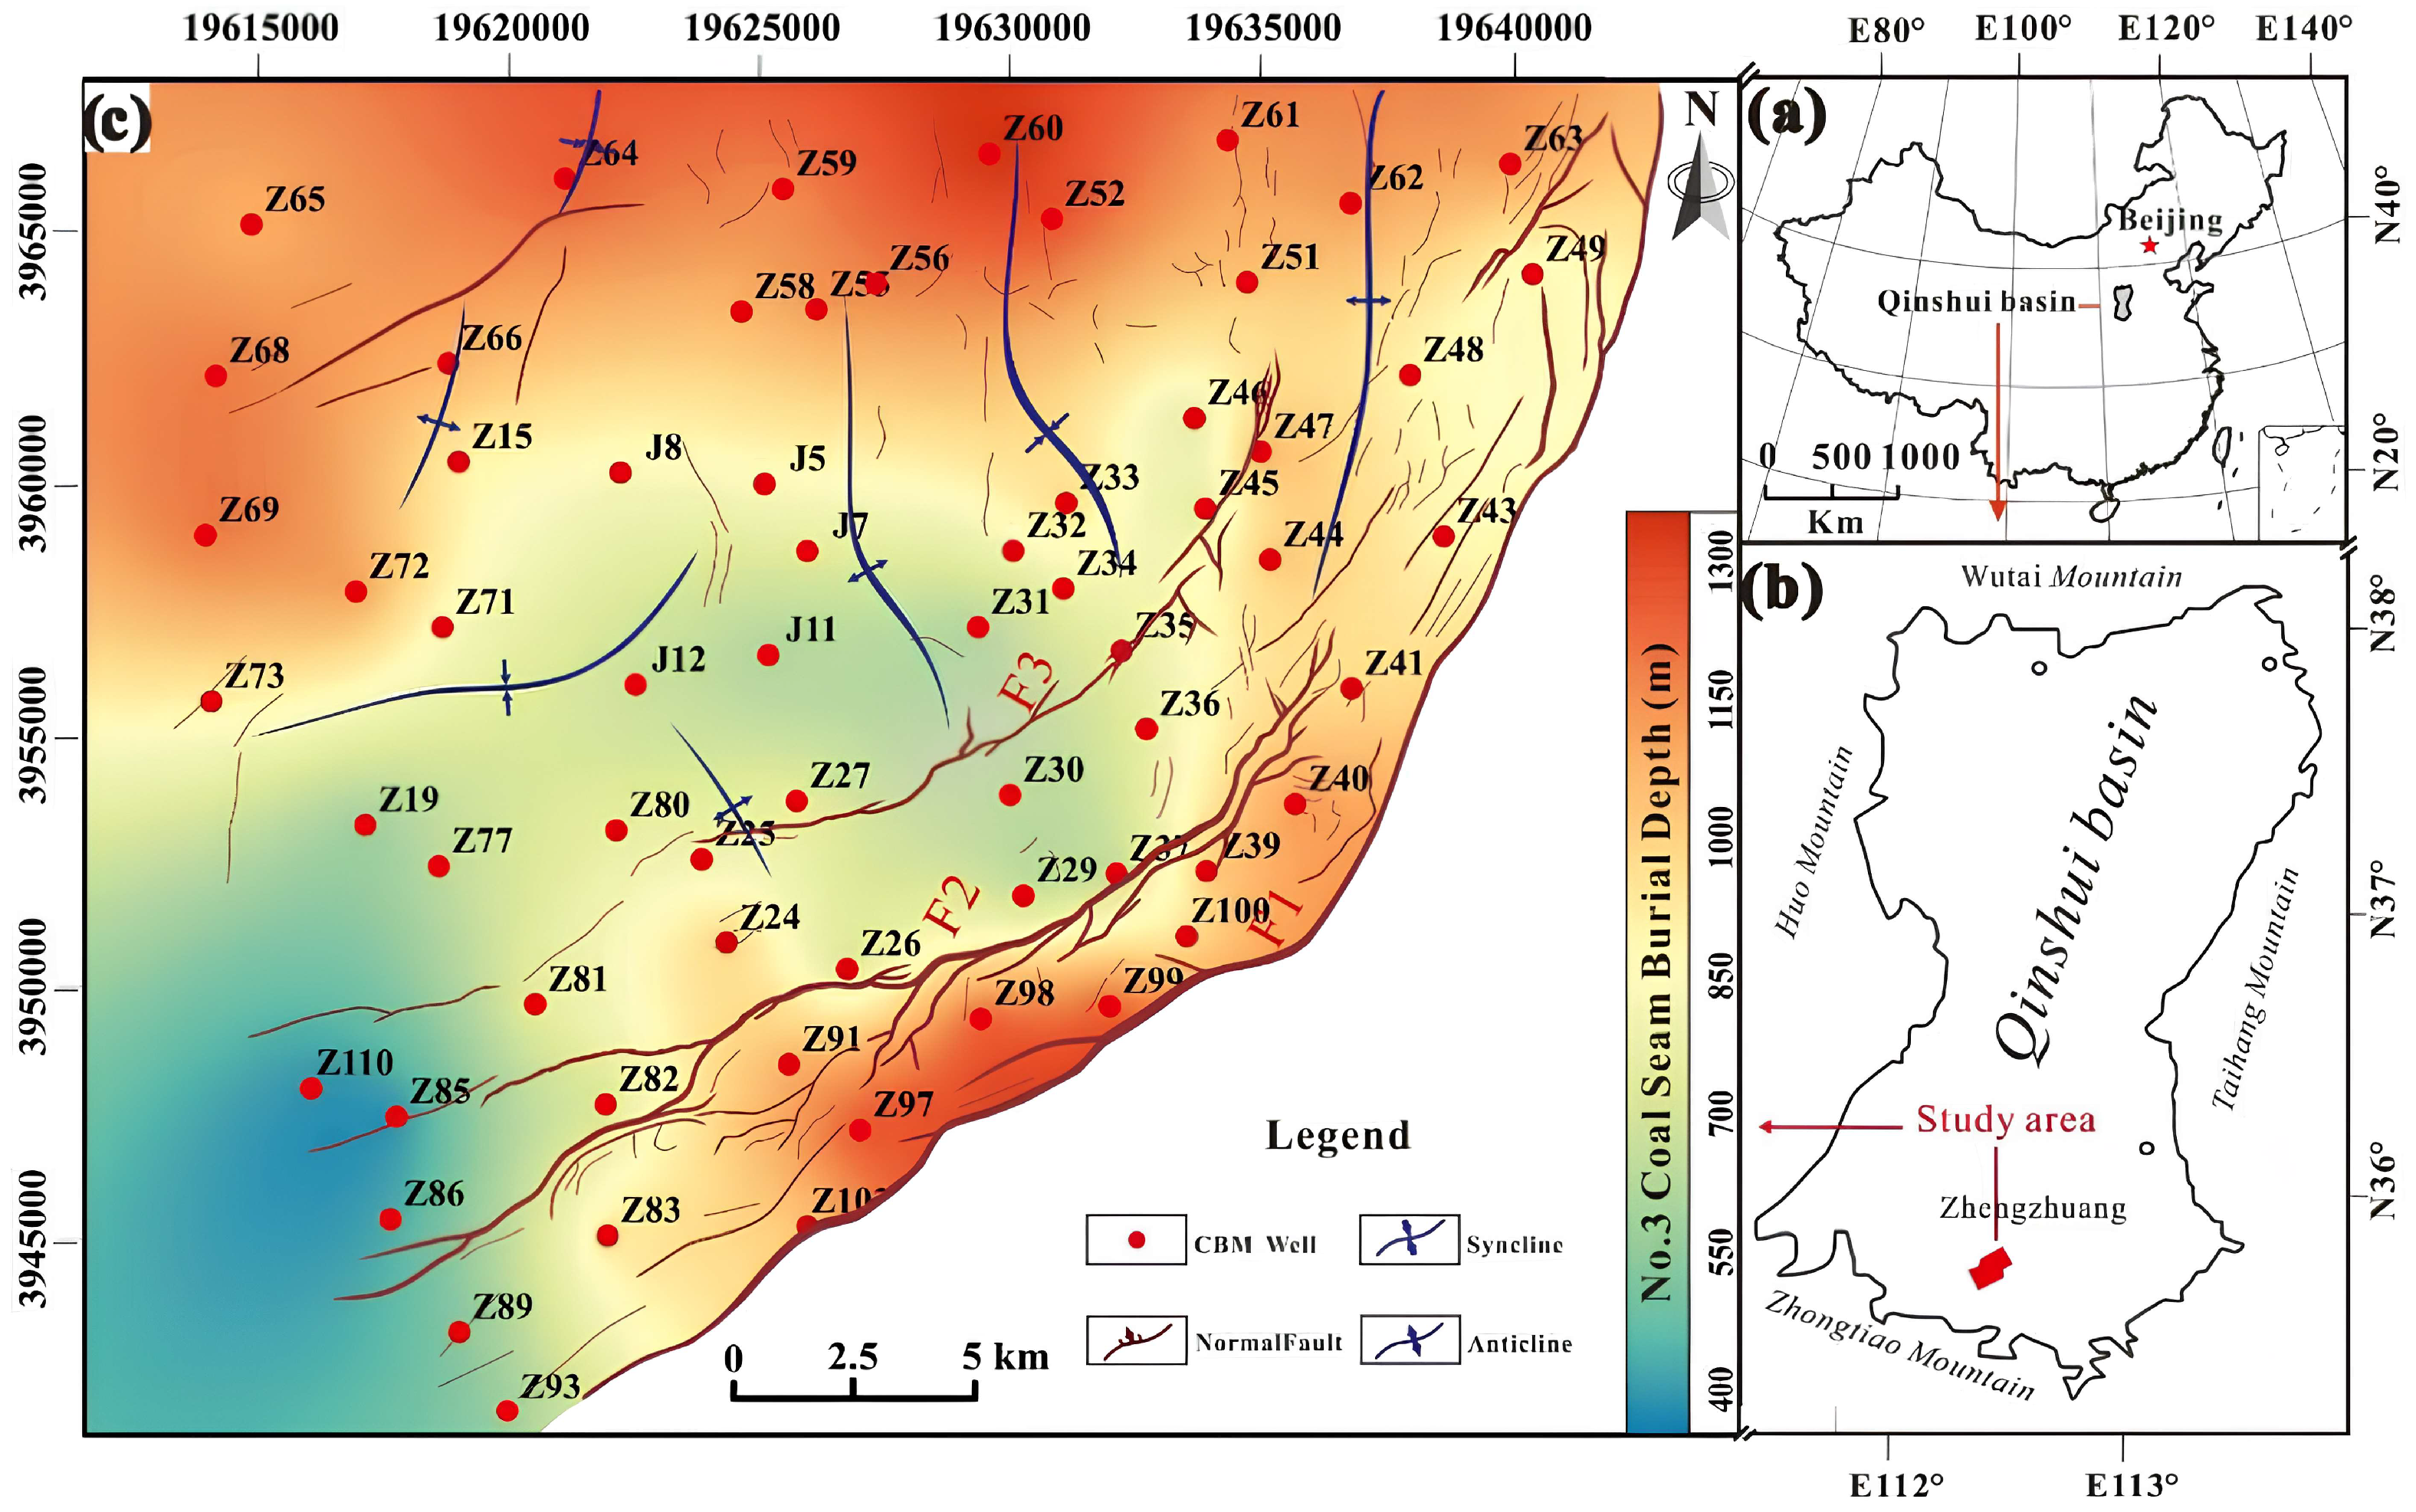
The Zhengzhuang Field, located in the central part of the Qinshui Basin, North China, is one of the most significant CBM production areas in the region. The Qinshui Basin is a fault-controlled synclinal basin with extensive coal-bearing strata, primarily of Carboniferous–Permian age. The Zhengzhuang block is characterized by thick coal seams, relatively stable stratigraphy, and well-developed structural deformation, making it an ideal site for coal texture analysis and reservoir characterization. Figure 2 shows a map of the Zhengzhuang Field, highlighting its location and the geological structures of the area. This area forms part of one of China’s most developed CBM basins, characterized by a gently dipping synclinal structure and high-rank anthracite coals of the Permian Shanxi Formation and Carboniferous Taiyuan Formation. The target seams in this study are the No. 3 and No. 15 coal seam layers, which were encountered at depths ranging from approximately 351.3 to 1341.9 m across all 86 wells from which the data were obtained.
In this study, three principal coal texture types are identified across the Zhengzhuang field. The coal texture labels were determined based on geological observations and well-log data. Coal textures (Undeformed Coal-UC, Cataclastic Coal-CC, and Granulated Coal-GC) were classified based on their distinct geological characteristics such as mechanical deformation, porosity, permeability, and fracturing. These classifications were verified and validated by geological experts, who ensured consistency in labeling based on established coal classification systems, those three types are:
  • Undeformed Coal (UC):
    UC represents primary or weakly deformed coal with preserved banded structure and strong mechanical integrity. This type typically shows low microporosity but high cleat connectivity, favoring fracture-dominated gas flow.
  • Cataclastic Coal (CC):
    CC formed under moderate tectonic stress, this texture exhibits partially disrupted banding and increased microfracturing. Cataclastic coal possesses enhanced adsorption capacity and moderate permeability, often acting as transitional facies between undeformed and granulated types.
  • Granulated Coal (GC):
    GC produced by intense tectonic deformation, granulated coal is fine-grained and friable, with a loss of bedding structures. It exhibits high microporosity but very low permeability, making it less favorable for CBM extraction without stimulation.
For this research, data were compiled from 86 wells distributed across the Zhengzhuang field. From each well, two representative stratigraphic layers Layer 3 and Layer 15 were selected based on their continuous logging coverage and lithological consistency. These layers were chosen because they represent key productive coal seams in the field, providing robust data for texture classification and prediction modeling.

2.2. Data Collection and Preprocessing

2.2.1. Well-Log Dataset Description

This study employed well-log data from 86 wells to characterize coal seam properties. The initial dataset comprised 13 logging parameters, each offering distinct geophysical information relevant to coal texture classification.
Measured depth (DEPTH) served as a spatial reference for correlating textural variations with stratigraphy. Acoustic transit time (AC) is sensitive to lithological changes and fracturing, with higher values indicating more deformed or porous coal. Caliper (CAL) measurements reflect borehole diameter, where deviations suggest weak or granulated coal zones. The compensated neutron log (CNL) indicates hydrogen content, indirectly representing microporosity and adsorbed gas. Bulk density (DEN) distinguishes intact from fractured coal, as higher densities typically correspond to undeformed textures. Gamma ray (GR) readings identify shale impurities and help separate coal from non-coal strata.
Resistivity measurements, including microresistivity (Rxo), deep resistivity (RD), and shallow resistivity (RS), provide insights into pore structure, cleat water content, and invasion profiles. Spontaneous potential (SP) reflects electrochemical contrasts that may relate to lithological or permeability variations. Other parameters borehole deviation (DEVI), resistivity at 2.5 m (R2_5), and porosity (POR) were excluded from modeling due to limited data coverage as shown in Table 1.

2.2.2. Preparing the Data

Prior to preprocessing, a descriptive statistical analysis was performed to assess data completeness and variability. The initial dataset exhibited heterogeneous coverage parameters such as POR, DEVI, and R2_5 had low availability (<20%), while others like DEPTH, AC, CAL, GR, and SP were fully recorded (100%). Variables with insufficient data were excluded from subsequent analysis to prevent overfitting and model bias.
The final dataset retained the following well-log parameters for modeling: DEPTH, AC, CAL, CNL, DEN, GR, Rxo, SP, RD, and RS.
Table 1 summarizes the descriptive statistics for all well-log parameters prior to data cleaning and imputation. The presented metrics include count, completeness percentage, mean, standard deviation (std), minimum (min), maximum (max), and interquartile range (IQR). The completeness percentage highlights the degree of data availability for each parameter, which informed subsequent preprocessing and variable selection decisions. A total of 2992 data points were extracted from the well-logging dataset, comprising 2429 UC samples, 554 CC samples, and only 9 GC samples. These data points were obtained from two stratigraphic layers 2037 points from Layer 3 and 955 points from Layer 15 representing the primary intervals analyzed for coal texture classification. Although Granulated Coal—GC has only 9 data points, an oversampling technique has been used to balance the dataset. Specifically, SMOTE (Synthetic Minority Over-sampling Technique) was used to increase the number of samples for GC by generating synthetic examples based on the existing data points of this class. This helps mitigate the challenge of having a very small number of samples for GC and ensures that the model is trained on a more balanced dataset.

2.2.3. Data Cleaning

The descriptive statistics indicate pronounced variability among several logging parameters, reflecting both geological heterogeneity and potential measurement inconsistencies. Most parameters—such as DEPTH, AC, CAL, GR, and SP—exhibit near-complete data coverage (≥98%), whereas CNL (78%), RS (84%), and R2_5 (74%) show moderate data loss. In contrast, POR (13%) and DEVI (3%) possess extremely limited data availability, making them unsuitable for inclusion in subsequent modeling due to their high potential to introduce statistical bias.
The well-logging dataset from the Zhengzhuang Field underwent systematic quality enhancement to ensure data completeness, reliability, and consistency prior to model construction. The initial dataset displayed a combination of complete and incomplete records across 13 logging parameters, necessitating the careful treatment of missing values and outliers to produce a coherent and interpretable dataset suitable for machine learning applications.
A detailed completeness assessment identified POR, DEVI, and R2_5 as parameters with inadequate data coverage of approximately 13%, 3%, and 74%, respectively. Due to their sparsity and risk of bias, these parameters were excluded from subsequent analyses. The remaining variables—DEPTH, AC, CAL, CNL, DEN, GR, Rxo, SP, RD, and RS—demonstrated sufficient coverage (>85%) and were retained for preprocessing and imputation. This refined subset provides a robust suite of petrophysical indicators that effectively capture lithological variations, coal texture characteristics, and structural deformation features.

2.2.4. Missing Value Imputation Using Machine Learning

To achieve full data completeness across all parameters, missing values were estimated using machine learning–based regression models instead of traditional mean or median substitution methods, which can distort the natural distribution of the data. For each parameter containing missing observations, a Random Forest Regression was trained using the available portion of the dataset. The model utilized correlated variables such as AC, DEN, GR, and SP to infer the missing values with high accuracy.
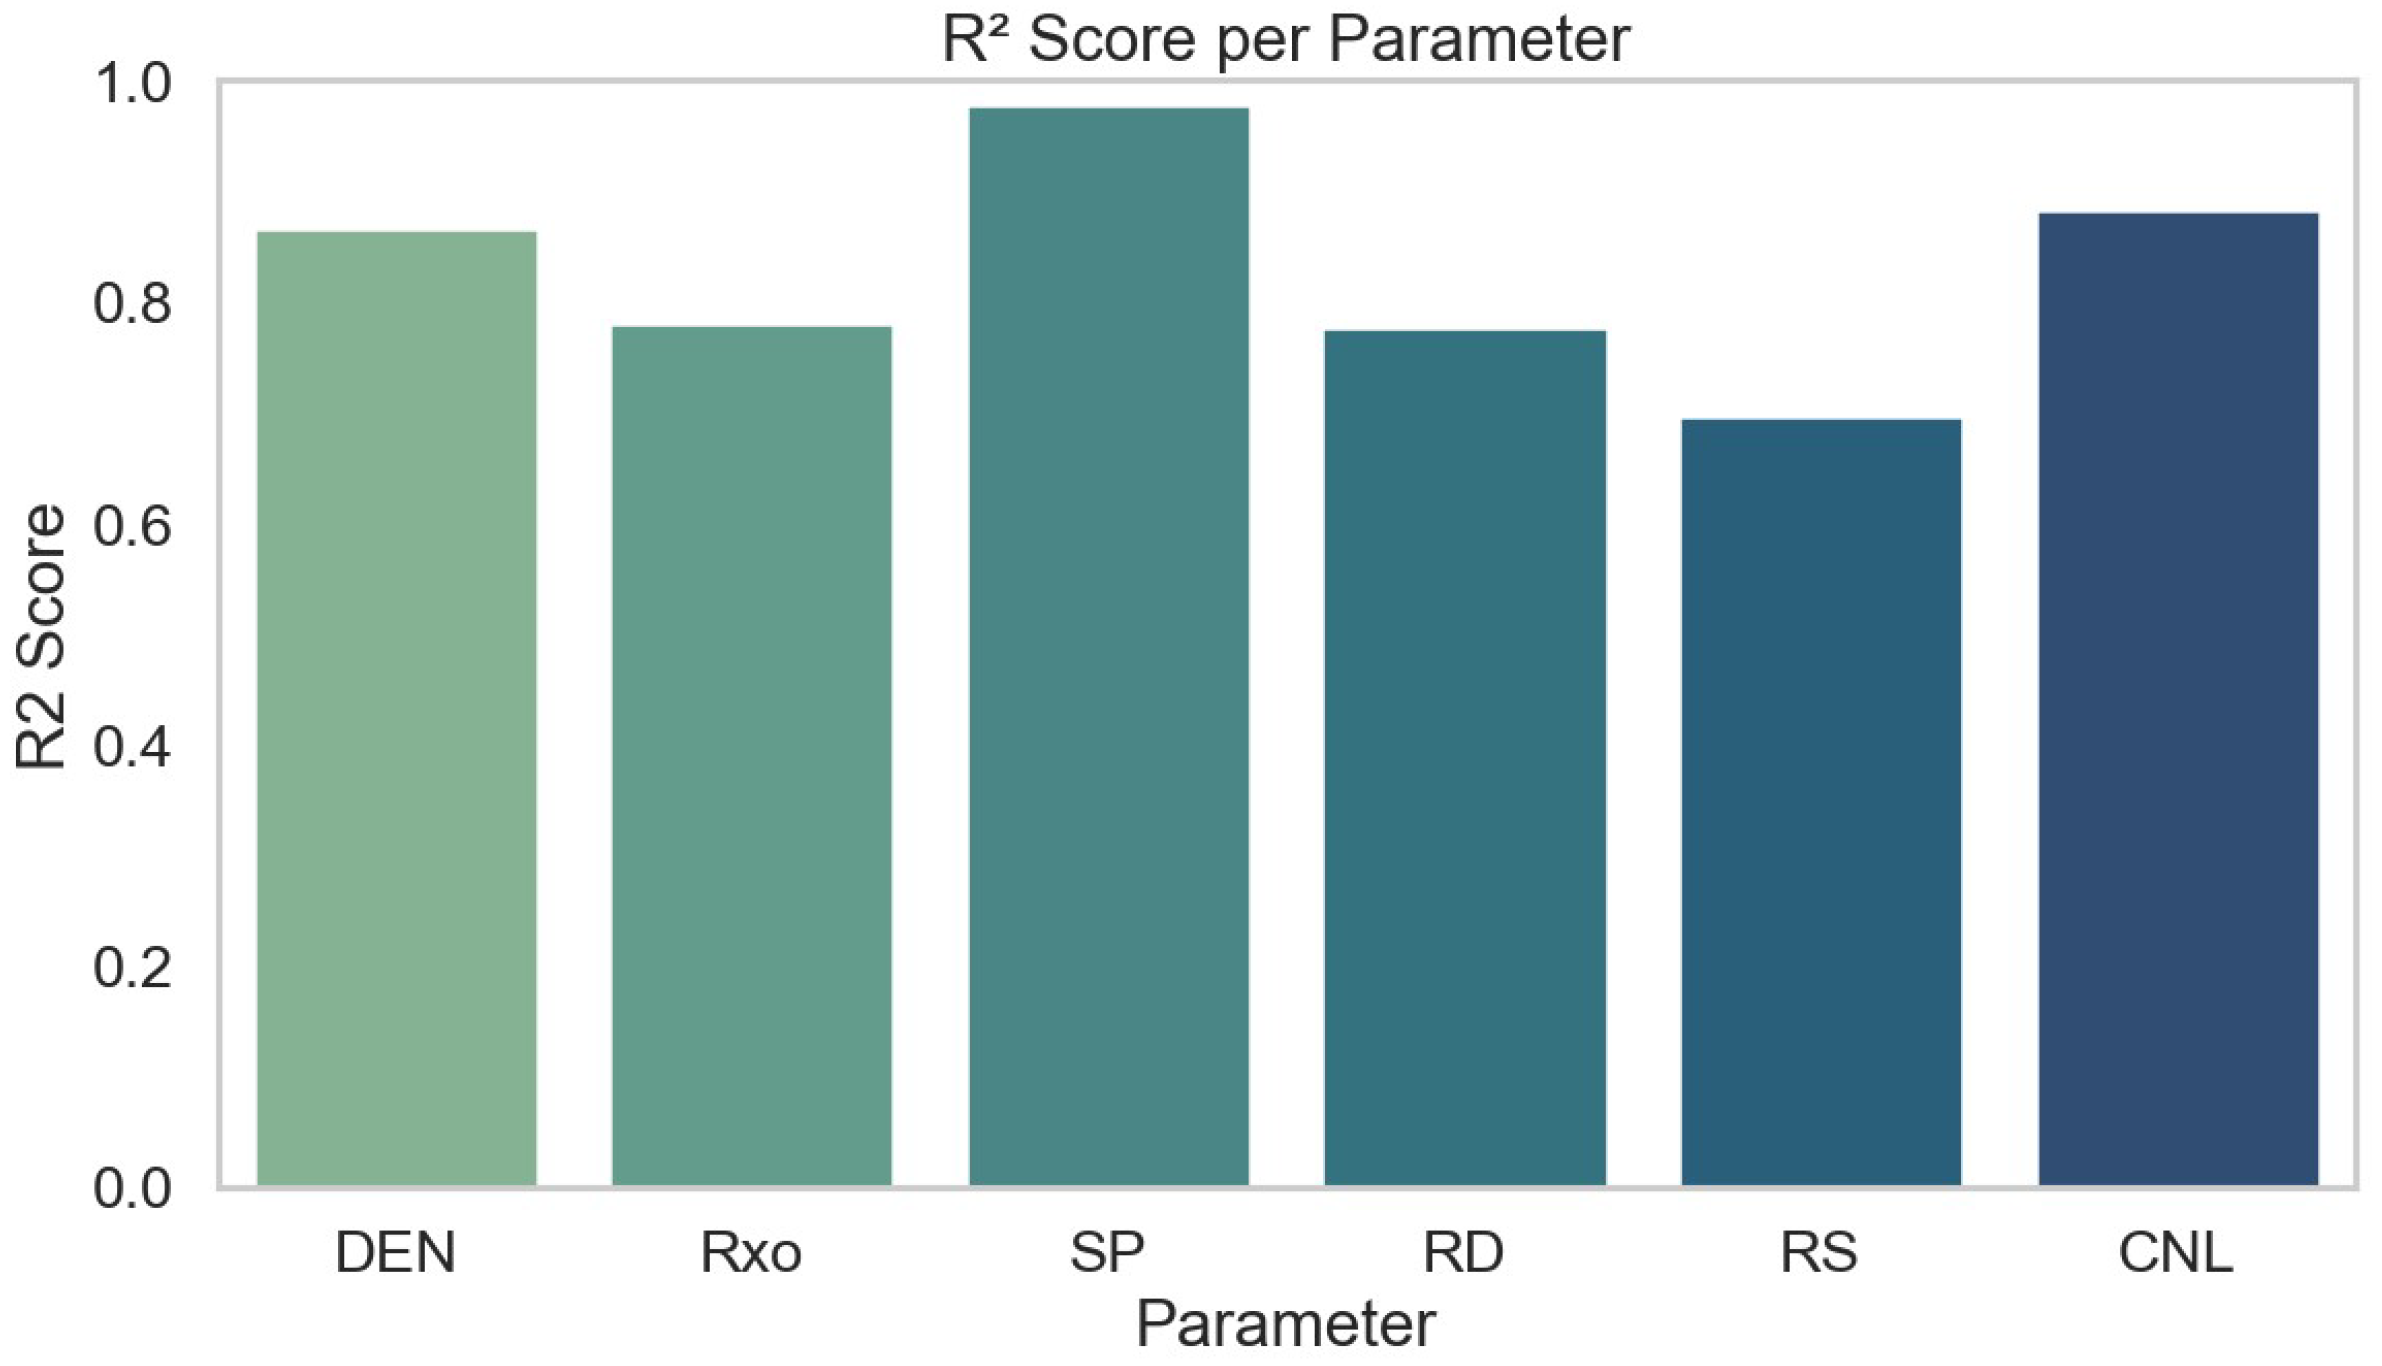
The performance of the imputation models was evaluated using the coefficient of determination (R2) for each parameter, as illustrated in Figure 3. The results demonstrate high predictive accuracy across all six imputed parameters (DEN, Rxo, SP, RD, RS, and CNL), with R2 values consistently exceeding 0.7. This confirms the robustness of the machine learning-based regression approach and its effectiveness in preserving inter-parameter relationships while achieving complete and statistically reliable data reconstruction.
After imputation, the reconstructed dataset was validated by comparing key statistical properties, including mean and variance, before and after processing to ensure consistency and realism in the data distribution. This approach successfully preserved the multivariate dependencies among features while achieving complete data coverage across all retained parameters, totaling 2992 samples per variable. The refined dataset, presented in Table 2 demonstrates uniform completeness and stabilized variance, with all parameters exhibiting 100% availability and improved distributional integrity relative to the raw data.

2.2.5. Parameters Reduction Before Modeling

Although all resistivity curves (RD, RS, and R2_5) capture similar aspects of the formation’s electrical characteristics, retaining them collectively introduces a high risk of multicollinearity within machine learning models. To optimize the input feature set and improve interpretability, only Rxo was preserved as the representative resistivity parameter, as it exhibited the most stable statistical behavior and the strongest correlation with coal texture variability.
This refinement produced a compact and reliable suite of features specifically tailored for coal texture prediction: DEPTH, AC, CAL, CNL, DEN, GR, Rxo, and SP. The finalized dataset achieved full completeness (100%) and consistent quality control across all retained parameters, ensuring robustness for subsequent modeling and analysis. This refined dataset serves as the foundation for the subsequent feature selection and coal-texture classification modeling, ensuring that all analyses are based on high-quality and bias-free data.

2.3. Input Parameter Selection for Coal-Texture Prediction

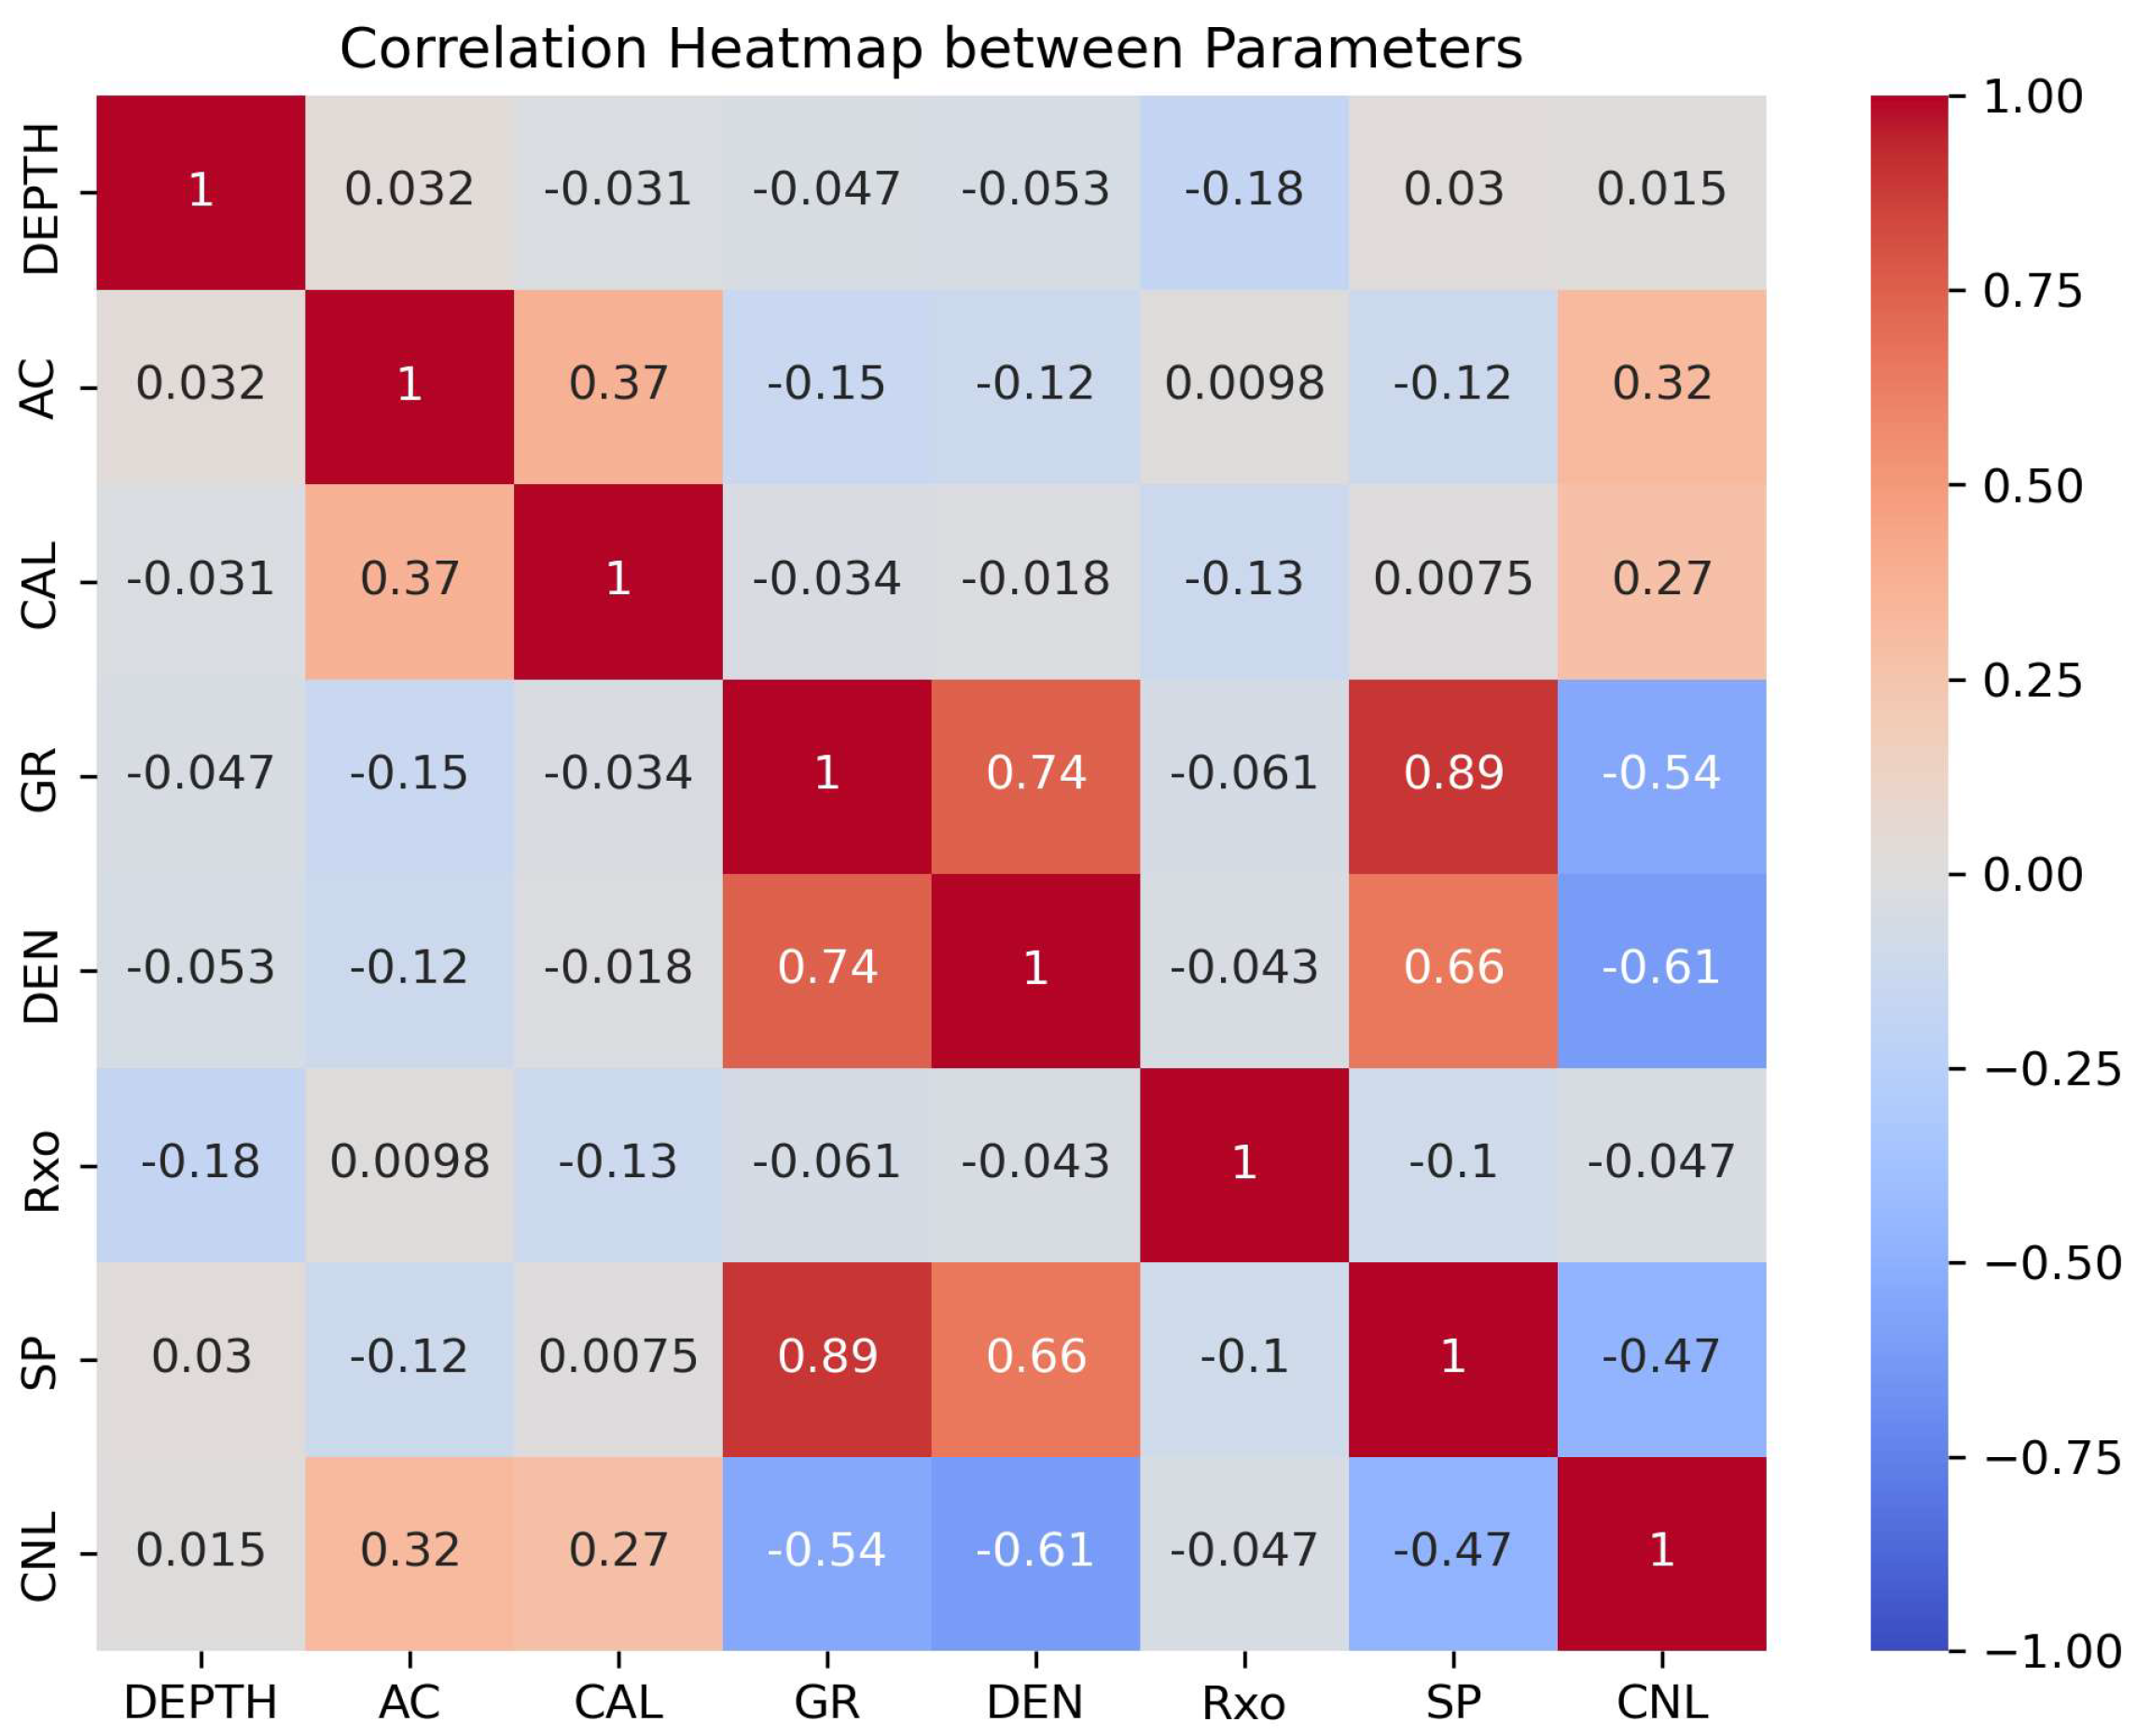
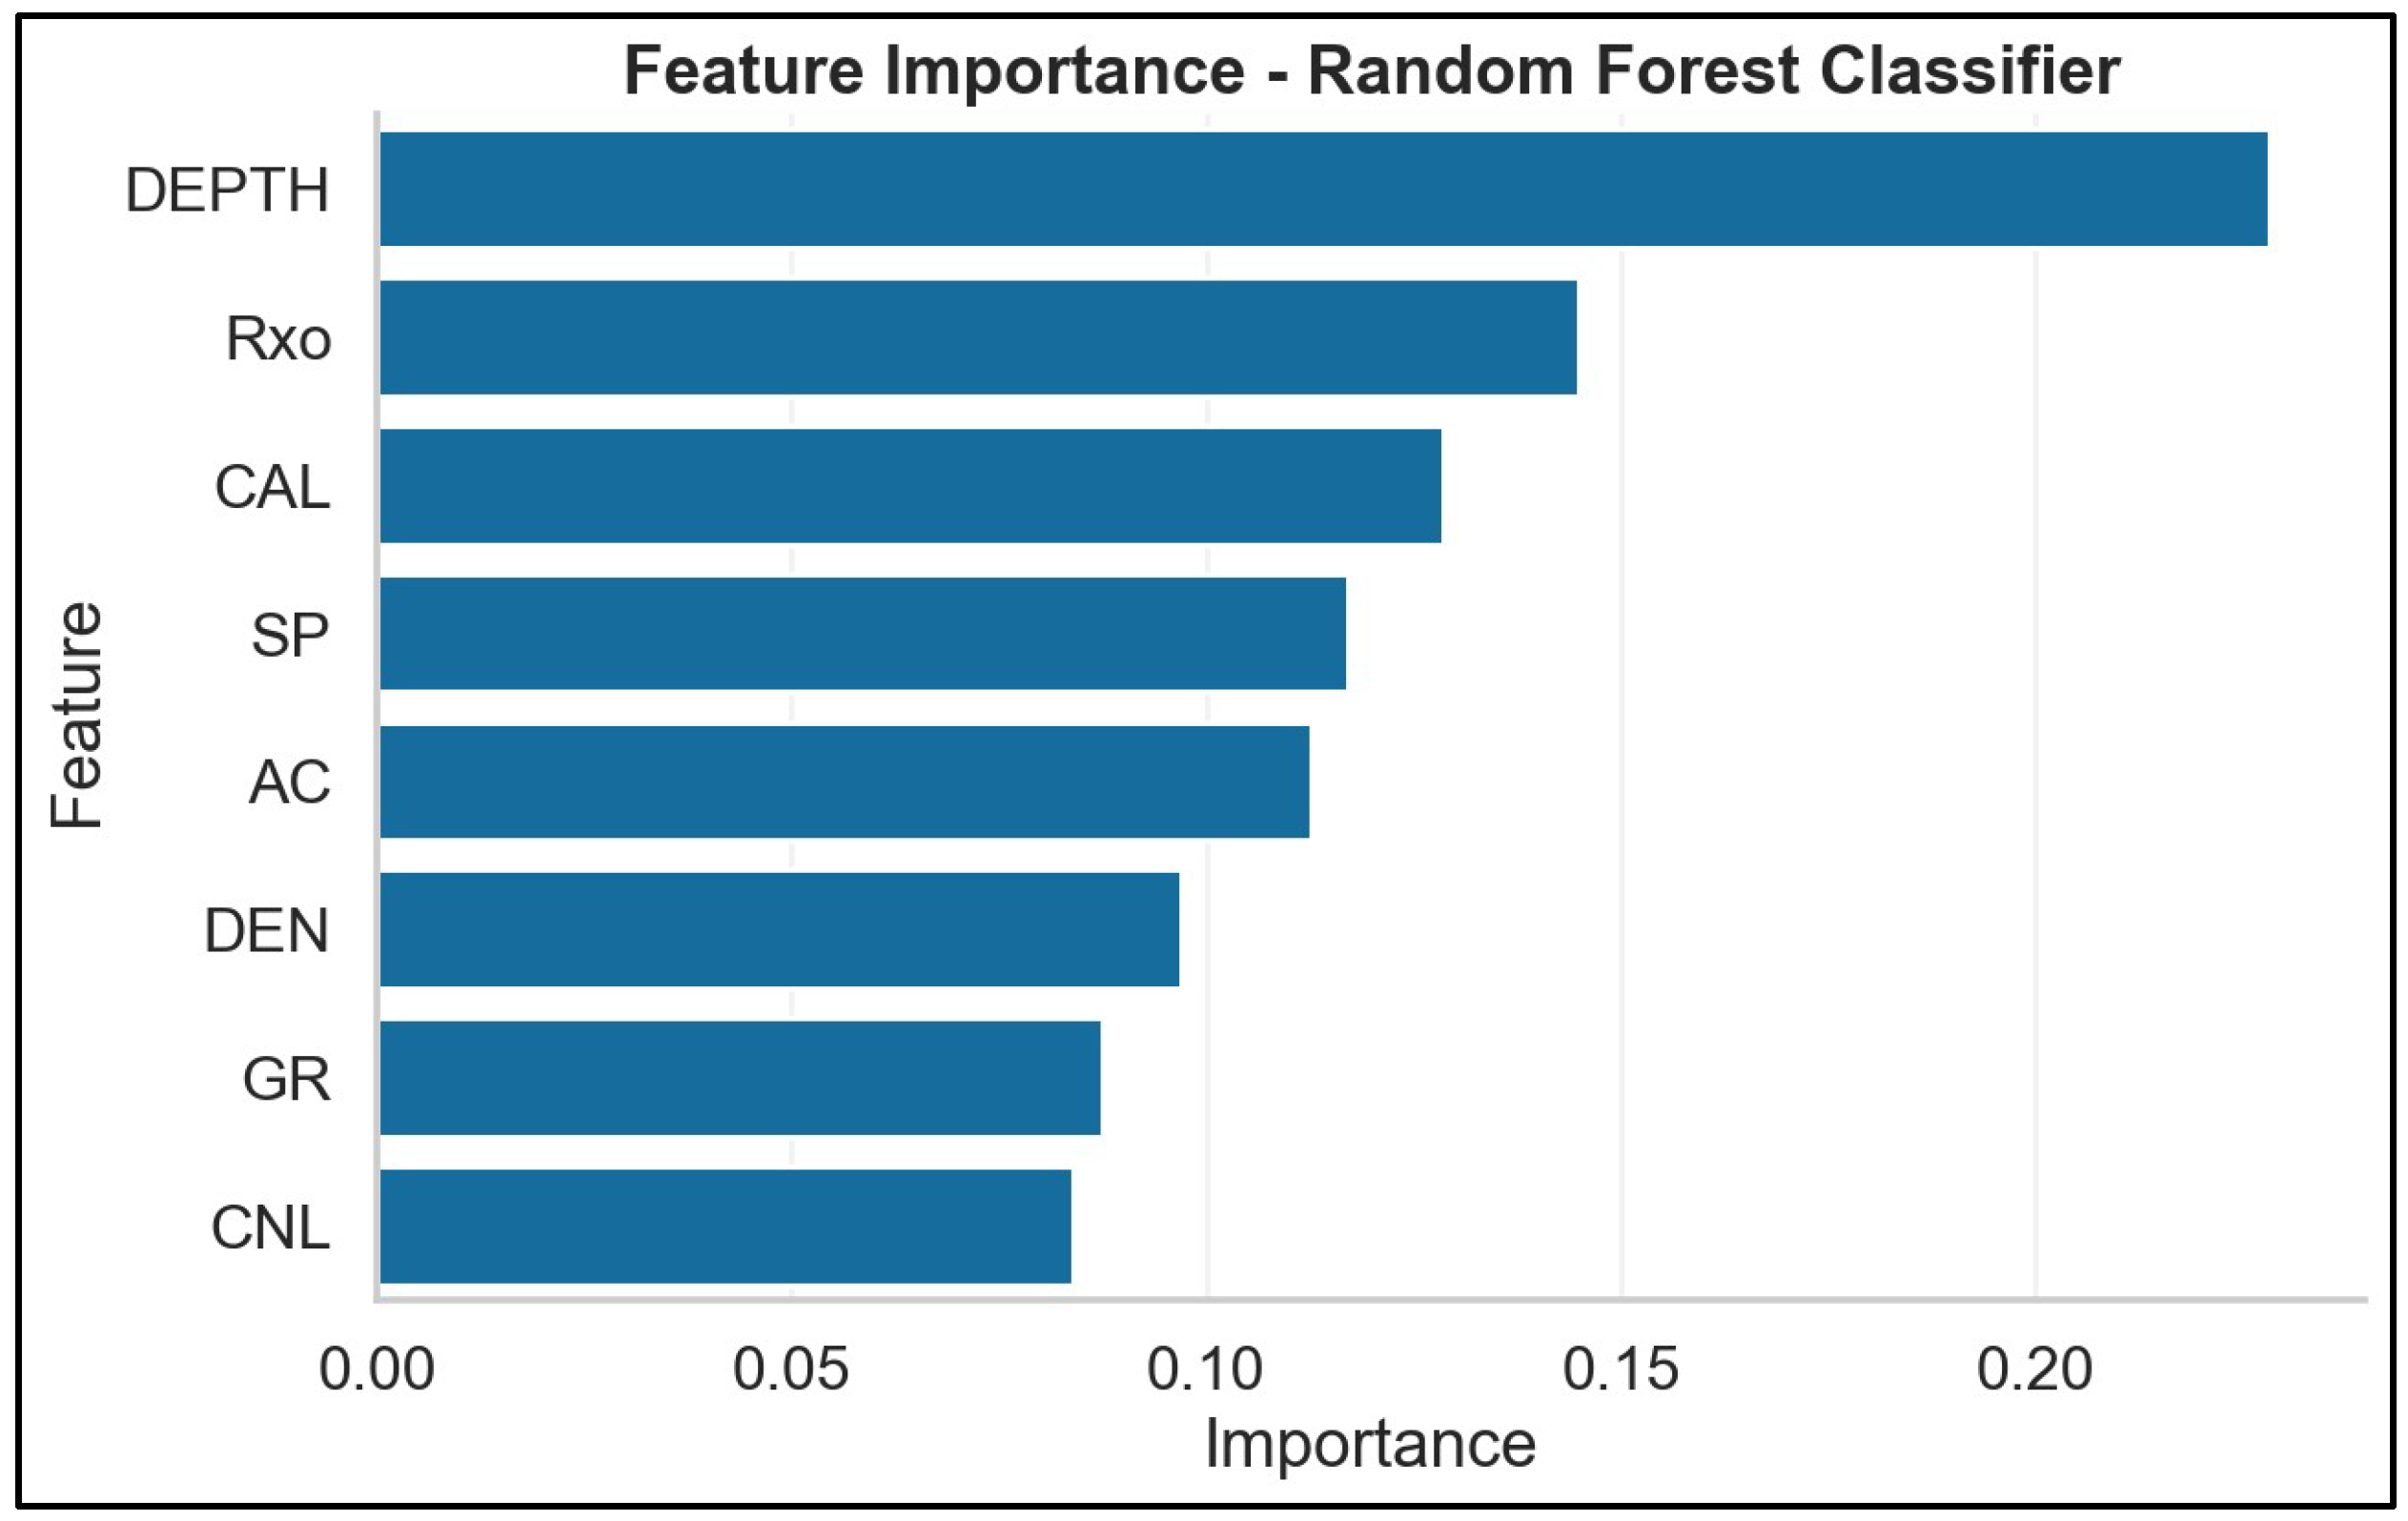
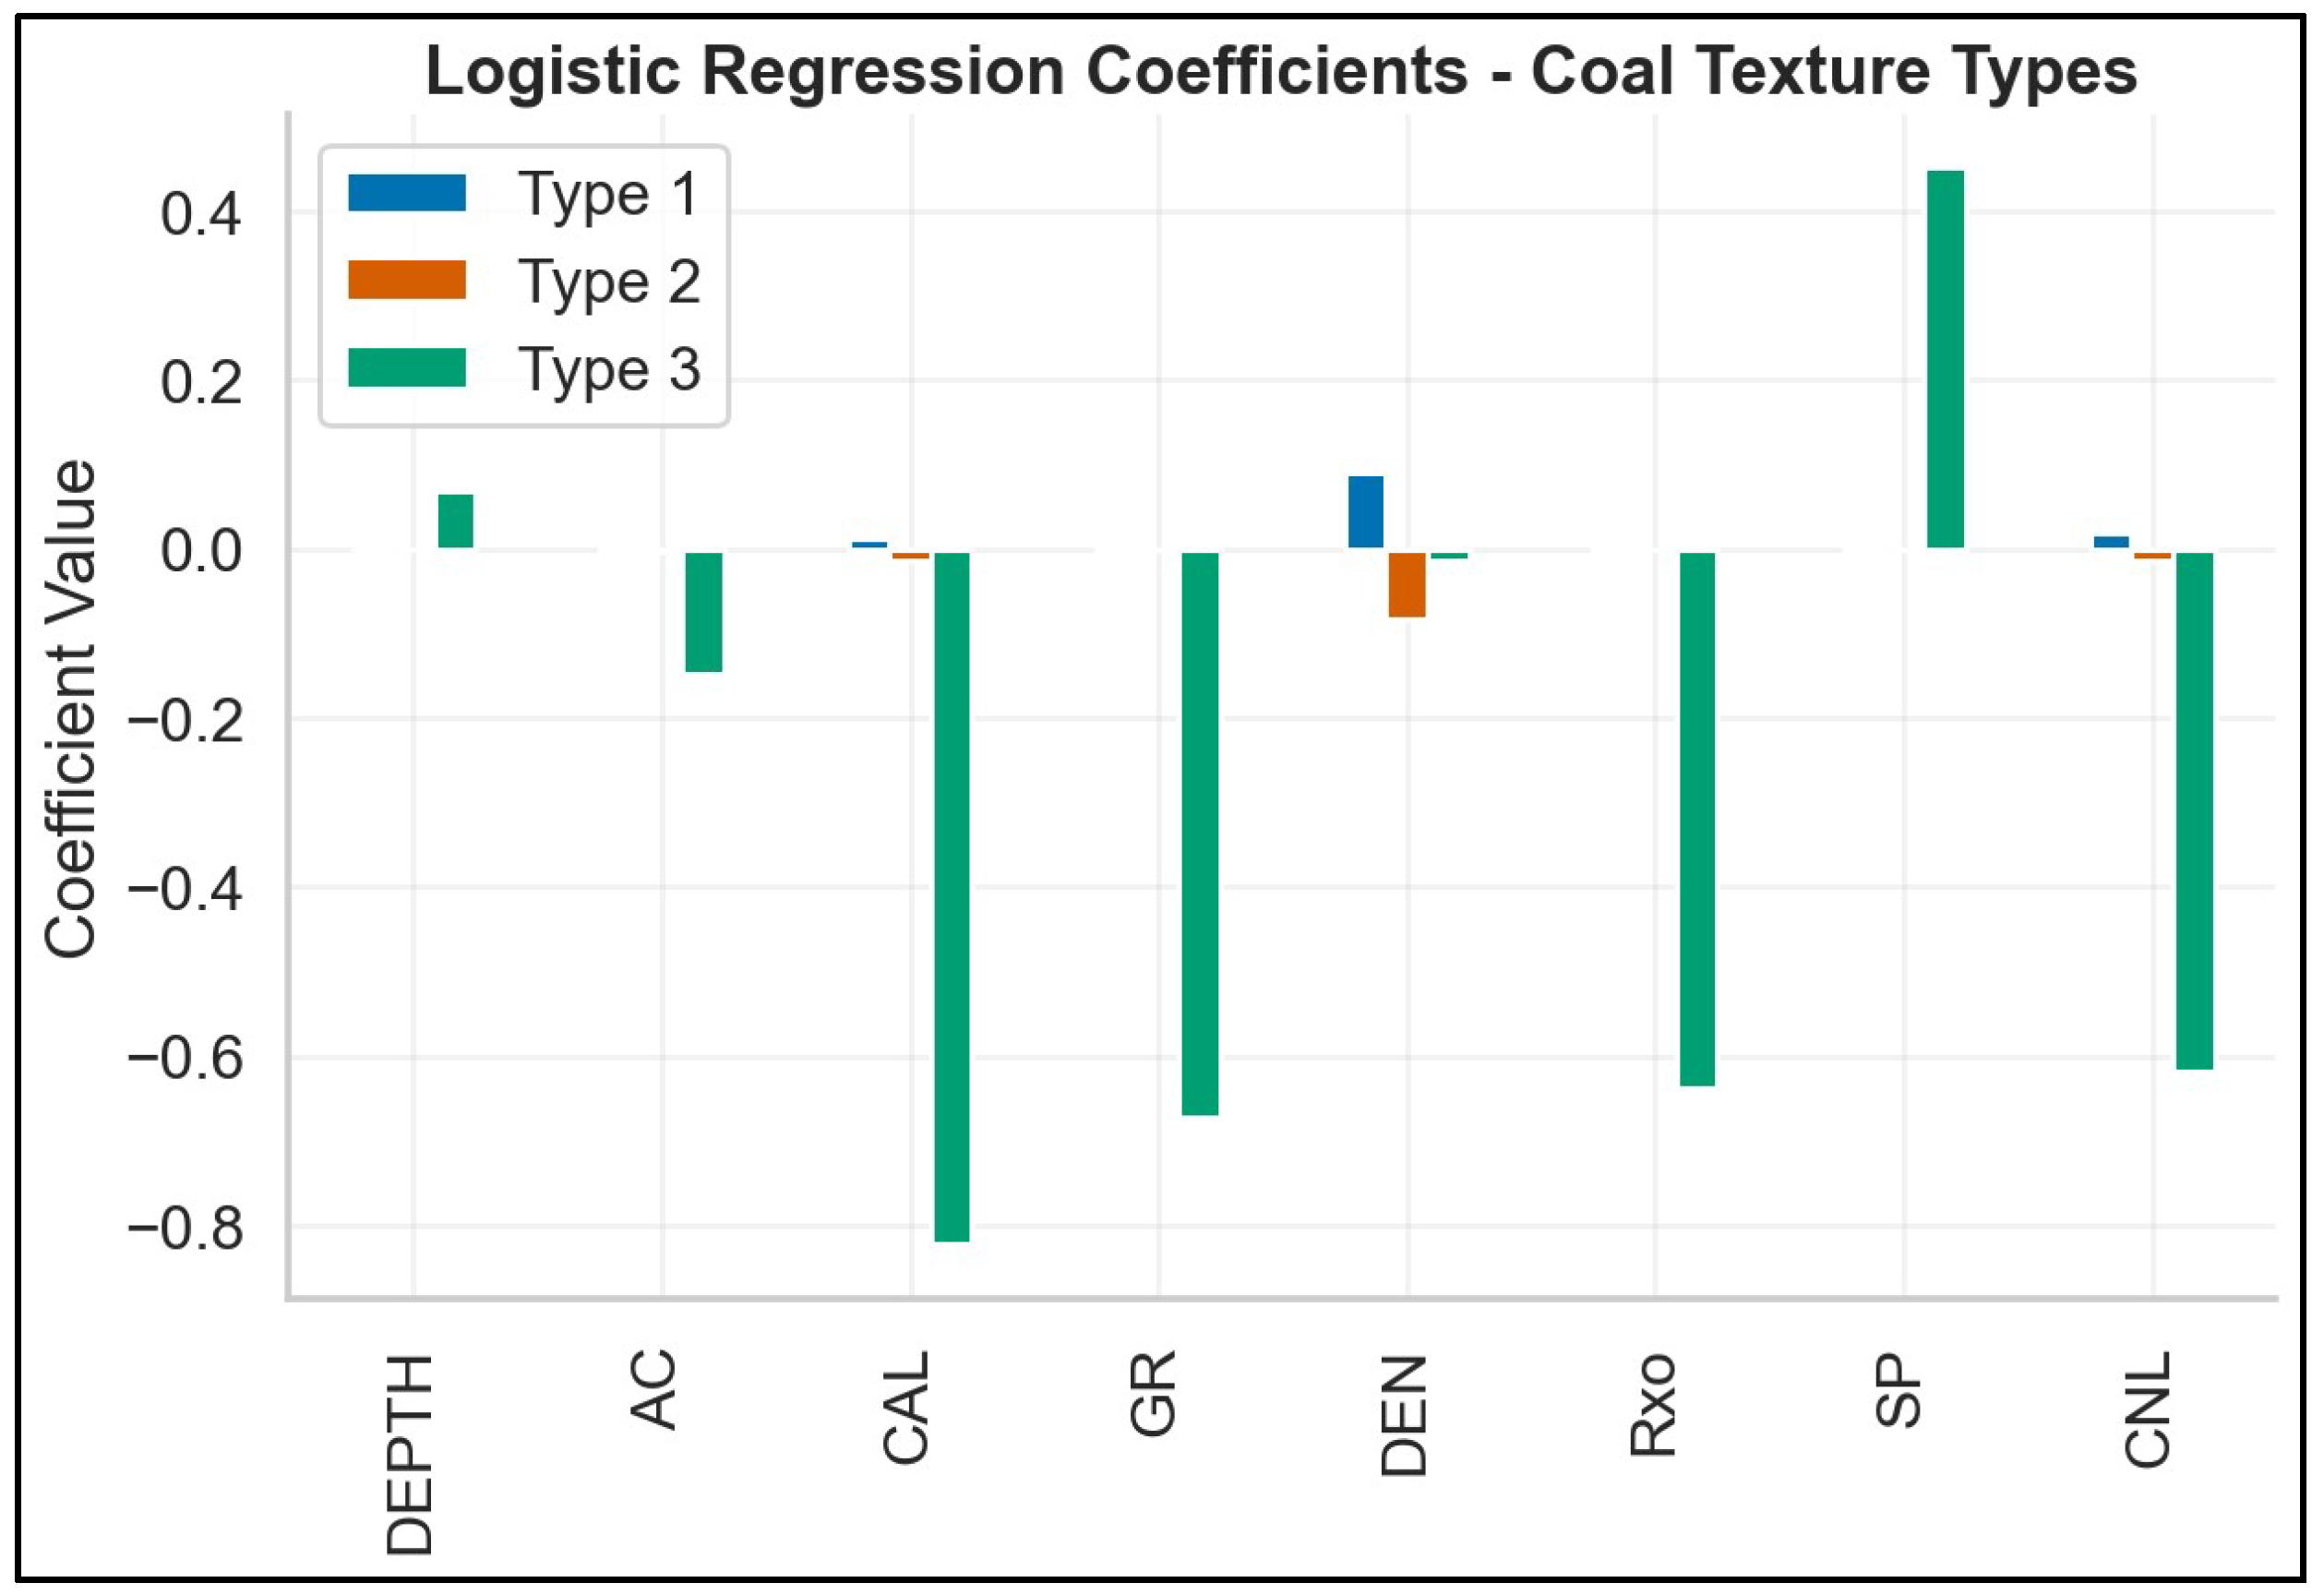
After preprocessing, eight well-log parameters—DEPTH, AC, CAL, CNL, DEN, GR, Rxo, and SP—were retained for modeling to evaluate their relative predictive contributions while minimizing redundancy. Three complementary analyses were conducted to assess the importance and interdependence of these features. The heat map correlation analysis as shown in Figure 4 revealed low to moderate correlations among most parameters, with the highest correlations observed between GR–SP (r = 0.89) and GR–DEN (r = 0.74), indicating shared sensitivity to lithological composition and borehole conditions. The Random Forest feature importance analysis which shown in Figure 5 demonstrated that DEPTH, Rxo, and CAL were the most influential parameters in predicting coal texture types, with SP and AC also contributing significantly. Additionally, the multinomial logistic regression coefficients shown in Figure 6 represent the influence of each feature on the classification of coal texture types. In this model, the coal texture types were encoded as categorical variables, where Type 1 represents Undeformed Coal (UC), Type 2 represents Cataclastic Coal (CC), and Type 3 represents Granulated Coal (GC). The multi-class dependent variable was thus a multi-class categorical variable corresponding to these three coal texture types.
Based on these findings, all eight features were retained for the primary modeling scenario. To explore the effect of reduced dimensionality, a secondary model was also developed using only the top five features—DEPTH, Rxo, CAL, SP, and AC—excluding DEN, GR, and CNL, which were found to have lesser impact. This dual-scenario approach enabled an assessment of how input dimensionality influenced model accuracy and stability. In this study, the relationships observed between the coal texture classifications and geophysical parameters, such as DEPTH and Rxo, are consistent with the geological understanding of coal seams in the Zhengzhuang Field. DEPTH is a crucial parameter that reflects the stratigraphy of the region, which can influence coal porosity and permeability. Coal textures such as UC, CC, and GC are closely linked to the depth of burial and the degree of tectonic stress exerted during the formation of the coal seams, the deeper coal seams tend to show a more cataclastic and fractured texture due to the higher stress levels at these depths.

2.4. Machine Learning Models

To predict coal-texture classes (undeformed, cataclastic, and granulated) from the well-log data, five complementary ML classifiers were selected: Extra Trees, Gradient Boosting, SVC, Random Forest, and kNN. These algorithms were chosen to represent diverse modeling paradigms—ensemble decision trees, boosting methods, kernel-based learning, and distance-based classification—allowing robust evaluation of nonlinear relationships and complex feature interactions inherent in the coal-log dataset [17].

2.4.1. Extra Trees Classifier

The Extra Trees algorithm is an ensemble method that constructs multiple unpruned decision trees with increased randomization in feature splits. Its computational efficiency and resistance to overfitting make it particularly suitable for noisy and correlated data, such as the heterogeneous coal-log dataset. This method is ideal for capturing complex, nonlinear relationships between features and coal-texture types [17].

2.4.2. Gradient Boosting Classifier

Gradient Boosting sequentially builds an ensemble of weak learners (typically shallow decision trees), where each model aims to correct the errors of its predecessor. It excels at capturing complex nonlinear relationships and handling noisy, imbalanced datasets. This method enhances prediction accuracy and is particularly effective in improving the precision of coal-texture classification when dealing with mixed data types [18,19,20].

2.4.3. SVC

The SVC is a kernel-based algorithm that finds the optimal hyperplane to separate different classes by maximizing the margin between them. It is effective in high-dimensional spaces and can handle situations where the number of features is much larger than the number of samples. SVC is particularly useful for distinguishing subtle differences between coal-texture classes when linear separability is weak [20].

2.4.4. Random Forest Classifier

The Random Forest algorithm aggregates predictions from multiple decision trees built on Random Forest is an ensemble method that aggregates predictions from multiple decision trees trained on bootstrapped subsets of the data with random feature selections. This model provides high generalization ability and is resistant to noise, making it suitable for complex datasets like coal logs. It also offers valuable insights into feature importance, helping to identify the most influential variables in coal-texture classification [21].

2.4.5. KNN

The kNN algorithm classifies samples based on the majority label of their k nearest neighbors in the feature space. Simple and non-parametric, kNN is effective for capturing local structures and clusters within data. This method serves as a baseline model for evaluating spatial similarities among well-log signatures and coal textures, offering insight into the relationship between proximity in the feature space and coal-texture classification [2,20,22].
Before training the models, hyperparameter optimization was performed to ensure optimal performance for each classifier. The hyperparameter tuning process was carried out to find the best values for each model. Table 3 summarizes the key hyperparameters optimized for each machine learning model.
To comprehensively evaluate model performance and ensure robust prediction of coal-texture types, those five selected machine learning classifiers were each tested under two distinct input scenarios.
  • Scenario 1: Utilized all eight well-log features—DEPTH, AC, CAL, CNL, DEN, GR, Rxo, and SP.
  • Scenario 2: Focused on the top five most influential features—DEPTH, Rxo, CAL, SP, and AC.
This dual-scenario framework enabled the assessment of how input dimensionality impacts model accuracy, stability, and generalization. After model evaluation, the best-performing classifiers were tested across multiple train-test size partitions (20%, 30%, 40%, and 50%) to determine the optimal data-split ratio for balancing training efficiency and predictive accuracy. This approach led to the identification of the most stable and accurate model configuration, forming the foundation for the final predictive framework in this study.

2.5. Evaluation Metrics

To evaluate the performance of the machine learning models, three key metrics were used: McFadden’s Pseudo-R2, Macro F1 Score, and PCA Projection by Coal Texture Type.
McFadden’s Pseudo-R2 is a measure of model fit that serves as an alternative to traditional R2 in logistic regression models. It is particularly useful for models that predict categorical outcomes, such as coal-texture classification. McFadden’s Pseudo-R2 is defined as:
R2_McFadden = 1 − (L_model/L_null)
where Lmodel is the log-likelihood of the fitted model, and Lnull is the log-likelihood of a model that only includes an intercept (i.e., no predictors). A higher value of McFadden’s Pseudo-R2 indicates a better-fitting model, with values close to 1 suggesting strong predictive power [23,24]. This metric is traditionally used for logistic regression models, but this study has applied it to all models, including non-logistic models such as Random Forest, Extra Trees, and Gradient Boosting by used the log-likelihood of the model (L_model) and compared it with the log-likelihood of a null model (L_null), which contains only the intercept.
Macro F1 Score is a metric used to evaluate classification models, particularly in imbalanced datasets. It is the harmonic mean of precision and recall, providing a single metric that balances the trade-off between false positives and false negatives. The Macro F1 Score is calculated as:
F1_macro = (1/N) × Σ (2 × Precision_i × Recall_i/(Precision_i + Recall_i))
where N is the number of classes, and Precisioni and Recalli are the precision and recall for class i, respectively. The Macro F1 Score averages the F1 scores of each class, giving equal weight to all classes, regardless of their frequency in the dataset [17,18,25].
PCA Projection by Coal Texture Type (PC1–PC2) is used to visualize the data in a reduced dimensional space, typically focusing on the first two principal components (PC1 and PC2) derived from Principal Component Analysis (PCA). This method helps to identify the separation between coal-texture classes in the feature space. By plotting the data in this reduced dimensional space, the projection helps visualize the separation of coal textures based on the well-log parameters, providing insight into the effectiveness of the model in distinguishing between the different classes [26,27].
These metrics offer a comprehensive evaluation of the model’s performance, focusing on fit, classification accuracy, and the underlying structure of the data in relation to coal-texture types.

3. Results and Discussion

3.1. Prediction Scenarios

3.1.1. Scenario 1: Model Evaluation and Performance Utilizing All 8 Parameters

In this scenario, all eight well-log parameters—DEPTH, AC, CAL, CNL, DEN, GR, Rxo, and SP—were incorporated to predict coal texture types. The evaluation of model performance indicated strong results across multiple metrics, including accuracy, Macro F1 Score, and McFadden’s Pseudo-R2 Score. These findings suggest that the full set of parameters offers significant value in distinguishing between coal texture types. The subsequent analysis presents the results of these models along with visual representations that highlight both predictive performance and feature importance.
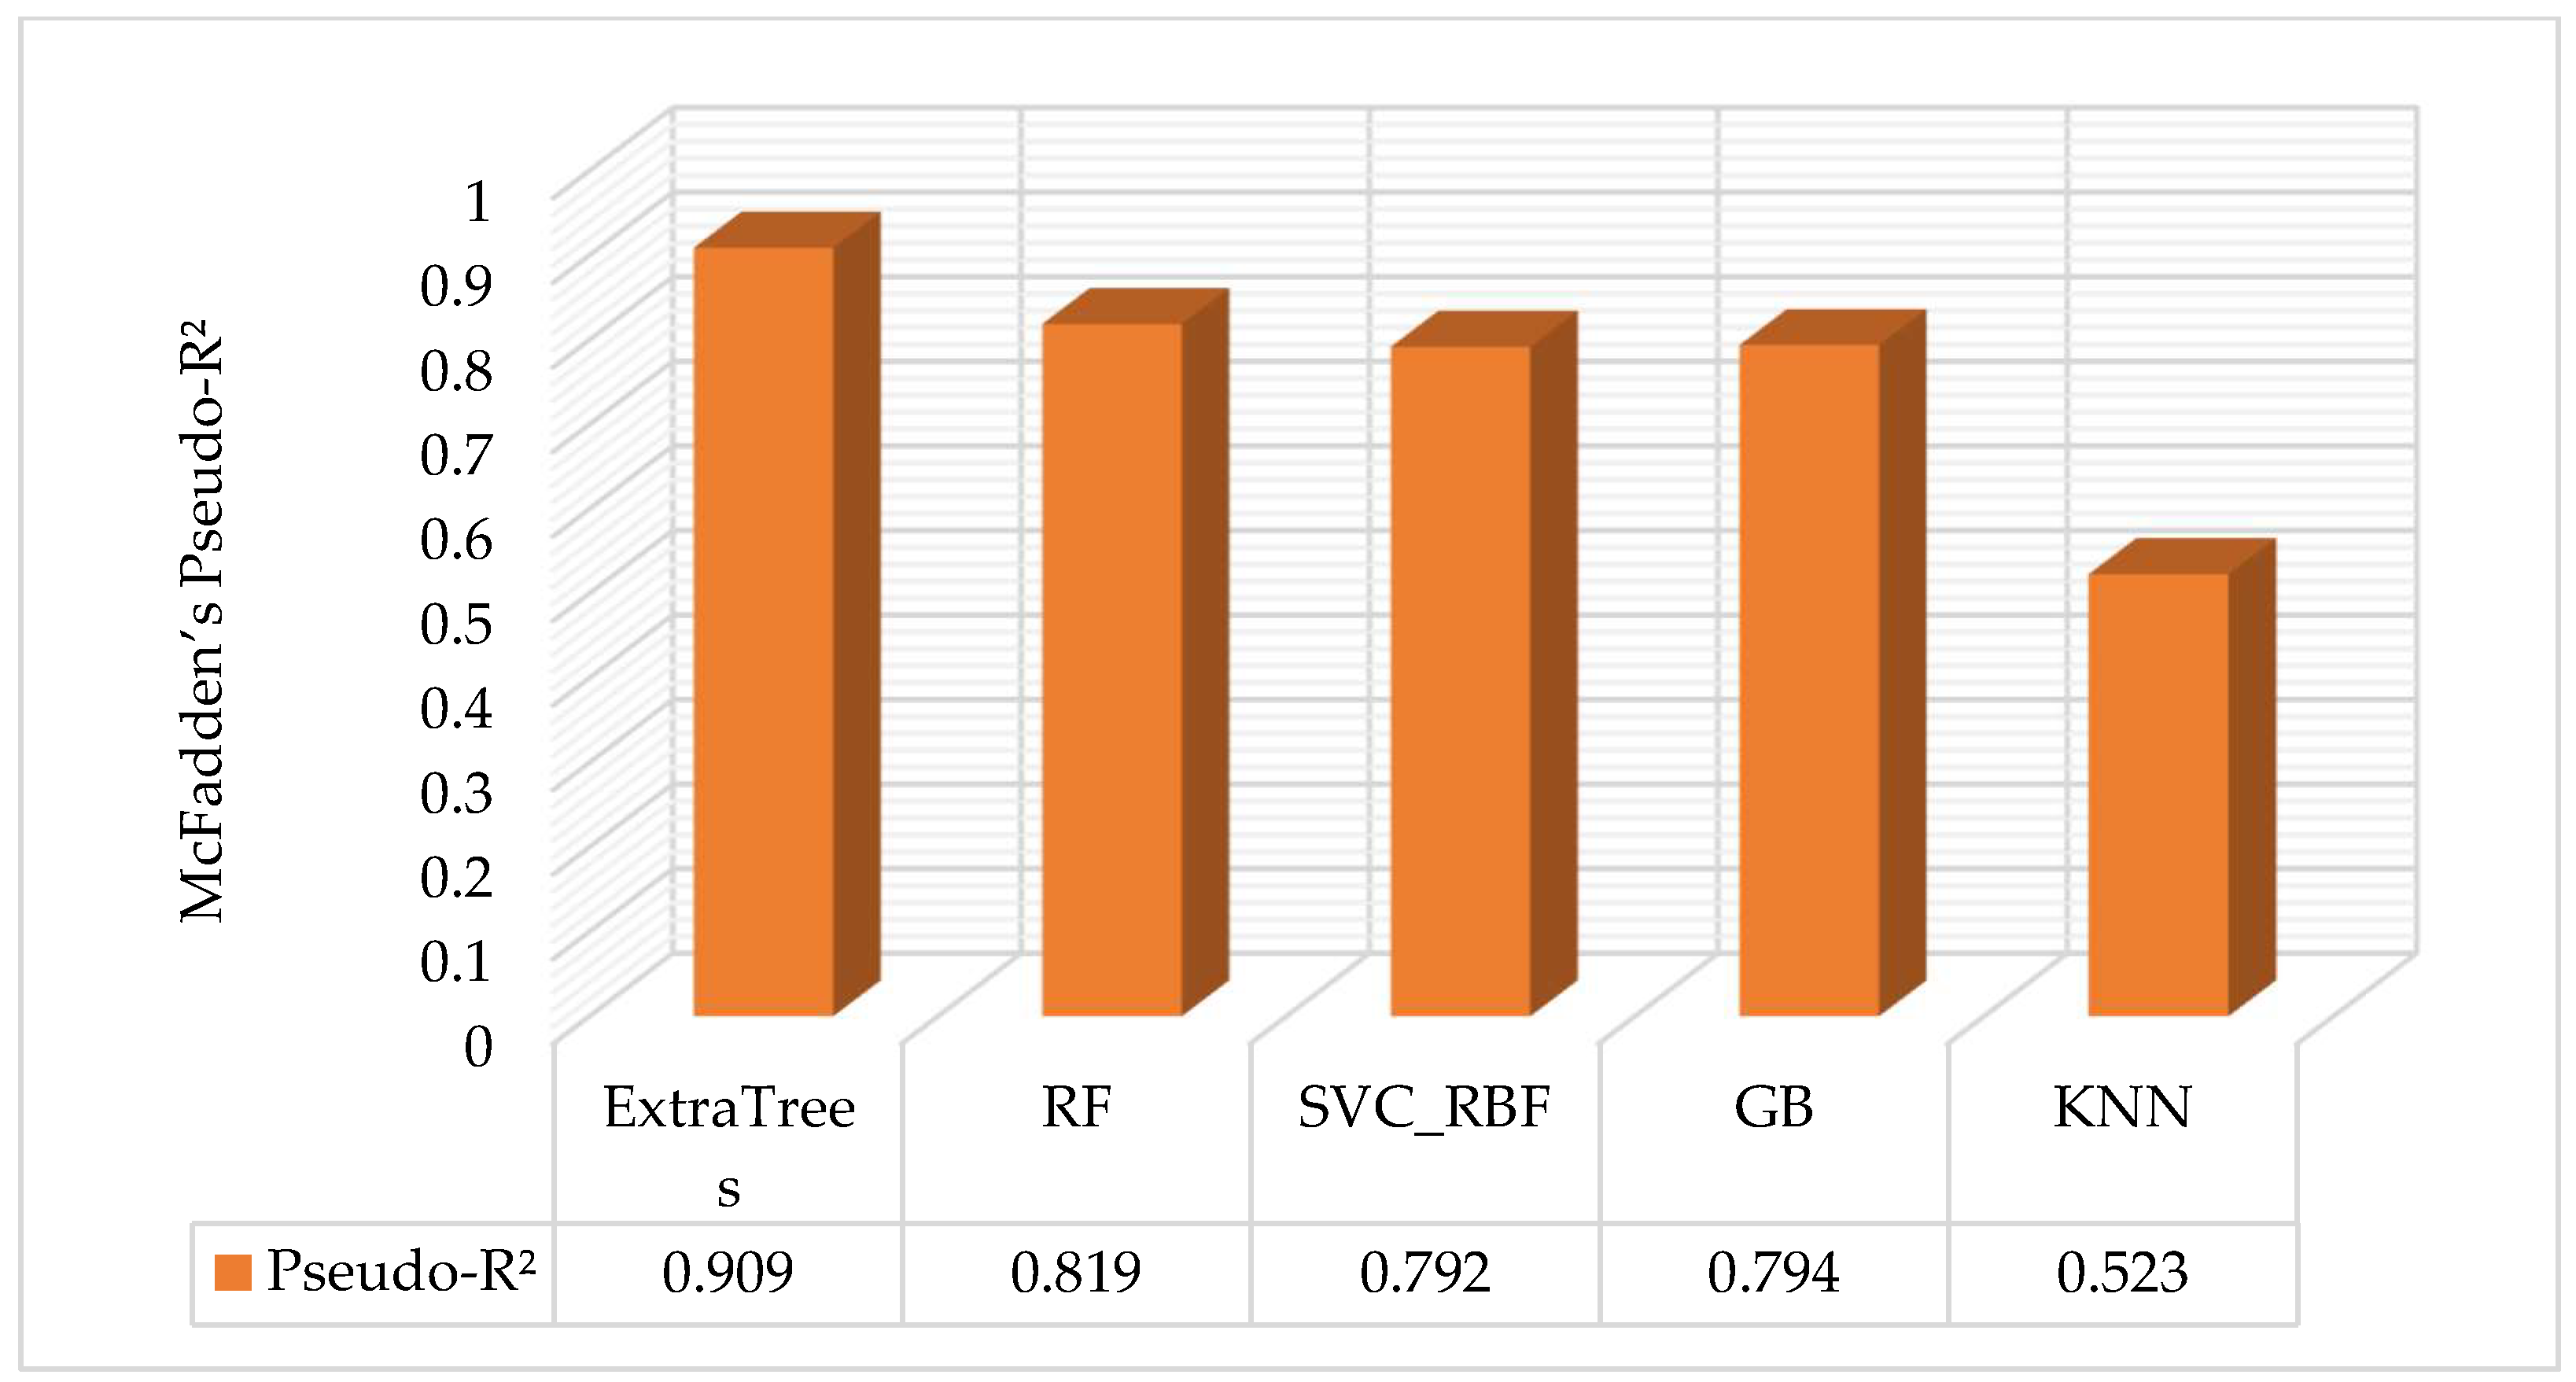
Figure 7 presents the McFadden’s Pseudo-R2 scores for each model in Scenario 1, illustrating the goodness of fit for the different classifiers. Notably, the Extra Trees classifier achieved the highest Pseudo-R2 score of 0.909, indicating superior model performance. This was followed by Gradient Boosting (0.819) and Random Forest (0.792), both of which demonstrated strong predictive capabilities. In contrast, the SVC and Knn showed comparatively lower scores of 0.794 and 0.523, respectively, suggesting a less effective fit for the data.
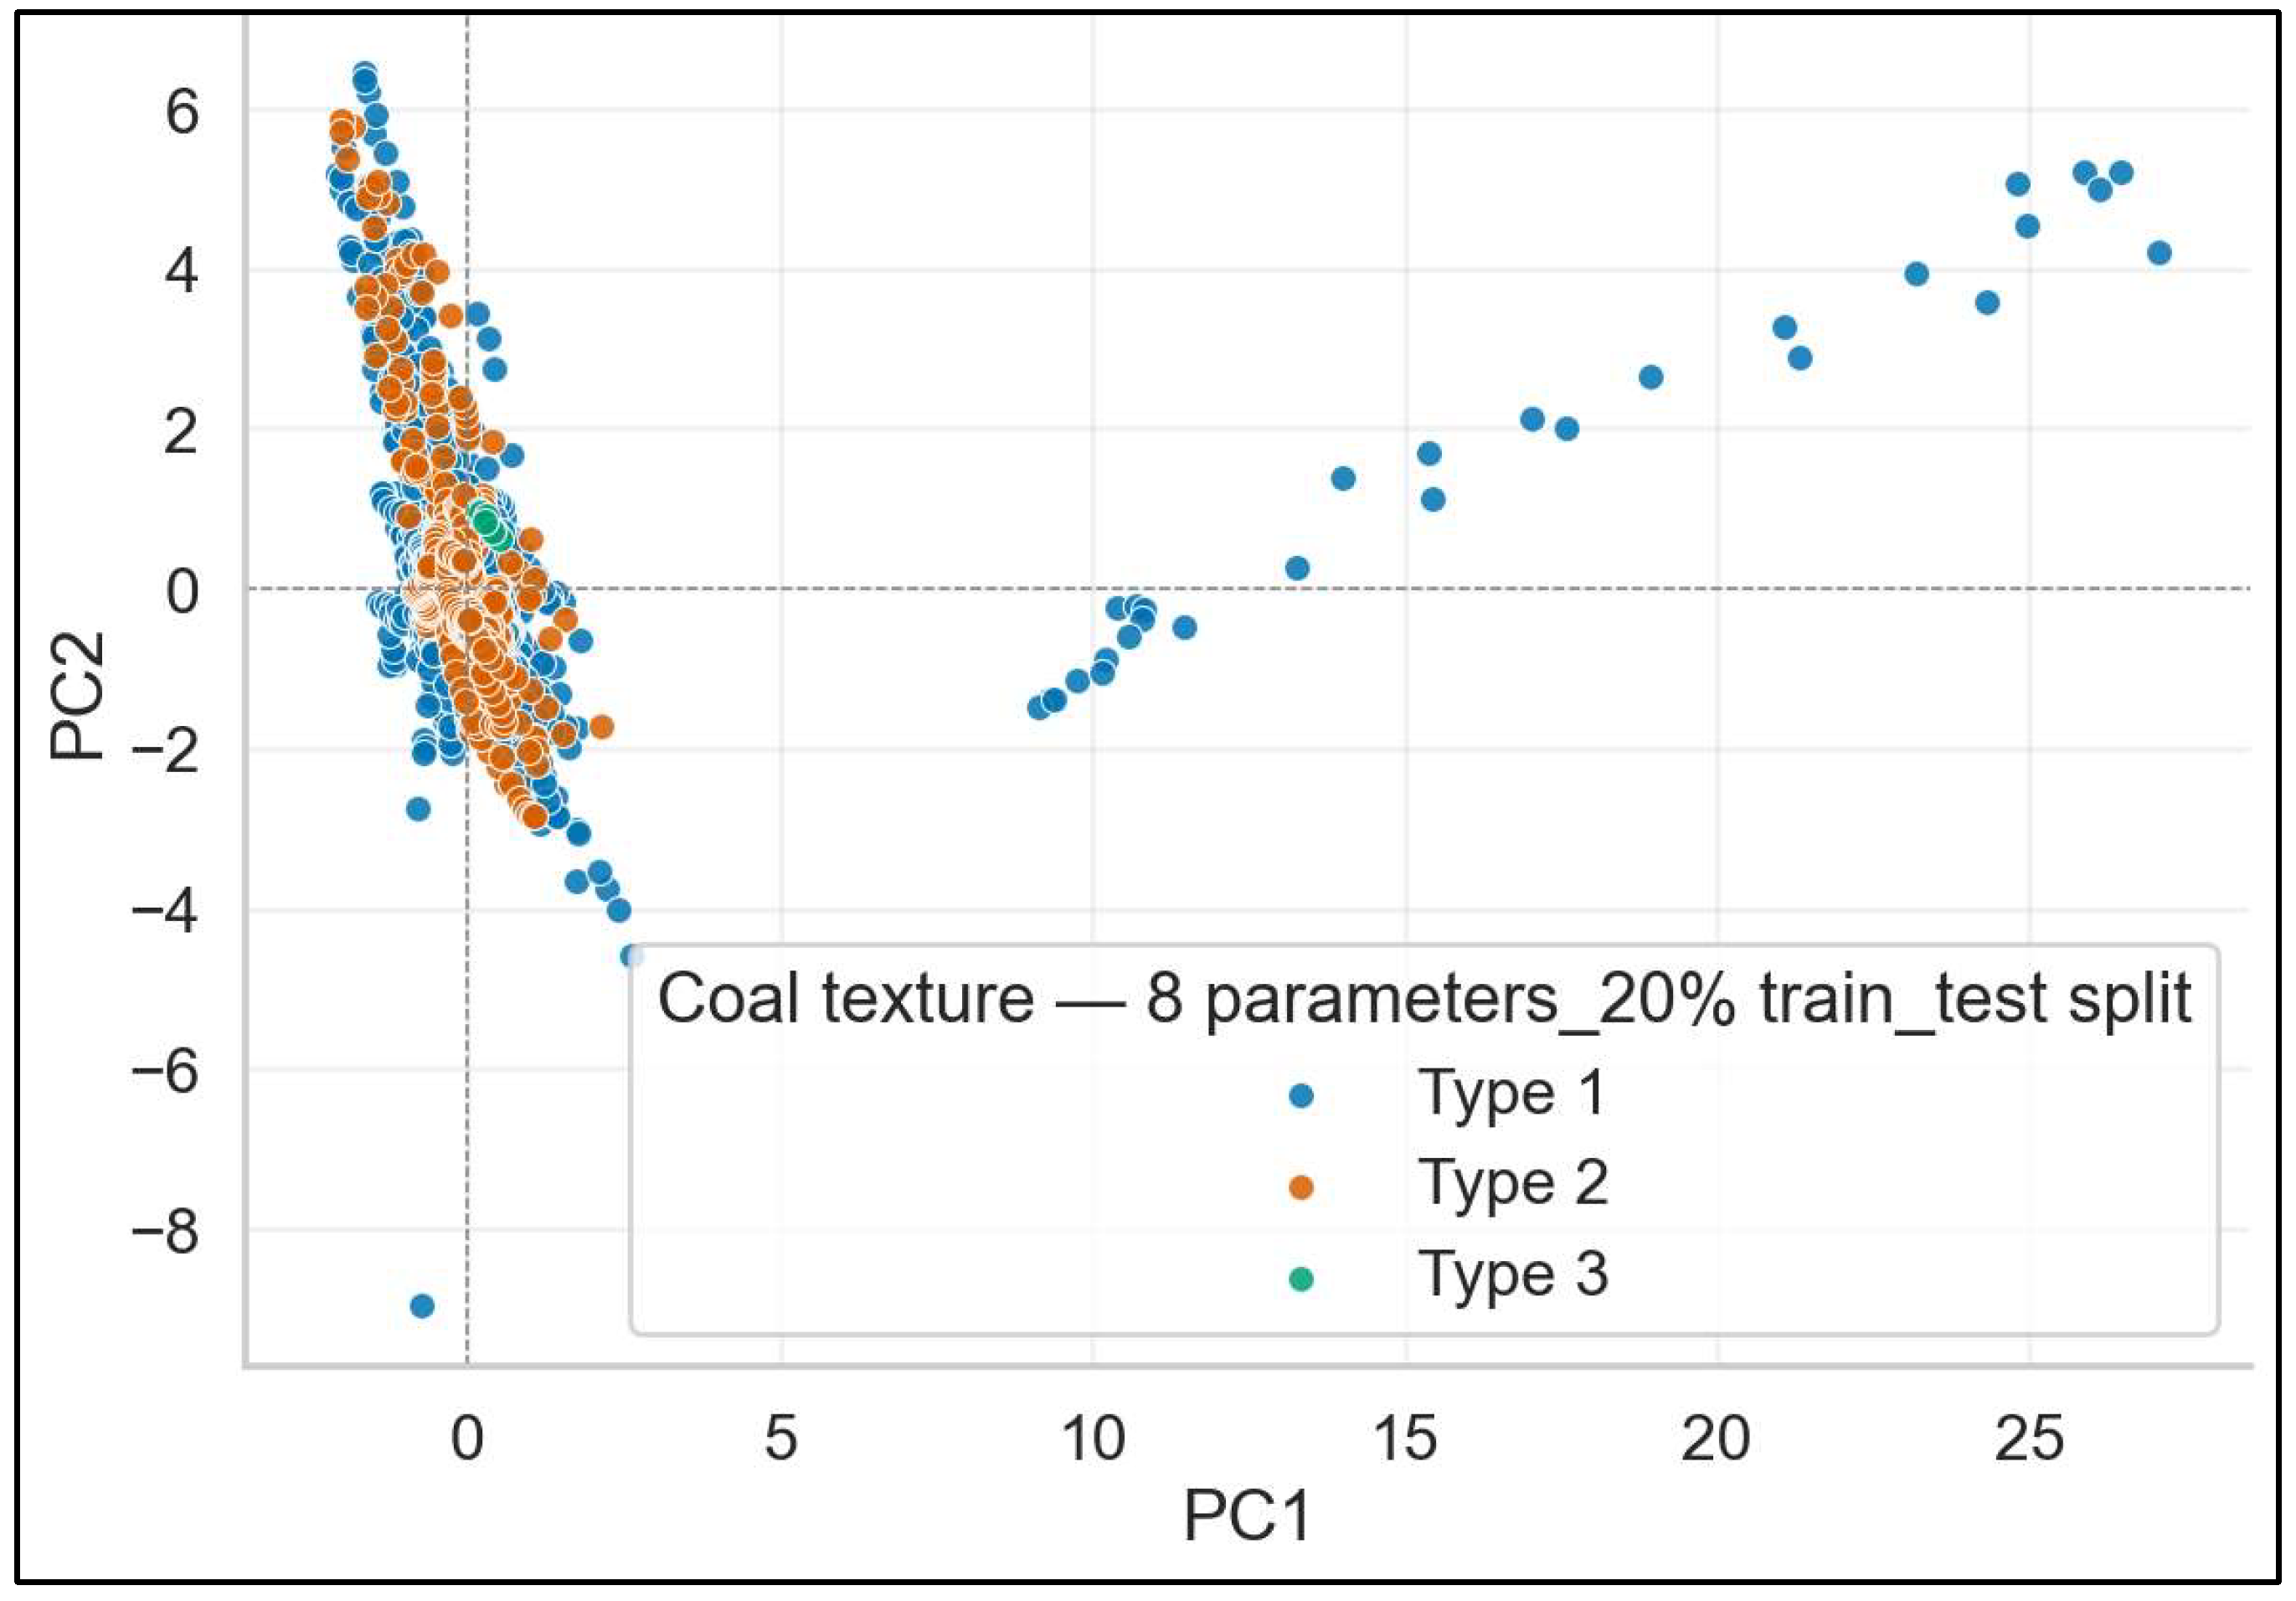
The PCA projection of coal texture types (Figure 8) further corroborates the relevance of the eight parameters. The separation of coal texture types along the first two principal components (PC1 and PC2) is clearly visible, with Type 1 (blue) and Type 2 (orange) exhibiting a distinct separation. In contrast, Type 3 (green) shows more dispersion, indicating overlap and variability in the data. This supports the effectiveness of the selected parameters in differentiating between these texture types.
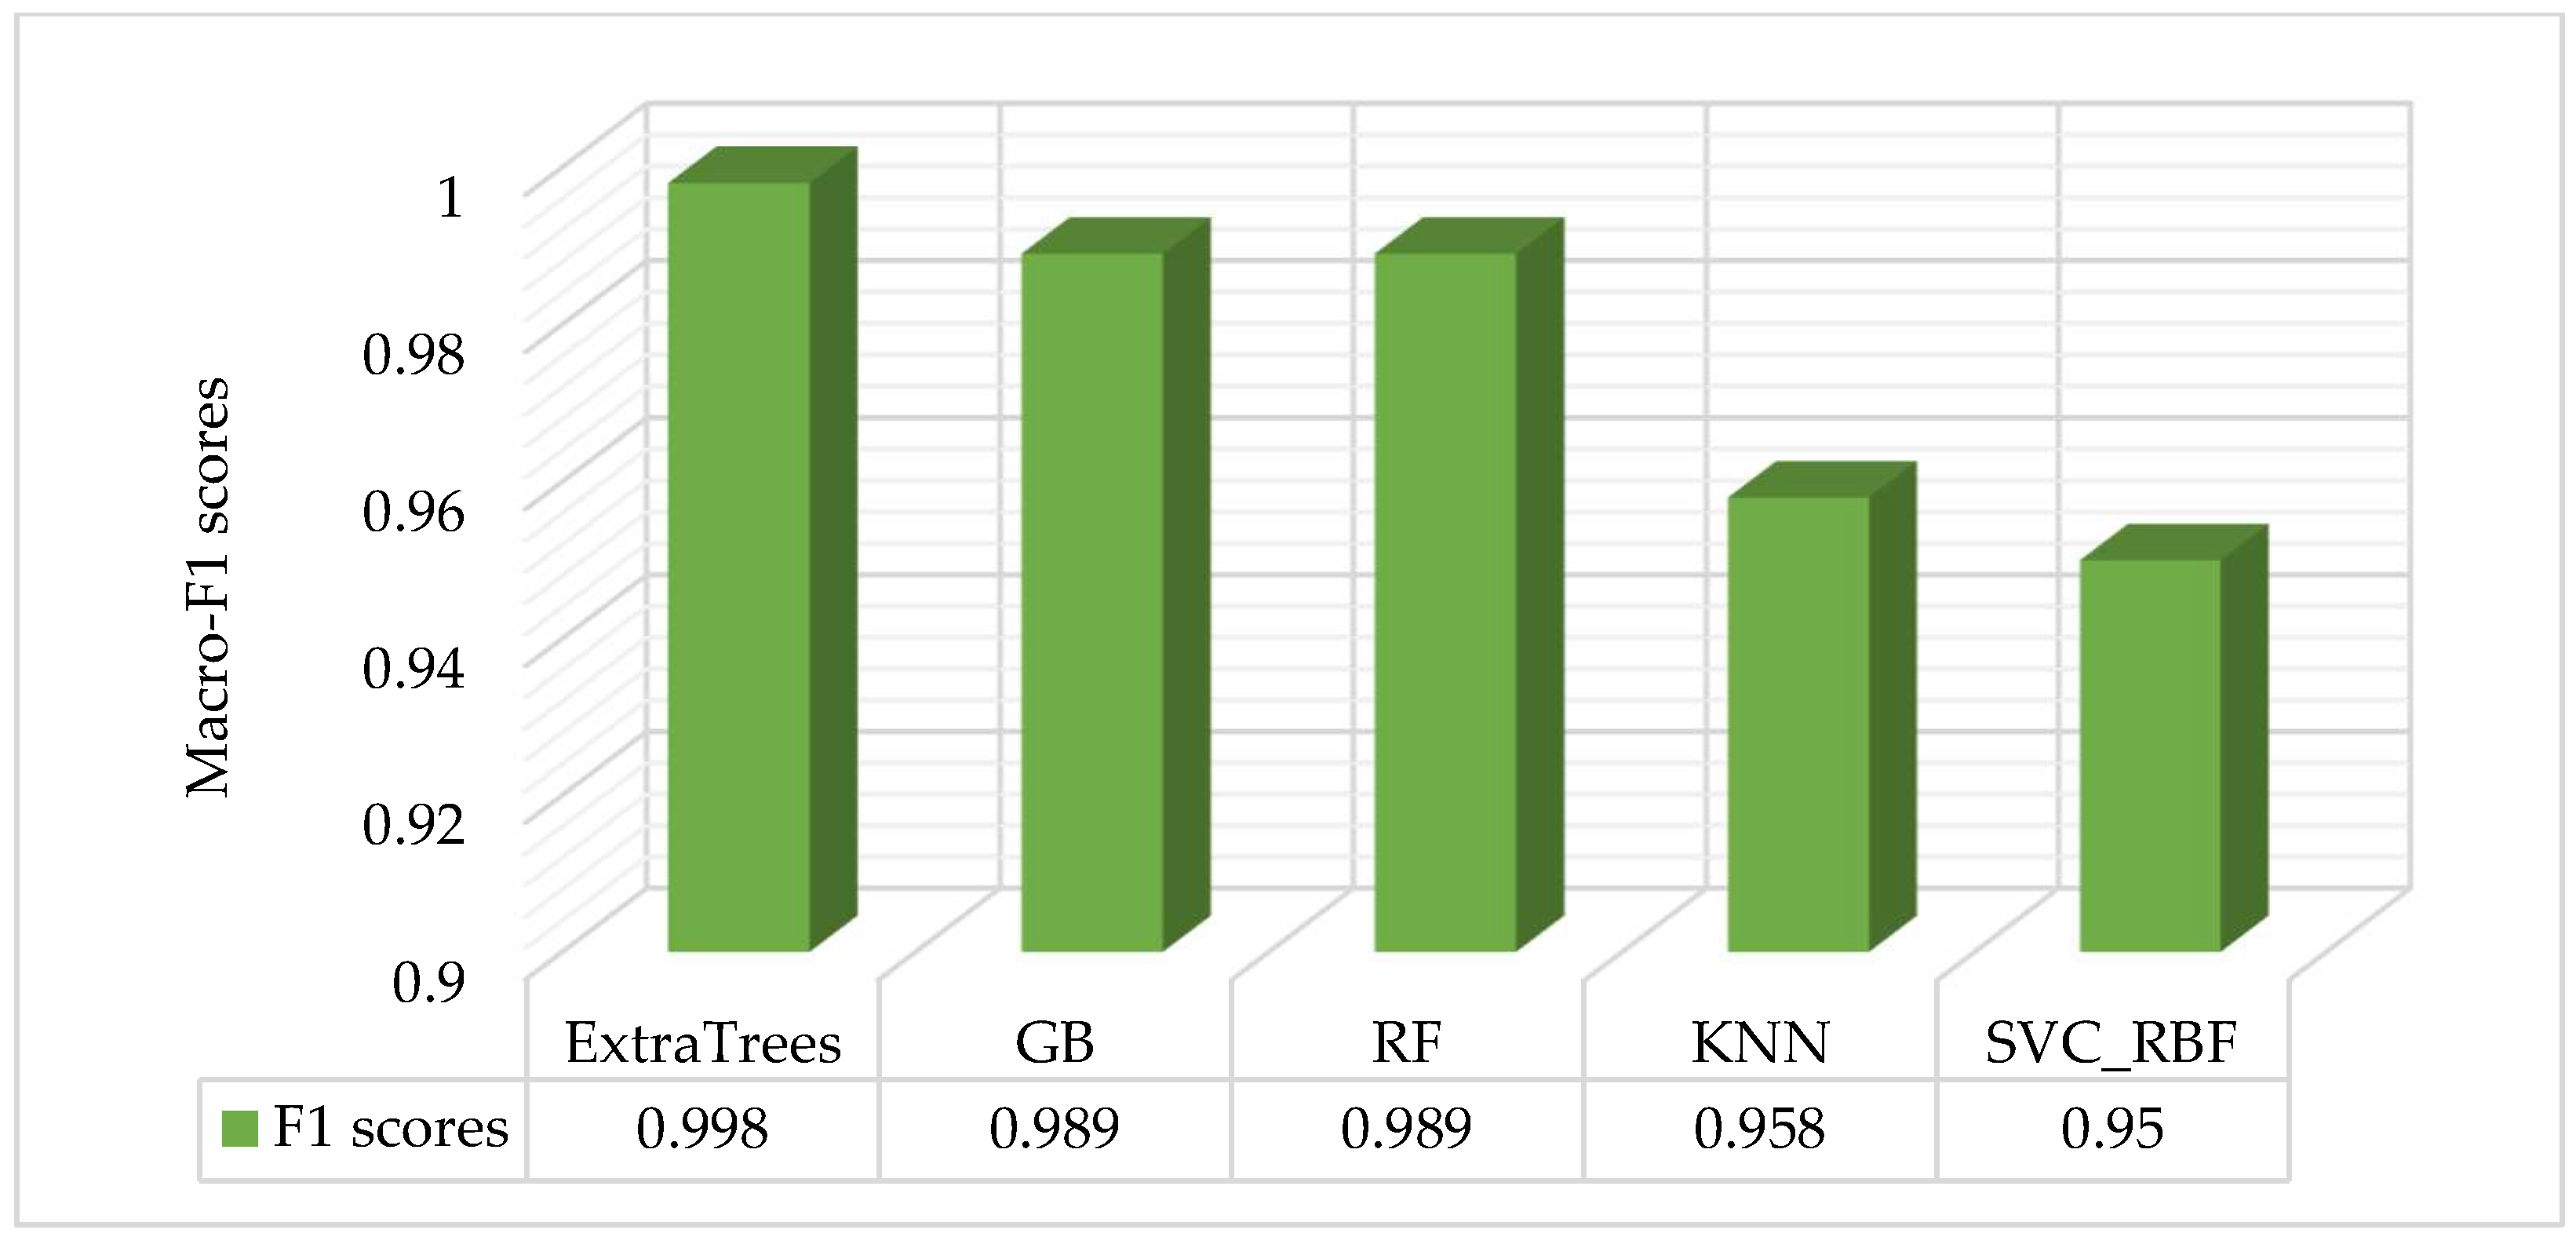
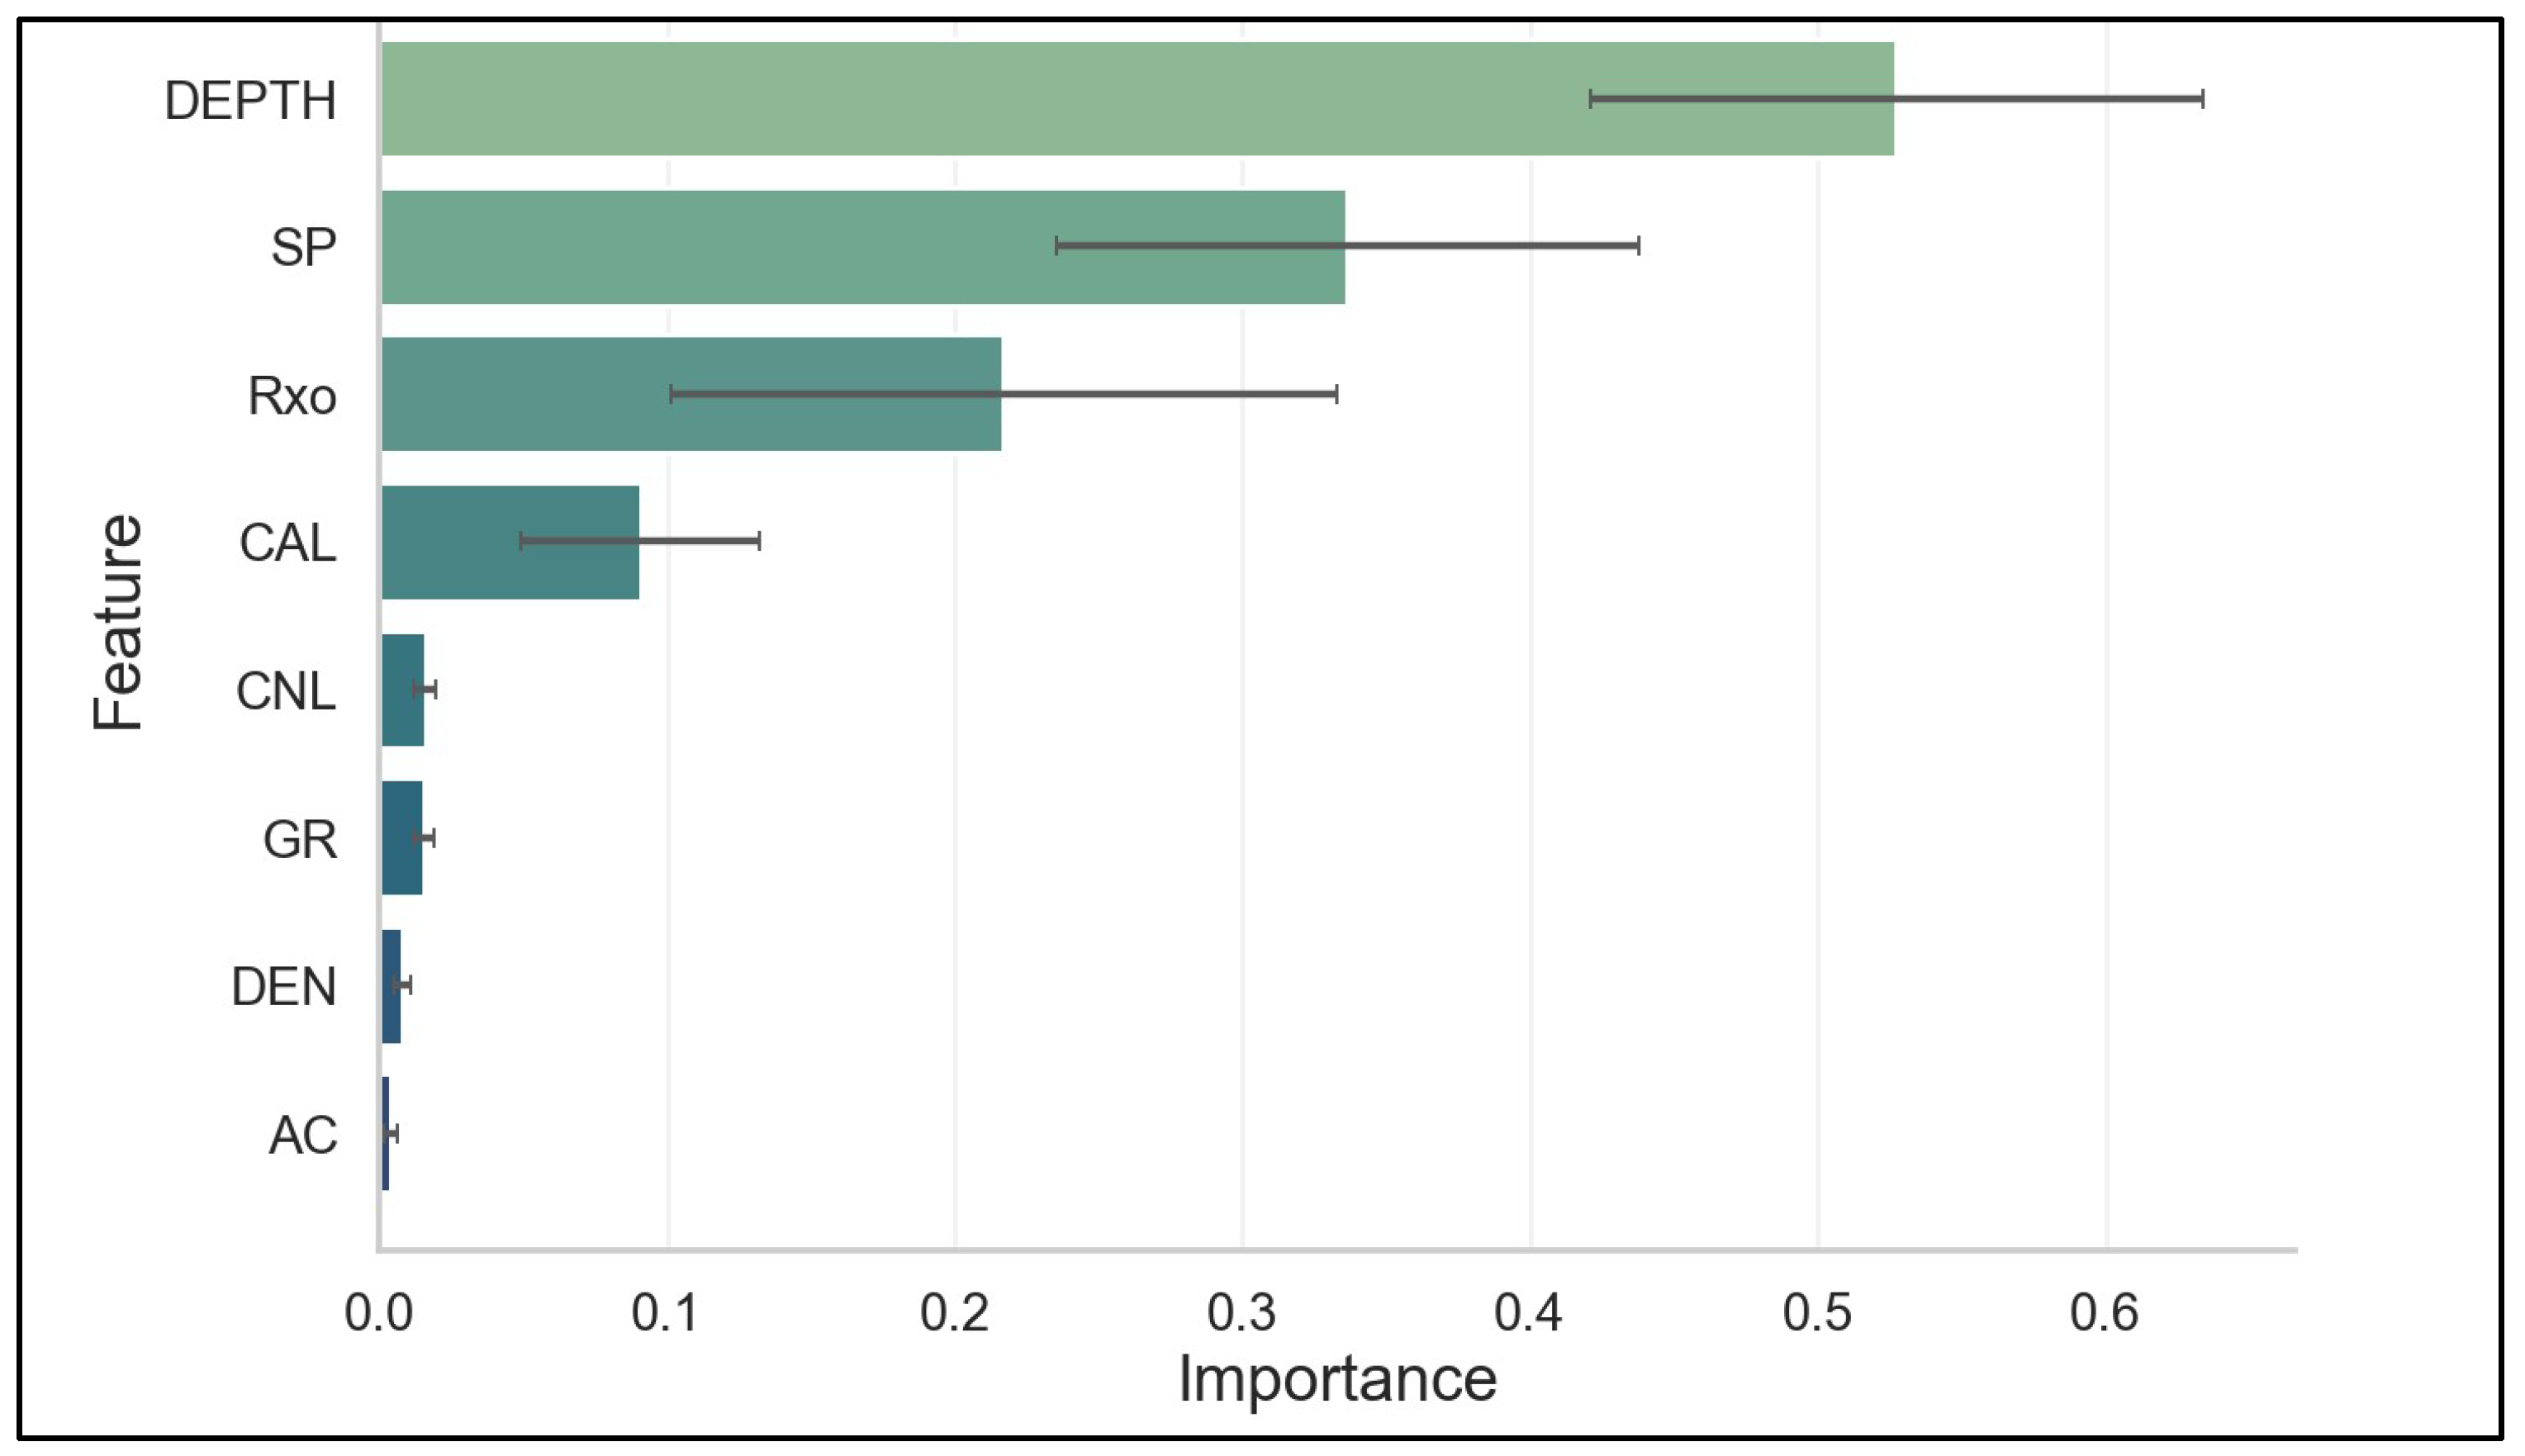
Figure 9 compares the Macro F1 Scores for each model, with Extra Trees again outpacing the other classifiers, achieving an exemplary score of 0.998. Both Random Forest and Gradient Boosting followed closely, each achieving a score of 0.989. SVC and kNN, although still showing reasonable performance, had lower scores of 0.958 and 0.950, respectively. This further reinforces the superior performance of ensemble-based models in coal texture prediction. Figure 10 illustrates the permutation feature importance for the eight parameters. It reveals that DEPTH is the most influential feature, followed by SP and Rxo, which were identified as crucial for distinguishing coal texture types. Although CAL and CNL showed lower importance, they still contributed to the overall prediction.
The results from Scenario 1, which utilized all eight parameters, demonstrate that the Extra Trees classifier outperformed the other models in both McFadden’s Pseudo-R2 and Macro F1 Score. These findings highlight the ability of the Extra Trees model to capture the complex relationships within the data. The PCA projection (Figure 8) further substantiates this, showing that the selected features effectively separate coal textures, particularly Types 1 and 2.
Feature importance analysis (Figure 10) reinforces the critical role of DEPTH, SP, and Rxo in coal texture prediction. These findings are consistent with geological expectations, where DEPTH correlates with stratigraphy and structure, SP reflects electrochemical properties, and Rxo is related to resistivity changes associated with cleat development and porosity. Although SVC and kNN also demonstrated reasonable performance, their lower metrics suggest they are less suited for this task compared to ensemble models like Extra Trees and Random Forest. These tree-based models excel at handling complex, nonlinear interactions among features, making them well-suited for coal texture classification.

3.1.2. Scenario 2: Model Evaluation and Performance Using the 5 Most Influential Parameters

In this scenario, the feature set was reduced to the five most influential parameters identified in Scenario 1: DEPTH, Rxo, CAL, SP, and AC. The parameters DEN, GR, and CNL were excluded due to their relatively lower feature importance, as evidenced by both Random Forest feature importance and permutation feature importance analyses. The objective of this reduction was to assess whether a more compact feature set would affect model performance, particularly in terms of accuracy and interpretability.
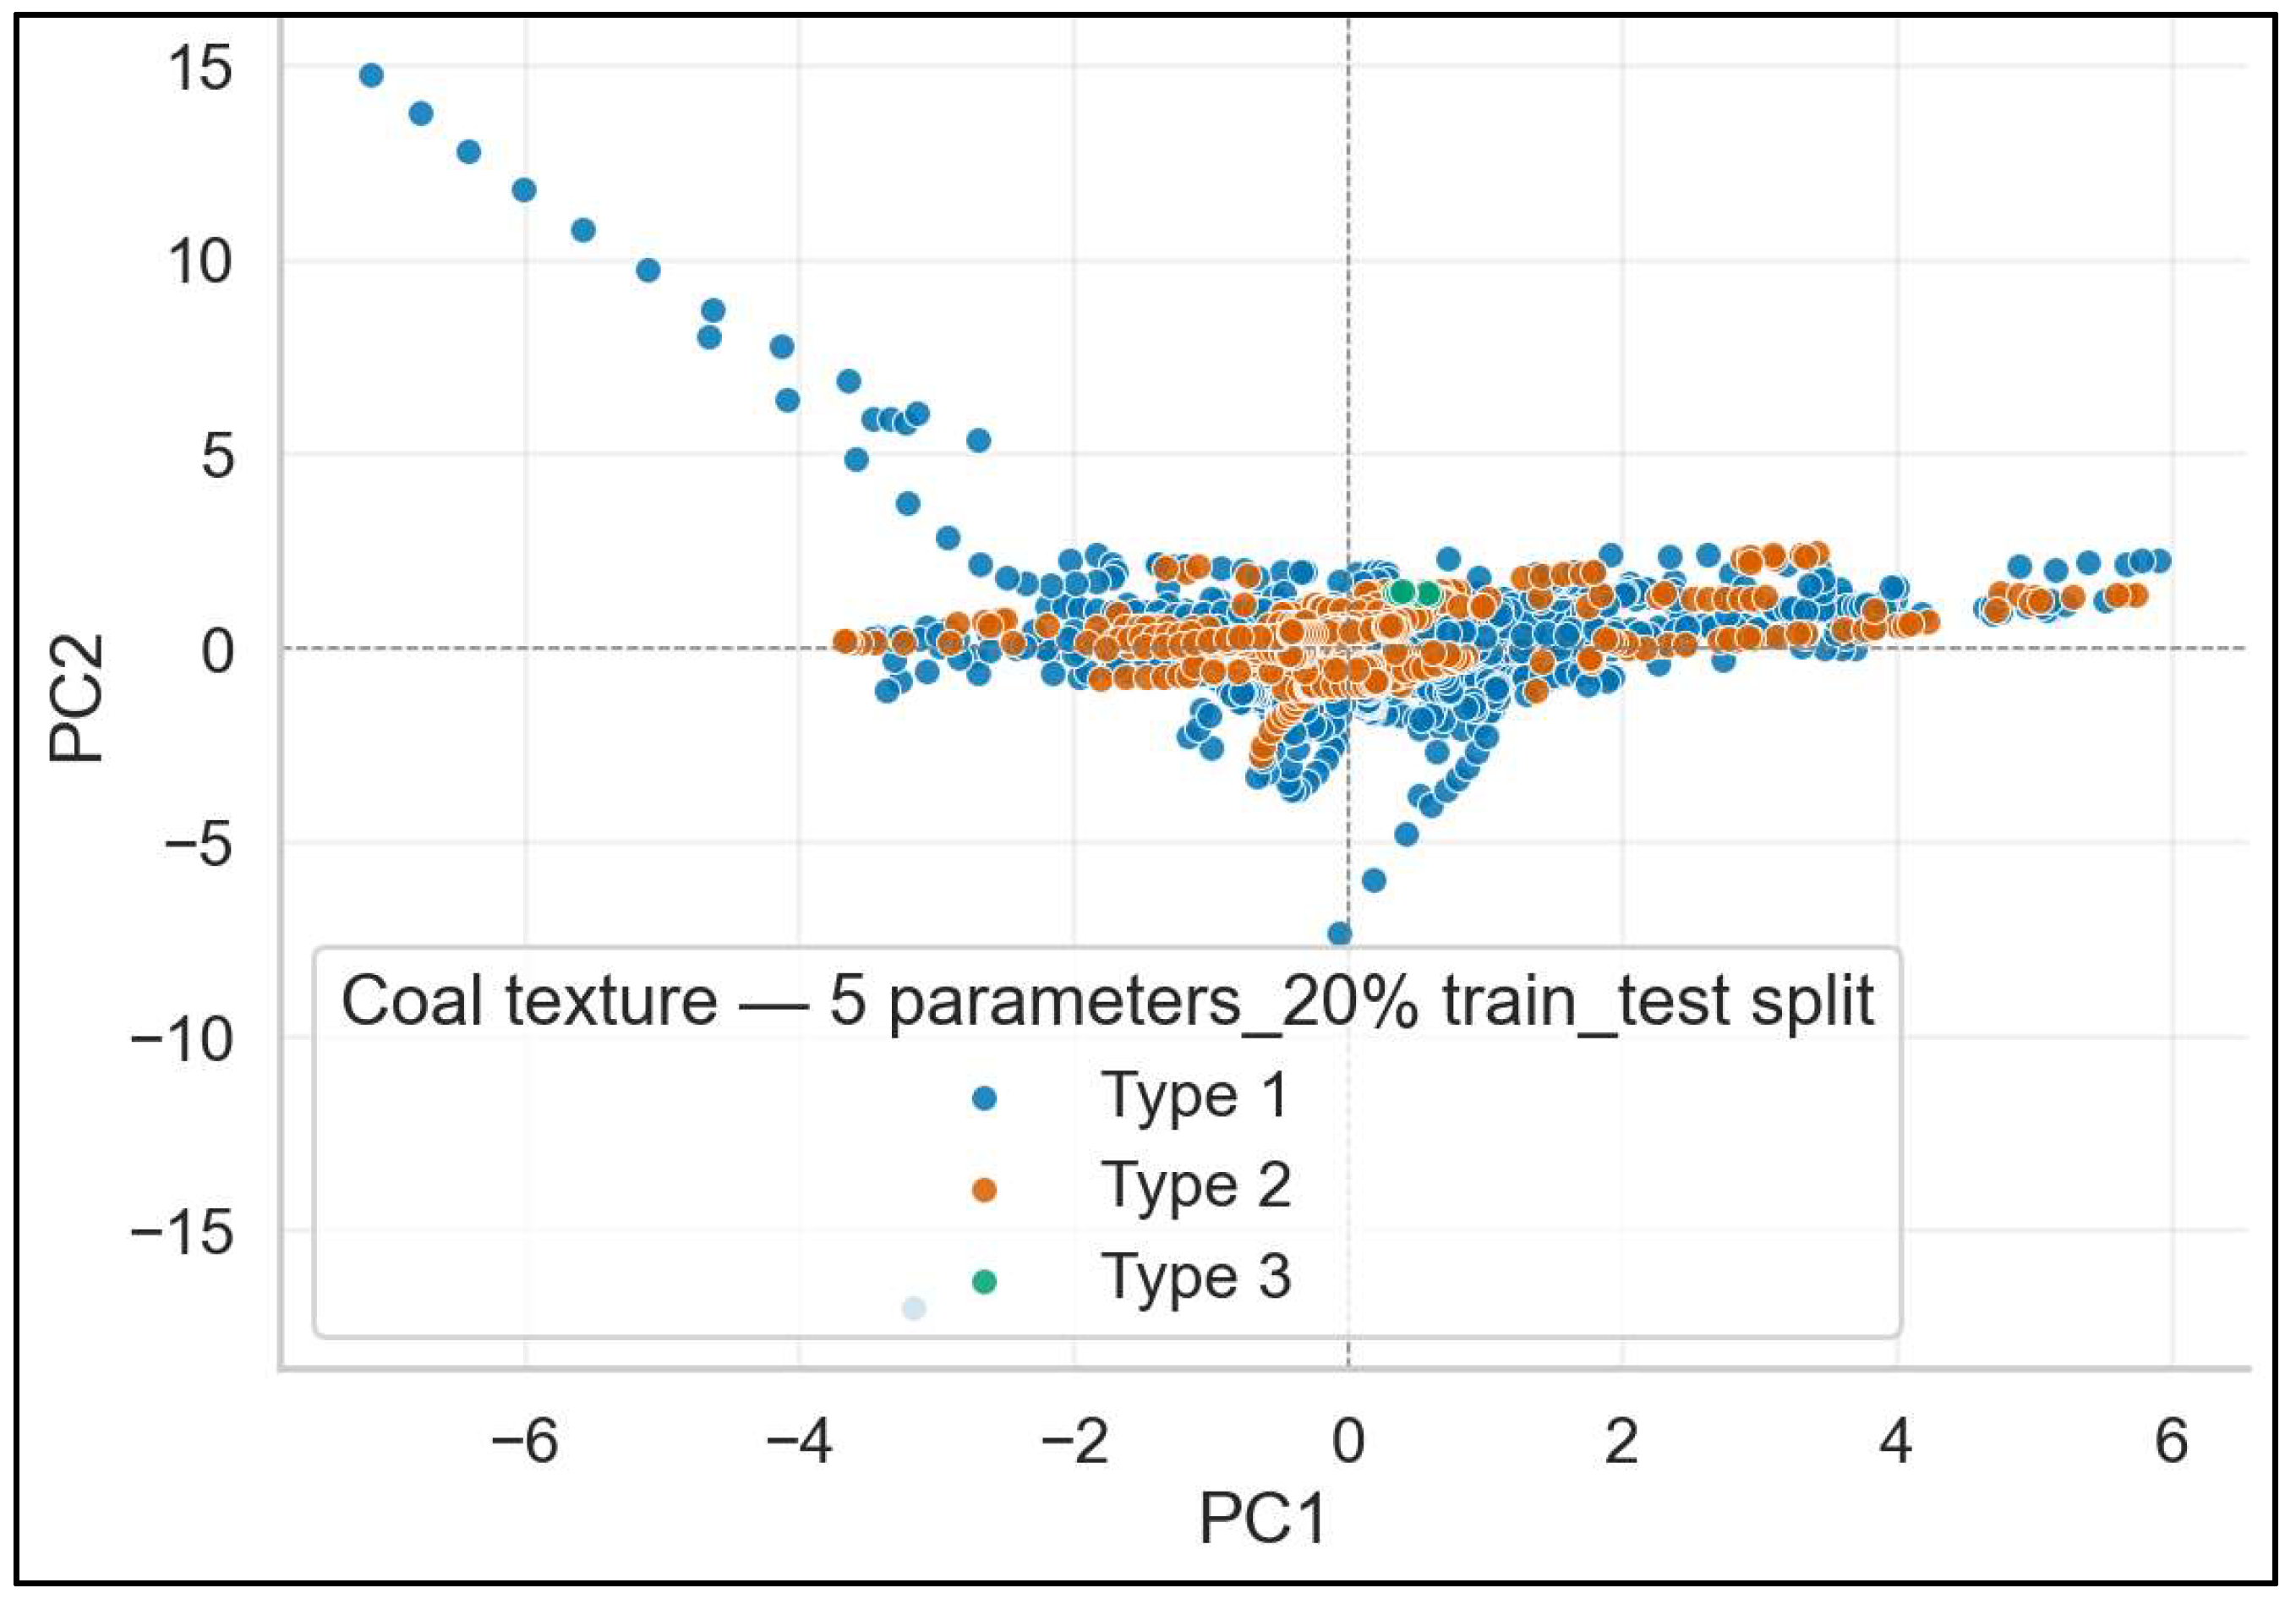
Figure 11 presents the PCA projection of coal texture types (Type 1, Type 2, and Type 3) based on the five most influential parameters. The results show that the separation between Type 1 (blue) and Type 2 (orange) remains evident, although the spread of Type 3 (green) is more dispersed compared to Scenario 1. This increased dispersion suggests that reducing the number of features has somewhat diminished the clarity of the segregation between coal textures, particularly for Type 3.
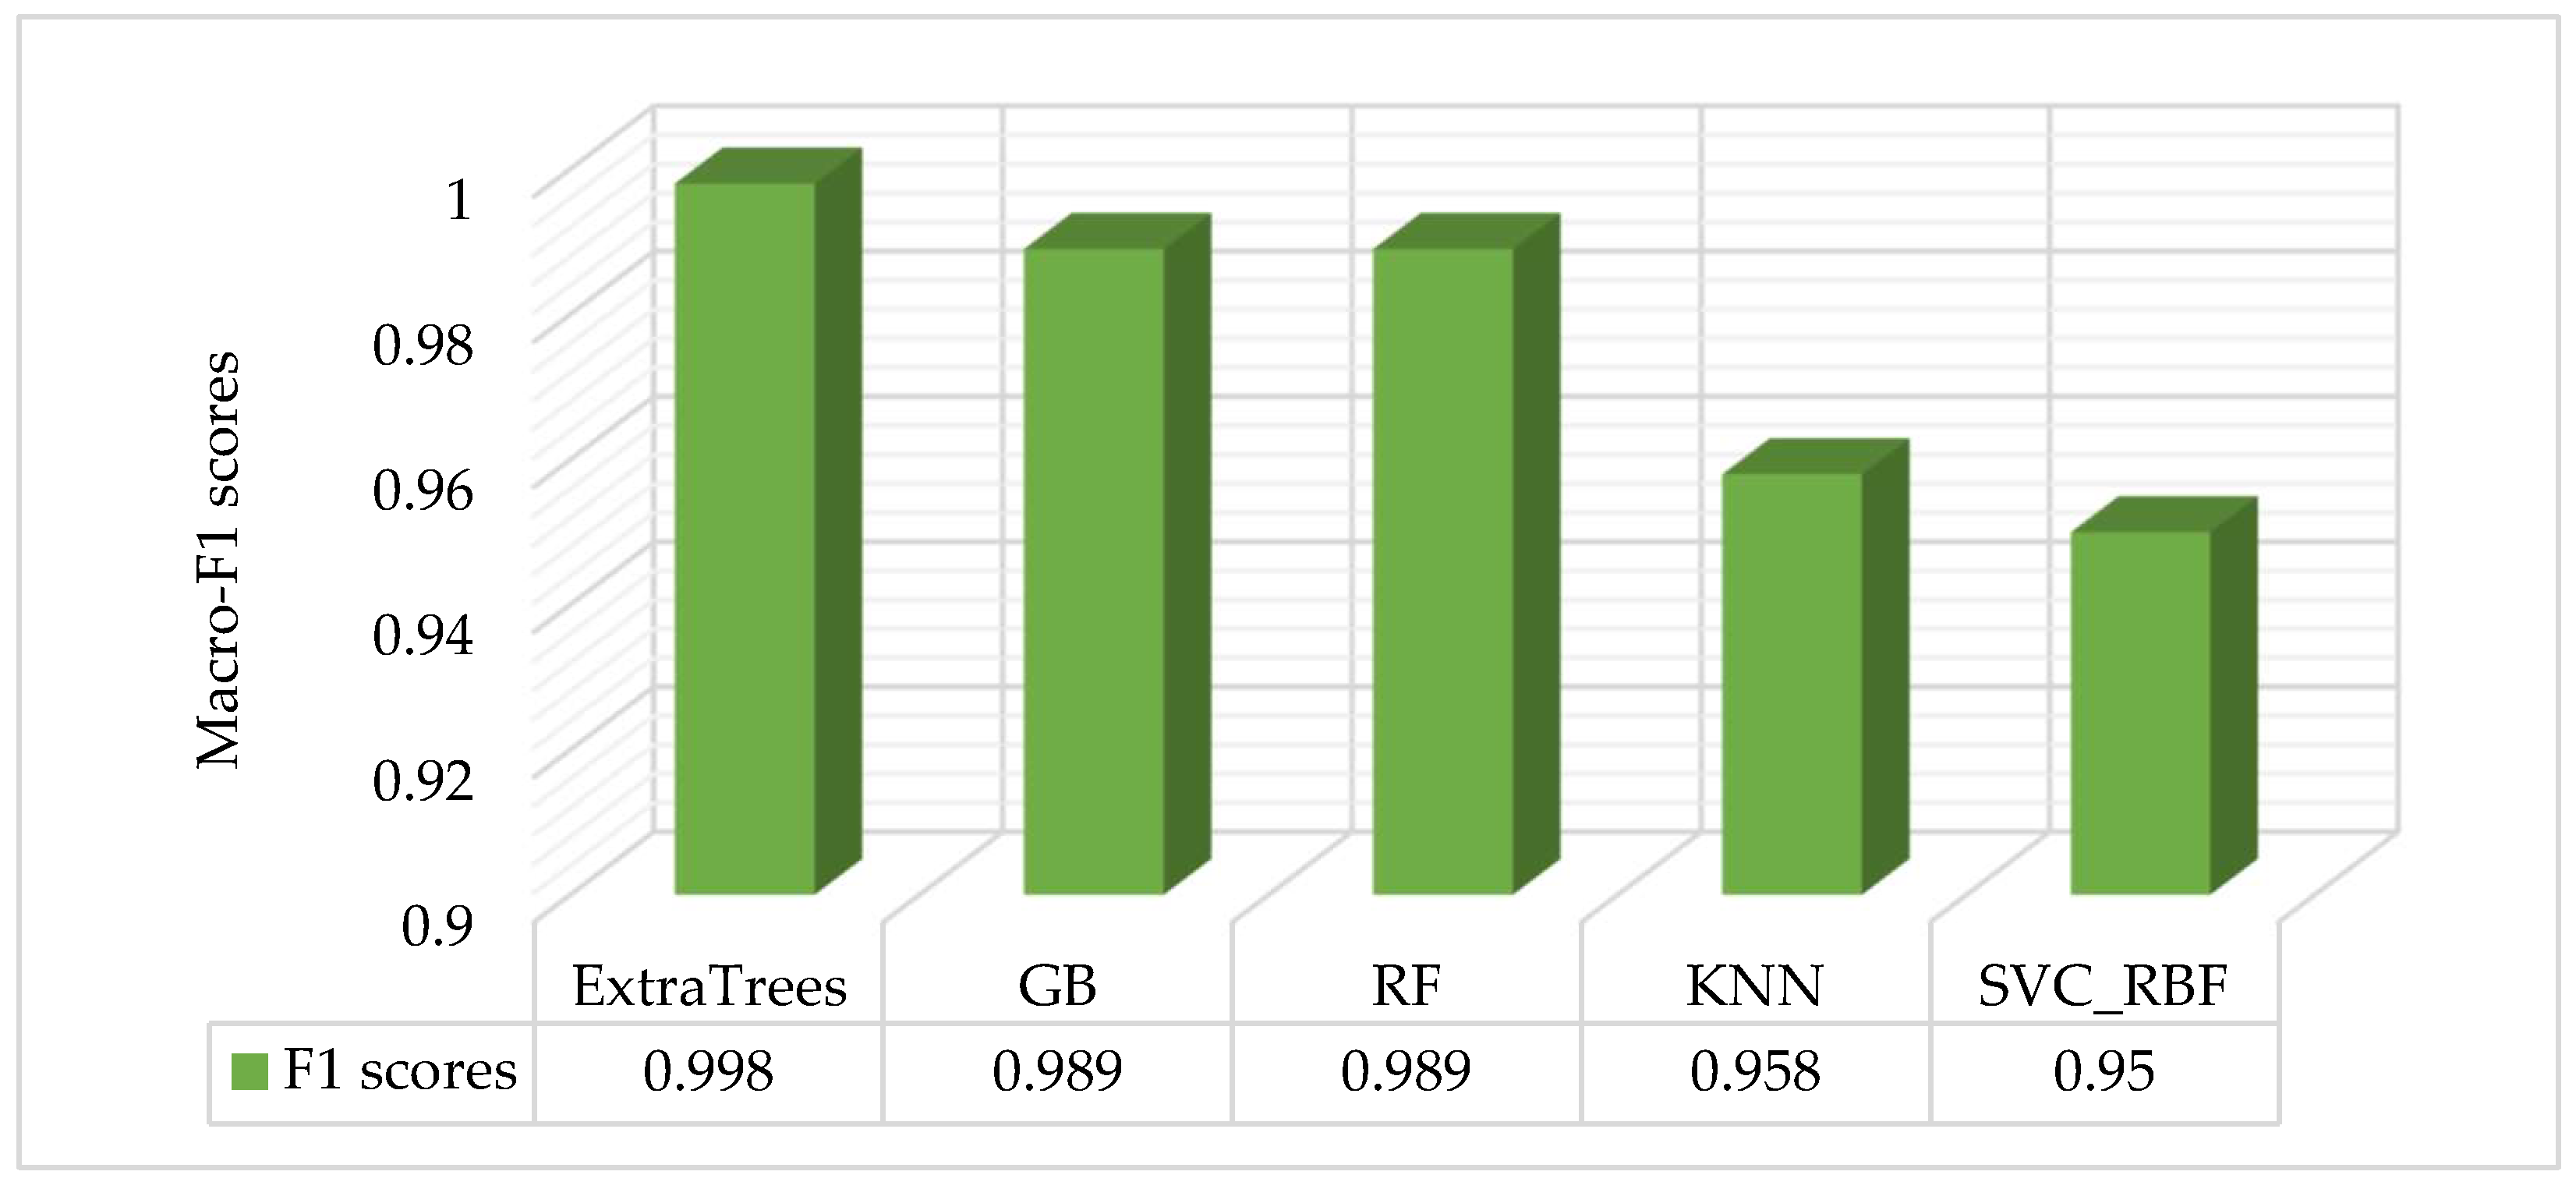
Figure 12 compares the Macro F1 Scores for each classifier in Scenario 2, indicating that the Extra Trees model continues to perform exceptionally well with a score of 0.998. Both Random Forest and Gradient Boosting also yield strong results, with scores of 0.989. SVC and kNN, although showing slightly lower scores of 0.958 and 0.950, respectively, still demonstrate competitive performance. When compared to Scenario 1, the reduction in the number of features did not significantly degrade model performance, suggesting that the selected five parameters are sufficient for robust prediction.
The permutation feature importance plot in Figure 13 highlights the relative importance of each parameter in Scenario 2. DEPTH remains the most influential feature, followed by SP and Rxo, which are critical to the classification of coal textures. Although the importance of CAL and AC is slightly reduced in this scenario compared to Scenario 1, they continue to contribute valuable predictive information.
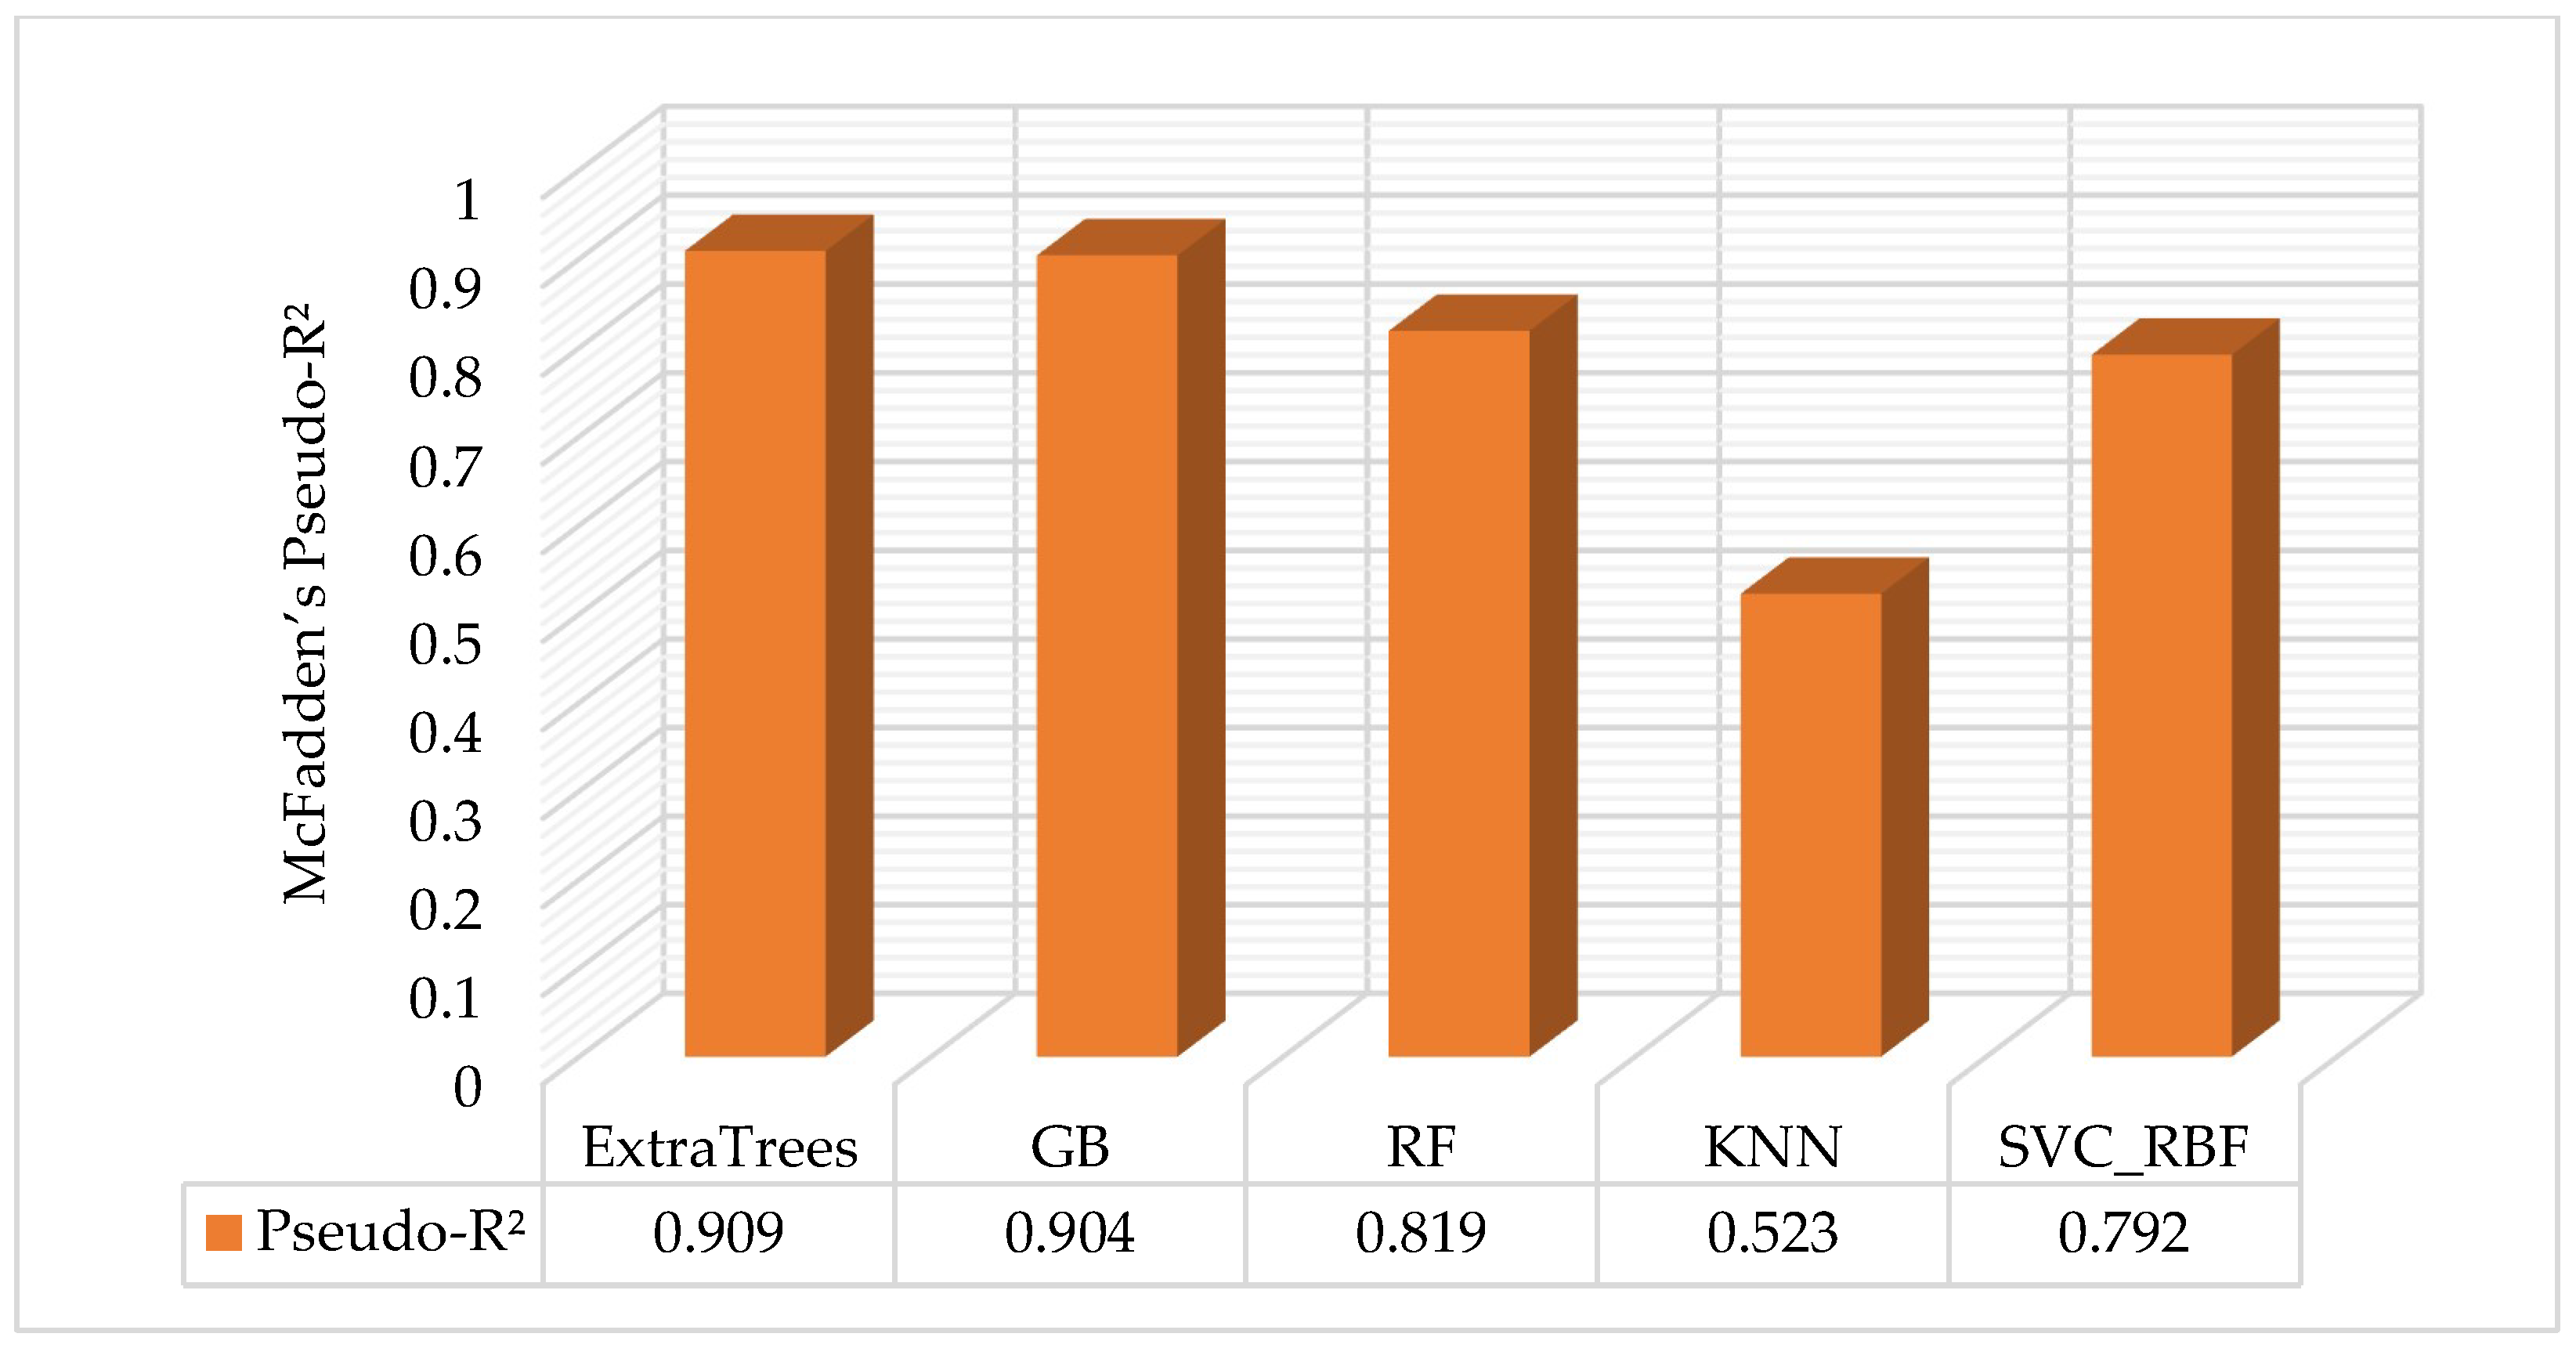
Finally, Figure 14 presents the McFadden’s Pseudo-R2 scores for different models in Scenario 2. Extra Trees again leads the performance with a score of 0.909, followed closely by Gradient Boosting (0.904) and Random Forest (0.819). The performance of SVC and kNN is somewhat lower in this scenario compared to Scenario 1 but remains competitive. These findings confirm that the removal of DEN, GR, and CNL did not significantly affect model fitting.
The results from Scenario 2, in which only the five most influential parameters were utilized, demonstrate that model performance remains largely consistent with Scenario 1, where all eight parameters were used. Extra Trees continues to be the top-performing model, achieving the highest scores for both Macro F1 Score and McFadden’s Pseudo-R2, followed by Gradient Boosting and Random Forest. The reduction in features did not significantly impact classification accuracy, suggesting that the selected parameters—DEPTH, Rxo, CAL, SP, and AC—are sufficient for distinguishing coal texture types effectively.
The PCA projection (Figure 11) shows that while the reduction in dimensionality led to some increased dispersion, the separation between Type 1 and Type 2 remains clear. This underscores the robustness of the chosen features. Additionally, the permutation feature importance plot (Figure 13) further confirms that DEPTH, SP, and Rxo are the dominant contributors to model performance, even when other features are excluded. From a geological perspective, DEPTH is strongly linked to stratigraphy, influencing coal seam characteristics such as porosity and permeability, which are crucial for gas migration and accumulation. The SP parameter reflects electrochemical contrasts in the coal, often associated with cleat formation and fracture intensity, which directly impact gas flow. Rxo represents the resistivity of the coal, which is influenced by porosity and water saturation, key factors in assessing the coal’s permeability and gas content. These findings support the significant role of these geological factors in determining coal texture and their relevance for effective CBM reservoir characterization.
These findings suggest that the five most influential parameters provide a compact, efficient, and interpretable feature set, with minimal trade-off in model performance. This not only enhances interpretability but also improves the computational efficiency of the models, making them more suitable for practical applications where model simplicity and speed are crucial3.2. Performance Evaluation for Different Test Sizes
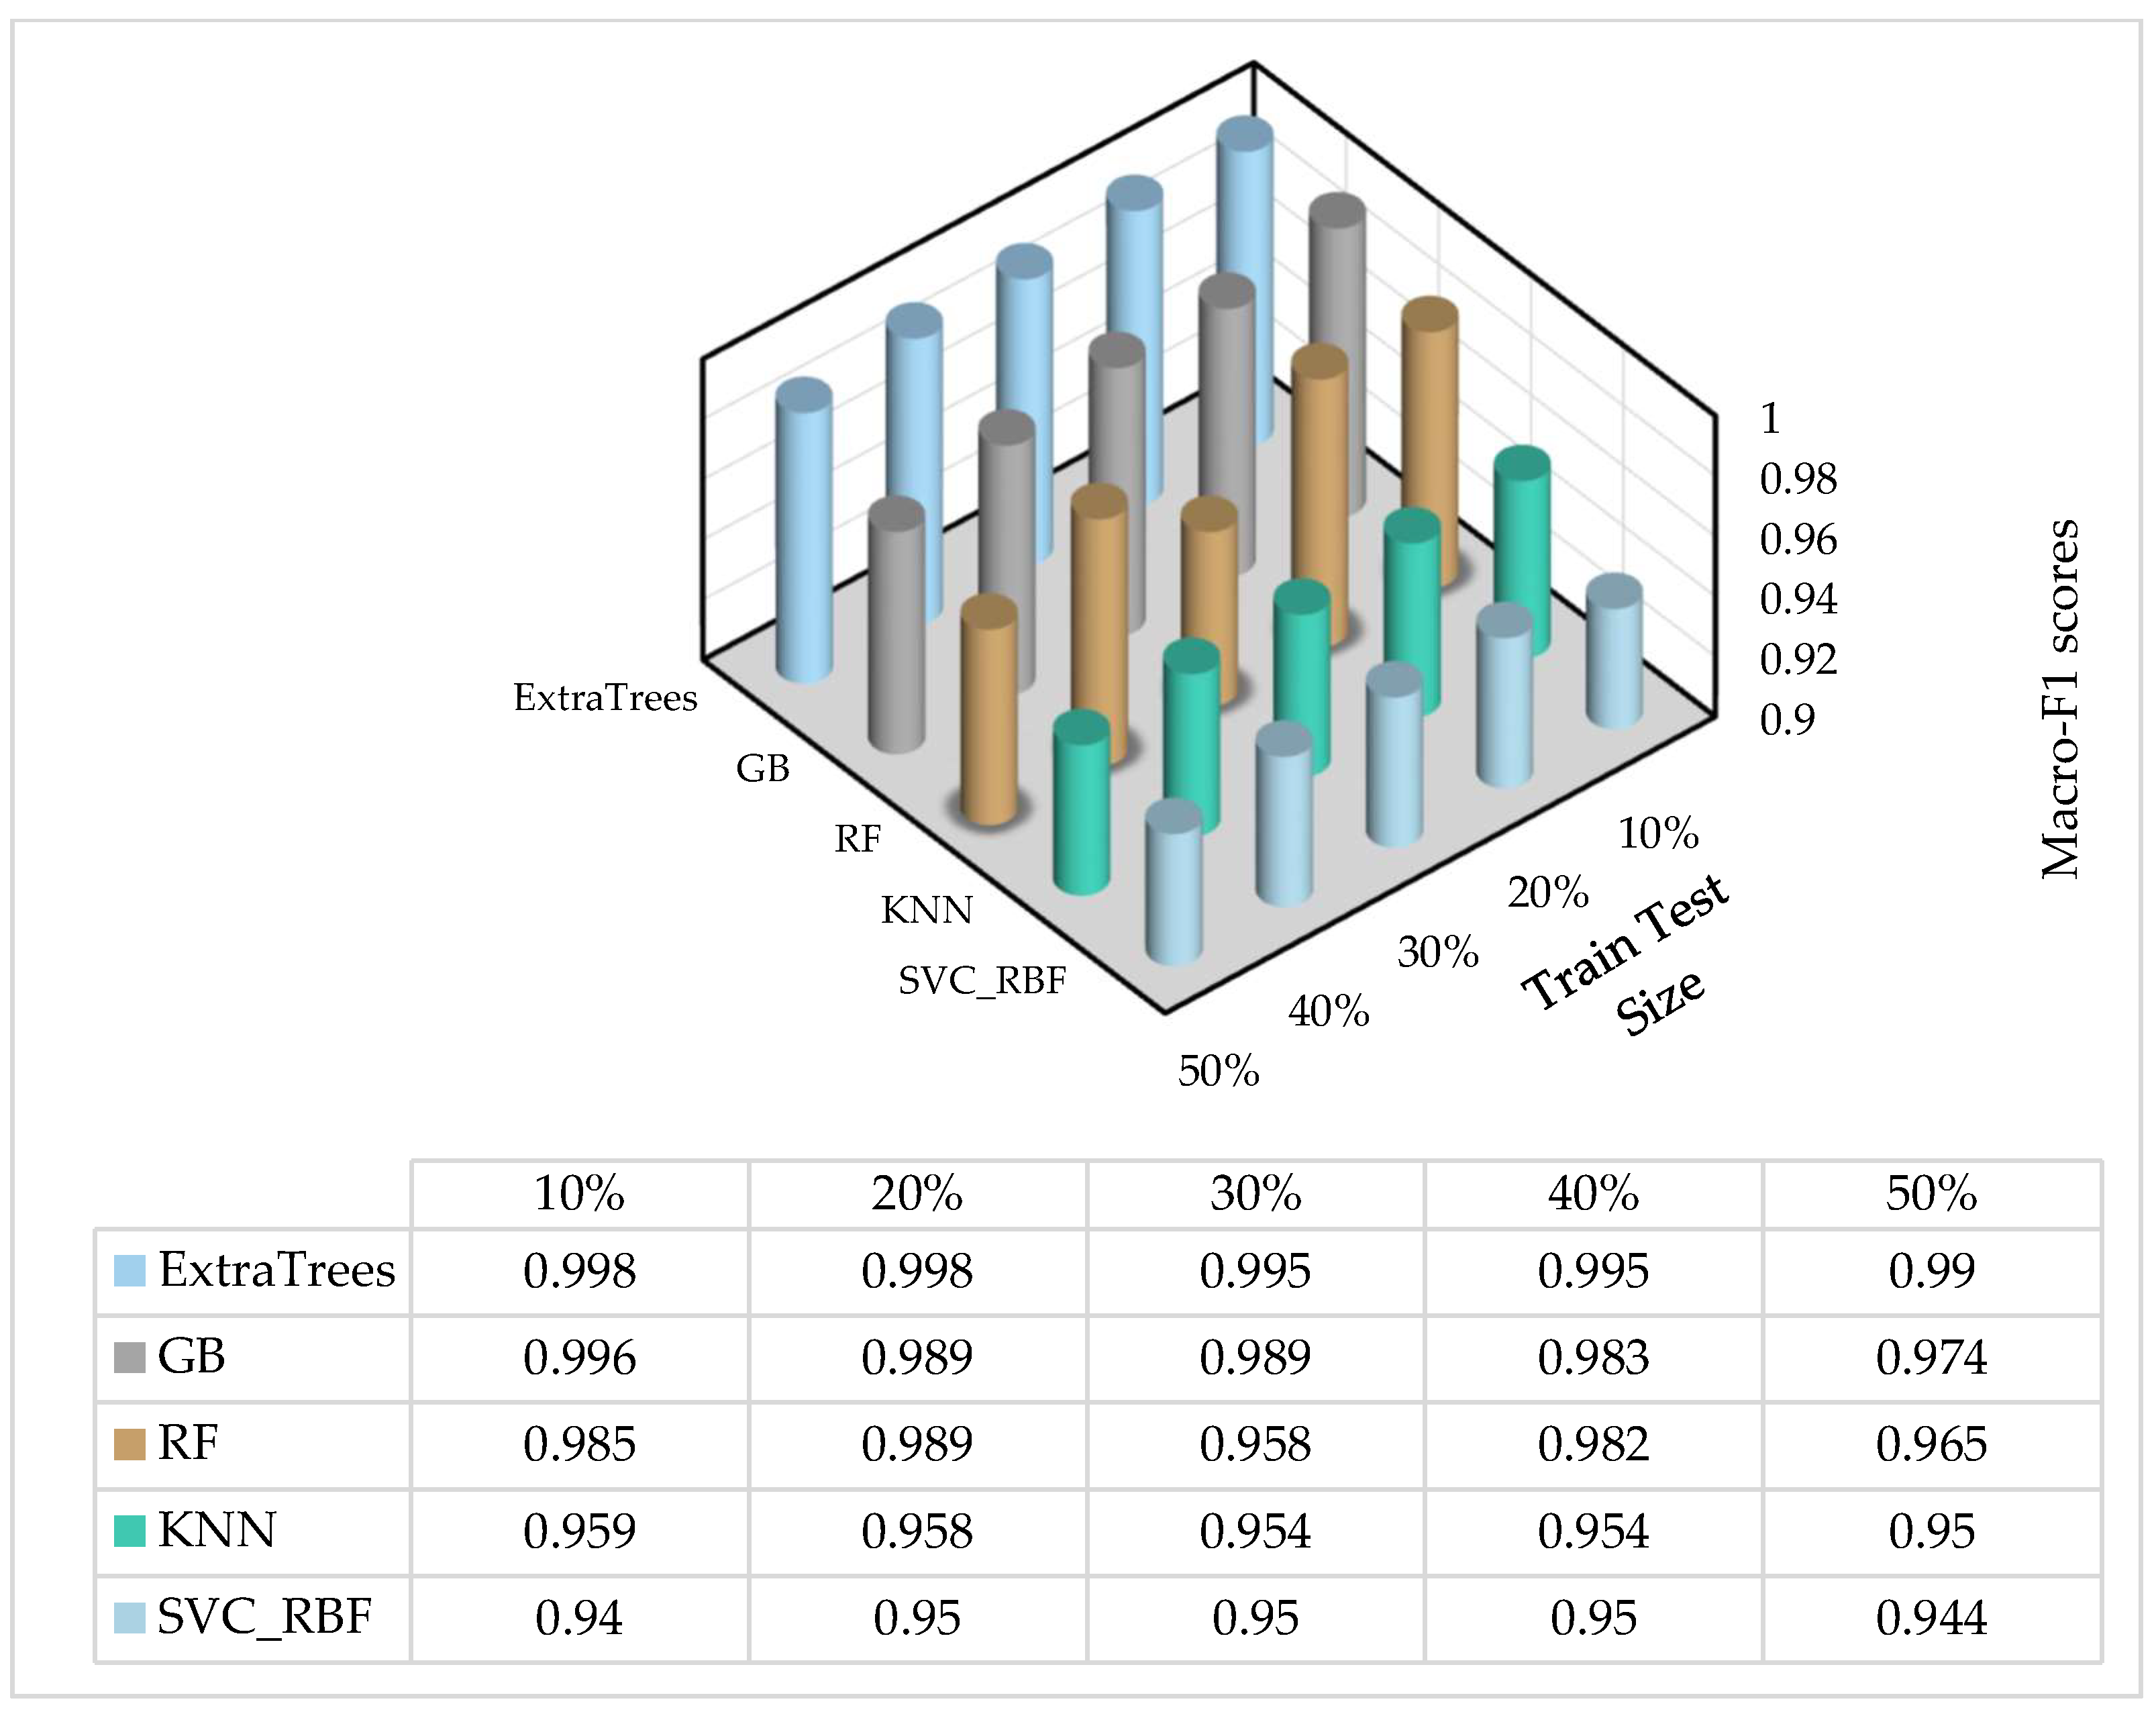
To investigate the impact of varying test/train splits on model performance, series of experiments using five different test sizes: 10%, 20%, 30%, 40%, and 50% have been conducted. For each test size, we evaluated the models’ performance using both the Macro F1 Score and McFadden’s Pseudo-R2 Score. The results for each test size scenario are summarized below.
10% Test Size
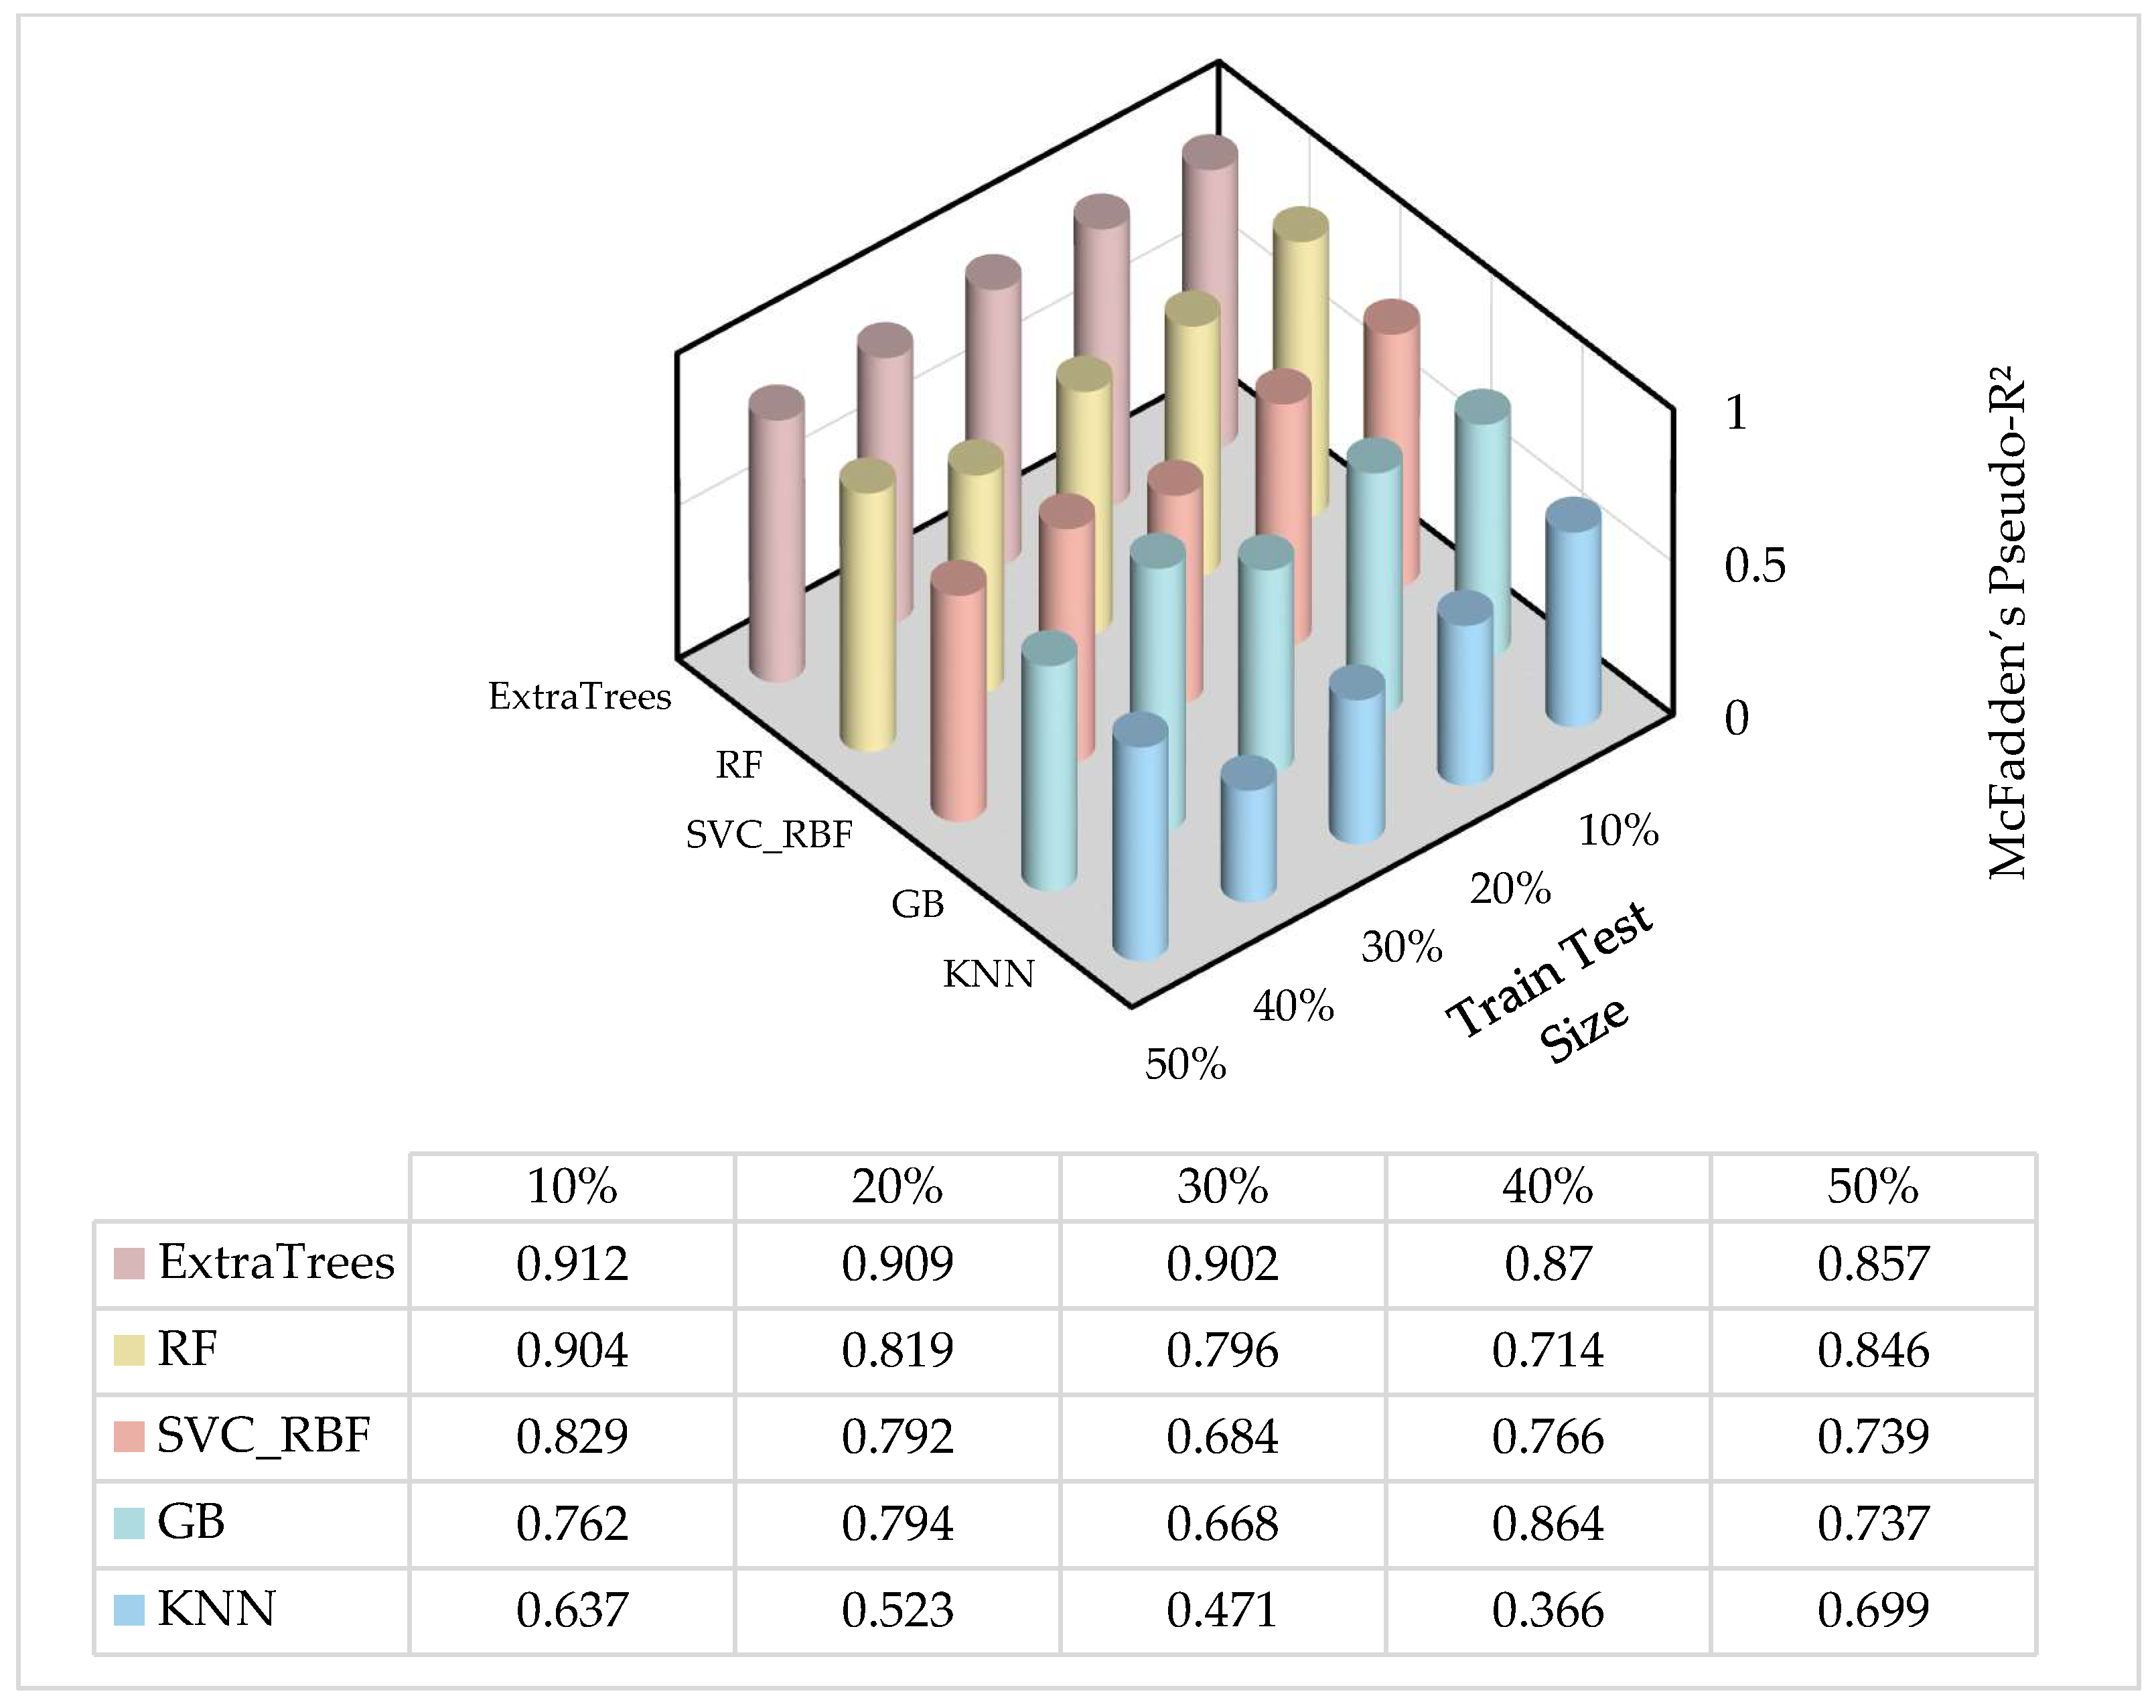
Figure 15 shows the Macro F1 Scores for classifiers with a 10% test size. ExtraTrees emerged as the top performer, achieving a perfect Macro F1 score of 0.998. It was followed by GradientBoosting (0.996) and RandomForest (0.985). SVC and kNN demonstrated robust performance with scores of 0.959 and 0.940, respectively. These findings highlight ExtraTrees as the most reliable and stable model, even with a small test size. In terms of McFadden’s Pseudo-R2 in Figure 16 ExtraTrees again outperformed all other models with a score of 0.912, closely followed by GradientBoosting (0.904). RandomForest and SVC displayed solid performance, with scores of 0.829 and 0.762, respectively. kNN, however, showed the lowest performance with a Pseudo-R2 score of 0.637. This demonstrates that ExtraTrees achieved the best model fit in this scenario.
20% Test Size
As the test size increased to 20%, ExtraTrees maintained its superior performance, securing a Macro F1 score of 0.998, as shown in Figure 15. RandomForest and GradientBoosting followed closely with scores of 0.989. Both kNN and SVC performed well, with scores of 0.958 and 0.950, respectively. For McFadden’s Pseudo-R2 in Figure 16, ExtraTrees continued to lead with a score of 0.909, followed by GradientBoosting (0.904). RandomForest showed a solid performance with a score of 0.819, while SVC and kNN exhibited weaker performance with scores of 0.792 and 0.523, respectively. These results reinforce the robustness of ExtraTrees at higher test sizes.
30% Test Size
Figure 15 presents the Macro F1 Scores for classifiers with a 30% test size. ExtraTrees maintained its leading position with a score of 0.995, followed by RandomForest (0.982) and GradientBoosting (0.956). kNN and SVC showed slightly reduced performance with scores of 0.948 and 0.899, respectively. McFadden’s Pseudo-R2 scores for the 30% test size Figure 16 show that ExtraTrees remained the top model with a score of 0.902, closely followed by RandomForest (0.796) and GradientBoosting (0.684). SVC and kNN showed reduced performance with scores of 0.668 and 0.471, respectively, highlighting the decreasing performance of these models as the test size increased.
40% Test Size
With a 40% test size, ExtraTrees continued to outperform all other classifiers, achieving a Macro F1 score of 0.995 as shown in Figure 15 GradientBoosting and RandomForest achieved strong results, scoring 0.983 and 0.982, respectively. Both kNN and SVC showed reduced performance, scoring 0.954 and 0.950, respectively. In terms of McFadden’s Pseudo-R2 ExtraTrees again led with a score of 0.87, followed closely by GradientBoosting at 0.864. While RandomForest and kNN scored 0.714 and 0.766, respectively. SVC recorded significantly lower scores of 0.366, these results further confirm the continued superiority of ExtraTrees in model fitting.
50% Test Size
Finally, in the 50% test size scenario, ExtraTrees remained dominant with a Macro F1 score of 0.990 in Figure 15 GradientBoosting and RandomForest followed with scores of 0.974 and 0.965, respectively. kNN and SVC maintained reasonable performance, scoring 0.950 and 0.944, respectively. For McFadden’s Pseudo-R2 in Figure 16. ExtraTrees retained its leadership with a score of 0.857, ahead of GradientBoosting (0.846). RandomForest scored 0.739, while kNN and SVC showed lower results with scores of 0.699 and 0.737, respectively. This further solidifies ExtraTrees as the most accurate model across all test sizes.
While the reported F1 scores of 0.998 and 0.995 shown in Figure 15 are very close, a statistical analysis was conducted to assess whether these differences are meaningful. F1 scores were obtained for all test sizes (10%, 20%, 30%, 40%, and 50%), suggesting that the slight variations are within the expected range performance for this type of dataset. ExtraTrees consistently outperformed all other models, making it the best-performing model in terms of both Macro F1 Score and McFadden’s Pseudo-R2. Despite the varying test sizes, ExtraTrees demonstrated exceptional stability and accuracy, confirming its superiority in predicting coal texture types. GradientBoosting and RandomForest also exhibited strong performance across all test sizes, while kNN and SVC lagged behind, particularly as the test size increased.
These results underscore the importance of effective feature selection and the robustness of tree-based models, such as ExtraTrees and RandomForest, for this coal texture classification task. The findings highlight the capacity of these models to maintain strong performance even when the test size varies, thus emphasizing their ability to manage different train/test splits effectively.
In particular, ExtraTrees was shown to be the most consistent performer, offering the best balance between model accuracy and stability, regardless of the test size. This makes ExtraTrees an ideal choice for tasks requiring high classification accuracy and model robustness in practical applications.

3.2. Implications for Coal Texture Classification

The machine learning models were evaluated using several performance metrics, including the Macro F1 Score, McFadden’s Pseudo-R2, and accuracy. To validate the models and assess their generalizability, k-fold cross-validation with k = 5 has been employed. In this approach, the dataset was divided into five subsets, and each model was trained on four subsets while testing it on the remaining subset. This process was repeated five times, with each subset serving as the test set once. The performance were metrics computed once for each fold, where the results were averaged to provide an overall assessment of the model’s robustness; the process was repeated for all test size (10%, 20%, 30%, 40%, and 50%) subsets. ExtraTrees consistently outperforms the other models in terms of both Macro F1 Score and McFadden’s Pseudo-R2 Score, solidifying its status as the best-performing model for coal texture classification. The model’s peak performance occurred at the 20% test size, where ExtraTrees achieved a Macro F1 Score of 0.998 and McFadden’s Pseudo-R2 Score of 0.909, illustrating its ability to effectively handle data with a moderate test split. While the 10% test size also yielded strong performance with a Macro F1 Score of 0.996, the 20% test size emerged as the most balanced, demonstrating the highest performance across both metrics.
The results reveal that ExtraTrees is robust to varying test sizes, consistently maintaining high accuracy and strong performance metrics. Conversely, other models such as GradientBoosting, RandomForest, and SVC exhibited more variability, particularly with larger test sizes. For instance, kNN experienced a notable drop in performance at the 50% test size, with both the Macro F1 Score and McFadden’s Pseudo-R2 Score significantly lower than those achieved by ExtraTrees and GradientBoosting.
Table 4 illustrates the performance of the ExtraTrees model across various test sizes (10%, 20%, 30%, 40%, and 50%) for coal texture classification, demonstrating its robust ability to handle both large and small datasets effectively, maintaining strong performance even with imbalanced data.
While the model performed excellently for most of the data points, a few misclassifications occurred at larger test sizes. Specifically, 50 UC samples (approximately 1.6%) were mistakenly predicted as CC at the 50% test size, while 23 CC samples (about 1.15%) were misclassified as UC. However, the GC class, due to its limited sample size, had minimal misclassification, with nearly all data points predicted correctly across the different test sizes. To mitigate this, SMOTE method has been applied during the model training phase. SMOTE helps balance the dataset by generating synthetic instances of the minority class, in this case, GC, to ensure the model learns more effectively to identify these less frequent instances. Although the effect of SMOTE may not be immediately evident in the confusion matrix for the test data, as it represents the model’s ability to generalize, it is expected to improve the model’s ability to forecast GC types in future predictions. By addressing the class imbalance, SMOTE increases the likelihood that the model will more accurately predict GC samples, especially when classifying unclassified coal texture types in future applications. Generally, the results in Table 4 further emphasize ExtraTrees’ superior classification capability, particularly with smaller test sizes (10% and 20%), where nearly all predictions were accurate. These results reinforce the earlier findings that ExtraTrees outperforms other models in classifying and predicting coal texture types.

4. Conclusions

This study presents a novel and comprehensive approach to optimizing reservoir characterization by leveraging machine learning for coal texture classification in the Zhengzhuang Field of the Qinshui Basin. By utilizing well-log data from 86 wells, the study refined a dataset initially comprising 2992 data points, categorized into three coal texture types: Undeformed Coal (UC), Cataclastic Coal (CC), and Granulated Coal (GC). After data optimization, the dataset was further reduced to 8 input parameters, followed by the selection of the 5 most influential features for model evaluation.
The research focused on improving the accuracy of coal texture prediction and enhancing the understanding of CBM reservoir properties, with a particular emphasis on gas migration and accumulation processes. Two main scenarios were evaluated: Scenario 1, using all 8 parameters, and Scenario 2, using the 5 most influential parameters. Through the application of five distinct machine learning models, the study demonstrated high-performance coal texture classification, advancing the understanding of coalbed methane reservoir characterization.
The following points summarize the key contributions of this work:
  • Mathematical Modeling and Machine Learning Success
This study utilized five different machine learning models—Extra Trees, Gradient Boosting, Support Vector Classifier (SVC), Random Forest, and k-Nearest Neighbors (kNN). Among these models, Extra Trees stood out as the best-performing classifier in both scenarios. Its ability to capture intricate patterns within the data, particularly the complex relationships between geophysical parameters, made it the optimal choice for coal texture classification. The model’s performance was evaluated using various metrics, such as McFadden’s Pseudo-R2 and Macro F1 Score, where Extra Trees consistently outperformed the others, demonstrating its exceptional predictive capabilities.
  • Model Performance and Evaluation
Extra Trees achieved the highest performance with a Macro F1 Score of 0.998, particularly when 20% of the data was used for the test set and 80% for training. This peak performance underscores the model’s robustness and its ability to maintain high accuracy, even with varying test sizes. These findings highlight the superior capability of ensemble learning methods, especially Extra Trees, in handling the complex geological data associated with coalbed methane reservoirs. The results suggest that machine learning can significantly enhance the accuracy of CBM reservoir modeling, particularly for gas migration and accumulation analysis.
  • Limitations, Future Implications, and Recommendations
While this study provides a robust methodology for coal texture classification, it is limited by the relatively small and geographically focused dataset from the Zhengzhuang Field. The model’s performance may vary with larger datasets or different geological settings, and the prediction accuracy for the Granulated Coal (GC) class could be further improved with more data points. While the study provides a successful approach to coal texture classification, further work could incorporate additional geophysical parameters and datasets to enhance model robustness. Including more diverse geological features from different regions would create a more comprehensive model for CBM exploration. Additionally, expanding this methodology to predict coal texture types in unsampled layers would optimize resource evaluation and gas accumulation predictions, improving extraction strategies. Future efforts will also focus on integrating geological stress modeling and multi-source data, such as seismic and geophysical measurements, to further improve the reliability and generalizability of machine learning-based coal texture classification across coal basins with varying geological conditions.
Author Contributions

Conceptualization, Y.W. (Yuting Wang), C.Z. and B.Y.; Software, Y.W. (Yahya Wahib); Validation, M.L. and A.D.R.; Formal analysis, J.C.; Investigation, G.S.; Resources, Y.Y.; Data curation, Y.W. (Yuting Wang) and B.Y.; Writing—original draft, Y.W. (Yahya Wahib), Y.W. (Yuting Wang), Y.Y. and B.Y.; Writing—review & editing, R.Y., B.Y., A.D.R. and J.Y.; Visualization, Y.W. (Yuting Wang) and Y.Y.; Supervision, B.Y. All authors have read and agreed to the published version of the manuscript.

Funding

This research was funded by a study on 3D Fine Geological Modeling of High-Rank Coalbed Methane in Zhengzhuang Block (NO. HBYT-SX-2024-JS-293).

Data Availability Statement

The data presented in this study are available on request from the corresponding author.

Conflicts of Interest

Author Yuting Wang, Cong Zhang, Yanhui Yang, Mengxi Li, Guangjie Sang, Ruiqiang Yang, and Jiale Chen were employed by the company Exploration and Development Research Institute of PetroChina Hubei Oilfield Company. The remaining authors declare that the research was conducted in the absence of any commercial or financial relationships that could be construed as a potential conflict of interest.

Abbreviations

The following abbreviations are used in this manuscript:
CBMCoalbed Methane
UCUndeformed Coal
CCCataclastic Coal
GCGranulated Coal
MLMachine Learning
SVCSupport Vector Classifier
kNNk-Nearest Neighbors
RFRandom Forest
PCAPrincipal Component Analysis
R2Coefficient of Determination
CTComputed Tomography
CNNConvolutional Neural Network
ViTVision Transformer
GCNGraph Convolution Network
XRFX-ray Fluorescence
RxoMicroresistivity
RDDeep Resistivity
RSShallow Resistivity
SPSpontaneous Potential
ACAcoustic Transit Time
CALCaliper
CNLCompensated Neutron Log
DENBulk Density
GRGamma Ray
DEPTHMeasured Depth
DEVIBorehole Deviation
R2_5Resistivity at 2.5 m
PORPorosity
SMOTE Synthetic Minority Over-sampling Technique

References

  1. Zhao, S.; Wu, D. Quantitative Analysis of Multi-Angle Correlation Between Fractal Dimension of Anthracite Surface and Its Coal Quality Indicators in Different Regions. Fractal Fract. 2025, 9, 538. [Google Scholar] [CrossRef]
  2. Li, C.; Yang, Z.; Tian, W.; Lu, B. Construction and Application of Prediction Methods for Coal Texture of CBM Reservoirs at the Block Scale. J. Pet. Sci. Eng. 2022, 219, 111075. [Google Scholar] [CrossRef]
  3. Teng, J.; Yao, Y.; Liu, D.; Cai, Y. Evaluation of Coal Texture Distributions in the Southern Qinshui Basin, North China: Investigation by a Multiple Geophysical Logging Method. Int. J. Coal Geol. 2015, 140, 9–22. [Google Scholar] [CrossRef]
  4. Hao, Z.; Li, J.; Gao, J.; Liu, R.; Wang, Y.; Dong, L.; Ma, W.; Zhang, L.; Zhang, P.; Tian, Z.; et al. A Study on the Accurate Classification of Complex Coal Samples Using Raman-XRF Combined Spectroscopy. Spectrochim. Acta Part B At. Spectrosc. 2025, 232, 107273. [Google Scholar] [CrossRef]
  5. Wang, Z.; Cai, Y.; Liu, D.; Lu, J.; Qiu, F.; Sun, F.; Hu, J.; Li, Z. Characterization of Natural Fracture Development in Coal Reservoirs Using Logging Machine Learning Inversion, Well Test Data and Simulated Geostress Analyses. Eng. Geol. 2024, 341, 107696. [Google Scholar] [CrossRef]
  6. Yan, Z.; Xiao, D.; Sun, H.; Zhang, L.; Yin, L. Coal Type Identification with Application Result Quantification Based on Deep-Ensemble Learning and Image-Encoded Reflectance Spectroscopy. Fuel 2024, 373, 132381. [Google Scholar] [CrossRef]
  7. Zhao, B.; Hu, S.; Zhao, X.; Zhou, B.; Li, J.; Huang, W.; Chen, G.; Wu, C.; Liu, K. The Application of Machine Learning Models Based on Particles Characteristics during Coal Slime Flotation. Adv. Powder Technol. 2022, 33, 103363. [Google Scholar] [CrossRef]
  8. Banerjee, A.; Chatterjee, R. A Methodology to Estimate Proximate and Gas Content Saturation with Lithological Classification in Coalbed Methane Reservoir, Bokaro Field, India. Nat. Resour. Res. 2021, 30, 2413–2429. [Google Scholar] [CrossRef]
  9. Quan, F.; Lu, W.; Song, Y.; Sheng, W.; Qin, Z.; Luo, H. Multifractal Characterization of Heterogeneous Pore Water Redistribution and Its Influence on Permeability During Depletion: Insights from Centrifugal NMR Analysis. Fractal Fract. 2025, 9, 536. [Google Scholar] [CrossRef]
  10. Zhou, F.; Oraby, M.; Luft, J.; Guevara, M.O.; Keogh, S.; Lai, W. Coal Seam Gas Reservoir Characterisation Based on High-Resolution Image Logs from Vertical and Horizontal Wells: A Case Study. Int. J. Coal Geol. 2022, 262, 104110. [Google Scholar] [CrossRef]
  11. Cao, L.; Yao, Y.; Cui, C.; Sun, Q. Characteristics of In-Situ Stress and Its Controls on Coalbed Methane Development in the Southeastern Qinshui Basin, North China. Energy Geosci. 2020, 1, 69–80. [Google Scholar] [CrossRef]
  12. Xu, S.; Liu, Q.; Yu, H.; Huang, X.; Bo, Y.; Lei, Y.; Zi, J.; Yang, Y.; Zhang, S. Neural Texture Synthesis and Style Transfer of Coal-Rock Images in Coal Mine Heading Faces Using Very Deep Convolutional Networks. Tunn. Undergr. Space Technol. 2024, 157, 106342. [Google Scholar] [CrossRef]
  13. Cheng, G.; Zhou, X.; Tang, Y.; Chen, J.; Yang, W.; Dai, L.; Liao, J.; Liao, L. CNN Inversion Model Considering Texture Features and Its Application to Soil Selenium Content. J. Geochem. Explor. 2025, 280, 107909. [Google Scholar] [CrossRef]
  14. Zhang, K.; Wang, W.; Cui, Y.; Lv, Z.; Fan, Y.; Zhao, X. Deep Learning-Based Estimation of Ash Content in Coal: Unveiling the Contributions of Color and Texture Features. Measurement 2024, 233, 114632. [Google Scholar] [CrossRef]
  15. Embaby, A.; Ismael, A.; Ali, F.A.; Farag, H.A.; Mousa, B.G.; Gomaa, S.; Elwageeh, M. An Approach Based on Machine Learning Algorithms, Geostatistical Technique, and GIS Analysis to Estimate Phosphate Ore Grade at the Abu Tartur Mine, Western Desert, Egypt. Min. Miner. Depos. 2023, 17, 108–119. [Google Scholar] [CrossRef]
  16. Cui, C.; Chang, S.; Yao, Y.; Cao, L. Quantify Coal Macrolithotypes of a Whole Coal Seam: A Method Combing Multiple Geophysical Logging and Principal Component Analysis. Energies 2021, 14, 213. [Google Scholar] [CrossRef]
  17. Huy, T.P.; Vo, T.; Kieu, T.; Phan Huy, T. Machine Learning Approaches to Dividend Prediction: An Empirical Study on Vietnam’s Stock Market. J. Dyn. Control 2025, 9, 152–168. [Google Scholar] [CrossRef]
  18. Yahya, W.; Baolin, Y.; AlRassas, A.M.; Yuting, W.; Al-Khafaji, H.; Al Dawood, R. Developing Robust Machine Learning Techniques to Predict Oil Recovery: A Comprehensive Field and Experimental Study. Geoenergy Sci. Eng. 2025, 250, 213853. [Google Scholar] [CrossRef]
  19. Al Dwood, R.; Meng, Q.; Ibrahim, A.W.; Yahya, W.A.; Alareqi, A.G.; AL-Khulaidi, G. A Novel Hybrid ANN-GB-LR Model for Predicting Oil and Gas Production Rate. Flow Meas. Instrum. 2024, 100, 102690. [Google Scholar] [CrossRef]
  20. Deumah, S.S.; Yahya, W.A.; Al-Khudafi, A.M.; Ba-Jaalah, K.S.; Al-Absi, W.T. Prediction of Gas Viscosity of Yemeni Gas Fields Using Machine Learning Techniques. In Proceedings of the Society of Petroleum Engineers—SPE Symposium: Artificial Intelligence—Towards a Resilient and Efficient Energy Industry 2021, Online, 18–19 October 2021. [Google Scholar] [CrossRef]
  21. AlRassas, A.M.; Ejike, C.; Deumah, S.; Yahya, W.A.; Ahmed, A.A.; Darwish, S.A.; Kingsley, A.; Renyuan, S. Knowledge-Based Machine Learning Approaches to Predict Oil Production Rate in the Oil Reservoir. In International Field Exploration and Development Conference; Springer Nature: Singapore, 2024; pp. 282–304. ISBN 9789819702671. [Google Scholar]
  22. Yahya, W.; Baolin, Y.; Al-Khafaji, H.; Deumah, S.; Ibrahim, A.-W.; Alrassas, A.M.; Aldawod, R.; Al-Khulaidi, G. Integrated Comparative Study and Sensitivity Analysis of Robust Machine Learning Approaches for Predicting Gas Density: Insights from a Real Gas Reservoir. Available online: https://www.researchgate.net/profile/Wahib-Ali-Yahya/publication/396447654_Integrated_Comparative_Study_and_Sensitivity_Analysis_of_Robust_Machine_Learning_Approaches_for_Predicting_Gas_Density_Insights_from_a_Real_Gas_Reservoir/links/68ecb089f3032e2b4be886c9/Integrated-Comparative-Study-and-Sensitivity-Analysis-of-Robust-Machine-Learning-Approaches-for-Predicting-Gas-Density-Insights-from-a-Real-Gas-Reservoir.pdf (accessed on 21 November 2025).
  23. Mubiru, J.; Evdorides, H. Quantifying the Risk Impact of Contextual Factors on Pedestrian Crash Outcomes in Data-Scarce Developing Country Settings. Future Transp. 2025, 5, 151. [Google Scholar] [CrossRef]
  24. Aldarweesh, F.M.; Johnson, C.E.; Roelfs, D.J.; Karimi, S.M.; Antimisiaris, D. Mental Health Outcomes and Digital Service Utilization: A Comparative Analysis of Arab American and Arab/Middle Eastern International Students During the COVID-19 Recovery Period. Healthcare 2025, 13, 2436. [Google Scholar] [CrossRef] [PubMed]
  25. Ma, J.; Li, T.; Shirani Faradonbeh, R.; Sharifzadeh, M.; Wang, J.; Huang, Y.; Ma, C.; Peng, F.; Zhang, H. Data-Driven Approach for Intelligent Classification of Tunnel Surrounding Rock Using Integrated Fractal and Machine Learning Methods. Fractal Fract. 2024, 8, 677. [Google Scholar] [CrossRef]
  26. Gu, Y.; Wu, X.; Jiang, Y.; Guan, Q.; Dong, D.; Zhuang, H. Evolution of Pore Structure and Fractal Characteristics in Transitional Shale Reservoirs: Case Study of Shanxi Formation, Eastern Ordos Basin. Fractal Fract. 2025, 9, 335. [Google Scholar] [CrossRef]
  27. Zhang, Y.; Zhang, L.; Lei, Z.; Xiao, F.; Zhou, Y.; Zhao, J.; Qian, X. Unsupervised Machine Learning-Based Singularity Models: A Case Study of the Taiwan Strait Basin. Fractal Fract. 2024, 8, 553. [Google Scholar] [CrossRef]
Figure 1. The main workflow for this study.
Energies 18 06185 g001
Figure 2. Map showing the location and geological structures of the Zhengzhuang field in Qinshui Basin. (a) The Qinshui Basin which located in the northern part of Shanxi Province, China; (b) The Zhengzhuang field which situated within the Qinshui Basin, specifically to the southeast; (c) The structure of the Zhengzhuang field [11].
Energies 18 06185 g002
Figure 3. R2 scores of RF-based regression models used to impute missing values for six well-log parameters (DEN, Rxo, SP, RD, RS, and CNL) with 2992 samples per parameter. Overfitting was tested, and the model showed high accuracy without overfitting.
Energies 18 06185 g003
Figure 4. Correlation heatmap among selected well-log parameters (post-processing).
Energies 18 06185 g004
Figure 5. Feature importance from a Random Forest classifier showing broadly similar contributions across logs.
Energies 18 06185 g005
Figure 6. Multinomial logistic-regression coefficients by coal-texture class, indicating comparable effect sizes across features.
Energies 18 06185 g006
Figure 7. McFadden’s Pseudo-R2 Scores for Model Performance in Coal Texture Classification (Test Set_Scenario 1).
Energies 18 06185 g007
Figure 8. PCA Projection of Coal Texture Types Showing Separation of Classes (Scenario 1).
Energies 18 06185 g008
Figure 9. Comparison of Macro F1 Scores Across Different Classifiers for Coal Texture Prediction (Test Set_Scenario 1).
Energies 18 06185 g009
Figure 10. Permutation Feature Importance for Coal Texture Classification (Scenario 1).
Energies 18 06185 g010
Figure 11. PCA Projection of Coal Texture Types Showing Separation of Classes (Scenario 2).
Energies 18 06185 g011
Figure 12. Comparison of Macro F1 Scores Across Different Classifiers for Coal Texture Prediction (Scenario 2).
Energies 18 06185 g012
Figure 13. Permutation Feature Importance for Coal Texture Classification (Scenario 2).
Energies 18 06185 g013
Figure 14. McFadden’s Pseudo-R2 Scores for Model Performance in Coal Texture Classification (Scenario 2).
Energies 18 06185 g014
Figure 15. Macro F1 Scores for Classifiers with 10, 20, 30, 40, and 50% Test Train Size for the Five ML Models Using 8 Parameters to Predict the Coal Texture Type.
Energies 18 06185 g015
Figure 16. McFadden’s Pseudo-R2 Scores for Classifiers With 10, 20, 30, 40, and 50% Test Train Size for the Five ML Models Using 8 Parameters to Predict the Coal Texture Type.
Energies 18 06185 g016
Table 1. Descriptive Statistics of Well-Log Features before Preprocessing for Coal Texture Classification.
ParameterCountCount %MeanStdMinMaxIQR
DEPTH2992100%881.02251.42351.31341.9375.11
AC2992100%407.8532.01237.84581.6421.80
CAL2992100%25.764.6820.6351.453.90
CNL233878%40.226.221.3355.325.60
DEN294798%2.138.471.12195.500.11
GR2992100%73.19196.5412.813775.1629.93
Rxo294398%1016.172014.342.3365,788.591052.15
SP294398%77.42132.42−193.462595.1564.63
RD265489%2105.922678.5033.2746,256.982023.89
DEVI863%2.060.650.732.760.56
RS252584%2062.652534.1432.9640,826.991921.57
R2_5221974%1090.601071.1013.994485.511828.01
POR38813%3.680.780.014.770.57
Table 2. Preprocessed Well-Log Features (Cleaned and Imputed) for Coal Texture Classification.
ParameterCountCount %MeanStdMinMaxIQR
DEPTH2992100%881.02251.42351.31341.9375.11
AC2992100%407.8532.01237.84581.6421.80
CAL2992100%25.764.6820.6351.453.90
CNL2992100%40.455.741.3355.325.29
DEN2992100%2.118.411.12195.500.11
GR2992100%73.19196.5412.813775.1629.93
Rxo2992100%1018.71999.52.3365,788.591065.21
SP2992100%77.17131.37−193.462595.1563.64
RD2992100%2073.72572.533.2746,256.981960.23
RS2992100%2017.02372.132.9640,826.991830.82
Table 3. Hyperparameters and Optimal Values for Model Training.
ModelHyperparameterRange/Values TestedOptimal Value
SVC (RBF)C[0.01, 0.1, 1, 10, 100, 1000]1
gamma[0.0001, 0.001, 0.01, 0.1, 1, 10]0.1
KNNn_neighbors[3, 5, 7, 9, 11, 15, 21]5
weights[“uniform”, “distance”]“distance”
metric[“euclidean”, “manhattan”, “chebyshev”, “cosine”]“euclidean”
leaf_size[10, 20, 30, 40, 50]30
algorithm[“auto”, “ball_tree”, “kd_tree”, “brute”]“auto”
Extra Treesn_estimators[300, 500]500
criterion[“gini”, “entropy”]“gini”
max_depth[None, 6, 10]None
min_samples_split[2, 5]2
max_features[“sqrt”, “log2”, 1.0]“sqrt”
Random Forestn_estimators[300, 500]500
max_depth[None, 6, 10]None
min_samples_split[2, 5]5
class_weight[None, “balanced_subsample”]None
Gradient Boostingn_estimators[200, 300]300
learning_rate[0.05, 0.1]0.1
max_depth[2, 3]3
Table 4. Confusion Matrix for ExtraTrees Model Predictions Across Different Test Sizes for Coal Texture Classification.
Coal Texture TypeTrain-Test Split10%20%30%40%50%
Undeformed Coal TextureUC, Predicted (True UC)2414787139501191
UC, Predicted (True CC)1218253150
UC, Predicted (True GC)00000
Cataclastic Coal TextureCC, Predicted (True UC)38162223
CC, Predicted (True CC)4393141191227
CC, Predicted (True GC)00000
Granulated Coal TextureGC, Predicted (True UC)00000
GC, Predicted (True CC)00000
GC, Predicted (True GC)12335
Disclaimer/Publisher’s Note: The statements, opinions and data contained in all publications are solely those of the individual author(s) and contributor(s) and not of MDPI and/or the editor(s). MDPI and/or the editor(s) disclaim responsibility for any injury to people or property resulting from any ideas, methods, instructions or products referred to in the content.