The Impact of Online Shopping on Retail Building Space and Energy Demand in the U.S.
Abstract
1. Introduction
2. Methods
2.1. Retrospective Modeling: Regression Model of Retail Space and In-Store Shopping Time
2.2. Retrospective Modeling: Model Connecting Online and In-Store Shopping Times
2.3. Prospective Modeling: Forecast Online and In-Store Shopping Times
2.4. Prospective Modeling: Forecast Retail Space and Retail Building Energy Demand
2.5. Monte Carlo Analysis for Retail Building Energy Demand
3. Results
3.1. Year-to-Year Change Retail Space Regression Model
3.2. Future In-Store Shopping Time Prediction
3.3. Future Retail Building Energy Demand in the U.S.
4. Discussion
- Implications for the retail sector—The transition towards e-commerce has profound implications for urban planning, management, and the development of sustainable cities. The need to adapt physical retail spaces for alternative uses or improve their energy efficiency to mitigate wasteful consumption is growing. As brick-and-mortar retail spaces contract, city planners may need to repurpose vacant commercial properties, adapt zoning regulations, and reconsider infrastructure needs to support mixed-use developments, residential conversions, or logistics hubs for e-commerce fulfillment [52]. Our analysis does not break out how different bricks and mortar retail sectors will evolve—instead, we quantify the overall scale of continued decline in the U.S. Commentors have considered this question, debating, for example, how the declining demand for retail space could indicate a shift toward smaller, experience-driven stores rather than large-format retail outlets [53]. This trend suggests that future retail spaces may prioritize flexible layouts, omni-channel integration, and energy-efficient designs to align with evolving consumer behaviors and sustainability objectives. Planners should therefore view the transition not as a “retail apocalypse” but as a functional transformation. Some retail will remain, driven by demand to see some products in person, along with the need for convenient e-commerce returns. The excess space needs repurposing, calling for flexibility and creativity in planning and development. Future analyses should explore repurposing, assessing social, economic, and energy attributes.
- Implications for the energy sector—Energy demand forecasts are important in planning expansion and retirement of supply and for prioritization of energy efficiency programs. There is a tendency for analysts to overpredict energy demand, e.g., [54], and often do not include behavioral change as an explicit element of the forecast. This analysis suggests that behavioral change could lead to energy reductions in the retail sector that are more rapid than might otherwise be expected. We do not consider here the total effect of e-commerce on energy demand, which includes changes in transport, packaging, warehousing, and other behavioral changes. For example, increased online shopping affects urban transportation patterns, potentially reducing consumer travel for shopping but increasing freight traffic. Some of these effects have been estimated in prior literature [11], and it is important to refine these estimates and put them in a temporal context.
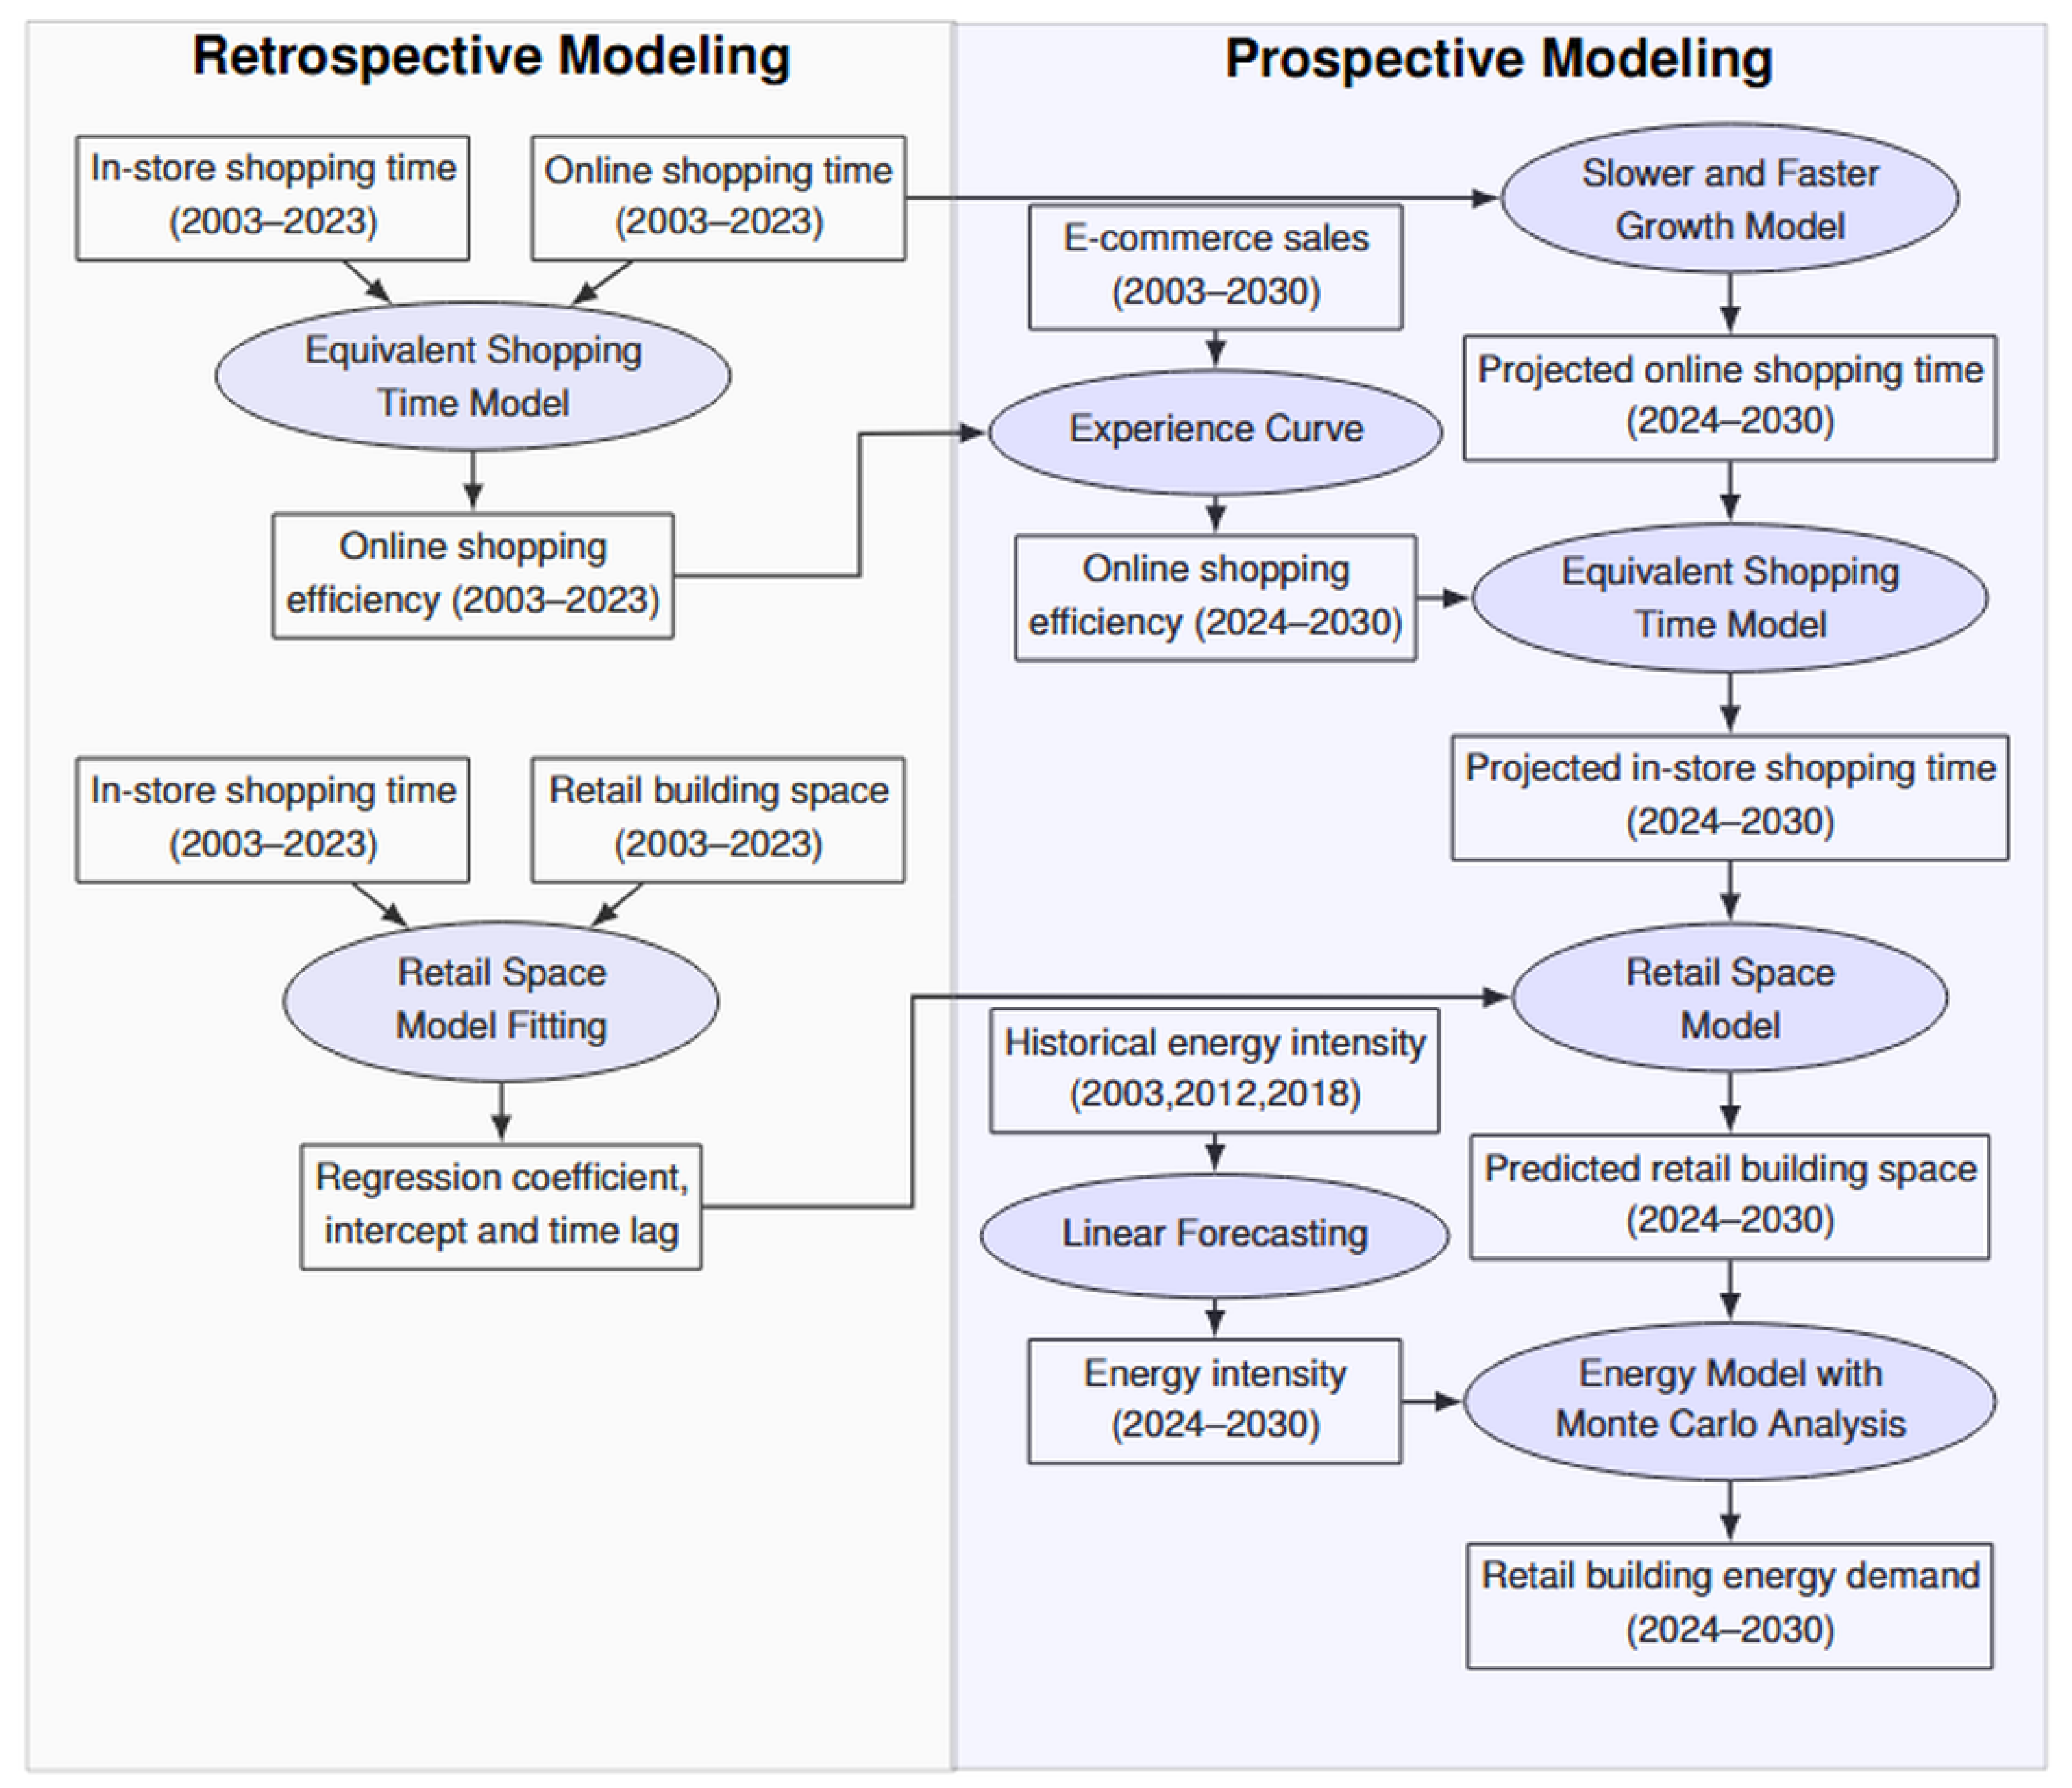
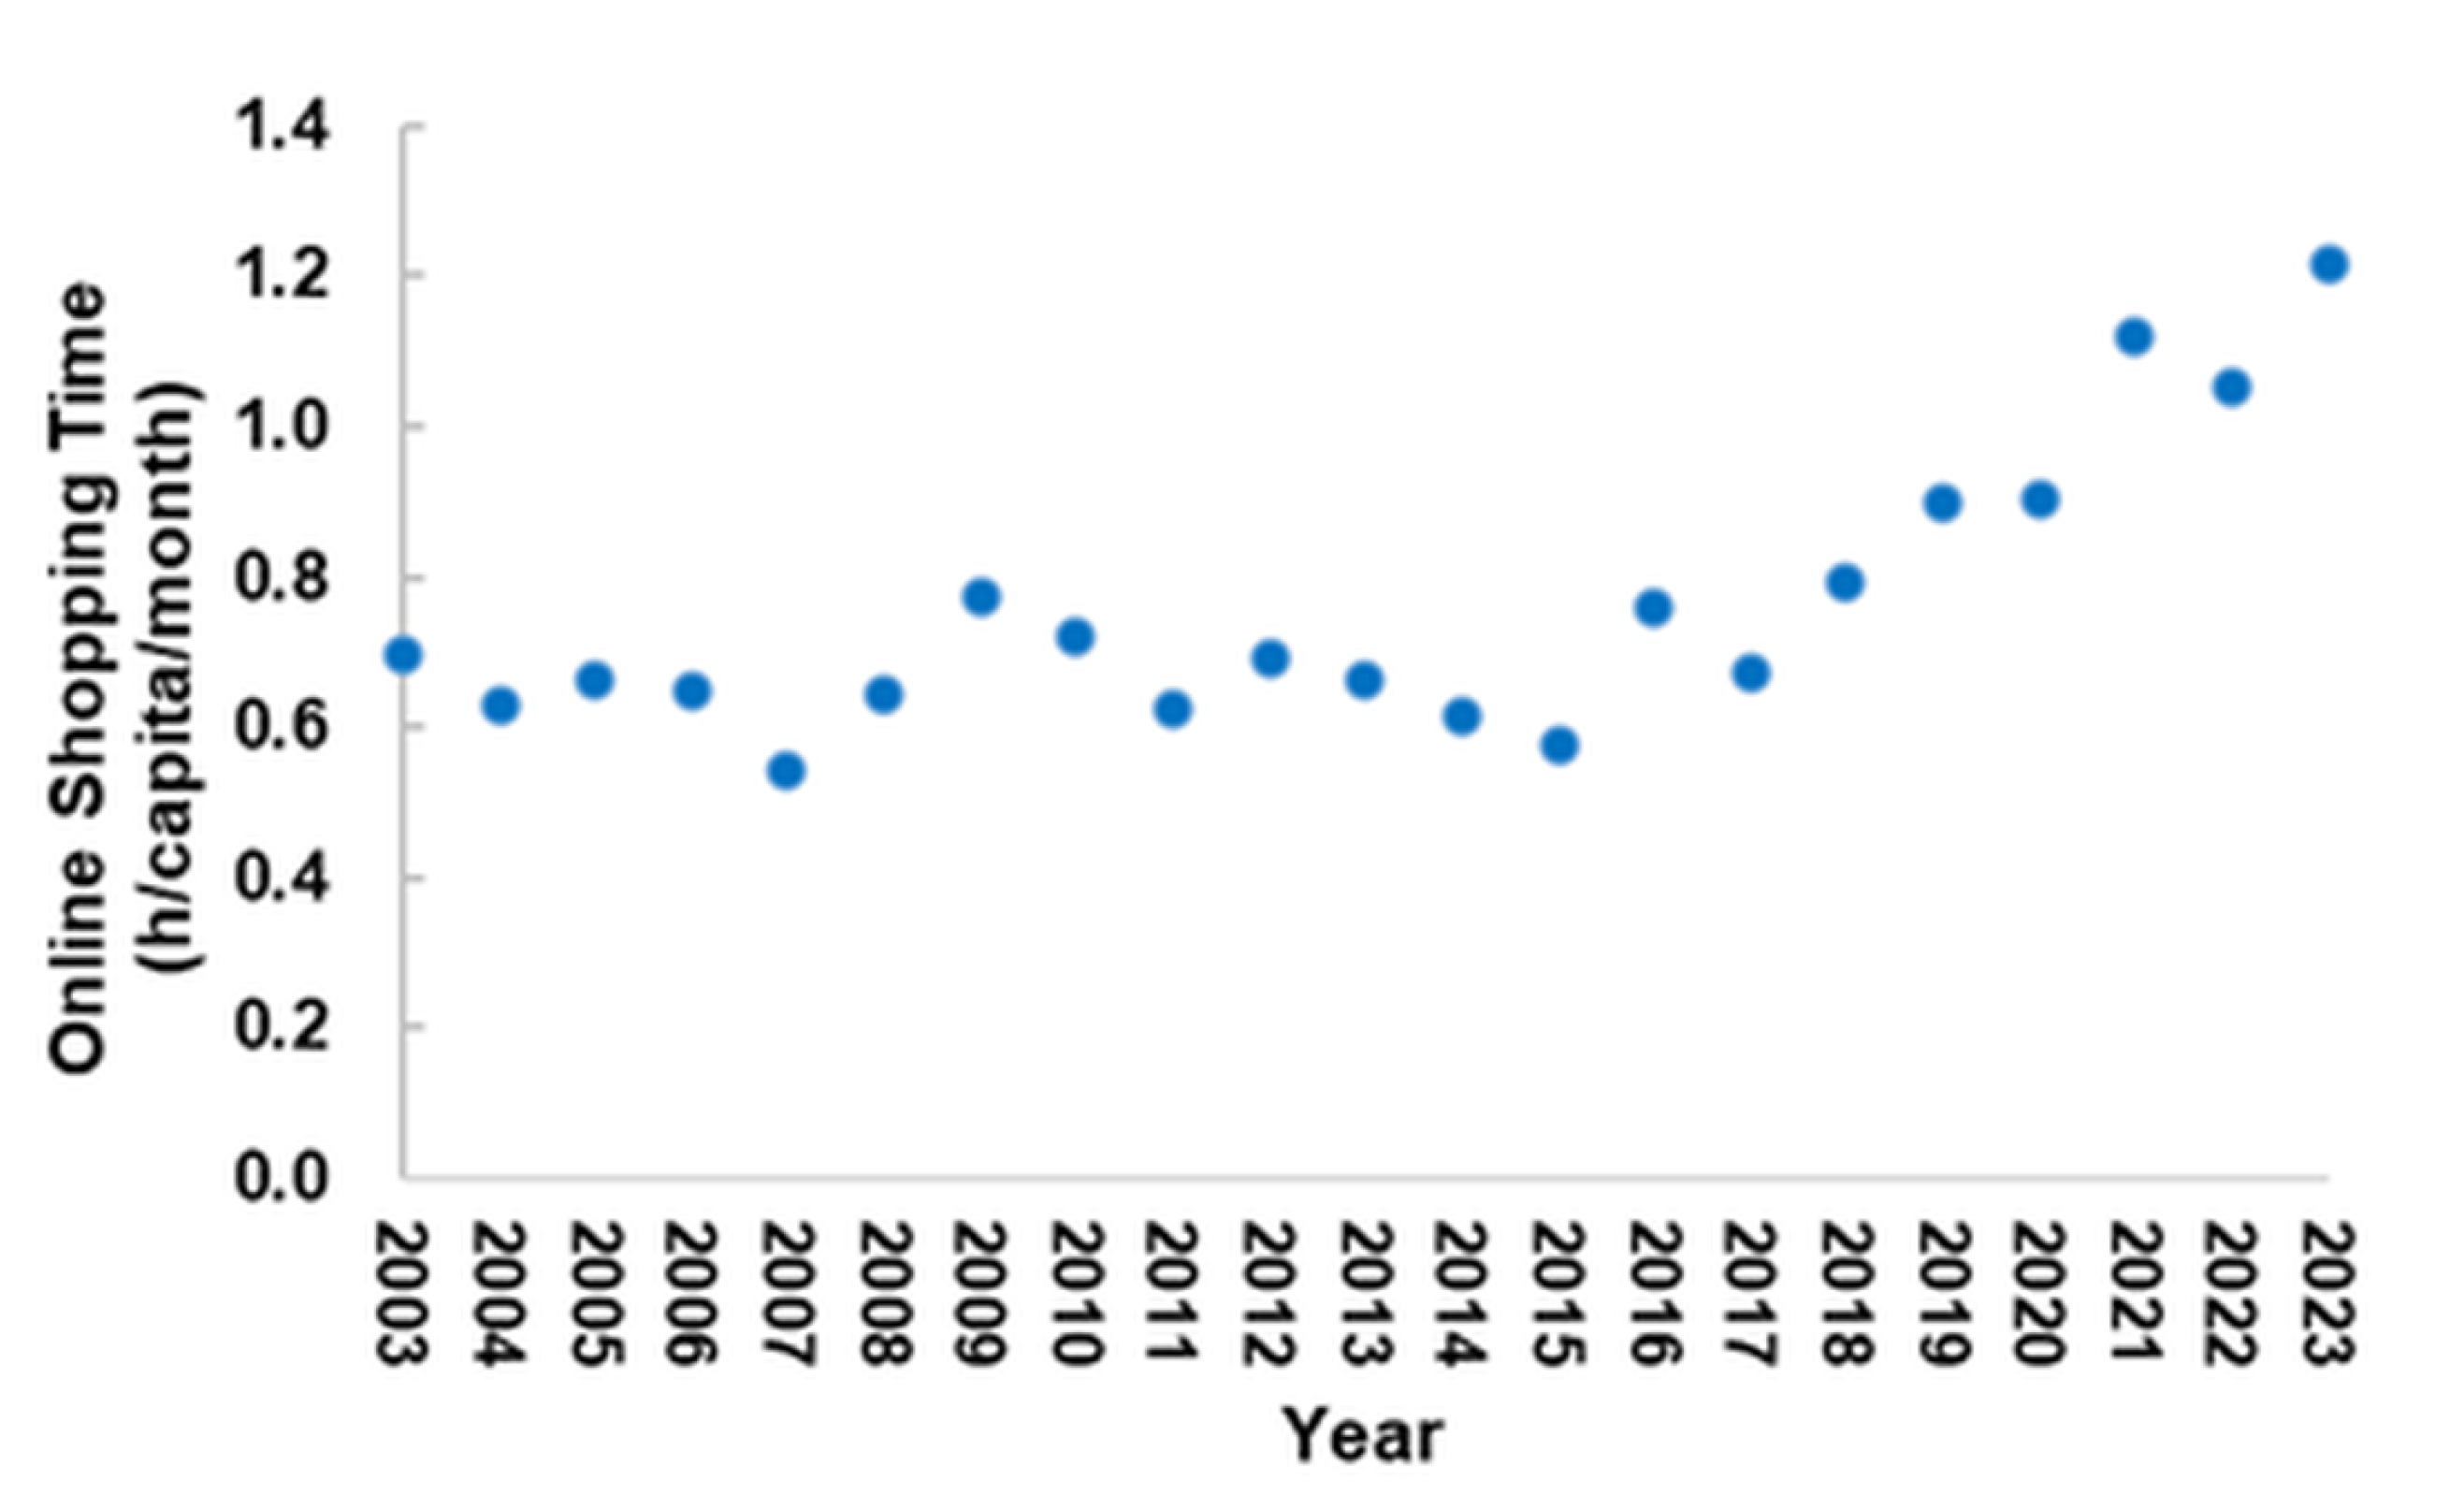
- Forecasting—The forecast cannot be “validated” today, one has to wait to compare the actual evolution in 2024–2030 with model predictions. We offer thoughts on the robustness of the forecast: We saw that the historical behavior for online shopping time did not show a single historical pattern; thus, two scenarios were developed—forecasting from 2003–2023 (slower growth) and 2015–2025 (faster growth). We rely on Monte Carlo simulation and the two online shopping growth scenarios to characterize uncertainty in the forecast. We believe this is a careful treatment of uncertainty associated with extrapolating historical trends. It is always possible that future disruptions change the trajectory, such uncertainty is inherent in forecasting. We argue that a retrospective forecast is useful in planning, when utilizing it is important to monitor trends to detect disruptive changes. Expert judgment is another approach used in forecasting, sometimes individuals assert their vision, while in expert elicitation, the collective opinion of a group of experts is developed. We do not comment on the relative accuracy of retrospective versus expert forecasting, but do want to report relevant expert assessments. While there are no formal expert elicitations forecasting e-commerce growth, there is a variety of prospective views from individual experts/teams. Ref. [55] predicts that U.S. e-commerce will continue its rapid expansion, reaching USD1.7 trillion in sales by 2028 at a modest and stable growth of around 8.5% annually, which lies within the growth rate range used in our model (3.6–10.1%, see details in [42]). McKinsey suggests that while U.S. online sales accelerated to 18% annual growth between 2019 and 2023, they “could now normalize at a more modest but still healthy growth rate” of around 6% a year, close to pre-pandemic rates [56].
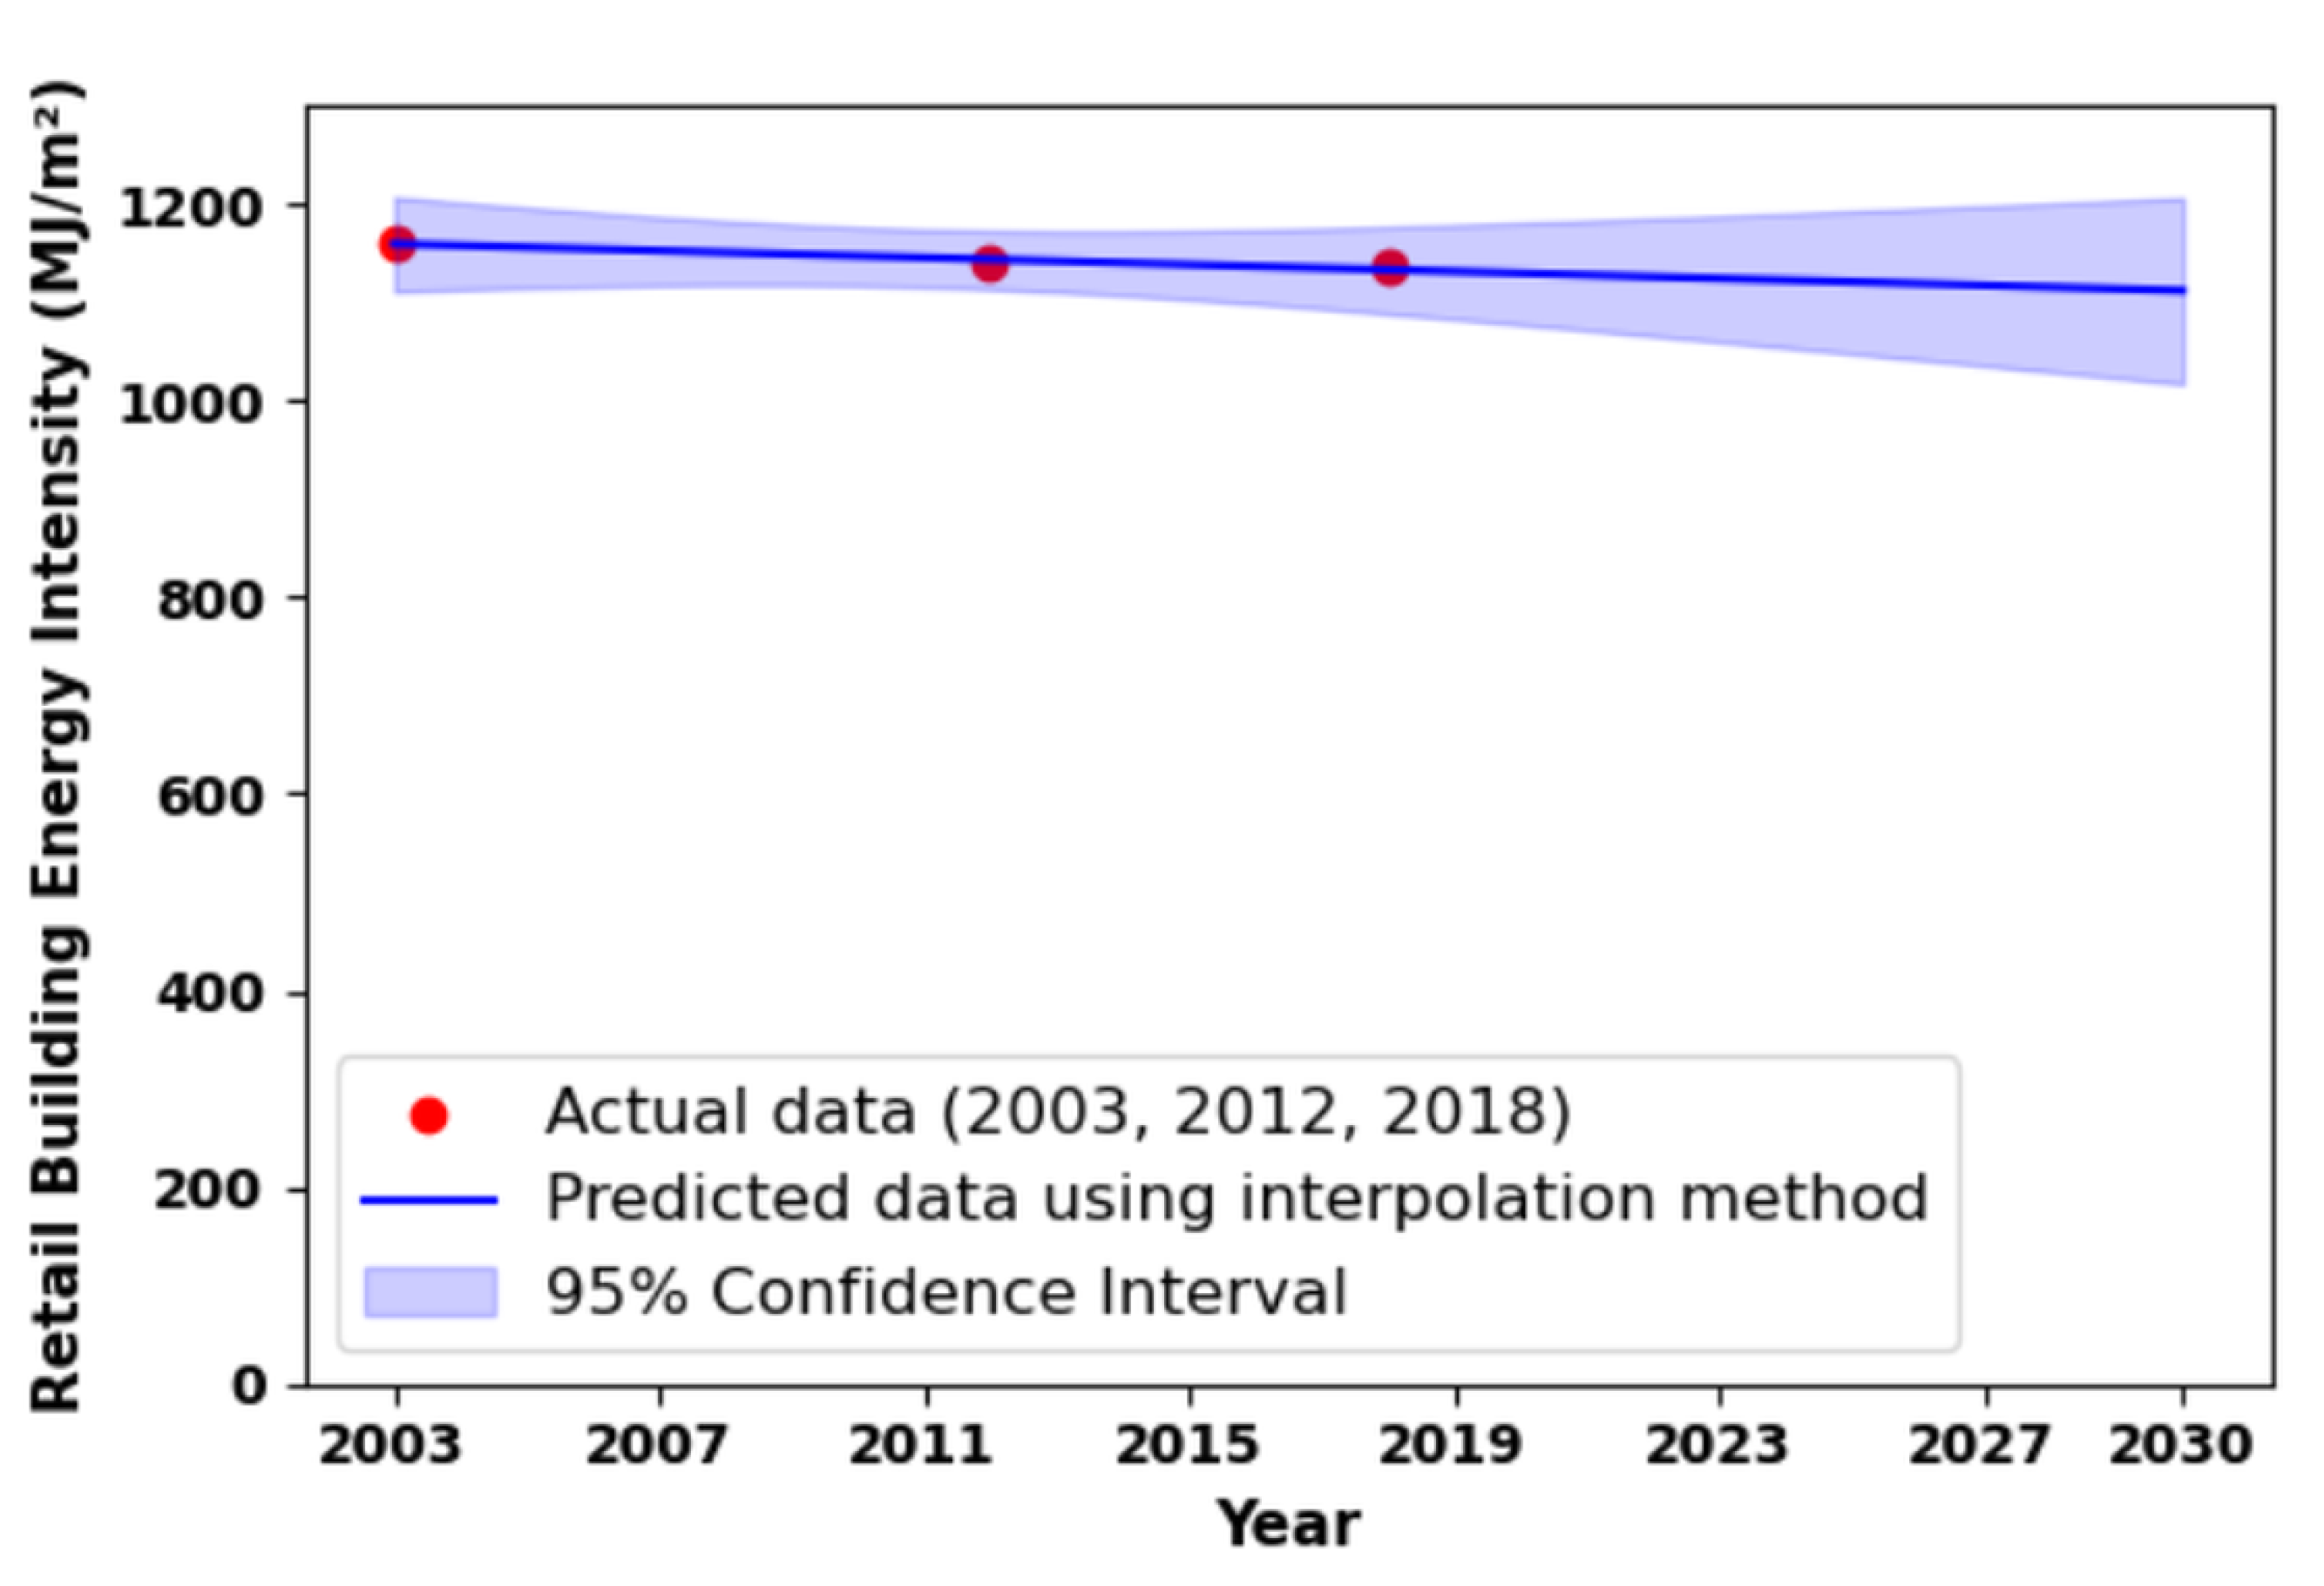
- Assumptions, Caveats, and Uncertainties—Data limitations led to a number of assumptions with modeling and construction of time series to run the models. The lack of a direct measure of online shopping time in ATUS led to estimating it based on total non-store shopping time minus “other” shopping time (e.g., garage sales); the latter assumed constant because of historical data. There is no annual source of data in the U.S. on retail space and retail energy use, so we estimate annual figures via a combination of extrapolation of data from 2003, 2012, and 2018 from CBECS and annual data on total commercial building space from CoStar. The evident technological progress in e-commerce suggests it must be accounted for to explain consumer behavior, which we accomplish via definition of K (shopping efficiency), based on the idea that total equivalent shopping time should be constant. Pre-e-commerce shopping time data supports these assumptions and there are prior examples of constant time budgets for an activity type, particularly transport [57]. While we believe we have explained their logical basis and they do explain historical trends well, they are all assumptions. Improvements in data availability would improve estimations of the relationship between online shopping and retail buildings, as well as transport and other activities it influences. In particular, recall that ATUS data on shopping time aggregates all retail purchases in into a single measure. As the adoption rate of e-commerce varies by sector, forecasting using the aggregate is presumably less accurate further in the future. ATUS could call out online shopping as an activity, similar to time use surveys in some countries that already do this. Linking the U.S. Consumer Expenditure Survey [58] with ATUS, e.g., one as a sub-cohort of the other, would open potential for many analyses clarifying linkages between activities and purchase behavior. One-off surveys could clarify how consumers use online shopping for which products. While we hope to see more resolved analyses of relationships between e-commerce, consumer behavior and energy in the future, this work provides a first reference point for the connection between online shopping and the retail building sector.
Supplementary Materials
Author Contributions
Funding
Data Availability Statement
Conflicts of Interest
Appendix A. Experience Curve Model for Online Shopping Efficiency
References
- Anyanwu, O.C.; Kur, K.K. Impact of Energy Consumption on Industrial Sector Performance. Sage Open 2024, 14, 21582440241298856. [Google Scholar] [CrossRef]
- Haberl, H.; Löw, M.; Perez-Laborda, A.; Matej, S.; Plank, B.; Wiedenhofer, D.; Creutzig, F.; Erb, K.H.; Duro, J.A. Built structures influence patterns of energy demand and CO2 emissions across countries. Nat. Commun. 2023, 14, 3898. [Google Scholar] [CrossRef] [PubMed]
- Xuan, V.N. Energy factors affecting environmental pollution for sustainable development goals: The case of India. Energy Explor. Exploit. 2024, 43, 410–450. [Google Scholar] [CrossRef]
- Verwiebe, P.A.; Seim, S.; Burges, S.; Schulz, L.; Müller-Kirchenbauer, J. Modeling Energy Demand—A Systematic Literature Review. Energies 2021, 14, 7859. [Google Scholar] [CrossRef]
- Bhattacharyya, S.C.; Timilsina, G.R. Energy Demand Models for Policy Formulation: A Comparative Study of Energy Demand Models. Policy Research Working Paper 4866, World Bank. 2009. Available online: https://ssrn.com/abstract=1368072 (accessed on 14 October 2025).
- Kuster, C.; Rezgui, Y.; Mourshed, M. Electrical Load Forecasting Models: A Critical Systematic Review. Sustain. Cities Soc. 2017, 35, 257–270. [Google Scholar] [CrossRef]
- Williams, E.; Tagami, T. Energy Use in Sales and Distribution via E-Commerce and Conventional Retail: A Case Study of the Japanese Book Sector. J. Ind. Ecol. 2002, 6, 99–114. [Google Scholar] [CrossRef]
- Phoung, S.; Hittinger, E.; Guhathakurta, S.; Williams, E. Forecasting macro-energy demand accounting for time-use and telework. Energy Strategy Rev. 2024, 51, 101264. [Google Scholar] [CrossRef]
- Liu, K.; Guhathakurta, S.; Han, C.; Hittinger, E.; Phoung, S.; Williams, E. How Much Is US Office Building Space Reduced per Teleworker? Findings 2024. [Google Scholar] [CrossRef]
- Adibfar, A.; Gulhare, S.; Srinivasan, S.; Costin, A. Analysis and modeling of changes in online shopping behavior due to COVID-19 pandemic: A Florida case study. Transp. Policy 2022, 126, 162–176. [Google Scholar] [CrossRef]
- Jaller, M.; Pahwa, A. Evaluating the environmental impacts of online shopping: A behavioral and transportation approach. Transp. Res. Part D Transp. Environ. 2020, 80, 102223. [Google Scholar] [CrossRef]
- Han, C.; Guhathakurta, S.; Hittinger, E.; Liu, K.; Phoung, S.; Williams, E. Empirical assessment of the relationship between teleworking frequency and residential energy use in the U.S.: Multilevel modeling and time use comparisons. Environ. Res. Infrastruct. Sustain. 2025, 5, 025018. [Google Scholar] [CrossRef]
- Jiang, P.; Van Fan, Y.; Klemeš, J.J. Impacts of COVID-19 on energy demand and consumption: Challenges, lessons and emerging opportunities. Appl. Energy 2021, 285, 116441. [Google Scholar] [CrossRef]
- Yoo, S.; Eom, J.; Han, I. Factors Driving Consumer Involvement in Energy Consumption and Energy-Efficient Purchasing Behavior: Evidence from Korean Residential Buildings. Sustainability 2020, 12, 5573. [Google Scholar] [CrossRef]
- Composto, J.W.; Weber, E.U. Effectiveness of behavioural interventions to reduce household energy demand: A scoping review. Environ. Res. Lett. 2022, 17, 063005. [Google Scholar] [CrossRef]
- Cai, Y.; Cude, B.J. Online Shopping. In Handbook of Consumer Finance Research, 2nd ed.; Xiao, J.J., Ed.; Springer: Cham, Switzerland, 2016; pp. 339–355. [Google Scholar] [CrossRef]
- Rashaduzzaman, M. Influence of Convenience, Time-Savings, Price, and Product Variety on Amazon Prime Members and Non-Prime Shoppers’ Online Apparel Purchase Intention. Ph.D. Thesis, University of Nebraska–Lincoln, Lincoln, Nebraska, 2020. Available online: https://digitalcommons.unl.edu/textilesdiss/16/ (accessed on 14 October 2025).
- Mishra, A.K. Understanding Consumer Behaviour in the Digital Age: A Study of Online Shopping Habits. Shodha Prabha 2023, 48, 84–93. Available online: https://www.academia.edu/110340622/UNDERSTANDING_CONSUMER_BEHAVIOUR_IN_THE_DIGITAL_AGE_A_STUDY_OF_ONLINE_SHOPPING_HABITS (accessed on 14 October 2025).
- Hjort, K.; Lantz, B. The impact of returns policies on profitability: A fashion e-commerce case. J. Bus. Res. 2016, 69, 4980–4985. [Google Scholar] [CrossRef]
- U.S. Census Bureau. Quarterly Retail E-Commerce Sales Report. 2024. Available online: https://www.census.gov/retail/ecommerce.html (accessed on 13 December 2024).
- UPS. UPS Pulse of the Online Shopper™ Study. 2017. Available online: https://vmn-logistiek.imgix.net/uploads/2017/06/UPS_Pulse-of-the-Online-Shopper_2017-1.pdf (accessed on 4 October 2025).
- Van Loon, P.; Deketele, L.; Dewaele, J.; McKinnon, A.; Rutherford, C. A comparative analysis of carbon emissions from online retailing of fast moving consumer goods. J. Clean. Prod. 2015, 106, 478–486. [Google Scholar] [CrossRef]
- Shi, K.; Vos, J.D.; Yang, Y.; Witlox, F. Does e-shopping replace shopping trips? Empirical evidence from Chengdu, China. Transp. Res. Part A Policy Pract. 2019, 122, 21–33. [Google Scholar] [CrossRef]
- Siragusa, C.; Tumino, A. E-grocery: Comparing the environmental impacts of the online and offline purchasing processes. Int. J. Logist. Res. Appl. 2021, 25, 1164–1190. [Google Scholar] [CrossRef]
- Ding, Y.; Lu, H. The interactions between online shopping and personal activity travel behavior: An analysis with a GPS-based activity travel diary. Transportation 2017, 44, 311–324. [Google Scholar] [CrossRef]
- Xi, G.; Zhen, F.; Cao, X.; Xu, F. The interaction between e-shopping and store shopping: Empirical evidence from Nanjing, China. Transp. Lett. 2018, 12, 157–165. [Google Scholar] [CrossRef]
- Matthews, H.S.; Hendrickson, C.T.; Soh, D.L. Environmental and Economic Effects of E-Commerce: A Case Study of Book Publishing and Retail Logistics. Transp. Res. Rec. J. Transp. Res. Board 2001, 1763, 6–12. [Google Scholar] [CrossRef]
- Pålsson, H.; Pettersson, F.; Winslott Hiselius, L. Energy consumption in e-commerce versus conventional trade channels—Insights into packaging, the last mile, unsold products and product returns. J. Clean. Prod. 2017, 164, 765–778. [Google Scholar] [CrossRef]
- Zhao, Y.B.; Wu, G.Z.; Gong, Y.X.; Yang, M.Z.; Ni, H.G. Environmental benefits of electronic commerce over the conventional retail trade? A case study in Shenzhen, China. Sci. Total Environ. 2019, 679, 378–386. [Google Scholar] [CrossRef] [PubMed]
- Bureau of Labor Statistics. American Time Use Survey. 2024. Available online: https://www.bls.gov/tus/ (accessed on 3 October 2024).
- U.S. Energy Information Administration. Commercial Buildings Energy Consumption Survey (CBECS). 2025. Available online: https://www.eia.gov/consumption/commercial/ (accessed on 14 October 2025).
- Romm, J.; Rosenfeld, A.; Herrmann, S. The Internet Economy and Global Warming: A Scenario of the Impact of E-Commerce on Energy and the Environment. Technical Report, Center for Energy and Climate Solutions, Global Environment and Technology Foundation. 1999. Available online: https://p2infohouse.org/ref/04/03784/0378401.pdf (accessed on 14 October 2025).
- Schneier, M. The Death Knell for the Bricks-and-Mortar Store? Not Yet. The New York Times, 2017. Available online: https://www.nytimes.com/2017/11/13/fashion/shopping-online-retail.html (accessed on 14 October 2025).
- Helm, S.; Kim, S.H.; Van Riper, S. Navigating the ‘retail apocalypse’: A framework of consumer evaluations of the new retail landscape. J. Retail. Consum. Serv. 2020, 54, 101683. [Google Scholar] [CrossRef]
- Tiwari, A.; Ghorai, S.; Bhar, A.; Bhattacharyya, S.K. E-commerce Revolution: Exploring the Impact of Online Shopping on Traditional Retail. Int. J. Res. Appl. Sci. Eng. Technol. 2023, 11, 2221–2226. [Google Scholar] [CrossRef]
- Larson, N. The Retail Shift: Exploring Historical Changes in Store Footprints. 2023. Available online: https://knowledge-leader.colliers.com/nicole-larson/the-retail-shift-exploring-historical-changes-in-store-footprints/ (accessed on 14 October 2025).
- CoStar Group. CoStar Market and Submarket Reports and Analytic Data. 2025. Available online: https://product.costar.com/Market/#/search/map (accessed on 14 October 2025).
- Zhang, D.; Zhu, P.; Ye, Y. The Effects of E-commerce on the Demand for Commercial Real Estate. Cities 2016, 51, 106–120. [Google Scholar] [CrossRef]
- Caudill, R.J.; Luo, Y.; Wirojanagud, P.; Zhou, M. A lifecycle environmental study of the impact of e-commerce on electronic products. In Proceedings of the 2000 IEEE International Symposium on Electronics and the Environment, San Francisco, CA, USA, 10 May 2000; pp. 298–303. [Google Scholar] [CrossRef]
- Weber, C.L.; Koomey, J.G.; Matthews, H.S. The Energy and Climate Change Implications of Different Music Delivery Methods. J. Ind. Ecol. 2010, 14, 754–769. [Google Scholar] [CrossRef]
- Rizet, C.; Cornélis, E.; Browne, M.; Léonardi, J. GHG emissions of supply chains from different retail systems in Europe. Procedia-Soc. Behav. Sci. 2010, 2, 6154–6164. [Google Scholar] [CrossRef]
- Liu, K.; Guhathakurta, S.; Han, C.; Hittinger, E.; Phoung, S.; Williams, E. Online Shopping Time-Efficiency: An Experience Curve Approach; Golisano Institute for Sustainability: Rochester, NY, USA, 2025; manuscript under review. [Google Scholar]
- Fisher, K.; Gershuny, J.; Flood, S.M.; Roman, J.G.; Hofferth, S.L. American Heritage Time Use Study Extract Builder; Version 1.2 [dataset]; IPUMS: Minneapolis, MN, USA, 2018. [Google Scholar] [CrossRef]
- Brueckner, J.K.; Rosenthal, S.S. Tenant Riskiness, Contract Length, and the Term Structure of Commercial Leases. Working Paper 10189, CESifo. 2022. Available online: https://www.econstor.eu/handle/10419/271833 (accessed on 14 October 2025).
- Ferreira, A.; Pinheiro, M.; de Brito, J.; Mateus, R. Combined carbon and energy intensity benchmarks for sustainable retail stores. Energy 2018, 165, 877–889. [Google Scholar] [CrossRef]
- Vespa, J.; Medina, L.; Armstrong, D.M. Demographic Turning Points for the United States: Population Projections for 2020 to 2060. In Current Population Reports P25-1144; U.S. Census Bureau: Washington, DC, USA, 2020. Available online: https://www.census.gov/content/dam/Census/library/publications/2020/demo/p25-1144.pdf (accessed on 14 October 2025).
- Heck, N.; Smith, C.; Hittinger, E. A Monte Carlo approach to integrating uncertainty into the levelized cost of electricity. Electr. J. 2016, 29, 21–30. [Google Scholar] [CrossRef]
- U.S. Energy Information Administration. Residential Energy Consumption Survey (RECS). 2021. Available online: https://www.eia.gov/consumption/residential/ (accessed on 14 October 2025).
- U.S. Department of Energy. Building Performance Database (BPD). 2020. Available online: https://www.energy.gov/eere/buildings/building-performance-database-bpd (accessed on 14 October 2025).
- U.S. Energy Information Administration. Annual Energy Outlook (AEO). 2023. Available online: https://www.eia.gov/outlooks/aeo/ (accessed on 14 October 2025).
- Das, S.; Sekar, A.; Chen, R.; Kim, H.C.; Wallington, T.J.; Williams, E. Impacts of Autonomous Vehicles on Consumers’ Time-Use Patterns. Challenges 2017, 8, 32. [Google Scholar] [CrossRef]
- Pettersson, F.; Winslott Hiselius, L.; Koglin, T. E-commerce and urban planning—Comparing knowledge claims in research and planning practice. Urban, Plan. Transp. Res. 2018, 6, 1–21. [Google Scholar] [CrossRef]
- Gauri, D.K.; Jindal, R.P.; Ratchford, B.; Fox, E.; Bhatnagar, A.; Pandey, A.; Navallo, J.R.; Fogarty, J.; Carr, S.; Howerton, E. Evolution of retail formats: Past, present, and future. J. Retail. 2021, 97, 42–61. [Google Scholar] [CrossRef]
- Craig, P.P.; Gadgil, A.; Koomey, J.G. What Can History Teach Us? A Retrospective Examination of Long-Term Energy Forecasts for the United States. Annu. Rev. Energy Environ. 2002, 27, 83–118. [Google Scholar] [CrossRef]
- Canaves, S. US Ecommerce Forecast 2024: Retail Sales Will Chart a Modest and Steady Course Through Ongoing Headwinds. eMarketer Report, EMARKETER Inc. 2024. Available online: https://www.emarketer.com/content/us-ecommerce-forecast-2024 (accessed on 14 October 2025).
- Gosling, S.; Pan, I.; Li, L.; Shenoy, S. What Do US Consumers Want from E-Commerce Deliveries? McKinsey & Company. 2025. Available online: https://www.mckinsey.com/industries/logistics/our-insights/what-do-us-consumers-want-from-e-commerce-deliveries (accessed on 12 October 2025).
- Stopher, P.R.; Ahmed, A.; Liu, W. Travel time budgets: New evidence from multi-year, multi-day data. Transportation 2017, 44, 1069–1082. [Google Scholar] [CrossRef]
- U.S. Bureau of Labor Statistics. Consumer Expenditure Survey. U.S. Department of Labor. 2025. Available online: https://www.bls.gov/cex/ (accessed on 14 October 2025).
- U.S. Census Bureau. Monthly Retail Trade Report. Advance Monthly Sales for Retail and Food Services. 2024. Available online: https://www.census.gov/retail/mrts/www/mrtssales92-present.xlsx (accessed on 14 October 2024).
- U.S. Bureau of Labor Statistics. Chained Consumer Price Index for All Urban Consumers: All Items in U.S. City Average [SUUR0000SA0]. 2024. Retrieved from FRED, Federal Reserve Bank of St. Louis. Available online: https://fred.stlouisfed.org/series/SUUR0000SA0 (accessed on 19 October 2024).
| Year | Lower | Preferred | Upper |
|---|---|---|---|
| 2024 | 4.9 | 4.9 | 5.4 |
| 2025 | 5.0 | 5.0 | 5.6 |
| 2026 | 5.0 | 5.1 | 5.8 |
| 2027 | 5.1 | 5.2 | 6.0 |
| 2028 | 5.2 | 5.4 | 6.1 |
| 2029 | 5.3 | 5.5 | 6.3 |
| 2030 | 5.4 | 5.6 | 6.6 |
| Equation | Inputs | Distribution | Parameters and Corresponding Source | |
|---|---|---|---|---|
| Historical Estimation | (11) | Commercial building space | None | Directly obtained from CoStar Database [37]. |
| Retail index | Normal | Mean and standard deviation from linear interpolation model for annual retail index. | ||
| Retail energy intensity | Normal | Mean and standard deviation from regression model for energy intensity. | ||
| Future Prediction | (7) | Online shopping time | Normal | Mean and standard deviation from regression model to predict future online shopping time. |
| Equivalent shopping time | None | Assumed to be 12 h/capita/month; see details in Section 2.2. | ||
| Other shopping time | None | Assumed to be 0.23 h/capita/month; see details in Section 2.2. | ||
| Online shopping efficiency K | Triangular | (lower, peak, upper) from [42]. | ||
| (10) | Population in the U.S. | None | ATUS provides population data for 2003–2023, then increases by 2.3 million annually until 2030 [46]. | |
| Retail energy intensity | Normal | Mean and standard deviation from regression model for energy intensity. | ||
| Coefficient | Normal | Mean and standard deviation of coefficient from regression model defined in Equation (1). | ||
| Coefficient | Normal | Mean and standard deviation of intercept from regression model defined in Equation (1). |
| Year | Online Shopping Time | In-Store Shopping Time | ||||||
| (h/capita/month) | (h/capita/month) | |||||||
| Slower E-Commerce Growth Scenario | Faster E-Commerce Growth Scenario | Slower E-Commerce Growth Scenario | Faster E-Commerce Growth Scenario | |||||
| Mean | 95% CI | Mean | 95% CI | Mean | 95% CI | Mean | 95% CI | |
| 2024 | 1.0 | 0.9∼1.1 | 1.3 | 1.2∼1.3 | 7.0 | 6.4∼7.6 | 5.7 | 5.1∼6.2 |
| 2025 | 1.0 | 0.9∼1.1 | 1.3 | 1.2∼1.4 | 6.7 | 6.0∼7.4 | 5.1 | 4.4∼5.7 |
| 2026 | 1.0 | 0.9∼1.2 | 1.4 | 1.3∼1.5 | 6.5 | 5.7∼7.2 | 4.6 | 3.7∼5.3 |
| 2027 | 1.1 | 0.9∼1.2 | 1.5 | 1.3∼1.6 | 6.2 | 5.4∼7.0 | 3.8 | 3.0∼4.9 |
| 2028 | 1.1 | 0.9∼1.2 | 1.5 | 1.4∼1.7 | 6.0 | 5.1∼6.9 | 3.4 | 2.5∼4.3 |
| 2029 | 1.1 | 1.0∼1.3 | 1.6 | 1.5∼1.8 | 5.7 | 4.7∼6.6 | 2.7 | 1.5∼3.8 |
| 2030 | 1.1 | 1.0∼1.3 | 1.7 | 1.5∼1.9 | 5.4 | 4.2∼6.5 | 2.0 | 0.6∼3.3 |
| Year | Slower E-Commerce Growth Scenario | Faster E-Commerce Growth Scenario | ||||||
| Retail Space (Million m2) | Energy Demand (PJ) | Retail Space (Million m2) | Energy Demand (PJ) | |||||
| Mean | 95% CI | Mean | 95% CI | Mean | 95% CI | Mean | 95% CI | |
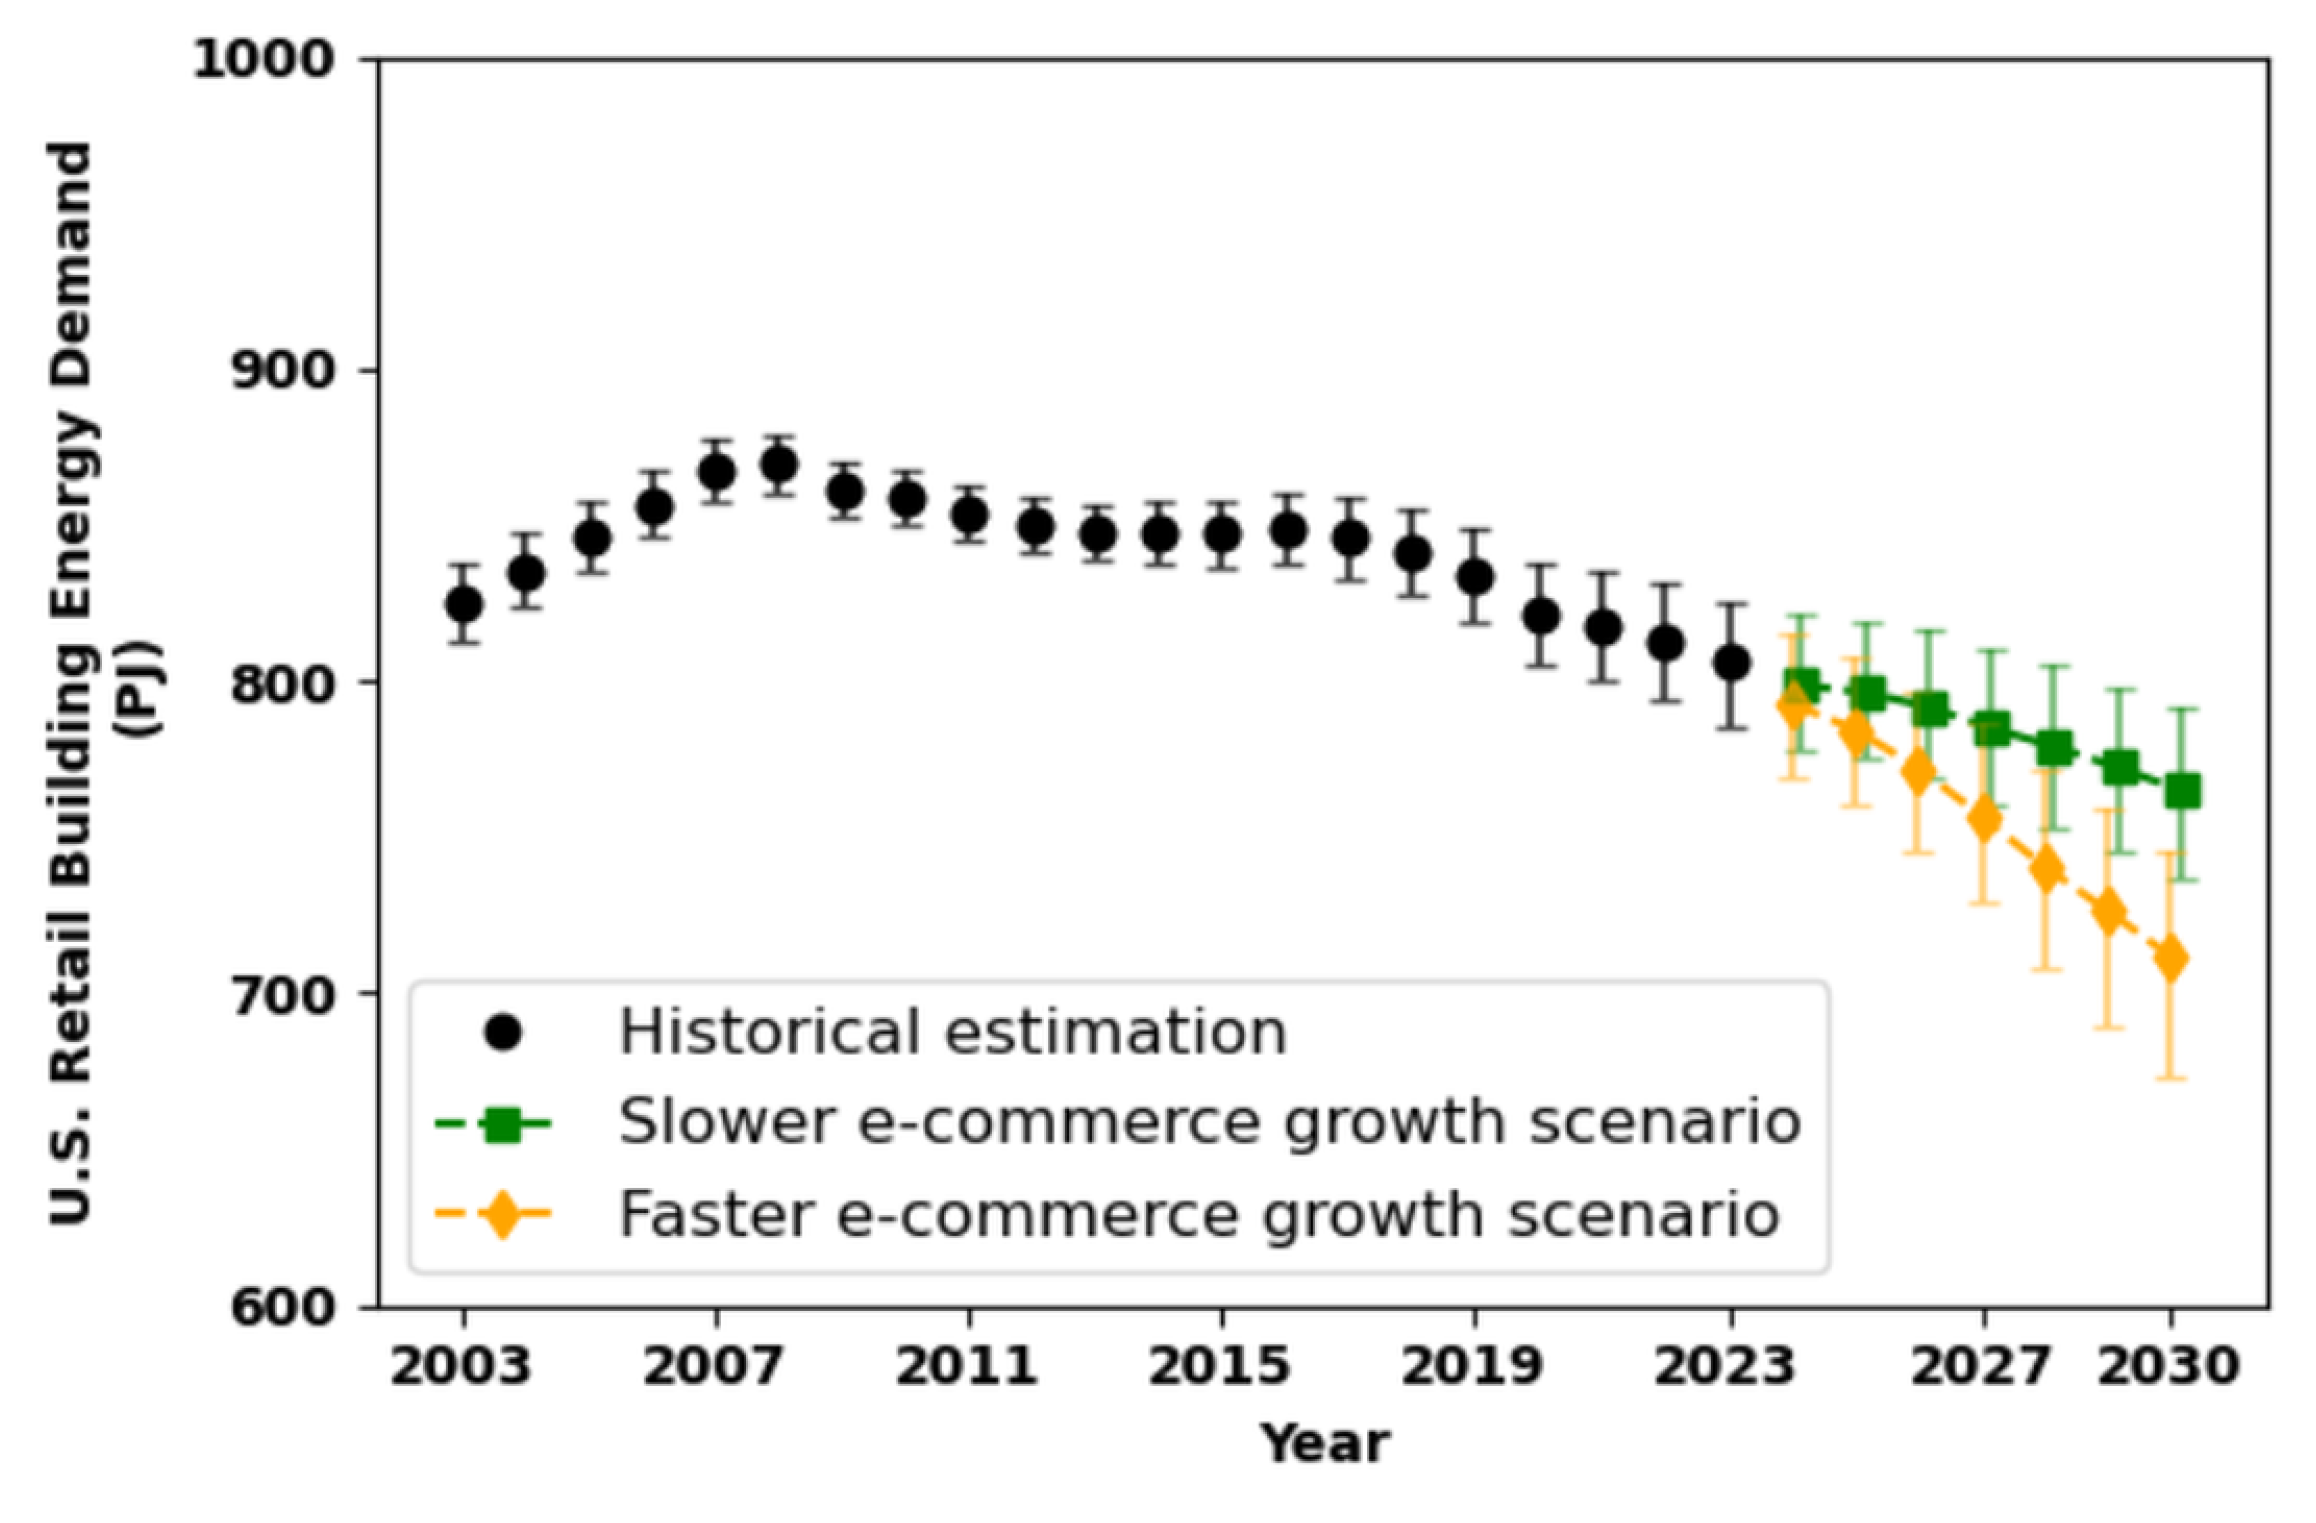
| 2024 | 710 | 690∼730 | 800 | 780∼820 | 710 | 690∼730 | 790 | 770∼820 |
| 2025 | 710 | 690∼730 | 800 | 770∼820 | 700 | 680∼720 | 780 | 760∼810 |
| 2026 | 710 | 690∼730 | 790 | 770∼810 | 690 | 670∼710 | 770 | 750∼800 |
| 2027 | 700 | 680∼720 | 780 | 760∼810 | 680 | 650∼700 | 760 | 730∼790 |
| 2028 | 700 | 680∼720 | 780 | 750∼800 | 660 | 640∼690 | 740 | 710∼770 |
| 2029 | 690 | 670∼720 | 770 | 740∼800 | 650 | 620∼680 | 730 | 690∼760 |
| 2030 | 690 | 660∼710 | 760 | 740∼790 | 640 | 610∼670 | 710 | 680∼750 |
| Slower E-Commerce Growth Scenario | Faster E-Commerce Growth Scenario | |
|---|---|---|
| Annual growth of online shopping time | +0.022 h/capita/month each year | +0.074 h/capita/month each year |
| Time spent online shopping in 2030 | 1.1 h/capita/month | 1.7 h/capita/month |
| Time spent in-store shopping in 2030 | 5.4 h/capita/month | 2.0 h/capita/month |
| Retail space (2018 baseline) | 740 million m2 | |
| Retail space change (compared to 2018) | −4% to −10% | −9% to −18% |
| Retail energy demand (2018 baseline) | 840 Peta Joules | |
| Retail energy demand change (compared to 2018) | −6% to −12% | −11% to −20% |
Disclaimer/Publisher’s Note: The statements, opinions and data contained in all publications are solely those of the individual author(s) and contributor(s) and not of MDPI and/or the editor(s). MDPI and/or the editor(s) disclaim responsibility for any injury to people or property resulting from any ideas, methods, instructions or products referred to in the content. |
© 2025 by the authors. Licensee MDPI, Basel, Switzerland. This article is an open access article distributed under the terms and conditions of the Creative Commons Attribution (CC BY) license (https://creativecommons.org/licenses/by/4.0/).
Share and Cite
Liu, K.; Guhathakurta, S.; Han, C.; Hittinger, E.; Phoung, S.; Williams, E. The Impact of Online Shopping on Retail Building Space and Energy Demand in the U.S. Energies 2025, 18, 6178. https://doi.org/10.3390/en18236178
Liu K, Guhathakurta S, Han C, Hittinger E, Phoung S, Williams E. The Impact of Online Shopping on Retail Building Space and Energy Demand in the U.S. Energies. 2025; 18(23):6178. https://doi.org/10.3390/en18236178
Chicago/Turabian StyleLiu, Kun, Subhrajit Guhathakurta, Chaeyeon Han, Eric Hittinger, Sinoun Phoung, and Eric Williams. 2025. "The Impact of Online Shopping on Retail Building Space and Energy Demand in the U.S." Energies 18, no. 23: 6178. https://doi.org/10.3390/en18236178
APA StyleLiu, K., Guhathakurta, S., Han, C., Hittinger, E., Phoung, S., & Williams, E. (2025). The Impact of Online Shopping on Retail Building Space and Energy Demand in the U.S. Energies, 18(23), 6178. https://doi.org/10.3390/en18236178


