Article

Phosphoric Acid Addition: Insight into the Mechanism Governing Biochar Structural Evolution

by
Zhongwei Wang
1,
Sunwen Xia
1,
Xiaohan Ren
2,* and
Yong Dong
1,*
1
School of Nuclear Science, Energy and Power Engineering, Shandong University, 17923 Jingshi Road, Jinan 250061, China
2
Institute of Thermal Science and Technology, Shandong University, 17923 Jingshi Road, Jinan 250061, China
*
Authors to whom correspondence should be addressed.
Energies 2025, 18(23), 6165; https://doi.org/10.3390/en18236165
Submission received: 29 October 2025 / Revised: 17 November 2025 / Accepted: 20 November 2025 / Published: 25 November 2025

Abstract

Phosphoric acid (H3PO4) pretreatment is an effective method to improve biochar properties, yet its evolution mechanism remains incompletely elucidated. This study investigated the synergistic pyrolysis of H3PO4 and mottled bamboo at different temperatures in a fixed-bed reactor. Results showed that during impregnation, H3PO4 promoted the partial dissolution of hemicellulose and reduced cellulose polymerization, resulting in a decrease in the activation energy of the fast pyrolysis stage from 96.72 kJ/mol (pristine bamboo biochar, MB) to 75.75 kJ/mol (H3PO4-modified bamboo biochar, MB/H3PO4). With increasing temperature, the pore structure of the modified biochar was enhanced while its graphitization degree decreased, owing to the catalytic effect of H+ and the cross-linking action of the acid. Meanwhile, the addition of H3PO4 facilitated the rearrangement of oxygen-containing heterocycles, and the incorporation of small-molecule benzene rings further improved the aromatization degree of the modified biochar. In conclusion, it functions as a catalyst, reactant, and pore-expanding agent during pyrolysis. This study further broadens the understanding of biochar evolution mechanisms regulated by phosphorus-containing additives, and provides a theoretical basis for optimizing biochar properties and producing phosphorus-rich biochar.

1. Introduction

Recently, numerous countries worldwide have adopted carbon neutrality goals to address pollution and the greenhouse effect caused by fossil fuel use [1]. Biomass, a naturally occurring non-fossil organic material, is regarded as an ideal asset for sustainable energy solutions by virtue of its renewability, low cost, carbon neutrality, and net-zero emission properties [2,3]. Biochar is a carbonaceous solid material produced via the pyrolysis of biomass under oxygen-deficient or low-oxygen conditions, possessing advantages such as high carbon content, good stability, and wide applicability, and it is currently widely used in pollution control, soil improvement, and nutrient cycling [4,5,6]. The combination of biomass pyrolysis and biochar for non-fuel utilization is a promising negative carbon technology, which can be applied to produce biochar, bio-oil, and syngas [7].
The conversion of biomass resources into energy is primarily achieved through thermochemical processes including combustion, gasification, and pyrolysis [8,9,10]. Among these, biomass pyrolysis technology is regarded as the most promising approach for industrialization due to its advantages such as mild reaction conditions and highly tunable products [11]. The pyrolysis mechanism encompasses the evaporation of moisture, the release of volatiles, the formation of solid char, and subsequent thermal reactions of the volatiles with the char [12]. This process serves as a means to produce high-energy-density biofuels, including biochar, bio-oil, and non-condensable gases. However, the pristine biochar produced via direct pyrolysis is often inadequate for contemporary applications because of its underdeveloped physicochemical properties, such as low porosity, limited stability, insufficient functional groups, and a lack of active sites [13]. Therefore, to enhance the utilization value of biochar, researchers are currently attempting to modify biochar to improve its surface functional groups and pore structure, thereby increasing its potential in catalysis, energy storage, adsorption, and other fields [14,15,16]. There are various methods for biochar modification, such as acid treatment, alkali treatment, metal impregnation, and nitrogen doping, among others [17,18,19,20], among these, the addition of pyrolysis additives during the pyrolysis process is one of the most effective approaches to enhance the porosity and surface properties of biochar.
In recent years, phosphorus-rich compounds, particularly phosphoric acid and its salts, have garnered significant attention as low-cost and efficient pyrolysis catalysts and modifiers. Their appeal lies in their dual ability to enhance the quality of bio-oil and simultaneously upgrade biochar properties [21]. Lu et al. [22] found that the presence of K3PO4 could promote the decomposition of lignin to form phenolic compounds; when the weight loading of K3PO4 was approximately 7.42%, the yield of phenols reached a maximum, with a peak area of 42.8%. Zhurinsh et al. [23] employed hydrothermal treatment on birch wood impregnated with phosphoric acid, and observed an increased yield of L-glucose in the bio-oil, with the maximum yield exceeding 20%. Liu et al. [24] reported that the co-pyrolysis of apple wood with H3PO4 could effectively improve the properties of biochar; when the H3PO4-to-apple wood (H3PO4/AW) ratio was 0.5, the biochar yield reached a maximum of 58.6%. Phosphates, as additives, also exert a positive effect on the pore structure and surface functional groups of biochar. Yang et al. [25] observed that during the co-pyrolysis of sawdust and Ca(H2PO4)2 at 300 °C, the BET specific surface area of the biochar increased by nearly 14 times, while at 600 °C, it increased by nearly 7 times. Xiang et al. [26] reported a high-performance activated carbon (WAC-20/40) derived from phosphoric acid (70 wt.%) activation of bamboo shoot shells for methylene blue adsorption. It achieved a high adsorption capacity of 344.51 mg/g and a removal rate of 97.04% under optimized conditions, demonstrating excellent stability with a removal rate remaining above 77% even after four cycles.
Furthermore, phosphorus-rich biochar, known for its excellent adsorption capacity and high phosphorus content, is frequently employed as a heavy metal adsorbent or carbon-based fertilizer. Zhang et al. [27] found that a pre-aging impact of K3PO4 impregnation significantly enhanced the stability and adsorption performance of phosphorus-rich biochar. Within the preparation temperature range of 550–750 °C, the content of phosphorus-containing functional groups was the highest (reaching 116% of that in 350 °C), corresponding to the maximum adsorption capacity (exceeding 289 mg/g). Their study indicated that 550 °C was the optimal pyrolysis temperature, balancing energy efficiency and heavy metal adsorption. In addition, Luo et al. [28] reported a bifunctional phosphorus-rich biochar designed for carbon sequestration and heavy metal immobilization. Their research demonstrated that the carbon sequestration rate in soil amended with phosphoric acid-modified biochar (59.6–67.0%) was significantly higher than that with pristine biochar (43.2–46.6%). Concurrently, these phosphorus-composite biochars exhibited a substantially stronger capacity for immobilizing lead and cadmium (31.3–92.3%), greatly surpassing that of pristine biochar (9.5–47.2%).
However, most studies on the co-pyrolysis of phosphoric acid and biomass to produce modified biochar have focused on pore expansion, adsorption capacity, and stability, and lack a precise explanation of the evolution mechanism of phosphoric acid-modified biochar. In addition, the various roles of phosphoric acid during co-pyrolysis, such as its functions as a catalyst, reactant, and pore-expanding agent, have not been thoroughly investigated. Therefore, this study investigated the co-pyrolysis process of phosphoric acid and biomass in a fixed-bed reactor at different temperatures ranging from 400 °C to 800 °C, with a focus on analyzing the properties and evolution mechanism of the modified biochar. This study can further expand the understanding of the evolution mechanism of biochar regulated by phosphorus-containing additives and is expected to provide valuable guidance for the production of phosphorus-rich biochar.

2. Materials and Methods

2.1. Biomass Materials

Mottled bamboo is a potential forest waste that is widely distributed in China. The MB samples were collected from Guangde City, Anhui Province, China. After being dried, the samples were crushed into powder with a particle size of less than 0.125 mm. The mottled bamboo used in this study contains 48.43% C, 5.527% H, 39.76% O, 0.42% N by Elemental analysis and 72.46% Volatile matter, 2.30% Ash content, 6.11% Moisture and 19.13% Fixed carbon by industrial Analysis; these elemental composition data were determined using a CHNS elemental analyzer (Vario EL cube, Elementar GmbH, Frankfurt, Germany).

2.2. Biochar Preparation

200 mL of a phosphoric acid (H3PO4) solution with a mass fraction of 10% was mixed with 20 g of mottled bamboo. The mixture was magnetically stirred in a water bath at 80 °C for 2 h, followed by cooling to room temperature; this step ensured effective impregnation and adsorption of H3PO4 onto the biomass prior to pyrolysis. The biomass pyrolysis reaction was conducted in a fixed-bed reactor system, which consists of a tube furnace containing a vertical quartz tube (760 mm in height, 45 mm in inner diameter) and a condensation unit. Before the experiment, approximately 2 g of the biomass sample was placed in a quartz basket suspended by a metal wire at the top of the quartz tube. The system was then purged with a nitrogen (N2) gas flow at 800 mL/min for 15–20 min to maintain an inert atmosphere. Initially, the reactor was heated to the target temperature (400, 500, 600, 700, 800 °C) at a heating rate of 20 °C/min. After the temperature stabilized, the quartz basket was quickly lowered to the center of the tube furnace. The sample was then pyrolyzed for 1 h, during which volatile products were swept away by a N2 gas flow at 200 mL/min. As shown in Figure 1, the condensable volatiles after the reaction are collected as liquid products through a condensation bulb immersed in ice water. After drying and cleaning, residual gases are collected in a gas bag. The condensed liquid and non-condensable gas were disposed of in an environmentally sound manner. Finally, the reactor was cooled to room temperature under a N2 atmosphere to obtain the biochar product.
Biochar collected from the pyrolysis of pristine mottled bamboo was labeled as MB, while the H3PO4-modified biochar was labeled as MB/H3PO4.

2.3. Characterization of Biochar

Thermogravimetric analysis (TGA) of MB and MB/H3PO4 was performed using a thermogravimetric analyzer (Mettler TGA/DSC 3+, Mettler Toledo, Switzerland) to obtain thermogravimetry (TG) curves and derivative thermogravimetry (DTG) curves. The samples were heated to 900 °C at a heating rate of 10 °C/min under a nitrogen atmosphere. Additionally, pyrolysis kinetic analysis was conducted based on the TG curves, and the activation energy of different reaction stages during pyrolysis was calculated.
The surface morphology of biochar was observed using a scanning electron microscope (SEM, Regulus 8100, Hitachi, Japan) at an accelerating voltage of 5 kV. The ultimate analysis results of biochar were determined using a CHNS elemental analyzer (Vario EL cube, Elementar GmbH, Germany). The crystal structure and phase composition were identified via an X-ray diffraction (XRD) analyzer (SmartLab, Rigaku, Japan) with a 2θ angle range of 10° to 80°.
Raman spectra of the samples in the wavenumber range of 800 cm−1 to 2000 cm−1 were acquired using an inVia Raman microscope (Renishaw RM2000, Renishaw, UK) under experimental temperatures of 400 °C, 500 °C, 600 °C, 700 °C, and 800 °C, and the spectra were subsequently deconvoluted into five characteristic peaks using OriginPro 2022 software. X-ray photoelectron spectroscopy (XPS) analysis was carried out with an Escalab 250Xi instrument (Thermo Fisher Scientific, Waltham, MA, USA) to determine the types and contents of carbon-containing and oxygen-containing functional groups on the biochar surface. A Fourier transform infrared spectrometer (FTIR; VERTEX 70, Bruker, Germany) was used to identify the composition of surface functional groups of the samples, with a wavenumber range of 4000–400 cm−1 and a resolution of 4 cm−1. Furthermore, two-dimensional correlation infrared spectroscopy (2D-PCIS) was constructed based on the FTIR data.

2.4. Pyrolysis Kinetics Analysis Method

In order to better reveal the pyrolysis catalysis of phosphoric acid additives and to study the mechanism of pyrolysis reaction, kinetic analyses were carried out on the basis of effective control of pyrolysis reaction.
The non-isothermal pyrolysis process was described by the Arrhenius equation as Equation (1):
d α d t = A e x p E a R T f α
where f(α) is the temperature-independent mechanism function, Ea (kJ/mol) is the activation energy, R is the universal gas constant (8.314 J/(mol ⋅ K)), T (K) is the reaction temperature, A (min−1) is the pre-exponential factor, and α (%) is the conversion rate.
α can be defined as Equation (2):
α = m i m t m i m f
where mi, mt, and mf are the initial mass of the sample, the sample mass at time t (min), and the final mass of the sample in the reaction, respectively.
For a given heating rate, β = dT/dt [29], the equation can be expressed as Equation (3):
d α   f α = 1 β A e x p E a R T d T
Integrate both sides of Equation (3) to obtain the following Equation (4):
G α = 0 α d α f α = A β T 0 T exp E a R T d T
where G(α) is the integral form of mechanism function f(α).
Based on the TG data, the kinetic parameters of the samples were estimated using the Coats-Redfern (CR) method in integral form, which is one of the current fitting methods and has been widely used for kinetic analysis of biomass pyrolysis [30]. Based on the above equations, the expression for the Coats-Redfern (CR) method is presented as following Equation (5):
ln G α T 2 = ln A R β E a E a R T
A plot of ln(G(α)/T2) versus 1/T can be fitted as a straight line, from which values of Ea and A can be acquired from the slope and the intercept.

2.5. D-PCIS Analysis Method

Due to the severe peak overlap in Fourier transform infrared (FTIR) spectroscopy, which makes accurate spectral interpretation difficult, two-dimensional perturbation-based correlation infrared spectroscopy (2D-PCIS) was introduced in this study to analyze the changes in biochar functional groups. 2D-PCIS was generated by processing the collected FTIR spectral data using 2D-shige software (Morita Team, Kansai University, Japan), based on the two-dimensional correlation technique proposed by Noda et al. [31,32]. 2D-PCIS is categorized into synchronous (Φ (v1, v2)) and asynchronous (ψ (v1, v2)) correlation infrared spectra, where v1 and v2 represent the wavenumbers corresponding to different functional groups. The synchronous correlation intensity Φ (v1, v2) denotes the synchronous or consistent changes in spectral intensity at v1 and v2 with increasing temperature, while the asynchronous correlation intensity ψ (v1, v2) represents the asynchronous or sequential changes in spectral intensity at these two wavenumbers. The synchronous correlation infrared spectrum is symmetric along the diagonal and consists of autopeaks and cross-peaks. Correlation peaks located on the diagonal are referred to as autopeaks. The intensity of autopeaks is always positive, representing the overall dynamic fluctuation degree of spectral intensity at the corresponding wavenumbers. Cross-peaks are situated in the off-diagonal regions of the synchronous spectrum; their intensities can be either positive or negative, reflecting the synchronous variations in spectral signals at different wavenumbers. In contrast, the asynchronous correlation infrared spectrum contains only cross-peaks (no autopeaks) and the cross-peaks are asymmetric with respect to the diagonal. Asynchronous cross-peaks only appear when the spectral intensities at two given wavenumbers (v1 and v2) undergo anisotropic changes (e.g., delayed or accelerated changes). Therefore, the presence of asynchronous cross-peaks indicates that the spectra originate from different sources or functional groups in distinct molecular environments. Similarly, the cross-peaks in the asynchronous spectrum can be either positive or negative, and the sign of these cross-peaks can help determine the order of changes in spectral bands under external perturbation [33]. Noda’s rules, which are used to interpret cross-peaks and confirm the direction and order of intensity changes, are provided in Table S1.

3. Results and Discussion

3.1. Pyrolysis Properties Determined by Thermogravimetric Analyses

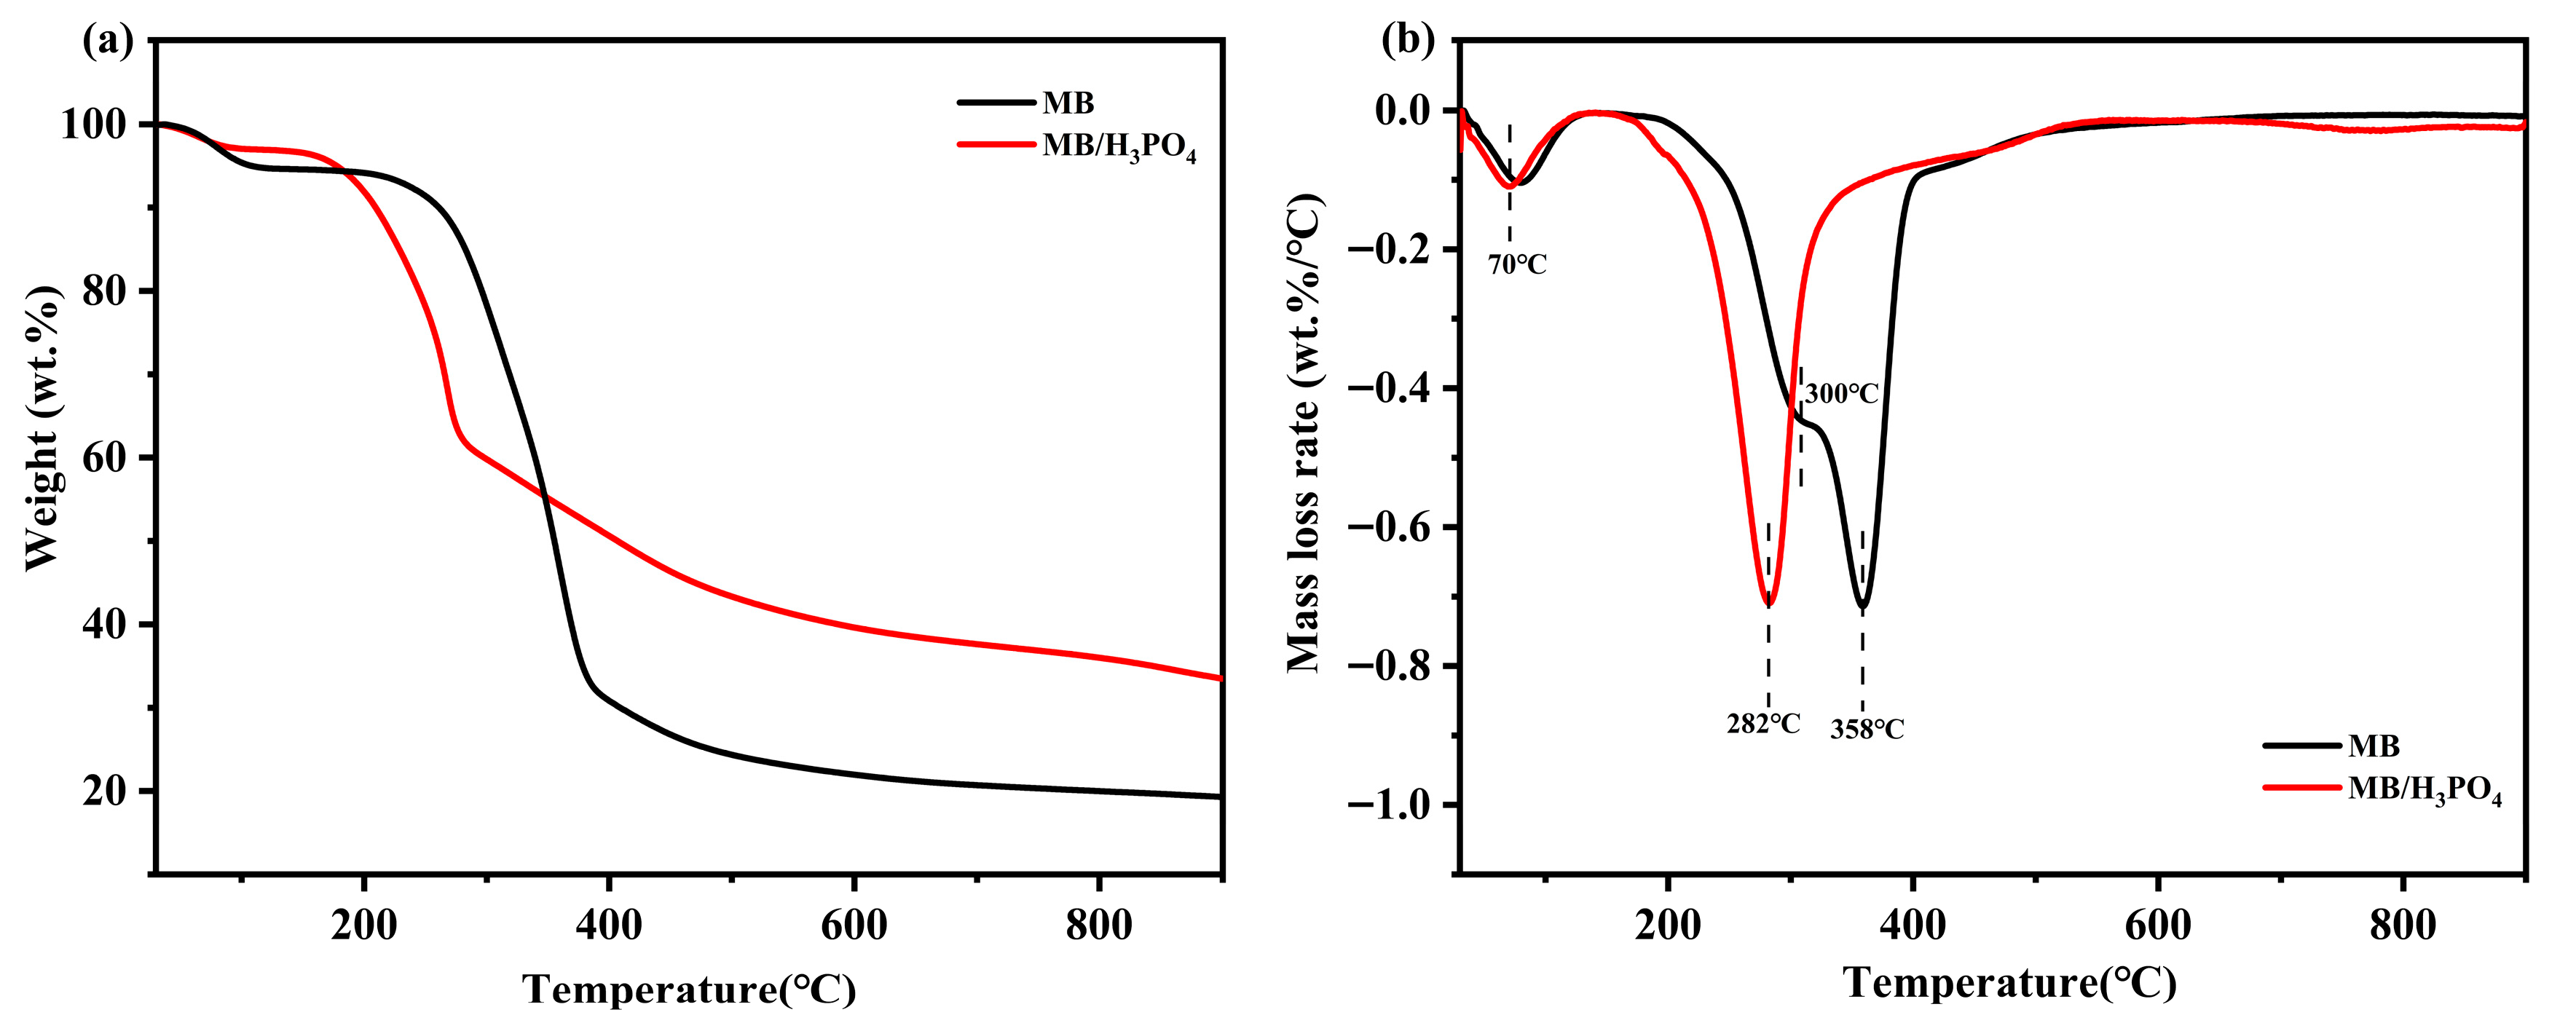
Figure 2 presents the thermogravimetric analysis (TGA) and corresponding differential thermogravimetric (DTG) curves for MB and MB/H3PO4. As shown in Figure 2a, the pyrolysis of MB exhibits an initial mass loss of approximately 9 wt% up to 260 °C, attributed primarily to moisture dehydration and drying. Subsequently, a significant mass reduction occurs between 260 °C and 380 °C, corresponding mainly to the decomposition of hemicellulose and cellulose [34]. Beyond 380 °C, the mass of MB gradually decreases due to the slower decomposition of lignin, leading to biochar formation. At the final pyrolysis temperature of 900 °C, the residual mass of MB was 19% of the original. Following the addition of H3PO4, the MB/H3PO4 sample showed an 8 wt% mass loss below 200 °C during the thorough dehydration/drying stage. A sharp mass loss was then observed between 200 °C and 280 °C, likely resulting from the accelerated decomposition of hemicellulose and cellulose catalyzed by H3PO4. The residual mass of MB/H3PO4 at 900 °C was 33.5%, significantly higher than that of the untreated MB (19%). This increased char yield can be attributed to two factors: (1) the introduction of additional non-volatile phosphate compounds into the residue, and (2) the catalytic effect of H3PO4 in promoting the charring of mottled bamboo and enhancing the char formation efficiency [35].
As illustrated in Figure 2b, the DTG curve for MB pyrolysis exhibits a minor peak at 70 °C, corresponding to the thorough dehydration/drying process. A prominent peak is observed at 358 °C, attributable to cellulose decomposition. Additionally, a shoulder peak at approximately 300 °C is associated with hemicellulose degradation. Upon the introduction of H3PO4, the shoulder peak preceding the main degradation peak (indicative of hemicellulose decomposition) becomes less distinct. Furthermore, the maximum mass loss rate peak for cellulose decomposition shifts to a significantly lower temperature of 282 °C. This shift indicates that the decomposition of hemicellulose is attenuated, while cellulose decomposition is facilitated at a reduced temperature. This phenomenon likely stems from the phosphoric acid promoting the cleavage of side chains and linkages within the mottled bamboo structure during impregnation. This process leads to partial dissolution of hemicellulose and a reduction in the degree of polymerization of cellulose [35].
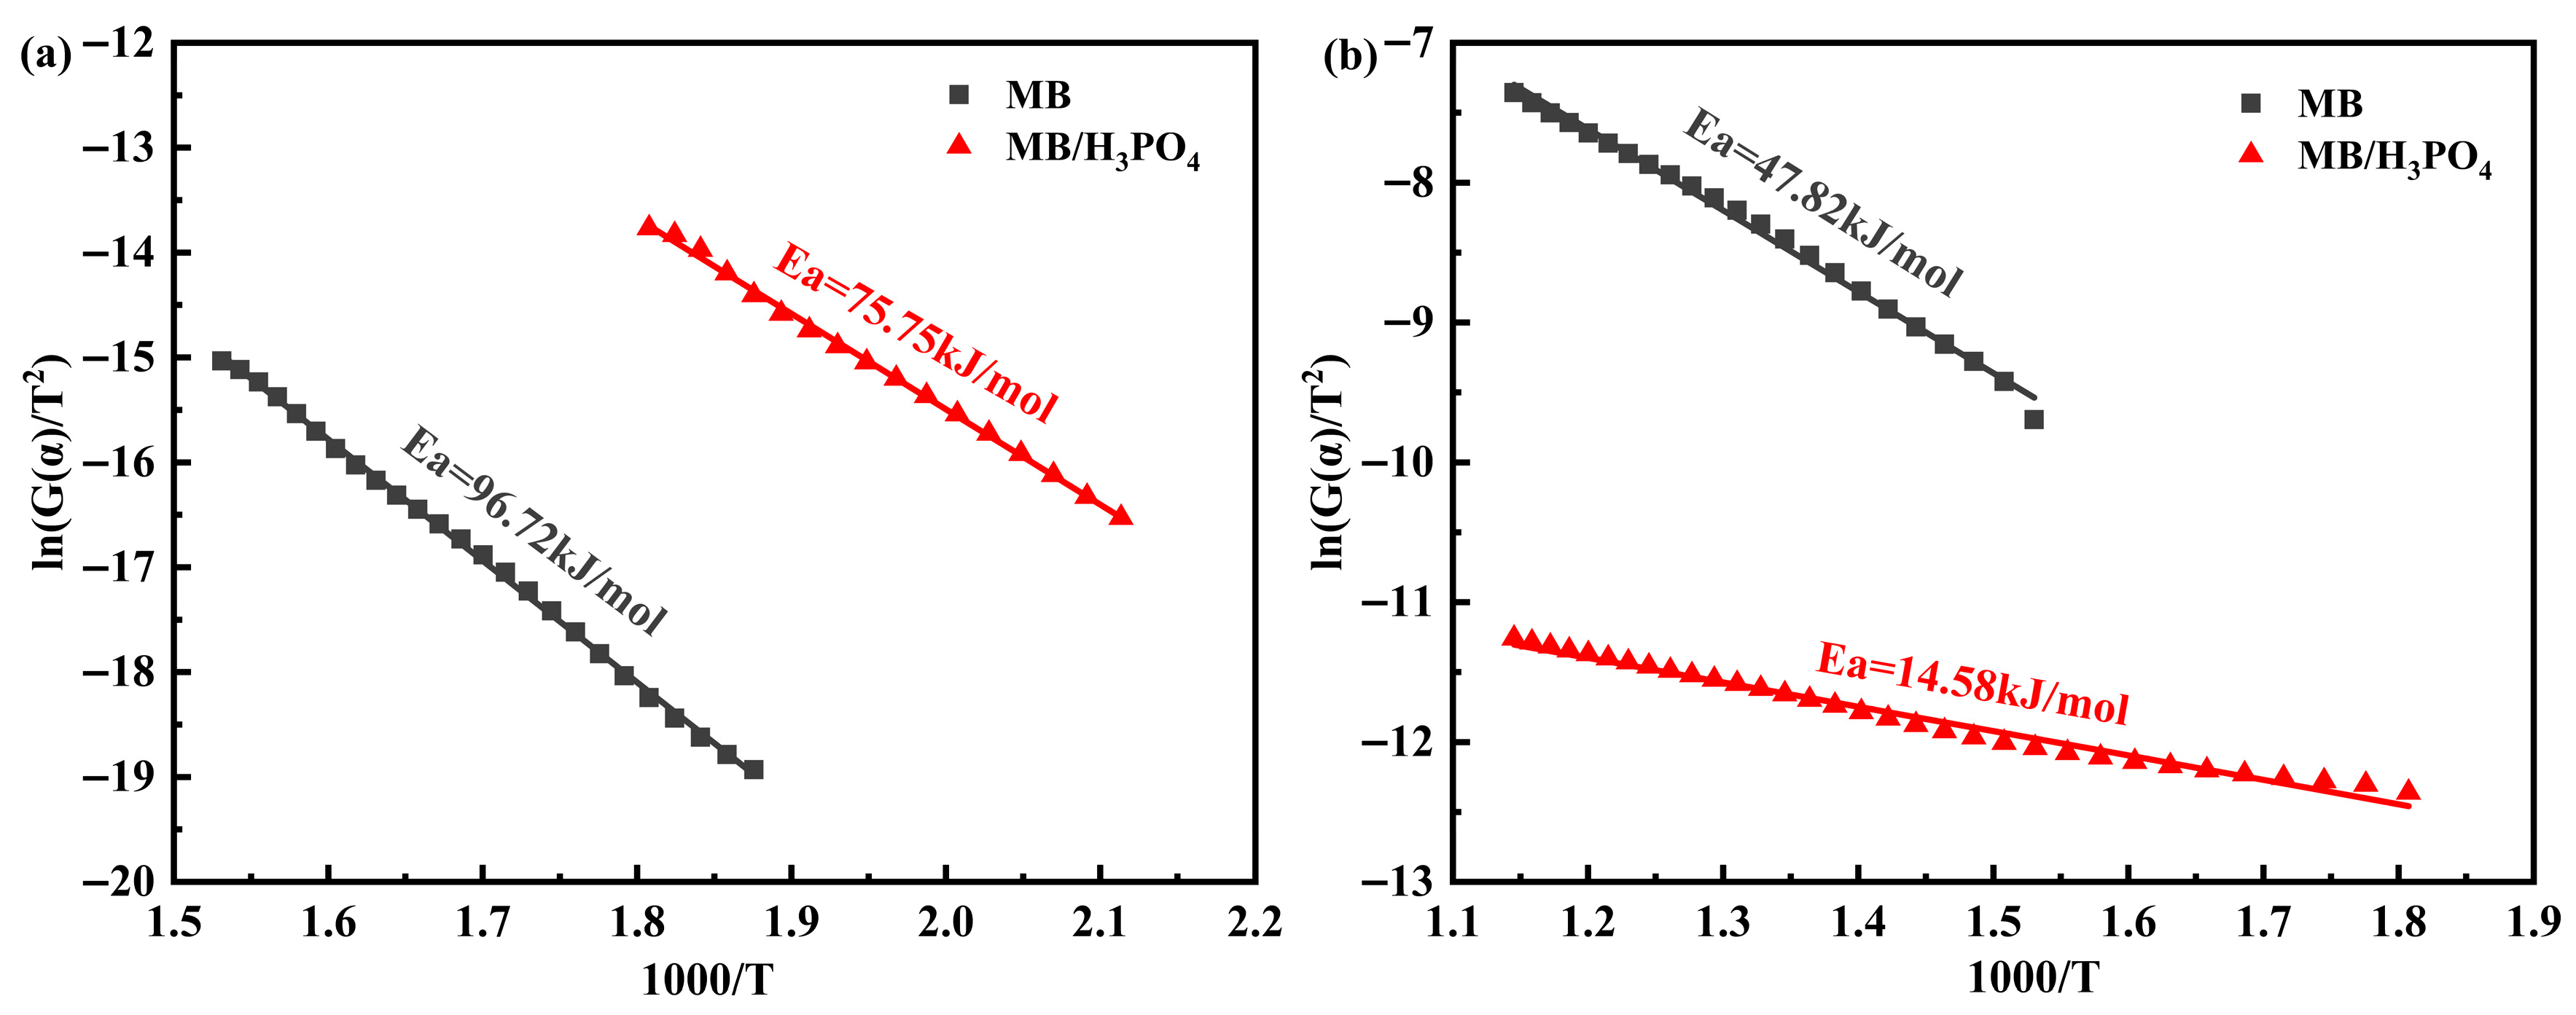
The Coats-Redfern (CR) model is a commonly used dynamic model for calculating pyrolysis kinetic parameters. Based on the thermogravimetric (TG) curves, the activation energies and pre-exponential factors for the pyrolysis of MB and MB/H3PO4 were determined using kinetic models. A total of 24 common mechanism models were selected in this study, and after preliminary data comparison, 15 mechanism models were finally chose [36]. The relevant function expressions are provided in Table S2. According to the thermogravimetric curves, the pyrolysis process was segmented for kinetic fitting calculations. Excluding the initial drying stage, the thermal decomposition of both MB and MB/H3PO4 was divided into two stages: decomposition and carbonization [24]. The fitting results are presented in Figure 3 and Table S3. For the first stage of MB, the most suitable model is the G-B Equation, while for MB/H3PO4, the Mampel Power Rule is the optimal model, both models can be described by diffusion models. For the reaction in the second stage, the high-temperature carbonization of MB and MB/H3PO4 can be described by the Third Order and Reaction Order, respectively.
As shown in Figure 3a, the decomposition of cellulose and hemicellulose mainly occurs in the first-stage reaction of MB (260–380 °C), with a corresponding activation energy of 96.72 kJ/mol. After the addition of H3PO4, the activation energy decreases to 75.75 kJ/mol. This is attributed to the fact that H3PO4, to a certain extent, promotes the cleavage of glycosidic bonds and C-H bonds, leading to the cracking of hemicellulose at weakly linked sites and a reduction in the degree of polymerization of cellulose. Figure 3b illustrates the second reaction stage, where the formation of char and a small amount of volatiles are the main products. The activation energy of the second stage decreases from 47.82 kJ/mol for MB to 14.58 kJ/mol for MB/H3PO4. This result indicates that H3PO4 promotes the char formation process. This may be due to the dehydration of phosphoric acid to form polyphosphoric acid, which facilitates intramolecular or intermolecular dehydration of polymers, thereby accelerating char formation [37].
Combined with the TG curves and pyrolysis kinetic analysis, it can be concluded that the addition of H3PO4 significantly reduces the activation energy of the pyrolysis reaction and effectively lowers the pyrolysis temperature.

3.2. Biochar’s Carbon Skeleton Analysis

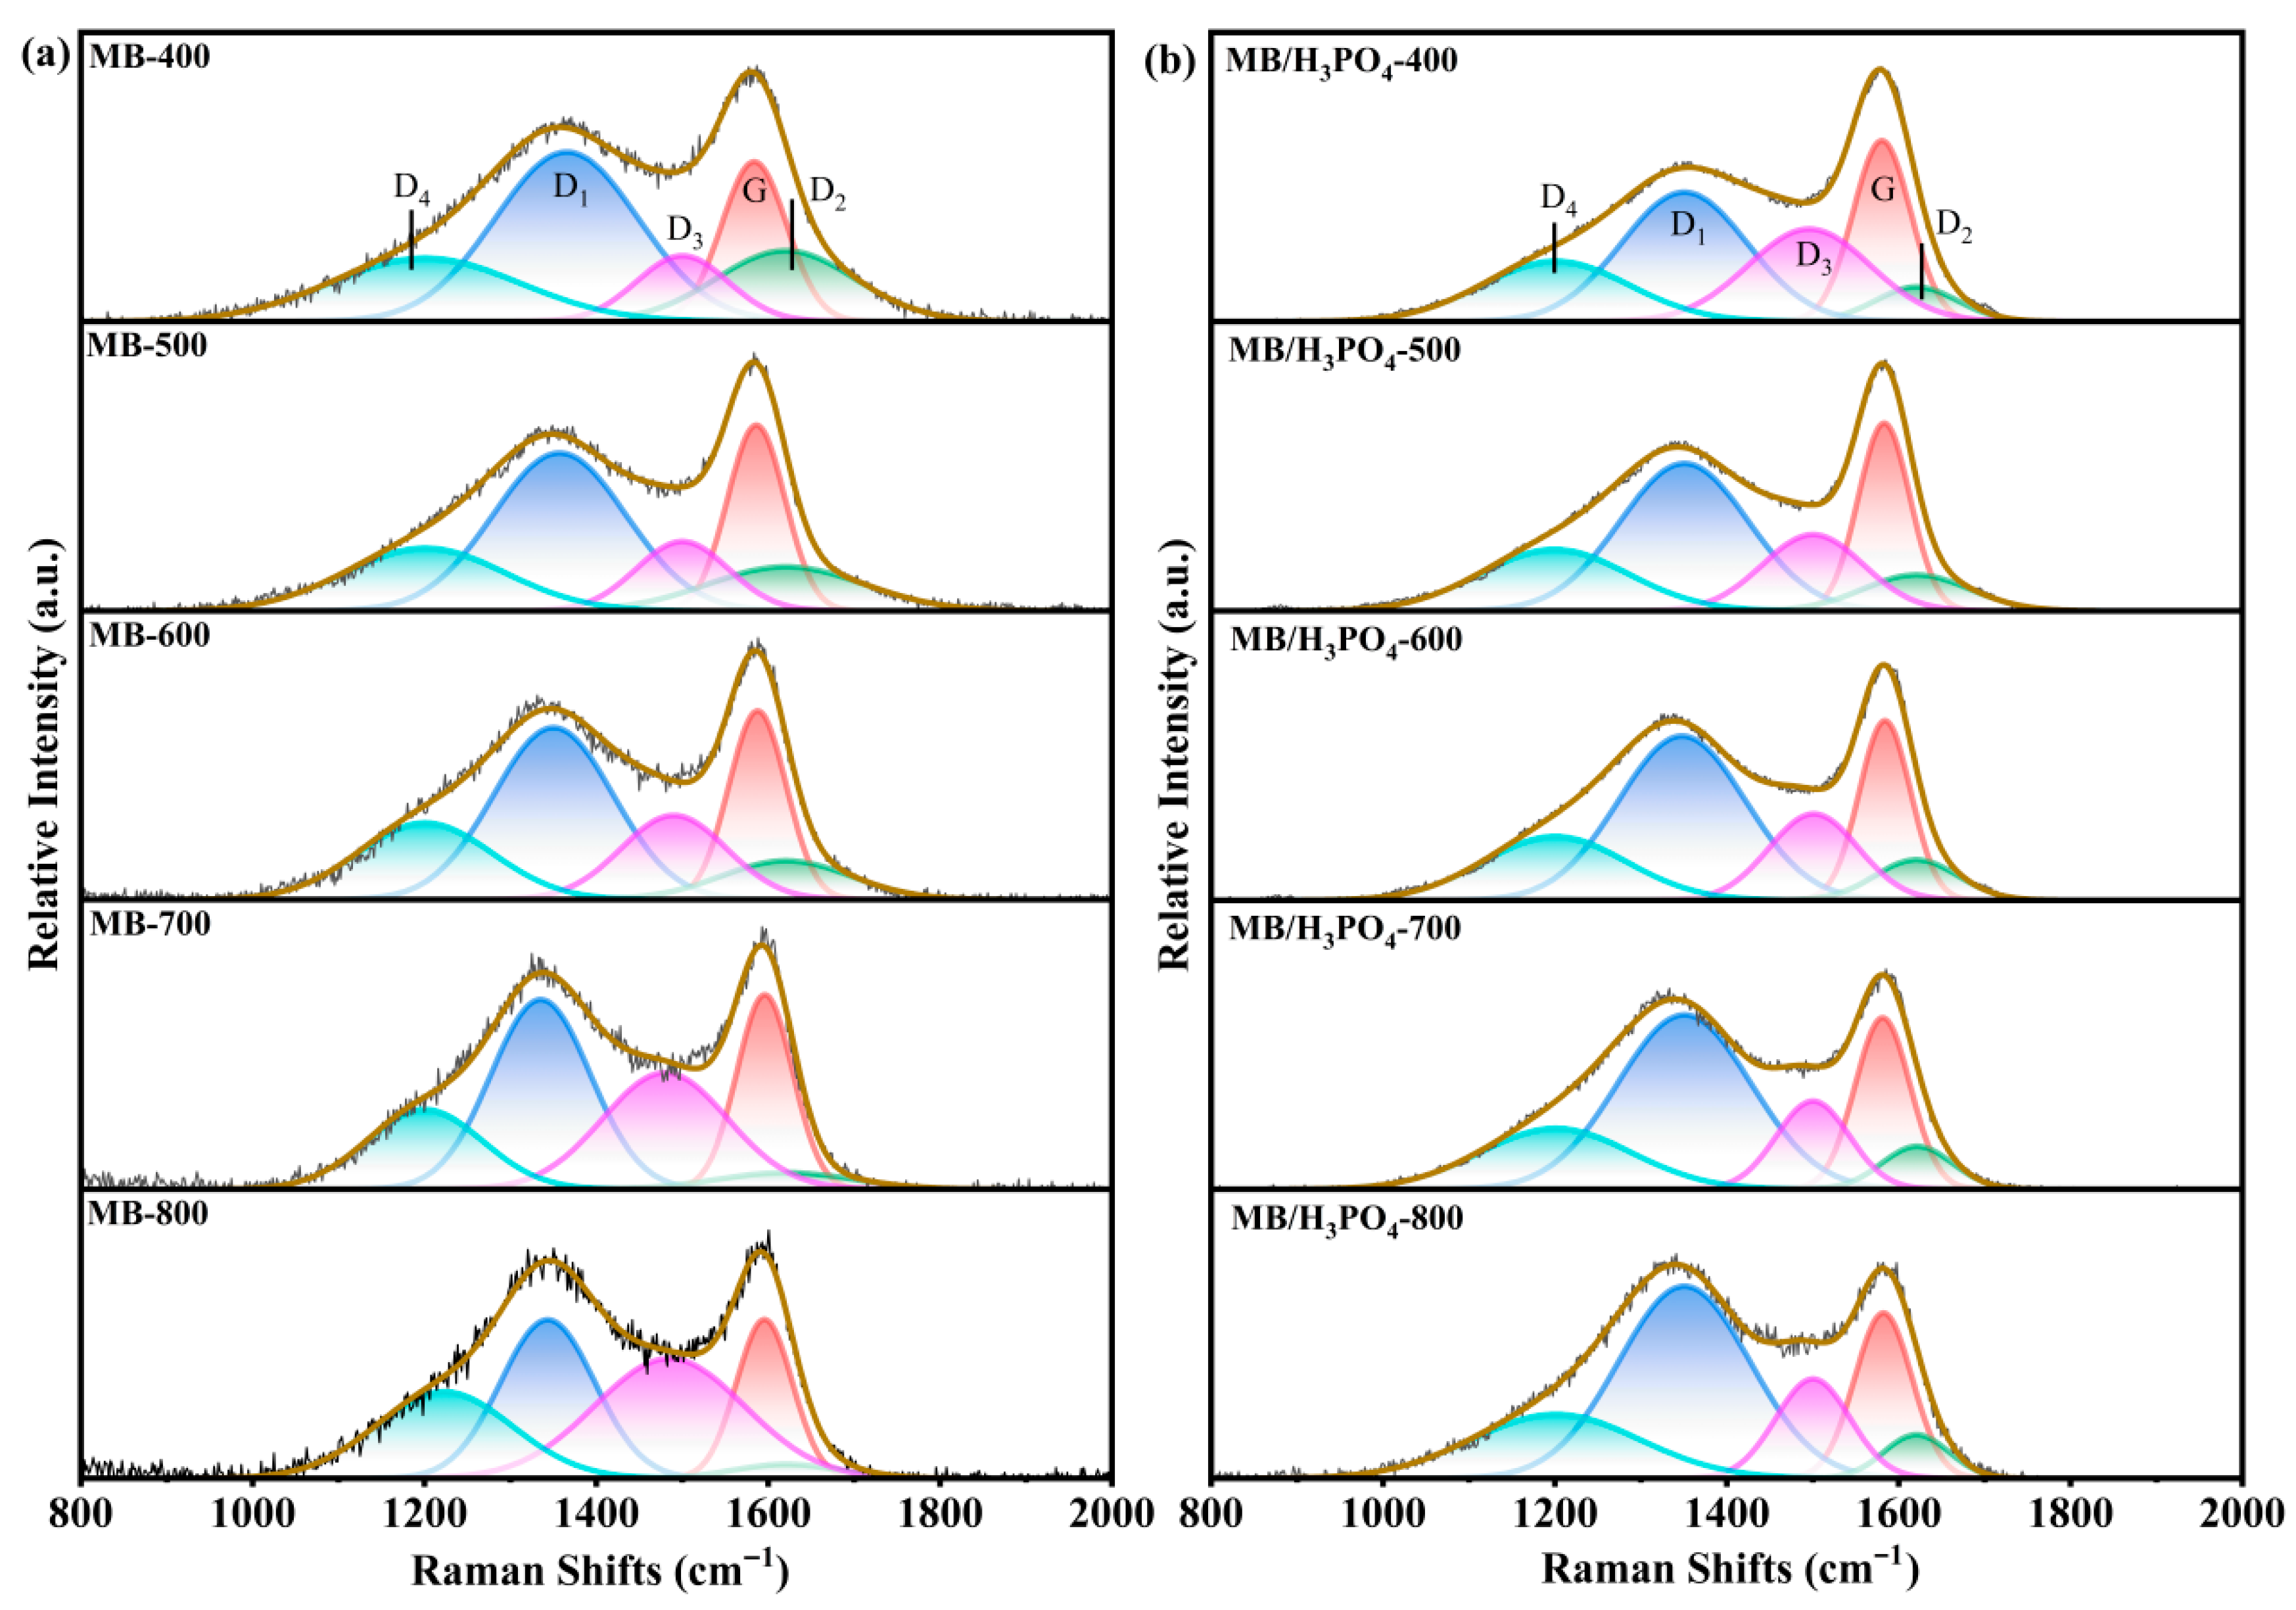
Figure 4 presents the Raman spectra illustrating the variation of ordering and graphitization degrees of biochar with temperature. Two distinct peaks (D peak and G peak) are observed in the spectra. The D peak is indicative of the defect degree in the carbon structure of the material and the disorder degree of amorphous carbon; the G band arises primarily from the in-plane vibration of microcrystalline carbon bonded via sp2 bonds, which originates from the in-plane vibration mode in the carbon structure, namely, reflecting the ordering degree of ordered carbon atoms. The intensity ratio of the D peak to the G peak (ID/IG) can be used to characterize the graphitization degree of carbon-like materials, and it is inversely proportional to the graphitization degree. A lower ID/IG value indicates an increase in ordering degree and an enhancement in graphitization degree [38,39].
To eliminate the overlapping interference between the G band and D band, the Raman spectra were deconvoluted into five peaks (G, D1, D2, D3, and D4) within the range of 800–1800 cm−1, and the Gaussian and Lorentzian methods were employed for fitting. Table S4 presents the positions of these peaks as well as the specific chemical structures in the carbon framework that they represent. The area ratio of the D1 peak to the G peak (ID1/IG) is indicative of the disorder degree of carbon materials; in contrast, the area ratio of the G peak to the total area of all peaks (IG/Itotal) reflects the degree of organization or graphitization of the carbon structure. Meanwhile, the full width at half maximum (FWHM) of the D1 peak is another important parameter for evaluating the graphitization degree. Table 1 shows the variations in the peak areas of G and D1 as well as their FWHM values with increasing temperature.
In the direct pyrolysis of MB, the ID1/IG of biochar was 2.34 at 400 °C, which decreased to 1.69 at 800 °C. Additionally, IG/Itotal showed an upward trend with increasing temperature, indicating that the increase in temperature led to a reduction in the disorder degree of MB biochar and the gradual growth of highly ordered crystalline graphite. Similarly, as the temperature increased, the FWHM (D1) decreased from 196.75 at 400 °C to 129.54 at 800 °C, suggesting an enhancement in the graphitization degree of biochar, which was consistent with the change in ID1/IG. However, for MB-H3PO4, the ID1/IG was 1.56 at 400 °C, but increased to 2.66 at 800 °C. Moreover, with the rise in temperature, IG/Itotal decreased from 20.94 to 17.00, indicating that the disorder degree of biochar increased while the graphitization degree decreased as the temperature increased. Meanwhile, the increase in FWHM (D1) suggested the growth of amorphous structures. This might be attributed to the insertion of P-O-P bonds into the carbon lattice during the pyrolysis process, resulting in the enlargement of amorphous structures and lattice defects in the carbon framework [40]. The XRD pattern of MB/H3PO4 is shown in Figure S1. It can be clearly observed that there are two distinct carbon envelope peaks at 20–30° and 40–45°, representing a typical amorphous carbon structure. With the increase in temperature, the intensity of the peaks gradually increased, indicating an increase in the amorphous structure of biochar, which was consistent with the analysis results of Raman spectroscopy.

3.3. Evolution of Biochar’s Functional Group

3.3.1. XPS Analysis

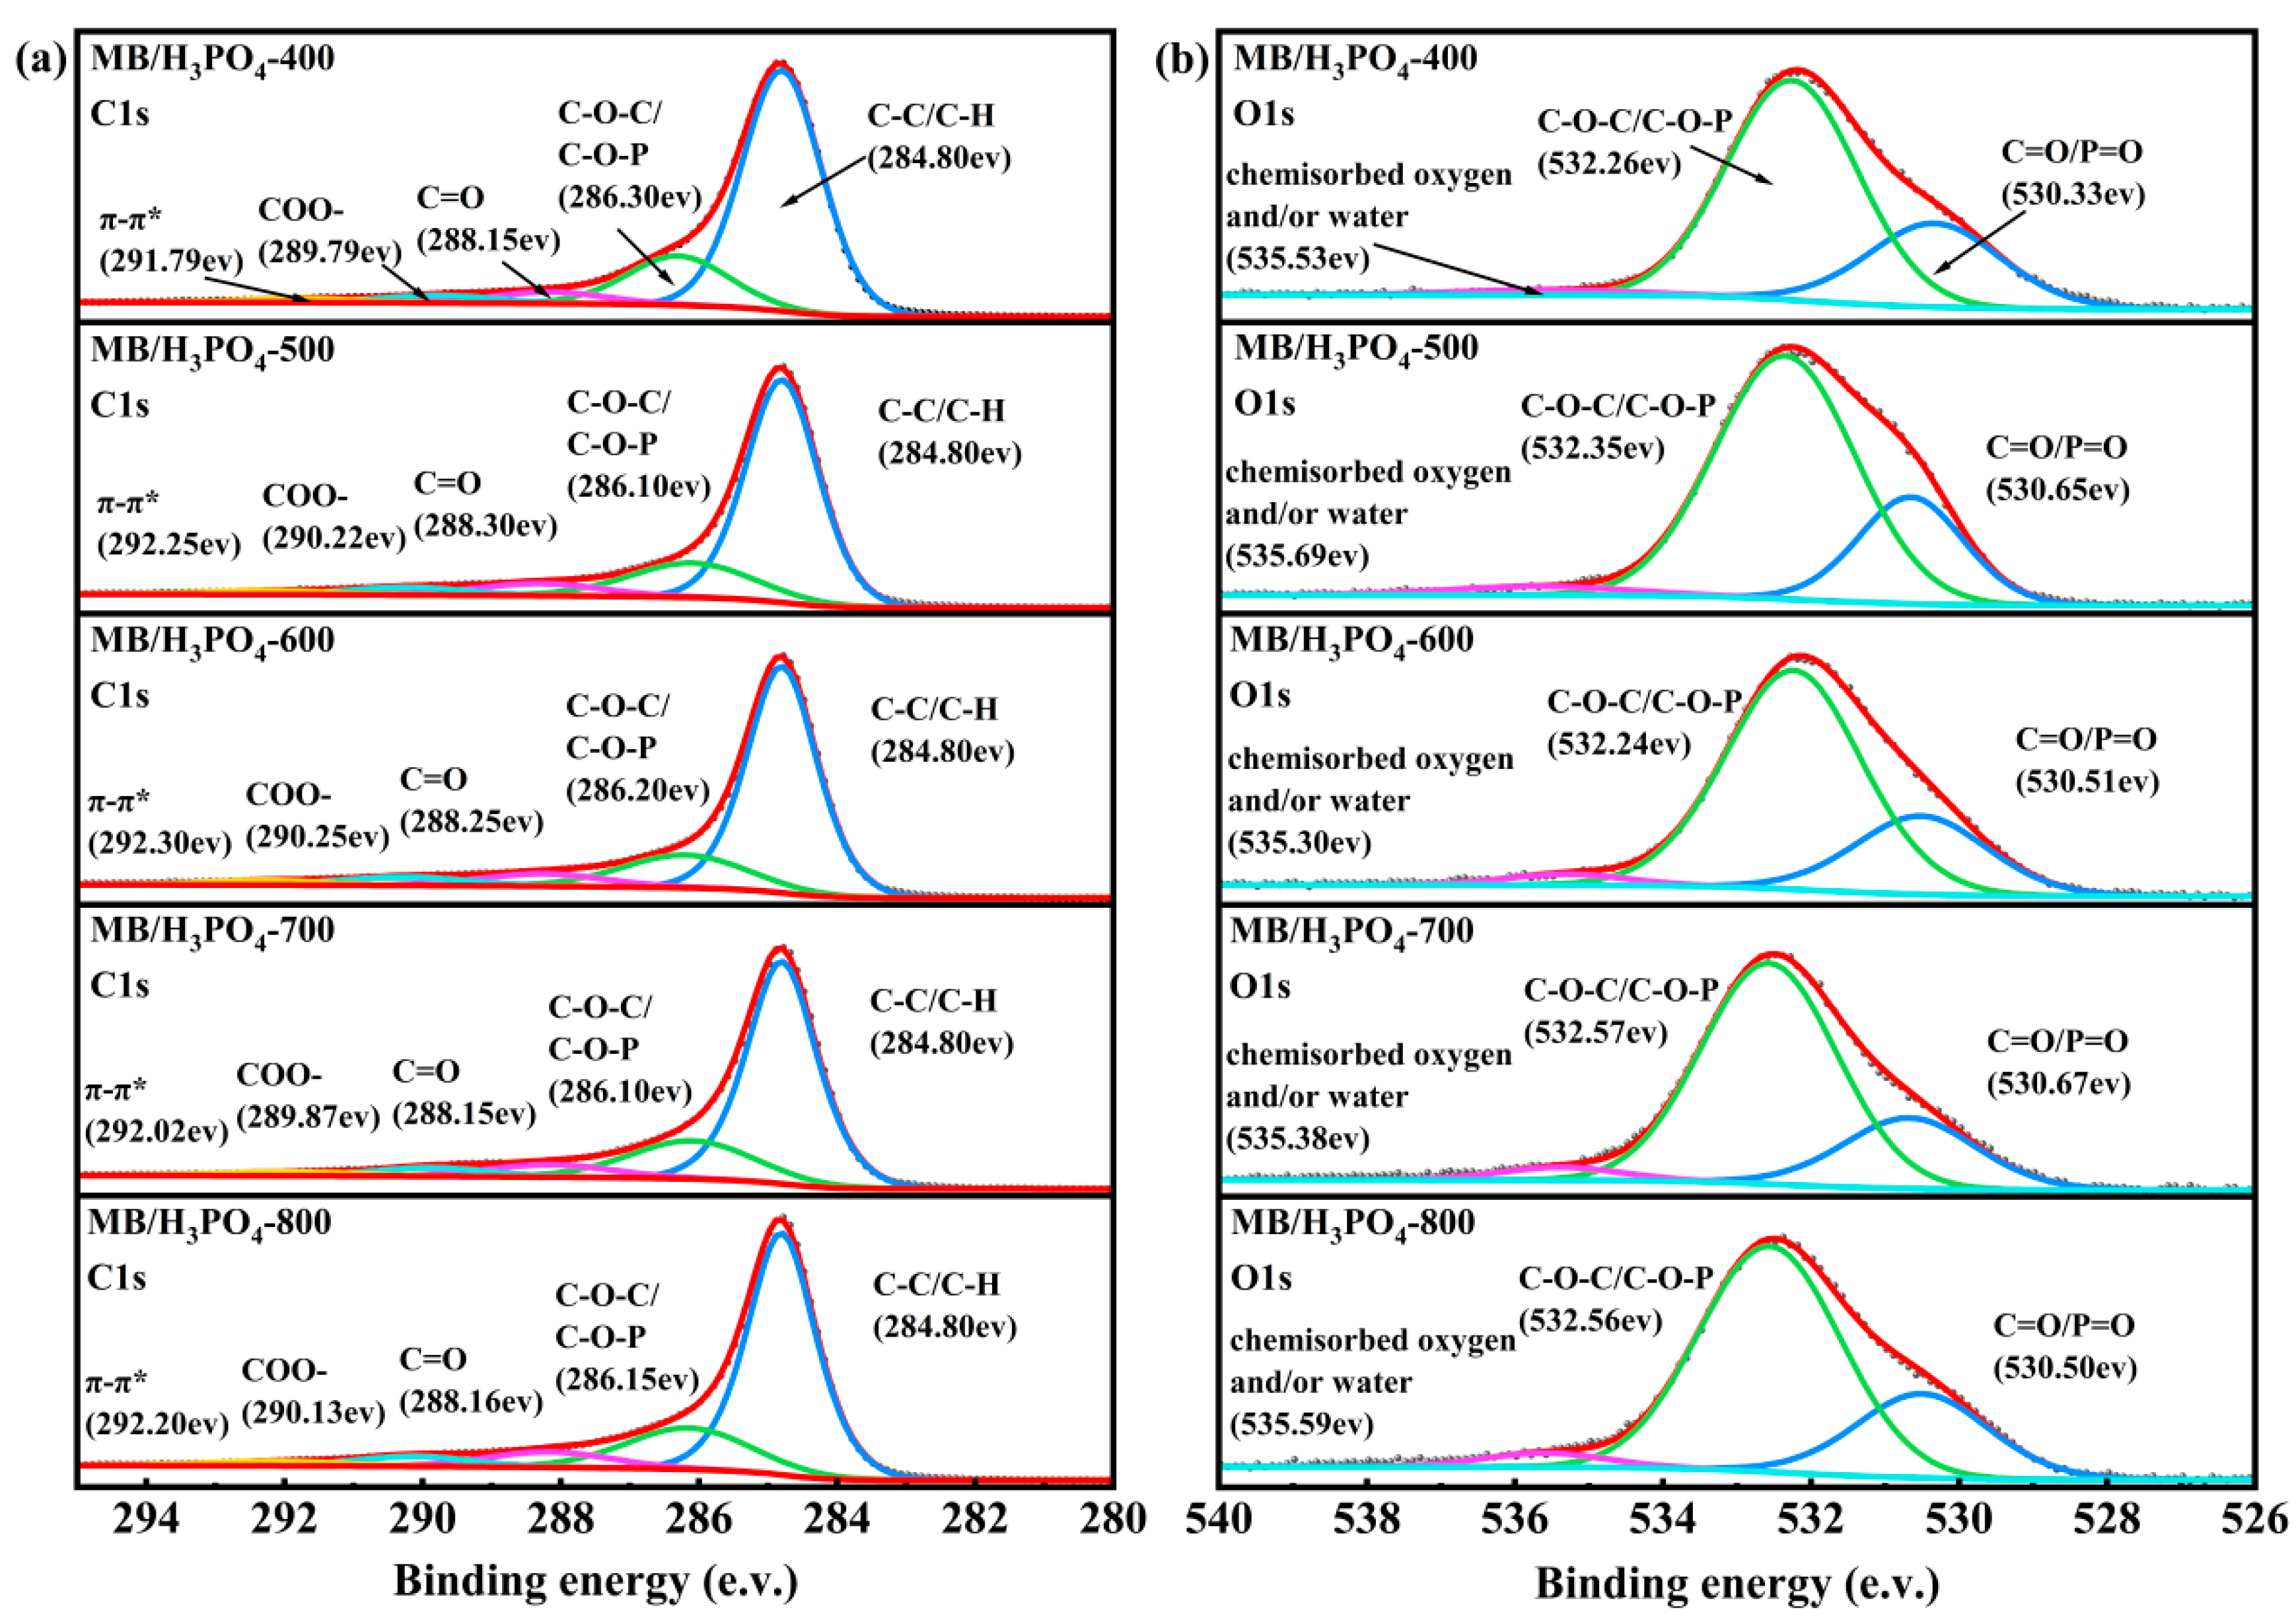
Figure 5 presents the C1s and O1s spectra of phosphoric acid-modified biochar. The C1s spectrum was deconvoluted into five peaks, corresponding to carbon in graphitic carbon (C-C/C-H groups) (284.80 eV), carbon species in ether groups and/or C-O-P linkages (C-O-C/C-O-P groups) (286.00 ± 0.30 eV), carbonyl groups (C=O groups) (288.50 ± 0.30 eV), carboxyl and/or ester groups (COO- groups) (290.00 ± 0.3 eV), and π-π* satellite groups (292.00 ± 0.30 eV) [41,42]. Table 2 shows the relative contents of different functional groups. With the increase in pyrolysis temperature, the content of graphitized carbon (area of C-C/C-H groups) decreased from 71.52% at 400 °C to 65.97% at 800 °C, indicating that the reaction rate between H3PO4 and carbon accelerated, leading to a reduction in the graphitization degree of modified biochar [41]. In addition, the relative contents of C-O-C/C-O-P, C=O and COO- groups all increased with the increase in temperature, which suggests that the addition of phosphoric acid introduced more oxygen-containing functional groups. It is noteworthy that the area of the π-π* satellite peak increased from 1.71% to 2.56% as the temperature rose, indicating that the addition of H3PO4 promoted the cyclization and condensation processes during pyrolysis, thereby enhancing the aromatization degree of biochar [43].
The O1s spectrum was deconvoluted into three peaks: C=O/P=O groups (530.50 ± 0.3 eV), C-O-C/C-O-P groups (532.30 ± 0.3 eV), and chemisorbed oxygen and/or water (535.50 ± 0.30 eV) (Valero-Romero et al., 2017) [44]. As shown in Table 2, single-bonded oxygen (-O-) remained the dominant component in all carbons, accounting for more than 70%, followed by double-bonded oxygen (=O) with a content exceeding 23%. This is attributed to the fact that phosphorus (P), located in the third period, has a significantly larger covalent radius (107 ± 3 pm) compared to carbon (C, 73 pm), making P more inclined to form sp3 configurations. Additionally, the ease of substitution of C atoms by P atoms enables H3PO4 to promote more bonding between P and C in biochar via oxygen bridges. The presence of O-P in the C-O-P bond also confirms the formation of phosphate structures on the biochar surface. However, due to the weak structural development of the O1s line, it is impossible to distinguish the contributions of organic oxygen and inorganic oxygen. Nevertheless, it can be observed from the figure that the peak of chemisorbed oxygen and/or water is relatively low (content below 4%), which is because P2O5 generated during pyrolysis can be regarded as a strong desiccant [41].

3.3.2. FTIR Analysis

Figure S2 shows the Fourier transform infrared (FTIR) spectra of modified biochar. Table S5 presents the main types of functional groups used in this study and their corresponding wavelengths. The broad band at 3425 cm−1 represents the O-H stretching vibration. With the increase in temperature, the peak intensity of -OH groups gradually weakens, which is attributed to the decomposition of -OH caused by H+-promoted dehydration and cyclization processes as well as the cross-linking between H3PO4 and biochar [43]. In addition, the peak at 2921 cm−1 corresponds to the methylene (-CH2) group in alkyl structures, the peak at 1606 cm−1 corresponds to the C=C vibration in alkenes, and the peak at 1425 cm−1 corresponds to the vibration of the methyl (-CH3) group [43,45]. Meanwhile, PO43− groups and P-O groups were observed at 1011 cm−1 and 877 cm−1, respectively. However, obvious peak overlapping occurs in the key regions of the FTIR spectrum, making it impossible to effectively interpret the disturbance changes caused by specific bonds [46]. Therefore, we processed the FTIR data to obtain two-dimensional correlation infrared spectra (2D-PCIS).

3.3.3. D-PCIS Analysis

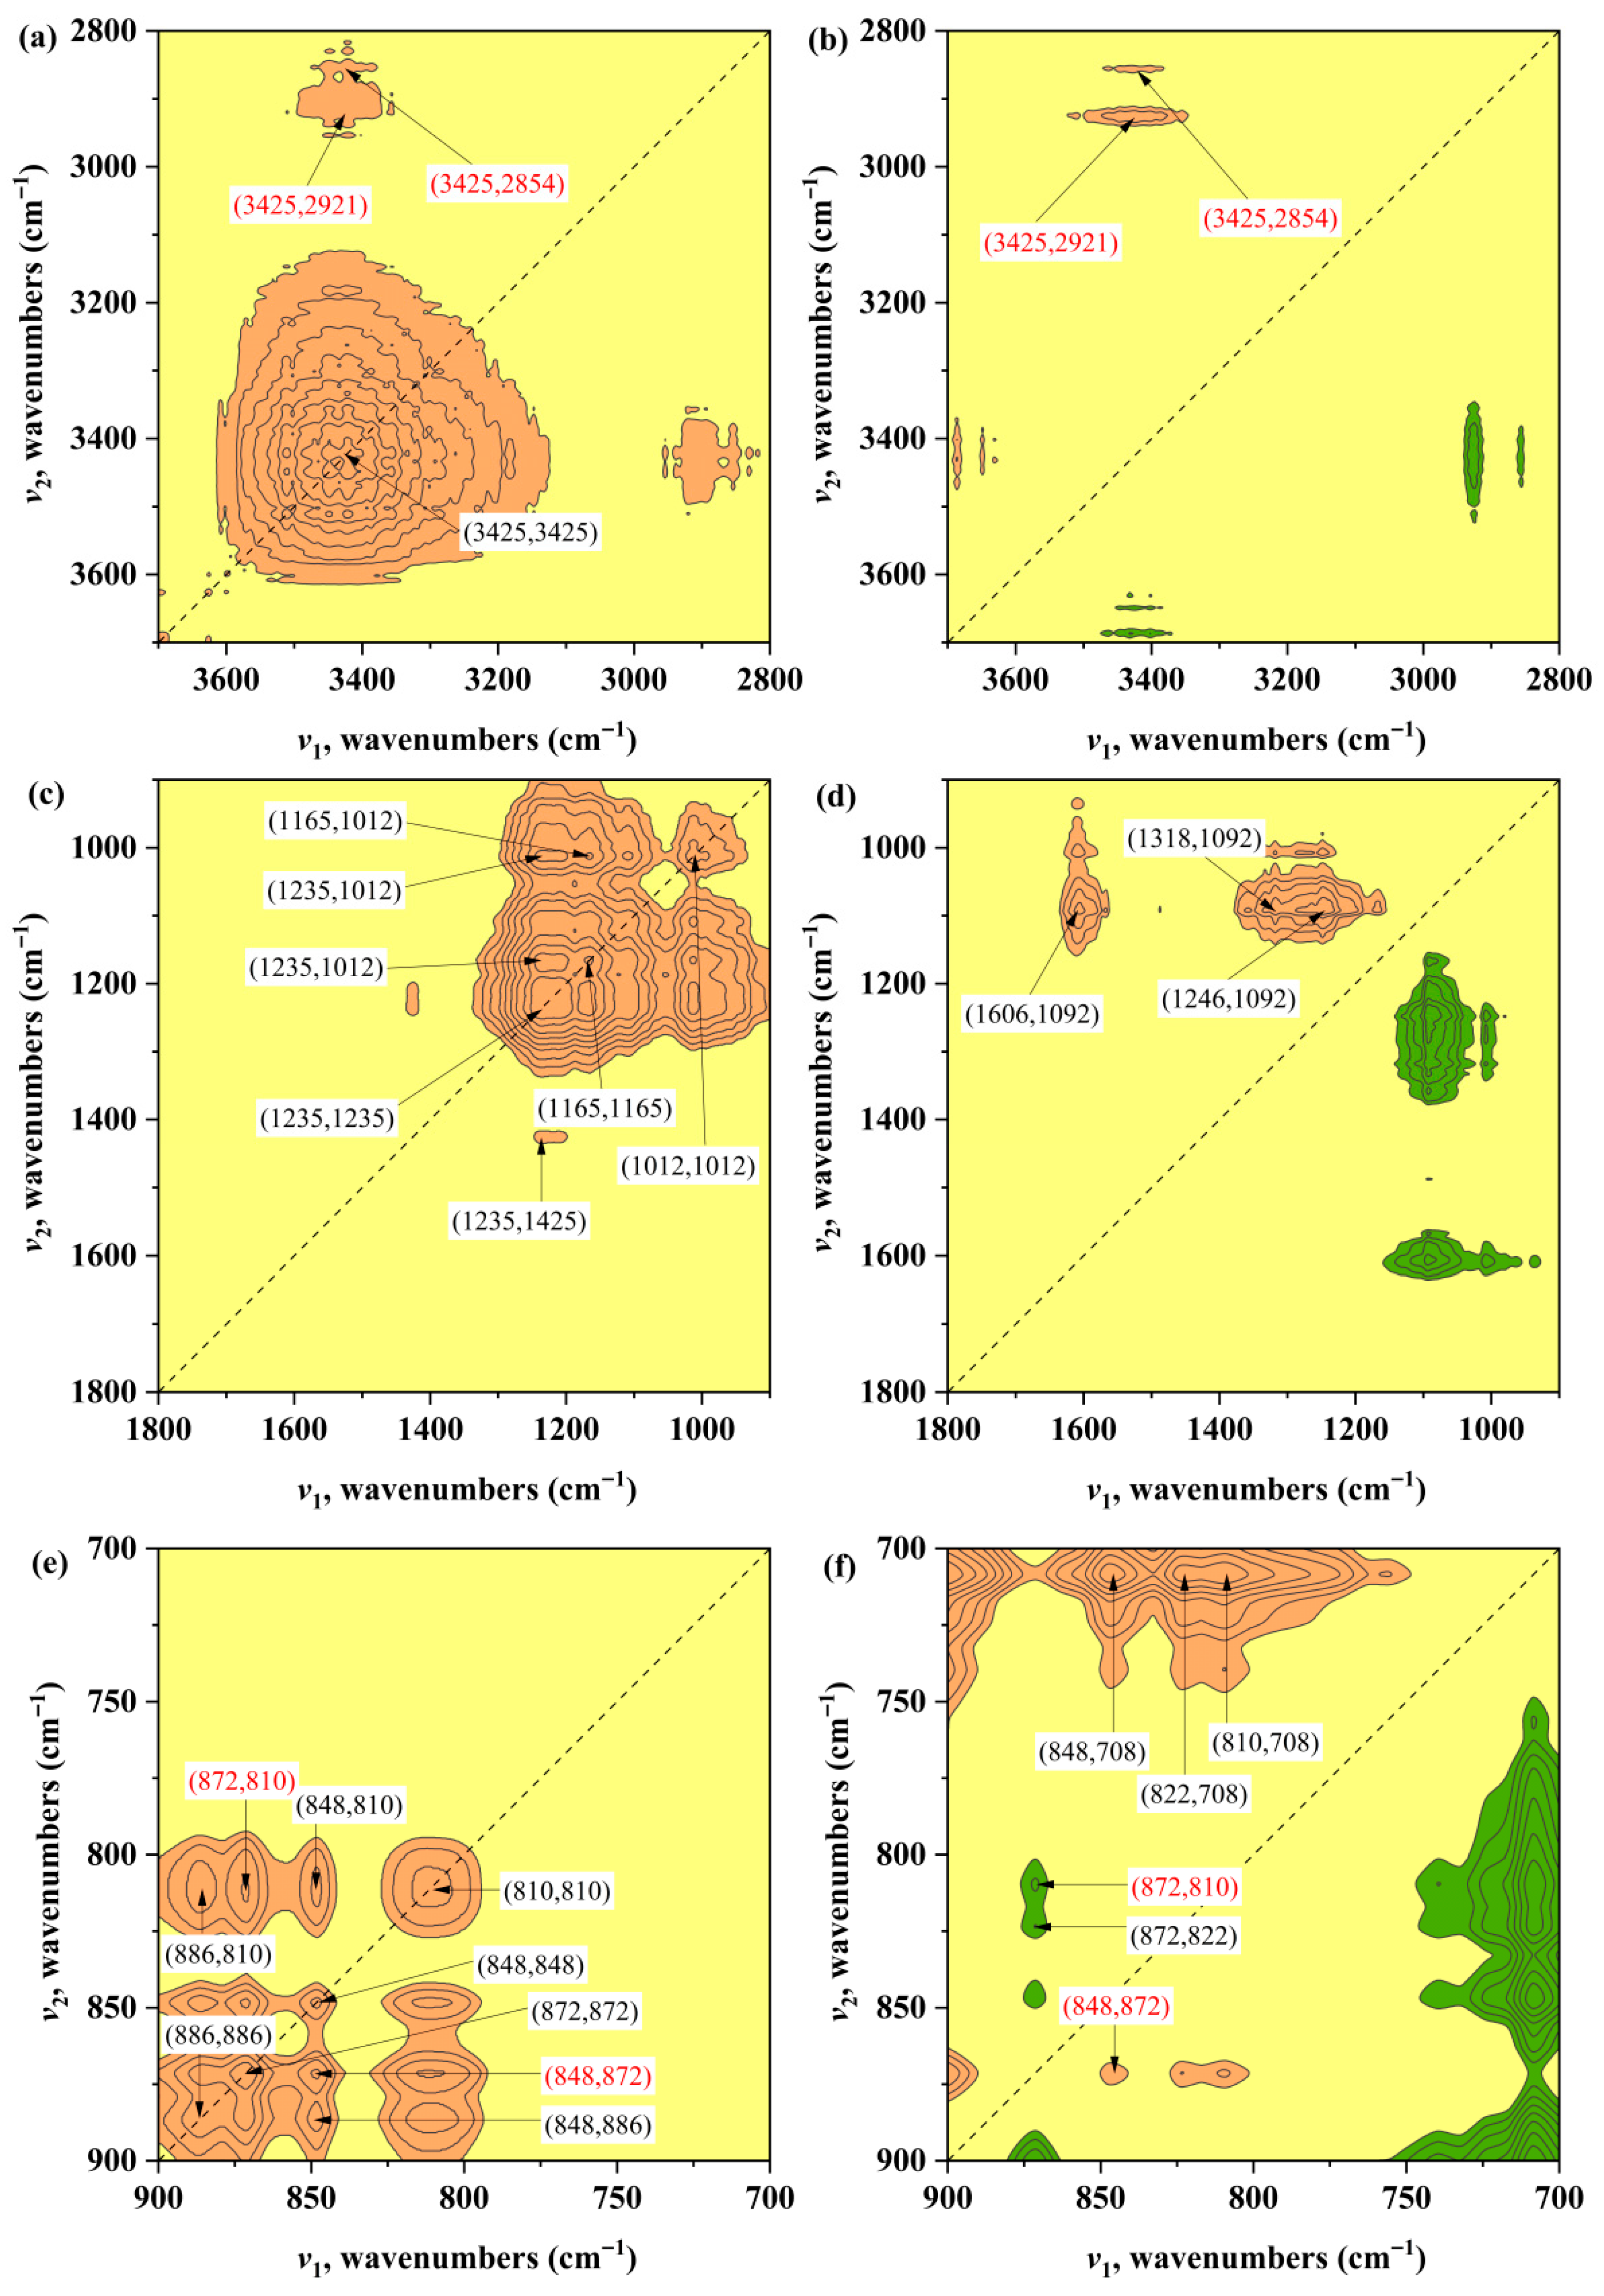
The synchronous (a, c, e) and asynchronous (b, d, f) spectra of 2D-PCIS are shown in Figure 6. To investigate the molecular structure of modified biochar in detail, the FTIR spectrum was divided into three regions: 3700–2800 cm−1, 1800–900 cm−1, and 900–700 cm−1. In the 3700–2800 cm−1 range, a very distinct autopeak (Φ (v1, v2)) is observed in the synchronous spectrum, corresponding to intermolecularly bonded O-H groups (3425 cm−1). This indicates that the intermolecularly bonded -OH groups exhibit a significant change in intensity with increasing temperature, which is consistent with previous analyses. Furthermore, the synchronous cross peaks Φ (3425, 2921) and Φ (3425, 2854) in the synchronous spectrum are positive, corresponding to intermolecularly bonded -OH (3425 cm−1) and methylene -CH2 (2921 cm−1, 2854 cm−1) functional groups, respectively. This suggests that compounds containing -CH2OH functional groups undergo synchronous changes during the pyrolysis process. In addition, according to Noda’s rules, the orthogonal cross peaks at ψ (3425, 2921) and ψ (3425, 2854) in the asynchronous spectrum (ψ (v1, v2)) are both positive, indicating that the intermolecularly bonded -OH groups react prior to the aliphatic chain -CH2 groups. This implies that the hydroxyl groups on the aromatic rings dehydrate before the primary alcohols during pyrolysis [45]. It is thus suggested that H+ ions in phosphoric acid may first react with the hydroxyl groups on the aromatic rings to cause dehydration, thereby enhancing the degree of aromatization of the biochar.
In the 1800–900 cm−1 range, the autopeaks observed in the synchronous spectrum correspond to C-O in aliphatic ethers/alcohols (1235 cm−1, 1165 cm−1) and C-O-C in glycosides (1012 cm−1), respectively. This indicates that the intensities of these three peaks all change to varying degrees with temperature, among which the intensity change of the C-O peak at 1235 cm−1 is the most significant. Positive cross peaks Φ (1425, 1235), Φ (1235, 1165), Φ (1235, 1012), and Φ (1165, 1012) are also observed in the synchronous spectrum, corresponding to -CH3 in alkanes (1425 cm−1), C-O in aliphatic ethers/alcohols (1235 cm−1, 1165 cm−1), and C-O-C in glycosides (1012 cm−1), respectively. This implies that these functional groups undergo synchronous changes. However, three positive cross peaks are observed in the asynchronous spectrum: ψ (1606, 1092), ψ (1246, 1092), and ψ (1318, 1092), corresponding to C=C in alkenes (1606 cm−1), C-O in aliphatic ethers/alcohols (1318 cm−1, 1246 cm−1), and C-O-C in glycosides (1012 cm−1), respectively. These peaks may be mainly related to the fact that H+ in H3PO4 primarily attacks the C-O bonds of alcohol or ether groups in biomass at high temperatures, leading to the accelerated condensation of alcohol or ether moieties into alkene moieties [43].
In the 900–700 cm−1 range, the autopeaks observed in the synchronous spectrum correspond to the functional groups of C=C in alkenes (886 cm−1, 872 cm−1) and C-H in aromatic compounds (848 cm−1, 810 cm−1). The intensities of the aforementioned functional groups also undergo significant changes with increasing temperature, indicating that H3PO4 enhances the degree of aromatization of biochar during pyrolysis by promoting the rearrangement of oxygen-containing heterocycles and the addition of small-molecule benzene rings [42]. Furthermore, cross peaks corresponding to these functional groups are observed in the synchronous spectrum, suggesting strong correlations between these peaks during the reaction process. However, the positive cross peaks Φ (872, 810) and Φ (872, 848) observed in the synchronous spectrum are both negative in the asynchronous spectrum. According to Noda’s rules, the condensation of small-molecule aromatic rings on biochar proceeds in a certain order, where the changes in C-H on the benzene rings (848 cm−1, 810 cm−1) occur prior to the changes in C=C in alkenes (872 cm−1). In addition, four independent cross peaks are observed in the asynchronous spectrum: ψ (848, 708), ψ (822, 708), ψ (810, 708), and ψ (872, 822). These peaks may correspond to changes in C=C bonds and C-H bonds on aromatic rings with different structures.

4. Conclusions

To investigate the mechanism underlying the effect of phosphorus-containing additives on carbon structure evolution, modified biochars were prepared from mottled bamboo at different temperatures via a phosphoric acid (H3PO4) pretreatment method. The effects of H3PO4 addition on the pyrolysis characteristics, carbon skeleton, and surface functional groups of biochar were examined. The results showed that the addition of H3PO4 accelerated the rate of thermal decomposition and reduced the activation energy of the fast pyrolysis stage; this was primarily attributed to the fact that impregnation promoted the cleavage of hemicellulose and reduced the polymerization of cellulose. SEM analysis, Raman analysis, and XRD patterns indicated that H+ catalysis and phosphoric acid cross-linking facilitated the expansion of the pore structure, while the insertion of P-O-P bonds into the carbon lattice reduced graphitization. XPS analysis and 2D-PCIS revealed that the addition of H3PO4 promoted cyclization and condensation during the pyrolysis process. Furthermore, H3PO4 enhanced the degree of aromatization of biochar by facilitating the rearrangement of oxygen-containing heterocycles and the incorporation of small-molecule benzene rings.

Supplementary Materials

The following supporting information can be downloaded at: https://www.mdpi.com/article/10.3390/en18236165/s1, Figure S1: XRD pattern of MB/H3PO4 pyrolysis at different temperatures; Figure S2: FTIR spectrum of phosphorus-rich biochar (MB/H3PO4) prepared at different temperatures; Table S1: Noda’s rule and method for determining crossing peaks in 2D-PCIS; Table S2: Mechanism function after preliminary screening; Table S3: Kinetic parameters of MB and MB/H3PO4 pyrolysis processes calculated by the CR method; Table S4: Biochar Raman shift peak splitting and interpretation; Table S5: The FTIR functional groups in modified biochar.

Author Contributions

Methodology, S.X.; Software, S.X.; Formal analysis, X.R.; Data curation, S.X.; Writing—original draft, Z.W.; Writing—review & editing, X.R. and Y.D.; Supervision, Y.D. All authors have read and agreed to the published version of the manuscript.

Funding

This work is financial sponsored by the National Research and Development Plan of China (No. 2024YFE0111000), and the Science and Technology Project of China Huaneng Group (Contract NO.: HNKJ22-H150).

Data Availability Statement

The original contributions presented in this study are included in the article/supplementary material. Further inquiries can be directed to the corresponding authors.

Conflicts of Interest

The authors declare that they have no known competing financial interests or personal relationships that could have appeared to influence the work reported in this paper.

References

  1. Jin, C.; Lv, Z.; Li, Z.; Sun, K. Green finance, renewable energy and carbon neutrality in OECD countries. Renew. Energy 2023, 211, 279–284. [Google Scholar] [CrossRef]
  2. Xia, S.W.; Yang, H.P.; Lei, S.S.; Lu, W.; Cai, N.; Xiao, H.Y.; Chen, Y.Q.; Chen, H.P. Iron salt catalytic pyrolysis of biomass: Influence of iron salt type. Energy 2023, 262, 125415. [Google Scholar] [CrossRef]
  3. Xia, S.W.; Yang, H.P.; Lu, W.; Cai, N.; Xiao, H.Y.; Chen, X.; Chen, Y.Q.; Wang, X.H.; Wang, S.R.; Wu, P.; et al. Fe-Co based synergistic catalytic graphitization of biomass: Influence of the catalyst type and the pyrolytic temperature. Energy 2022, 239, 122262. [Google Scholar] [CrossRef]
  4. Liu, S.; Cen, B.; Yu, Z.; Qiu, R.; Gao, T.; Long, X. The key role of biochar in amending acidic soil: Reducing soil acidity and improving soil acid buffering capacity. Biochar 2025, 7, 52. [Google Scholar] [CrossRef]
  5. Das, N.; Pandey, P. Biochar-driven rhizoremediation of soil contaminated with organic pollutants: Engineered solutions, microbiome enrichment, and bioeconomic benefits for ecosystem restoration. Biochar 2025, 7, 101. [Google Scholar] [CrossRef]
  6. Zhao, Y.; Hu, Z.; Lu, Y.; Shan, S.; Zhuang, H.; Gong, C.; Cui, X.; Zhang, F.; Li, P. Facilitating mitigation of agricultural non-point source pollution and improving soil nutrient conditions: The role of low temperature co-pyrolysis biochar in nitrogen and phosphorus distribution. Bioresour. Technol. 2024, 394, 130179. [Google Scholar] [CrossRef]
  7. Yang, Q.; Zhou, H.; Bartocci, P.; Fantozzi, F.; Mašek, O.; Agblevor, F.A.; Wei, Z.; Yang, H.; Chen, H.; Lu, X.; et al. Prospective contributions of biomass pyrolysis to China’s 2050 carbon reduction and renewable energy goals. Nat. Commun. 2021, 12, 1698. [Google Scholar] [CrossRef]
  8. Vuppaladadiyam, A.K.; Vuppaladadiyam, S.S.V.; Awasthi, A.; Sahoo, A.; Rehman, S.; Pant, K.K.; Murugavelh, S.; Huang, Q.; Anthony, E.; Fennel, P.; et al. Biomass pyrolysis: A review on recent advancements and green hydrogen production. Bioresour. Technol. 2022, 364, 128087. [Google Scholar] [CrossRef]
  9. Heidari, M.; Dutta, A.; Acharya, B.; Mahmud, S. A review of the current knowledge and challenges of hydrothermal carbonization for biomass conversion. J. Energy Inst. 2019, 92, 1779–1799. [Google Scholar] [CrossRef]
  10. AlNouss, A.; McKay, G.; Al-Ansari, T. Production of syngas via gasification using optimum blends of biomass. J. Clean. Prod. 2020, 242, 118499. [Google Scholar] [CrossRef]
  11. Leng, L.J.; Xu, S.Y.; Liu, R.F.; Yu, T.; Zhuo, X.M.; Leng, S.Q.; Xiong, Q.; Huang, H.J. Nitrogen containing functional groups of biochar: An overview. Bioresour. Technol. 2020, 298, 122286. [Google Scholar] [CrossRef]
  12. Chen, H.Y.; Shan, R.; Zhao, F.X.; Gu, J.; Zhang, Y.Y.; Yuan, H.R.; Chen, Y. A review on the NOx precursors release during biomass pyrolysis. Chem. Eng. J. 2023, 451, 138979. [Google Scholar] [CrossRef]
  13. Vijayaraghavan, K. Recent advancements in biochar preparation, feedstocks, modification, characterization and future applications. Environ. Technol. Rev. 2019, 8, 47–64. [Google Scholar] [CrossRef]
  14. Rizwan, M.; Eisa, M.H.; Zada, A.; Azizi, S.; Alkaoud, A.M.; Albishi, M.S.; Chen, H. Cutting edge advancements in biochar applications: Thermochemical, fermentative, photocatalytic and electrocatalytic hydrogen production and storage. Fuel 2025, 402, 136016. [Google Scholar] [CrossRef]
  15. Rana, P.; Soni, V.; Sharma, S.; Poonia, K.; Patial, S.; Singh, P.; Selvasembian, R.; Chaudhary, V.; Hussain, C.M.; Raizada, P. Harnessing nitrogen doped magnetic biochar for efficient antibiotic adsorption and degradation. J. Ind. Eng. Chem. 2025, 148, 174–195. [Google Scholar] [CrossRef]
  16. Liu, H.; Yang, Q.; Wang, C.; Wu, Y.; Liu, L.; Shen, G.; Chen, Q. Single-atom Fe-decorated N-doped porous carbon from waste biomass as a high-performance air-cathode for wastewater treatment in microbial fuel cells. Water Res. 2025, 280, 123518. [Google Scholar] [CrossRef] [PubMed]
  17. Wu, W.J.; Wu, C.L.; Zhang, G.J.; Liu, J.; Li, Y.L.; Li, G.Q. Synthesis and characterization of magnetic K2CO3-activated carbon produced from bamboo shoot for the adsorption of Rhodamine b and CO2 capture. Fuel 2023, 332, 126107. [Google Scholar] [CrossRef]
  18. Liang, Y.; Huang, G.G.; Zhang, Q.; Yang, Y.T.; Zhou, J.C.; Cai, J.J. Hierarchical porous carbons from biowaste: Hydrothermal carbonization and high-performance for Rhodamine B adsorptive removal. J. Mol. Liq. 2021, 330, 115580. [Google Scholar] [CrossRef]
  19. He, Y.Y.; Ni, L.M.; Gao, Q.; Ren, H.; Su, M.F.; Hou, Y.M.; Liu, Z.J. Activated Carbon with Ultrahigh Specific Surface Derived from Bamboo Shoot Shell through K2FeO4 Oxidative Pyrolysis for Adsorption of Methylene Blue. Molecules 2023, 28, 3410. [Google Scholar] [CrossRef]
  20. Fakhar, A.; Canatoy, R.C.; Galgo, S.J.C.; Rafique, M.; Sarfraz, R. Advancements in modified biochar production techniques and soil application: A critical review. Fuel 2025, 400, 135745. [Google Scholar] [CrossRef]
  21. Zhang, L.; Chang, L.; Liu, H.; de Jesus Puy Alquiza, M.; Li, Y. Biochar application to soils can regulate soil phosphorus availability: A review. Biochar 2025, 7, 13. [Google Scholar] [CrossRef]
  22. Lu, Q.; Zhang, Z.-B.; Yang, X.-C.; Dong, C.-Q.; Zhu, X.-F. Catalytic fast pyrolysis of biomass impregnated with K3PO4 to produce phenolic compounds: Analytical Py-GC/MS study. J. Anal. Appl. Pyrolysis 2013, 104, 139–145. [Google Scholar] [CrossRef]
  23. Zhurinsh, A.; Dobele, G.; Pomilovskis, R.; Volperts, A.; Jurkjane, V. Evolution of 1,6-anhydrosugars in the pyrolysis of biomass with phosphoric acid and P-containing activated carbon. Catal. Today 2021, 367, 51–57. [Google Scholar] [CrossRef]
  24. Liu, C.; Liu, X.; He, Y.; An, X.; Fan, D.; Wu, Z. Microwave-assisted catalytic pyrolysis of apple wood to produce biochar: Co-pyrolysis behavior, pyrolysis kinetics analysis and evaluation of microbial carriers. Bioresour. Technol. 2021, 320, 124345. [Google Scholar] [CrossRef]
  25. Yang, L.; Tan, W.-F.; Mumford, K.; Ding, L.; Lv, J.-W.; Zhang, X.-W.; Wang, H.-Q. Effects of phosphorus-rich sawdust biochar sorption on heavy metals. Sep. Sci. Technol. 2018, 53, 2704–2716. [Google Scholar] [CrossRef]
  26. Xiang, W.; Gan, L.H.; Wang, Y.; Yang, N.W.; Wang, W.J.; Li, L.J.; Liu, Z.J.; Feng, Y.P.; Chen, D.F.; Wang, R.J. Enhanced adsorption performance of phosphoric acid activated biochar from in-situ pre-carbonized bamboo shoot shells. Ind. Crops Prod. 2025, 226, 120719. [Google Scholar] [CrossRef]
  27. Zhang, H.; Liao, W.; Zhou, X.; Shao, J.; Chen, Y.; Zhang, S.; Chen, H. Coeffect of pyrolysis temperature and potassium phosphate impregnation on characteristics, stability, and adsorption mechanism of phosphorus-enriched biochar. Bioresour. Technol. 2022, 344, 126273. [Google Scholar] [CrossRef]
  28. Luo, Y.; Li, Z.P.; Xu, H.C.; Xu, X.Y.; Qiu, H.; Cao, X.D.; Zhao, L. Development of phosphorus composite biochar for simultaneous enhanced carbon sink and heavy metal immobilization in soil. Sci. Total Environ. 2022, 831, 154845. [Google Scholar] [CrossRef] [PubMed]
  29. Hu, Q.; Tang, Z.; Yao, D.; Yang, H.; Shao, J.; Chen, H. Thermal behavior, kinetics and gas evolution characteristics for the co-pyrolysis of real-world plastic and tyre wastes. J. Clean. Prod. 2020, 260, 121102. [Google Scholar] [CrossRef]
  30. Liu, H.; Chen, B.; Wang, C. Pyrolysis kinetics study of biomass waste using Shuffled Complex Evolution algorithm. Fuel Process. Technol. 2020, 208, 106509. [Google Scholar] [CrossRef]
  31. Noda, I. Generalized 2-Dimensional Correlation Method Applicable to Infrared, Raman, and Other Types of Spectroscopy. Appl. Spectrosc. 1993, 47, 1329–1336. [Google Scholar] [CrossRef]
  32. Lasch, P.; Noda, I. Two-Dimensional Correlation Spectroscopy (2D-COS) for Analysis of Spatially Resolved Vibrational Spectra. Appl. Spectrosc. 2019, 73, 359–379. [Google Scholar] [CrossRef]
  33. Hou, L.; Wu, P.-y. Applications of Two-dimensional Correlation Infrared Spectroscopy in the Characterization of Polymers. Acta Polym. Sin. 2022, 53, 522–538. [Google Scholar] [CrossRef]
  34. Li, J.; Dou, B.; Zhang, H.; Zhang, H.; Chen, H.; Xu, Y.; Wu, C. Pyrolysis characteristics and non-isothermal kinetics of waste wood biomass. Energy 2021, 226, 120358. [Google Scholar] [CrossRef]
  35. Li, S.; Li, S.; Wang, C.; Zhu, X. Catalytic effects of ammonium dihydrogen phosphate on the pyrolysis of lignocellulosic biomass: Selective production of furfural and levoglucosenone. Fuel Process. Technol. 2020, 209, 106525. [Google Scholar] [CrossRef]
  36. Yi, H.; Yang, Z.; Tang, X.; Zhao, S.; Gao, F.; Wang, J.; Huang, Y.; Yang, K.; Shi, Y.; Xie, X. Variations of apparent activation energy based on thermodynamics analysis of zeolitic imidazolate frameworks including pyrolysis and combustion. Energy 2018, 151, 782–798. [Google Scholar] [CrossRef]
  37. Jia, Y.; Lu, Y.; Zhang, G.; Liang, Y.; Zhang, F. Facile synthesis of an eco-friendly nitrogen-phosphorus ammonium salt to enhance the durability and flame retardancy of cotton. J. Mater. Chem. A 2017, 5, 9970–9981. [Google Scholar] [CrossRef]
  38. Wang, Y.; Alsmeyer, D.C.; McCreery, R.L. Raman-Spectroscopy of Carbon Materials—Structural Basis of Observed Spectra. Chem. Mater. 1990, 2, 557–563. [Google Scholar] [CrossRef]
  39. Sheng, C. Char structure characterised by Raman spectroscopy and its correlations with combustion reactivity. Fuel 2007, 86, 2316–2324. [Google Scholar] [CrossRef]
  40. Zhao, L.; Zheng, W.; Masek, O.; Chen, X.; Gu, B.; Sharma, B.K.; Cao, X. Roles of Phosphoric Acid in Biochar Formation: Synchronously Improving Carbon Retention and Sorption Capacity. J. Environ. Qual. 2017, 46, 393–401. [Google Scholar] [CrossRef]
  41. Puziy, A.M.; Poddubnaya, O.I.; Socha, R.P.; Gurgul, J.; Wisniewski, M. XPS and NMR studies of phosphoric acid activated carbons. Carbon 2008, 46, 2113–2123. [Google Scholar] [CrossRef]
  42. Yang, H.; Yu, Y.; Zhang, H.; Wang, W.; Zhu, J.; Chen, Y.; Zhang, S.; Chen, H. Effect mechanism of phosphorous-containing additives on carbon structure evolution and biochar stability enhancement. Biochar 2024, 6, 39. [Google Scholar] [CrossRef]
  43. Chu, G.; Zhao, J.; Huang, Y.; Zhou, D.; Liu, Y.; Wu, M.; Peng, H.; Zhao, Q.; Pan, B.; Steinberg, C.E.W. Phosphoric acid pretreatment enhances the specific surface areas of biochars by generation of micropores. Environ. Pollut. 2018, 240, 1–9. [Google Scholar] [CrossRef] [PubMed]
  44. Valero-Romero, M.J.; Garcia-Mateos, F.J.; Rodriguez-Mirasol, J.; Cordero, T. Role of surface phosphorus complexes on the oxidation of porous carbons. Fuel Process. Technol. 2017, 157, 116–126. [Google Scholar] [CrossRef]
  45. Yang, H.; Li, S.; Liu, B.; Chen, Y.; Xiao, J.; Dong, Z.; Gong, M.; Chen, H. Hemicellulose pyrolysis mechanism based on functional group evolutions by two-dimensional perturbation correlation infrared spectroscopy. Fuel 2020, 267, 117302. [Google Scholar] [CrossRef]
  46. Harvey, O.R.; Herbert, B.E.; Kuo, L.-J.; Louchouarn, P. Generalized Two-Dimensional Perturbation Correlation Infrared Spectroscopy Reveals Mechanisms for the Development of Surface Charge and Recalcitrance in Plant-Derived Biochars. Environ. Sci. Technol. 2012, 46, 10641–10650. [Google Scholar] [CrossRef]
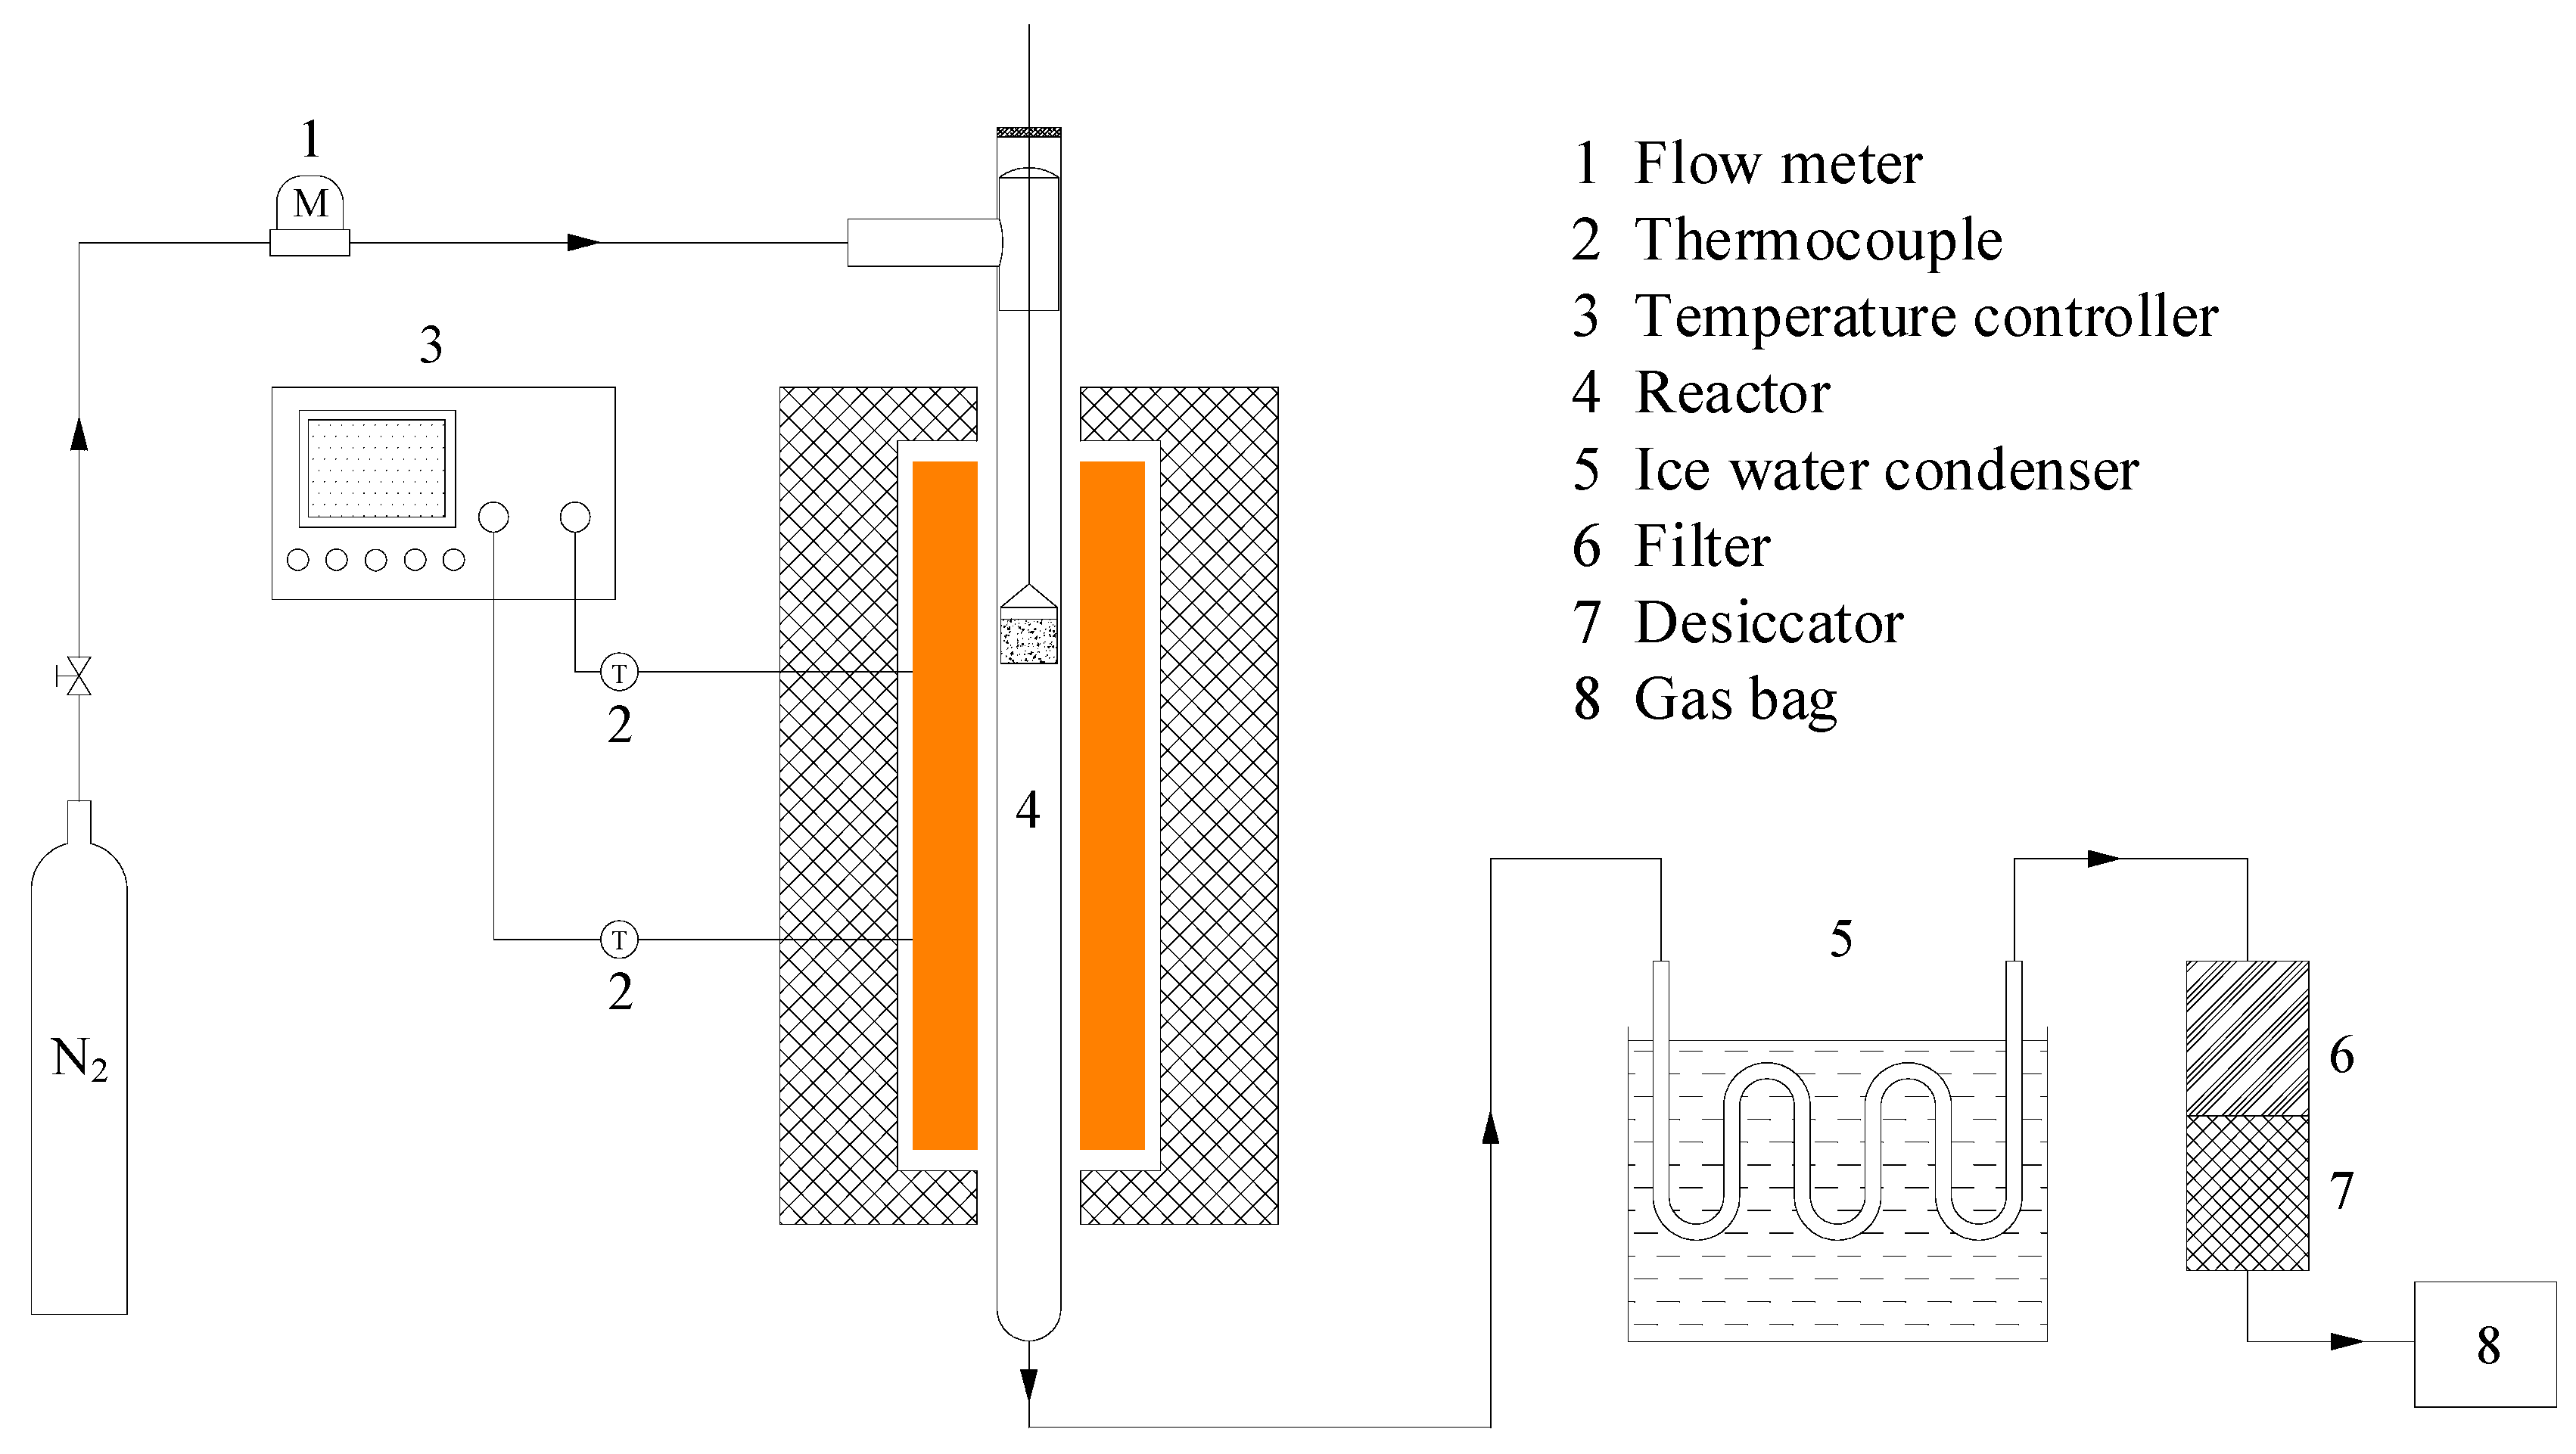
Figure 1. Schematic diagram of biomass pyrolysis system.
Energies 18 06165 g001
Figure 2. Co-pyrolysis of H3PO4 with mottled bamboo: (a) thermogravimetric analysis (TGA) curves and (b) differential thermogravimetric analysis (DTG) curves.
Energies 18 06165 g002
Figure 3. Kinetic plots of the two stages of MB and MB/H3PO4 pyrolysis: (a) the first stage, (b) the second stage.
Energies 18 06165 g003
Figure 4. Raman shifts of (a) MB and (b) MB/H3PO4 at different temperatures.
Energies 18 06165 g004
Figure 5. X-ray photoelectron spectroscopy of MB/H3PO4 prepared at different temperatures: (a) C1s spectra and (b) O1s spectra.
Energies 18 06165 g005
Figure 6. The wavenumber ranges of 2D-PCIS synchronous spectra for MB/H3PO4 prepared at different temperatures are (a) 3700–2800 cm−1, (c) 1800–900 cm−1, and (e) 900–700 cm−1; whereas the wavenumber ranges of the asynchronous spectra are (b) 3700–2800 cm−1, (d) 1800–900 cm−1, and (f) 900–700 cm−1.
Energies 18 06165 g006
Table 1. The parameters of different peaks in Raman shifts of MB and MB/H3PO4 prepared at different temperatures.
SamplesFWHG(D1)/cm−1FWHG(G)/cm−1IG/ITotalID1/IG
MB-400196.7589.2316.592.34
MB-500182.9078.6419.321.98
MB-600164.6078.5519.401.91
MB-700136.1776.4219.451.74
MB-800129.5476.3616.081.69
MB/H3PO4-400172.1578.8920.941.56
MB/H3PO4-500175.9870.8519.681.95
MB/H3PO4-600174.0170.3818.332.26
MB/H3PO4-700182.8075.4918.392.46
MB/H3PO4-800180.3078.6217.002.66
Table 2. Relative content of different peak areas in the X-ray diffraction spectra of MB/H3PO4 prepared at different temperatures.
SamplesC1sO1s
C-C/
C-H
C-O-C/
C-O-P
C=OCOO-π-π* SatelliteTotal of Oxygenated CarbonC=O/
P=O
C-O-C/
C-O-P
Chemisorbed Oxygen and/or Water
MB/H3PO4-40071.5218.774.863.131.7126.7627.4970.182.33
MB/H3PO4-50069.5318.266.483.632.1028.3724.2972.253.46
MB/H3PO4-60069.2117.396.604.552.2428.5424.9971.763.25
MB/H3PO4-70067.5519.666.424.052.3130.1323.1772.913.92
MB/H3PO4-80065.9719.707.394.372.5631.4625.1770.933.90
Disclaimer/Publisher’s Note: The statements, opinions and data contained in all publications are solely those of the individual author(s) and contributor(s) and not of MDPI and/or the editor(s). MDPI and/or the editor(s) disclaim responsibility for any injury to people or property resulting from any ideas, methods, instructions or products referred to in the content.