Article

Research on Vibration and Noise of Oil Immersed Transformer Considering Influence of Transformer Oil

1
College of Computer Science and Technology, Shenyang Institute of Engineering, Shenyang 110136, China
2
School of Electrical Engineering, Shenyang University of Technology, Shenyang 110136, China
*
Author to whom correspondence should be addressed.
Energies 2025, 18(23), 6155; https://doi.org/10.3390/en18236155
Submission received: 24 October 2025 / Revised: 18 November 2025 / Accepted: 20 November 2025 / Published: 24 November 2025

Abstract

This study investigates the vibration and noise characteristics of oil-immersed power transformers, with a particular focus on the influence of transformer oil on structural dynamics and acoustic emission. The research integrates multi-physics modelling, finite-element simulation, and field measurements to analyze the vibration transmission paths from the core and windings to the tank wall. A fluid–structure interaction (FSI) model is developed to account for the damping effect of insulating oil, and a correction factor is introduced to adjust modal parameters. Simulation results reveal that oil significantly enhances vibration propagation, especially in the vertical direction, while structural ribs and clamping configurations affect local vibration intensity. Noise simulations show that magnetostriction is the dominant source of audible sound, with harmonic components sensitive to load and voltage variations. Experimental validation using a portable sound level meter confirms the simulation trends and highlights the spatial variability of acoustic pressure. The findings provide a theoretical and practical basis for optimizing sensor placement and developing voiceprint-based diagnostic tools for transformer condition monitoring.

1. Introduction

The reliable and economic operation of power systems is increasingly contingent upon the health condition of strategic assets such as power transformers, gas-insulated switchgear (GIS) and rotating machines [1,2]. For more than a century, maintenance philosophies have evolved from reactive “fix-after-failure” regimes to proactive strategies that attempt to eliminate failures before they occur [3,4]. Reactive maintenance, dominant in the early twentieth century, imposed enormous costs because unplanned outages not only required expensive spare parts and emergency crews, but also caused cascading interruptions to industrial and residential consumers [5]. The subsequent adoption of time-based preventive maintenance (TBM) alleviated some of these drawbacks by introducing fixed intervals for inspection and overhaul; yet TBM is intrinsically haunted by the twin evils of “over-maintenance” and “under-maintenance” [6,7]. Excessive dismantling increases life-cycle cost and may even introduce infant mortality, whereas insufficient intervention leaves latent defects unattended. Condition-based maintenance (CBM), also termed predictive or prognostic maintenance, has therefore emerged as the third evolutionary step, facilitated by advances in sensing, signal processing and artificial intelligence [8,9]. CBM continuously observes incipient failure precursors—electrical, thermal, mechanical and chemical—and triggers maintenance only when the asset condition crosses a statistically validated threshold. In principle, CBM maximizes availability while minimizing both risk and cost [10,11].
Among all substation apparatus, power transformers are arguably the most critical single component; their sudden loss may entail weeks of lead time for replacement or rewinding, and consequential losses in the order of millions of dollars [12,13]. Transformers undergo complex ageing mechanisms: electrical stresses accelerate partial discharge (PD) activity, thermal gradients degrade cellulose insulation, and mechanical short-circuit forces provoke winding deformation [14,15]. Consequently, transformer life is governed by a multi-physics, multi-scale degradation process that is difficult to capture with purely physics-based models [16]. Continuous monitoring of dielectric, acoustic, thermal and chemical indicators is therefore essential. While dissolved gas analysis (DGA), frequency response analysis (FRA) and dielectric response measurements have reached maturity, they either require outage conditions or provide only periodic snapshots [17,18]. To complement these techniques, non-intrusive sensing modalities such as acoustic and vibration monitoring have gained prominence because they can be deployed on-line and at moderate cost [19,20]. The underlying premise is that any internal defect—be it PD, core looseness, winding distortion, or cooling system deterioration—manifests itself as a perturbation in the acoustic or mechanical signature emitted by the tank or enclosure.
Acoustic and vibrational diagnostics are not new. As early as 1991, Kindig et al. proposed the use of sound-intensity mapping to detect core and winding anomalies in large power transformers [21]. Since then, the literature has expanded to encompass four major categories of acoustic techniques: (i) ultrasonic partial discharge detection, (ii) combined acoustic and electromagnetic PD location, (iii) noise pattern analysis for global health assessment, and (iv) vibration monitoring for mechanical integrity. Each category has its own merits and limitations, which are briefly reviewed below.
(1)
Ultrasonic partial discharge detection
Partial discharge is both a symptom and an accelerator of insulation ageing. The sudden release of energy across a micro-void generates a pressure wave whose spectral content extends into the ultrasonic domain (>20 kHz). Early work relied on piezoelectric ceramic (PZT) sensors mounted on the tank wall [22,23]. PZT sensors are inexpensive and robust, but suffer from low sensitivity, poor repeatability and electromagnetic interference (EMI) in high-voltage environments. To overcome these shortcomings, fibre-optic ultrasonic sensors have been intensively investigated. In 2016, Zhang et al. developed a Michelson interferometric fibre sensor capable of detecting PD in 252 kV GIS [24]. A year later, Thomas Gräf’s group at TU Berlin demonstrated an ultra-miniature fibre Fabry–Perot sensor with sensitivity comparable to electrical PD detectors [25]. Yan Gao et al. reported a Sagnac interferometric configuration optimized for frequency response up to 300 kHz [26]. Peng Wei et al. further refined the Mach–Zehnder topology by tailoring the mandrel material and geometry to achieve resonance matching [27]. More recently, Zhou et al. deployed a Michelson fibre sensor on a 220 kV GIS and successfully located PD sources with centimetre-scale accuracy [28]. The common conclusion of these studies is that fibre-optic ultrasonic sensing offers immunity to EMI, intrinsic safety, and high spatial resolution; however, challenges remain in long-term stability, packaging ruggedness and cost.
(2)
Acousto-electrical joint detection
Although ultrasonic sensors can accurately locate PD, the relationship between acoustic magnitude and apparent charge is non-trivial. Conversely, ultra-high-frequency (UHF) electromagnetic sensors provide a direct measure of charge but poor spatial resolution. Cavallini et al. were among the first to combine UHF and ultrasonic measurements for GIS [29]. Building on this concept, Jiang et al. developed a joint time-of-flight algorithm that exploits the arrival time difference between the electromagnetic pulse and the acoustic wave, enabling three-dimensional PD localisation with sub-decimetre accuracy even under strong EMI [30]. Field trials on 550 kV GIS demonstrated that the combined approach not only locates defects but also quantifies their severity, thereby furnishing asset managers with actionable information.
(3)
Noise pattern analysis
Transformer noise originates from magnetostrictive forces in the core, electromagnetic forces in windings, and turbulent flow in cooling systems [31]. The resulting acoustic spectrum is a superposition of harmonics at integer multiples of twice the power frequency (100/120 Hz) and broadband components generated by fans and pumps. Any deviation—such as core loosening, winding clamping failure or DC bias in renewable-rich grids—alters the spectral fingerprint. Bassim et al. showed that changes in the acoustic intensity between 200 Hz and 1 kHz correlate with the degree of core ageing in shunt reactors [32]. More recent work by Gubbala et al. employed mel-frequency cepstral coefficients (MFCCs) and deep autoencoders to classify transformer acoustic signatures into healthy, minor and critical states with 95% accuracy [33]. The advantage of noise analysis lies in its global assessment capability; the drawback is that it is sensitive to ambient noise and requires sophisticated de-noising algorithms.
(4)
Vibration monitoring
Vibration sensing is conceptually similar to noise analysis but measures mechanical acceleration directly on the tank or cooling pipes. Ji et al. demonstrated that core looseness increases the 100 Hz component and introduces higher-order harmonics up to 800 Hz [34]. Short-circuit tests further revealed that winding deformation leads to a pronounced rise in the 400–600 Hz band due to radial and axial oscillations [35]. Bartoletti et al. proposed a distributed fibre Bragg grating (FBG) network to measure vibration along the tank circumference, achieving temperature-compensated strain resolution below 1 µε [36]. Recent advances in micro-electro-mechanical systems (MEMS) have enabled low-power wireless sensor nodes capable of synchronized sampling at 25 kHz with battery life exceeding five years [37]. Challenges include the influence of structural resonances, sensor attachment variability and data transmission in substation environments.
(5)
Voiceprint (acoustic fingerprint) diagnostics
The concept of “voiceprint” was first introduced by Bell Labs in 1945 for speaker identification [38]. In the context of power equipment, each transformer (or any other apparatus) can be viewed as a “speaker” whose voice is determined by its geometry, material properties and operating state. Once a baseline voiceprint is established, any deviation may indicate an anomaly. Early implementations used spectrograms and expert judgement, but these methods are labour-intensive and subjective. Statistical pattern recognition brought Gaussian mixture models (GMM) into play [39], followed by the I-vector framework that models inter-device variability in a low-dimensional subspace [40]. Deep learning has recently revolutionized the field: Google’s D-vector architecture (2014) uses a deep neural network (DNN) to map variable-length acoustic sequences into fixed-dimensional embeddings [41]. Subsequent improvements introduced attention mechanisms and end-to-end loss functions, pushing equal error rates below 1% in laboratory settings [42]. Pilot studies on 25 kV distribution transformers suggest that voiceprint diagnostics can detect tap-changer defects and cooling blockages weeks in advance of conventional alarms [43].
(6)
Digital twin for intelligent O&M
The ultimate vision is to merge multi-modal sensing with high-fidelity modelling into a digital twin that mirrors the physical asset in real time [44,45]. Two prerequisites must be satisfied: (i) non-invasive acquisition of multi-physics data (electrical, acoustic, thermal, etc.) under live conditions, and (ii) robust mapping between observable parameters and internal health states. The former is increasingly tractable thanks to the sensing technologies reviewed above; the latter remains an open research question. Physics-based models (e.g., finite-element magneto-mechanical simulations) are computationally expensive and require material parameters that drift with ageing. Data-driven models (e.g., deep neural networks) are flexible but demand large, labelled datasets that are scarce for in-service failures. Hybrid approaches that combine reduced-order physics with Bayesian updating appear most promising [46,47].

2. Structure of Oil Immersed Transformer and Composition of Vibration of Structural Parts

2.1. Structural Composition and Vibration Constituents of Oil-Immersed Power Transformers

Under rated service conditions, magnetostriction of the grain-oriented silicon-steel core excites periodic mechanical motion, while electromagnetic (EM) forces arising from load currents simultaneously drive the windings into vibration. Once these two primary sources couple, the composite vibrational energy propagates through the active part—comprising core, windings, clamping frames, and insulation—and subsequently through the cooling system, ultimately manifesting as measurable tank-wall vibration. The amplitude and spectral signature of this surface vibration are strongly correlated with the clamping integrity, axial and radial displacement, and deformation severity of both windings and core.
Operationally, the winding coil stack behaves as a multi-degree-of-freedom mass–spring–damper system subjected to intense EM impulsive loads, particularly under overload or short-circuit events. These forces initiate complex mechanical oscillations that entrain the core, insulating blocks, and structural clamps into synchronized motion. The resulting vibrational energy is conveyed to the external tank shell through two parallel channels: (i) the solid mechanical path provided by the core-clamp-tank assembly and (ii) the fluid-borne path mediated by the insulating oil. Concurrently, a fraction of the energy radiates as airborne acoustic waves.
Hence, the global vibration of an oil-immersed transformer originates from the superposition of at least two dominant sub-sources—the magnetic core and the current-carrying windings—augmented by weaker, but not negligible, contributions from auxiliary cooling equipment (e.g., fans and oil pumps). Spectrally, auxiliary-source vibrations are comparatively monochromatic, typically confined below 100 Hz, and therefore readily separable from the broadband signatures intrinsic to the active part. Figure 1 schematically depicts the principal vibration transmission pathways.
Structurally, the vibration energy generated within the windings reaches the tank via two dominant routes:
(1)
Structural conduction through the core-limb/yoke assembly followed by fluid coupling into the tank wall;
(2)
Direct fluid-borne transmission through the oil volume.
Conversely, core vibration is transferred through rigid mechanical joints between core and tank and is further diffused by hydrodynamic pressure waves in the oil.
Consequently, the observable tank-wall vibration comprises two superimposed phenomena: (i) vibration directly imparted through structural contact and pressure pulsation, and (ii) low-amplitude, high-frequency oil-pressure oscillations induced by localized core and winding motion. Because the relative contribution of each pathway is sensitive to design-specific geometric parameters, the spectral composition of tank vibration may differ among transformer types. Nevertheless, since the dominant excitation originates from the core and windings, continuous monitoring of tank-wall vibration provides a non-invasive diagnostic window into the mechanical integrity of the internal active part, thereby forming the theoretical cornerstone for vibration-based transformer condition monitoring.

2.2. Modelling of Core and Winding Vibrations in Power Transformers

The laminated core of a power transformer is typically constructed from grain-oriented silicon-steel sheets. Inter-laminar leakage fluxes at the joints produce electromagnetic (EM) forces that excite sheet vibrations, inter-sheet impacts, and frictional motions, giving rise to noise whose fundamental frequency is twice the supply frequency (100 Hz for a 50 Hz grid). Owing to the inherent nonlinearities of magnetostriction, the B–H curve, and the unequal magnetic path lengths of the inner and outer limbs, the flux waveforms contain higher-order harmonics. Consequently, the core-noise spectrum also exhibits integer multiples of the fundamental (i.e., 200 Hz, 300 Hz, …).
Recent advances in core-manufacturing technology—especially improved clamping forces and tighter stacking tolerances—have significantly reduced these EM-force-induced vibrations. Both theoretical and experimental studies on multi-step-lap joints have shown that the inter-sheet vibration component can be neglected for modern cores; hence, the dominant source of core vibration is magnetostrictive deformation.
The linear magnetostrictive strain ε of a silicon-steel sheet subjected to a magnetic field H is governed by
1 L d L d H = 2 ε s H c 2 | H |
where ε_s is the saturation magnetostrictive strain, H_c the coercive force, and L the sheet’s original length. Integrating (1) yields
ε = Δ L L = 2 ε s H c 2 0 H | H | d H = ε s H c 2 H 2
For no-load operation, the flux density in the core is
B = Φ A = V 0 N 1 A ω cos ω t = B 0 cos ω t
where Φ is the main flux, V0 the peak voltage, A the core cross-section, and N1 the primary turns. The corresponding magnetic field intensity is
H = B μ = B B s H c = B 0 B s H cos ω t
with B_s the saturation flux density and μ the permeability. Substituting (4) into (2) gives the magnetostrictive strain
ε = Δ L L = ε s B 0 2 B s 2 cos 2 ω t = ε s V 0 2 N 1 A ω B s 2 cos 2 ω t
Differentiating twice with respect to time, the acceleration of magnetostrictive vibration is
a = d 2 ( Δ L ) d t 2 = 2 ε s L V 0 2 N 1 A B s 2 cos 2 ω t
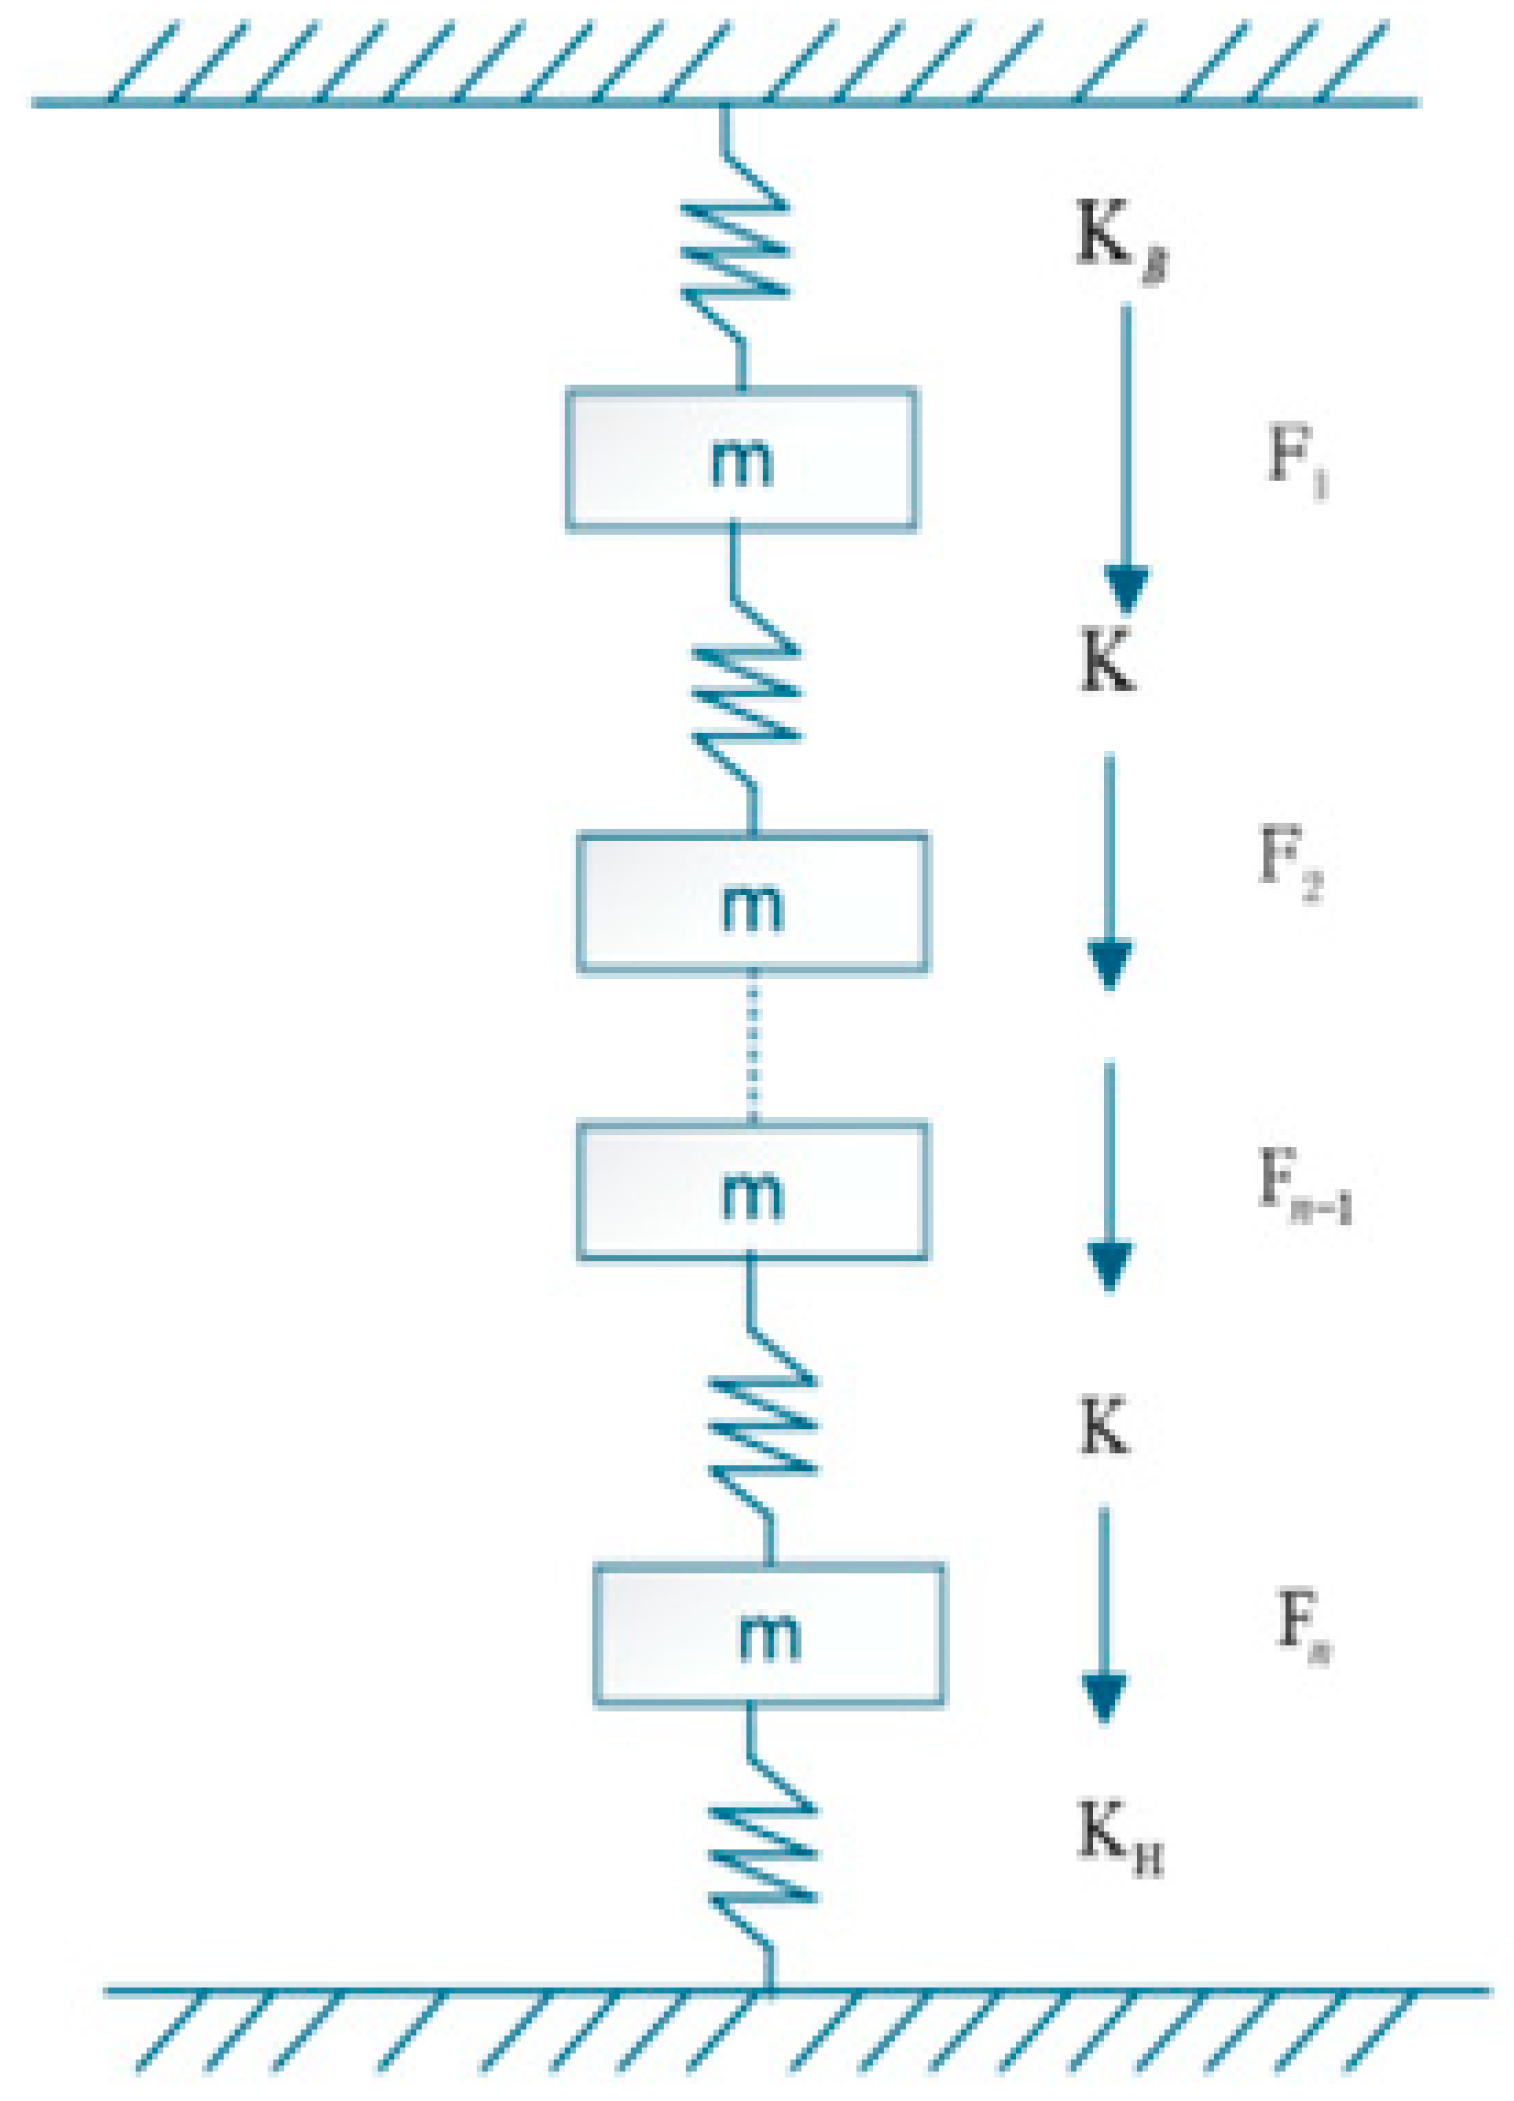
For the transformer windings, leakage flux between core and coils interacts with load currents, producing electromagnetic forces that act as distributed excitations. The winding assembly—comprising disk coils separated by insulating spacers and clamped between top and bottom yoke beams—can be modelled as a multi-degree-of-freedom (MDOF) elastic system, as illustrated in Figure 2.
Consider an elemental current segment dV immersed in a leakage-flux density B. The Lorentz force on the segment is
d F = d V B
The flux density itself is generated by the entire winding current distribution:
B = μ 4 π d V r 0 r 2
where r is the distance vector. Combining (7) and (8) reveals that the net electromagnetic force acting on the winding is proportional to the square of the load current. Because the resulting mechanical stress is transmitted through the structural stack, the winding vibration acceleration is likewise proportional to this force. Consequently, the vibration acceleration signal is proportional to the square of the load current, and its fundamental frequency is twice the supply frequency.

2.3. Modelling of Fluid–Structure Interaction Damping Between Transformer Oil and Structural Components

In oil-immersed power transformers, the vibration of the core and windings is strongly attenuated by hydrodynamic damping arising from the surrounding insulating oil. To incorporate this effect into a finite-element (FE) or lumped-parameter model, the excitation frequency and the associated damping coefficient must be quantified explicitly.
(1)
Excitation frequency
For both core and winding assemblies, the dominant mechanical frequency ωc is twice the electrical supply frequency ω, i.e.,
ω c = 2 ω
where ω is the grid angular frequency (e.g., 2π·50 rad s−1 or 2π·60 rad s−1).
(2)
Damping coefficient
The viscous damping coefficient α capturing energy dissipation in the oil–solid interface is expressed as
α = c ω c ρ ρ s
in which, c, speed of sound in the oil (≈1.4 × 10³ m s−1 at 20 °C). ρ, mass density of the vibrating solid (7.65 × 10³ kg m−3 for grain-oriented silicon steel or 8.96 × 10³ kg m−3 for copper conductors). ρ_s, mass density of the transformer mineral oil (≈0.88 × 10³ kg m−3).
(3)
Vibration correction factor
To compensate for added-mass effects and frequency shifts introduced by the fluid, a dimensionless correction factor β is introduced:
β = ρ ρ + ρ s
(4)
Implementation procedure
The derived damping coefficient α is applied as a viscous boundary condition on the wet surfaces of the core and winding FE models, whereas β is employed to scale the effective modal mass. The corrected modal response is then superimposed on the original undamped solution, yielding a complete vibration signature that rigorously accounts for fluid–structure interaction damping in oil-immersed transformers.

3. Simulation of Vibration and Noise of Oil Immersed Transformer

3.1. Vibration Simulation of the Active Part–Tank Assembly

3.1.1. Fundamental Assumptions and Boundary Conditions

(1)
Simplifications of the structural model
The transformer core–winding system is a high-order multi-degree-of-freedom (MDOF) structure; however, for linear modal analysis, the following simplifications are introduced:
  • All sub-domains are treated as homogeneous continua; the laminated core is regarded as a monolithic solid, and inter-laminar joints as well as yoke–limb interfaces are neglected.
  • Material nonlinearities are excluded from the modal solver.
(2)
Material properties
Windings: Solid copper, ρ_w = 8960 kg m−3, E_w = 1.10 × 10¹¹ Pa, ν_w = 0.35.
Core: Grain-oriented silicon-steel laminations, sheet thickness 0.23–0.35 mm. To account for stacking factor (k_sf = 0.93–0.97), the effective density is ρ_c = 7114.5–7420.5 kg m−3. The experimentally calibrated effective Young’s modulus is E_c = 1.50 × 10¹¹ Pa, and Poisson’s ratio ν_c = 0.29.
(3)
Boundary constraints
Two boundary sets are prescribed:
  • Free-free for all surfaces without mechanical contact;
  • Fixed constraints (all six DOFs set to zero) at the upper locating lugs and lower foot pads that anchor the core inside the tank.
(4)
Frequency range
The eigen-solution is sought over 0–10 kHz, and the first six mode shapes and natural frequencies are extracted.
(5)
Multi-physics coupling strategy
The vibration problem involves electromagnetic, structural, and fluid fields. Electromagnetic–structural coupling is achieved by applying magnetostrictive forces in the core and Lorentz forces in the windings. Structural–fluid coupling is realized by defining fluid–structure interaction (FSI) interfaces, with oil damping coefficients supplied in Section 2.3.
(6)
Magnetostrictive excitation
The magnetostrictive strain is defined as
λ = Δ L L
In practice, the magnetostrictive effect is equivalently represented as a body force
F ms = E λ
where E is the elastic modulus of the lamination.
The measurement process of the magnetostrictive coefficient is illustrated in Figure 3. The acquired data will be used in subsequent simulations and experiments.
An experimentally calibrated constitutive law for 30ZH120 steel is
λ silicon = 0.84 B 3 1.1 B 2 + 0.79 B
with B obtained from the preceding electromagnetic analysis.
(7)
Fluid modelling assumptions
To accelerate convergence while preserving accuracy, the oil is idealized as:
(a)
Weakly compressible (small pressure perturbations);
(b)
Inviscid (negligible viscous dissipation);
(c)
Laminar (natural-circulation pressure ≪ pump pressure);
(d)
Homogeneous.

3.1.2. Vibration Characteristics of the Active Part

To facilitate understanding and replication by other researchers, the transformer model adopted in this paper is the one provided by COMSOL Multiphysics 6.2 for modelling and simulation. The following boundary conditions were implemented in the finite element (FE) model:
Core clamping: Modelled using spring elements between core packets and clamping frames, with stiffness values derived from manufacturer specifications and static load-deflection tests.
Tank constraints: The tank base was considered fixed to the foundation, while the tank walls were modelled with elastic supports to account for welding and bracing effects.
Oil–structure coupling: Considering that transformer components in contact with oil are affected by it, we have developed an algorithm to determine the damping coefficient for core vibration calculations in oil-immersed transformers. This algorithm calculates the coefficient based on the core density, the oil density, and the core vibration frequency, using the formula:
α = 2 π c ω c ρ ρ s
The variables are defined as follows: α is the damping coefficient, c is the propagation speed, ωc is the core vibration frequency, ρ is the core density (valued according to the density of the core’s silicon steel), and ρ_s is the transformer oil density. This calculated damping coefficient can then equivalently represent the oil coupling for any surface in contact with the oil.
The objective is to quantify how accurately winding vibrations are transmitted to the tank and to identify the surface locations most sensitive to these vibrations. Full 3-D harmonic response analyses were conducted for several structural configurations.
(1)
Simultaneous winding and core excitation
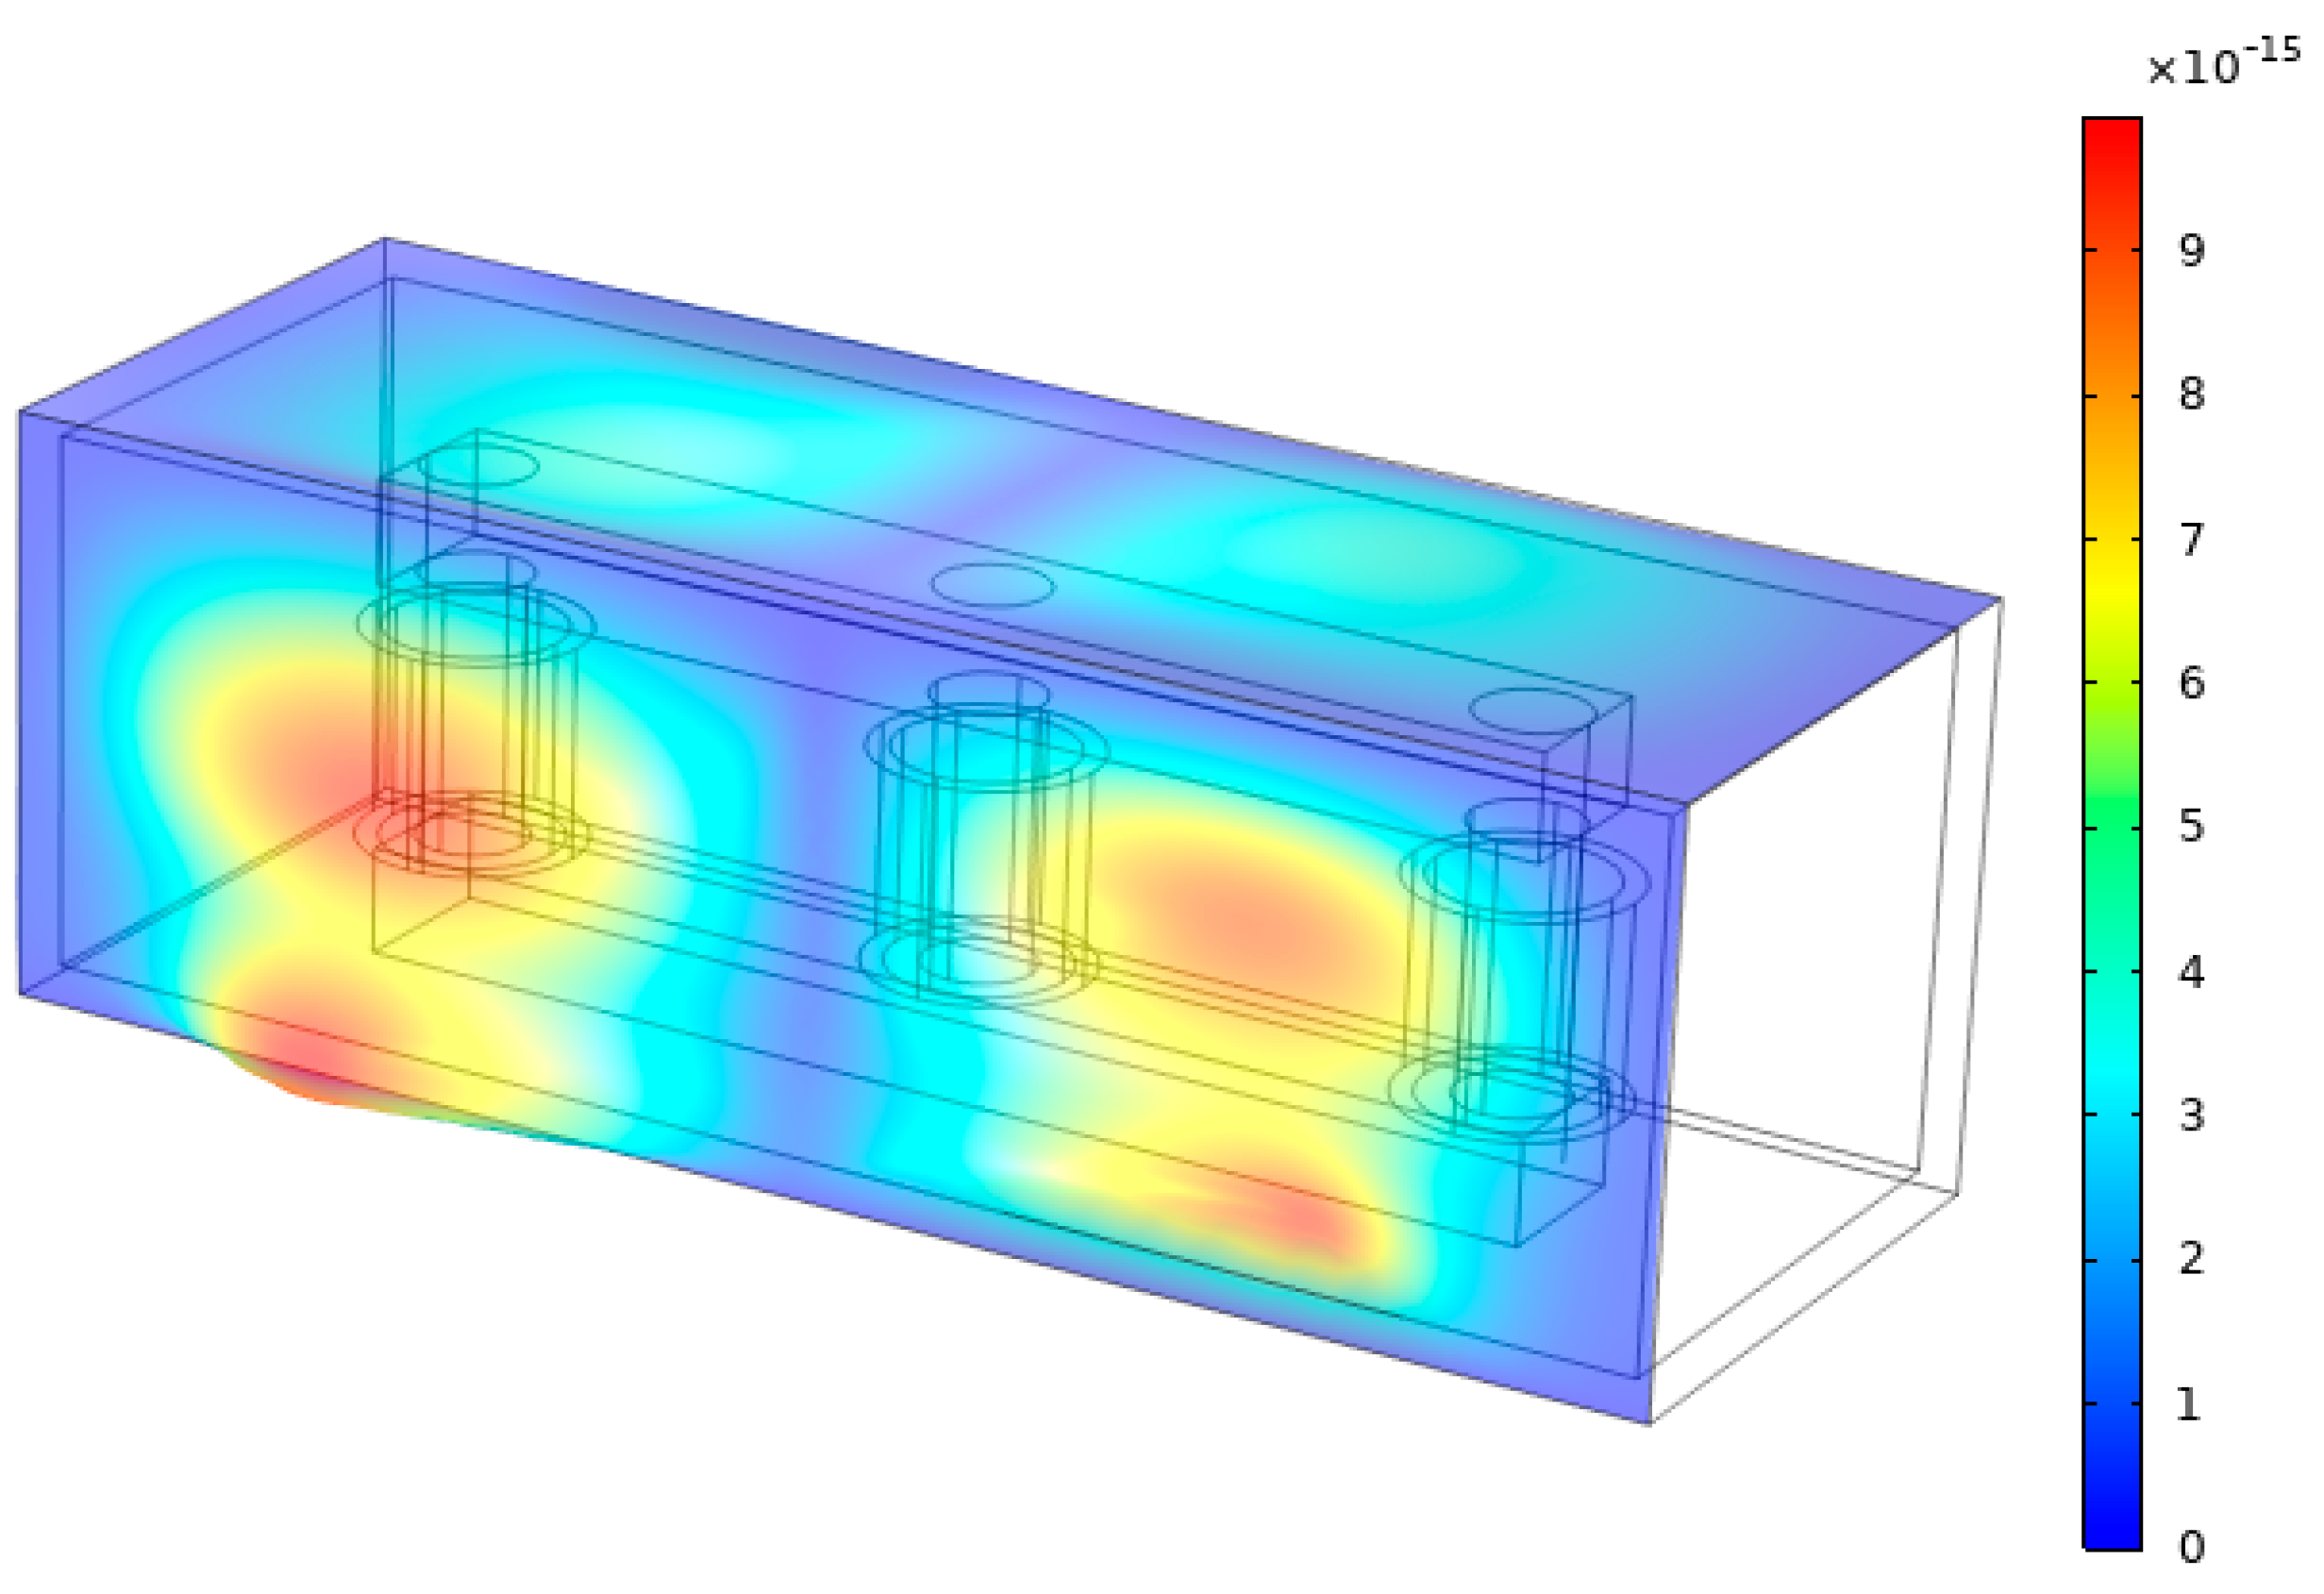
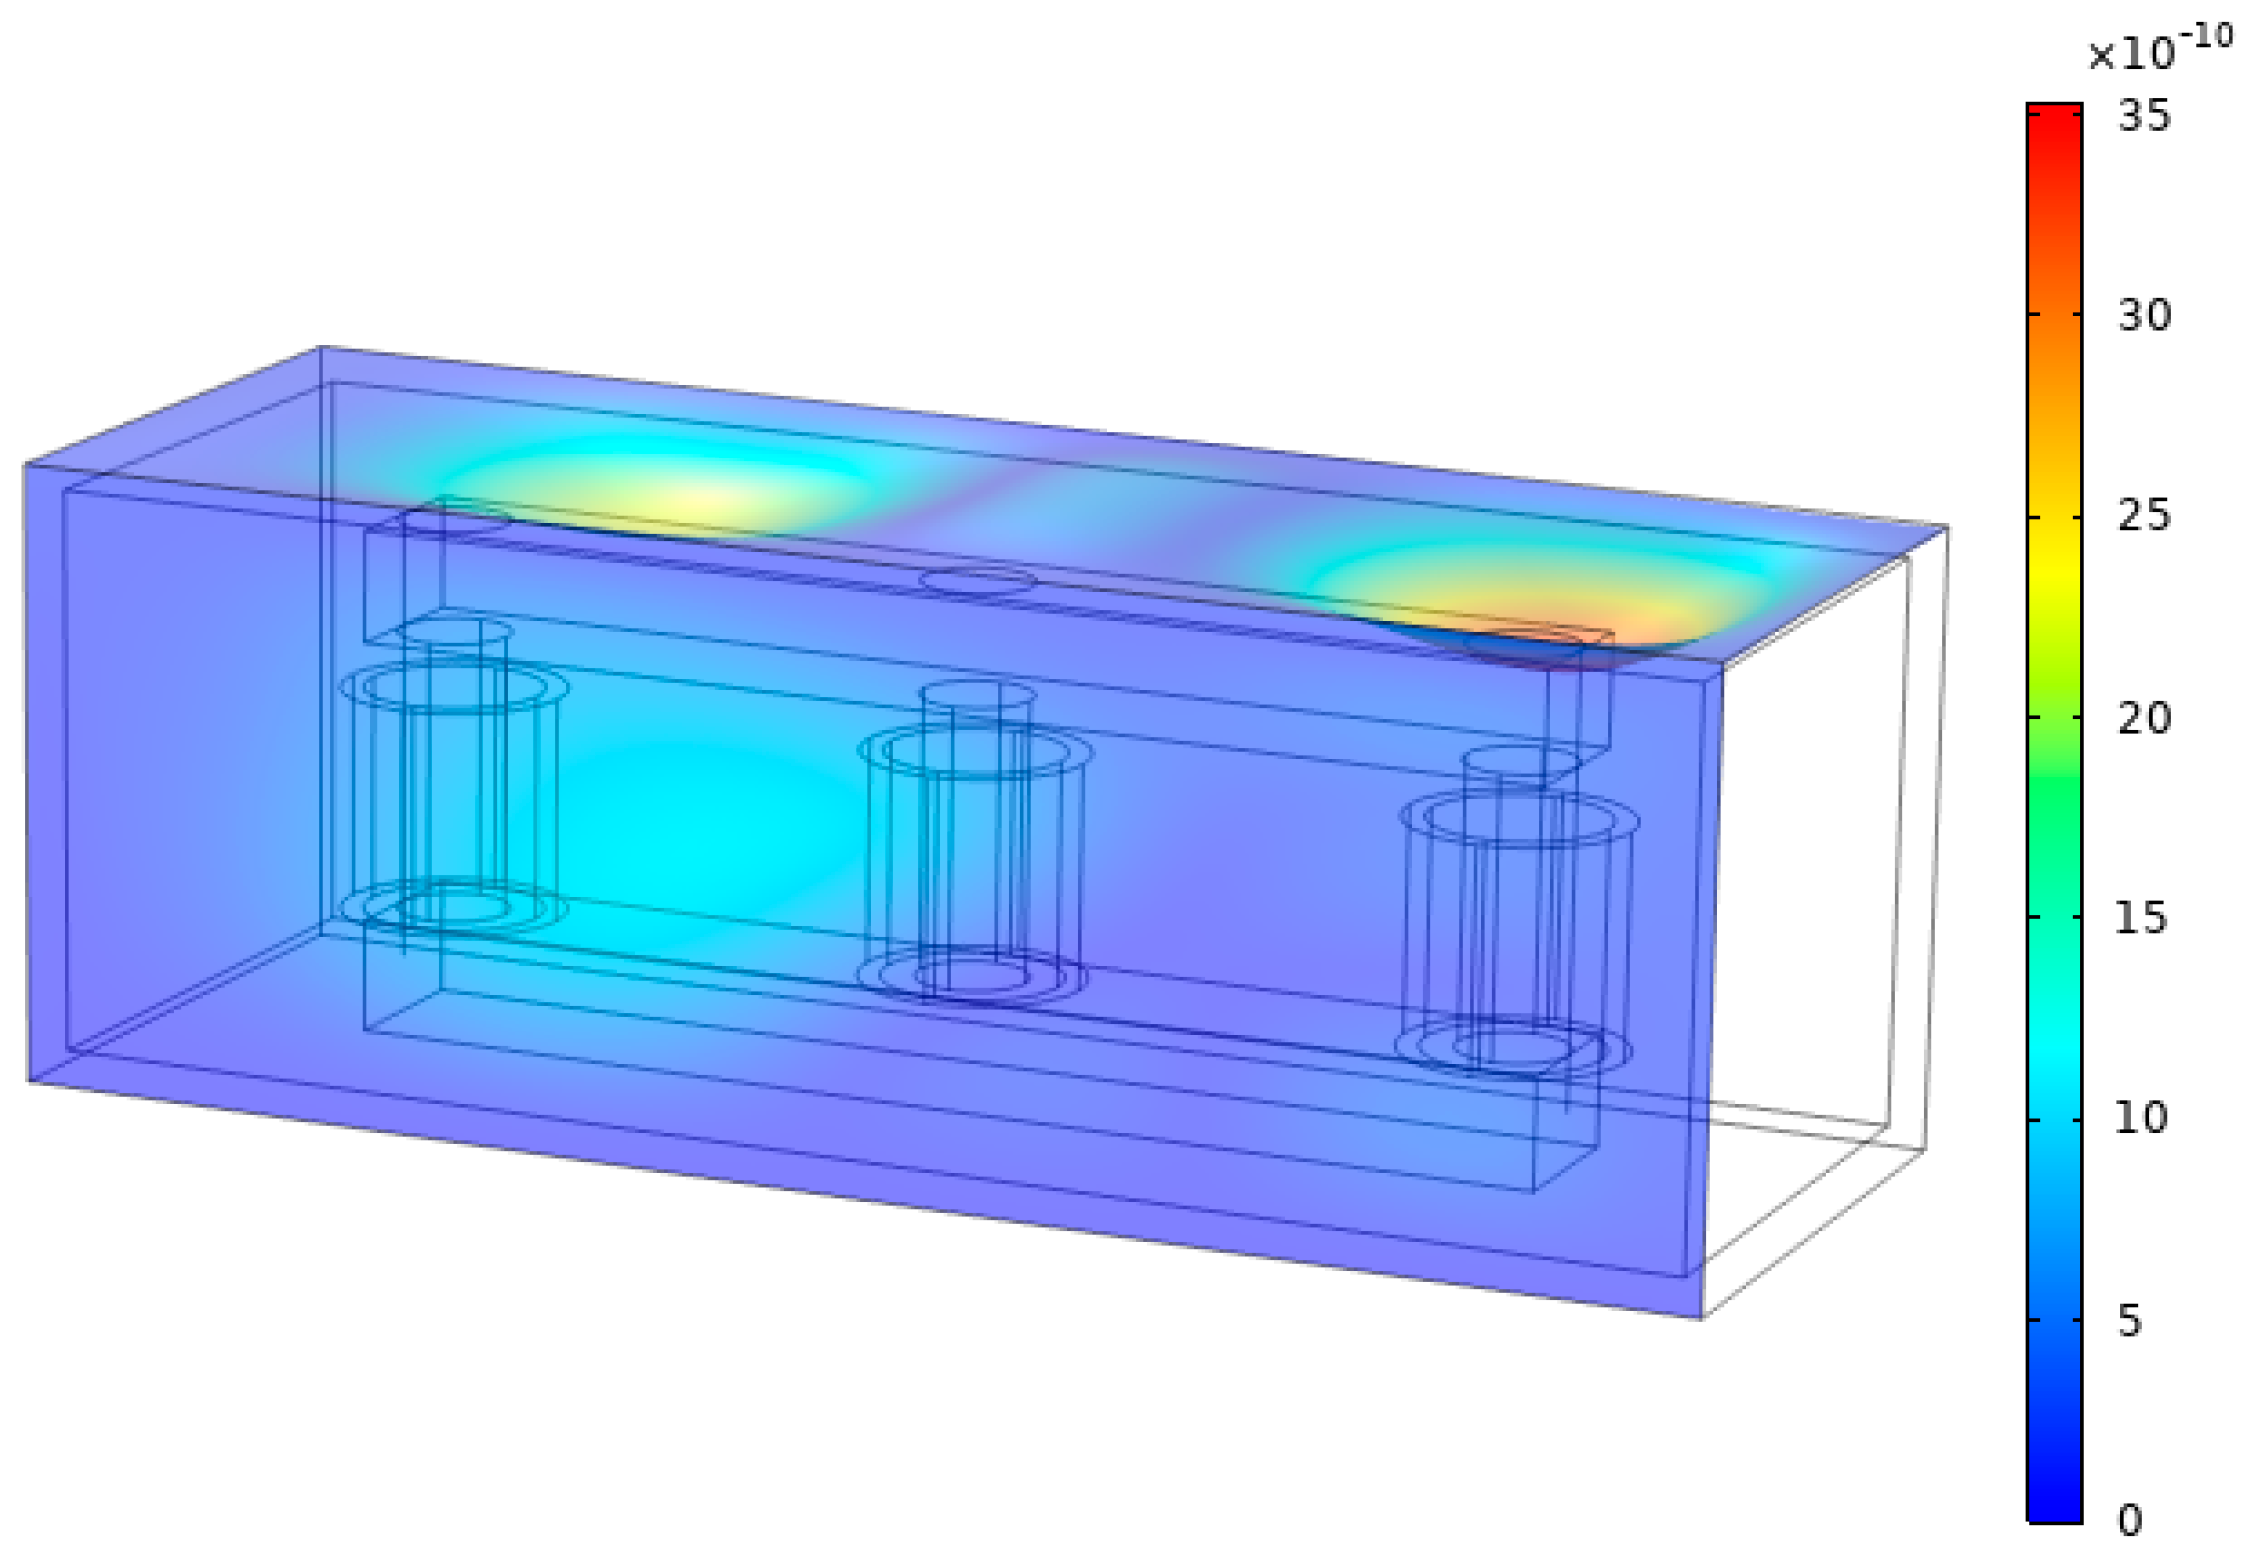
Figure 4 presents the tank-wall vibration pattern when both Lorentz forces in the windings and magnetostrictive forces in the core are applied. The vibration amplitude above phases A and C is markedly higher than that above phase B. Both the front (broadside) and the top faces of the tank exhibit measurable vibration, with the front face consistently displaying larger displacements.
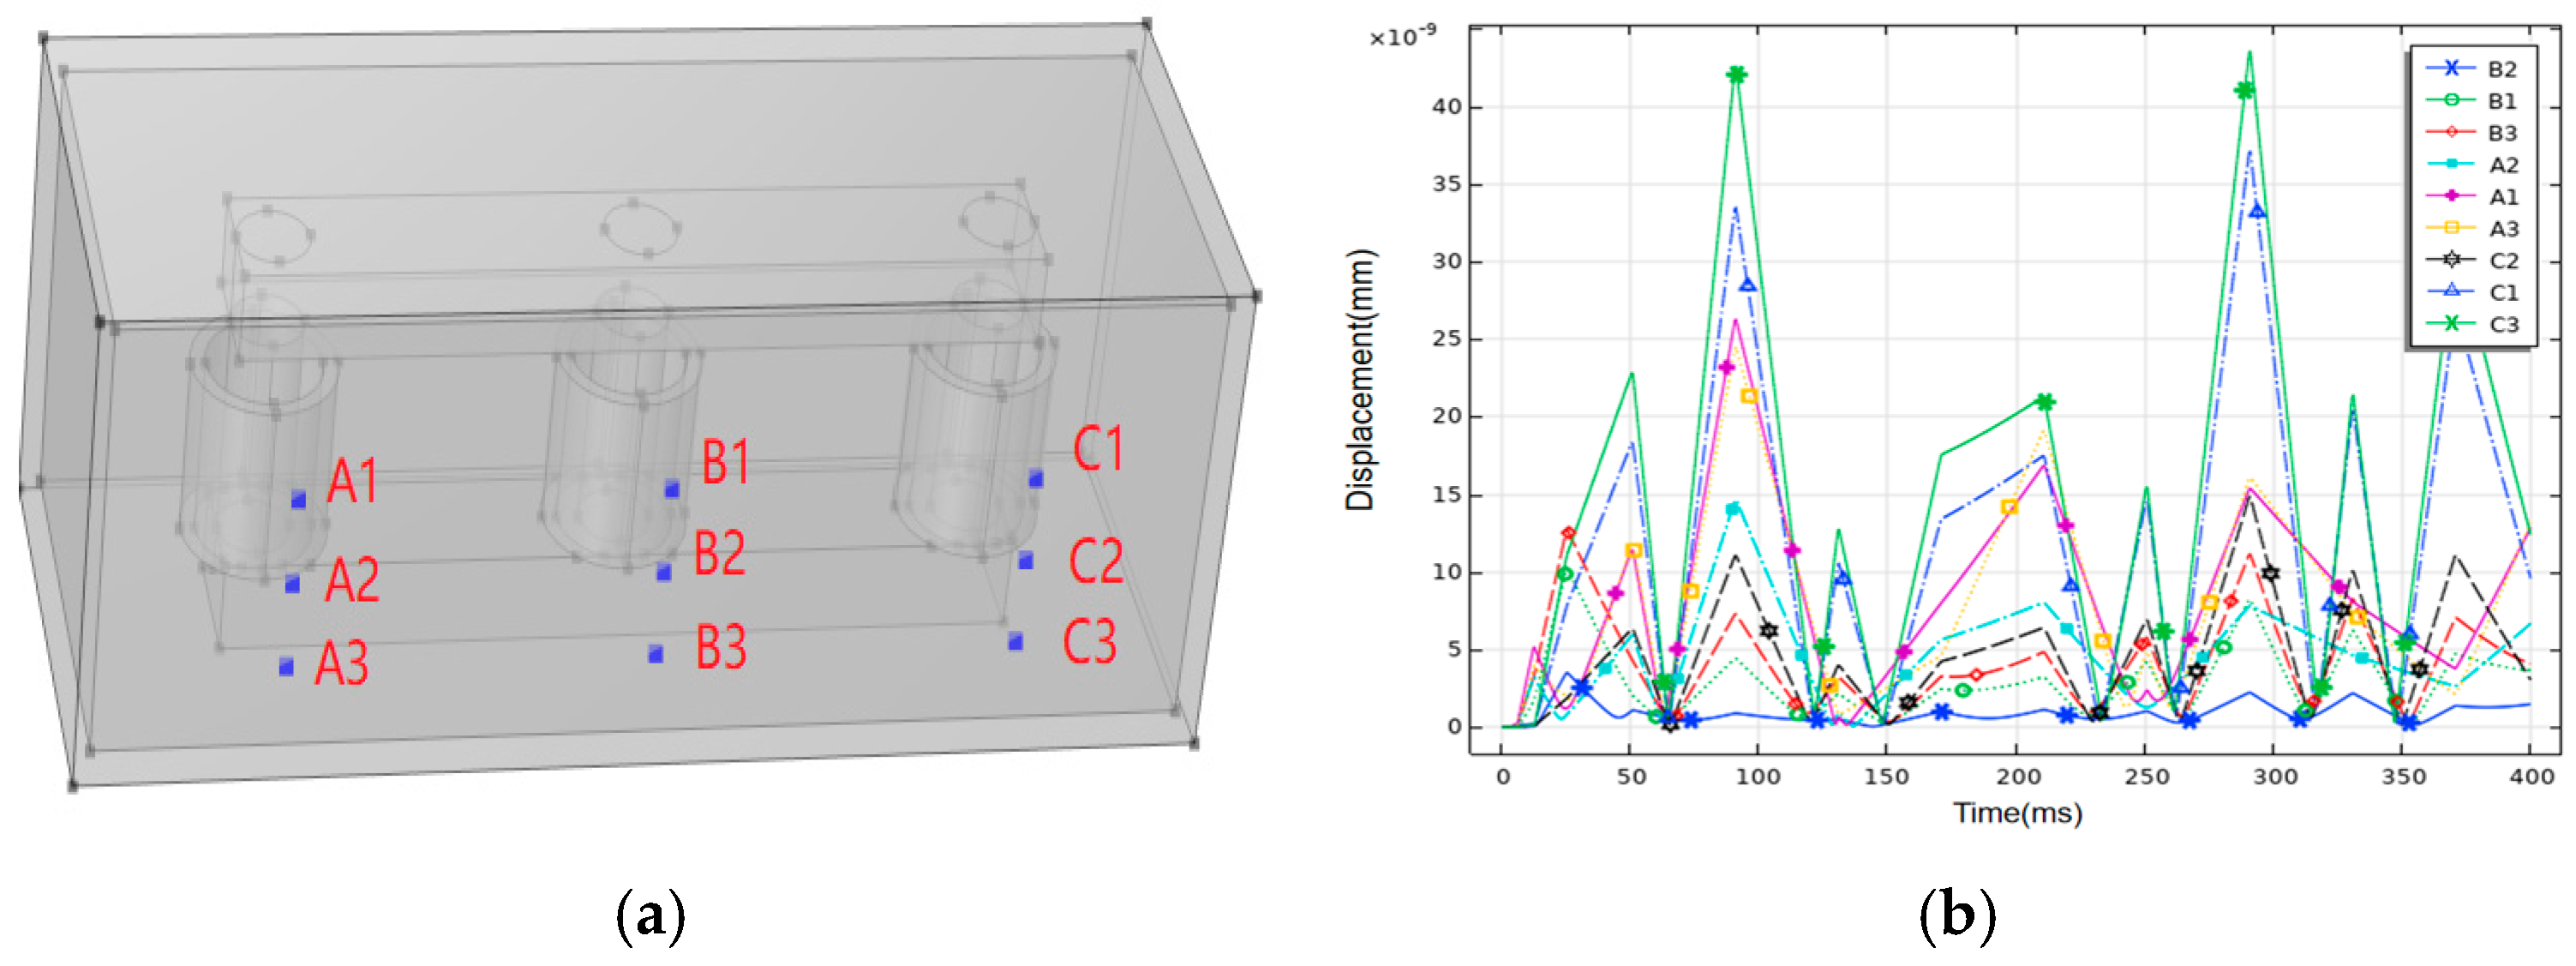
Point-wise sampling along the winding height (spacing = ½ winding height, Figure 5a) shows the displacement envelopes in Figure 5b. The amplitude hierarchy is bottom > top > mid-height, a trend that is repeated for all three phases. Consequently, when sensor resources are limited, priority should be given to locations directly facing the winding, especially at the bottom and top ends.
(2)
Winding-only excitation
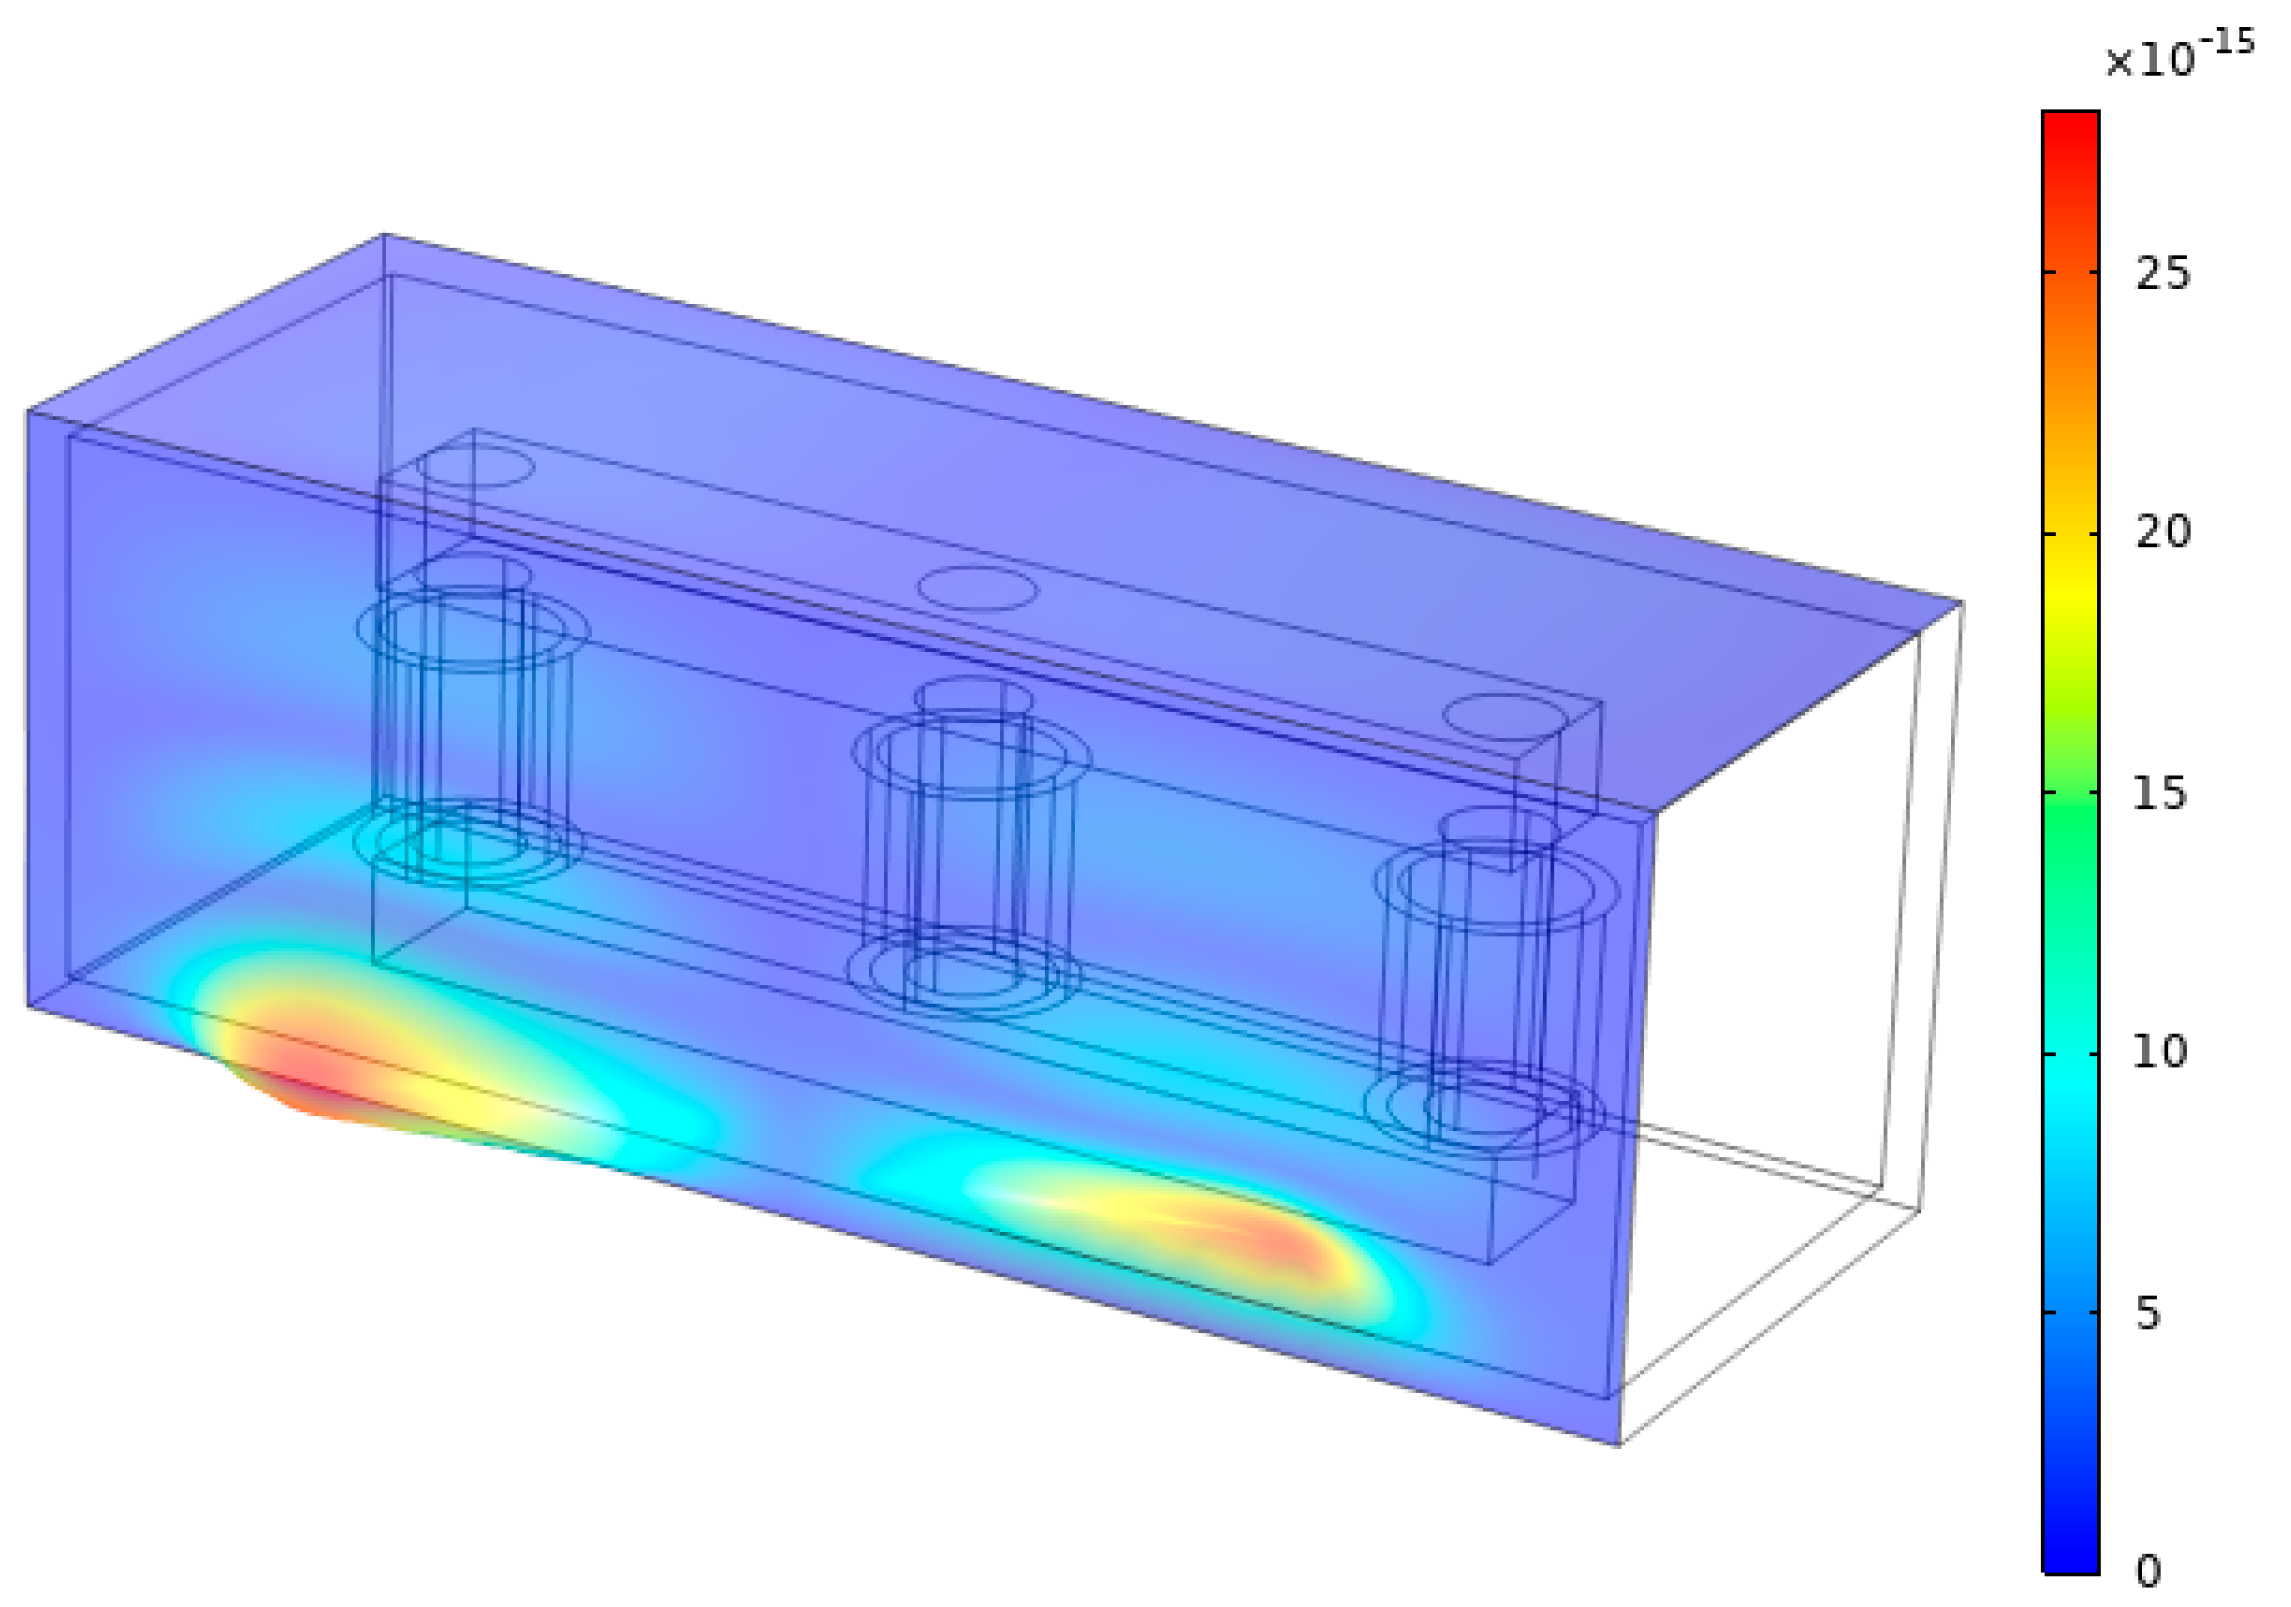
Figure 6 isolates the contribution of winding Lorentz forces (core excitation suppressed). Without core vibration, the top face becomes the dominant radiator, indicating that winding-induced motion reaches this surface preferentially through the oil path. The presence of core vibration partly attenuates this contribution; therefore, signals measured on the top face must be decomposed to separate winding- and core-related spectral components.
(3)
Influence of oil and stiffening ribs
Two principal transmission paths exist: (i) mechanical conduction through the lower clamping structure and the tank floor, and (ii) fluid-borne propagation via the bulk oil. Figure 4 and Figure 5 suggest that direct oil coupling dominates the front-face response, yet the pronounced bottom-end vibration does not preclude a significant contribution from the clamping path.
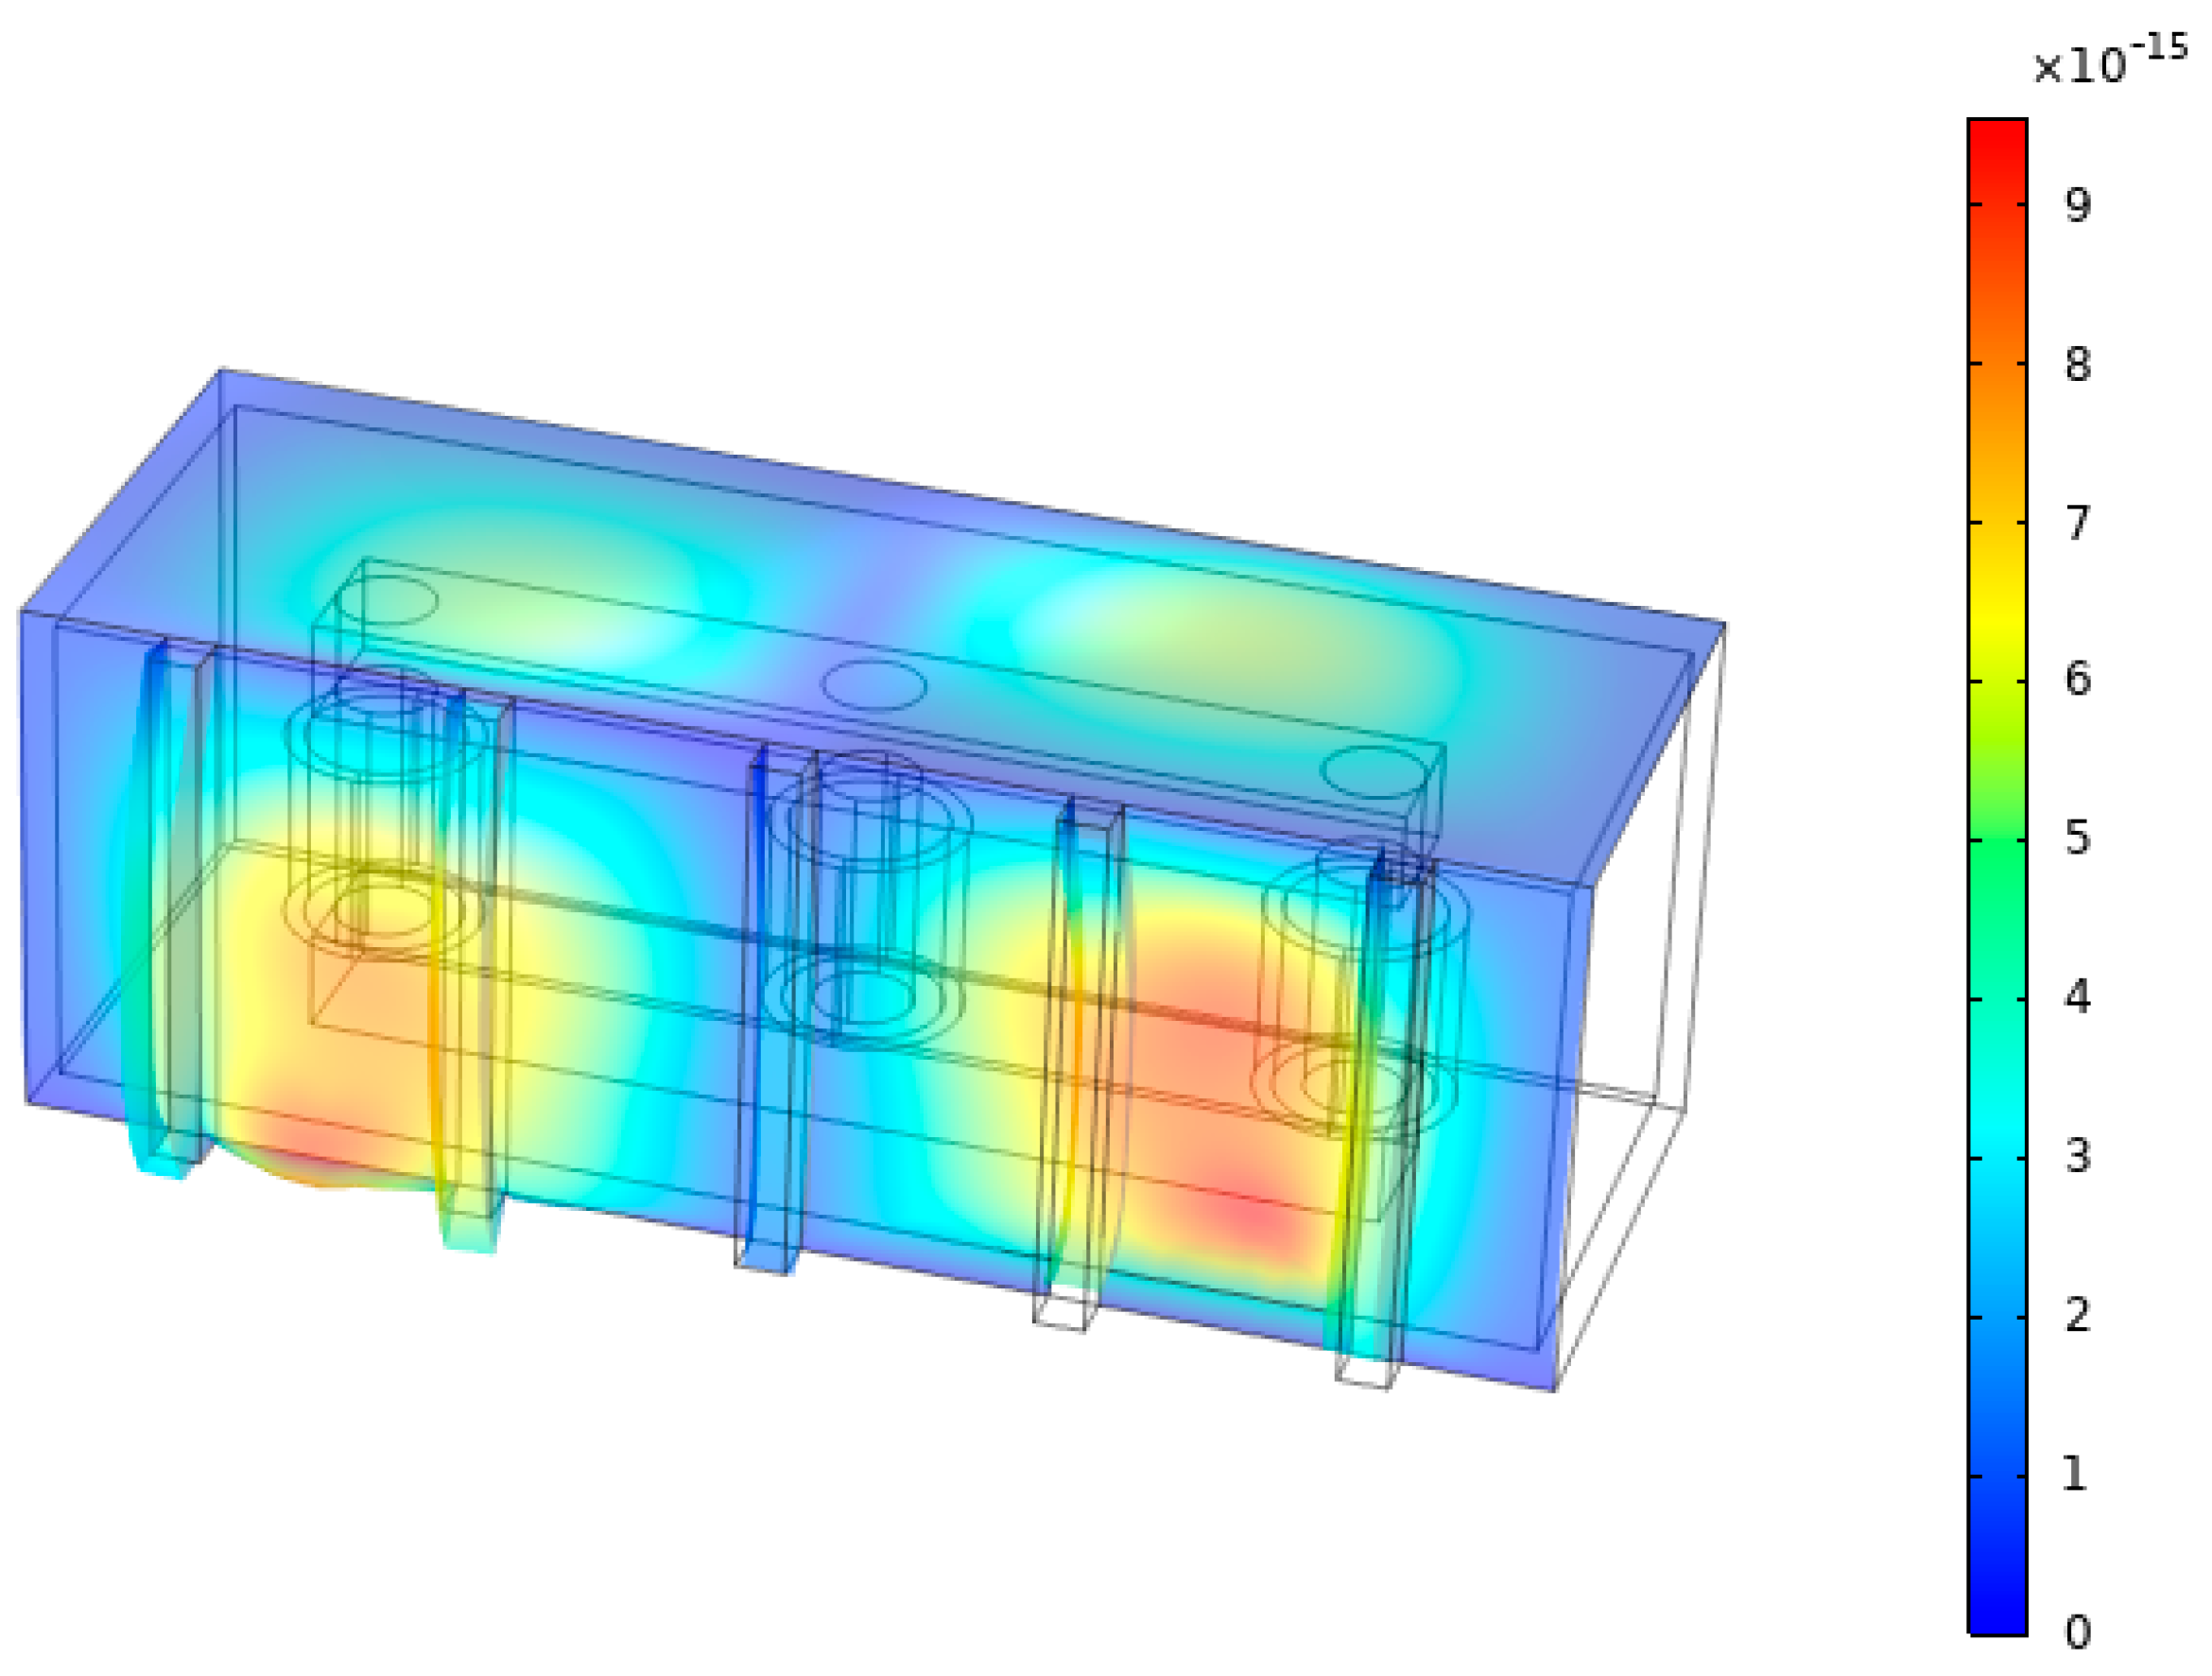
Figure 7 displays the surface vibration distribution when the oil is removed from the model. The pattern changes markedly: negligible vibration reaches the front face from the tank floor because the latter is fixed, underscoring the essential role of the oil in transmitting energy upwards.
Figure 8 illustrates the effect of circumferential stiffening ribs. The ribs obstruct horizontal wave propagation and locally intensify vibration at mid-height. Ribs aligned with winding projections also cause a local reduction in amplitude. These findings must be incorporated into sensor placement strategies to avoid both blind spots and misleading attenuation zones.

3.2. Noise Simulation for Oil-Immersed Transformers

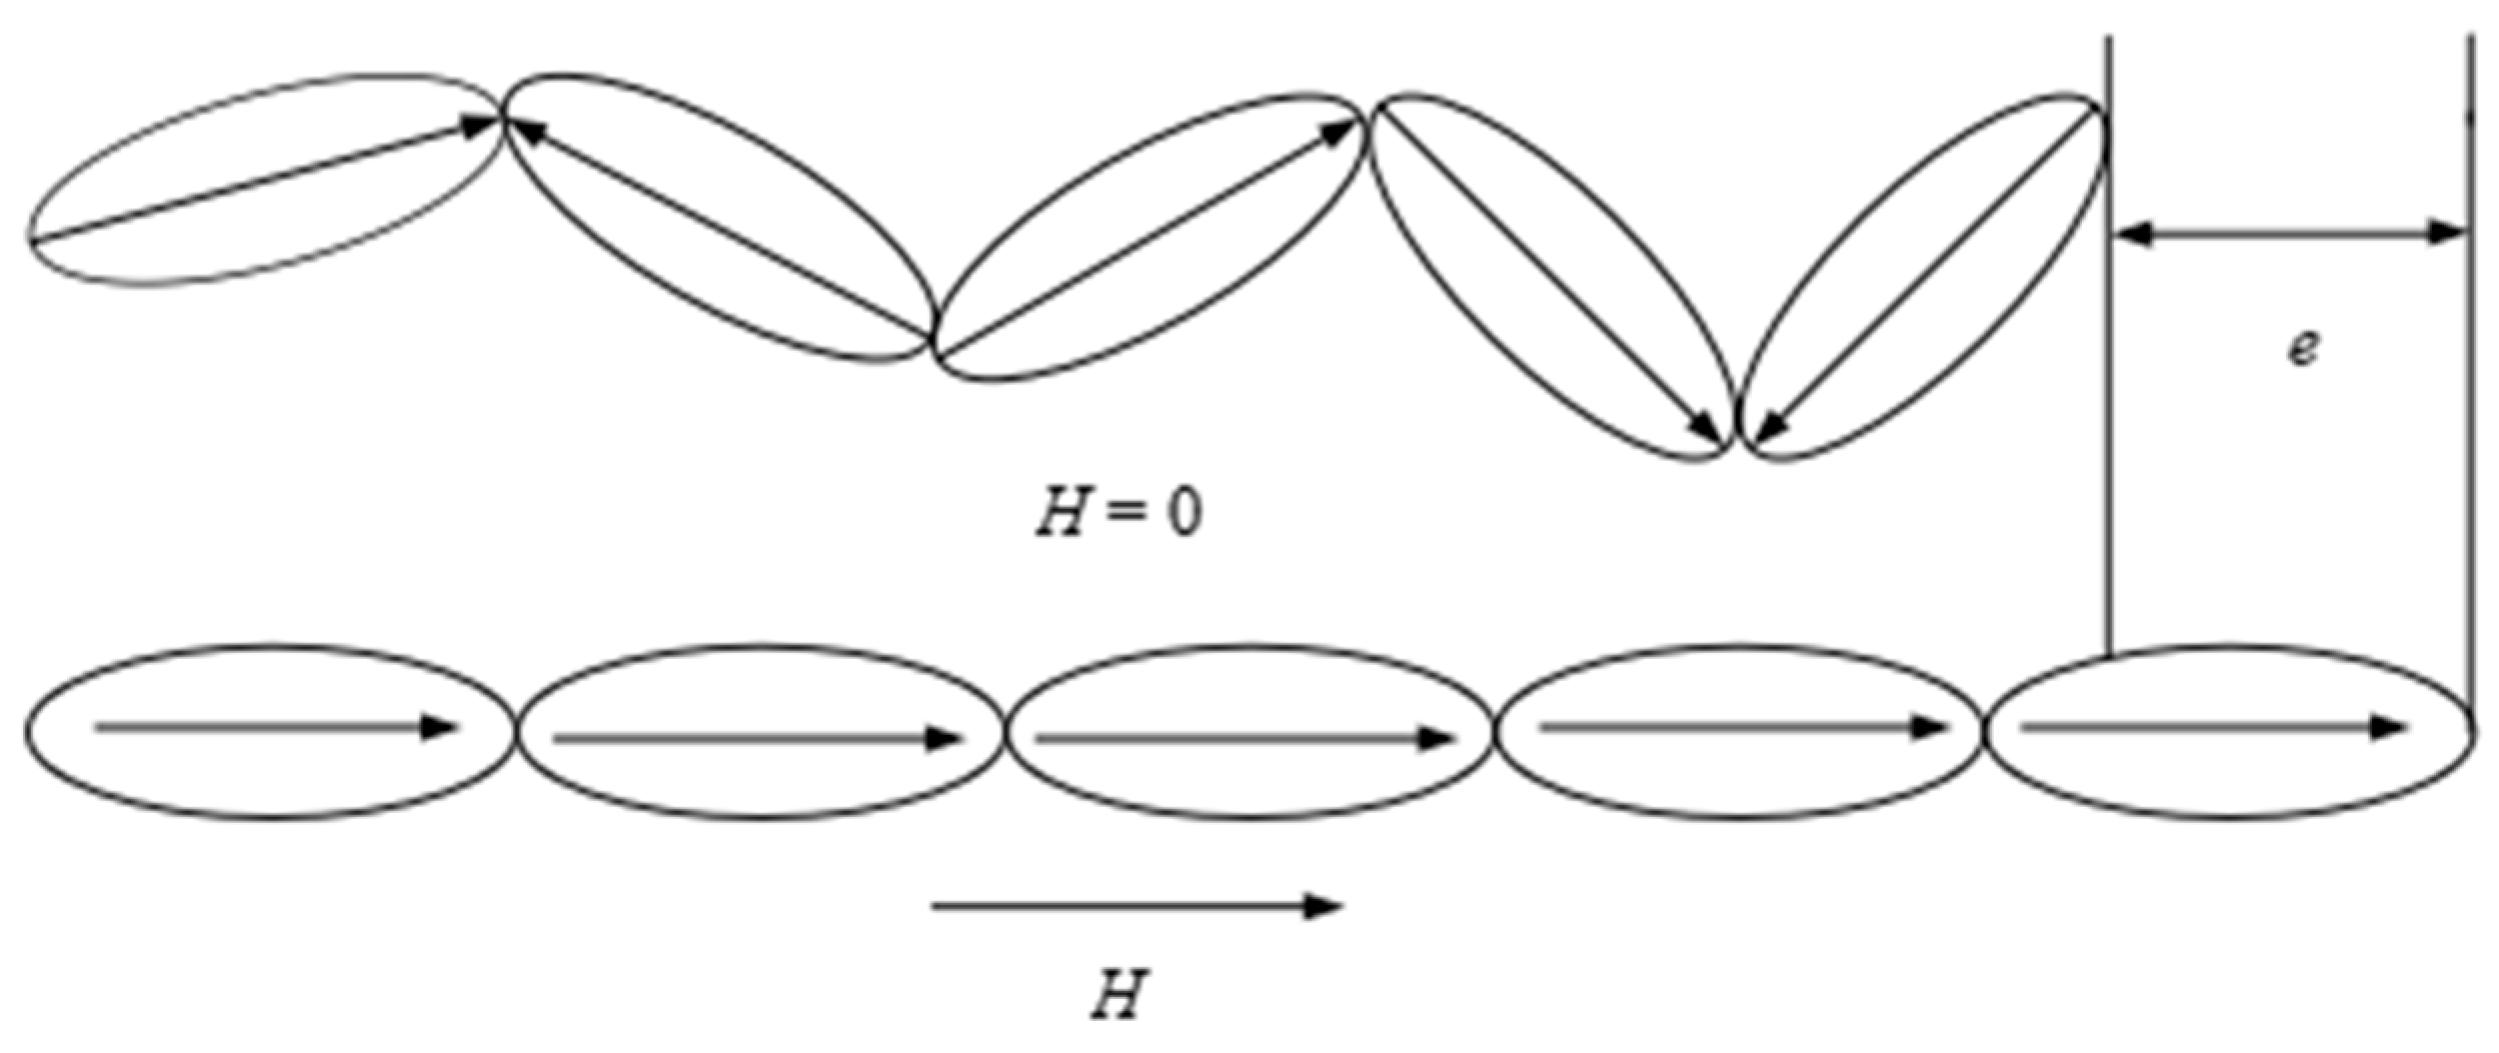
Sound is generated by the excitation of the core by alternating magnetic fields, which cause the silicon steel laminations to undergo magneto strictive vibrations, thereby producing an audible humming noise. The vibration resulting from electromagnetic forces produced by internal gaps and interlaminar leakage flux in silicon steel laminations is negligible. Thus, magnetostriction constitutes the dominant mechanism for acoustic emission from transformer cores. Figure 9 illustrates that in the absence of an external magnetic field, the distribution of magnetic domains is disordered and lacks regularity. However, following the application of a persistent external magnetic field, the domains undergo a rapid reorientation, achieving a uniform and orderly arrangement with identical directional alignment.
The period of deformation induced by magnetostriction is half the period of the alternating magnetic field variation. Consequently, the frequency of vibration generated by magnetostriction is twice that of the magnetic field frequency, i.e., twice the electrical current frequency. When the power frequency is 50 Hz, the core vibration frequency thus becomes 100 Hz. When the vibration of a transformer spreads as a sound source into the surrounding medium, forming sound waves, two conditions must be met: mechanical vibration and the presence of an elastic medium in the surrounding space. The change in air pressure at various points in space is denoted by p , which represents the sound pressure. The effective value of the sound pressure is taken logarithmically to characterize the intensity of the vibration. This numerical value representing the intensity of sound vibration is called the sound pressure level, denoted by L p , with the unit of decibels (dB), defined as
L p = 20 lg p p 0
Among these, p represents the effective value of the sound pressure, while p 0 denotes the reference sound pressure. For air, this value is 2 × 10⁻⁵ Pa, which corresponds to the minimum sound pressure perceptible to the human ear.
The propagation process of vibrations generated by transformers can be described by the hydrodynamic Stokes equations, where the wave equation for vibrations in air is expressed as
1 c 2 2 P t 2 2 P = 0
where c represents the speed of sound.
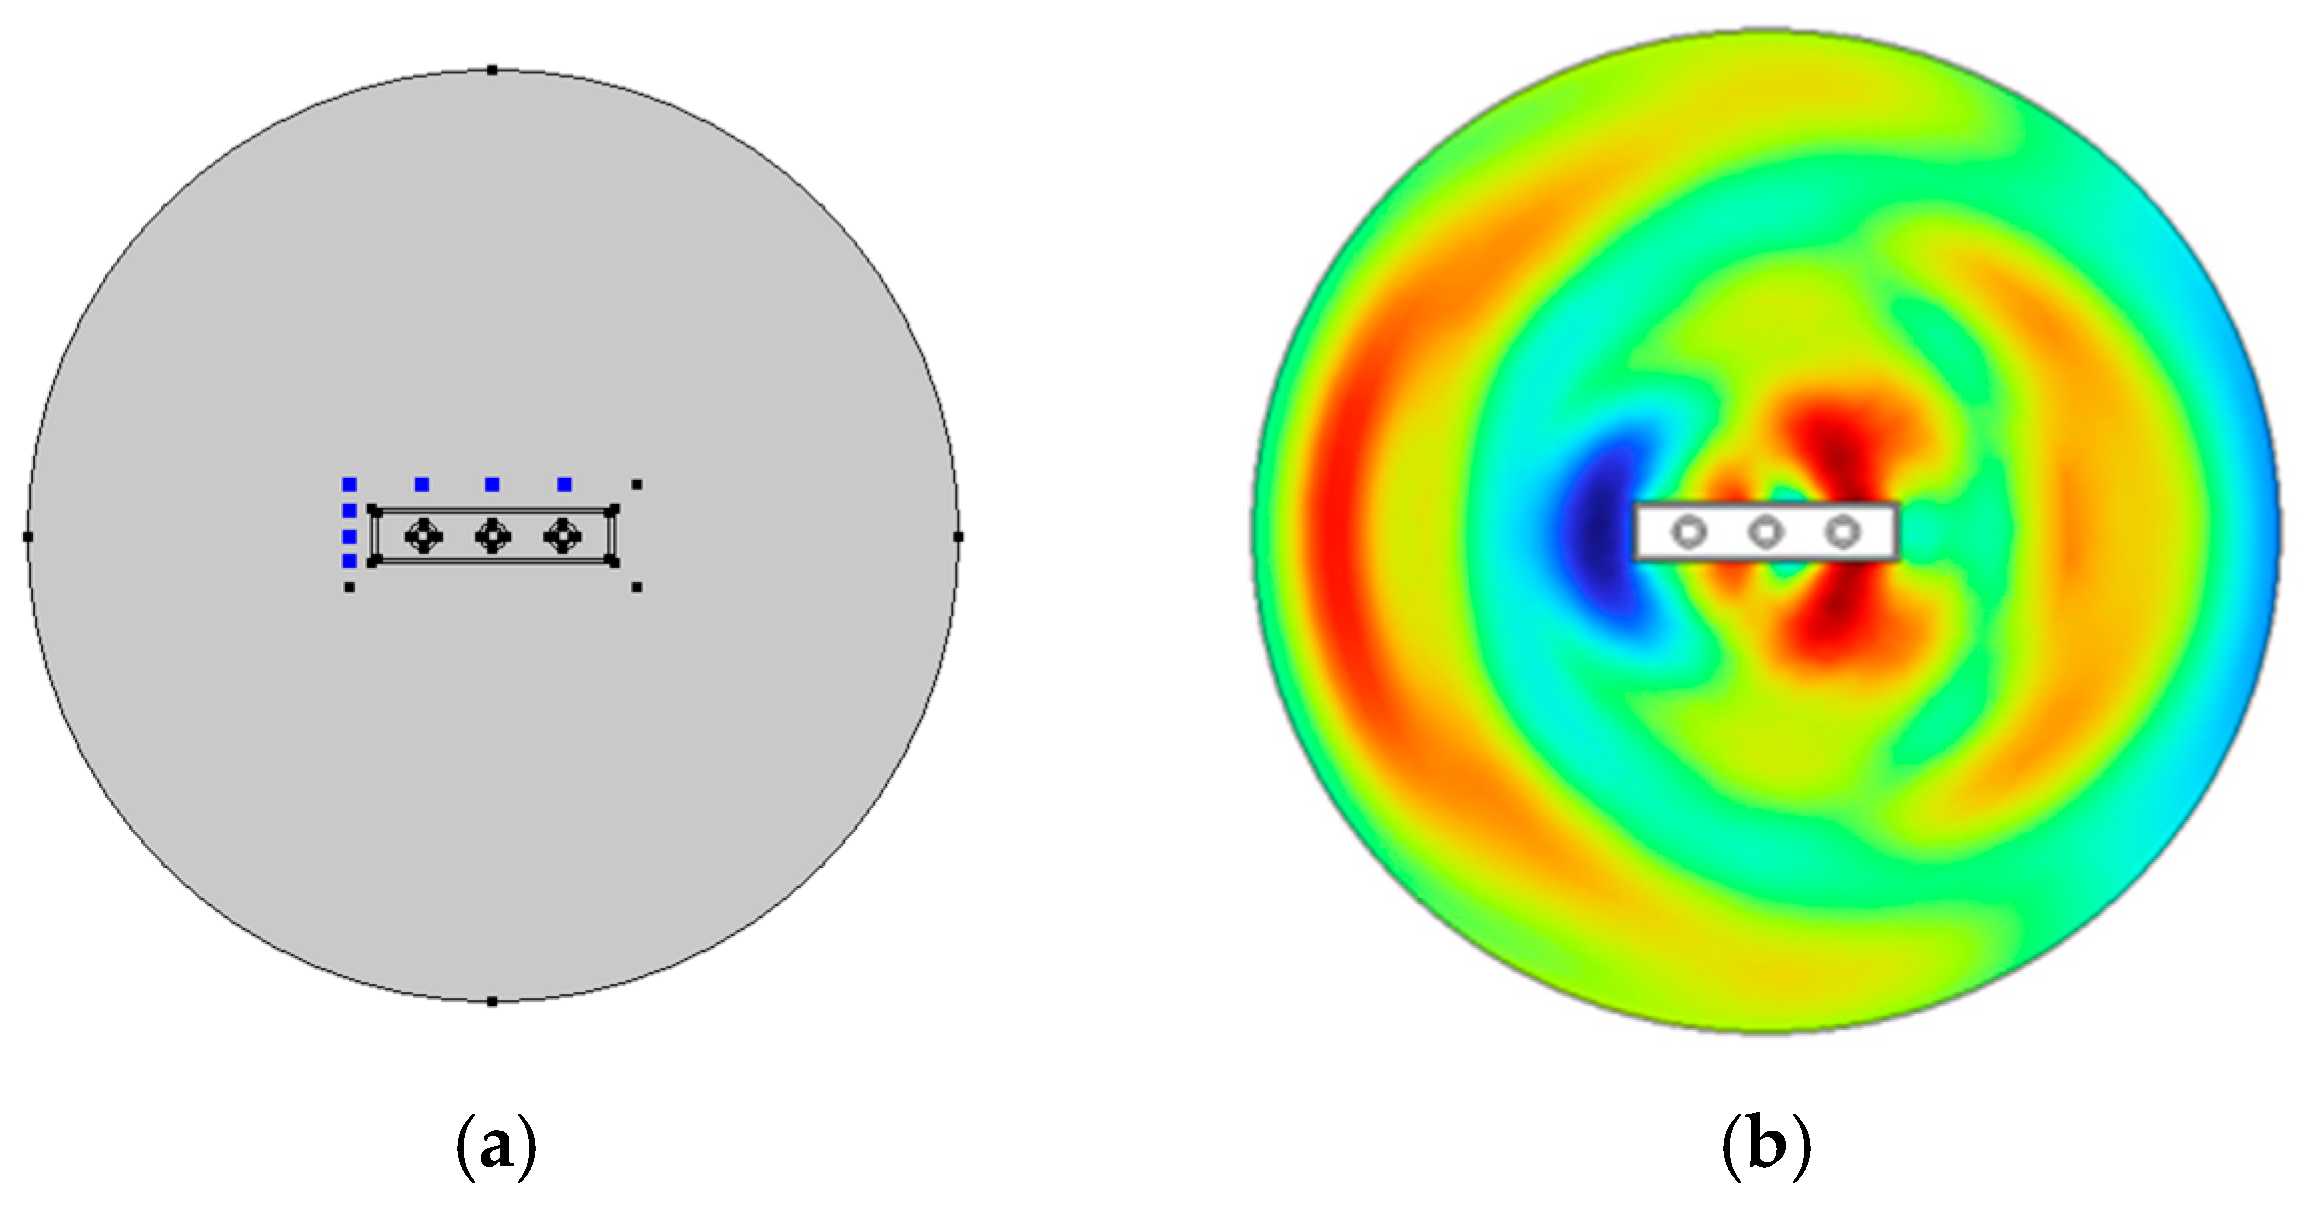
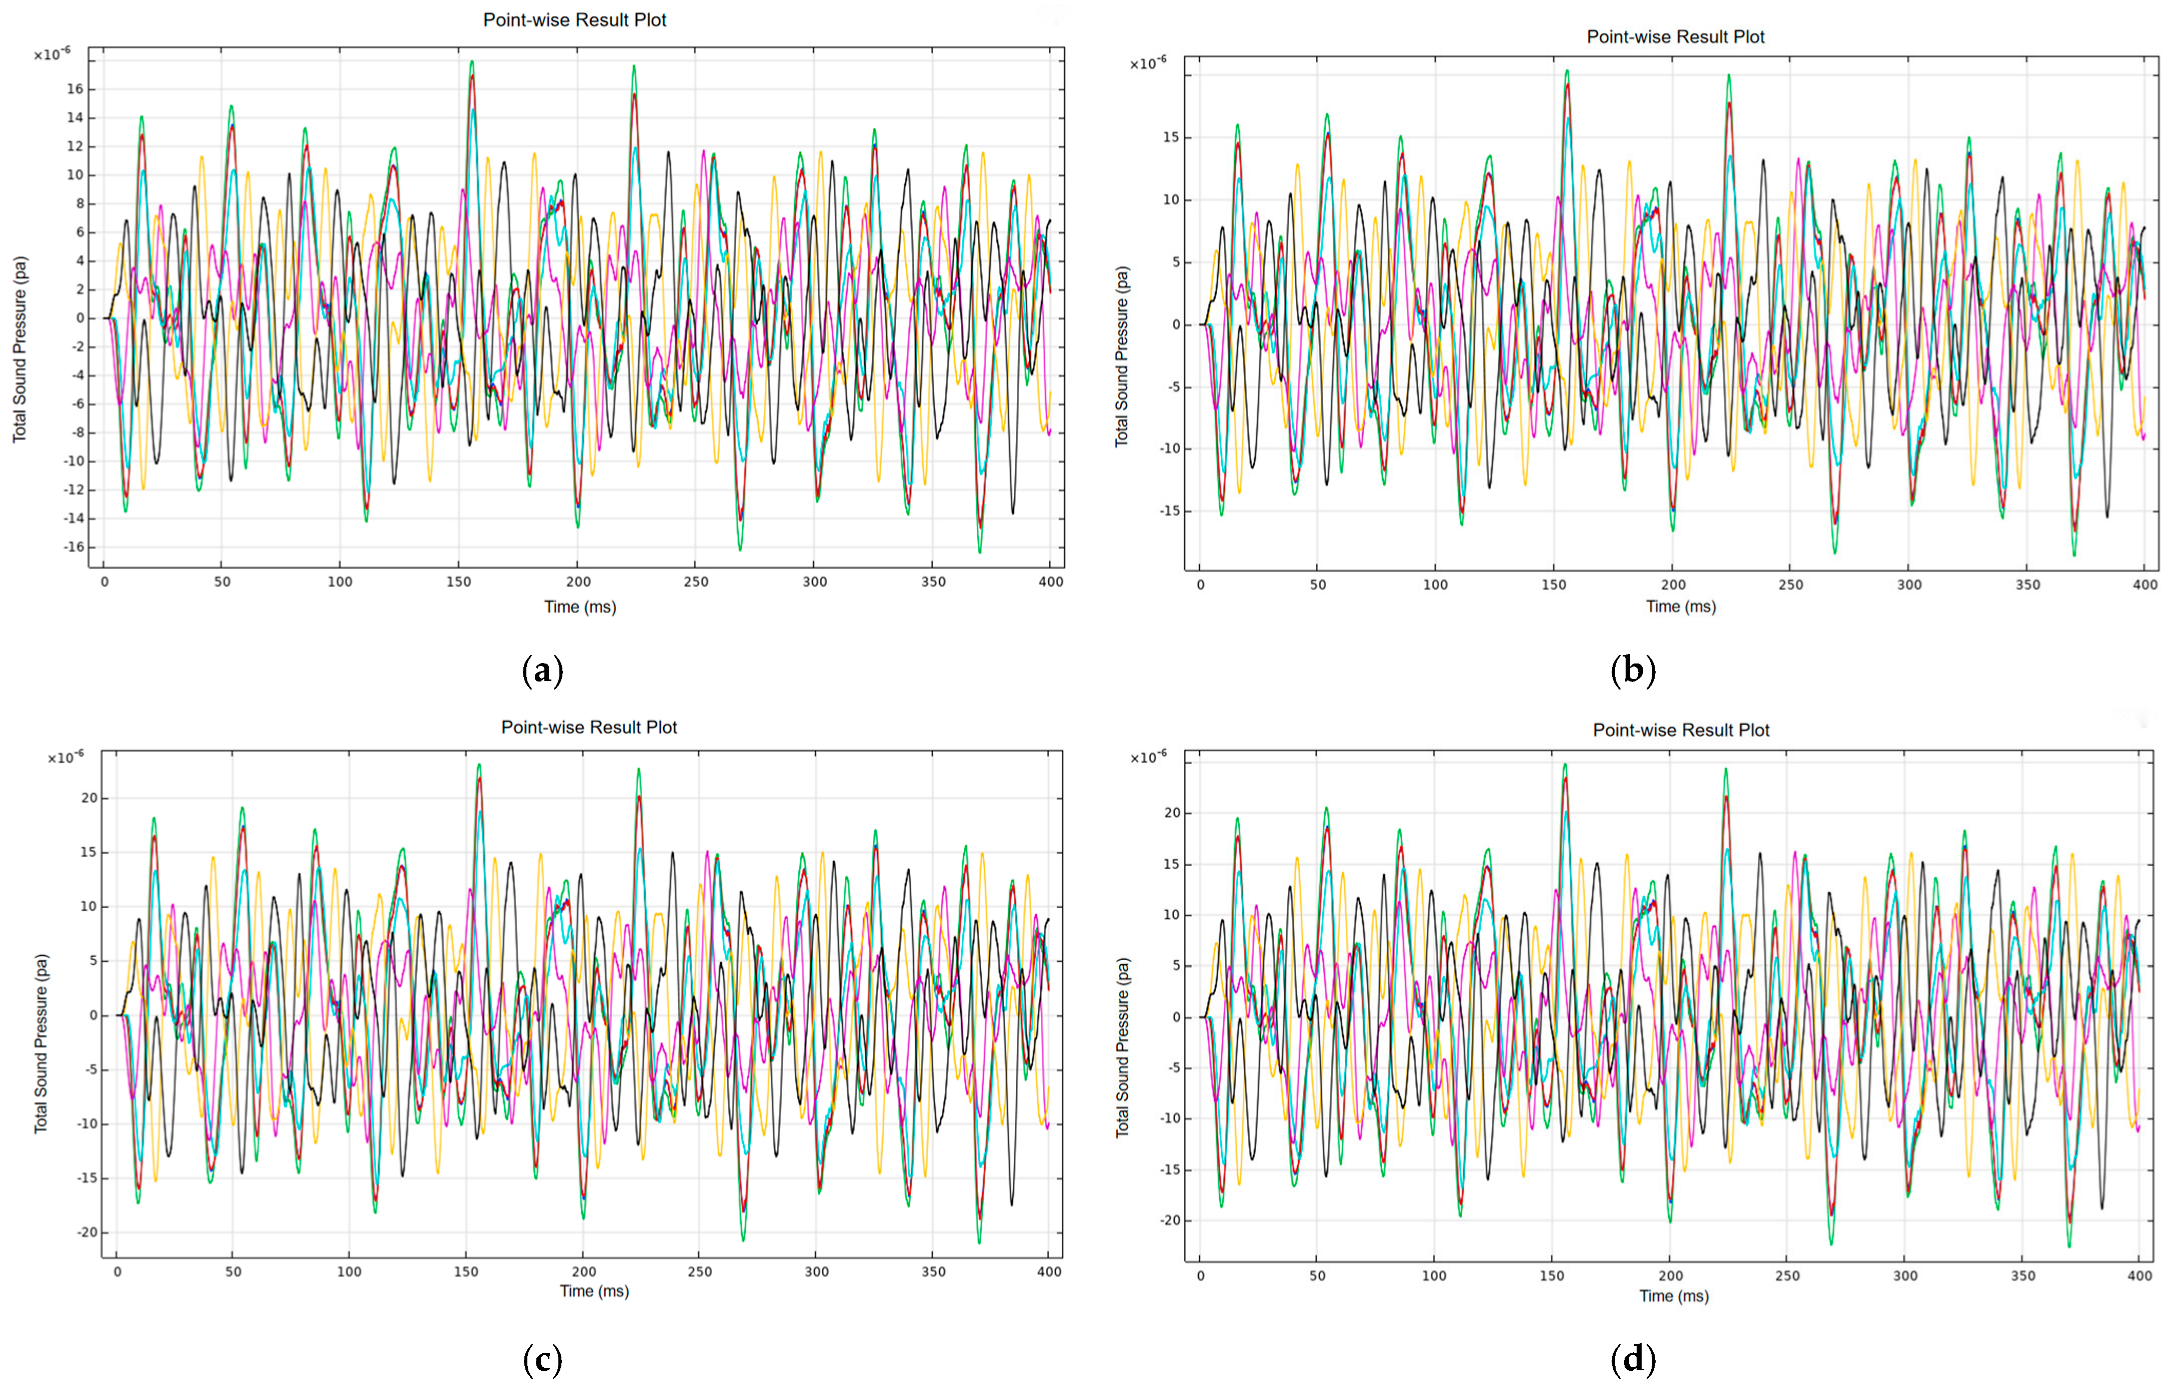
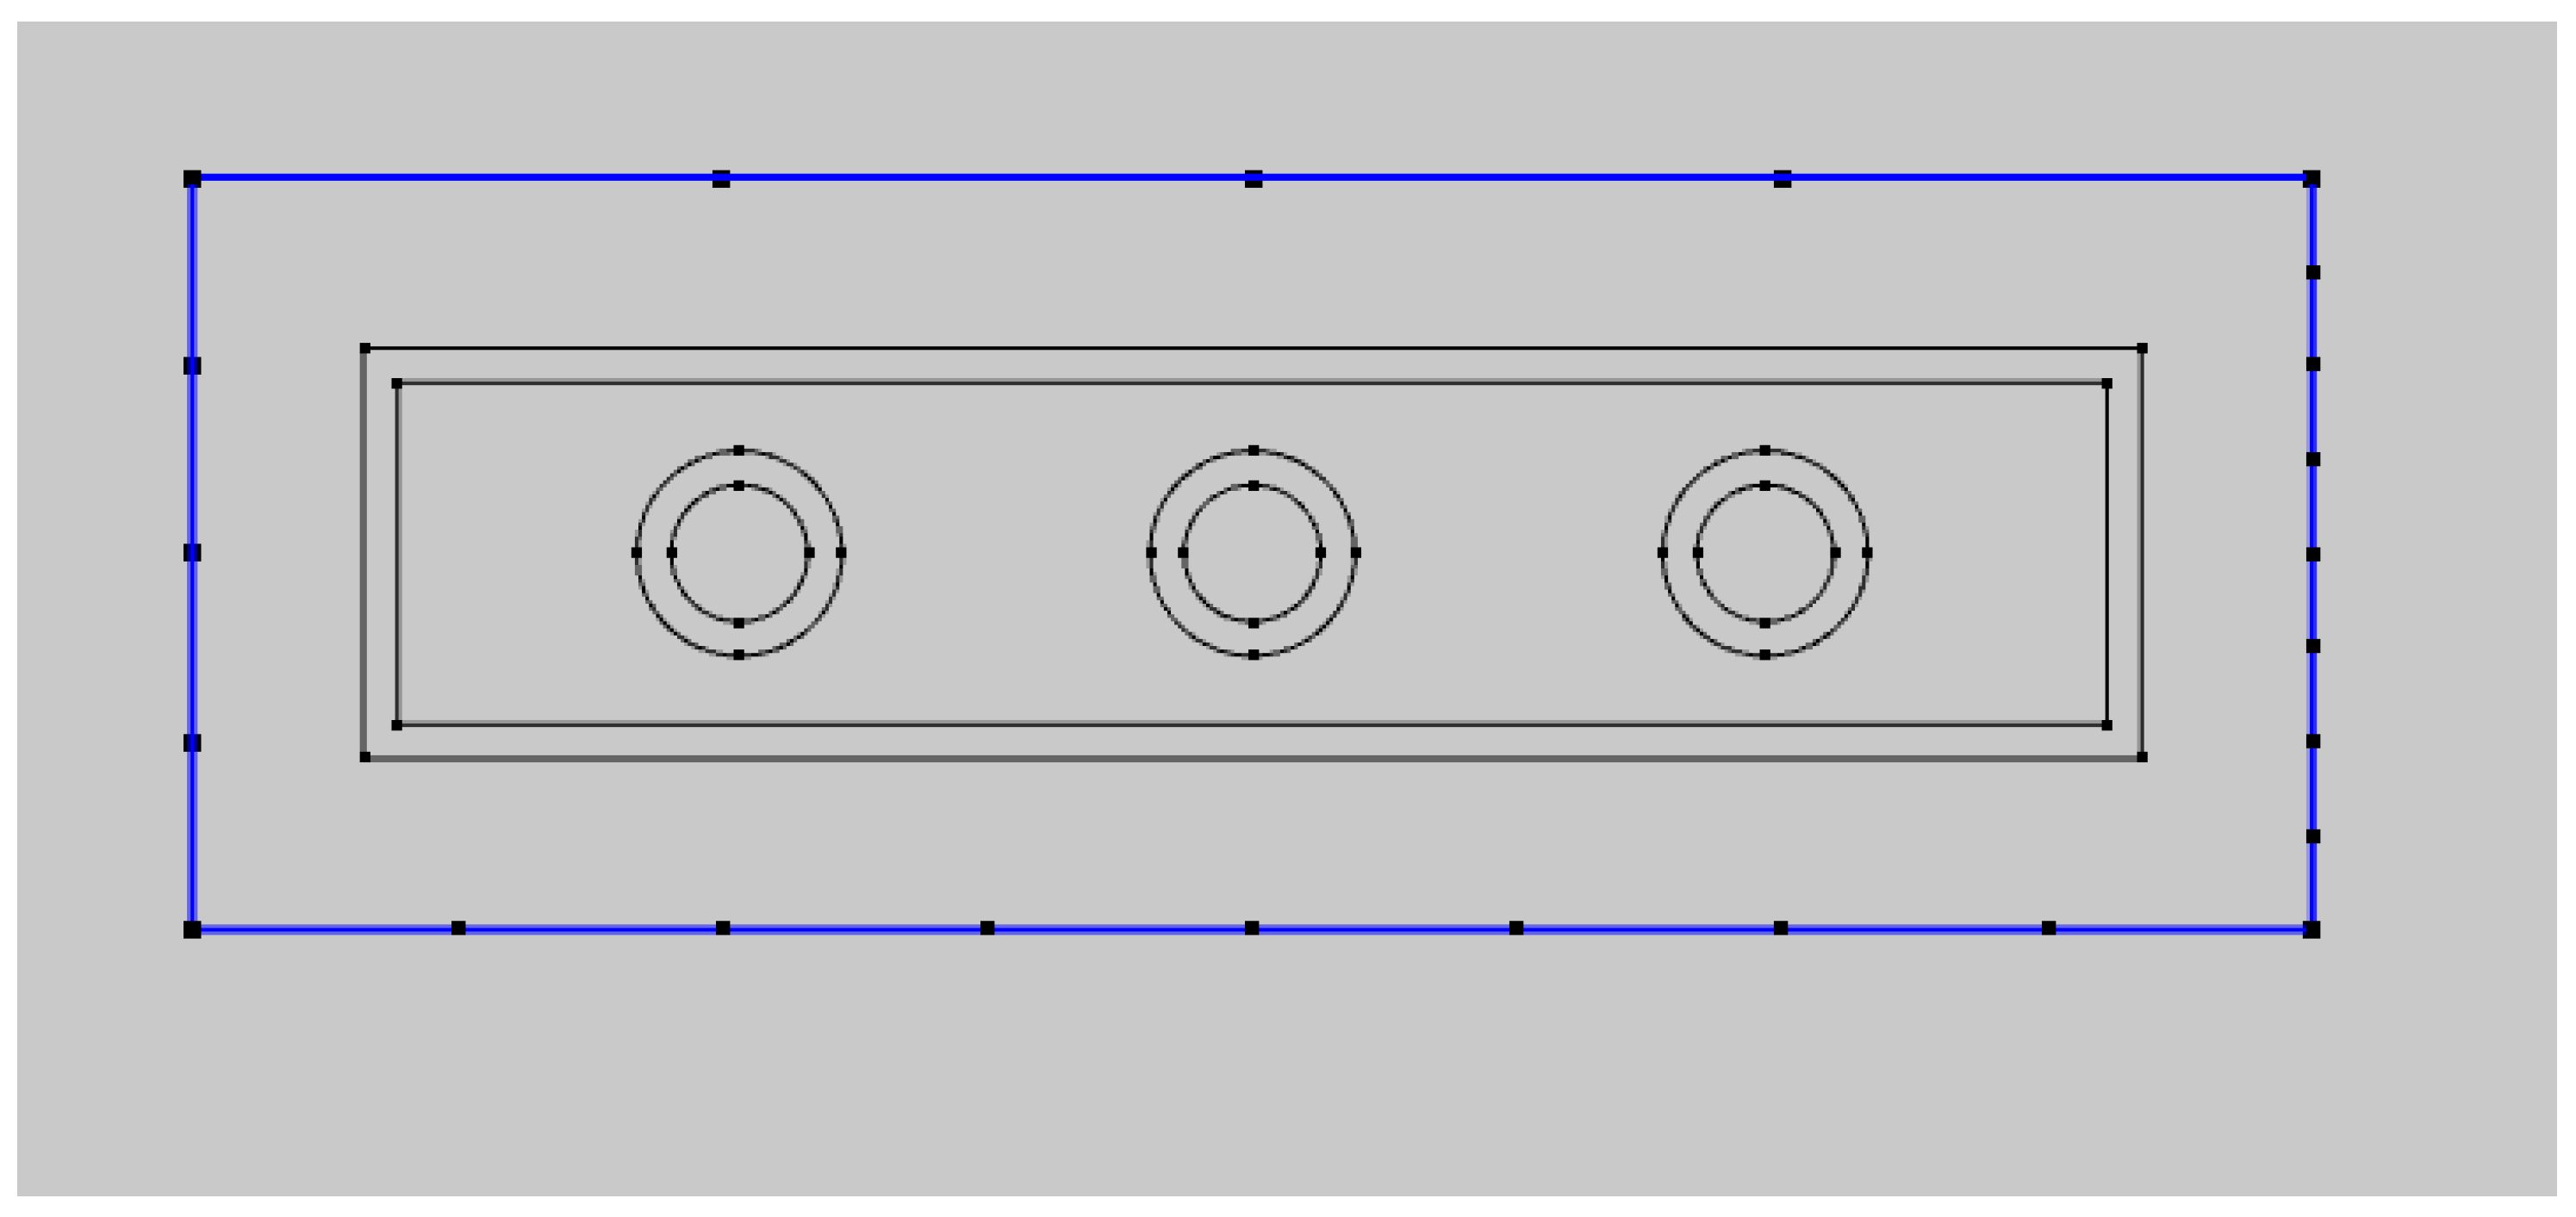
The sound pressure sampling points for the transformer and a two-dimensional finite element model of the sound field are established, as illustrated in Figure 10. Various special operating conditions of the transformer were considered, including overload, underload, voltage fluctuation, and loosening of the core.

3.2.1. Overload and Underload

The calculated sound pressure levels at multiple sampling points under transformer load fluctuations between 90% and 110% within a 400 ms time frame are presented in Figure 11. As illustrated, the amplitude of the sound pressure exhibits proportional variations in response to the load fluctuations.

3.2.2. Voltage Fluctuation

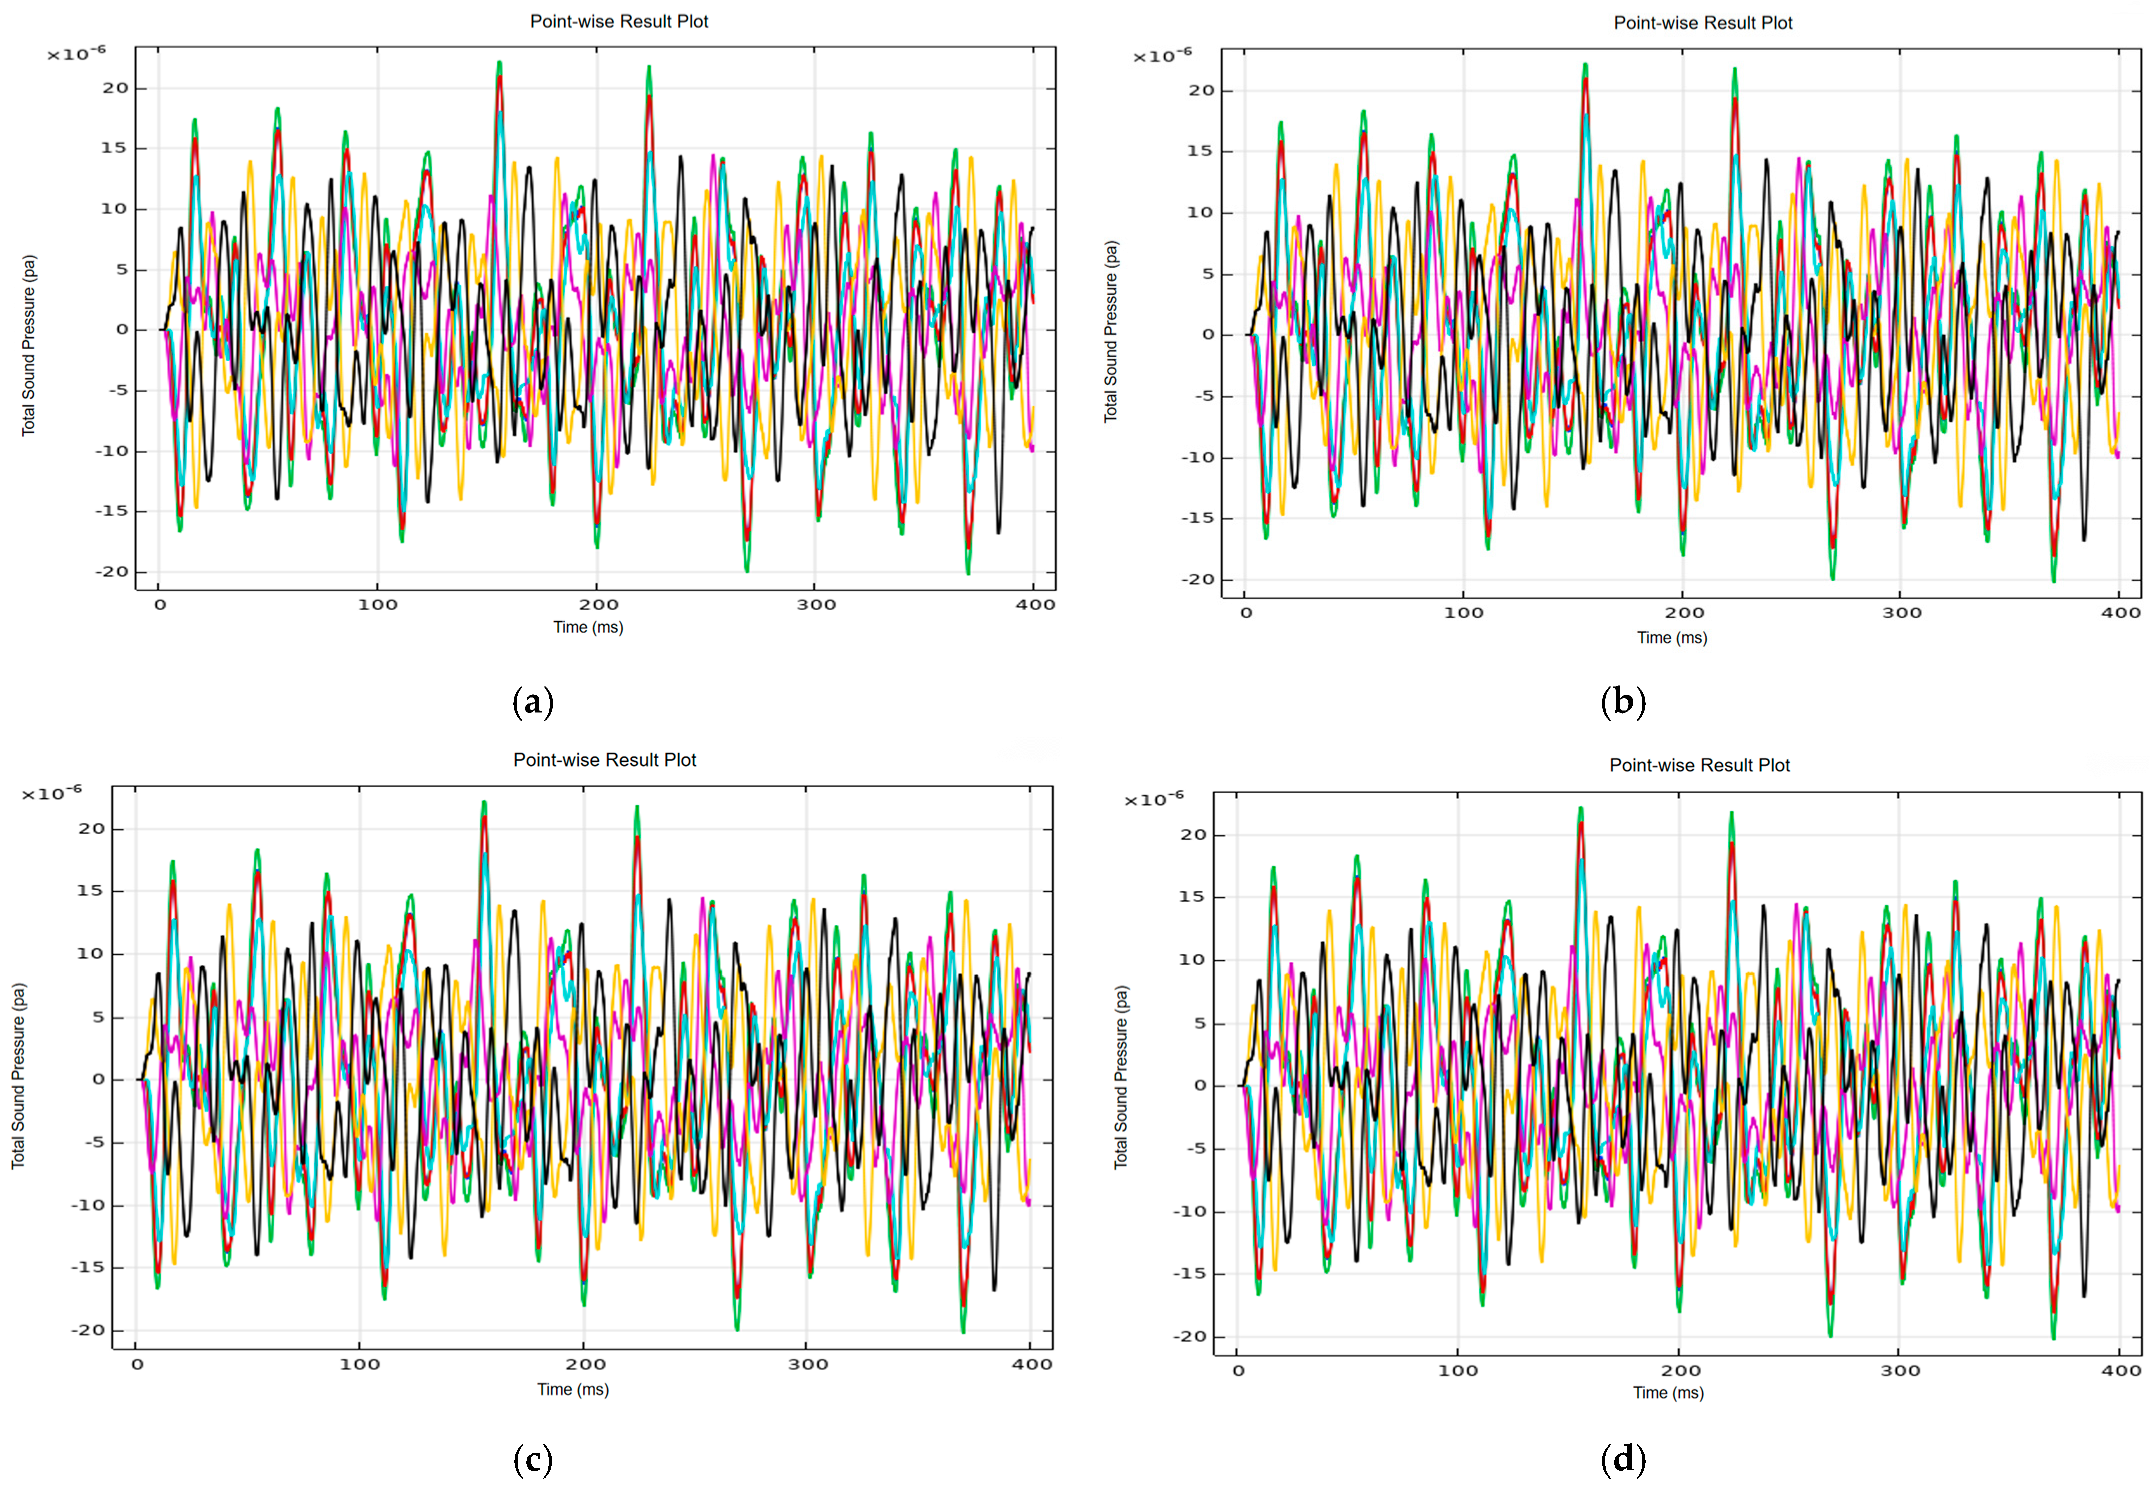
The calculation results of sound pressure at multiple sampling points within the range of 400 ms, under the condition that the transformer voltage fluctuates between 90% and 110%, are shown in Figure 12. It can be seen that as the voltage fluctuates, the sound pressure amplitude does not change significantly, but the high-frequency components increase proportionally.

3.2.3. Iron Core Looseness

The analysis indicates a 75% to 97.5% level of confidence in the detection of a loose transformer core. The corresponding acoustic pressure calculations for multiple sampling points over a 400 ms interval are depicted in the accompanying Figure 13.

3.2.4. Analysis of Sensor Network Deployment Scheme

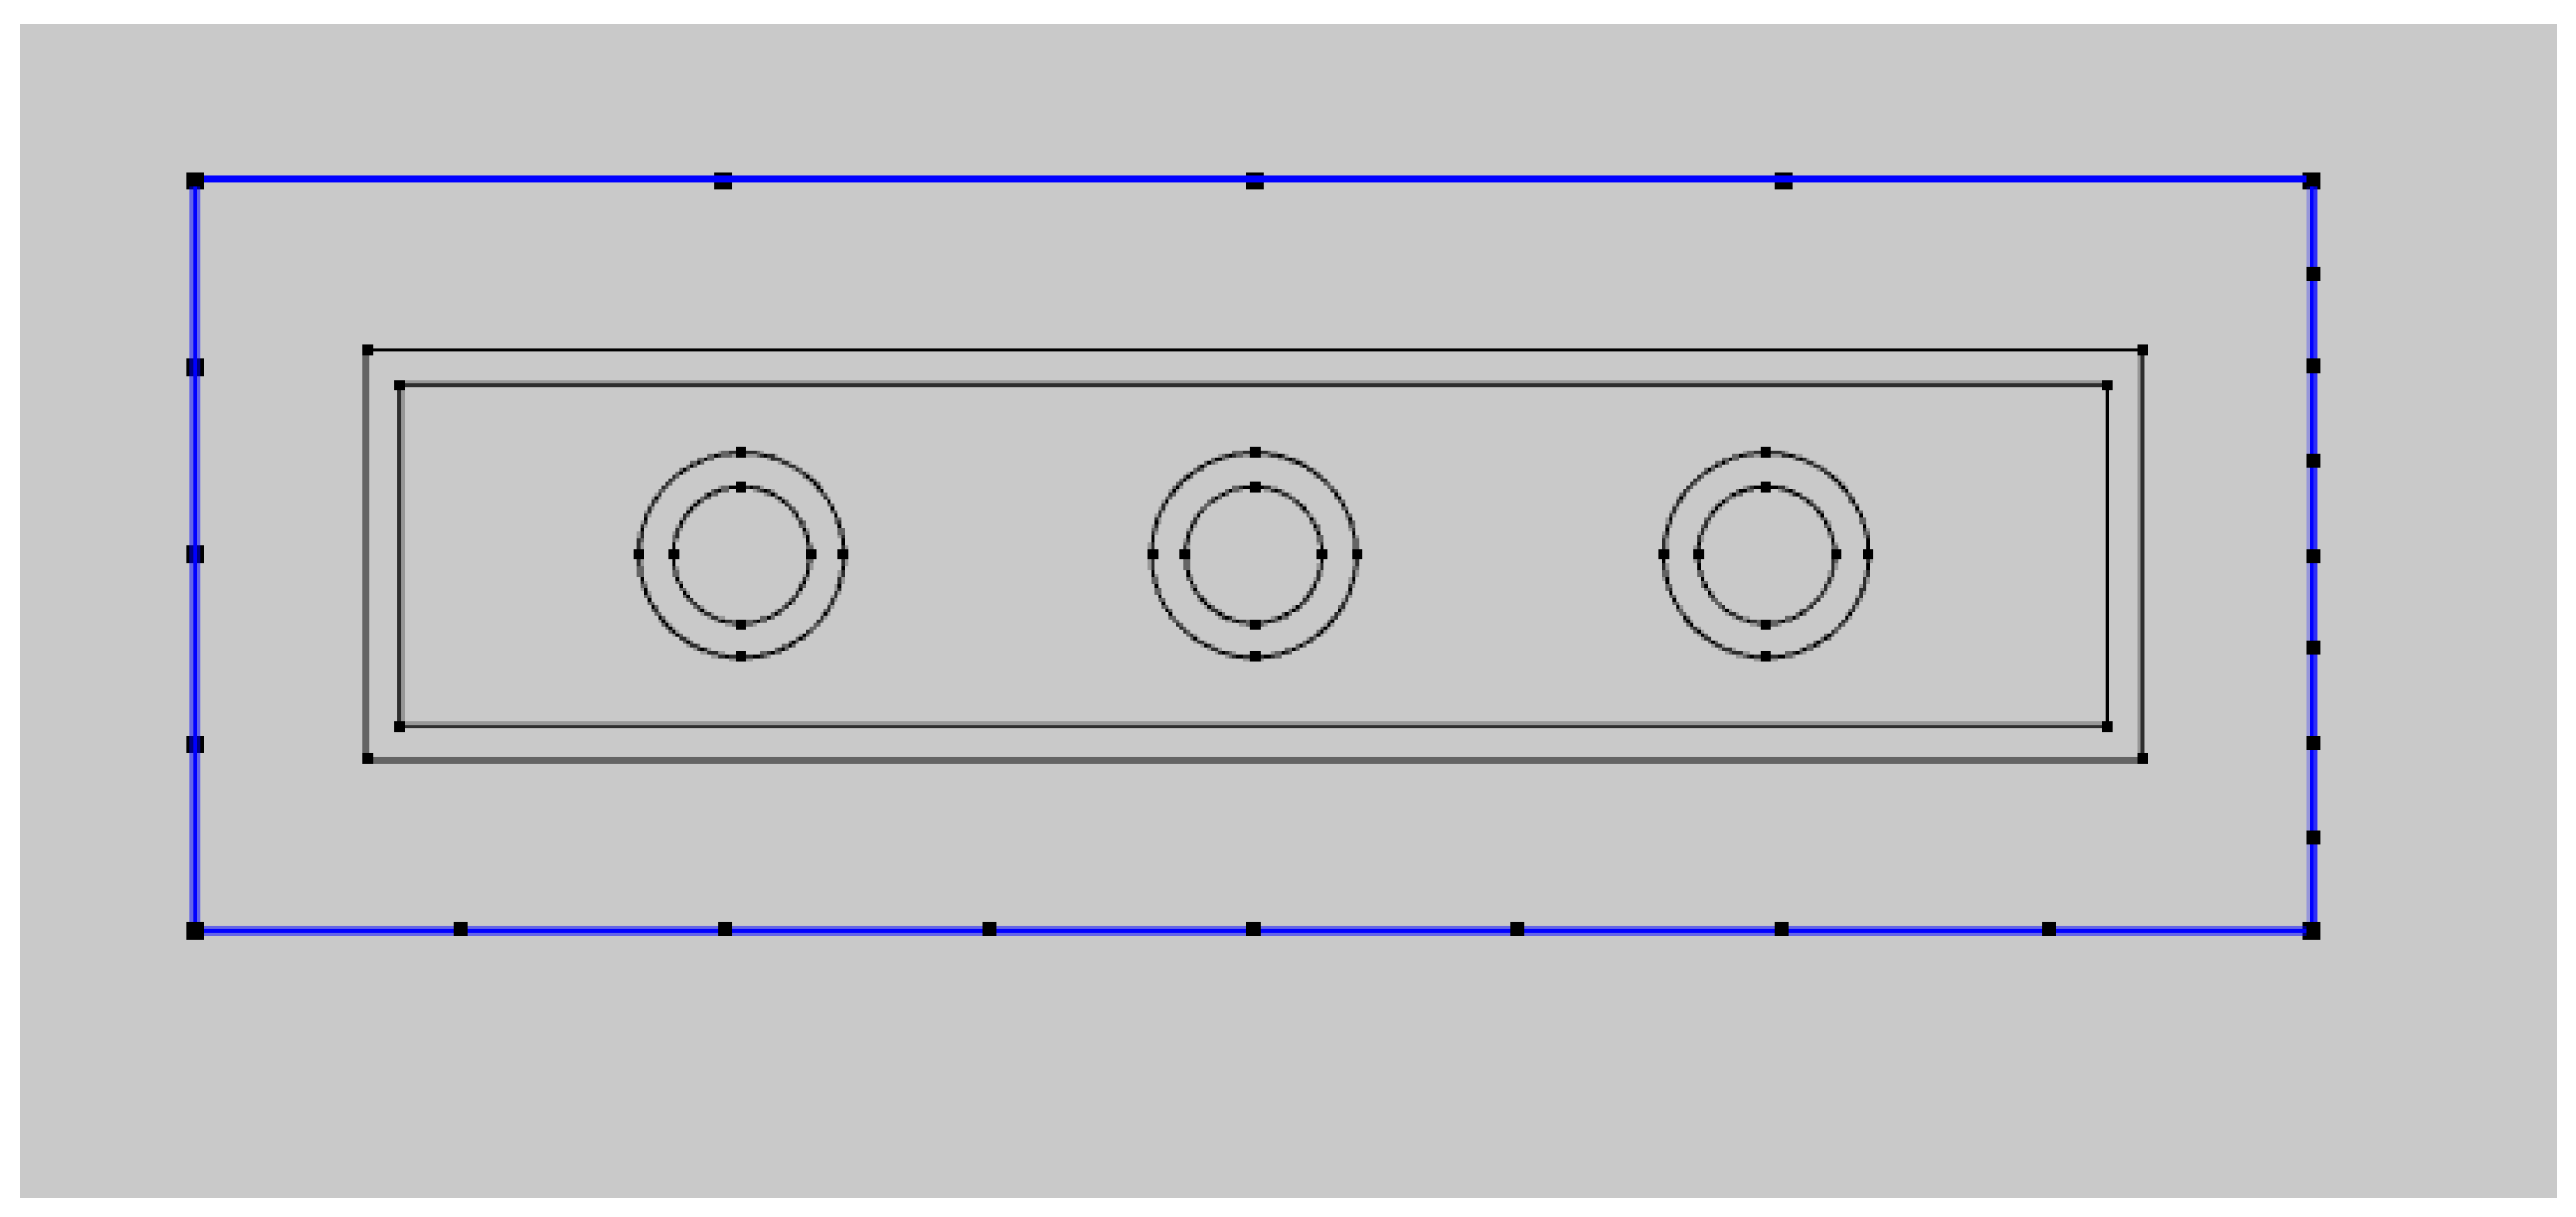
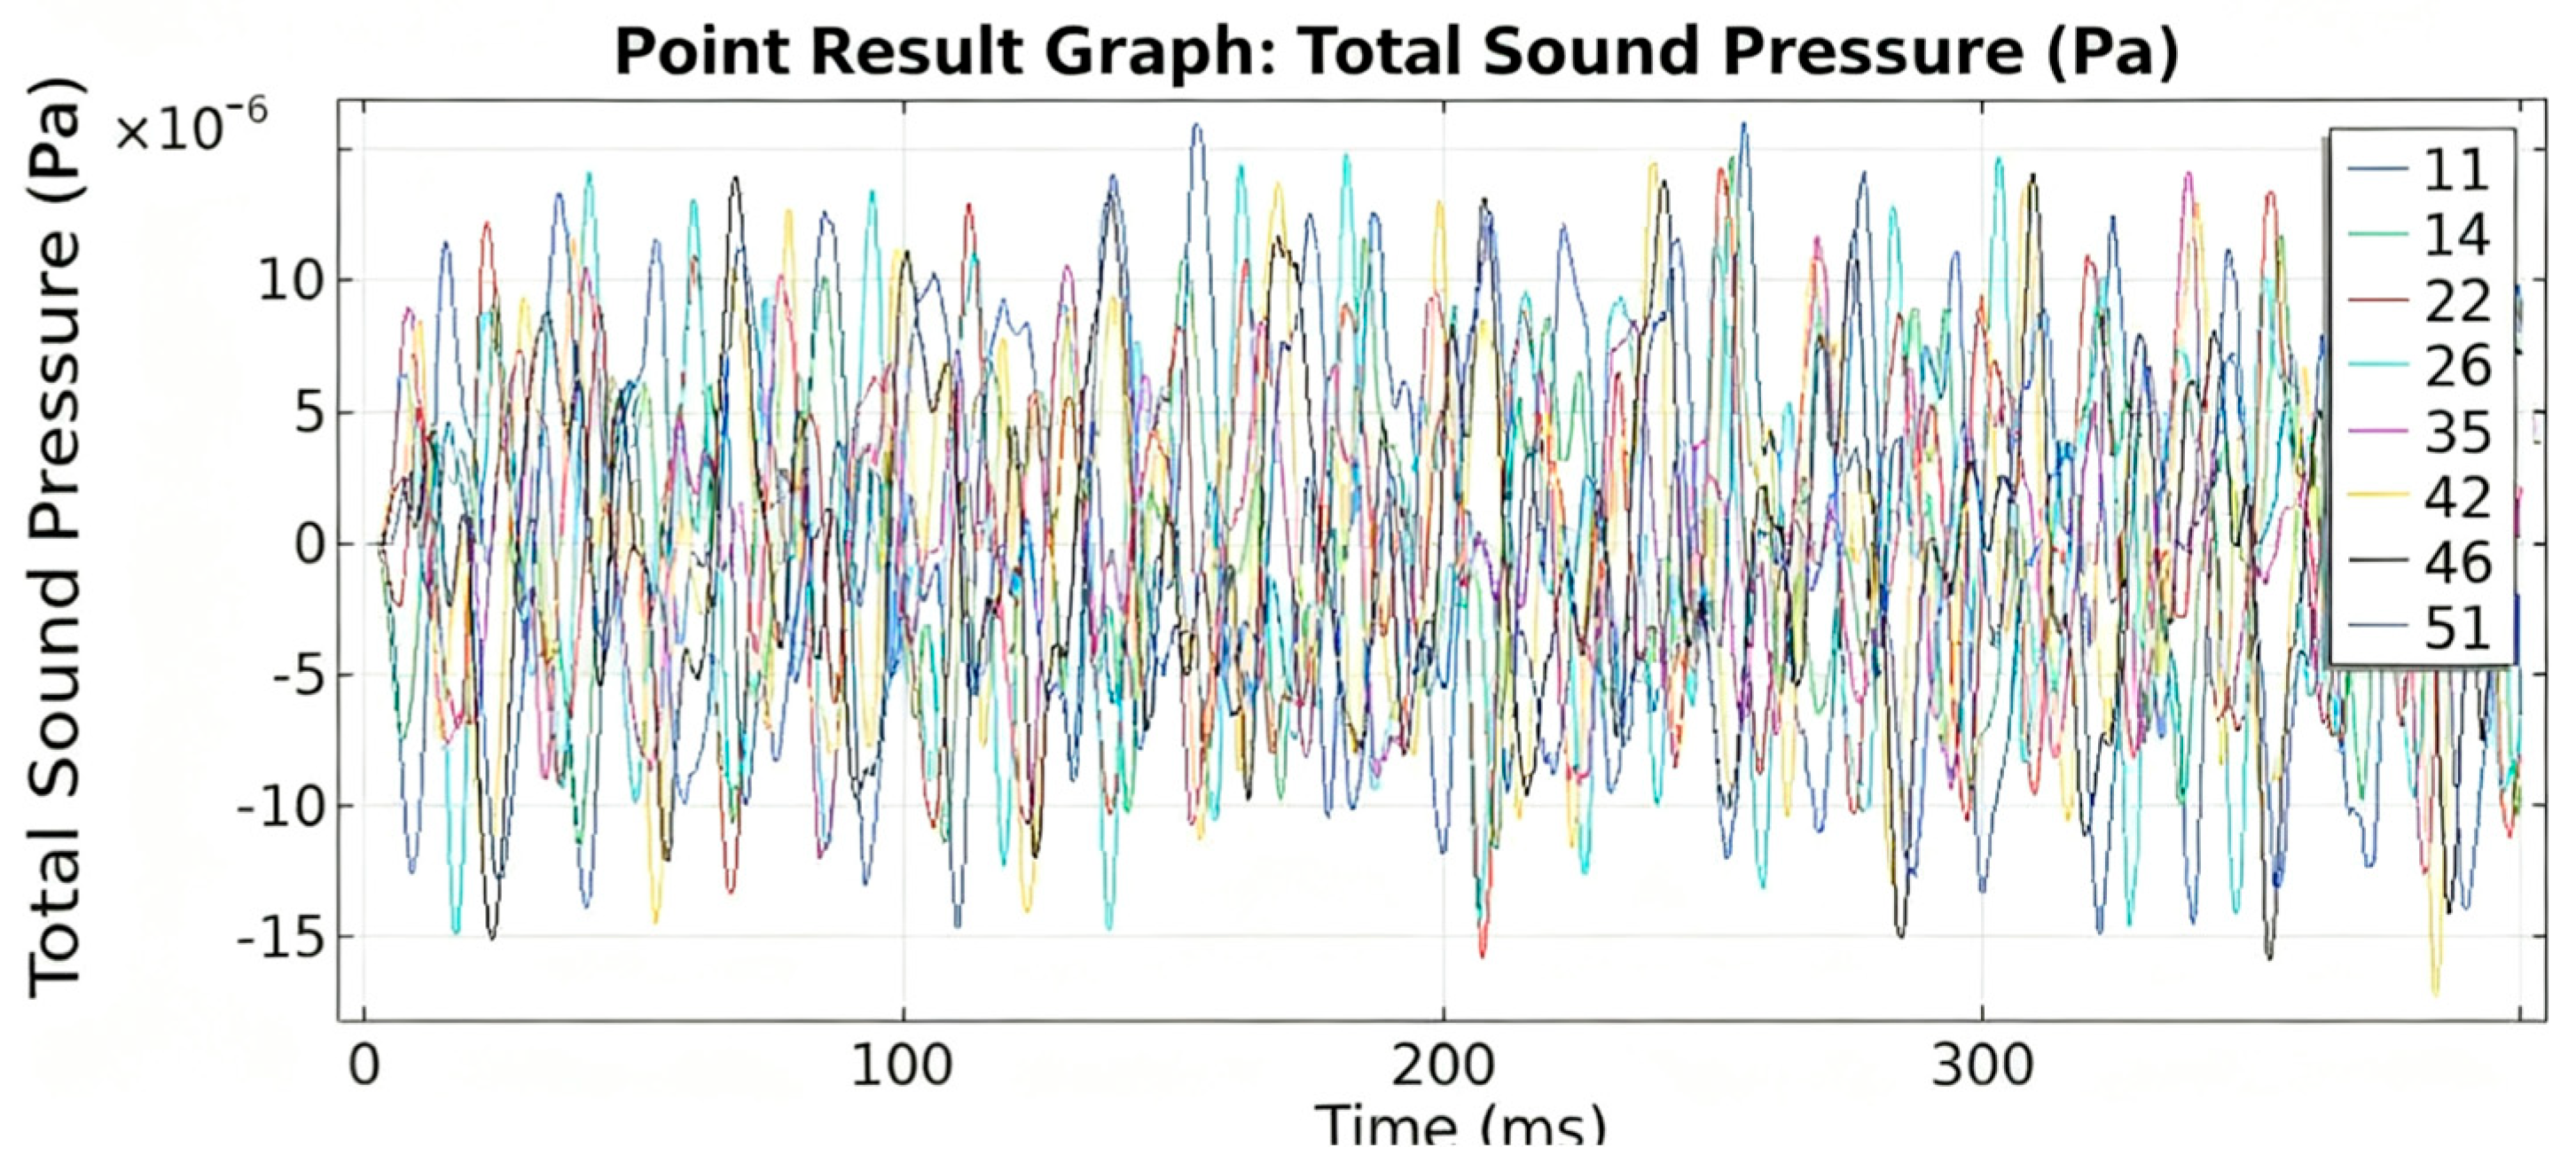
Taking the acoustic pressure results from sampling points 1 m outside the transformer tank under rated operating conditions as an example, a comparative analysis of the sensor network layout effectiveness is conducted. The locations of the frontal sampling points are shown in Figure 14 below.
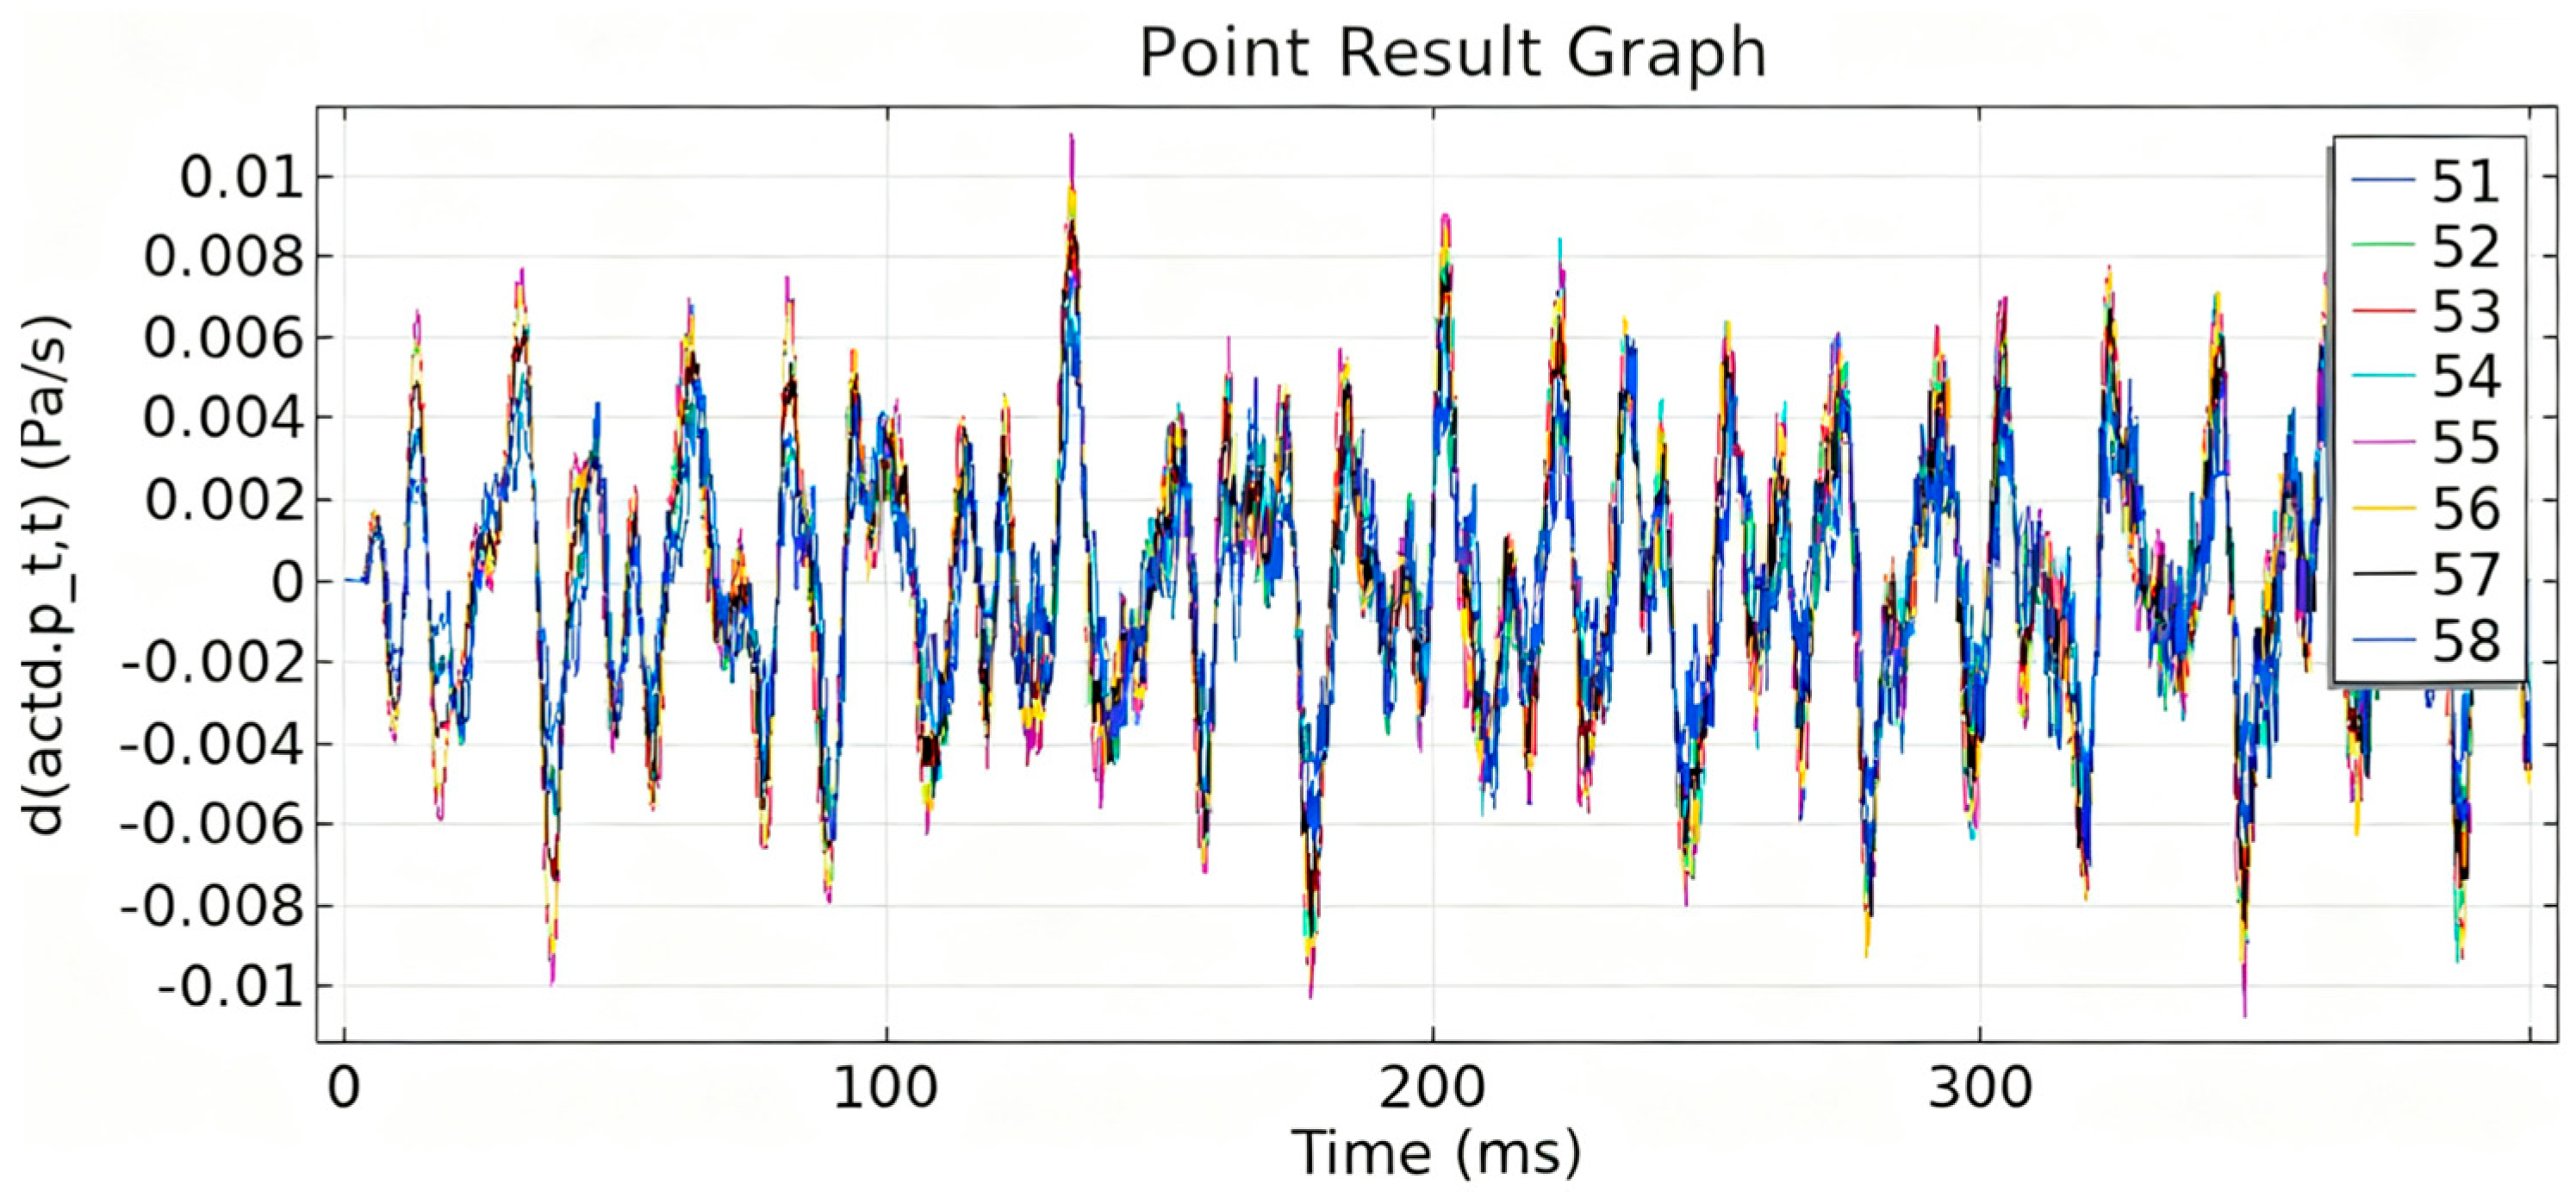
A comparative analysis of the sound pressure distribution across various sampling locations on the tank front is depicted in Figure 15 below.
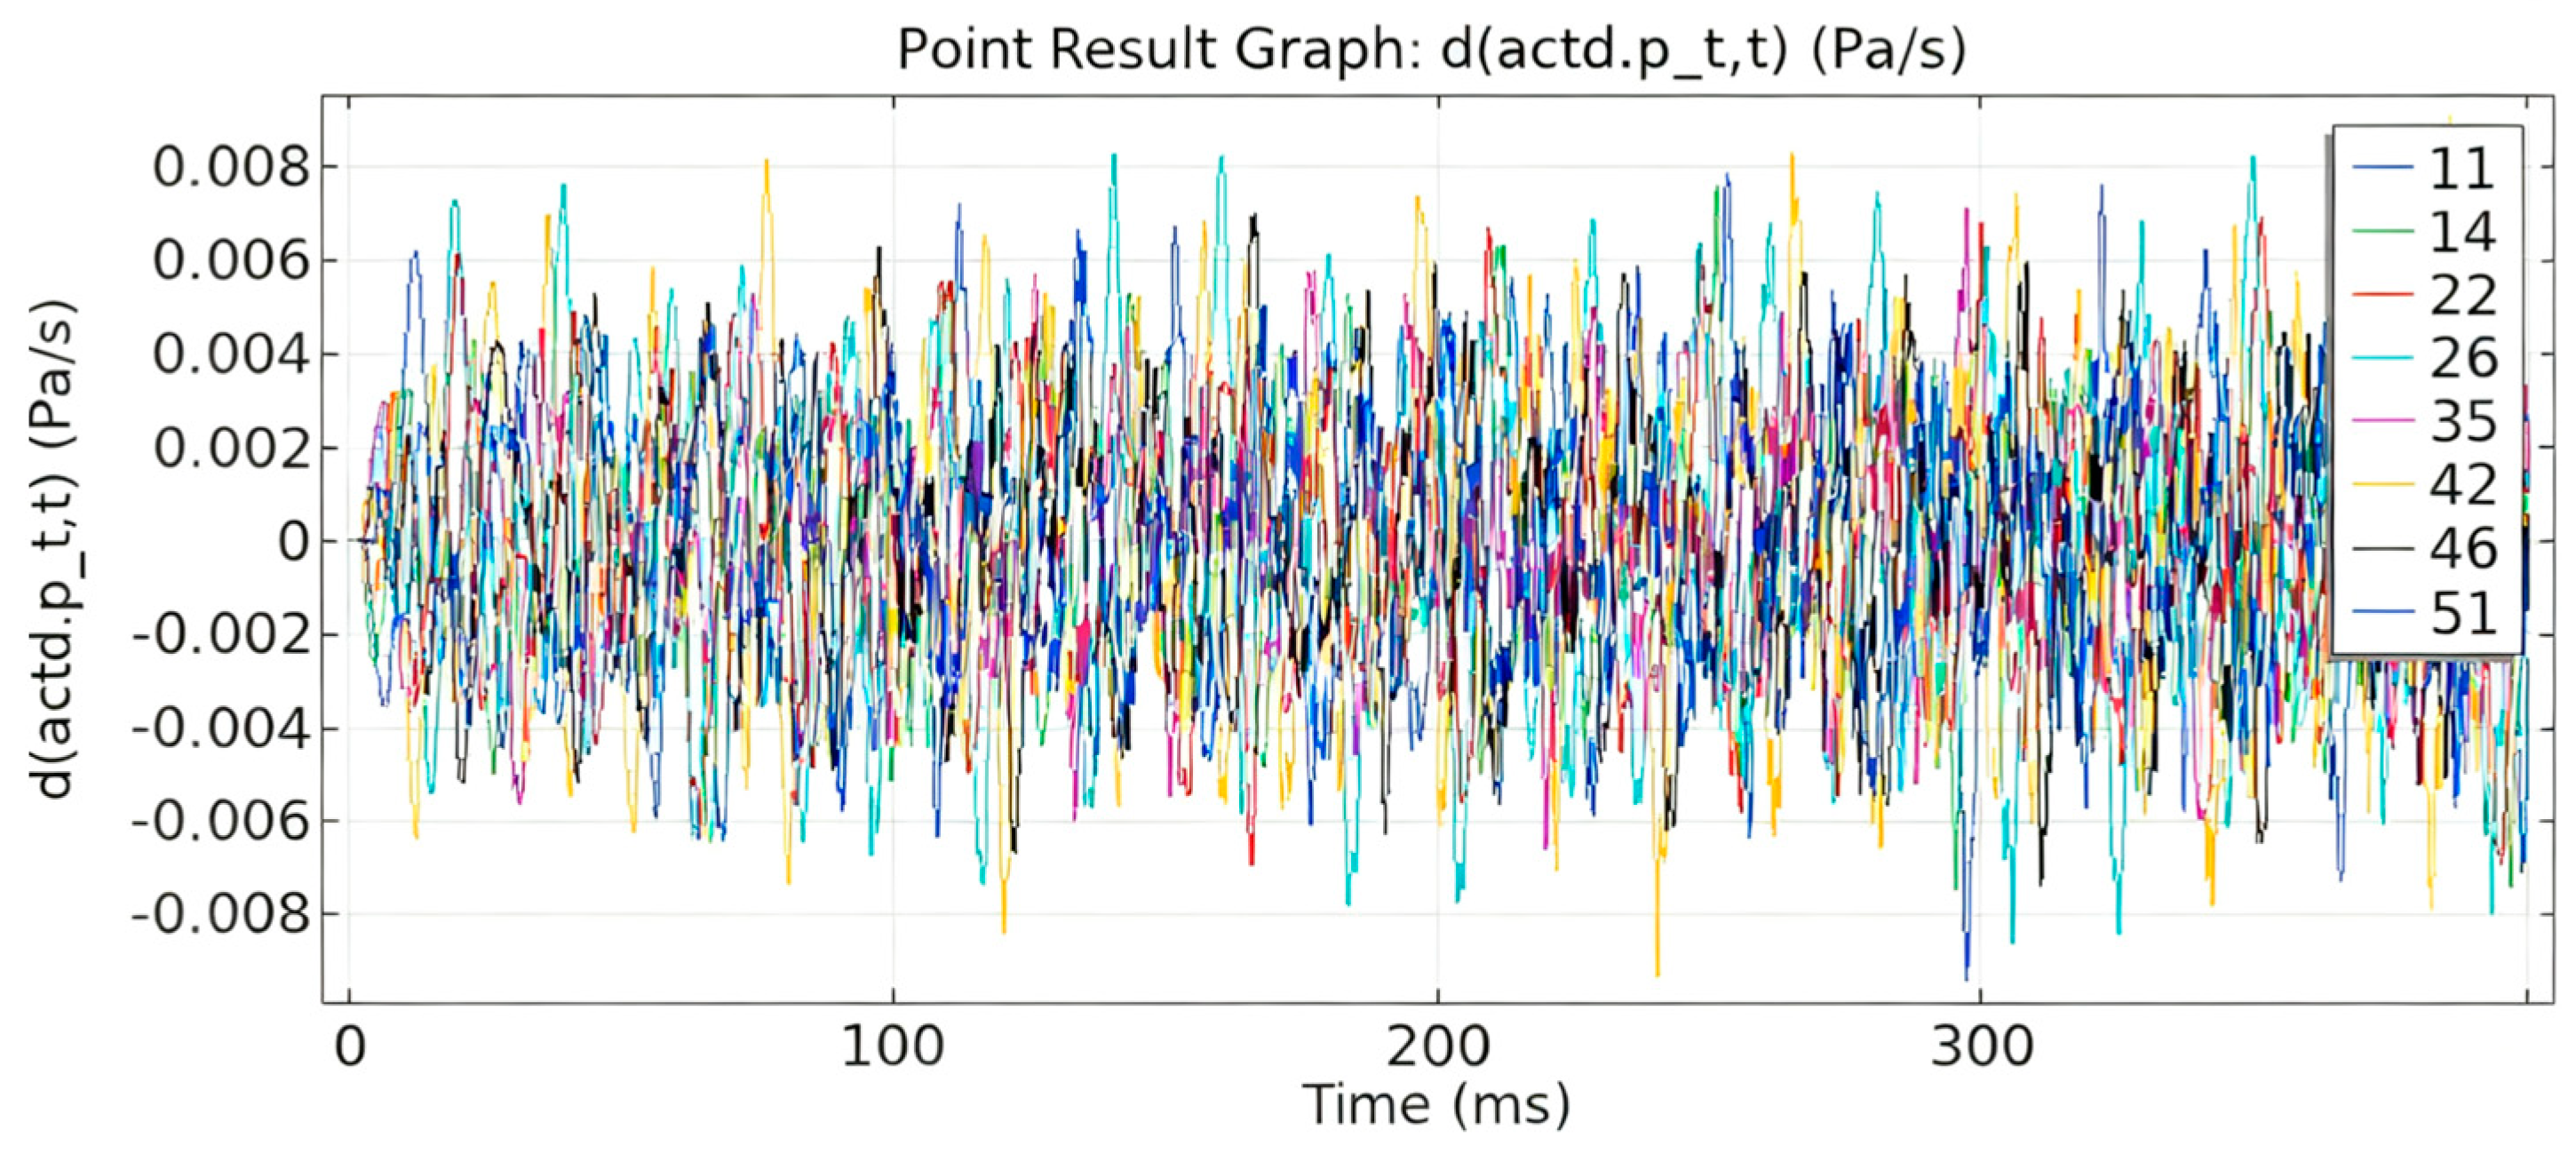
A comparative analysis of the spatial distribution of the sound pressure derivative among various sampling locations on the front of the tank is depicted in Figure 16 below.
The positions of the side-panel sampling points on the tank are illustrated in Figure 17 below.
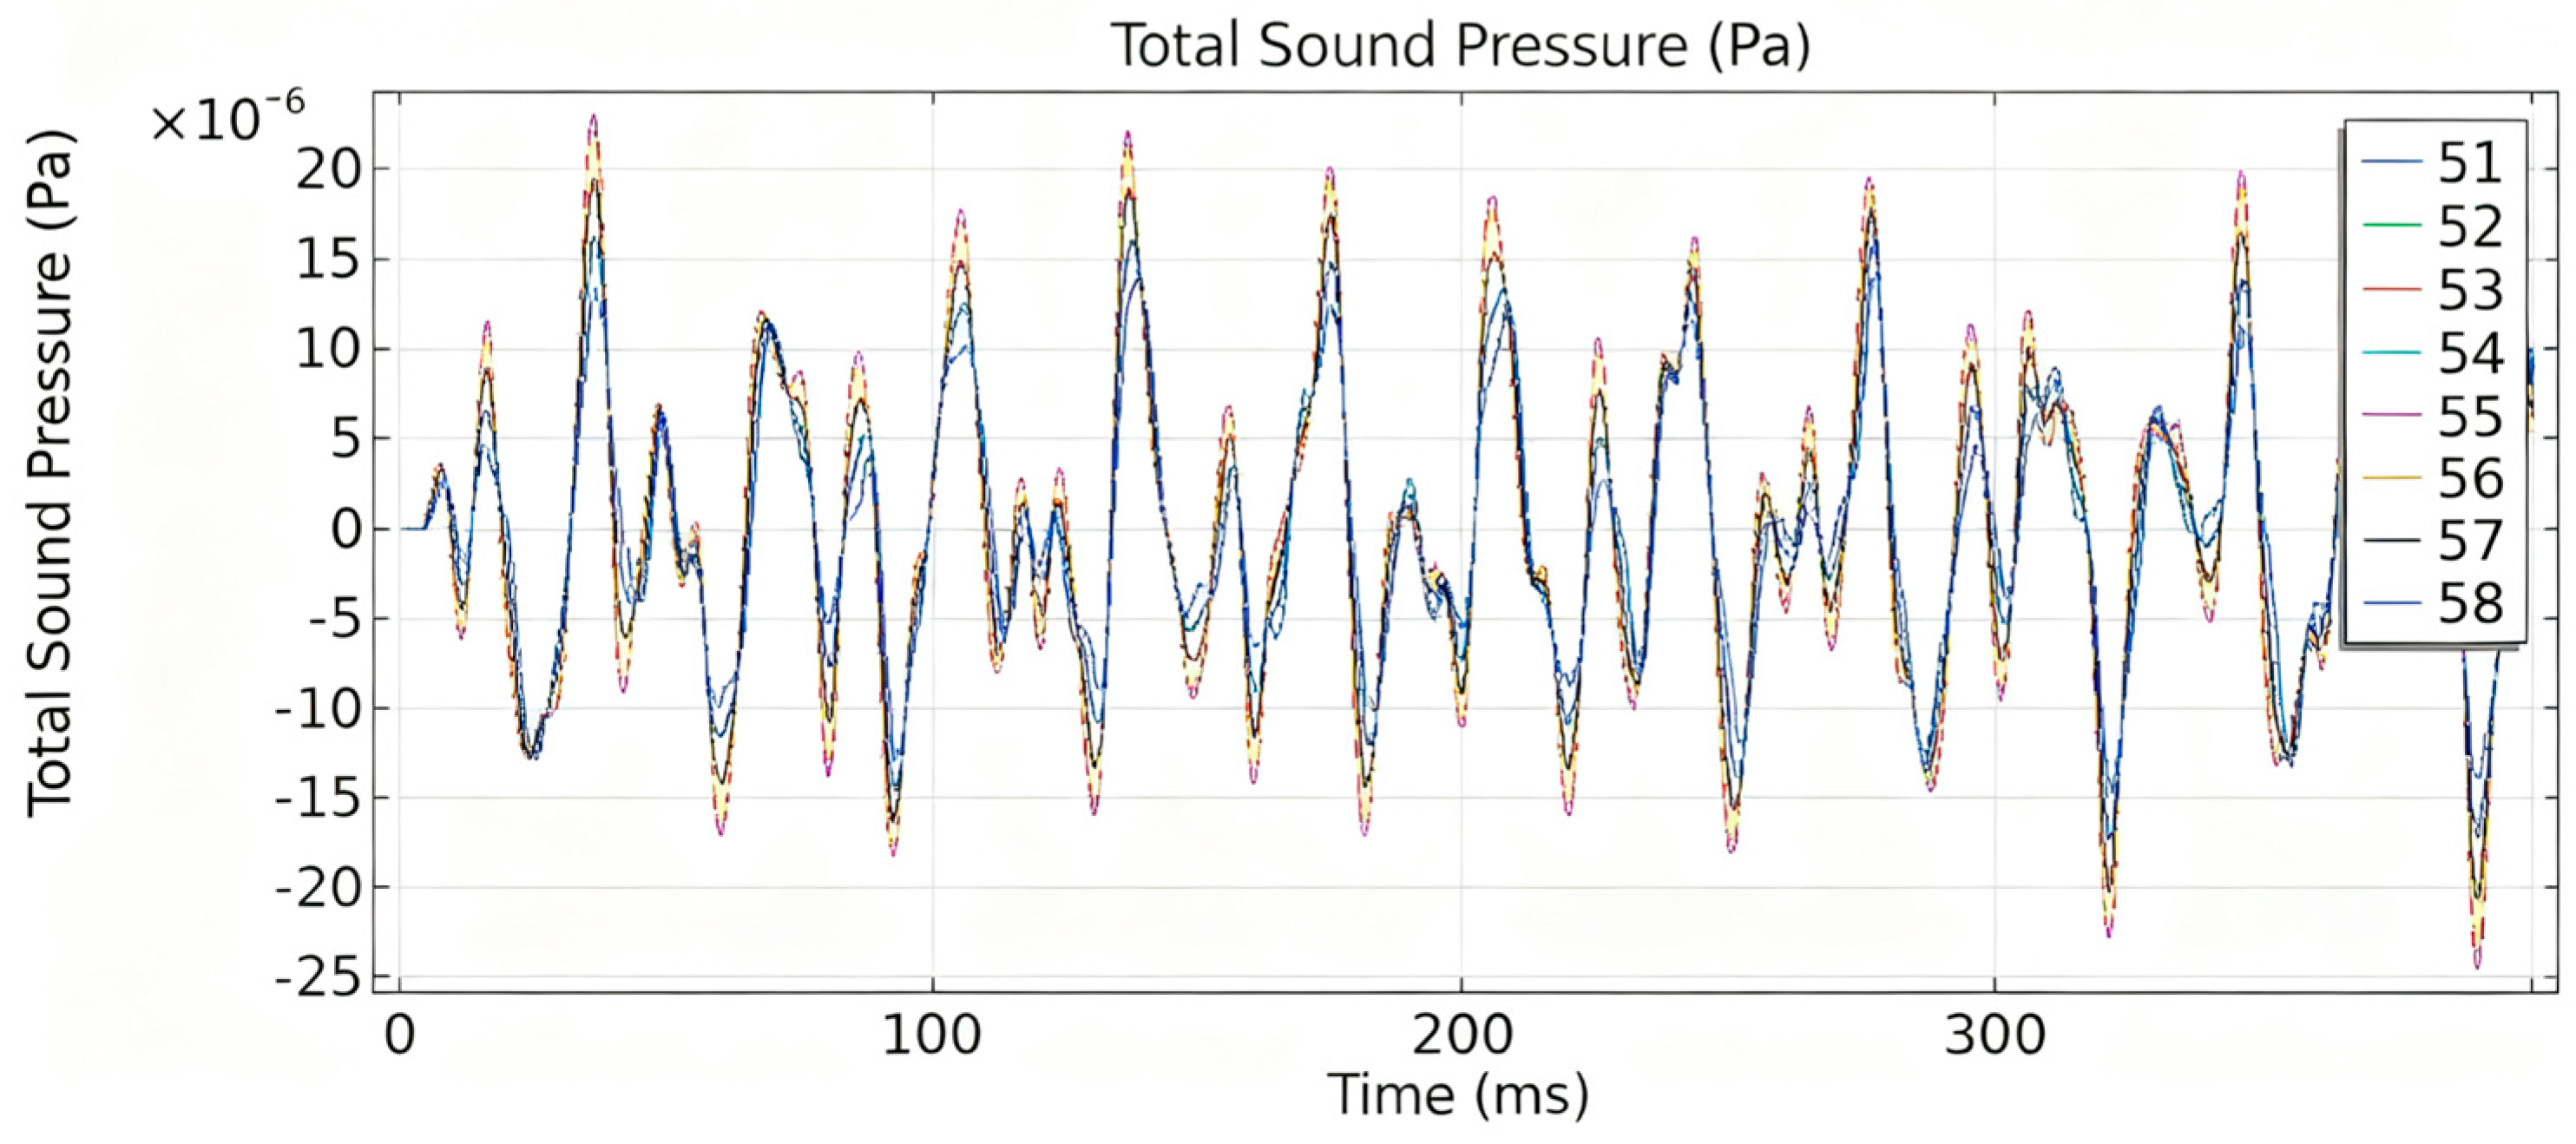
A comparative analysis of the sound pressure distribution across various sampling locations on the side of the tank is depicted in Figure 18 below.
A comparative analysis of the spatial distribution of the sound pressure derivative among various sampling locations on the side of the tank is depicted in Figure 19 below.

4. Vibration and Noise Measurement and Analysis on Oil-Immersed Transformers

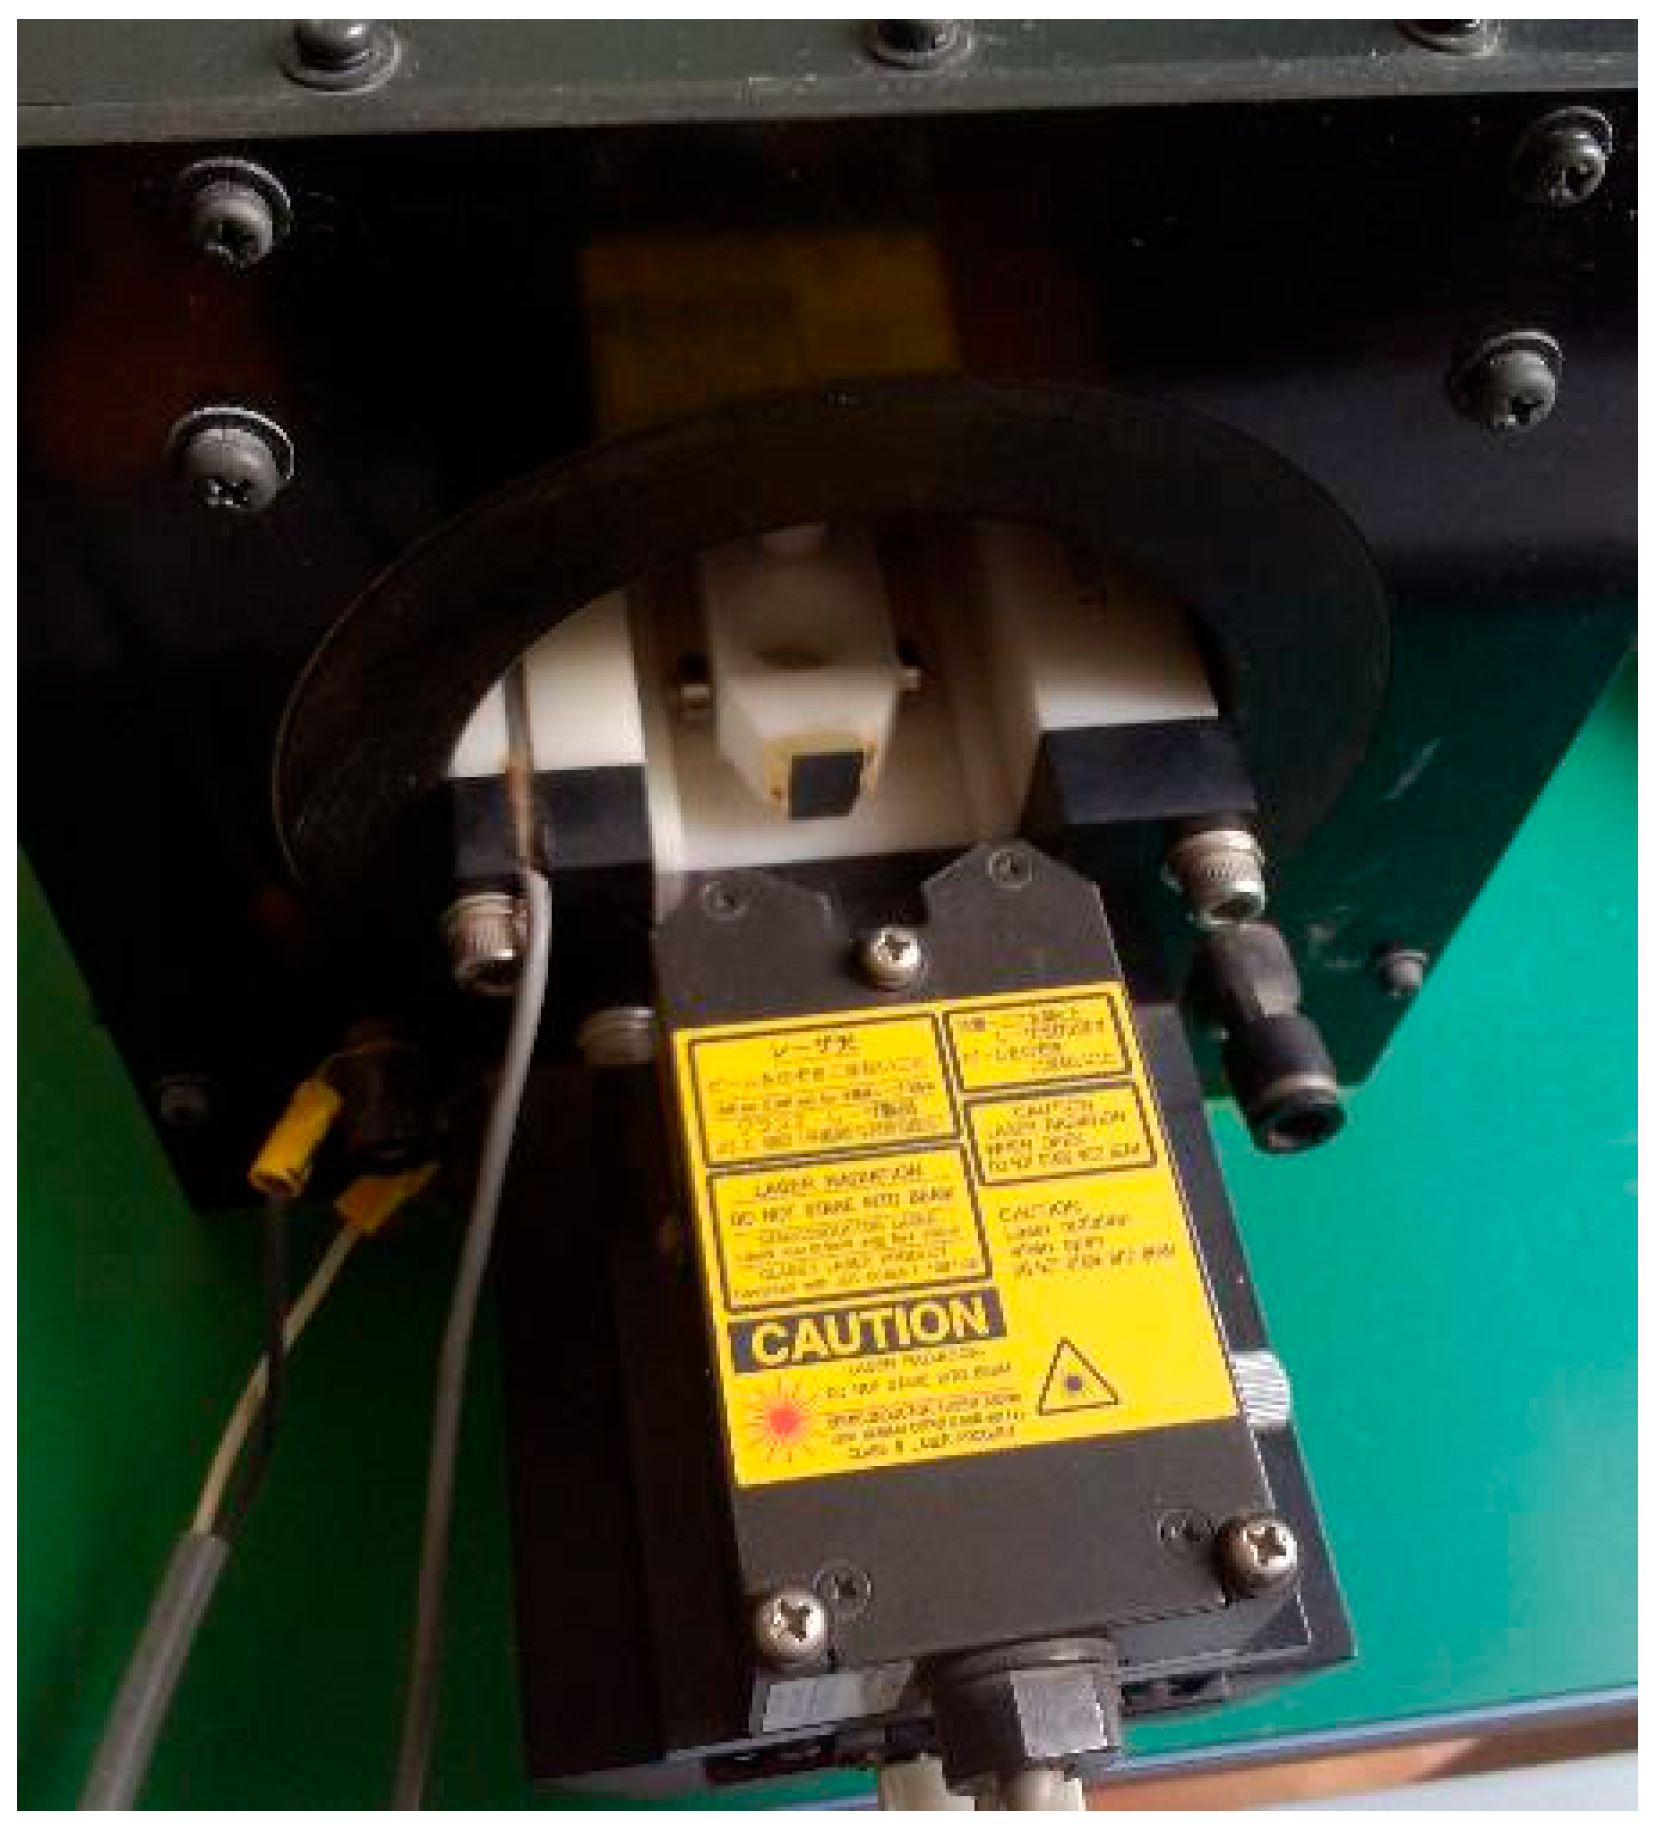
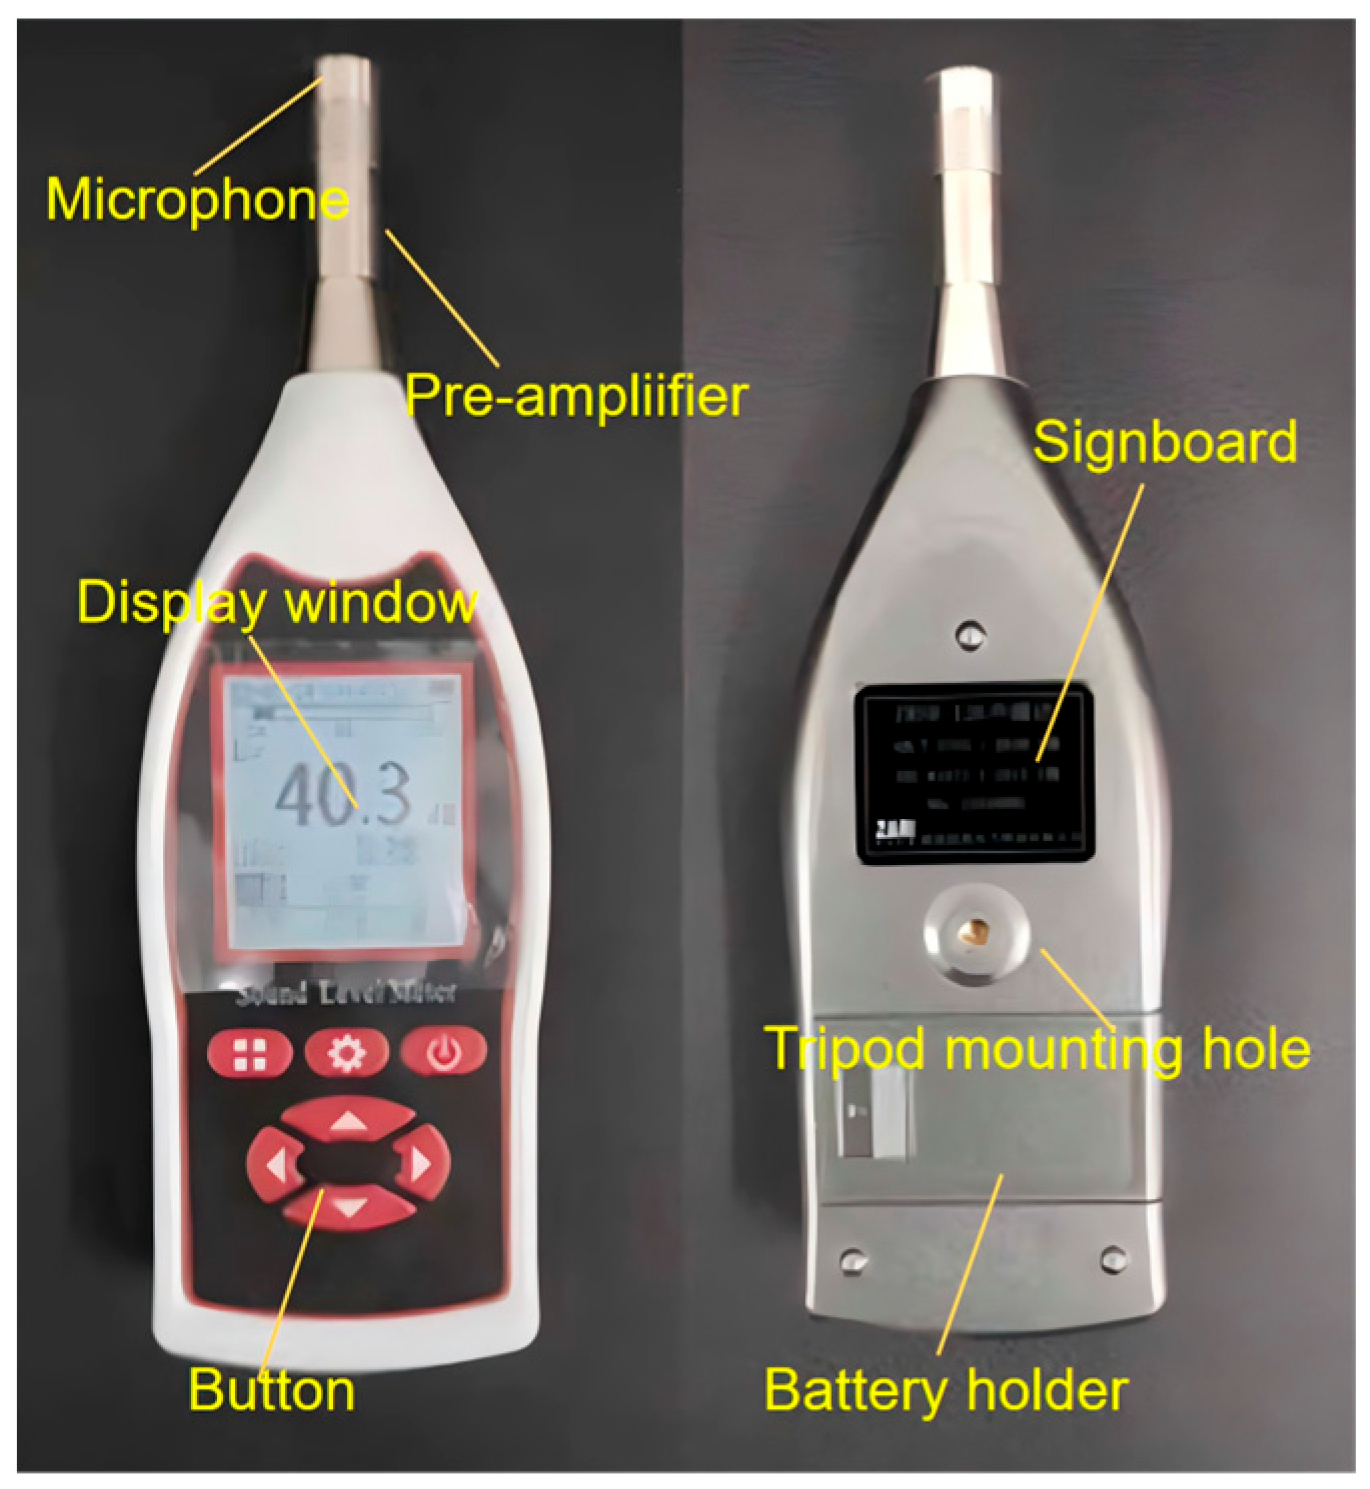
Upon obtaining the audio signals from the transformer under normal operating conditions, this study utilized the ZRSR-126 sound level meter (manufactured by Hunan Zhanrui Electric Power Technology Co., Ltd. from Changsha, Hunan province, China.) for audio acquisition. This device, commonly deployed in industrial environments, features operational simplicity and portability. The physical apparatus is illustrated in Figure 20.
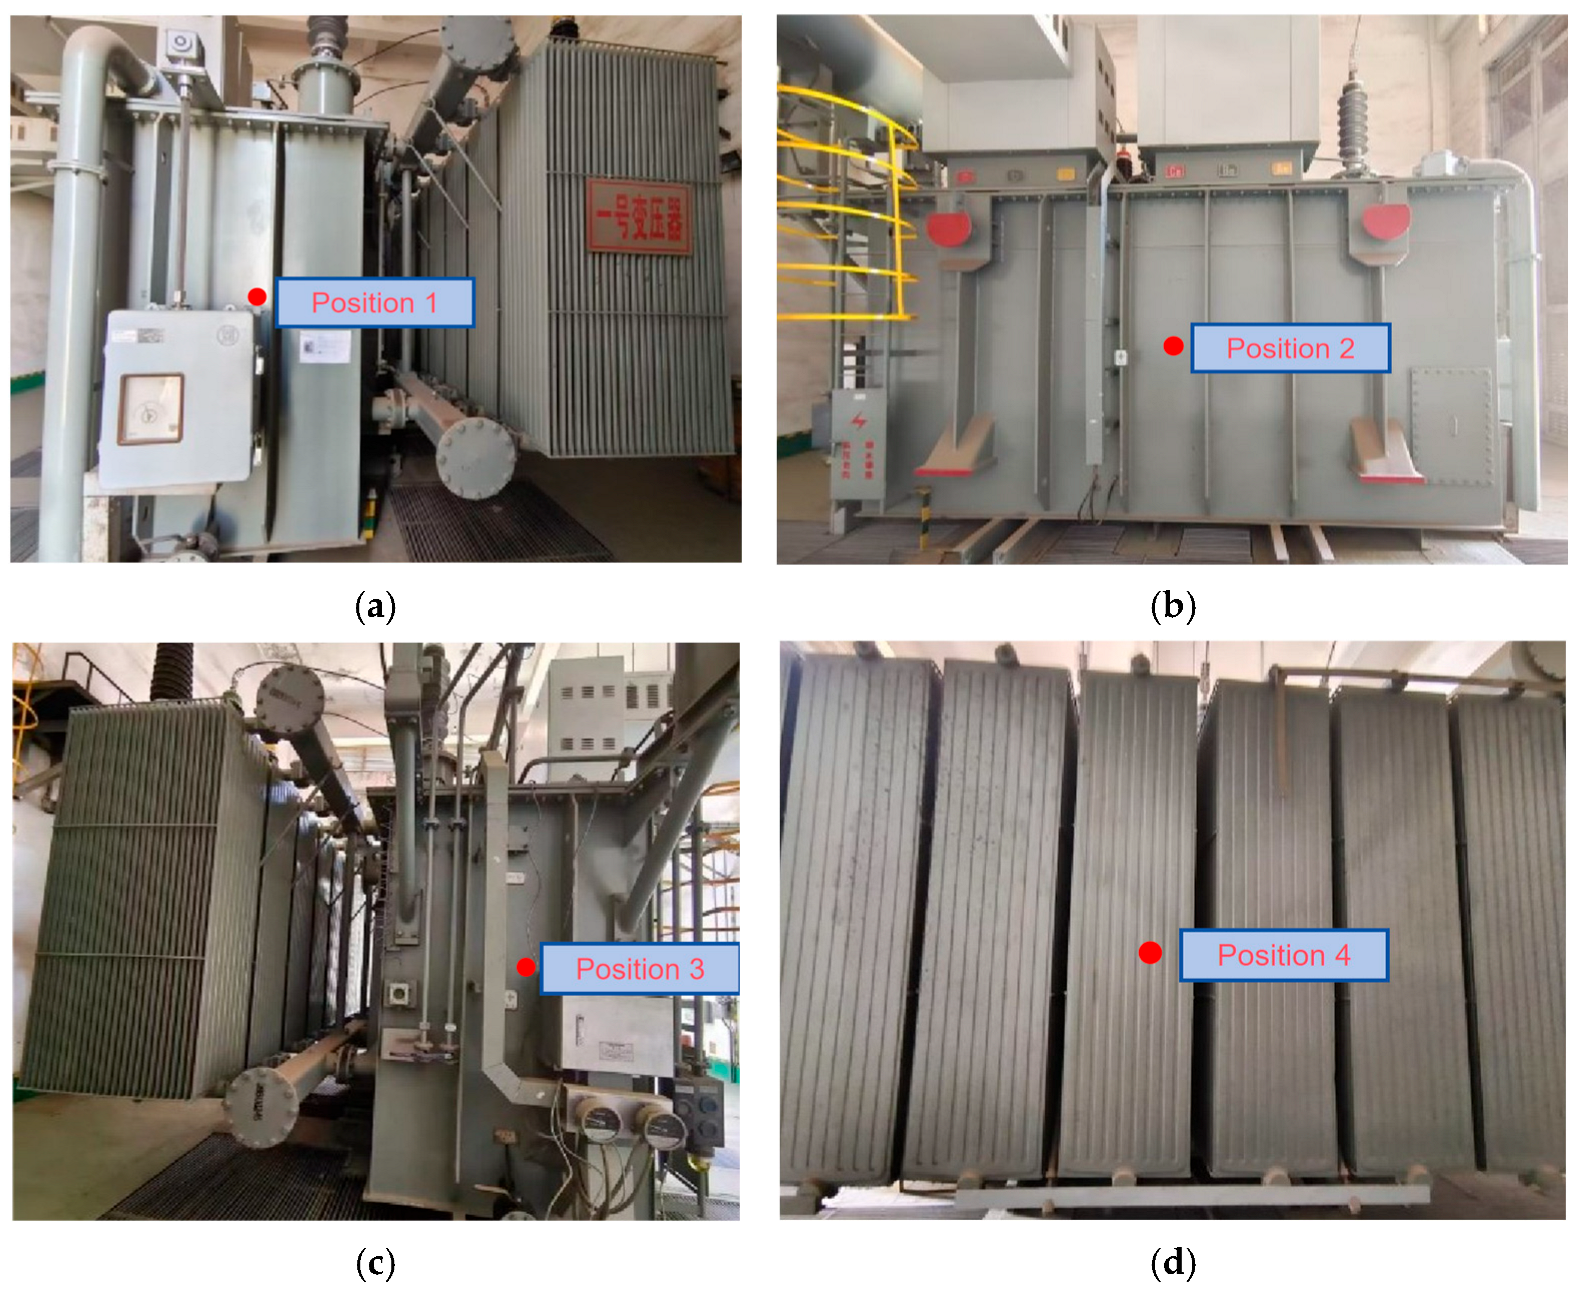
The ZRSR-126 sound level meter utilizes advanced digital detection technology, featuring stable performance, a relatively wide measurement range, and user-friendly operation. Moreover, its compact structural design ensures portability, meeting all the requirements for transformer audio acquisition in this study. In accordance with the national standard for noise measurement of oil-immersed transformers, the sound pressure level method was employed, with test points positioned 1 m from the transformer surface along the central axis of its cross-section. Data acquisition was conducted at positions 1, 2, 3, and 4 on the transformer tank wall, as illustrated in Figure 21.
Audio signals, being short-duration non-stationary signals, are not directly applicable for analysis. The acoustic signals from transformers similarly constitute non-stationary signals containing substantial information. To utilize voiceprint recognition technology for identifying transformer operational states, preprocessing of the acquired audio signals is essential.
Manual operations during audio acquisition inevitably introduce silent segments at both the beginning and end of recordings. These silent segments contain no valuable information. The comparative results before and after processing these silent segments in the noise signal are demonstrated in Figure 22.
As shown in Figure 23, the recorded audio of the transformer contains minor silent segments at both the beginning and end of the signal. The segment between the red lines represents the truly effective information from the transformer, necessitating the removal of the leading silent portions. The specific procedure is as follows: Using the Python3.9.7 programming environment, the trim function from the librosa library was employed to truncate the audio signal. This function automatically identifies and removes silent sections based on the energy level of the audio signal. If the energy of a particular frame falls below a certain threshold relative to the global maximum energy (determined by the top_db parameter), it is considered silent and removed. During this process, the trim function returns two values: the truncated audio signal yt and the indices index of the removed segments. Here, yt is the processed audio signal after truncation, and index is an array containing the start and end indices of the removed portions. In this study, the top_db parameter is typically set to 30. However, based on comparative observations before and after silence removal, a parameter value of 20 was found to yield better results for silence elimination.
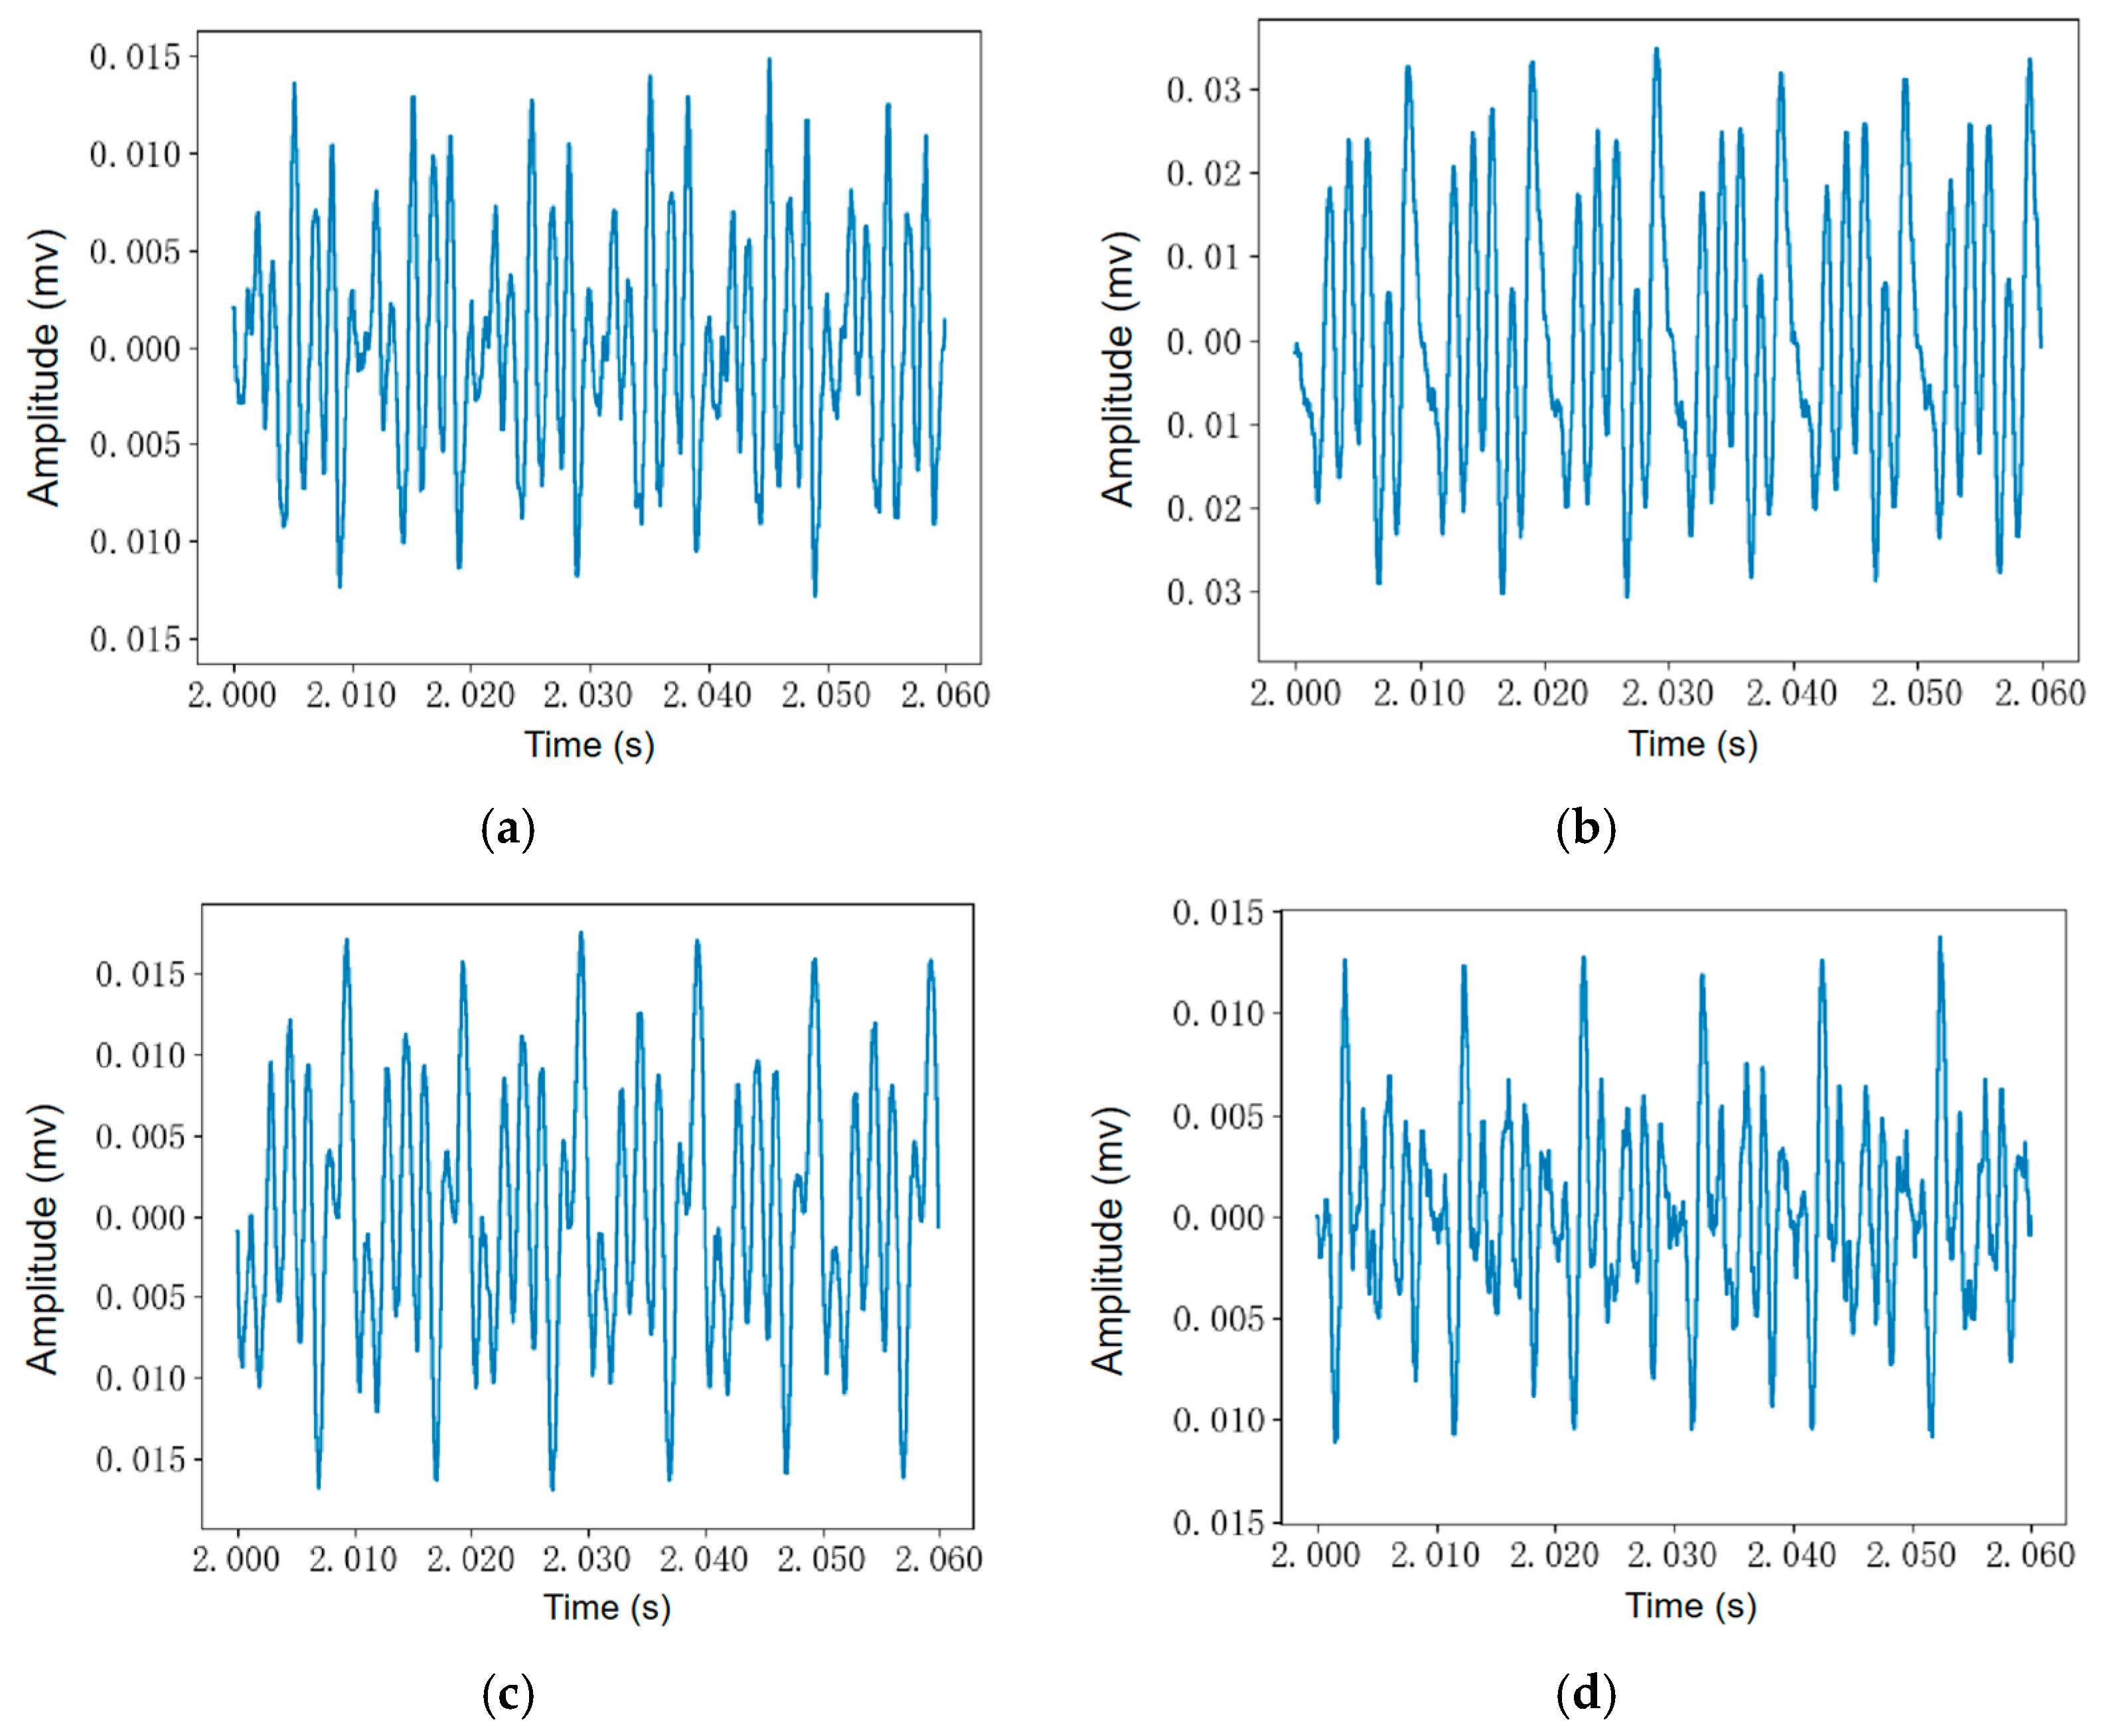
The audio signals from different detection points after silence removal were read, with the vertical coordinate representing the sound pressure level in terms of electrical level signals. The audio readings from various transformer detection points are shown in Figure 23.
The audio duration for each detection point was read as 0.06 s, revealing a periodic variation pattern with distinct amplitudes observed across different points. As established in Section 2 regarding the propagation pathways of transformer acoustic signals, the sound pressure level varies significantly when transmitted to different spatial positions. To facilitate comparative analysis of audio signals, the time-domain characteristics are conventionally transformed into frequency-domain relationships for deeper examination.
For comprehensive understanding of signal amplitude–frequency characteristics, Fourier transform was applied to the audio signals measured at various locations, with the resulting spectral relationships depicted in Figure 24.
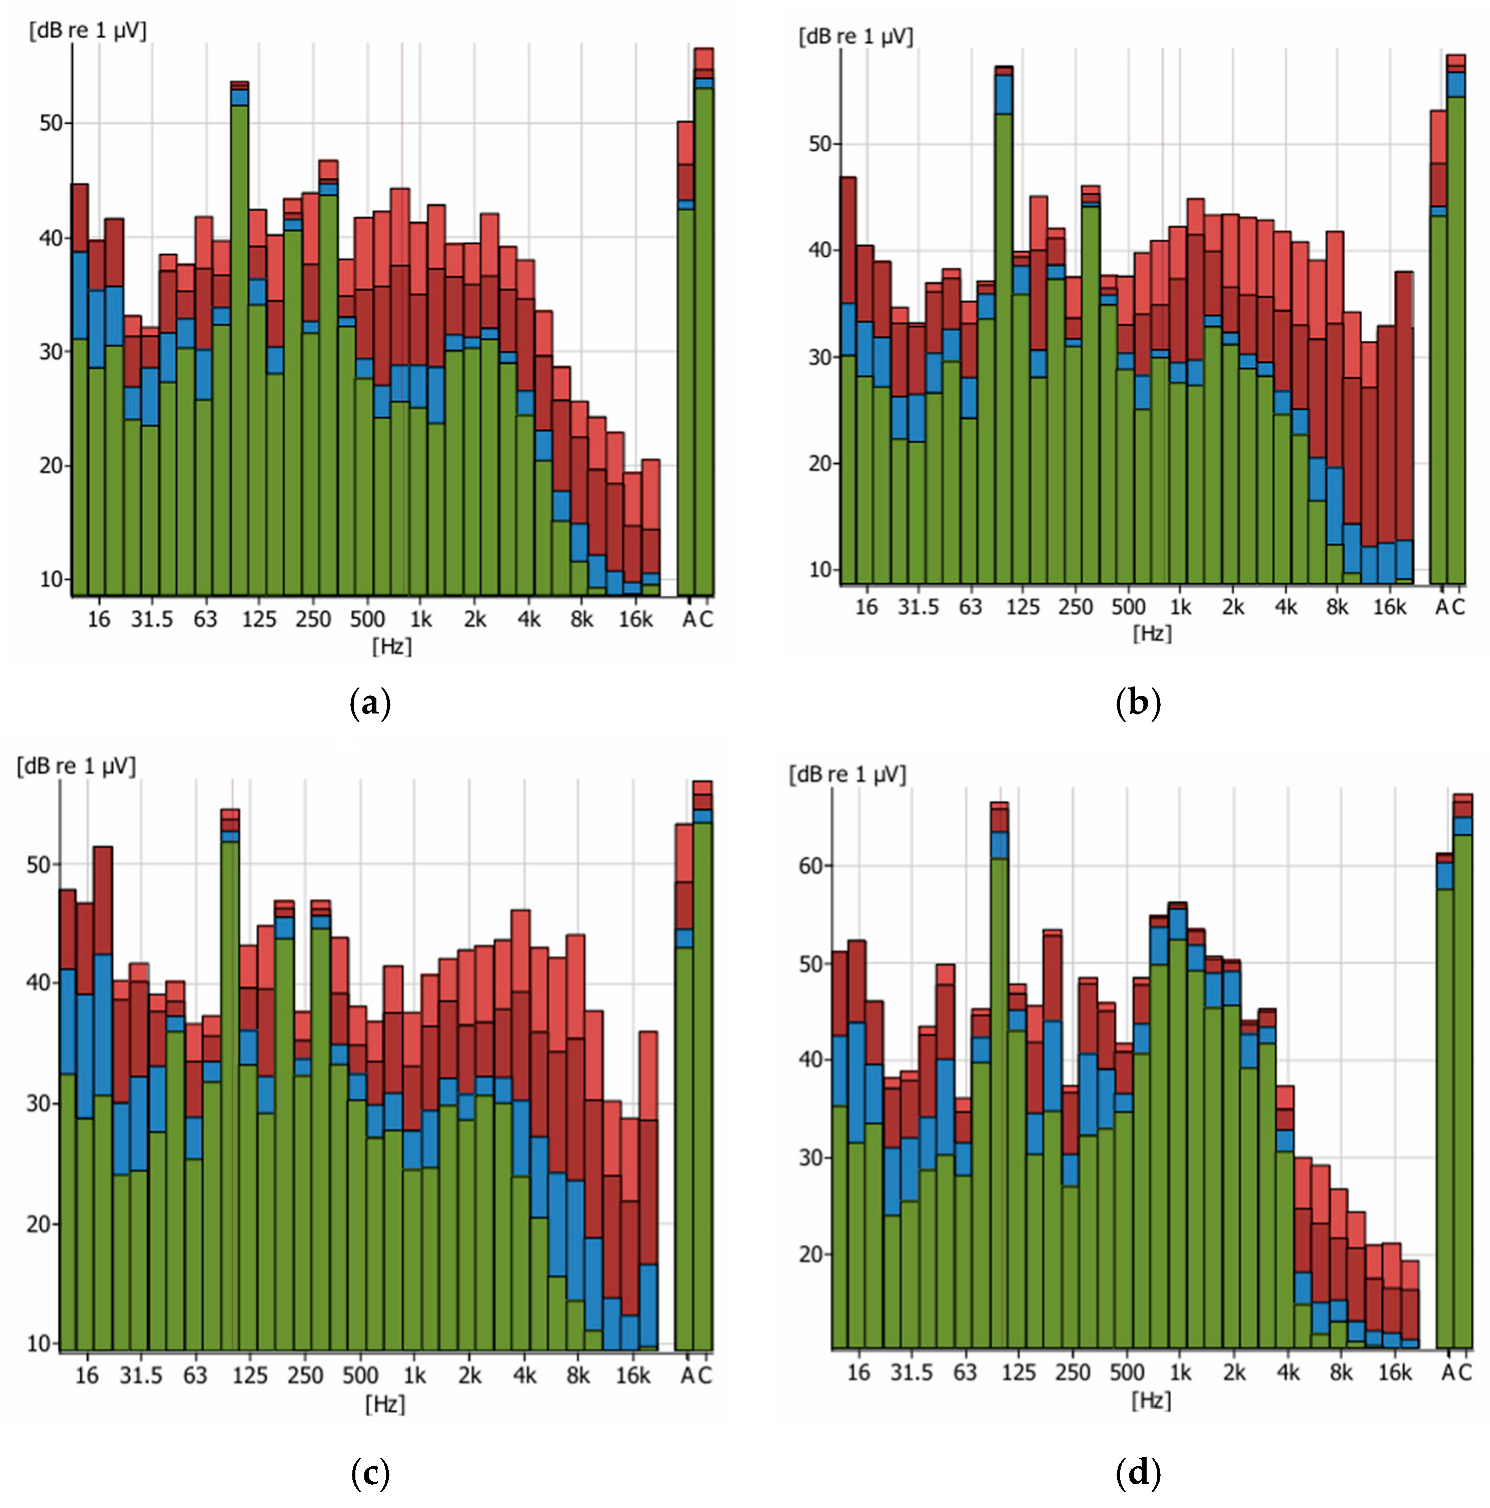
As observed in Figure 24, the frequency spectrum from the detection points indicates that the transformer’s acoustic energy is predominantly concentrated at 100 Hz. In addition to this fundamental frequency, the spectrum contains harmonic components at integer multiples of 100 Hz. These harmonic distortions likely originate from nonlinear elements within the transformer, such as magnetic core saturation and iron losses.
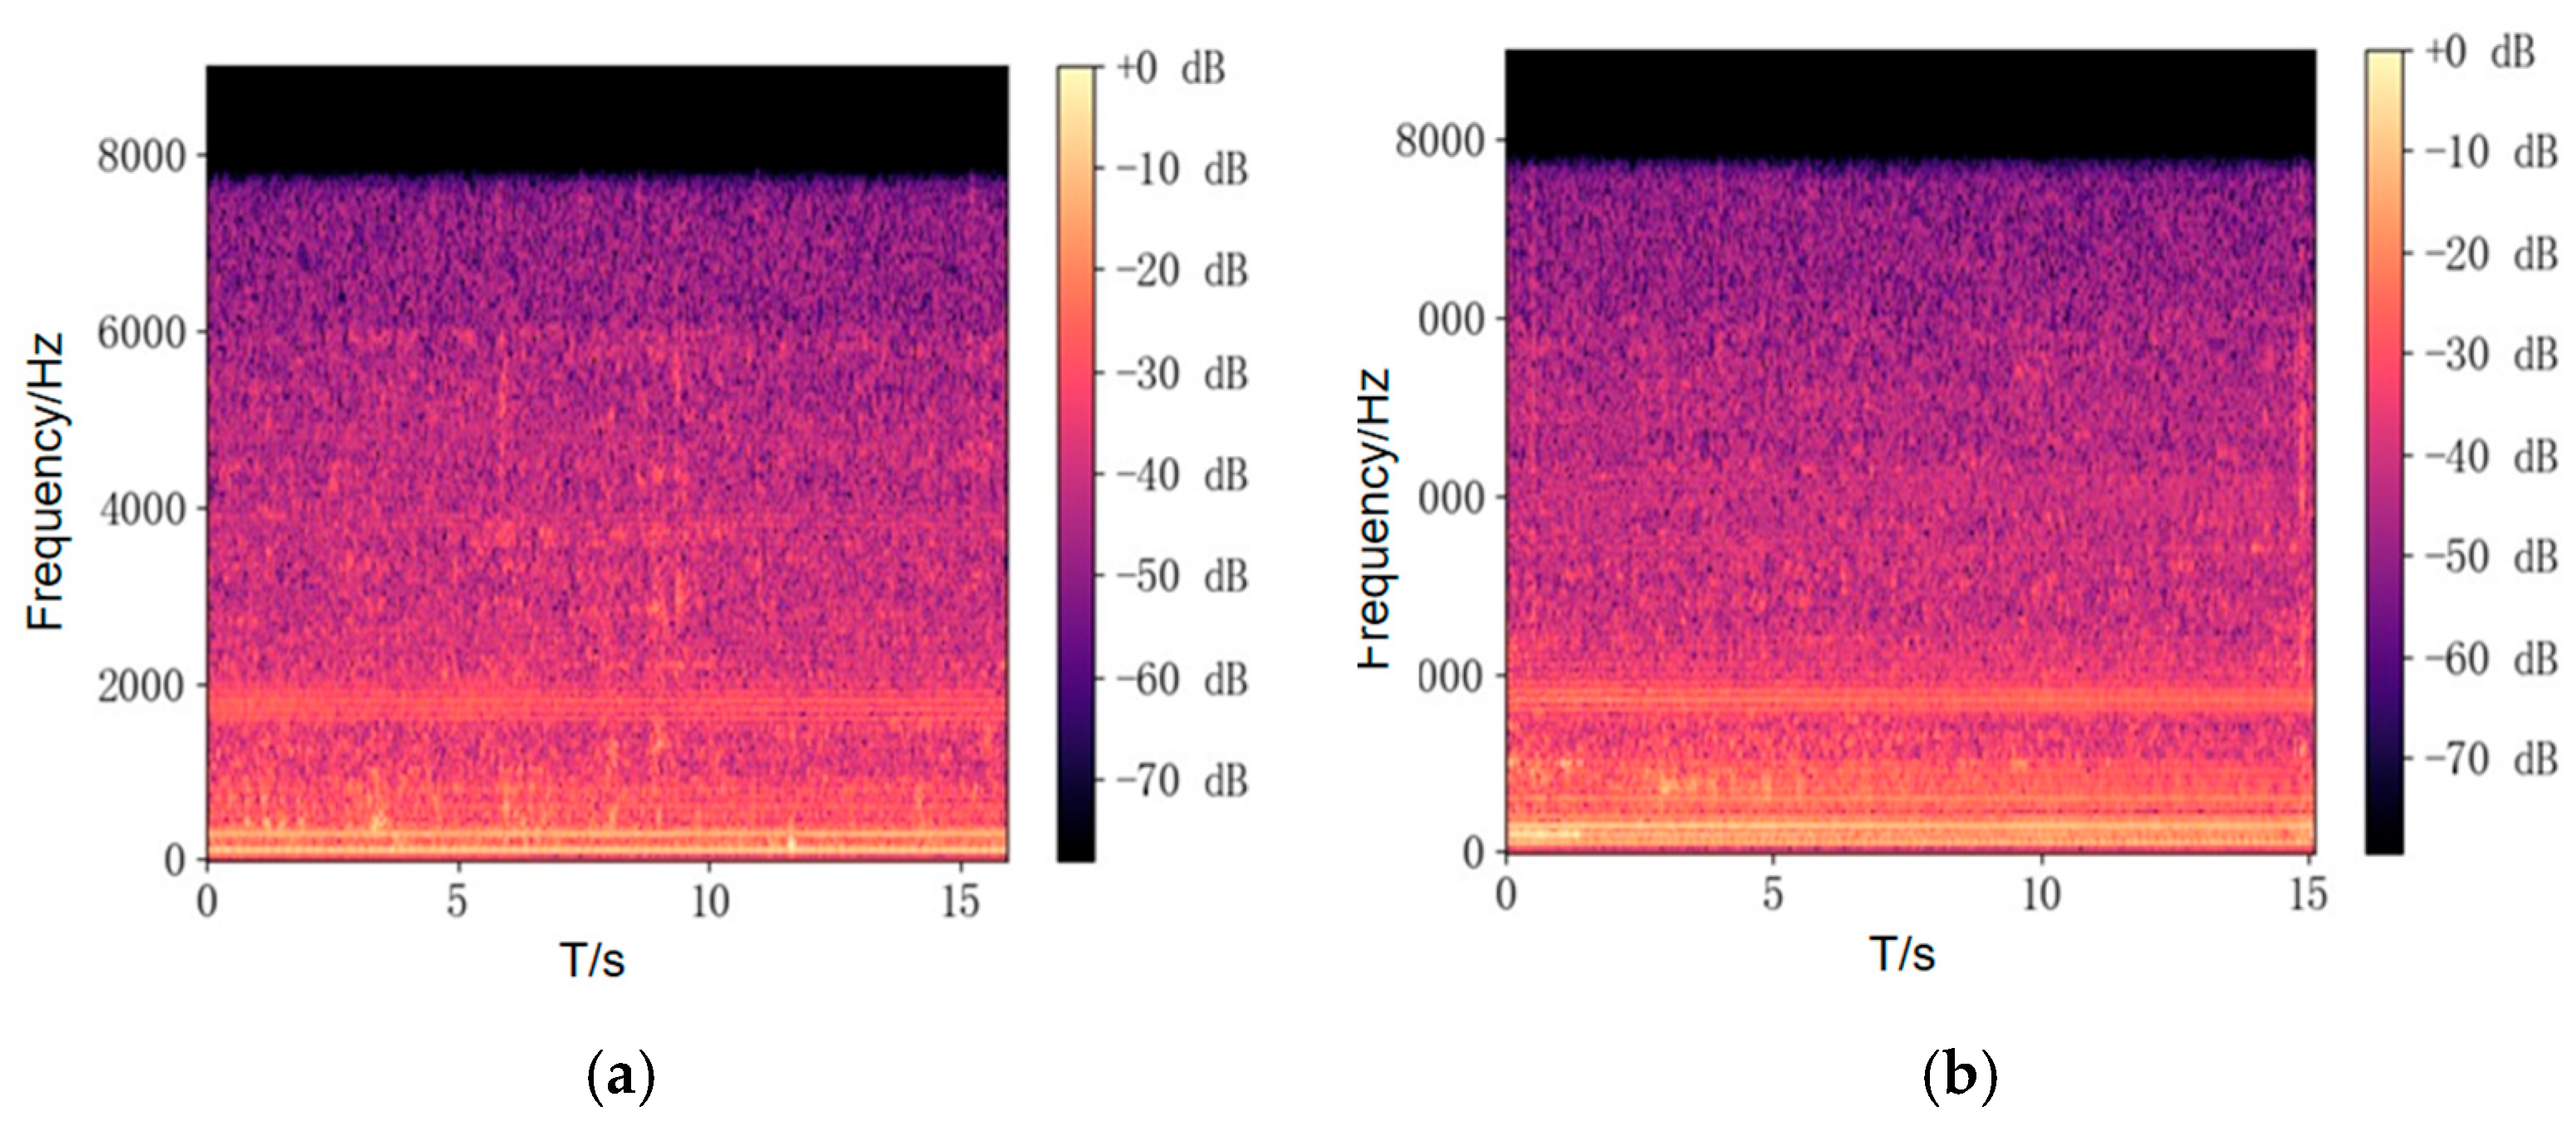
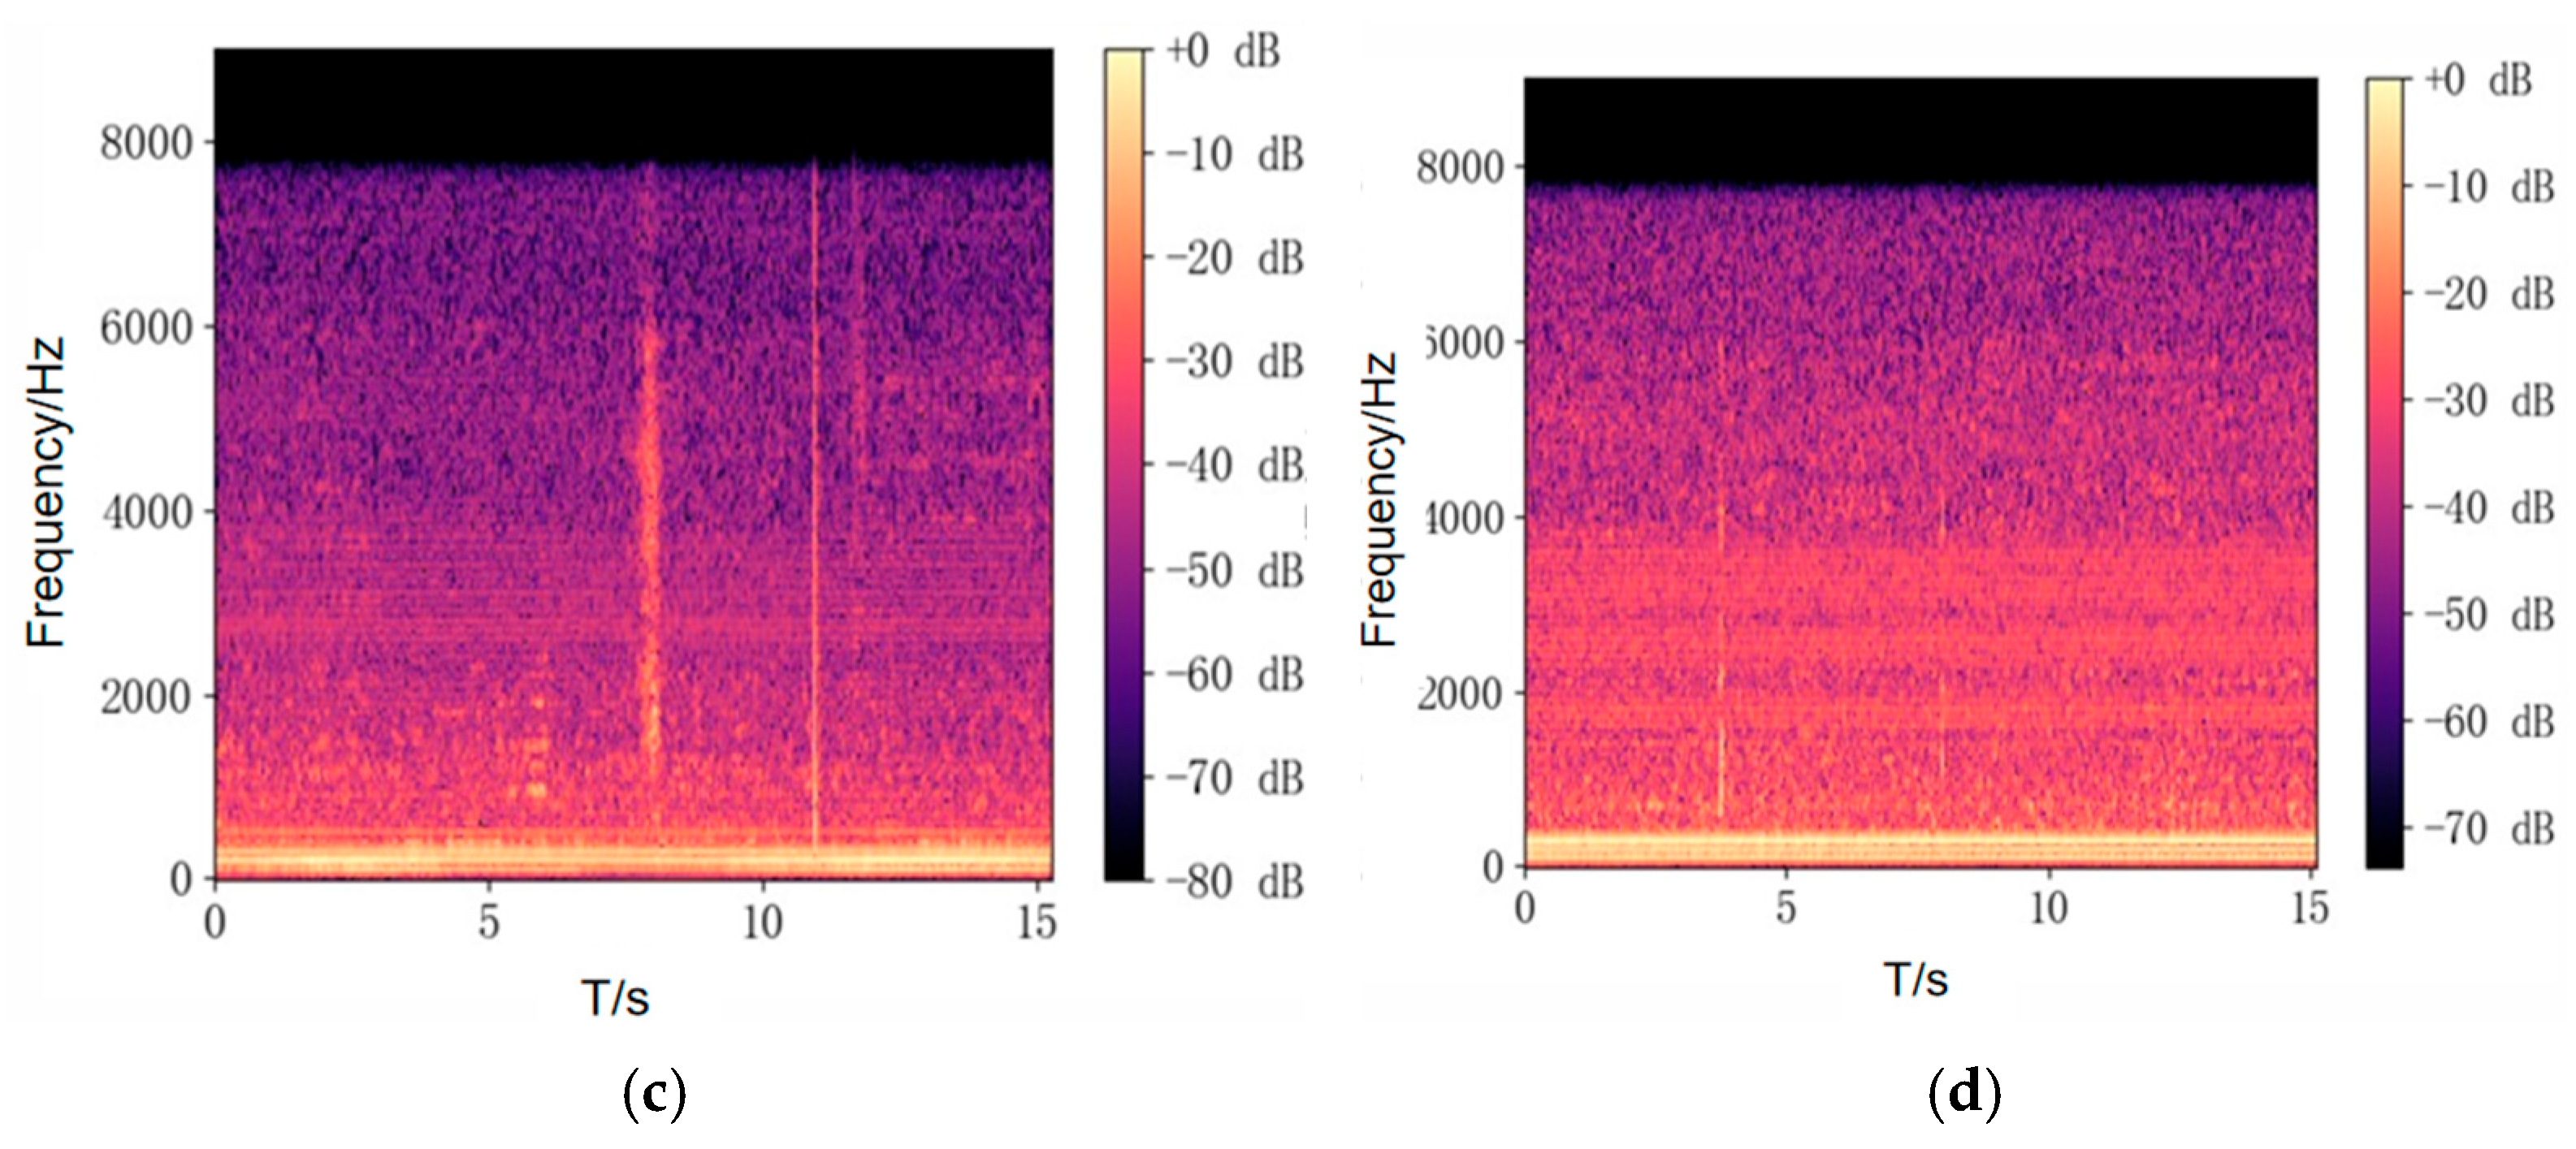
Through the analysis of spectrograms under different operating conditions, as shown in Figure 25, darker shades typically represent frequency components with high signal intensity or energy, while lighter shades indicate the opposite. Regardless of the operating condition of the transformer, the frequency is primarily concentrated at 100 Hz. Regarding the sound pressure level corresponding to 100 Hz, the core loosening condition exhibits the highest sound pressure level compared to other conditions. The reason for this may be attributed to mechanical resonance of internal components, such as screws, caused by core loosening.
Due to the alternating magnetic field generated during transformer operation, eddy currents may be induced in internal metal components, potentially giving rise to frequency components around 200 Hz. Alternatively, electromagnetic noise generated by the electromagnetic field may produce frequency components above 300 Hz, or transformer components may resonate under specific excitations, thereby amplifying sounds at particular frequencies.
It can be observed that the sound pressure level under normal operation is slightly higher than under undervoltage conditions but lower than under overvoltage conditions. This is because increased voltage elevates the magnetic flux density, intensifying the magnetostriction effect in the core. This causes the core to undergo more significant periodic expansion and contraction under the alternating magnetic field. Since the magnetic force is proportional to the voltage, an increase in voltage leads to greater core vibration amplitude, thereby raising the sound pressure level.
The transformer operates under different working conditions with its frequency components predominantly concentrated in the low-frequency range. As shown in Figure 26, darker colours indicate higher energy values in the corresponding regions, which correspond to greater sound intensity. However, this relationship is not strictly linear with the numerical values of sound pressure level. For frequency components above 2 kHz, the corresponding energy values become significantly weaker.
In terms of energy distribution, the energy is relatively substantial below approximately 200 Hz. Under rated voltage conditions, the energy is mainly concentrated at 100 Hz, with the energy in the vicinity of 100 Hz being slightly higher than that at other frequencies. The energy distributions under under-voltage and over-voltage conditions appear similar. However, comparative analysis reveals that besides the 100 Hz component, other frequency components are present. Excessive voltage leads to increased internal magnetic field intensity, which may cause redistribution of the internal magnetic field. This redistribution alters the resonant frequencies of the core and windings, resulting in elevated sound pressure levels and enhanced energy.
The characteristic spectrogram of core loosening demonstrates that the noise generated by core loosening increases significantly with the degree of looseness, producing louder noise levels. Additionally, new frequency components may be introduced. The above analysis shows consistency with the results obtained from simulations.
Furthermore, various noise sources during audio acquisition must be considered. These may include electrical interference from the acquisition equipment itself, electromagnetic interference from the external environment, or instability in the measured signal. All these interfering factors could potentially contribute to the generation of harmonic components in the transformer’s acoustic signature.

5. Conclusions

This paper presents a comprehensive investigation into the vibration and noise behaviour of oil-immersed transformers, emphasizing the critical role of transformer oil in modulating structural dynamics and acoustic emission. Key findings include:
  • Oil significantly influences vibration transmission, particularly by facilitating fluid-borne energy transfer from the windings to the tank wall. This highlights the importance of incorporating fluid–structure interaction in predictive models.
  • Magnetostriction remains the primary source of core noise, with its harmonic content sensitive to operational parameters such as load and voltage. This supports the use of acoustic harmonic analysis for early fault detection.
  • Simulation and experimental results align well, validating the proposed models and demonstrating the spatial variability of vibration and sound pressure across the transformer surface.
  • Sensor placement strategies must account for structural features such as stiffening ribs and clamping points, which can locally amplify or attenuate vibration signals.
  • The study lays the groundwork for advanced diagnostic techniques, including voiceprint recognition and digital twin modelling, by establishing a robust link between observable surface signals and internal mechanical states.
Future work should focus on expanding the dataset under varying operational and fault conditions, integrating machine learning algorithms for pattern recognition, and developing real-time monitoring systems based on the proposed models.

Author Contributions

Methodology, X.H.; Software, S.M. and X.Z.; Formal analysis, Y.Z. and R.L.; Investigation, B.Z. All authors have read and agreed to the published version of the manuscript.

Funding

This research was funded by [Liaoning Provincial Education Department] grant number [JYTQN2023087]. The APC was funded by [Liaoning Provincial Education Department].

Data Availability Statement

The original contributions presented in the study are included in the article; further inquiries can be directed to the corresponding author.

Conflicts of Interest

The authors declare no conflict of interest.

References

  1. Rashed, A.K.; Alshehawy, A.M.; Mansour, D.E.A.; Farade, R.A.; Ghali, M.; Megahed, T.F. Optical Spectroscopy Techniques for Condition Assessment and Fault Diagnosis of Power Transformer Insulation: A Critical Review on Technologies, Methods, and Standards. IEEE Trans. Dielectr. Electr. Insul. 2025, 32, 2162–2176. [Google Scholar] [CrossRef]
  2. Fofana, I.; Hadjadj, Y. Electrical-Based Diagnostic Techniques for Assessing Insulation Condition in Aged Transformers. Energies 2016, 9, 679. [Google Scholar] [CrossRef]
  3. Long, J.; Shenoi, A.R.; Jiang, W. A reliability-centred maintenance strategy based on maintenance-free operating period philosophy and total lifetime operating cost analysis. Proc. Inst. Mech. Eng. Part G J. Aerosp. Eng. 2009, 223, 711–719. [Google Scholar] [CrossRef]
  4. Lee, J.; Wu, F.; Zhao, W.; Ghaffari, M.; Liao, L.; Siegel, D. Prognostics and health management design for rotary machinery systems—Reviews, methodology and applications. Mech. Syst. Signal Process. 2014, 42, 314–334. [Google Scholar] [CrossRef]
  5. Bebbington, M.; Cronin, S.J.; Chapman, I.; Turner, M.B. Quantifying volcanic ash fall hazard to electricity infrastructure. J. Volcanol. Geotherm. Res. 2008, 177, 1055–1062. [Google Scholar] [CrossRef]
  6. Zhao, H.J.; Zhu, Y.; Wang, X.F.; Xing, Y.B.; Ding, S.M.; Chen, J. Research on Design and Application of Reactive Power Optimization Software for Distribution Network. In Proceedings of the 4th International Conference on Environmental and Energy Engineering (IC3E 2020), Sanya, China, 12 March 2020. [Google Scholar]
  7. Zhang, X.; Gockenbach, E. Asset-Management of Transformers Based on Condition Monitoring and Standard Diagnosis. IEEE Electr. Insul. Mag. 2008, 24, 26–40. [Google Scholar] [CrossRef]
  8. Jardinem, K.A.; Lin, D.; Banjevic, D. A review on machinery diagnostics and prognostics implementing condition-based maintenance. Mech. Syst. Signal Process. 2005, 20, 1483–1510. [Google Scholar] [CrossRef]
  9. Brown, R.E.; Humphrey, B.G. Asset management for transmission and distribution. IEEE Power Energy Mag. 2005, 3, 39–45. [Google Scholar] [CrossRef]
  10. Heng, A.; Zhang, S.; Tan, C.A.; Joseph, M. Rotating machinery prognostics: State of the art, challenges and opportunities. Mech. Syst. Signal Process. 2008, 23, 724–739. [Google Scholar] [CrossRef]
  11. Eugenio, B.; Cristiana, D.; Gianpio, L.M.D. Eigen-spectrograms: An interpretable feature space for bearing fault diagnosis based on artificial intelligence and image processing. Mech. Adv. Mater. Struct. 2023, 30, 4639–4651. [Google Scholar]
  12. Abu-Elanien, E.A.; Salama, M. Asset management techniques for transformers. Electr. Power Syst. Res. 2009, 80, 456–464. [Google Scholar] [CrossRef]
  13. Ayu, K.; Yunusa-Kaltungo, A. A Holistic Framework for Supporting Maintenance and Asset Management Life Cycle Decisions for Power Systems. Energies 2020, 13, 1937. [Google Scholar] [CrossRef]
  14. Xue, W.; Jia, D. A Novel Method for Winding Faults Diagnostic of Power Transformers Based on Parameter Estimation. IEEJ Trans. Electr. Electron. Eng. 2021, 16, 1563–1572. [Google Scholar] [CrossRef]
  15. Engin, B.; Varbak, S.N.; Erkan, D. Hybrid Condition Monitoring System for Power Transformer Fault Diagnosis. Energies 2023, 16, 1151. [Google Scholar] [CrossRef]
  16. Cui, Y.; Ma, H.; Saha, T.; Ekanayake, C.; Wu, G.N. Multi-physics modelling approach for investigation of moisture dynamics in power transformers. IET Gener. Transm. Distrib. 2016, 10, 1993–2001. [Google Scholar] [CrossRef]
  17. Gmati, G.; Fofana, I.; Picher, P.; Fernàndez, O.H.A.; Rebaine, D.; Meghnefi, F.; Brahami, Y.; Yapi, K.M.L. Effect of Moisture and Aging of Kraft Paper Immersed in Mineral Oil and Synthetic Ester on Bubbling Inception Temperature in Power Transformers. Energies 2025, 18, 4579. [Google Scholar] [CrossRef]
  18. Thango, A.B. Six Sigma-Based Frequency Response Analysis for Power Transformer Winding Deformation. Appl. Sci. 2025, 15, 3951. [Google Scholar] [CrossRef]
  19. Jingle Jabha, D.F.; Selvi, K.; Joselin, R. A Strategy to Determine Partial Discharge in XLPE Power Cables Using Acoustic Emission Detection Technique. J. Test. Eval. 2017, 46, 283–293. [Google Scholar] [CrossRef]
  20. Zarandi, D.F.; Behjat, V.; Gauvin, M.; Picher, P.; Ezzaidi, H.; Fofana, I. Power Transformers OLTC Condition Monitoring Based on Feature Extraction from Vibro-Acoustic Signals: Main Peaks and Euclidean Distance. Sensors 2023, 23, 7020. [Google Scholar] [CrossRef] [PubMed]
  21. Franciszek, W.; Zbigniew, O.; Grzegorz, S.; Maciej, S. The 8AE-PD computer measurement system for registration and analysis of acoustic emission signals generated by partial discharges in oil power transformers. Metrol. Meas. Syst. 2019, 26, 403–418. [Google Scholar] [CrossRef]
  22. MacAlpine, M.; Zhao, Z.; Demokan, M.S. Development of a fibre-optic sensor for partial discharges in oil-filled power transformers. Electr. Power Syst. Res. 2002, 63, 27–36. [Google Scholar] [CrossRef]
  23. Markalous, S.M.; Tenbohlen, S.; Feser, K. Detection and location of partial discharges in power transformers using acoustic and electromagnetic signals. IEEE Trans. Dielectr. Electr. Insul. 2008, 15, 1576–1583. [Google Scholar] [CrossRef]
  24. Hou, S.; Qin, Y.; Gao, J.; Lyu, F.; Li, X. Intelligent Monitoring System Based on Optical Fiber Acoustic Emission Sensor and Its Application in Partial Discharge Diagnosis of Gas-insulated Switchgear. Sens. Mater. 2021, 33, 1127–1136. [Google Scholar] [CrossRef]
  25. Si, W.; Fu, C.; Li, D.; Li, H.; Yuan, P.; Yu, Y. Directional Sensitivity of a MEMS-Based Fiber-Optic Extrinsic Fabry—Perot Ultrasonic Sensor for Partial Discharge Detection. Sensors 2018, 18, 1975. [Google Scholar] [CrossRef]
  26. Jiang, J.; Wang, K.; Wu, X.; Ma, G.; Zhang, C. Characteristics of the propagation of partial discharge ultrasonic signals on a transformer wall based on Sagnac interference. Plasma Sci. Technol. 2020, 22, 024002. [Google Scholar] [CrossRef]
  27. Liu, Y.; Peng, W.; Liang, Y.; Zhang, X.; Zhou, X.; Pan, L. Fiber-optic Mach-Zehnder interferometric sensor for high-sensitivity high temperature measurement. Opt. Commun. 2013, 300, 194–198. [Google Scholar] [CrossRef]
  28. Ma, G.M.; Shi, C.; Qin, W.Q.; Li, Y.B.; Zhou, H.Y.; Li, C.R. A Non-Intrusive Electrical Discharge Localization Method for Gas Insulated Line Based on Phase-Sensitive OTDR and Michelson Interferometer. IEEE Trans. Power Deliv. 2019, 34, 1324–1331. [Google Scholar] [CrossRef]
  29. Xin, X.; Luo, Y.; Tang, X.; Chen, P.; Li, Y. Relocatable Ultrasonic Array and UHF Combined Sensor Applied to PD Location in Oil. IEEE Sens. J. 2014, 14, 357–361. [Google Scholar]
  30. Sikorski, W. Active Dielectric Window: A New Concept of Combined Acoustic Emission and Electromagnetic Partial Discharge Detector for Power Transformers. Energies 2019, 12, 115. [Google Scholar] [CrossRef]
  31. Mingyong, L.; Olivier, H.; Xavier, M.; Frederic, B.; Laurent, B.; Thierry, W. Reduction of Power Transformer Core Noise Generation Due to Magnetostriction-Induced Deformations Using Fully Coupled Finite-Element Modeling Optimization Procedures. IEEE Trans. Magn. 2017, 53, 1–11. [Google Scholar]
  32. Sikorski, W.; Gielniak, J. Online Monitoring of Partial Discharges in Large Power Transformers Using Ultra-High Frequency and Acoustic Emission Methods: Case Studies. Energies 2025, 18, 1718. [Google Scholar] [CrossRef]
  33. Machado, B.B.; Casamayor, Á.H.; García, D.I.; Giner, E. Damage mechanism identification in additive manufactured extruded polymer via acoustic emission technique, experimental testing and pattern recognition models. Eng. Fail. Anal. 2025, 181, 109928. [Google Scholar] [CrossRef]
  34. Zhanlong, Z.; Yongye, W.; Sigong, Z.; Peiyu, J.; Huarui, Y. Online monitoring research of transformer vibration based on labview. J. Phys. Conf. Ser. 2019, 1168, 022083. [Google Scholar] [CrossRef]
  35. Bartoletti, C.; Desiderio, M.; Carlo, D.D.; Fazio, G.; Muzi, F.; Sacerdoti, G.; Salvatori, F. Vibro-Acoustic Techniques to Diagnose Power Transformers. IEEE Trans. Power Deliv. 2004, 19, 221–229. [Google Scholar] [CrossRef]
  36. Hong, L.; Zhang, R.; Zhang, R. Research on S-type fiber Bragg grating acceleration sensor for low-frequency vibration monitoring. Rev. Sci. Instrum. 2024, 95, 065006. [Google Scholar] [CrossRef]
  37. Simplice, A.; Issouf, F.; Zié, Y.; Brettschneider, S.; Peter, K.; Bekibenan, S. On the Feasibility of Monitoring Power Transformer’s Winding Vibration and Temperature along with Moisture in Oil Using Optical Sensors. Sensors 2023, 23, 2310. [Google Scholar] [CrossRef]
  38. Kinnunen, T.; Li, H.Z. An overview of text-independent speaker recognition: From features to supervectors. Speech Commun. Int. J. 2010, 52, 12–40. [Google Scholar] [CrossRef]
  39. Gryvill, H.; Grana, D.; Tjelmeland, H. Bayesian Ensemble Kalman Filter for Gaussian Mixture Models. Math. Geosci. 2024, 57, 153–192. [Google Scholar] [CrossRef]
  40. Kenny, P.; Ouellet, P.; Dehak, N.; Gupta, V.; Dumouchel, P. A Study of Interspeaker Variability in Speaker Verification. IEEE Trans. Audio Speech Lang. Process. 2008, 16, 980–988. [Google Scholar] [CrossRef]
  41. Xuan, X.; Han, R.; Ding, B. Research on Speaker Identification Models Based on CNN and Additive Angular Margin Loss. In Proceedings of the 2021 2nd International Conference on Electronics, Communications and Information Technology (CECIT 2021), Sanya, China, 27 December 2021. [Google Scholar]
  42. Ahmed, K.; Mohamed, D.; Ahmed, S.S. A novel hybrid feature method based on Caelen auditory model and gammatone filterbank for robust speaker recognition under noisy environment and speech coding distortion. Multimed. Tools Appl. 2022, 82, 16195–16212. [Google Scholar]
  43. Imam, S.A.; Lim, M.H.; Abdelrhman, A.M.; Ahmad, I.; Leong, M.S. Enhanced Blade Fault Diagnosis Using Hybrid Deep Learning: A Comparative Analysis of Traditional Machine Learning and 1D Convolutional Transformer Architecture. Eng. Rep. 2025, 7, 70202. [Google Scholar] [CrossRef]
  44. Fei, T.; Jiangfeng, C.; Qinglin, Q.; Meng, Z.; He, Z.; Fangyuan, S. Digital twin-driven product design, manufacturing and service with big data. Int. J. Adv. Manuf. Technol. 2018, 94, 3563–3576. [Google Scholar]
  45. Gabrielle, B.; Georges, A.N.; Dragan, K.; Stéphane, P. Multi-criteria prioritization of asset management investments in the power industry. IFAC Pap. Line 2022, 55, 1804–1809. [Google Scholar]
  46. Ramirez, I.; Pino, J.; Pardo, D.; Sanz, M.; Rio, L.; Ortiz, A.; Morozovska, K.; Aizpurua, I.J. Residual-based attention Physics-informed Neural Networks for spatio-temporal ageing assessment of transformers operated in renewable power plants. Eng. Appl. Artif. Intell. 2025, 139, 109556. [Google Scholar] [CrossRef]
  47. Guo, C.; Potekhin, V.V.; Li, P.; Kovalchuk, E.A.; Lian, J. MDFT-GAN: A Multi-Domain Feature Transformer GAN for Bearing Fault Diagnosis Under Limited and Imbalanced Data Conditions. Appl. Sci. 2025, 15, 6225. [Google Scholar] [CrossRef]
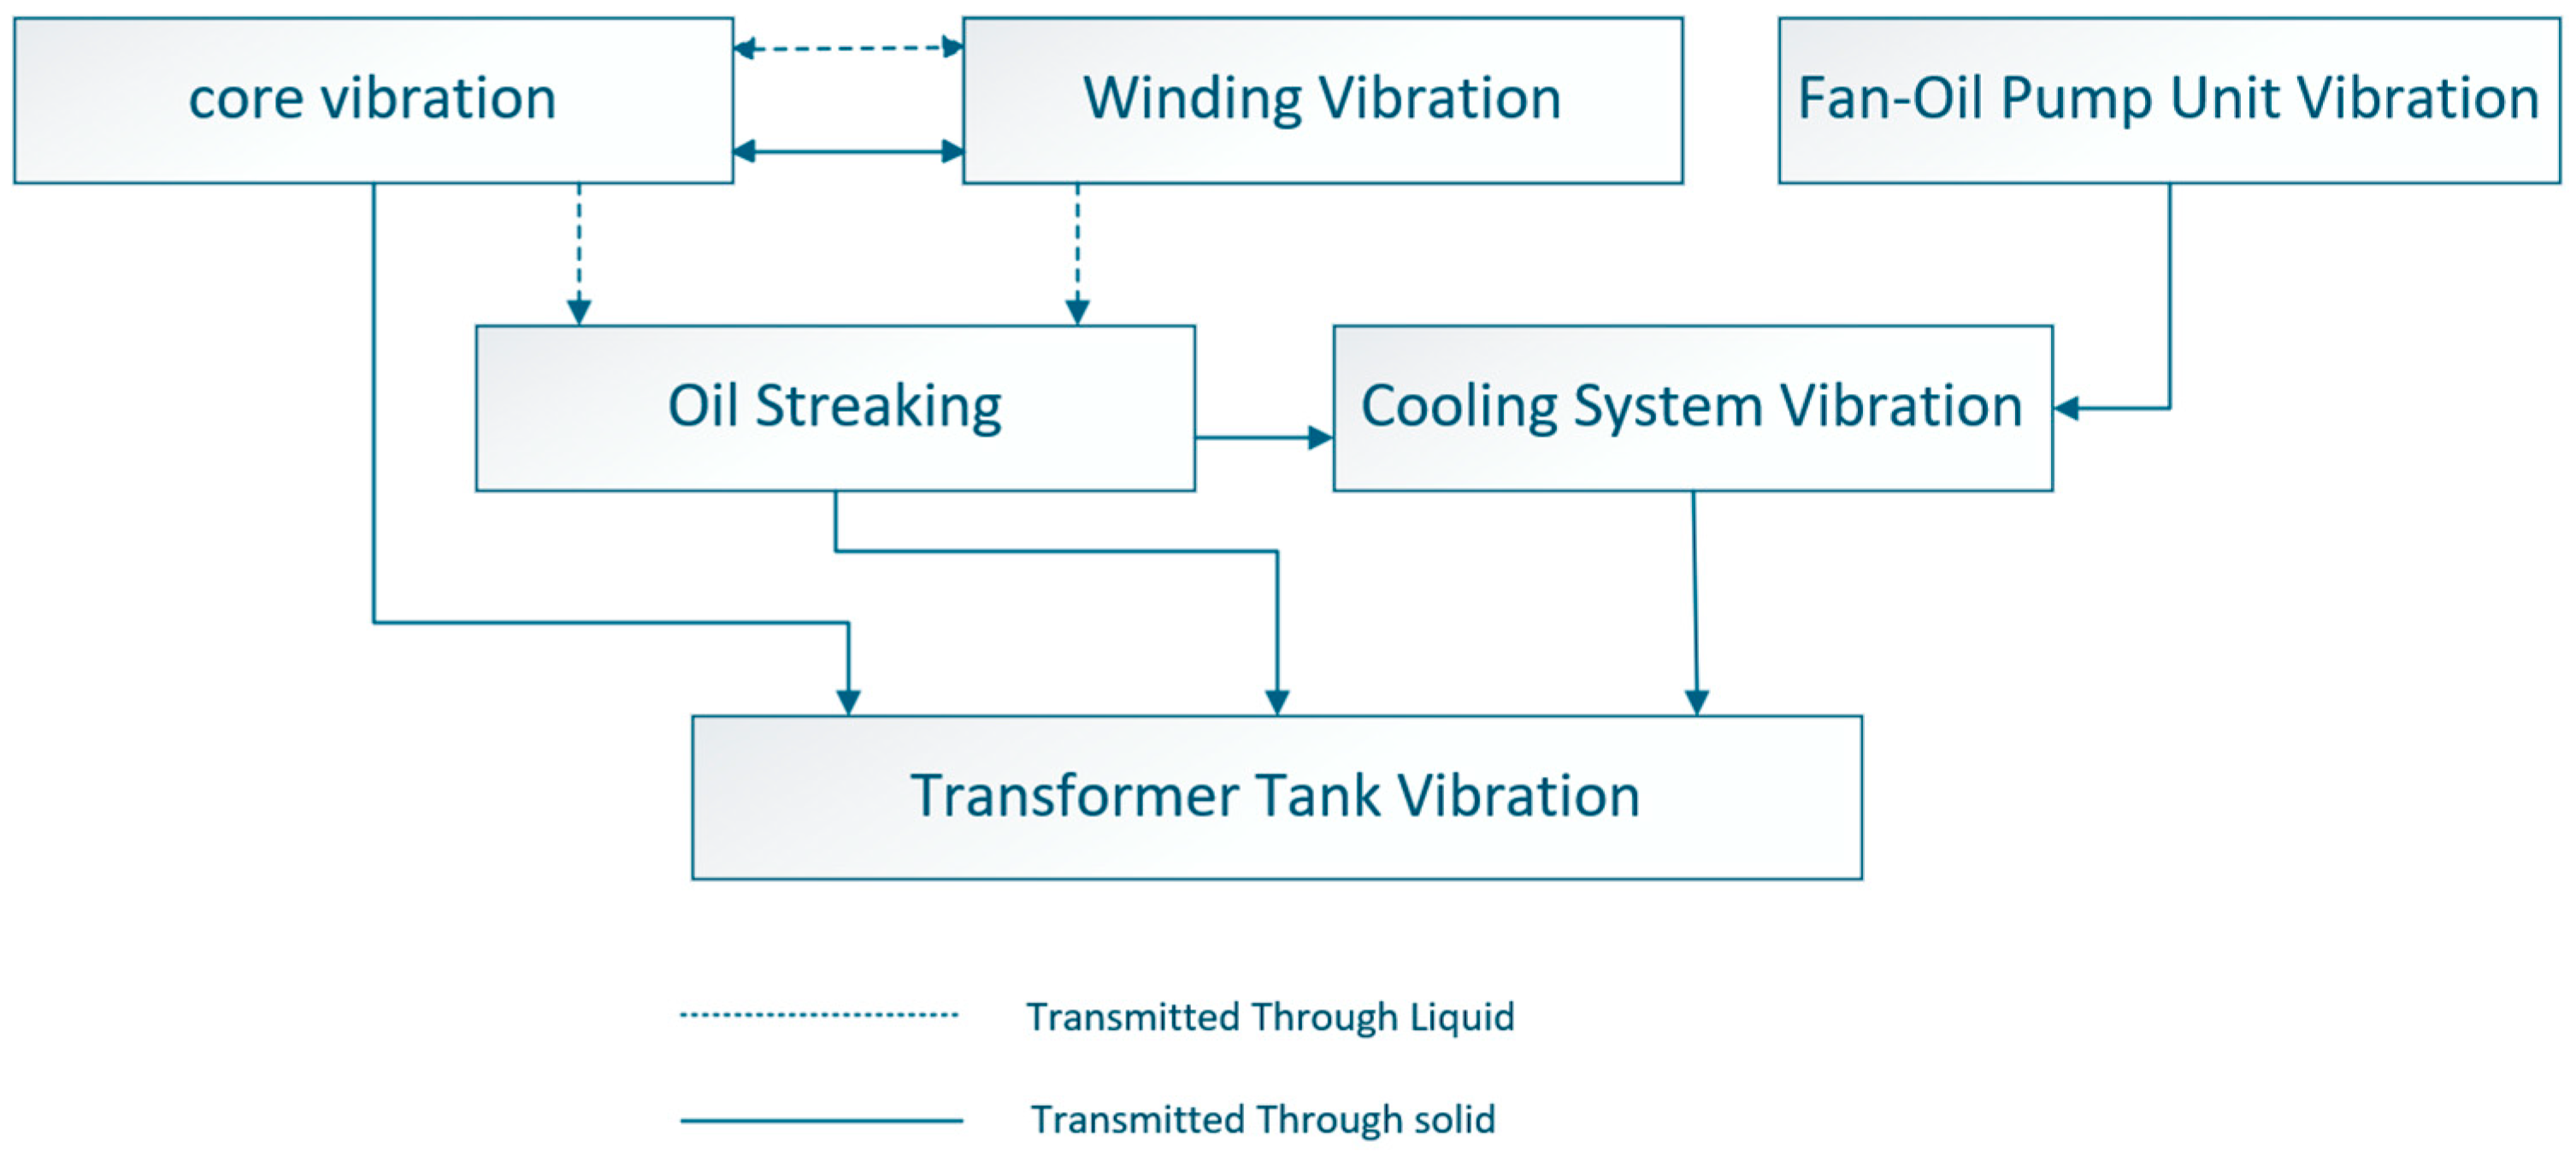
Figure 1. Vibration transmission path.
Energies 18 06155 g001
Figure 2. A multi-degree-of-freedom (MDOF) elastic system.
Energies 18 06155 g002
Figure 3. Measurement of magnetostrictive coefficients.
Energies 18 06155 g003
Figure 4. Vibratory response of the tank wall.
Energies 18 06155 g004
Figure 5. Sampling points with corresponding displacement curves. (a) Illustration of sampling points; (b) Plot of displacement.
Energies 18 06155 g005
Figure 6. Spatial distribution of the Lorentz Force.
Energies 18 06155 g006
Figure 7. Spatial distribution of surface vibratory response.
Energies 18 06155 g007
Figure 8. The effect of circumferential stiffening ribs.
Energies 18 06155 g008
Figure 9. Magnetostriction in microscopic perspective.
Energies 18 06155 g009
Figure 10. A two-dimensional finite element model of the sound field. (a) Multiple sampling points; (b) A field finite element model.
Energies 18 06155 g010
Figure 11. Acoustic pressure results under various loading conditions: (a) 90% load operating condition; (b) 96% load operating condition; (c) 102% load operating condition; (d) 106% load operating condition.
Energies 18 06155 g011
Figure 12. Acoustic pressure results under various voltage conditions: (a) 90% voltage condition; (b) 96% voltage condition; (c) 102% voltage condition; (d) 108% voltage condition.
Energies 18 06155 g012aEnergies 18 06155 g012b
Figure 13. Sound pressure distribution under core looseness condition: (a) 97.5% iron core loosening; (b) 90% iron core loosening; (c) 85% iron core loosening; (d) 80% iron core loosening.
Energies 18 06155 g013
Figure 14. Locations of the frontal sampling points on the tank.
Energies 18 06155 g014
Figure 15. Tank front sound pressure.
Energies 18 06155 g015
Figure 16. Tank front sound pressure derivative.
Energies 18 06155 g016
Figure 17. The locations of the sampling points on the tank side.
Energies 18 06155 g017
Figure 18. Tank side sound pressure.
Energies 18 06155 g018
Figure 19. Tank side sound pressure derivative.
Energies 18 06155 g019
Figure 20. ZRSR-126 sound level meter.
Energies 18 06155 g020
Figure 21. Location of transformer test points. (a) Position 1; (b) Position 2; (c) Position 3; (d) Position 4.
Energies 18 06155 g021
Figure 22. Audio mute elimination at the starting and ending positions of transformers. (a) Before silence removal; (b) After silence removal.
Energies 18 06155 g022
Figure 23. Reading of noise signals from different locations. (a) Position 1; (b) Position 2; (c) Position 3; (d) Position 4.
Energies 18 06155 g023
Figure 24. Spectrograms at different locations. (a) Position 1; (b) Position 2; (c) Position 3; (d) Position 4.
Energies 18 06155 g024
Figure 25. Spectrograms under different operating conditions. (a) 90% voltage condition; (b) 110% voltage condition; (c) nominal voltage; (d) iron core loosening.
Energies 18 06155 g025
Figure 26. Mel spectrograms for different operating conditions: (a) 90% voltage condition; (b) 110% voltage condition; (c) nominal voltage; (d) iron core loosening.
Energies 18 06155 g026aEnergies 18 06155 g026b
Disclaimer/Publisher’s Note: The statements, opinions and data contained in all publications are solely those of the individual author(s) and contributor(s) and not of MDPI and/or the editor(s). MDPI and/or the editor(s) disclaim responsibility for any injury to people or property resulting from any ideas, methods, instructions or products referred to in the content.