Article

Low-Carbon Economic Dispatch of Agricultural Park Integrated Energy Systems Based on Improved Multi-Objective Grey Wolf Optimizer

by
Qianxi Pu
1,
Xiaoyuan Chen
1,2,*,
Boyang Shen
3 and
Lin Fu
3,*
1
School of Engineering, Sichuan Normal University, Chengdu 610101, China
2
Sichuan Energy Internet Research Institute, Tsinghua University, Chengdu 610213, China
3
College of Transportation, Tongji University, Shanghai 201804, China
*
Authors to whom correspondence should be addressed.
Energies 2025, 18(23), 6138; https://doi.org/10.3390/en18236138
Submission received: 20 September 2025 / Revised: 9 November 2025 / Accepted: 18 November 2025 / Published: 24 November 2025

Abstract

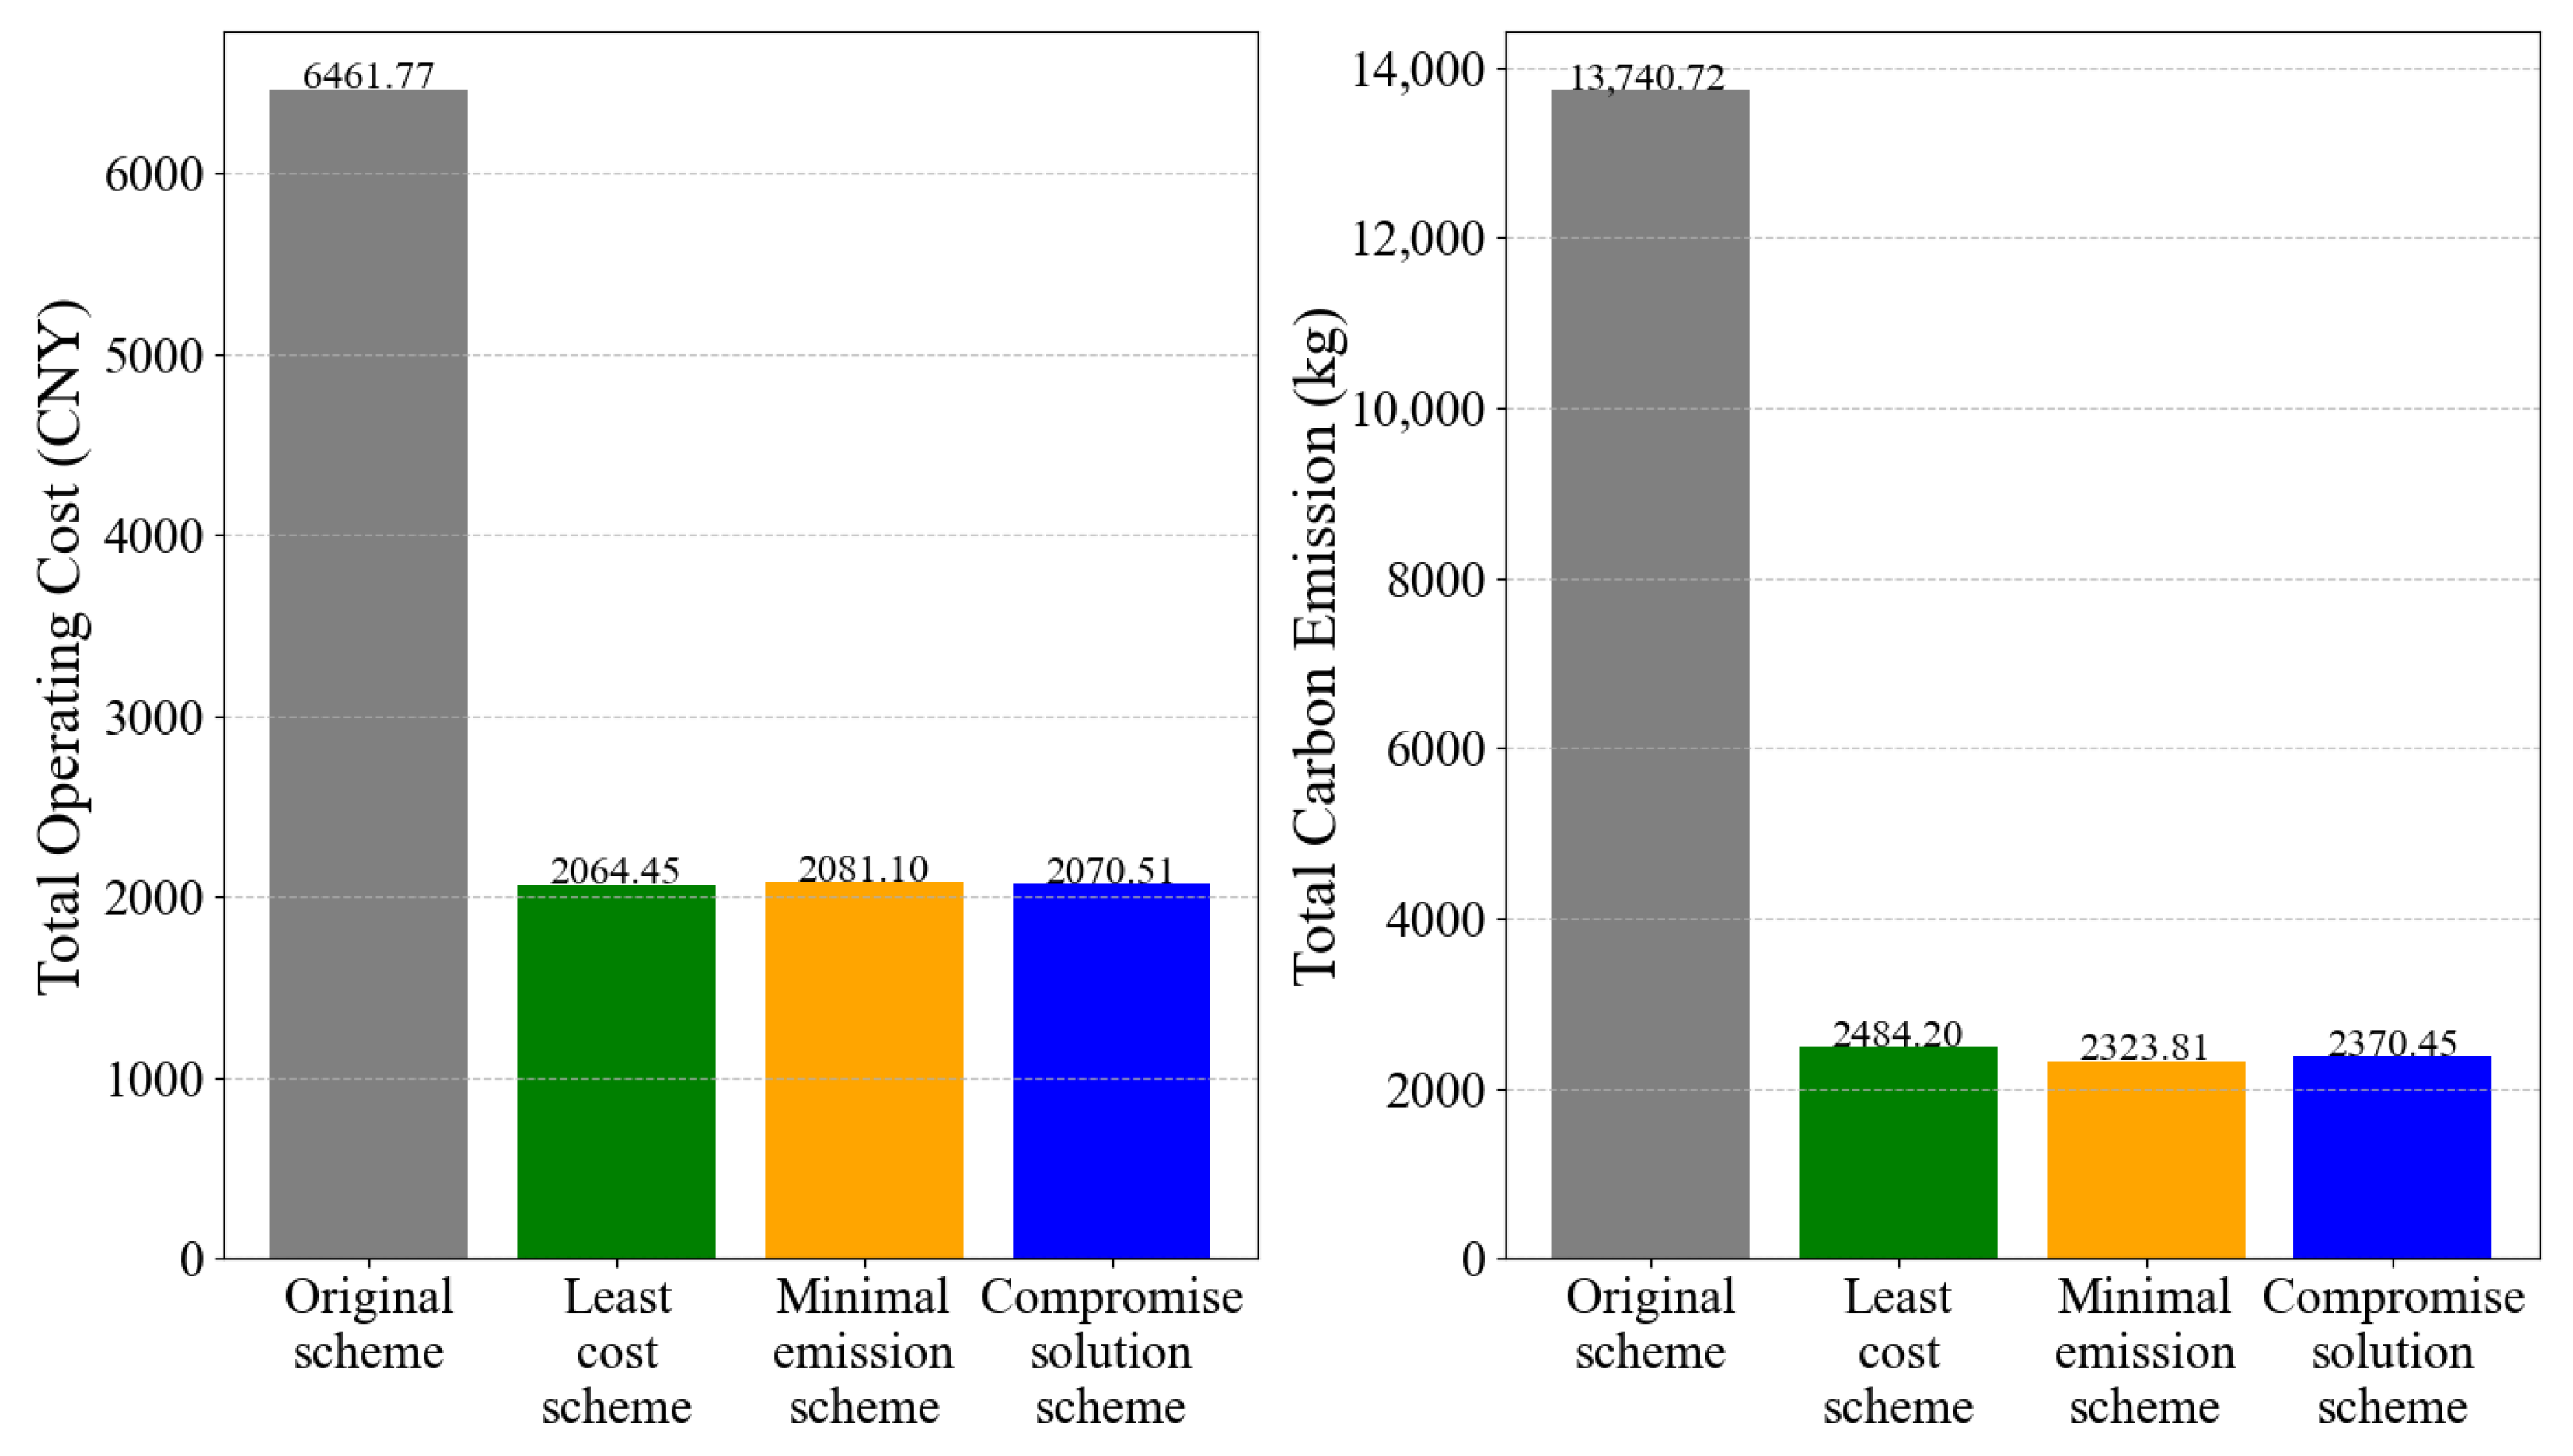
This article investigates a wind–solar–biogas complementary integrated energy system (IES) for achieving combined cooling, heating, and power (CCHP) supply in agricultural parks. The system consists of wind power, photovoltaic power, biogas-based combined heat and power (CHP), waste heat boilers, electric heating/cooling units, absorption chillers, and energy storage devices. Using Changma Village, Baiwu Town, Yanyuan County, Sichuan Province as a case study, a multi-objective optimization model was established with the objectives of minimizing operating costs and carbon emissions. An improved multi-objective grey wolf optimizer (MOGWO) was applied to solve the model. The results show that the proposed method yielded a well-distributed Pareto front. In the optimal compromise solution, the total operating cost decreased from CNY 6461.77 to CNY 2070.51, a reduction of 67.96%, and the carbon emissions decreased from 13,740.72 kg to 2370.45 kg, a reduction of 82.75%. The proposed wind–solar–biogas complementary IES can enhance both the overall economic performance and low-carbon sustainability of the agricultural park energy systems.

1. Introduction

To promote rural revitalization and achieve carbon peak and carbon neutrality goals, China issued the Rural Comprehensive Revitalization Plan (2024–2027) [1]. The development of modern agricultural parks is a key measure to advance supply-side structural reforms in agriculture and accelerate the modernization of agriculture and rural areas [2,3,4]. It also serves as an important platform for fostering new growth drivers in the rural economy and promoting thriving rural industries. With strong national policies supporting comprehensive rural revitalization, modern agricultural parks have become increasingly important. To date, over 350 national modern agricultural industrial parks have been supported across China [5].
Rural areas are rich in clean energy resources such as wind, solar, and biomass, providing a solid energy foundation and suitable conditions for the low-carbon development of modern agricultural parks [6]. By fully utilizing local clean energy, a multi-energy complementary integrated energy system can be established to supply electricity, heating, and cooling for agricultural park loads, thereby achieving efficient energy utilization and complementary operation of multiple energy sources, with significant economic and environmental benefits [7,8,9].
To explore the dynamic matching between the supply and load sides of integrated energy systems in agricultural parks, extensive research has been conducted internationally and domestically on algorithmic optimization and operational scheduling. Wu et al. [10] proposed an optimal scheduling strategy for an agricultural integrated energy system combining hybrid energy storage, biogas power generation, power-to-gas technology, and electric boilers. With the minimization of the total system operating cost as the single objective, the outputs of various energy conversion devices are controlled to enhance system performance and reduce operating costs. Ahmad et al. [11] presented an optimal design and operation strategy for a hybrid renewable energy system (HRES) in rural areas of Pakistan using particle swarm optimization to determine both grid-connected and off-grid configurations including wind, photovoltaic, and battery systems, aiming to minimize electricity costs. Liang et al. [12] developed a bi-level optimization model based on multi-agent game theory to address energy waste and conflicting interests among integrated energy systems in parks. In the upper-level model, a cooperative game driven by interval economic relations determines energy exchanges, which are then passed to the lower-level model. Li et al. [13] proposed a multi-objective bi-level sustainable development planning method for integrated energy systems (IESs), which considers bidirectional responses of supply–demand interactions and hydrogen utilization. The model aims to optimize economic performance, renewable energy consumption, and carbon emissions, and is solved using the Non-dominated Sorting Genetic Algorithm II (NSGA-II) in combination with the commercial solver Gurobi. Chen et al. [14] proposed a framework combining photovoltaic, wind turbines, and biomass–biogas combined heat and power technologies, establishing a multi-objective optimization model with economic, environmental, and primary energy saving rate objectives, solved via a non-dominated sorting genetic algorithm. Wang et al. [15] presented a new type of wind–solar–biogas–storage system, establishing an MECS optimization operation mode to maximize daily economic benefits. Chen et al. [16] proposed a multi-objective optimization scheduling method for integrated energy systems in facility agriculture parks, accounting for local wind–solar consumption and multiple constraints to effectively reduce operation and maintenance costs on typical days while maximizing renewable energy utilization. Yu et al. [17] combined electricity and carbon quota trading to establish a direct electricity–carbon trading mechanism, enhancing economic efficiency and reducing electricity and carbon trading costs. Dardon et al. [18] studied a hybrid photovoltaic–wind–biomass system coupled with battery storage in rural Guatemala to meet local energy demands. Winsly et al. [19] evaluated the feasibility of implementing a hybrid energy system combining biomass, solar, wind, and grid energy in higher education institutions. The efficient utilization of biomass reduced the grid share in the hybrid system, achieving a renewable energy penetration rate of 95%.
The optimal operation of an integrated energy system is typically determined based on an optimization model that considers the system’s objective functions and the operational constraints of each device. The primary objectives usually include economic performance, environmental impact, and energy utilization efficiency, while the constraints are generally classified as balance constraints and non-balance constraints. To solve such complex, nonlinear, multi-objective optimization problems, intelligent optimization algorithms—such as genetic algorithms, sine–cosine algorithms, particle swarm optimization, and Grey Wolf Optimizer (GWO)—are widely employed in both academia and engineering practice [20,21]. Among these, GWO has been extensively applied in energy system dispatch optimization due to its simple structure, few parameters, and fast convergence. However, the traditional GWO still exhibits limitations in multi-objective problems, including susceptibility to local optima and uneven distribution of solutions [22,23].
In this context, this study proposed an improved Grey Wolf Optimizer tailored to the characteristics of rural resource endowments, addressing the high operation and maintenance costs and significant carbon emissions of agricultural park integrated energy systems. The improved GWO overcame the limitations of the traditional single-objective GWO, mitigated the tendency to converge to local optima, and ensured a more uniform distribution of the solution set. It enabled reasonable allocation of wind, photovoltaic, and biogas generation outputs, as well as the charge–discharge strategies of energy storage devices and grid compensation. Electricity, heating, and cooling met the demands across different time periods while simultaneously minimizing system operation and maintenance costs and carbon emissions, which solved the dynamic matching of electric–thermal–cooling loads and the coordination of multiple energy sources.

2. Site Selection of Integrated Energy System in Agricultural Park

Yanyuan County, Liangshan Prefecture, is in the western part of Liangshan, on the southeastern edge of the Qinghai–Tibet Plateau, along the western bank of the lower reaches of the Yalong River. It lies between 100°42′–102°03′ E and 27°06′–28°16′ N, with most areas situated at an elevation of 2300–2800 m. This unique geographical location endows Yanyuan with abundant wind and solar energy resources, providing the county with a distinctive resource endowment for the development of clean energy [24].

2.1. Wind Resources in Yanyuan County, Liangshan Prefecture

In Yanyuan County, Liangshan Prefecture, the areas with concentrated wind resources experience an annual average wind speed of 6–8 m/s. To date, the total installed capacity of wind power in Yanyuan County has exceeded 1.089 million kW, making it the largest high-altitude wind power base within a single county in China [25].
The Baiwu Wind Power Project in Yanyuan County is located on Zhala Mountain northwest of Baiwu Town. The project has a total installed capacity of 120 MW, consisting of 40 wind turbines each rated at 3 MW. The average annual electricity generation is approximately 231 million kWh, with an average annual utilization of 1929 h [26].

2.2. Photovoltaic Resources in Yanyuan County, Liangshan Prefecture

Yanyuan County represents one of the regions with the highest solar radiation levels in Sichuan Province. The annual average total solar radiation ranges from 4000 to 6500 MJ/m2, with annual sunshine duration of approximately 2200–2850 h, which is three to five times higher than that of the Chengdu Plain [27].
The Yanyuan Baiwu Photovoltaic Project is situated between 27°42′14″–27°47′16″ N and 101°19′14″–101°22′00″ E. The project has a total installed capacity of 160 MW with 303,800 photovoltaic panels. The average annual equivalent utilization is about 1453 h, providing 267.306 million kWh of clean electricity to the grid annually while saving 82,300 tons of standard coal and reducing carbon dioxide emissions by approximately 250,000 tons [27].

2.3. Biomass Resources in Yanyuan County, Liangshan Prefecture

Yanyuan County is endowed with abundant biomass resources, particularly corn straw and residual fruit tree branches. In 2021, the county’s theoretical total straw resource was estimated at 1.5943 × 10⁵ tons, of which, approximately 1.4129 × 10⁵ tons were practically available. Notably, apple orchards alone contributed nearly 100,000 tons of discarded tree stumps on an annual basis [28].
During the “13th Five-Year Plan” period, the county planned and constructed only 20 MW of biomass power generation capacity [29], indicating that the level of local biomass utilization for power production remains limited. The energy supply potential of straw and livestock manure has yet to be fully exploited.

2.4. Liangshan Prefecture Yanyuan County Agricultural Park

Yanyuan County is the largest apple production base in China’s plateau regions and the largest apple production base in southwest China [30]. In 2023, the Apple Modern Agricultural Park in Yanyuan County was successfully recognized as a provincial five-star modern agricultural park. In 2024, this park was upgraded to a national modern agricultural park, and four additional modern agricultural parks are expected to be established [31].
Currently, the Overall Land and Space Planning of the Baiwu Mountain Ecological Agriculture and Animal Husbandry Development Area (2021–2035) in Yanyuan County is preparing to establish a national core area for modern agricultural industries in Baiwu Town [32].

2.5. Multi-Energy Complementary Integrated Energy System Application Scenarios

Based on the investigation and analysis of wind farms, photovoltaic power stations, biomass resources, and agricultural parks in Yanyuan County, Liangshan Prefecture, this study focuses on Changma Village, Baiwu Town, which has a low-carbon agricultural industrial park (Figure 1).
Using the curtailed power from the 120 MW Baiwu wind power project and the 160 MW Baiwu photovoltaic plant, and through gasification and biogas-based combined heat and power, the system integrates local biomass resources such as crop straw, orchard residues, and livestock manure to build a wind–solar–biogas complementary integrated energy system for the agricultural park.

3. Energy Management Strategy

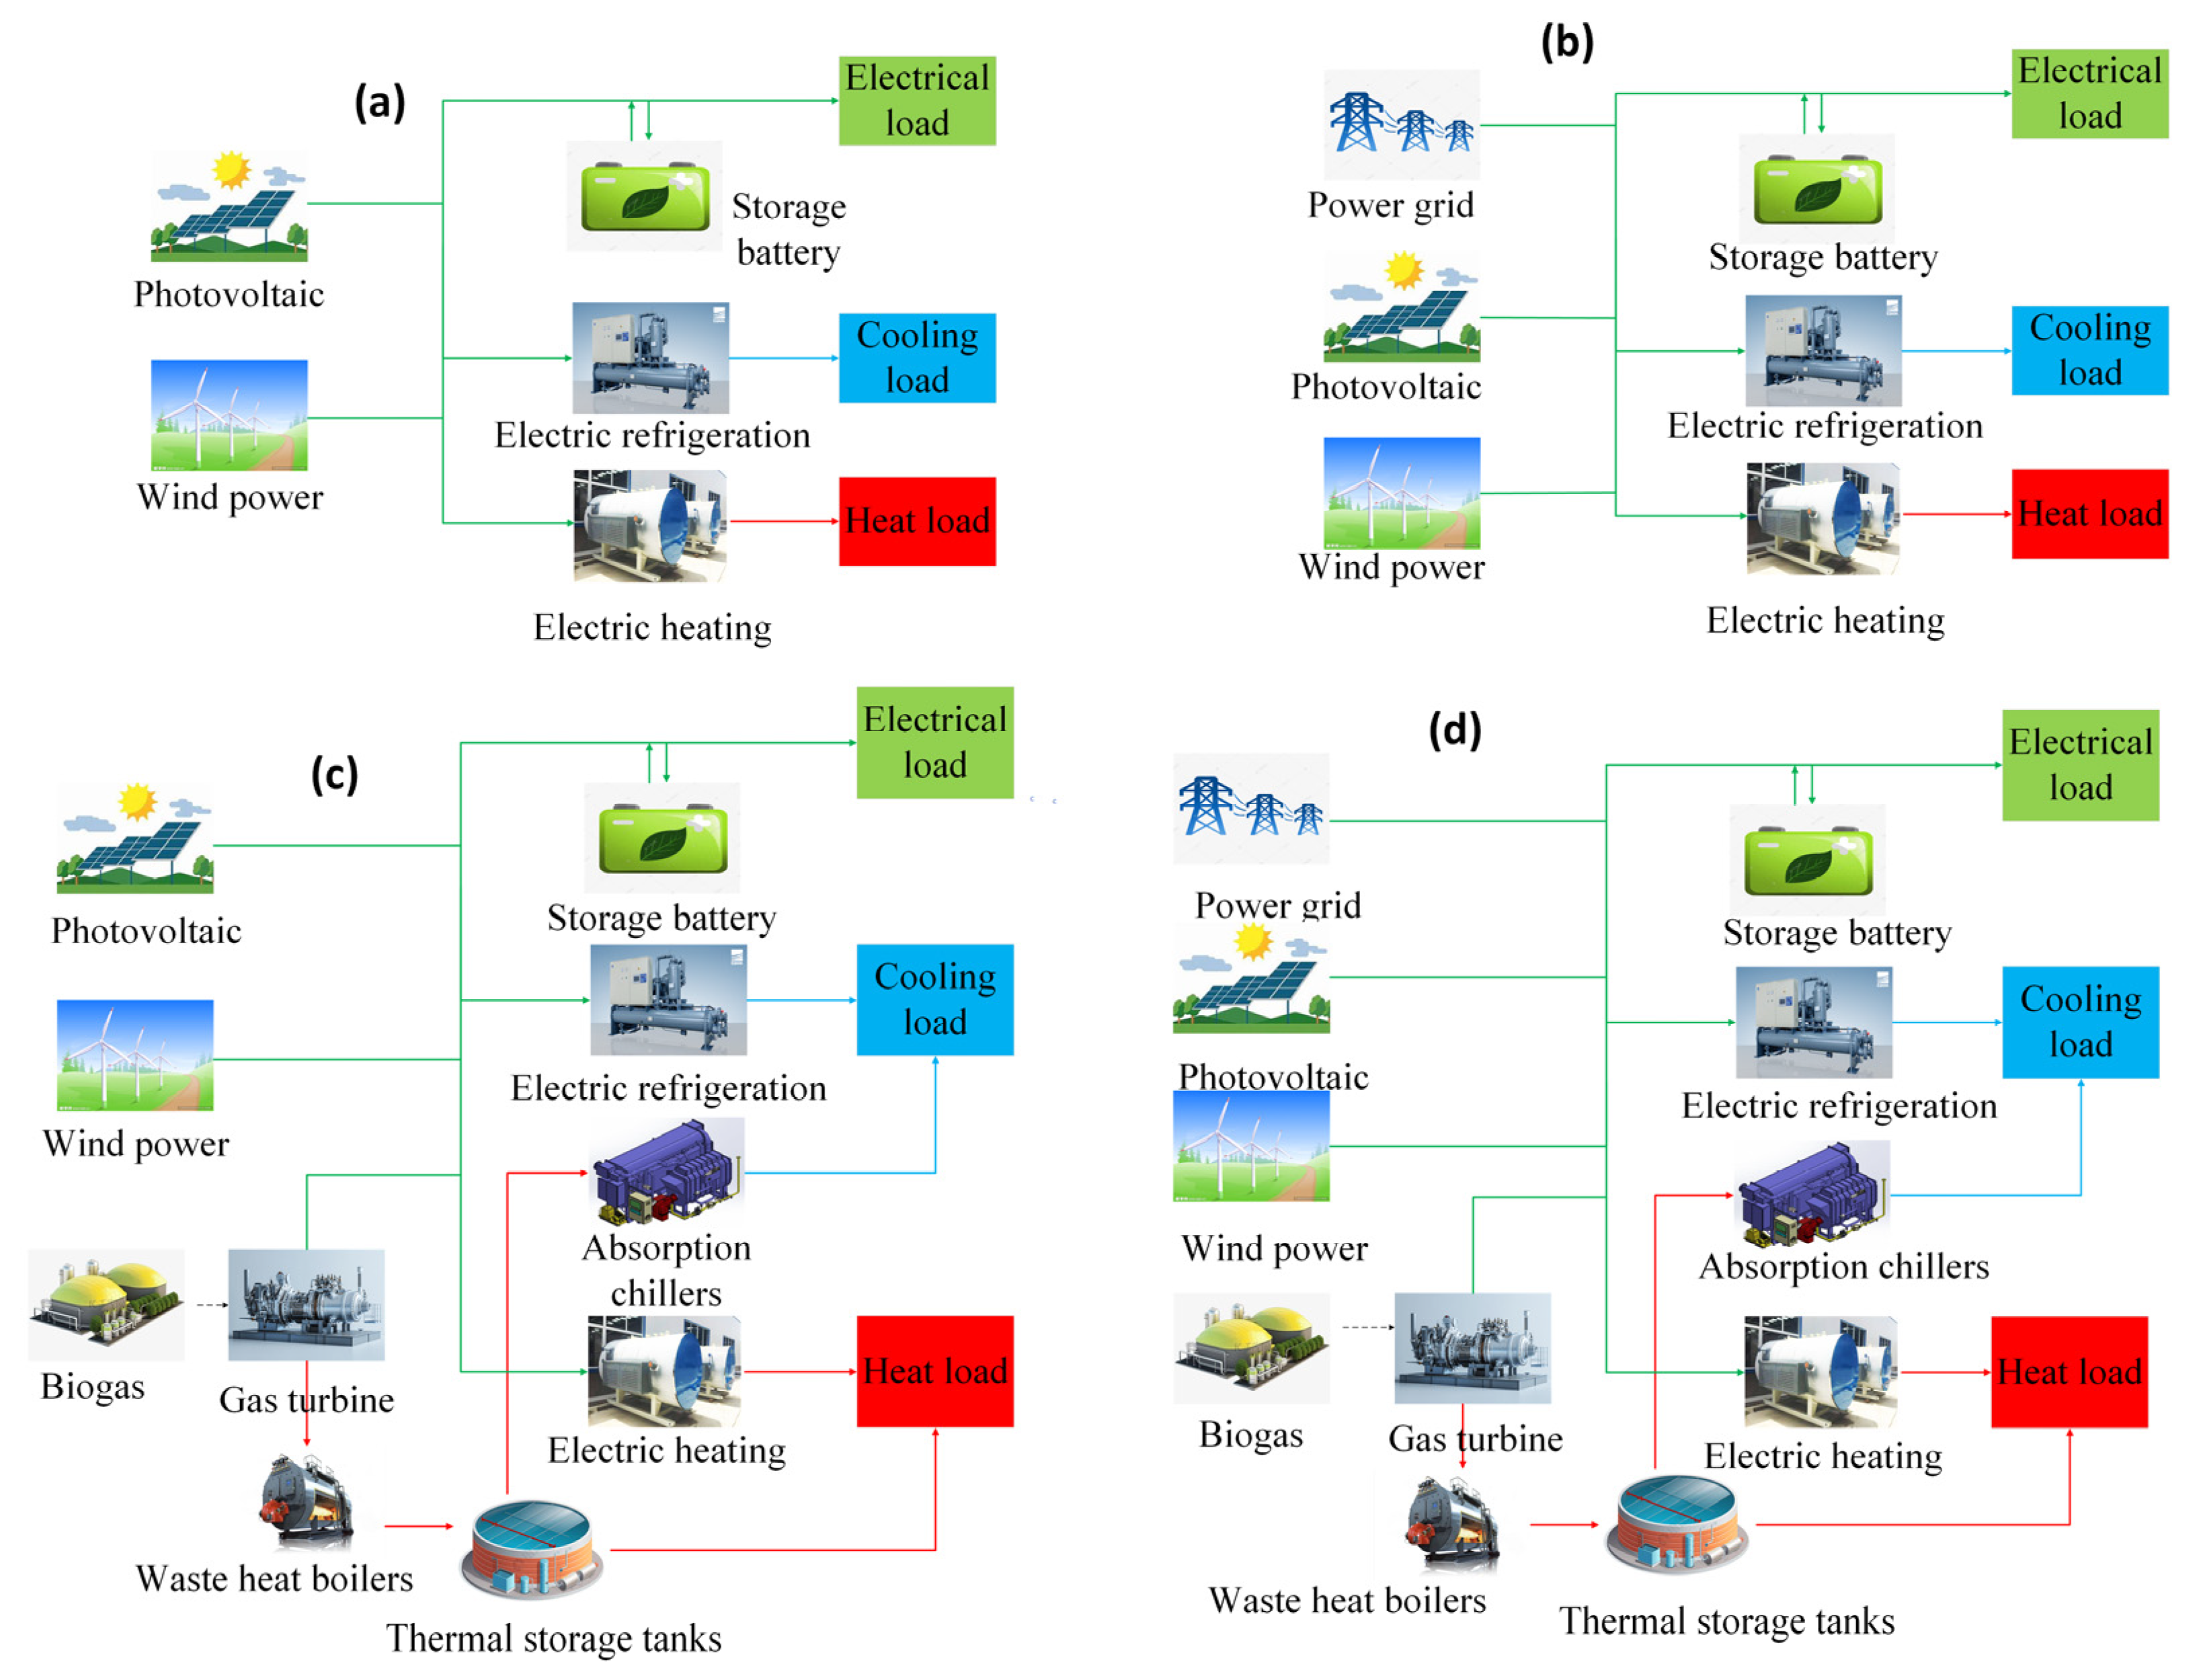
The integrated energy system designed in this study consists of six components: wind power, photovoltaic power, biogas combined heat and power (CHP) units, the power grid, electric cooling devices, electric heating devices, and energy storage systems. This system not only supplies electricity, heating, and cooling to the low-carbon agricultural park, but also addresses the issues of limited energy utilization patterns and low energy efficiency in rural areas. Based on the coordinated output of multiple energy sources and the demand for electricity, heating, and cooling, four typical operation modes are designed: the Wind–PV Dominated Mode, the Wind–PV–Grid Coordinated Mode, the Wind–PV–Biogas Coordinated Mode, and the Wind–PV–Biogas–Grid Coordinated Mode, as illustrated in Figure 2.

4. Modeling of Integrated Energy System

4.1. Wind Power Generation

In this study, the output of the wind turbine is represented using a piece-wise function, expressed mathematically as follows [33]:
P w i n d , t = 0 , ν < ν i n , ν > ν o u t p W i n d n o m ν 3 ν i n 3 ν n o m 3 ν o u t 3 , ν i n ν < ν n o m p W i n d n o m , ν n o m ν < ν o u t
where P w i n d , t denotes the output power of the wind turbine in period t (kW), and p W i n d n o m represents its rated power (kW). ν is the actual wind speed in period t (m/s), while ν i n , ν o u t , and ν n o m correspond to the cut-in, cut-out, and rated wind speeds, respectively (m/s).

4.2. Photovoltaic Power Generation

Photovoltaic (PV) systems convert solar radiation into electrical energy, with their output power depending on factors such as solar irradiance, the area of the PV modules, and the energy conversion efficiency. This relationship can be mathematically expressed as follows [34]:
P P V , t = G   ×   S P V   ×   η P V
where P P V , t is the photovoltaic output power in period t (kW), G is the solar irradiance (kW/m2), S P V is the area of the photovoltaic panels (m2), and η P V is the energy conversion efficiency of the photovoltaic panels.
The energy conversion efficiency of the photovoltaic (PV) system depends not only on solar irradiance, ambient temperature, and atmospheric conditions, but also follows the calculation formula [35]:
η P V = k 1 × G G 0 k 2 k 3 × G G 0 × 1 k 4 × T T 0 + k 5 × A M A M 0
where G is the solar irradiance (kW/m2) and G 0 is the standard irradiance (1 kW/m2); T is the ambient temperature (°C) and T 0 is the standard temperature (25 °C); AM is the atmospheric mass factor, with A M 0 = 1.5 under standard conditions; k 1 k 5 are empirical coefficients.

4.3. Biogas Cogeneration

The operating characteristics and mathematical models of each energy device in the biogas thermoelectric system are described as follows.

4.3.1. Biogas Gas Turbine

The gas turbine utilizes biogas as the input fuel to generate both electricity and heat. Its operation can be modeled as [36]:
P b i o , t = Q b i o , t × η b i o E = V i n , t × L H V × η b i o E
P b i o , h = Q b i o , t × η b i o Q
V i n , t × L H V = Q b i o , t
where P b i o , t is the electrical power output of the gas turbine at time t (kW), P b i o , h is the thermal output (kJ), Q b i o , t is the heat generated by biogas consumption (kJ), and V i n , t is the volume of input biogas (m3). LHV denotes the lower heating value of biogas (kJ/m3), and η b i o E , η b i o l o s s , and η b i o Q represent the power generation efficiency, heat loss rate, and heat generation efficiency of the gas turbine, respectively. These efficiencies are functions of the partial load ratio during operation.
The electrical and thermal efficiencies are expressed as [37]:
η b i o E = 0.1841 + 0.1736 P L R b i o + 0.0102 P L R b i o 2 + 0.0122 P L R b i o 3
η b i o Q = 1 η b i o E η b i o l o s s
The effective partial load ratio of the gas turbine is defined as:
P L R b i o = P b i o , t P b i o , i n
where P b i o , i n is the rated power of the gas turbine (kW).

4.3.2. Waste Heat Recovery Boiler

The heat load provided by the biogas cogeneration system is calculated as:
Q b i o , h = P b i o , t   ×   η h r   ×   η h x
where Q b i o , h is the heat supplied by the biogas cogeneration system (kW), η h r denotes the heat recovery efficiency of the waste heat boiler, and η h x represents the efficiency of the heat exchanger.

4.3.3. Biogas Digester

The biogas digester serves as methane storage equipment, and its storage capacity must not fall below the specified minimum value. The digester has a total volume of 100 m3, with a biogas production rate of 5 m3/h. The dynamic volume of biogas is described by:
V b i o g a s , t = V b i o g a s , t 1 + V i n , t V o u t , t
where V b i o g a s , t is the biogas volume at time t (m3), V i n , t is the biogas inflow (m3), and V o u t , t is the biogas outflow (m3).

4.4. Electric Heating and Electric Refrigeration Equipment

This device converts electrical energy into heat and coordinates with methane-based heating to satisfy thermal load requirements. The heat output is expressed as:
Q E B , t = η E B × P E B , t
where P E B , t is the electrical power input of the electric heating equipment during period t (kW), Q E B , t is the corresponding heat output (kW), and η E B denotes the operating efficiency of the electric heating equipment.
This device converts electrical energy into cooling to meet the cold load demand. Its operation is described as:
C E C , t = P E C , t × C O P e c
where P E C , t and C E C , t are the electric power input and cold power output of the electric refrigeration equipment during period t (kW), respectively, and C O P e c is the coefficient of performance of the equipment.

4.5. Absorption Chiller

In this study, the absorption chiller assists the electric refrigeration equipment in meeting the cooling load. Its operation is described by the following mathematical model:
C a b s , t = Q a b s , t × C O P a b s
where C a b s , t and Q a b s , t are the cooling power output and thermal power input of the absorption chiller during period t (kW), respectively, and C O P a b s denotes the energy efficiency coefficient of the absorption chiller.

4.6. Energy Storage Equipment

The dynamic energy balance of the heat storage device and battery is described as follows [38]:
W H t = W H t 1 ( 1 μ H l o s s ) + Q c h t ρ T S T c h Δ t Q d i s t ρ T S T d i s Δ t S B a t t = S B a t t 1 ( 1 μ B l o s s ) + P c h t ρ B a t c h Δ t P d i s t ρ B a t d i s Δ t
where W H t and S B a t t are the energy stored in the heat storage device and battery at time t (kWh), respectively; W H t 1 and S B a t t 1 are the stored energy at the previous time step (kWh); μ H l o s s and μ B l o s s are the heat dissipation coefficient and self-discharge rate of the heat storage device and battery, respectively; Q c h t and ρ T S T c h are the charging power of the heat storage device and battery (kW); Q d i s t and P d i s t are the discharging power (kW); ρ T S T c h , ρ T S T d i s , ρ B a t c h , and ρ B a t d i s denote the charging and discharging efficiencies of the heat storage device and battery, respectively.

5. Multi-Objective Optimization Operation Model

This study develops an integrated energy system (IES) optimization model that simultaneously considers operation and maintenance (O&M) costs and carbon emissions. The O&M costs include the operational expenditures of individual system components as well as the costs associated with power exchange with the grid. Carbon emissions are primarily attributed to photovoltaic power, wind power, biogas utilization and electricity purchased from the external grid.

5.1. Objective Function

5.1.1. Operating Cost Objective

The objective function is designed to minimize the system’s operation and maintenance (O&M) costs. These costs consist of the energy supply and maintenance costs of each equipment unit, the conversion and maintenance costs of energy conversion devices, the start-up and shutdown costs of energy storage equipment, and the costs associated with power exchange between the integrated energy system and the grid. The objective function is expressed as:
m i n   F t o t a l = F 1 + F 2 + F 3 + F 4
(1)
Equipment energy supply and maintenance cost
F 1 = t = 1 T ( P w i n d , t × C W T + P p v , t × C P V + P b i o , t × C B C H P )
where P w i n d , t , P p v , t , P b i o , t denote the power outputs of wind turbines, photovoltaic modules, and biogas turbines at time t (kW), and C W T ,   C P V , C B C H P represent their unit O&M costs (Yuan/kW).
(2)
Equipment conversion and maintenance cost
F 2 = t = 1 T ( P h r , t × C B C H P + P E C , t × C E C + P E B , t × C E B + P a b c , t × C A B C )
where P h r , t , P E C , t , P E B , t , P a b c , t represent the output power of the waste heat boiler, electric chiller, electric boiler, and absorption chiller at time t (kW), while C B C H P , C E C , C E B , C A B C denote their corresponding unit maintenance costs (Yuan/kW).
(3)
Start-up and shutdown cost
F 3 = t = 1 T ( P b a t , t × C B S + Q t e s , t × C T S T )
where P b a t , t is the charging/discharging power of the battery at time t (kW), Q t e s , t is the charging/discharging thermal power of the thermal energy storage unit (kW), and C B S and C T S T denote the unit degradation costs of the battery and thermal storage system, respectively (Yuan/kW).
(4)
Cost of power usage with the grid
F 4 = t = 1 T P G r i d i n , t × C g r i d
where P G r i d i n , t denotes the purchased electricity from the grid at time t (kW) and C G r i d i n is the corresponding electricity tariff (Yuan/kW).

5.1.2. Environmental Cost Objective

The second objective is to minimize the total carbon emissions of the integrated energy system. Carbon emissions are primarily generated from biogas combustion, electricity purchased from the external grid, and renewable energy generation. The environmental cost function is formulated as:
m i n C c a r = t = 1 T   ( P G r i d i n , t × φ e l e + M b i o t × φ b i o + P w i n d , t × φ w i n d + P p v , t × φ p v )
where
C c a r —Total carbon emission of integrated energy system in rural park (kg);
φ e l e —Carbon emission coefficient of electric energy (kg/kW);
M b i o t —Methane consumption of the system in time period t (m3);
φ b i o —Methane carbon emission coefficient (kg/m3).
φ p v , φ w i n d —Carbon emission factor of photovoltaic and wind power (kg/kW).

5.2. Constraint Conditions

5.2.1. Energy Conservation Constraints

  • Electric Energy Balance
The electrical energy balance of the system is formulated as:
P w i n d , t + P P V , t + P b i o , t + P G r i d i n , t + P d i s , t = P c h , t + P E B , t + P E C , t + P E l o a d
where P w i n d , t is the actual power of wind turbines at time t (kW); P P V , t is the actual photovoltaic power at time t (kW); P b i o , t is the electrical output of the biogas turbine at time t (kW); P G r i d i n , t is the power exchanged with the external grid at time t (kW); P d i s , t and P c h , t represent the discharging and charging power of the battery (kW), respectively; P E B , t is the power consumption of electric boilers (kW); P E C , t is the power consumption of electric chillers (kW); and P E l o a d is the electrical load demand at time t (kW).
2.
Thermal Energy Balance
The thermal energy balance of the system is given as:
Q d i s , t + Q E B , t = Q l o a d + Q c h , t + Q a b s , t
where Q E B , t is the thermal output of the electric heating equipment at time t (kW); Q d i s , t and Q c h , t denote the discharging and charging thermal power of the thermal storage unit (kW), respectively; P Q l o a d is the thermal load demand at time t (kW); and Q a b s , t represents the thermal power consumed by the absorption chiller at time t (kW).
3.
Cooling Energy Balance
The cooling energy balance of the system is expressed as:
C e c , t + C a b s , t = C l o a d
where C e c , t and C a b s , t denote the cooling power output of the electric refrigeration equipment and the absorption chiller at time t (kW) [39], and P C l o a d is the cooling load demand at time t (kW).

5.2.2. Non-Conservative Constraint Conditions

(1)
Wind and Photovoltaic Output Constraints
0 P w i n d , t p W i n d n o m 0 P P V , t p P V m a x
where P w i n d , t is the wind turbine output power at time t (kW) and p W i n d n o m is its rated capacity (kW); P P V , t is the photovoltaic output power at time t (kW); and p P V m a x is the maximum PV capacity (kW).
(2)
Biogas Cogeneration Output Constraints
0 P b i o , t P b i o , e m a x 0 Q b i o , h Q b i o , h m a x
where P b i o , t is the electric power of the biogas gas turbine at time t (kW) and P b i o , e m a x is its rated electric power (kW); Q b i o , h is the thermal power at time t (kW); and Q b i o , h m a x is the rated thermal power (kW).
(3)
Electric Heating Equipment Constraint
0 P E B , t P E B , m a x
where P E B , t is the heating equipment power consumption at time t (kW) and P E B , m a x is the maximum heating power (kW).
(4)
Electric Refrigeration Equipment Constraint
0 C E C , t C E C m a x
where C E C , t is the refrigeration output of the electric chiller at time t (kW) and C E C m a x is its maximum cooling capacity (kW).
(5)
Absorption Chiller Constraint
0 C a b s , t C a b s m a x
where C a b s , t is the cooling output of the absorption chiller at time t (kW) and C a b s m a x is the maximum cooling capacity (kW).
(6)
Battery Operation Constraints
S B a t m i n S B a t t S B a t m a x 0 P c h t ρ B a t c h S n o m 0 < P d i s t ρ B a t d i s S n o m P d i s t P c h t = 0
where S n o m is the rated capacity of the battery pack (kWh), and S B a t m i n and S B a t m a x are the lower and upper capacity limits (kWh). Charging and discharging cannot occur simultaneously.
(7)
Thermal Energy Storage Constraints
W H m i n W H t W H m a x 0 Q c h t Q c h m a x 0 Q d i s t Q d i s m a x W H m i n W H 0 ( Q c h t ρ T S T c h Q d i s t ρ T S T d i s ) W H m a x W H 0
where W H 0 is the initial heat storage capacity (kWh), W H m i n and W H m a x are the lower and upper storage limits (kWh), Q c h m a x is the maximum charging power (kW), and Q d i s m a x is the maximum discharging power (kW).

6. Improved Multi-Objective Grey Wolf Optimizer

6.1. Basic Concept of Grey Wolf Optimizer (GWO)

The Grey Wolf Optimizer (GWO) is a population-based intelligent optimization algorithm inspired by the social hierarchy and cooperative hunting behavior of grey wolves [40]. It mimics the leadership hierarchy and strategies of tracking, encircling, and attacking prey. Due to its simplicity and efficiency, GWO has demonstrated strong performance in solving complex optimization problems and converging toward optimal solutions.
The population hierarchy of grey wolves is categorized into four levels:
  • α (Alpha) wolf: the leader responsible for decision-making and guidance, representing the best solution.
  • β (Beta) wolf: assists the α wolf in decision-making and management, representing the second-best solution.
  • δ (Delta) wolf: follows α and β wolves, supervises subordinate wolves, and represents the third-best solution.
  • ω (Omega) wolf: the lowest-ranking members that follow all higher levels, mainly responsible for exploration and position updating, representing the remaining candidate solutions.
The GWO optimization process consists of three major stages: encircling prey, hunting prey, and attacking prey, which can be mathematically described as follows [41,42].
(1)
Encircling Prey Stage
D = C × X p r e y t X t X t + 1 = X p r e y t A × D
where D denotes the distance between a grey wolf and the prey, X p r e y t is the prey’s position at iteration t, and X t is the position of the wolf. The coefficients A and C control the search scope and prey disturbance, respectively, and are defined as:
A = 2 a × r 1 a , C = 2 × r 2 , a = 2 × ( 1 t T )
where a is a convergence factor linearly decreasing from 2 to 0 with iteration t, and r1 and r2 ∈ [0, 1] are uniformly distributed random numbers.
(2)
Hunting Prey Stage
D α = C 1 × X α X D β = C 2 × X β X D δ = C 3 × X δ X
X 1 = X α A 1 × D α X 2 = X β A 2 × D β X 3 = X δ A 3 × D δ
X ( t + 1 ) = X 1 + X 2 + X 3 3
where X α , X β , and X δ denote the positions of the α, β, and δ wolves, respectively; A 1 , A 2 , and A 3 are coefficient vectors; and X 1 , X 2 , X 3 represent the adjusted positions of the ω wolf influenced by the three leading wolves.
(3)
Attacking Prey Stage
The value of parameter A determines the search strategy adopted by the wolves. When ∣A∣ ≤ 1, the wolves converge toward the prey, facilitating local exploitation around the best solution. Conversely, when ∣A∣ ≥ 1, the wolves diverge and explore the search space more broadly, which enhances global exploration and prevents premature convergence.

6.2. Improved Multi-Objective Grey Wolf Optimizer

To enhance the optimization performance of the integrated energy system scheduling, this study developed an improved multi-objective grey wolf optimizer (MOGWO) based on the standard grey wolf optimizer (GWO). Considering the limitations of the conventional GWO in handling multiple objectives, maintaining solution diversity, and achieving convergence stability, four improvement strategies were proposed.
(1)
Pareto dominance-based multi-objective extension
A Pareto dominance criterion is introduced to evaluate candidate solutions, enabling the algorithm to handle multiple conflicting objectives simultaneously. The non-dominated solution set is defined as [43]:
P = { x C y C , y x }
where C denotes the feasible solution set, and y x indicates that solution y is no worse than x in all objectives and strictly better in at least one objective.
(2)
Dynamic elite archiving mechanism
A dynamic external archive is constructed by merging the current population with the historical non-dominated solution set. To prevent excessive growth of the archive and ensure uniform distribution, a crowding-distance criterion is applied to remove densely distributed individuals, thereby maintaining solution diversity and promoting a well-distributed Pareto front [44].
(3)
Diversified leadership wolf selection strategy
Instead of selecting α, β, and δ wolves solely from the current population, three representative solutions are adaptively chosen from the non-dominated archive to enhance search direction diversity.
  • α (minimum-cost solution):
α = a r g   m i n x P   F 1 ( x )
  • β (minimum-emission solution):
β = a r g   m i n x P   F 2 ( x )
  • δ (compromise solution):
A compromise leader is determined by normalizing the two objectives and computing the Euclidean distance of each solution to the ideal point (0, 0). The normalization process is defined as:
C o s t = F 1 x i F 1 m i n F 1 m a x F 1 m i n ,   C a r b o n = F 2 ( x i ) F 2 m i n F 2 m a x F 2 m i n
The Euclidean distance of solution x i to the ideal point is calculated as:
d i = C o s t 2 + C a r b o n 2
The compromise leader δ is then defined as:
δ = a r g   m i n d i i
This selection strategy ensures that the population evolves under the guidance of solutions representing both extreme objectives and a balanced trade-off.
(4)
Exponential decay-based convergence factor
To balance global exploration and local exploitation, an exponentially decaying convergence factor is introduced as:
a = 2 2 × k k m a x 3
where k is the current iteration and k m a x is the maximum number of iterations. This mechanism allows the algorithm to maintain a strong global search ability in the early stage while gradually improving local exploitation accuracy in the later stage.
The improved MOGWO not only enhanced the convergence speed and solution quality but also ensured a well-distributed set of Pareto-optimal solutions. Figure 3 presents the framework of the improved grey wolf optimization algorithm.

6.3. Benchmark Test and Performance Companions

6.3.1. Benchmark Test and Verification

In the multi-objective optimization system, standard test functions are usually used to evaluate the performance of the algorithm. To verify the convergence and stability of the improved MOGWO, three typical ZDT benchmark functions with bias constraints, namely ZDT1, ZDT2 and ZDT3, were selected for testing in this work [45].
The mathematical models of the ZDT benchmark functions are as follows:
f 1 x = x 1
g x = 1 + 9 n 1 i = 2 n   x i
f 2 ( x ) = g ( x ) h ( f 1 , g )
Different definitions of h ( f 1 , g ) generate distinct Pareto front shapes:
ZDT1: h = 1 f 1 / g , producing a continuous convex Pareto front;
ZDT2: h = 1 ( f 1 / g ) 2 , producing a concave Pareto front;
ZDT3: h = 1 f 1 / g ( f 1 / g ) s i n ( 10 π f 1 ) , resulting in a discontinuous multi-segment front, which is used to evaluate the algorithm’s global search and diversity-preserving capabilities.
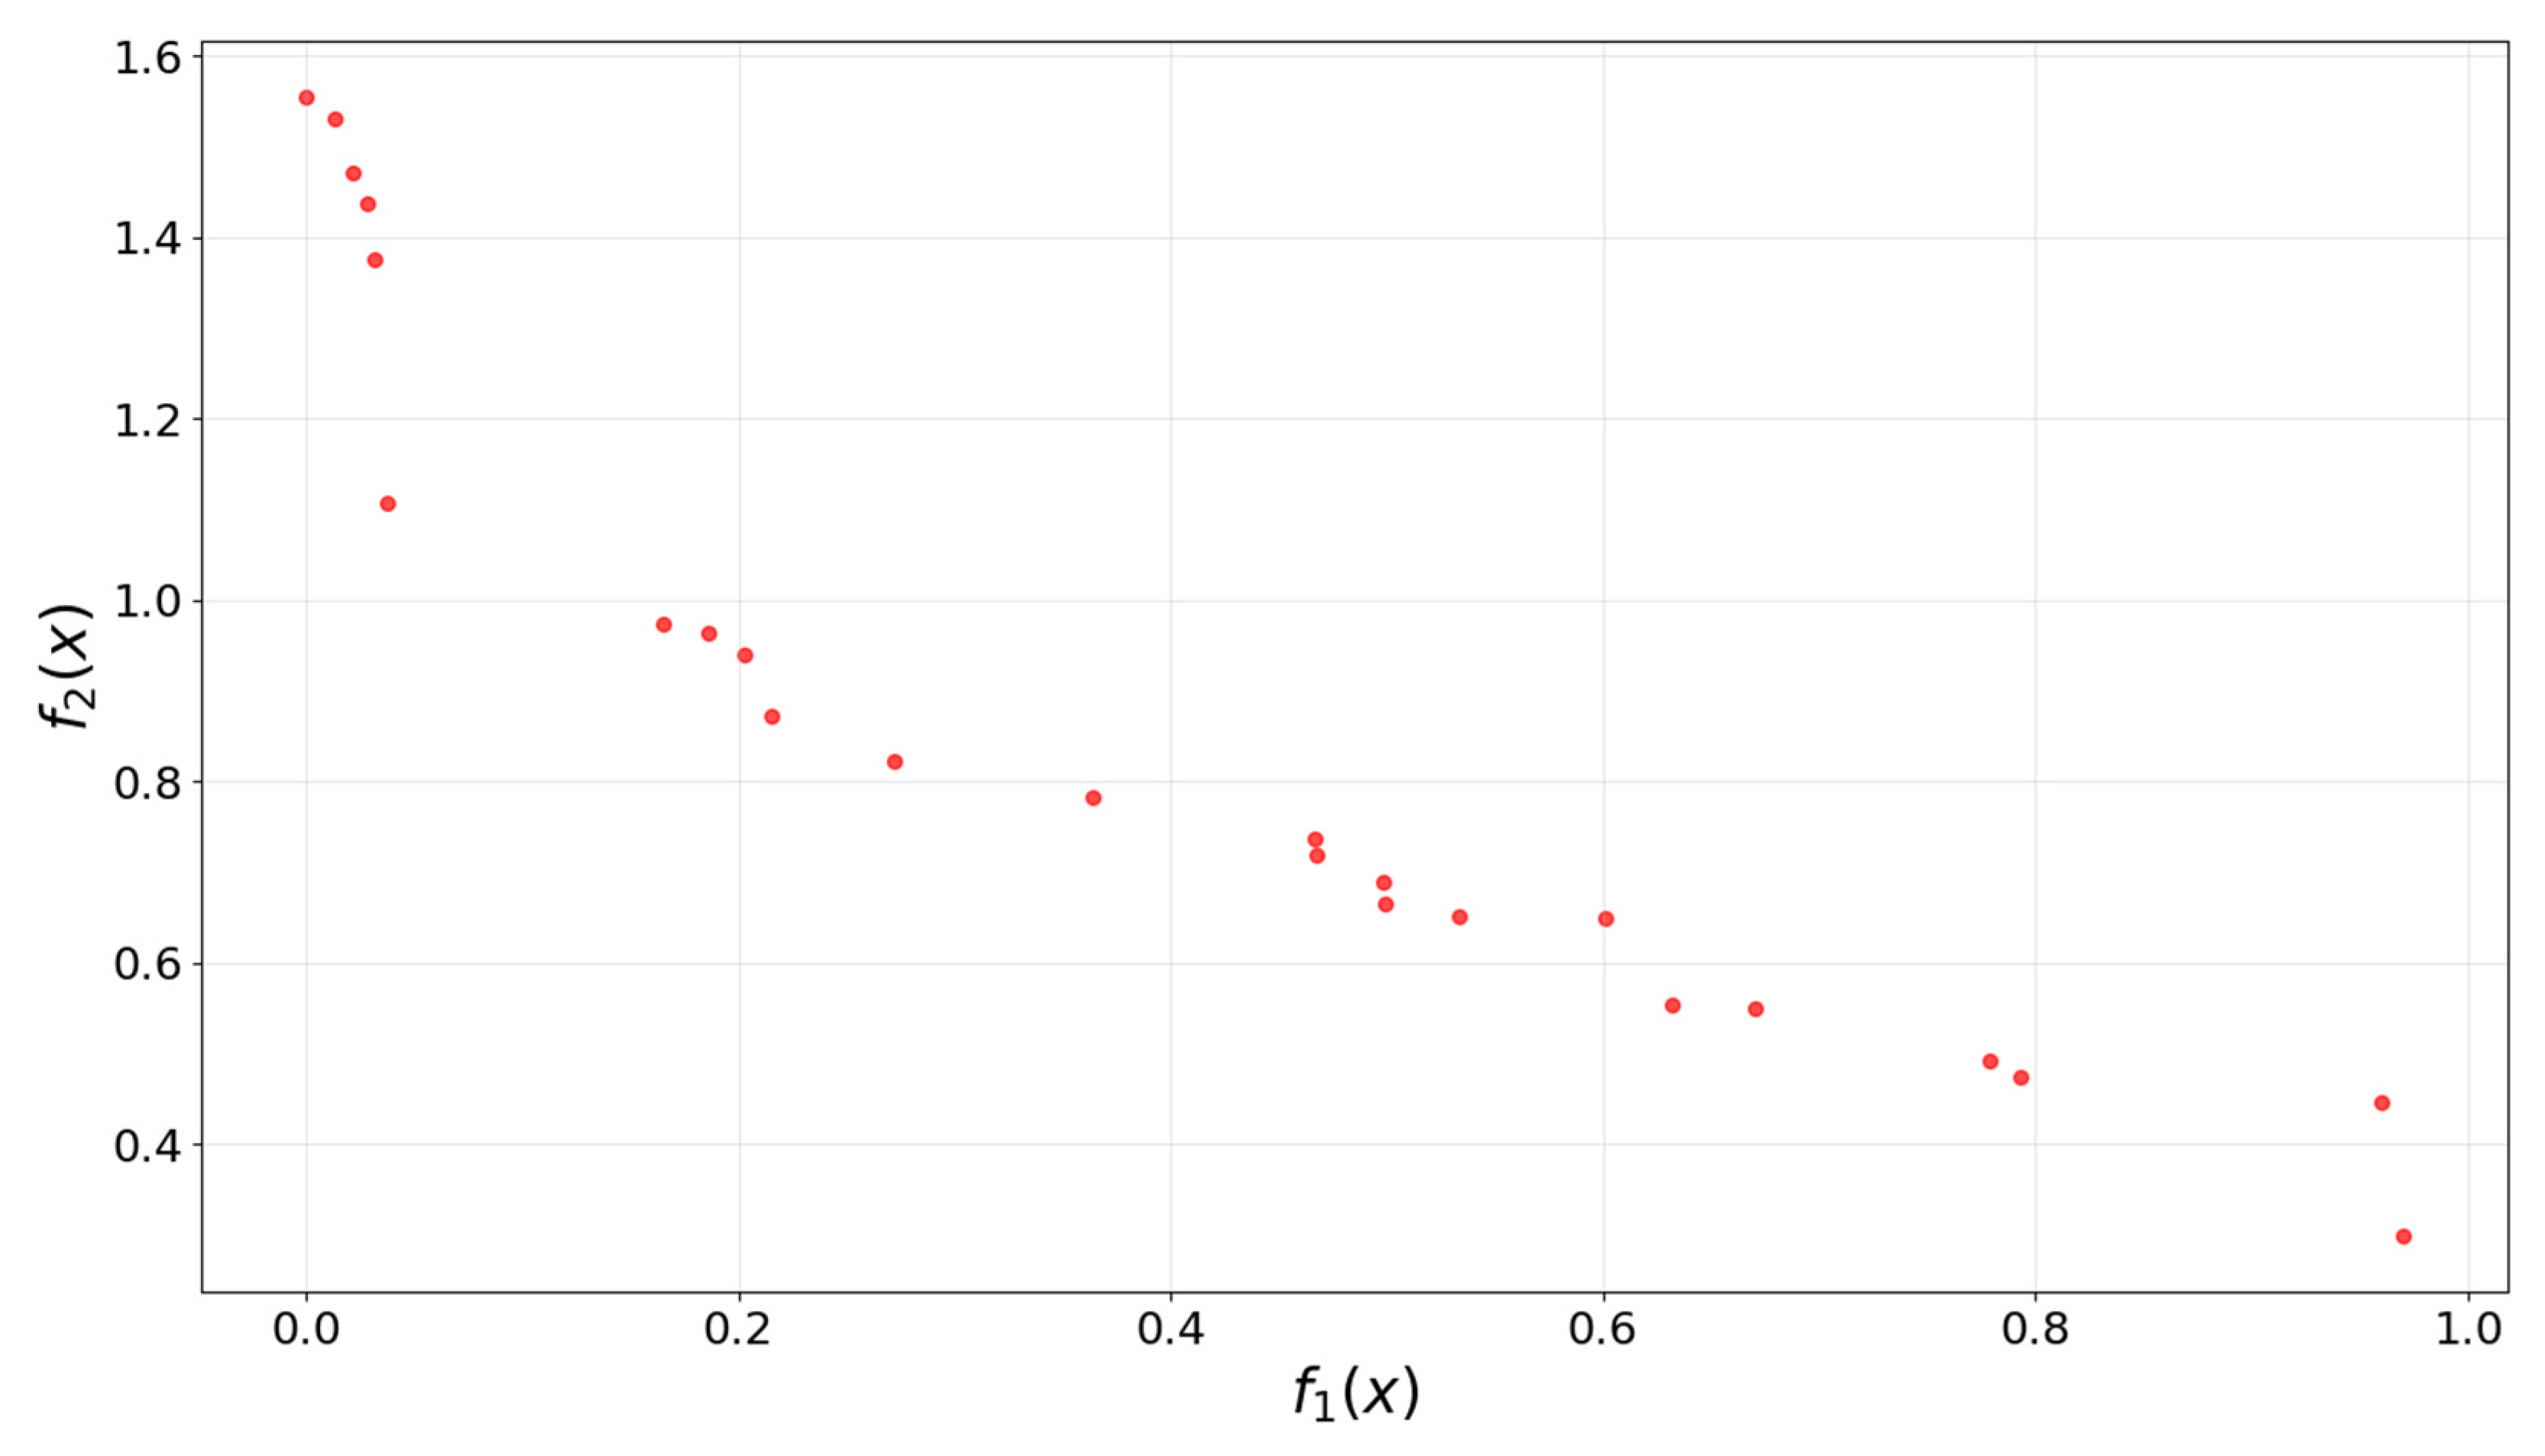
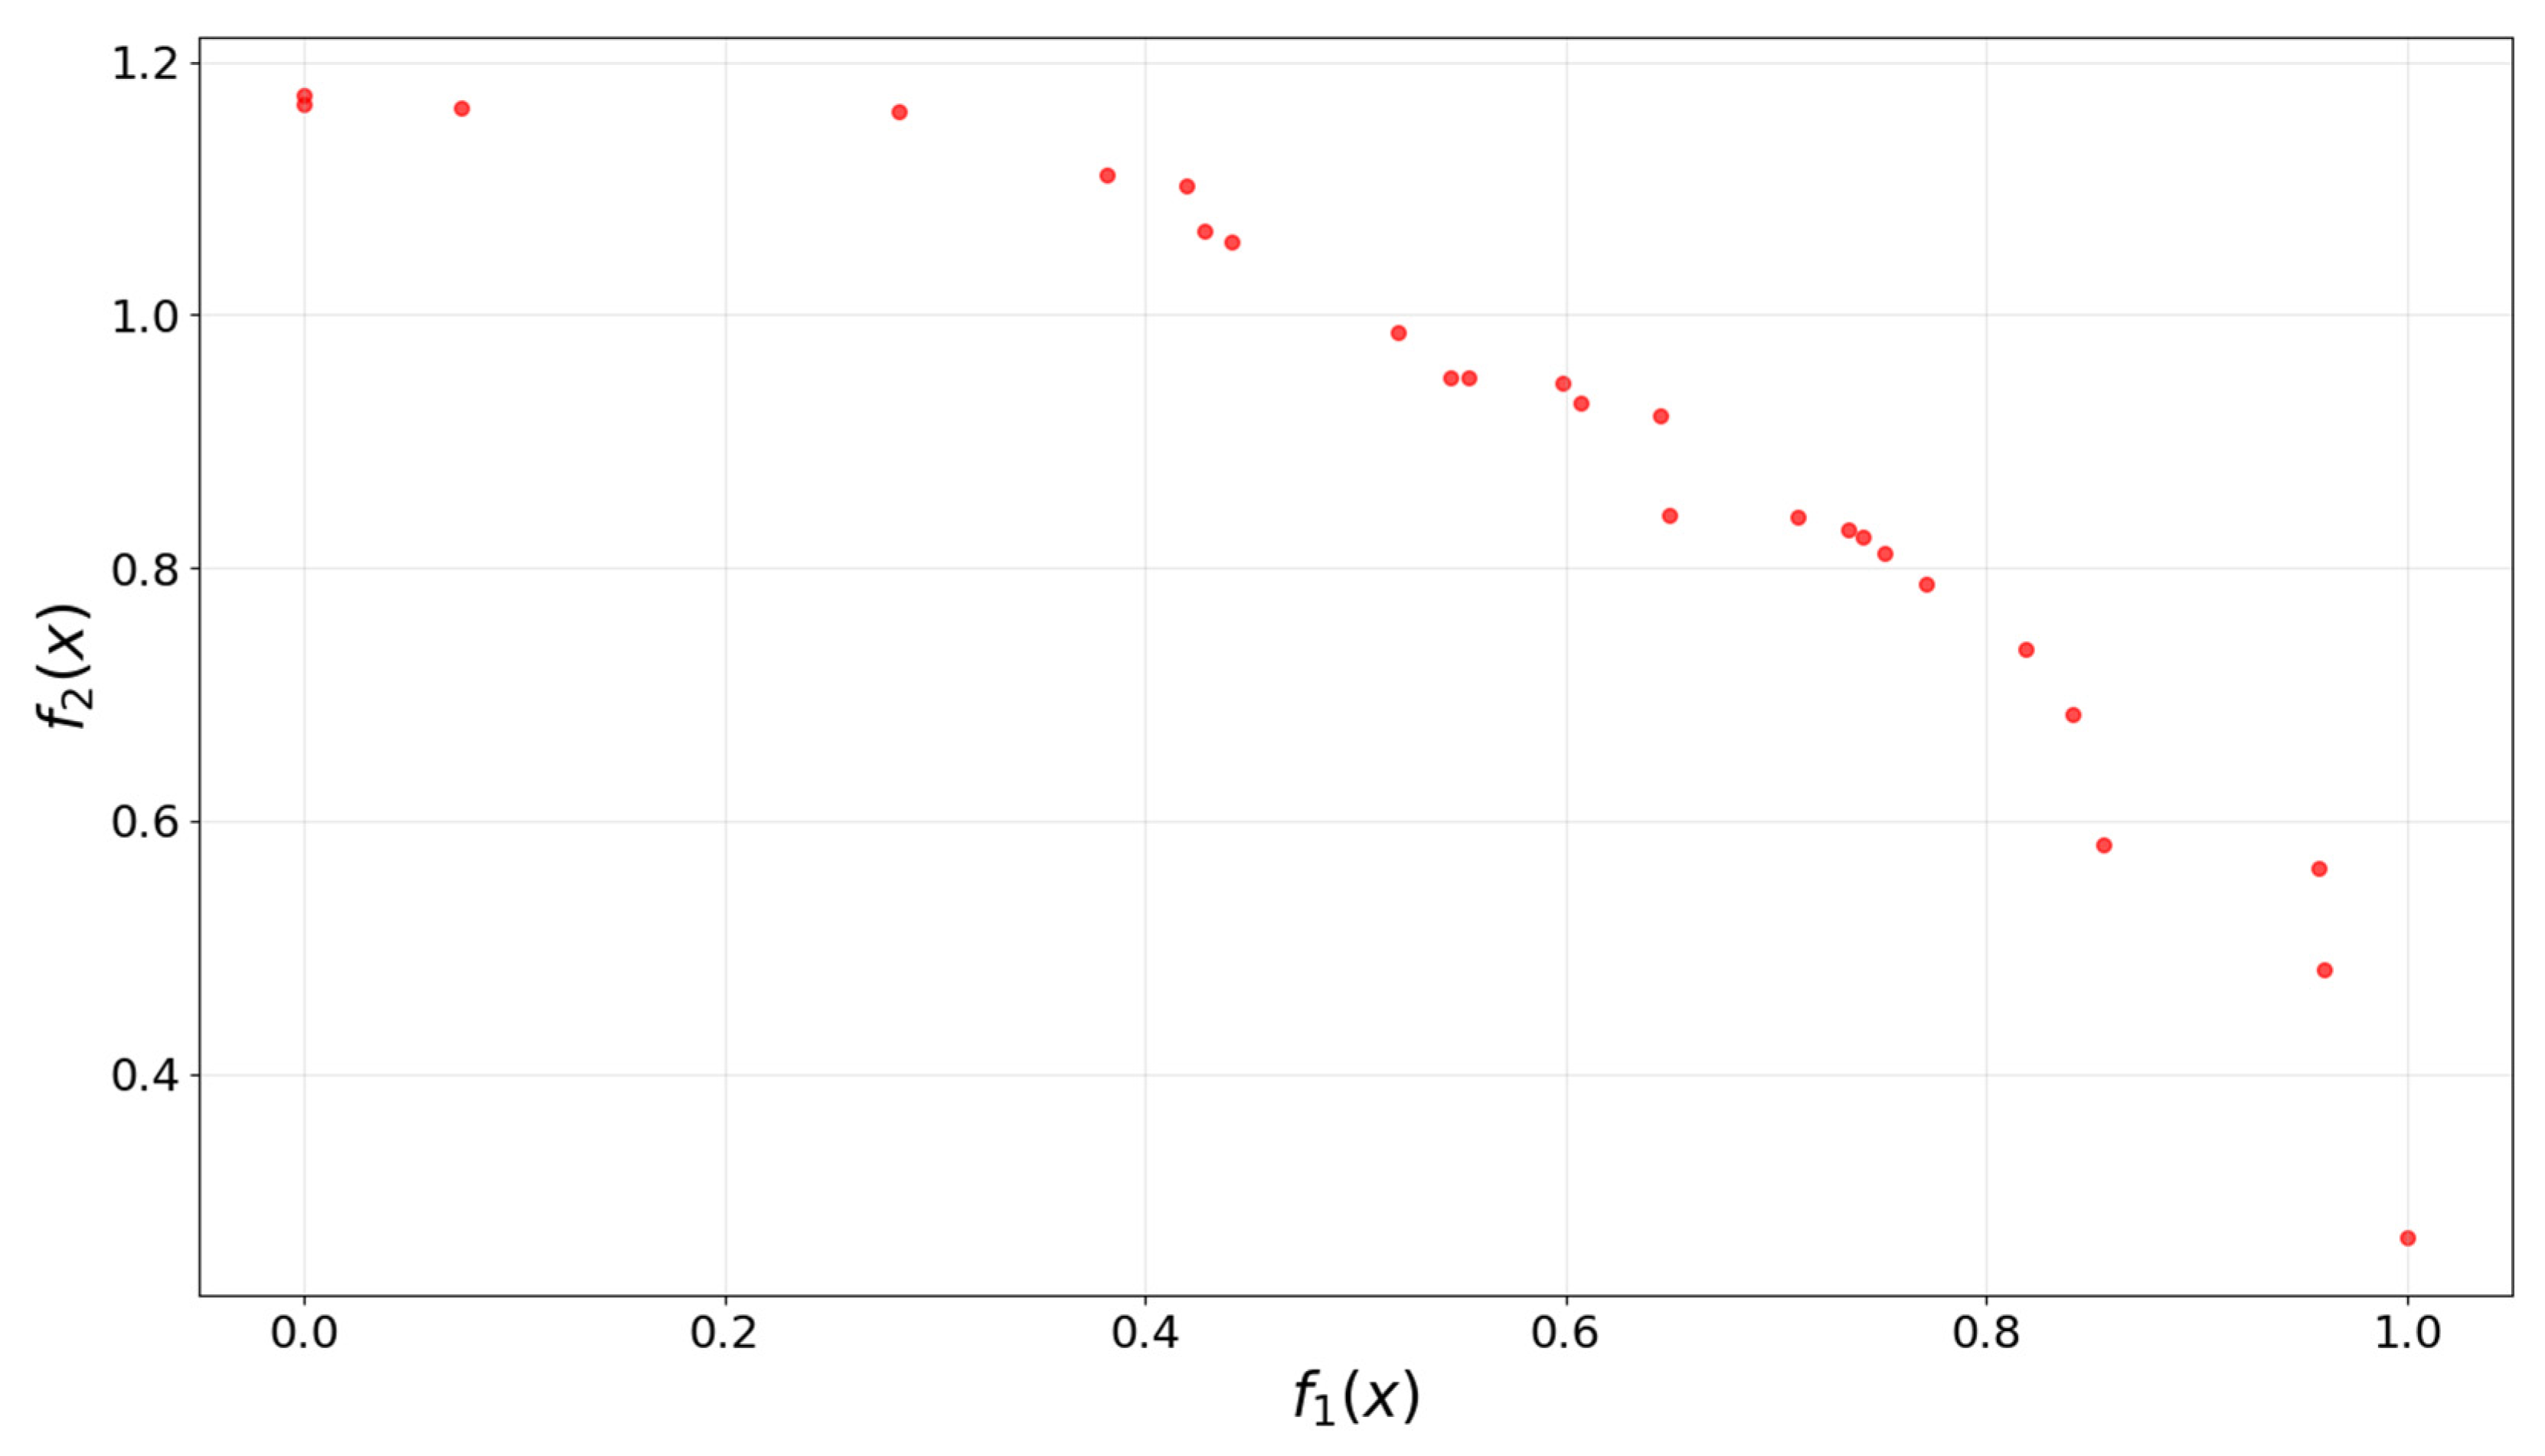
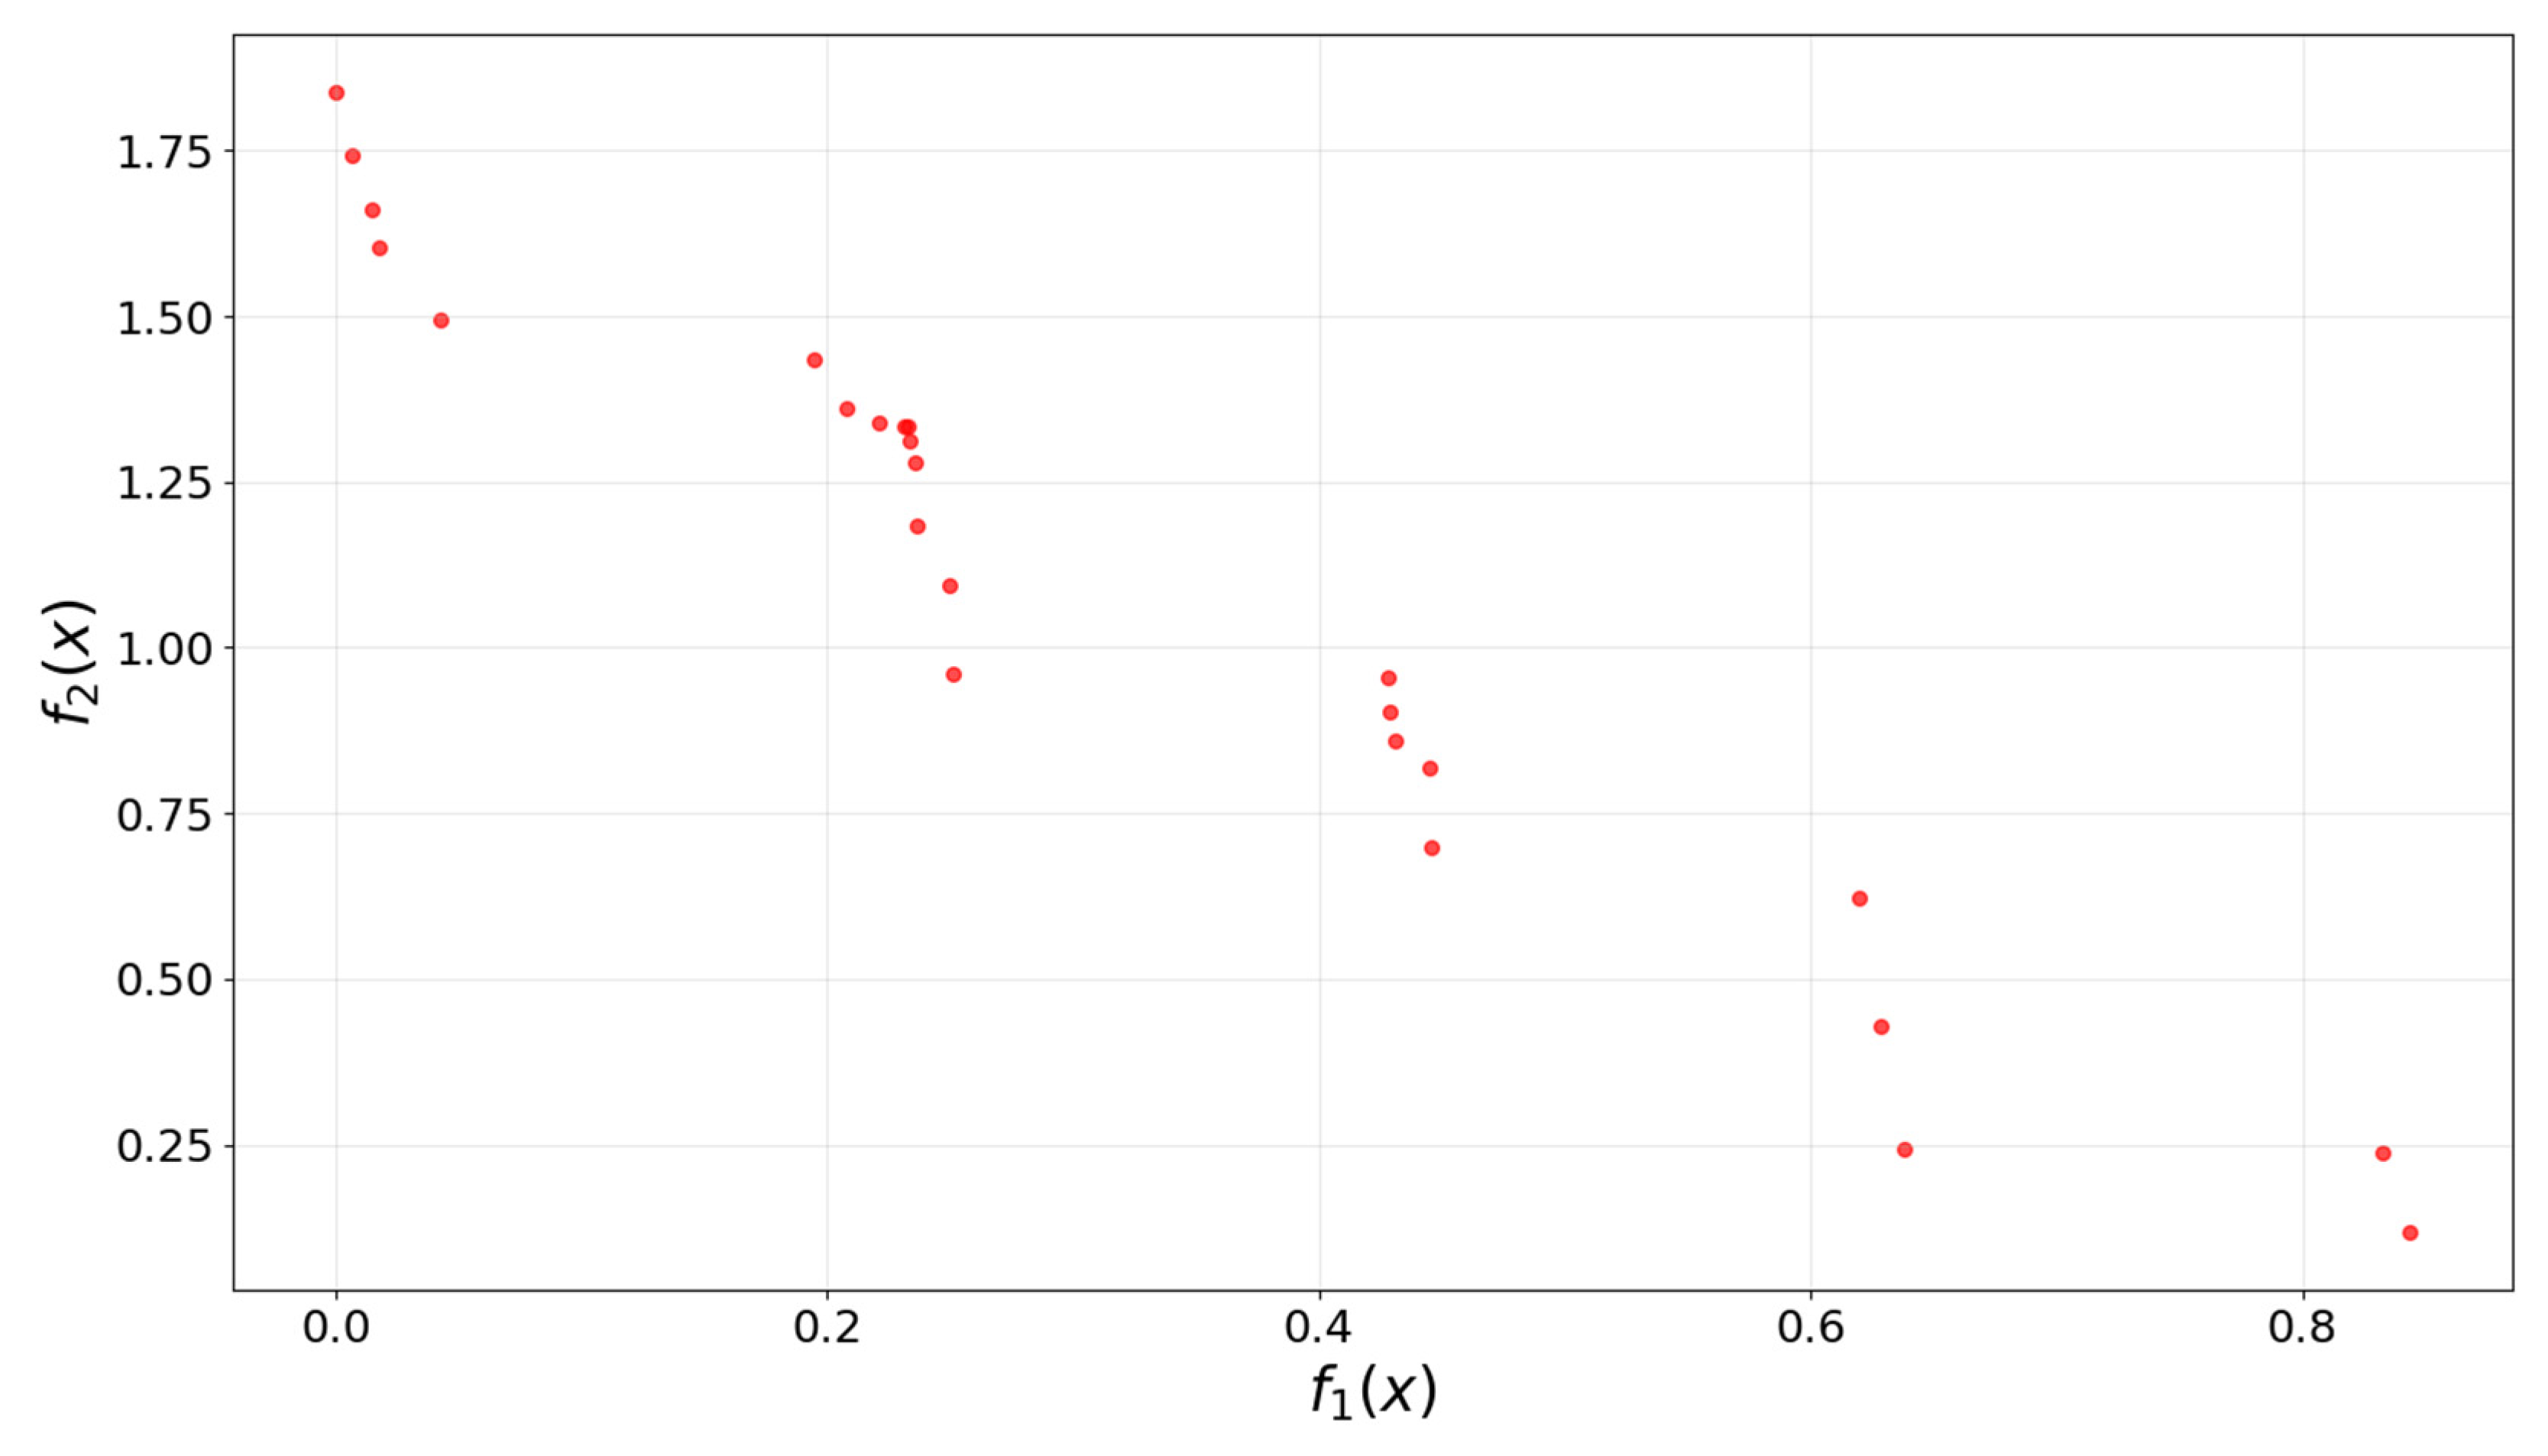
The improved MOGWO algorithm was executed on the above three benchmark functions. The Pareto fronts illustrated in Figure 4, Figure 5 and Figure 6 reproduce the convex (ZDT1), concave (ZDT2), and discontinuous (ZDT3) front shapes. Table 1 summarized the size of the Pareto solution sets, the ranges of the objective functions, and the characteristics of the corresponding front shapes for each test function. The results demonstrated that the improved algorithm maintains strong convergence reliability and stability across different landscape complexities.

6.3.2. Performance Companions and Analysis

Based on the technical verification of the above-mentioned MOGWO algorithm, a further comparison was made with the standard MOGWO [46]:
(1)
The initial value of standard MOGWO algorithm is fully initialized randomly from 0 to the maximum output power. The improved random initialization in this study is based on a random fluctuation of ±20% before optimization. This mechanism enhances the population diversity while maintaining solution feasibility.
(2)
The standard MOGWO selects three leader wolves (α, β, δ) using roulette wheel selection in the least-crowded regions. In the improved method, a multi-criteria leader selection strategy is proposed: α-wolf represents the non-dominated solution with the best cost performance, β-wolf represents the best carbon emission solution, and δ-wolf is determined using a normalized aggregation function combining α and β wolves, thus balancing both objectives and convergence diversity.
(3)
In the standard MOGWO algorithm, the alpha value is set as a linear convergence factor α = 2 − 2tT. In the improved method, a nonlinear dynamic weight coefficient α = 2 − 2(t/T)3 is adopted. This enables a broader exploration in the early iterations and a faster exploitation in later stages.
An ablation study was conducted based on the above three improvement points. Hypervolume (HV) and Spacing are two metrics used to evaluate the performance of algorithms. HV indicates the convergence and diversity of the solution set in the target space. The larger the value, the closer the solution set is to the ideal Pareto frontier. Spacing is used to evaluate the distribution uniformity of the solution set on the Pareto frontier. The smaller the value, the more uniform the distribution of the solution set is. As shown in Table 2, the results show that the improved MOGWO outperforms other research models in terms of HV, spacing, and the number of solution sets.
It should also be noted that the improved MOGWO proposed in this paper enhances the overall performance by incorporating Pareto-based multi-objective optimization, a dynamic elite archiving mechanism, an exponentially decaying convergence factor, and a dynamic leader selection strategy. Consequently, the computational complexity of the improved MOGWO is somewhat higher than that of the standard GWO, and its runtime is relatively longer correspondingly. For a typical optimization case with a decision dimension of 198, a population size of 50 and a maximum iteration of 100, the improved MOGWO exhibits a computational complexity of 2.88 × 10⁶ and an average runtime of 7.5465 ± 0.2798 s. Overall, the complexity and runtime of the proposed algorithm remain within the same orders of magnitude as the standard GWO (1.92 × 10⁶, 4.3855 ± 0.1197 s). The entire optimization process can converge quickly and yield the optimal results for actual engineering applications.

7. Operation Optimization Process and Simulation Results

7.1. Basic Data and Parameters

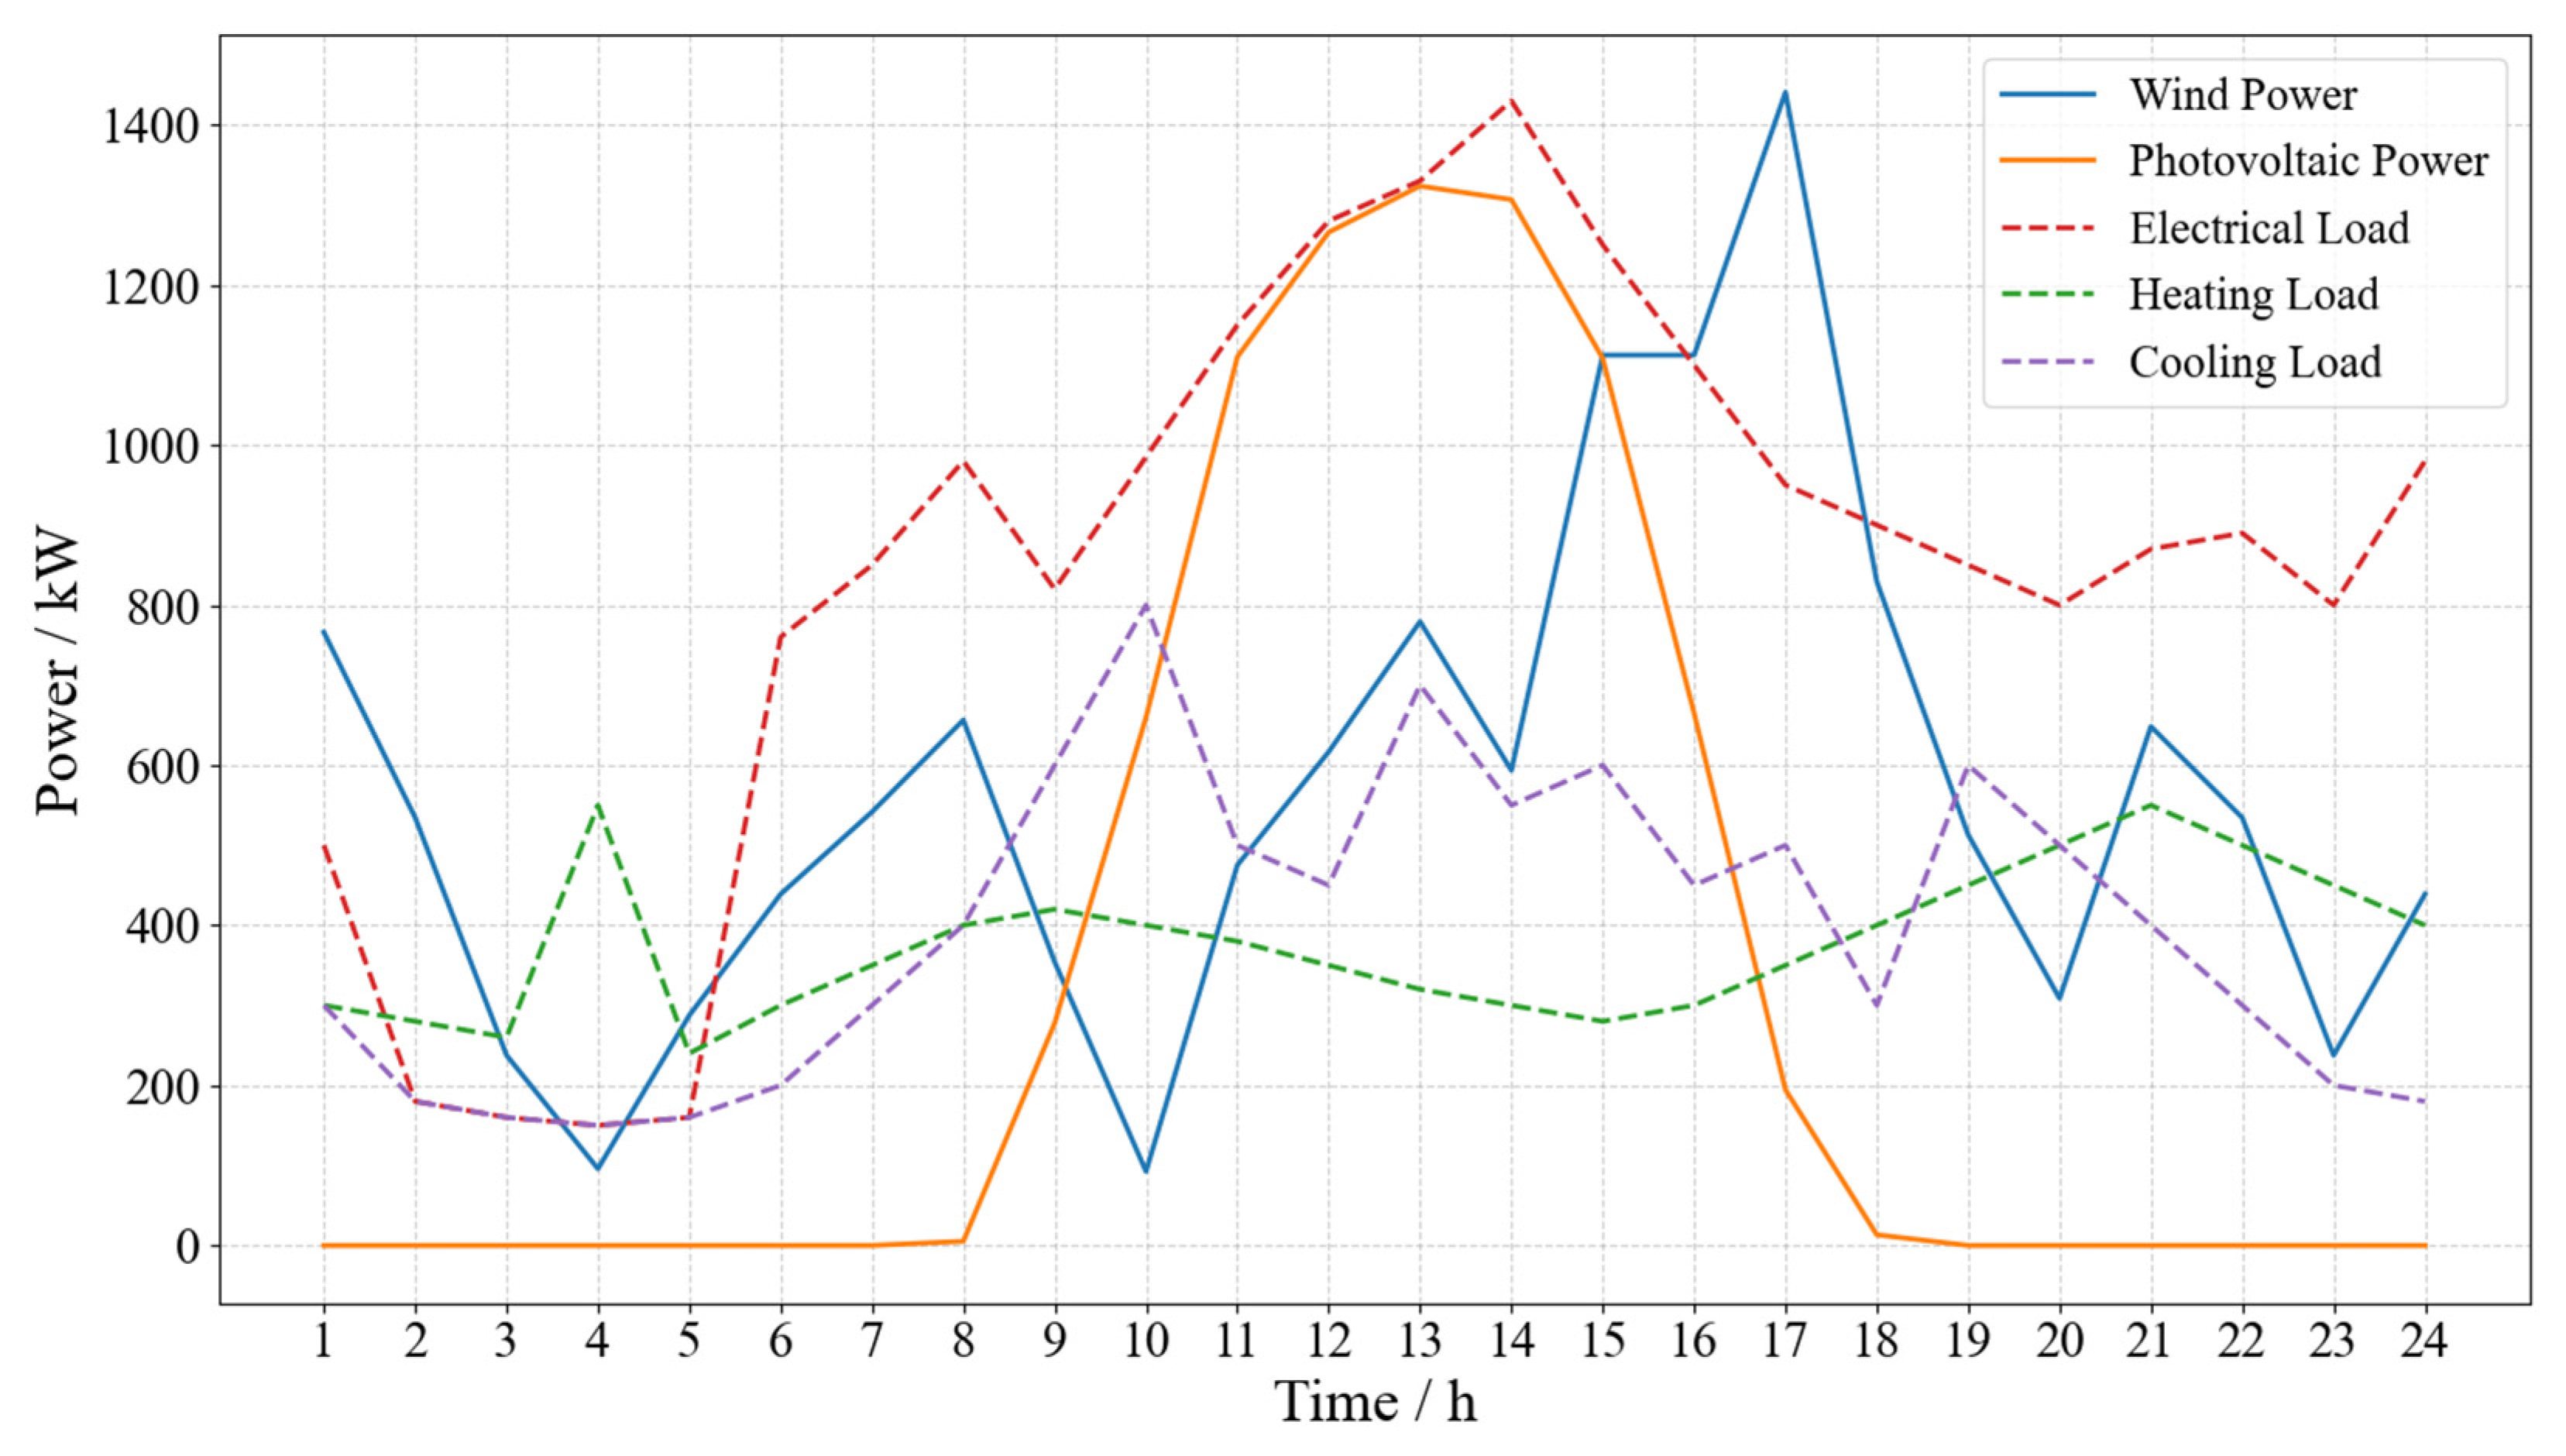
The demand characteristics of heat, power and electricity in Changma Village of Baowu Town, Yanyuan County, are sourced from [47,48]. The typical curves of the daily abandoned clean power and the corresponding energy loads in the agricultural park case are shown in Figure 7.
The main performance parameters and operation and maintenance (O&M) costs of various energy equipment in the agricultural park are shown in Table 3 and Table 4 [48,49]. The carbon emission factors [50,51] for the photovoltaic power, wind power, biogas power and grid power used in the simulations are set as 0.075 kg/kWh, 0.025 kg/kWh, 1.960 kg/kWh, 1.383 kg/kWh, respectively.

7.2. Optimization Process

Based on the wind speed, solar irradiance, and biogas data of Baiwu Town in Yanyuan County, Liangshan Prefecture, a mathematical model of the integrated energy system was constructed. Based on this model, a multi-objective optimization model was further developed with the goals of minimizing operation and maintenance costs and carbon emissions. The improved MOGWO was employed as the solution method, where the hourly outputs of energy devices—including biogas-based power generation, biogas heating, waste heat boilers, battery charging/discharging, thermal storage release, electric heating, electric cooling, and absorption chillers—were treated as continuous decision variables. These variables were perturbed around their original values within a range of 0.8 to 1.2 times the baseline outputs while ensuring compliance with the system’s energy balance constraints (electricity, heating, and cooling) and operational boundary conditions of each device.
The decision variables were then represented as position vectors of grey wolf individuals, serving as inputs to the main loop of the improved MOGWO. Everyone corresponds to a complete set of system dispatch strategies. By simulating the cooperative hunting behavior of grey wolves, the population iteratively evolves within the objective space toward optimal solutions. In each iteration, non-dominated sorting and crowding distance measures were applied to assess population quality, and the leading wolves (α, β, δ) were selected to guide the search process, progressively approaching the Pareto-optimal front.
The optimization produced a well-distributed and representative set of non-dominated solutions, forming the Pareto front. From this front, the solution with the lowest O&M cost (denoted as the α-solution) and the solution with the lowest carbon emissions (denoted as the β-solution) were identified. Furthermore, all objective values were normalized, and the Euclidean distance to the ideal point (0, 0) was calculated. The solution with the shortest distance was selected as the compromise optimal solution (denoted as the δ-solution), achieving a balanced trade-off between economic performance and environmental sustainability.

7.3. Simulation Results

The algorithm parameters were configured as follows: the initial population size was set to 50, the maximum number of iterations to 100, and the upper limit of the non-dominated solution set to 50. The hourly outputs of each device were taken as decision variables and fed into the multi-objective Grey Wolf Optimizer, which performed iterative optimization within the main loop. After the predefined 50 of iterations, a set of non-dominated solutions satisfying all constraints was obtained, representing optimal trade-offs between operation and maintenance costs and carbon emissions for the corresponding device output strategies, as shown in Figure 8.
According to the Pareto front Figure 8, two extreme solutions were selected, namely the solution with the minimum operation and maintenance cost and the solution with the lowest carbon emissions. Subsequently, the values of both objective functions for all solutions were normalized to the range [0, 1], and the Euclidean distance from each solution to the ideal point (0, 0) was calculated. In this way, the cost-optimal solution, the emission-optimal solution, and the compromise solution closest to the ideal point were identified. Figure 9 presents the comparisons of the optimization results in terms of economic costs and environmental emissions.
The results shown in Figure 9 indicate that the cost-optimal solution yields a total operation and maintenance cost of CNY 2064.45 with a corresponding carbon emission of 2484.40 kg. The emission-optimal solution achieves the lowest emission level of 2323.81 kg, with an associated operation and maintenance cost of CNY 2081.10. By normalizing the objective function values of all non-dominated solutions and calculating their Euclidean distances to the ideal point (0,0), the optimal compromise solution was identified, with an operation and maintenance cost of CNY 2070.51 and a carbon emission of 2370.45 kg.
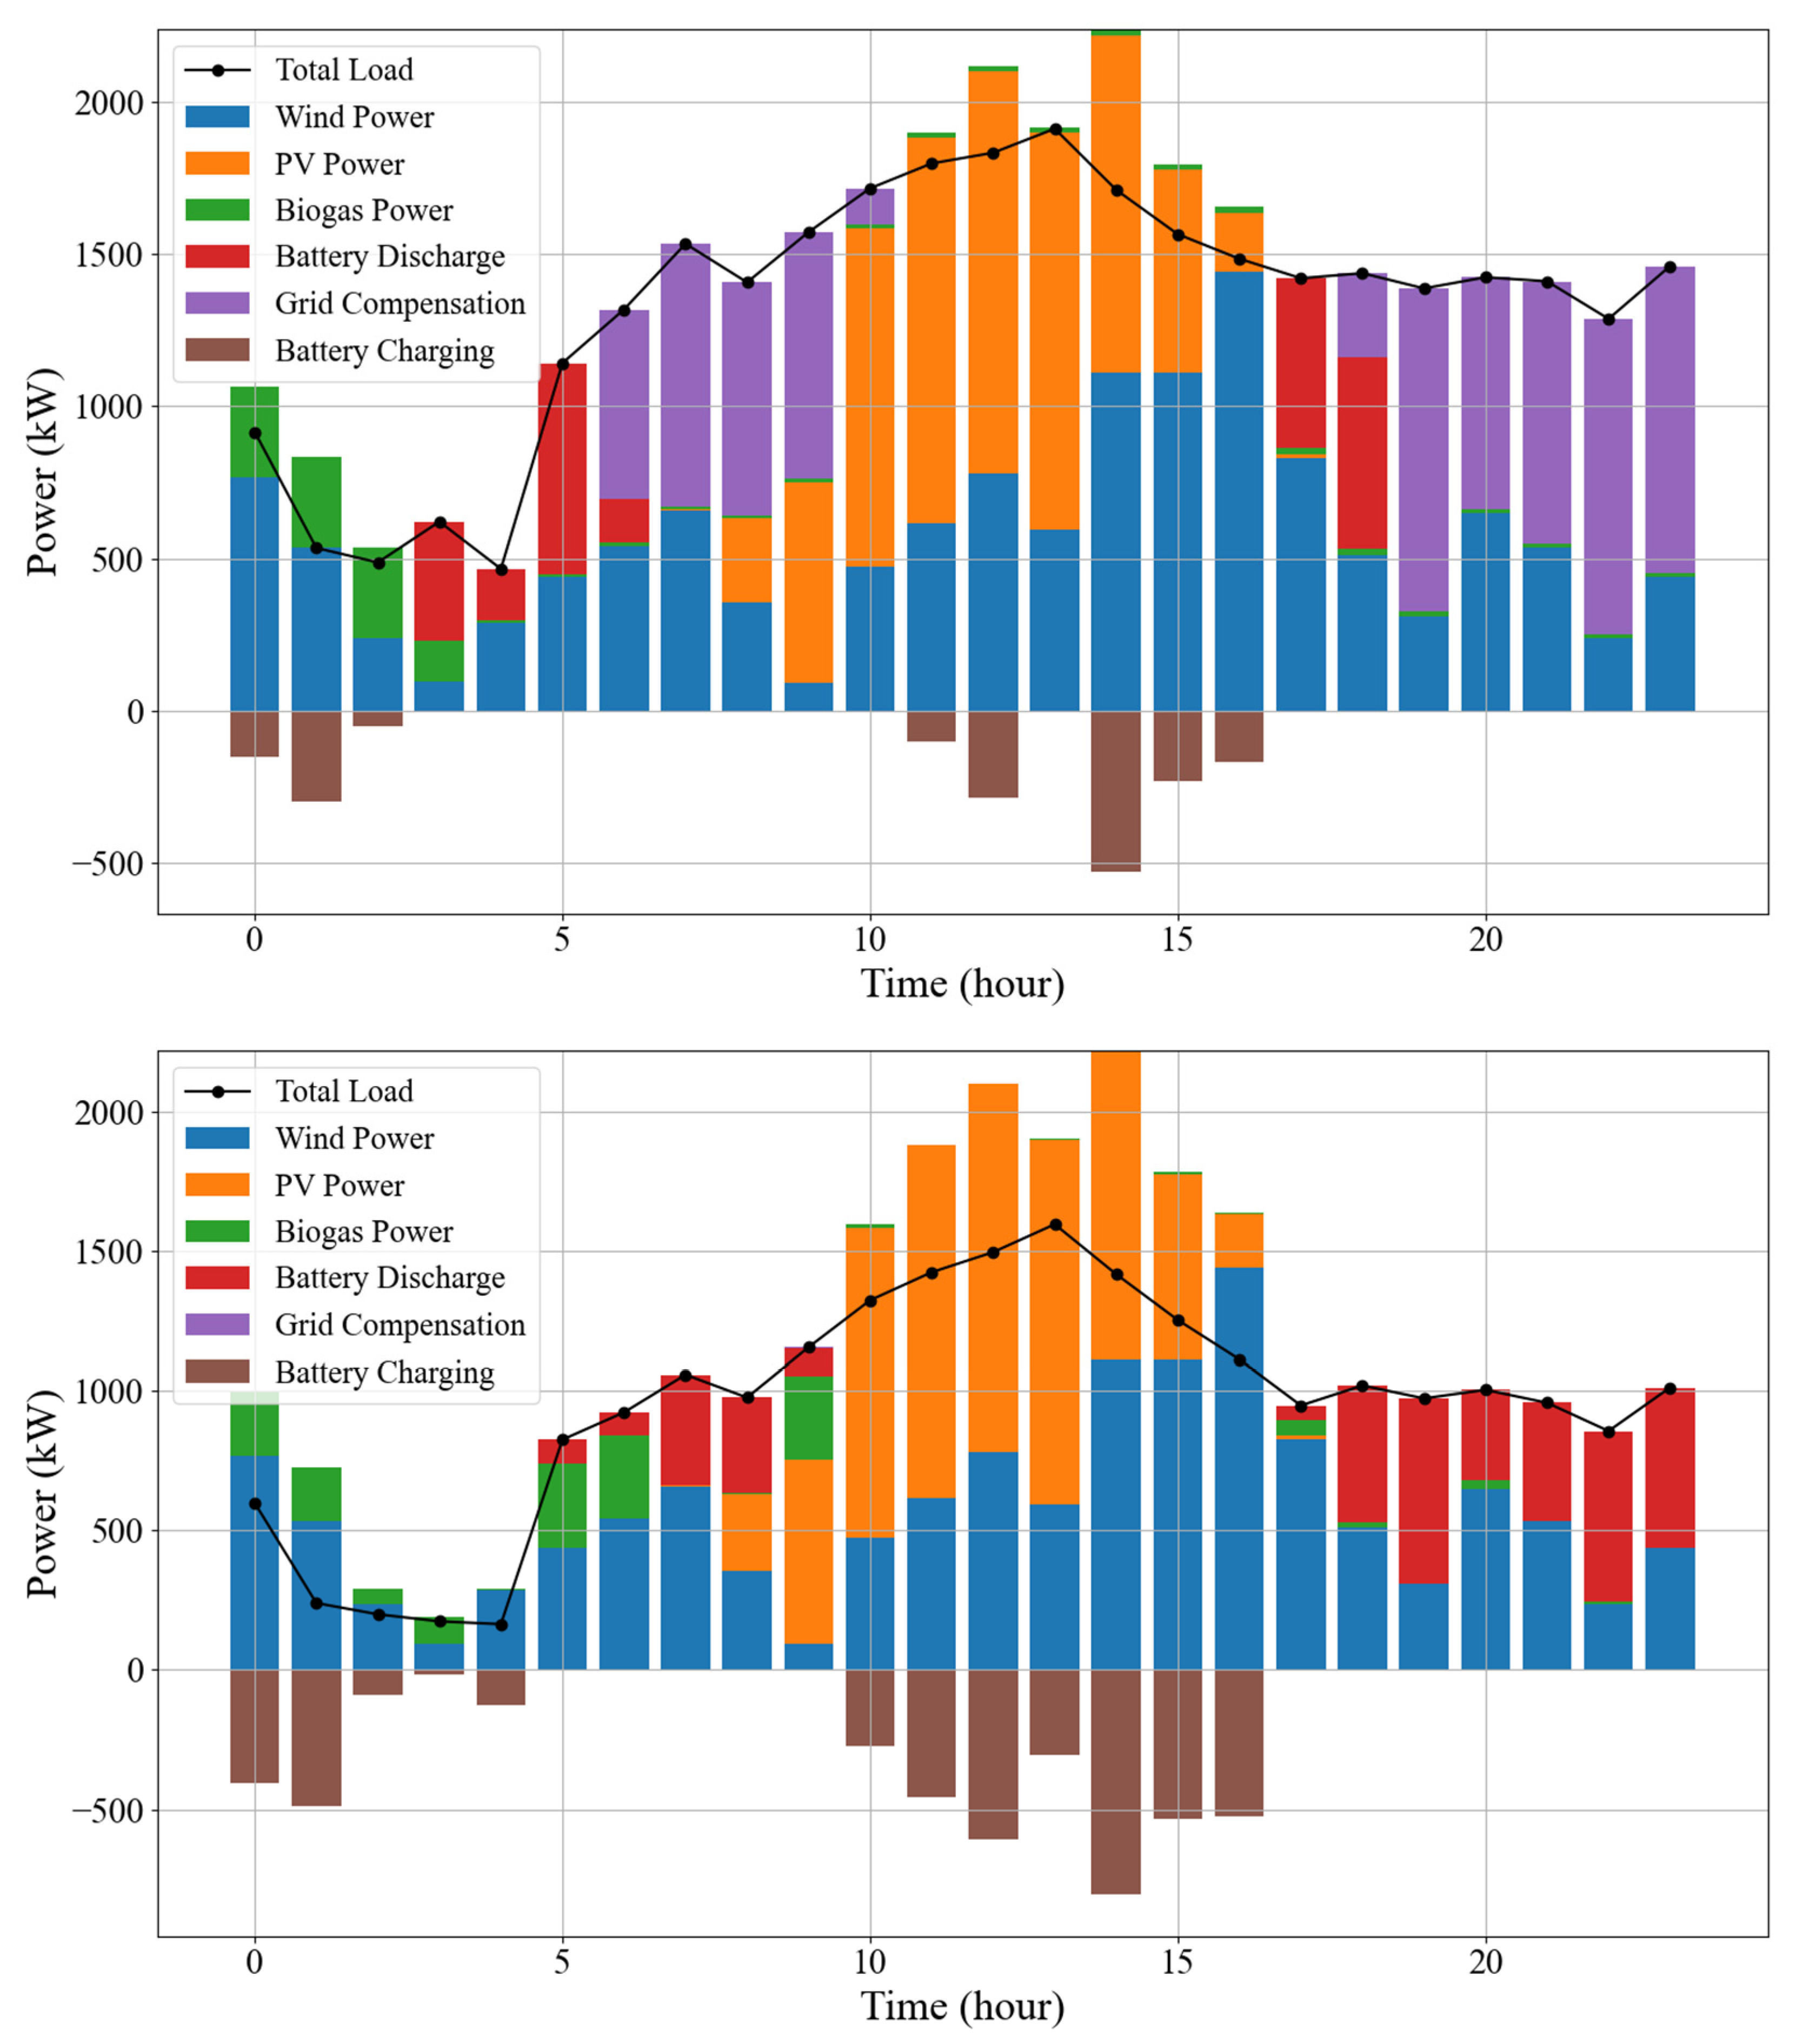
Figure 10 and Table 5 present the performance comparison of the optimal compromise solutions before and after optimization. The optimization results indicate that biogas power generation increased by 21.28%. To achieve continuous reductions in both operational costs and carbon emissions, the electricity consumption of electric heating and cooling equipment decreased substantially, resulting in a 28.69% reduction in the total electric load. Meanwhile, battery charging increased to store excess electricity, and battery discharge also rose to meet part of the demand. The reduced thermal and cooling energy was compensated by the heat released from the absorption chiller and the thermal storage tank, maintaining energy balance within the system.
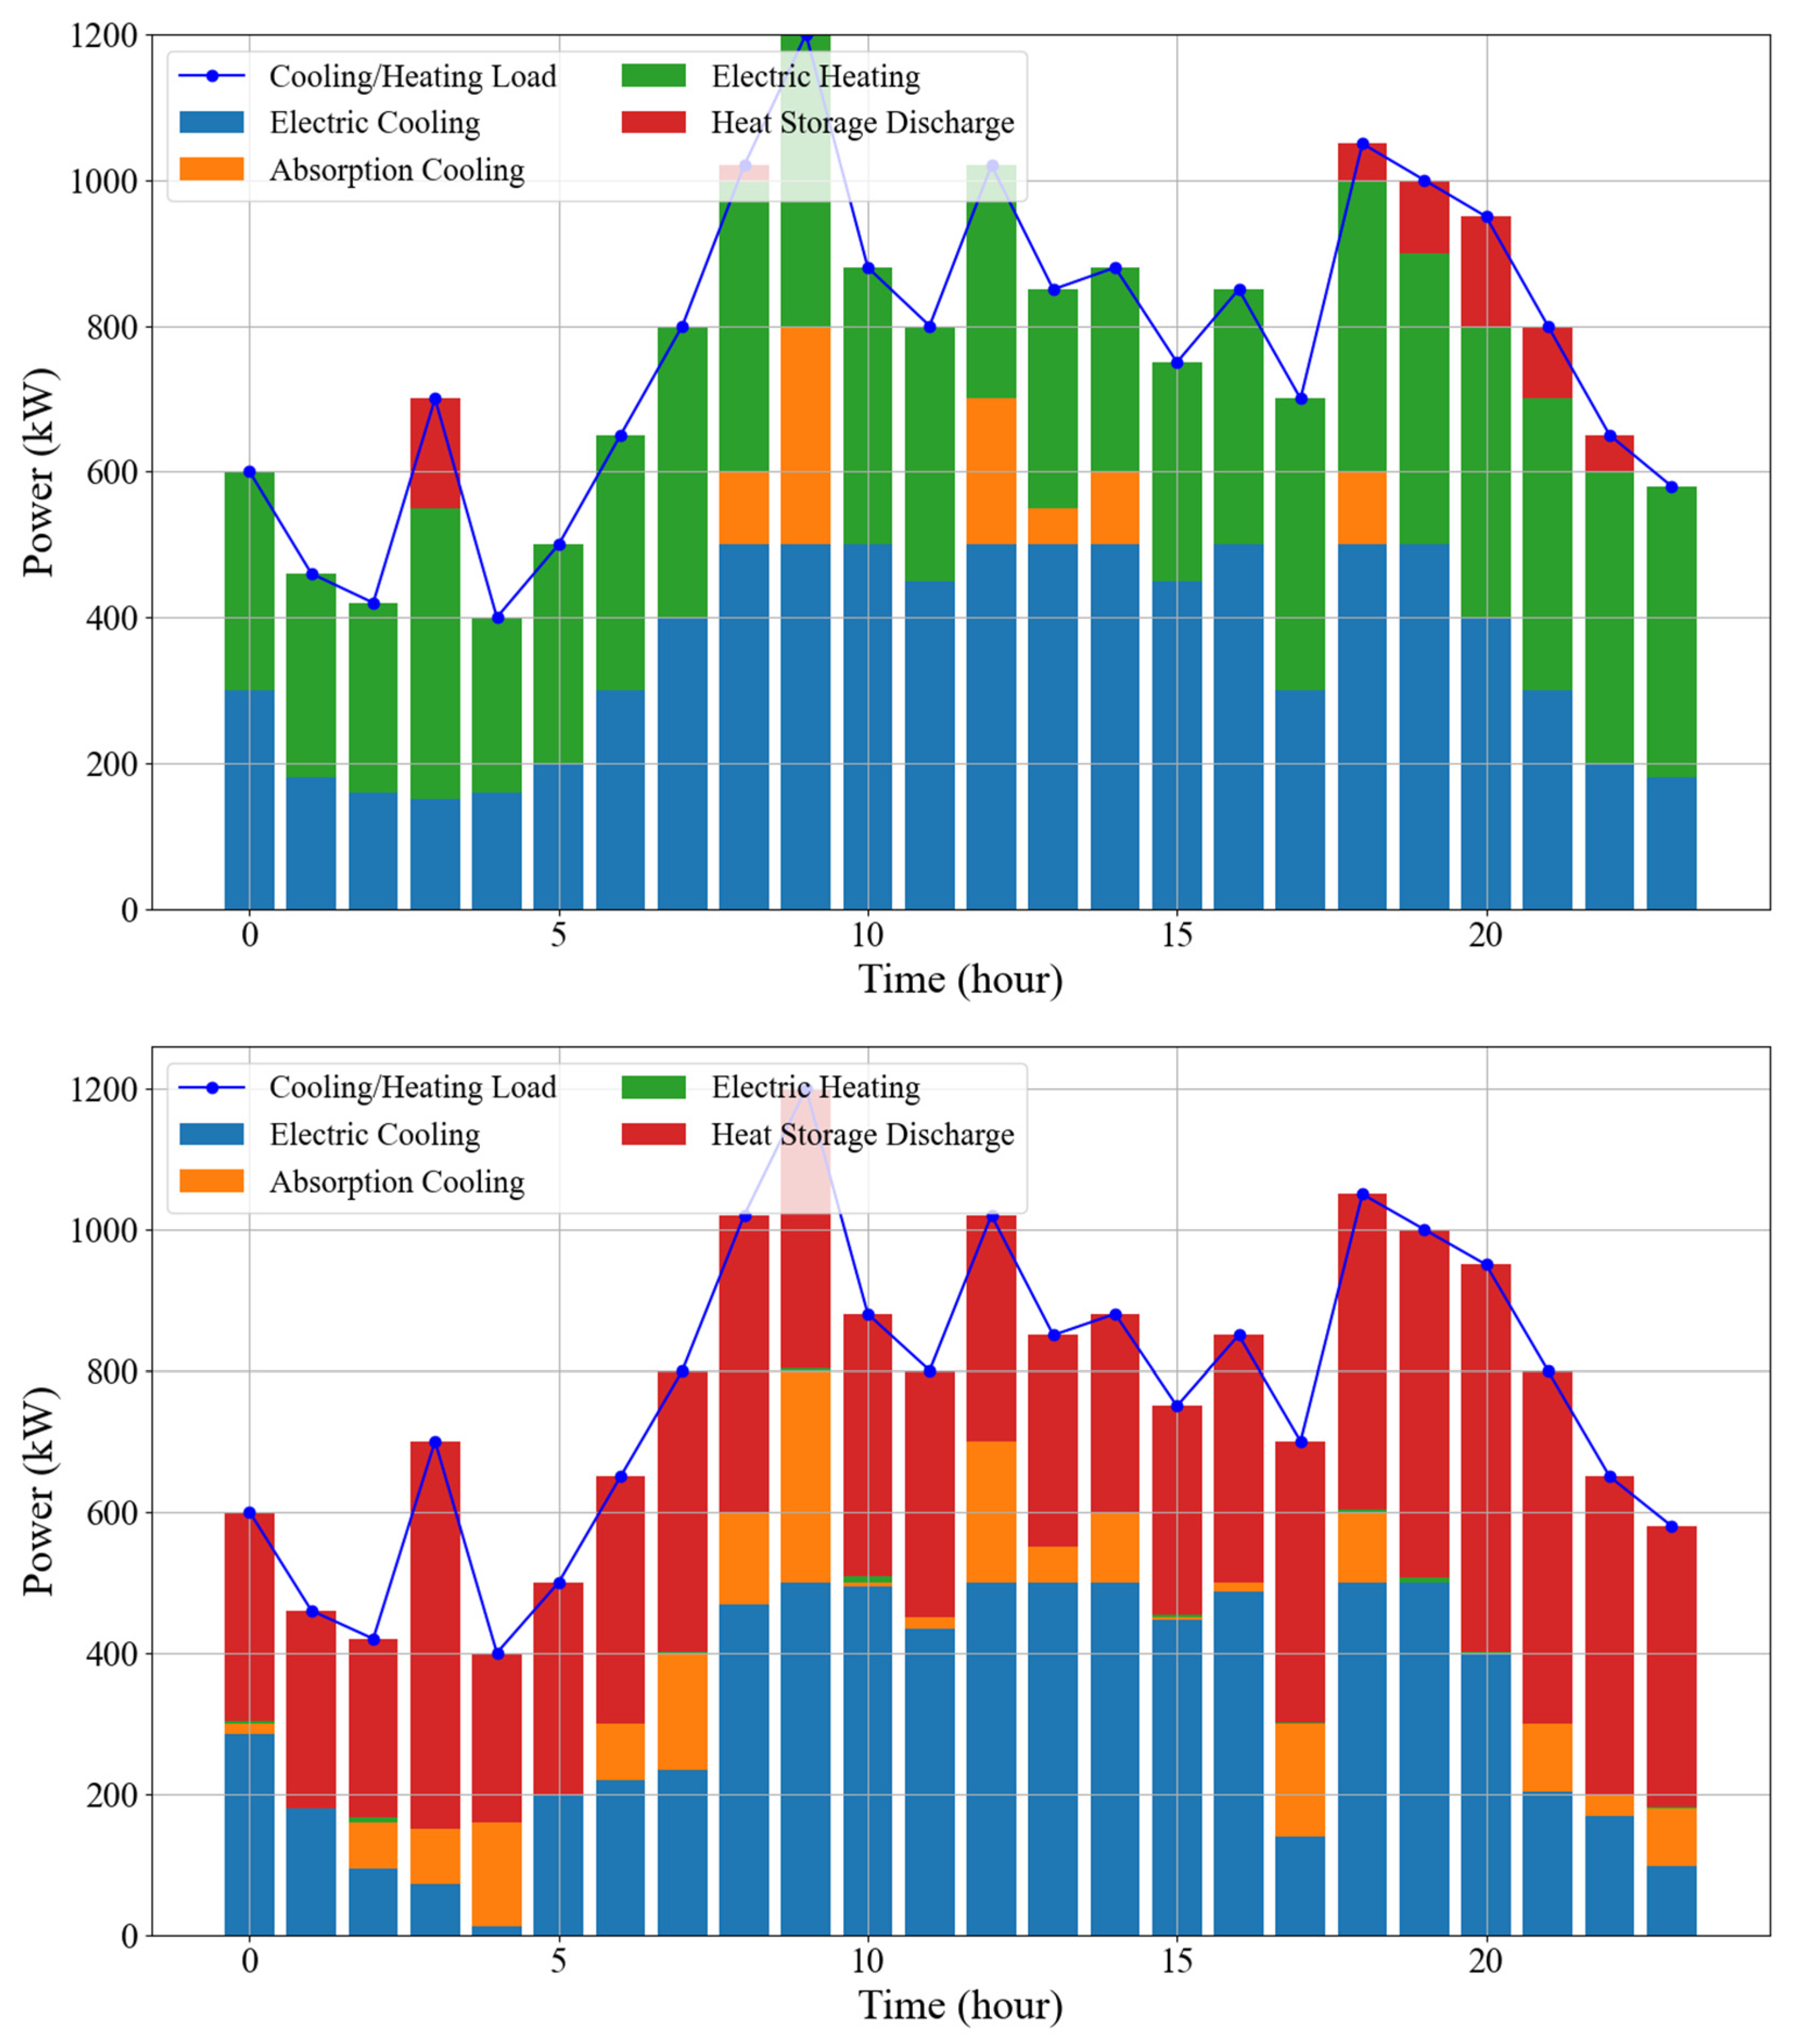
Figure 11 and Table 6 present the performance comparisons of the optimal compromise solution in response to cooling and heating loads before and after optimization.
From the results in Table 6 and Figure 11, the optimization strategy effectively reduces the operating time of high-energy-consuming electric cooling and heating equipment while compensating for the corresponding cooling and heating loads by increasing the operating share of the absorption chiller and thermal storage system.

7.4. Sensitivity Analysis

After implementing the optimized scheduling strategy based on the improved MOGWO, the total operation and maintenance (O&M) cost decreased by 67.96%. To further evaluate the sensitivity of the system’s O&M cost to the total system cost before and after optimization, a comprehensive sensitivity analysis was conducted.
Specifically, each cost parameter was pre-set within a range of ±30% around its benchmark value, with an increment of 10%, resulting in a total of seven perturbation levels. At each level, the cost parameters of the power grid and various energy devices were adjusted sequentially. The system’s operating conditions were then simulated under both pre-optimization and post-optimization scenarios, and the corresponding total system costs were calculated.
In order to quantify the impact of parameters on the system cost, a cost elasticity indicator EC was introduced as follows [52]:
E C = 1 C 0 d C d ( Δ p ) × 100 %
where C0 represents the baseline operating cost of the system and dC/dp) denotes the derivative of the total system cost with respect to changes in the cost parameter.
Table 7 presents the sensitivity comparisons of the cost parameters for each equipment before and after optimization. It can be seen that the sensitivity of the power grid changed the most significantly after optimization, dropping from 63.3% to 0.1%, a change of −63.2%. The sensitivity of the wind power generation cost parameter CWT increased from 11% to 34.3%, a change of +23.3%. The cost parameter CPV of photovoltaic power increased from 4.8% to 14.9%, a change of +10.1%. Therefore, after adopting the optimized algorithm, the electricity capacity of the power grid has been significantly reduced, thereby effectively lowering the correlation between the operation cost of the entire system and the electricity cost, and finally achieving a low-cost and low-carbon power supply. In the actual system design process, it is necessary to pay particular attention to the changes in the capacity of renewable energy sources, equipment costs and other performance parameters to further reduce the economic cost and carbon emissions of the entire system.

8. General Analysis Framework

An improved MOGWO scheduling model has been explored in this paper for use in energy supply design and performance evaluation for agricultural parks. It is a universal and scalable technical design guideline that can be applied to agricultural park scenarios in rural areas with various wind, solar, and biogas resources. The detailed optimization design steps are shown in Figure 12 and are as follows:
(1)
The solar radiation intensity, temperature and wind speed data are inputted. The local energy sources generate clean electricity and supply it to various energy equipment. The gas turbine is selectively started based on whether the demand for cold, heat and electricity is met.
(2)
When the output of local clean power exceeds the local load, the surplus power is stored in the batteries. Otherwise, when the output is less than the load demand, the batteries will make up for the energy shortage. In the case when the sum of local clean power and battery discharging power is still cannot meet the load demand, the gas turbine will start, and the waste heat from the gas turbine will be stored in the heat storage tank through a boiler. Moreover, the local power grid can also be connected to offer power compensation when required.
(3)
A mathematical model of the integrated energy system is built using the energy management modes of Step (2). The integrated energy system includes photovoltaic power station, wind farm, biogas cogeneration, electricity-to-heat conversion units, electricity-to-cooling conversion units, absorption refrigeration machines, batteries, heat storage tanks, and heat, cold, and electricity loads, etc.
(4)
A multi-objective operation optimization model is established based on the comprehensive energy system in Step (3). The model is constructed with the O&M costs and carbon emissions as the objectives, and the balance of cooling, heating and electricity as well as the power ratings of energy equipment are the constraints.
(5)
Based on the user-defined weather conditions (temperature, solar radiation intensity, wind speed, etc.) and the demand from the local loads, the multi-objective optimization model in Step (4) is finally used to obtain the optimal equipment configuration scheme to simultaneously reduce the O&M costs and carbon emissions.
Figure 12. General analysis framework for comprehensive energy system design and optimal dispatch in agricultural parks.
Energies 18 06138 g012

9. Conclusions

For wind–solar–biogas complementary comprehensive energy systems near rural areas, a source–load collaborative optimization model was established, and an improved multi-objective grey wolf optimizer was introduced to minimize operating costs and carbon emissions, thereby addressing the dynamic matching of electricity, heating, and cooling loads and the coordinated allocation of multi-energy outputs. After applying the improved optimizer, the total operation and maintenance cost decreased from CNY 6461.77 to CNY 2070.51, while carbon emissions were reduced from 13,740.72 kg to 2370.45 kg, representing reductions of approximately 67.96% and 82.75%, respectively.
From the sensitivity comparisons of cost parameters for each equipment before and after optimization, it can be seen that the sensitivity of the power grid changed the most significantly after optimization, dropping from 63.3% to 0.1%. This means that the electricity capacity of the power grid has been significantly reduced, thereby effectively lowering the correlation between the operation cost of the entire system and the electricity cost, and finally achieving a low-cost and low-carbon power supply. Overall, the complexity and runtime of the proposed algorithm remain within the same orders of magnitude as the standard GWO. The entire optimization process can converge quickly and yield the optimal results for actual engineering applications.
These results demonstrate that the improved multi-objective Grey Wolf Optimizer significantly enhanced both the economic performance and environmental sustainability of the system. This new technology has considerable universal application value. In similar agricultural parks or integrated energy system scenarios, users only need to input specific system parameters and operational constraints, and they can obtain optimized parameter configurations and energy management strategies. This new technology provides a highly energy-efficient and economically feasible technical solution for the design and operation optimization of comprehensive energy systems in future agricultural parks.

Author Contributions

Conceptualization, L.F. and X.C.; methodology, Q.P. and X.C.; software, Q.P. and X.C.; validation, X.C. and B.S.; writing—original draft preparation, Q.P.; writing—review and editing, L.F., X.C. and B.S.; supervision, X.C. and L.F.; project administration, X.C. All authors have read and agreed to the published version of the manuscript.

Funding

This work was supported by the Sichuan Science and Technology Program (2025ZNSFSC0447), Sichuan Provincial Higher Education Teaching Reform Project (JG2024-0690, JSJ2024012), MOE (Ministry of Education in China) Thematic Case Project of China Academic Degrees and Graduate Education Development Center (ZT-2410636003), and the Fundamental Research Funds for the Central Universities.

Data Availability Statement

The data presented in this study are available on request from the corresponding author.

Conflicts of Interest

The authors declare no conflicts of interest.

References

  1. Available online: https://www.gov.cn/zhengce/202501/content_7000493.htm (accessed on 22 January 2025).
  2. Sulewski, P.; Wąs, A. Agriculture as Energy Prosumer: Review of Problems, Challenges, and Opportunities. Energies 2024, 17, 6447. [Google Scholar] [CrossRef]
  3. Nikolić, D.; Jovanović, S.; Jurišević, N.; Nikolić, N.; Radulović, J.; Velemir Radović, M.; Grujić, I. Sustainable Design in Agriculture—Energy Optimization of Solar Greenhouses with Renewable Energy Technologies. Energies 2025, 18, 416. [Google Scholar] [CrossRef]
  4. Liu, H.; Ye, S.; Yin, C.; Wang, L.; Zhang, C. Cooperative Game-Theoretic Scheduling for Low-Carbon Integrated Energy Systems with P2G–CCS Synergy. Energies 2025, 18, 3942. [Google Scholar] [CrossRef]
  5. Available online: https://wap.reportway.org/article/34349.html (accessed on 22 January 2025).
  6. MacDonald, S.; Winner, B.; Smith, L.; Juillerat, J.; Belknap, S. Bridging the rural efficiency gap: Expanding access to energy efficiency upgrades in remote and high energy cost communities. Energy Effic. 2020, 13, 503–521. [Google Scholar] [CrossRef]
  7. Saidmamatov, O.; Tetreault, N.; Bekjanov, D.; Khodjaniyazov, E.; Ibadullaev, E.; Sobirov, Y.; Adrianto, L.R. The Nexus between Agriculture, Water, Energy and Environmental Degradation in Central Asia—Empirical Evidence Using Panel Data Models. Energies 2023, 16, 3206. [Google Scholar] [CrossRef]
  8. Monsberger, C.; Reuter, S.; Ackerl, F.; Mayr, B.; Fina, B.; Mauthner, B. The Role of Renewable Gas Energy Communities in Austria’s Energy Transformation. Energies 2025, 18, 4863. [Google Scholar] [CrossRef]
  9. Kim, Y.; Kim, S. Economic Analysis of Biofuel Production in Agrophotovoltaic Systems Using Building-Integrated Photovoltaics in South Korea. Energies 2025, 18, 1949. [Google Scholar] [CrossRef]
  10. Yang, W.; Xia, Y.; Yu, X.; Zhang, H.; Lin, X.; Ma, H.; Du, Y.; Dong, H. Optimal Dispatch of Agricultural Integrated Energy System with Hybrid Energy Storage. Energies 2022, 15, 9131. [Google Scholar] [CrossRef]
  11. Ahmad, R.; Farzaneh, H. Techno-economic analysis and dynamic power simulation of a hybrid solar-wind-battery system for power supply in rural areas in Pakistan. Clean. Energy Syst. 2024, 8, 100127. [Google Scholar] [CrossRef]
  12. Liang, W.; Wang, S.; Li, X.; Li, X.; Xu, K. Optimization method of low carbon park integrated energy system based on multi-agent game. Electr. Power Syst. Res. 2025, 243, 111484. [Google Scholar] [CrossRef]
  13. Li, X.; Zhang, F.; Huang, Y.; Zhang, G. Bi-Level Sustainability Planning for Integrated Energy Systems Considering Hydrogen Utilization and the Bilateral Response of Supply and Demand. Sustainability 2025, 17, 7637. [Google Scholar] [CrossRef]
  14. Chen, M.; Wei, J.; Yang, X.; Fu, Q.; Wang, Q.; Qiao, S. Multi-objective optimization of multi-energy complementary systems integrated biomass-solar-wind energy utilization in rural areas. Energy Convers. Manag. 2025, 323, 119241. [Google Scholar] [CrossRef]
  15. Wang, T.; Wang, Q.; Zhang, C. Research on the Optimal Operation of a Novel Renewable Multi-Energy Complementary System in Rural Areas. Sustainability 2021, 13, 2196. [Google Scholar] [CrossRef]
  16. Wei, C.; Yuan, L.; Xin, H.; Hailong, Z.; Yong, Y.; Jianbin, C. Multi-objective optimal scheduling method for integrated energy systems in facility agricultural industrial parks considering local consumption of wind and photovoltaic power. Electr. Power Constr. 2021, 42, 20–27. [Google Scholar]
  17. Yu, X.; Song, Y.; Sun, R. Distributed cooperative electricity-carbon trading for multi-park integrated energy systems. Sustain. Energy Grids Netw. 2025, 43, 101683. [Google Scholar] [CrossRef]
  18. Dardon, J.D.A.; Farzaneh, H. Techno-economic analysis of a hybrid photovoltaic-wind-biomass-battery system for off-grid power in rural Guatemala. Util. Policy 2024, 88, 101762. [Google Scholar] [CrossRef]
  19. Winsly, B.W.; Ramalingam, V.K.; Santhappan, J.S.; Maria, A.J.; Chokkalingam, M.P.; Rajendran, V. Optimal sizing and techno-economic-environmental evaluation of biomass-solar-wind-grid hybrid energy system: A case study of an institute in South India. Energy Convers. Manag. 2025, 325, 119352. [Google Scholar] [CrossRef]
  20. El Mestari, W.; Cheggaga, N.; Adli, F.; Benallal, A.; Ilinca, A. Tuning Parameters of Genetic Algorithms for Wind Farm Optimization Using the Design of Experiments Method. Sustainability 2025, 17, 3011. [Google Scholar] [CrossRef]
  21. Vahidi, J.; Golmaei, S.M. Optimizing Construction Scheduling Using the Sine Cosine Algorithm (SCA) with Building Information Modeling (BIM). Results Eng. 2025, 28, 107100. [Google Scholar] [CrossRef]
  22. Wu, M.; Du, P.; Jiang, M.; Goh, H.H.; Zhu, H.; Zhang, D.; Wu, T. An integrated energy system optimization strategy based on particle swarm optimization algorithm. Energy Rep. 2022, 8, 679–691. [Google Scholar] [CrossRef]
  23. Zheng, Q.; Yue, C.; Zhang, S.; Yao, C.; Zhang, Q. Optimal Allocation of Water Resources in Canal Systems Based on the Improved Grey Wolf Algorithm. Sustainability 2024, 16, 3635. [Google Scholar] [CrossRef]
  24. Gao, Y.; Hu, Z.; Chen, G. The “Yanyuan Model” of clean energy in Liangshan, Sichuan: Responding to the era’s “green expectations”. Bus. Manag. 2023, 8, 48–49. [Google Scholar]
  25. Available online: https://www.sc.chinanews.com.cn/cjbd/2023-11-01/198049.html (accessed on 1 November 2023).
  26. Available online: https://fgw.sc.gov.cn/sfgw/c106099/2022/1/29/7650e2495f6d4fd48e17560783b76791.shtml (accessed on 29 January 2022).
  27. Available online: http://www.chinapower.com.cn/tynfd/bwfd/20241127/269145.html (accessed on 23 November 2024).
  28. Wang, P.; Zhang, L.; Jiang, Y.; Luo, W.; Chen, Z.; Hai, H.; Xiong, Z. Current situation and countermeasures of comprehensive utilization of straw in Yanyuan County. Sichuan Agric. Sci. Technol. 2023, 12, 79–82. [Google Scholar]
  29. Available online: http://www.yanyuan.gov.cn/zfxxgk/zfxxgknr/tzgg_31066/202106/t20210617_1939943.html (accessed on 26 June 2018).
  30. Available online: http://www.yanyuan.gov.cn/mlzd/yygk/202211/t20221128_2376356.html (accessed on 29 April 2025).
  31. Available online: http://www.yanyuan.gov.cn/zfxxgk/zfxxgknr/zfgzbg/202406/t20240604_2685962.html (accessed on 4 June 2024).
  32. Available online: http://www.yanyuan.gov.cn/zt/xj/lygk/zrzy/gtkjghbz/xjgtkjztgh/202309/t20230906_2541420.html (accessed on 19 November 2024).
  33. Sun, Y.; Yu, Q.; Wang, X.; Gao, S.; Sun, G. Extraction of Basic Features and Typical Operating Conditions of Wind Power Generation for Sustainable Energy Systems. Sustainability 2025, 17, 6577. [Google Scholar] [CrossRef]
  34. Wang, J.; Lu, Y.; Yang, Y.; Mao, T. Thermodynamic performance analysis and optimization of a solar-assisted combined cooling, heating and power system. Energy 2016, 115, 49–59. [Google Scholar] [CrossRef]
  35. Liu, Z.; Cui, Y.; Wang, J.; Yue, C.; Agbodjan, Y.S.; Yang, Y. Multi-objective optimization of multi-energy complementary integrated energy systems considering load prediction and renewable energy production uncertainties. Energy 2022, 254, 124399. [Google Scholar] [CrossRef]
  36. Basrawi, M.F.B.; Yamada, T.; Nakanishi, K.; Katsumata, H. Analysis of the performances of biogas-fuelled micro gas turbine cogeneration systems (MGT-CGSs) in middle-and small-scale sewage treatment plants: Comparison of performances and optimization of MGTs with various electrical power outputs. Energy 2012, 38, 291–304. [Google Scholar] [CrossRef]
  37. Wu, D.; Han, Z.; Liu, Z.; Li, P.; Ma, F.; Zhang, H.; Yin, Y.; Yang, X. Comparative study of optimization method and optimal operation strategy for multi-scenario integrated energy system. Energy 2021, 217, 119311. [Google Scholar] [CrossRef]
  38. Mirjalili, S.; Mirjalili, S.M.; Lewis, A. Grey Wolf Optimizer. Adv. Eng. Softw. 2014, 69, 46–61. [Google Scholar] [CrossRef]
  39. Chen, Y.; Chen, X.; Fu, L.; Jiang, S. Superconducting hydrogen-electricity multi-energy system for transportation hubs: Modeling, technical study and economic-environmental assessment. Appl. Energy 2025, 401, 126823. [Google Scholar] [CrossRef]
  40. Aldaliee, A.A.; Mansor, N.N.; Mokhlis, H.; Ramasamy, A.K.; Awalin, L.J. Pareto-Based Optimization of PV and Battery in Home-PV-BES-EV System with Integrated Dynamic Energy Management Strategy. Sustainability 2025, 17, 7364. [Google Scholar] [CrossRef]
  41. Tuan, D.H.; Tran, D.T.; Nguyen Ngoc Thanh, V.; Huynh, V.V. Load Frequency Control Based on Gray Wolf Optimizer Algorithm for Modern Power Systems. Energies 2025, 18, 815. [Google Scholar] [CrossRef]
  42. Coronado-Mendoza, A.; Camas-Náfate, M.; Artal-Sevil, J.S.; Domínguez-Navarro, J.A. Optimum Design of a Photovoltaic Inverter System Based on GA, PSO and GWO Algorithms with a MPPT Sliding Mode Control. Energies 2025, 18, 1911. [Google Scholar] [CrossRef]
  43. Huang, H.; Shen, Q.; Liu, W.; Peng, Y.; Zhu, S.; Bao, R.; Mo, L. Optimal Scheduling of a Hydropower–Wind–Solar Multi-Objective System Based on an Improved Strength Pareto Algorithm. Sustainability 2025, 17, 7140. [Google Scholar] [CrossRef]
  44. Ma, Z.; Jen, C.T.; Aazami, A. Time-Dependent Vehicle Routing Optimization Incorporating Pollution Reduction Using Hybrid Gray Wolf Optimizer and Neural Networks. Sustainability 2025, 17, 4829. [Google Scholar] [CrossRef]
  45. Zhang, H.; Sui, X.; Sui, P.; Wei, L.; Huang, Y.; Yang, Z.; Yang, H. Coil Parameter Optimization Method for Wireless Power Transfer System Based on Crowding Distance Division and Adaptive Genetic Operators. Energies 2024, 17, 3289. [Google Scholar] [CrossRef]
  46. Zhang, M.; Wang, J.; Zhi, H.; Zhao, J.; Chang, X.; Zhang, S.; Guo, X.; Wang, T. An Integrated Electricity–Gas–Heat Energy System Based on the Synergy of Long- and Short-Term Energy Storage. Energies 2025, 18, 55. [Google Scholar] [CrossRef]
  47. Liu, Y. Analysis of Factors Affecting Power Generation in Photovoltaic Power Generation Systems. Sichuan Hydropower 2022, 41, 27–30. [Google Scholar]
  48. Ye, Y.; Yuan, X. Research on Wind Energy Resources and Optimal Spacing of Wind Turbines in a Typical Area of Liangshan Prefecture, Sichuan Province Based on CFD Simulation. East. Electr. Rev. 2024, 38, 28–33. [Google Scholar] [CrossRef]
  49. Bai, J.; Wu, X.; Chen, X.; Zhang, Z.; Fu, L.; Zhao, C.; Qing, K.; Luo, Q.; Gong, S.; Shen, B. Combined space cooling/heating and domestic hot water supply driven by data center waste heat: Complementary energy conservation, economic capacity optimization and generic analysis framework. Build. Environ. 2025, 283, 113402. [Google Scholar] [CrossRef]
  50. Zhang, T. Research on the Operation Optimization of Comprehensive Energy System Based on the Coordinated Utilization of Multiple Energy Sources in Rural Areas. Master’s Thesis, North China Electric Power University, Beijing, China, 2024. [Google Scholar] [CrossRef]
  51. Li, J. Research on the Near-Zero Carbon Operation Strategy of the Comprehensive Energy System in Facility Agriculture Industrial Parks. Master’s Thesis, Lanzhou University of Technology, Lanzhou, China, 2022. [Google Scholar] [CrossRef]
  52. Schyska, B.U.; Kies, A.; Schlott, M.; Von Bremen, L.; Medjroubi, W. The sensitivity of power system expansion models. Joule 2021, 5, 2606–2624. [Google Scholar] [CrossRef]
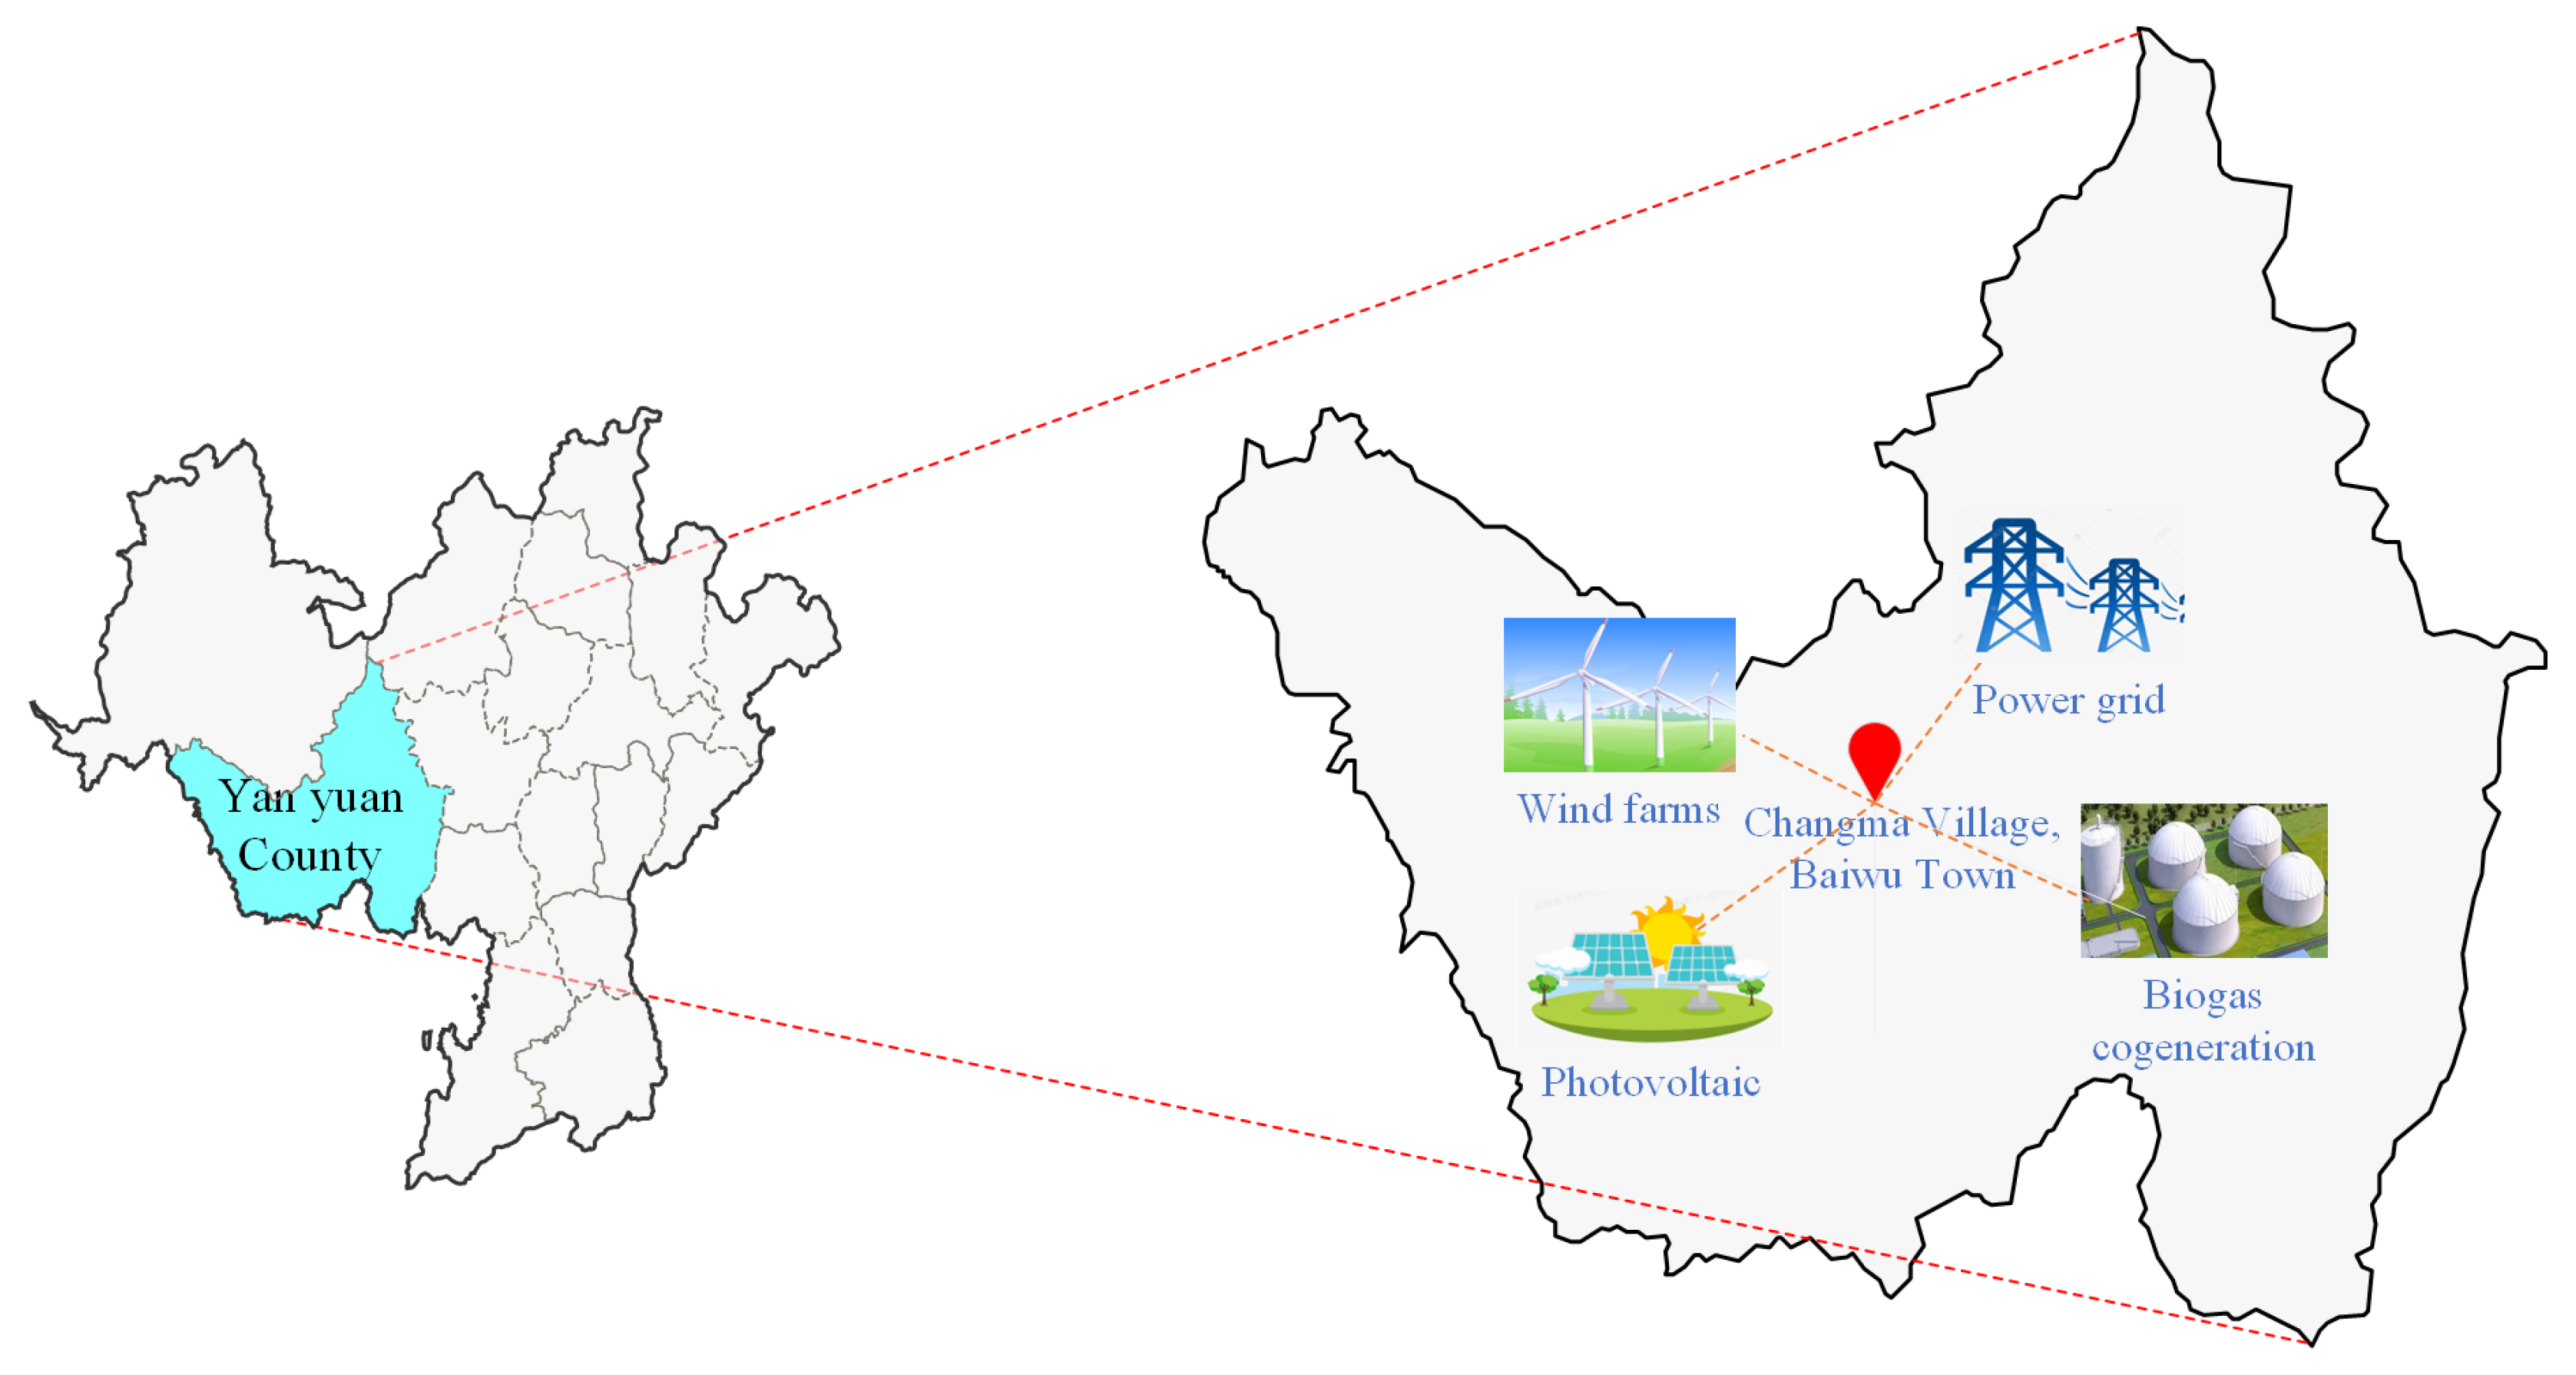
Figure 1. Site selection for comprehensive energy system in new agricultural park in Yanyuan County.
Energies 18 06138 g001
Figure 2. Four operating modes of energy management strategy. (a) Wind–PV Dominated Mode: The combined output of photovoltaic and wind power is sufficient to meet the electricity, cooling, and heating demands of the park. All load demands are supplied by photovoltaic and wind power, the cooling demand is met by the electric chiller, and the heating demand is provided by the electric boiler. (b) Wind–PV–Grid Collaborative Mode: When the biogas supply is insufficient, the gas turbine cannot operate. In this case, the power shortage is compensated by the grid, and the cooling and heating demands are fully met by electric devices. (c) Wind–PV–Biogas Collaborative Mode: When the output of photovoltaic and wind power is insufficient to meet the electricity, cooling, and heating demands, the biogas-based combined heat and power (CHP) system is activated, supported by a thermal storage tank and an absorption chiller. In this case, the cooling demand is jointly met by the electric chiller and the absorption chiller, while the heating demand is supplied through the coordinated operation of the thermal storage tank and the electric boiler. (d) Wind–PV–Biogas–Grid Collaborative Mode: When the combination of photovoltaic, wind, and biogas-based CHP generation is still insufficient to fully satisfy the electricity, heating, and cooling demands, the power grid compensates for the deficit. The priority order of energy utilization is as follows: photovoltaic and wind power > battery discharge > biogas-based CHP > grid supply.
Energies 18 06138 g002
Figure 3. Framework of the improved Grey Wolf Optimizer.
Energies 18 06138 g003
Figure 4. Pareto front of the ZDT1 test function.
Energies 18 06138 g004
Figure 5. Pareto front of the ZDT2 test function.
Energies 18 06138 g005
Figure 6. Pareto front of the ZDT3 test function.
Energies 18 06138 g006
Figure 7. Basic data for clean power and cooling, heating, and electrical loads.
Energies 18 06138 g007
Figure 8. Pareto front of the non-dominated solution set.
Energies 18 06138 g008
Figure 9. Comparison of operation and maintenance costs and carbon emission costs for different schemes.
Energies 18 06138 g009
Figure 10. Comparison of the electrical loads and power outputs of each device before and after optimization.
Energies 18 06138 g010
Figure 11. Comparison of cooling and heating loads and the corresponding outputs of each device before and after optimization.
Energies 18 06138 g011
Table 1. Comparison of Pareto front performance on different test functions.
Test FunctionPareto Solution Set Sizef1 Rangef2 RangeFront Shape
ZDT124[0.000, 0.970][0.300, 1.555]Concave
ZDT226[0.000, 1.000][0.270, 1.174]Convex
ZDT325[0.000, 0.843][0.117, 1.839]Discontinuous
Table 2. Comparison of HV, spacing, and pareto set size for different algorithms.
AlgorithmHVSpacingPareto Solution Set Size
Standard MOGWO191,807.9660.09513.433
Improved MOGWO206,743.3180.08116.533
Ablation_Init172,536.4070.10514.700
Ablation_Leaders178,799.6770.09515.400
Ablation_aFactor146,749.4610.11911.233
Table 3. Main performance parameters for various energy equipment.
EquipmentParameterValue
Photovoltaic PowerMaximum output power2000 kW
Wind PowerMaximum output power2000 kW
Biogas Combined Heat and PowerRated power output300 kW
Maximum heating efficiency0.62
Maximum power generation efficiency0.38
Waste heat recovery efficiency0.9
Heat exchange efficiency0.9
Electric HeatingThermal efficiency0.85
Rated thermal power500 kW
Electric CoolingCooling efficiency3
Maximum cooling output power500 kW
Absorption ChillerRefrigeration efficiency1.2
Maximum cooling output power500 kW
Battery Energy StorageRated capacity5000 kWh
Charging/discharging efficiency0.93
Thermal Storage TankRated capacity5000 kWh
Charging/discharging efficiency0.9
Table 4. Operation and maintenance costs for various energy equipment.
Energy EquipmentCost (CNY/kW)
Photovoltaic Power (CPV)0.052
Wind Power (CWT)0.039
Biogas Combined Heat and Power (CBCHP)0.09
Electric Heating Equipment (CEB)0.084
Electric Cooling Equipment (CEC)0.084
Absorption Chiller (CABC)0.084
Battery Energy Storage (CBS)0.036
Thermal Storage Tank (CTST)0.024
Table 5. Optimization results of the electrical loads and power outputs of each device.
ItemBefore OptimizationAfter OptimizationPower ChangeChange Rate
Biogas power generation1332.35 kW1615.86 kW+283.51 kW+21.28%
Electric heating equipment8852.63 kW43.99 kW−8808.64 kW−99.50%
Electric cooling equipment2876.67 kW2544.74 kW−331.93 kW−11.54%
Total electric load31,854.33 kW22,713.76 kW−9140.57 kW−28.69%
Battery charging1821.43 kW4626.98 kW+2805.54 kW+154.03%
Battery discharging2582.59 kW4145.49 kW+1562.90 kW+60.52%
Grid compensation8185.93 kW4.50 kW−8181.43 kW−99.95%
Table 6. Optimization results of the cooling and heating loads and power outputs of each device.
ItemBefore OptimizationAfter OptimizationPower ChangeChange Rate
Electric cooling equipment8630 kW7634.21 kW−995.79 kW−11.54%
Absorption chiller850 kW1845.79 kW+995.79 kW+117.15%
Electric heating equipment8410 kW41.79 kW−8368.21 kW−99.50%
Heat released from storage620 kW8988.21 kW+8368.21 kW+1349.71%
Table 7. Comparisons of equipment cost parameters before and after optimization.
ParameterBefore OptimizationAfter OptimizationChange Rate
Cgrid63.3%0.1%−63.2%
CEB11.5%0.2%−11.3%
CWT11%0.343%+23.3%
CPV4.8%14.9%+10.1%
CEC3.7%10.3%+6.6%
CBS2.5%15.3%+12.8%
CBCHP1.9%7%+5.1%
CABC1.1%7.5%+6.4%
CTST0.2%10.4%+10.2%
Disclaimer/Publisher’s Note: The statements, opinions and data contained in all publications are solely those of the individual author(s) and contributor(s) and not of MDPI and/or the editor(s). MDPI and/or the editor(s) disclaim responsibility for any injury to people or property resulting from any ideas, methods, instructions or products referred to in the content.