Article

Hotspot Detection in Photovoltaic Modules with Fiber Bragg Grating and Brillouin Distributed Temperature Sensors

by
Bartlomiej Guzowski
*,
Mateusz Lakomski
and
Dominik Bobinski
Department of Semiconductor and Optoelectronic Devices, Lodz University of Technology, 8 Politechniki Ave., 93-590 Lodz, Poland
*
Author to whom correspondence should be addressed.
Energies 2025, 18(23), 6117; https://doi.org/10.3390/en18236117
Submission received: 31 October 2025 / Revised: 17 November 2025 / Accepted: 20 November 2025 / Published: 22 November 2025

Abstract

The increasing deployment of photovoltaic (PV) installations presents critical challenges related to module safety and efficiency. Early detection of hotspots on PV modules is crucial to prevent degradation and mitigate fire risk. This study investigates the effectiveness of fiber optic sensors, specifically fiber Bragg gratings (FBGs) and distributed temperature sensing (DTS) based on Brillouin backscattering, to detect and localize hotspots on PV modules. Both sensor types successfully identified hotspot occurrences, with validation conducted through simultaneous thermocouple measurements and infrared thermographic imaging. The tests provide a comprehensive analysis of measurement methodologies, highlighting the advantages and limitations of fiber optic sensing techniques. While FBG sensors offer the most precise temperature measurements at the PV module surface, DTS systems demonstrate superior capability in hotspot detection.

1. Introduction

Solar photovoltaic technology is constantly growing and has become a key component of the clean energy transition worldwide. In 2024, the global cumulative PV market reached over 2.2 TW, with a record 600 GW of new installations, representing a 33% year-on-year growth rate [1]. The European Union aims to reach an installed capacity of 600 GW of PV by 2030 [2]. The expansion of photovoltaics means that PV installations are increasingly common on the roofs of residential and industrial buildings.
Photovoltaics offer numerous advantages from both environmental and economic perspectives. However, their main disadvantage is the association with various types of fires [3]. Intra-system problems are responsible for approximately 50% of fires in rooftop photovoltaic installations [4]. As PV technology develops, the number of such incidents also increases [5,6,7]. Statistical analyses show an average fire rate of 0.289 per megawatt installed, equivalent to 28.9 fires per gigawatt installed [4]. In the case of rooftop PV installations, there is a significant risk that fire may spread to the entire building [8], leading to substantial financial losses. Fires at large-scale photovoltaic farms are highly destructive, as they lead to severe environmental degradation. Such incidents can result in the release of toxic chemical pollutants into the atmosphere, soil, and water, cause an increase in respiratory and other health issues, and destroy extensive areas of vegetation and wildlife habitats [9]. These consequences are often difficult to reverse due to the persistence of chemical contaminants and long-term biodiversity loss. For this reason, photovoltaic monitoring and fire detection systems are continuously being developed and improved by numerous research groups [10,11,12].
One major cause of fires in PV systems are hotspots—localized regions on a module where excessive heating of photovoltaic cells occurs. When a photovoltaic cell becomes reverse-biased and starts to act as a load to surrounding cells, it consumes and dissipates power, resulting in heat generation in a small area [13]. This effect is especially dangerous as it can cause thermal runaway.
The causes of hotspots—such as high diurnal temperature swings, dirt-related partial shading, and micro-cracks within solar cells—are under constant investigation [14,15,16]. Standard methods for measuring the temperature of photovoltaic modules typically employ electrical sensors [17,18], such as thermocouples and resistance temperature detectors, or cameras for infrared thermography [19,20]. These approaches have limitations regarding real-time monitoring, response time, and spatial resolution. Thermal imaging is usually performed during manual inspection by an operator, making it a time-consuming process for large-scale PV installations. This is one reason why drones equipped with thermal cameras are considered advantageous [21] for measuring temperatures over extensive areas, offering speed and safety unattainable with manual inspection. However, drones cannot operate under all weather conditions, and their operational time is limited by battery capacity [22].
Hotspots in photovoltaic modules can also be detected electrically by analyzing operating parameters such as impedance [23], module current and voltage [24]—changes in the output current trajectory and unusual voltage drops indicate areas of excessive heating. In practice, techniques such as impedance analysis or comparison of currents between sub-modules are used to quickly identify local anomalies. The main disadvantages of using electrical behavior analysis to detect hotspots in PV modules are the low resolutions of the problem locations. Moreover, this method is prone to false indications in the presence of other defects, such as connection degradation, which also affect the electrical signal [25].
Fiber optic sensors, on the other hand, offer high sensitivity, small footprints, immunity to high temperatures, flexibility, and outstanding multiplexing capabilities, making them extensively used in a variety of applications such as structural health [26,27], strain, and temperature monitoring [28]. These sensors are also deployed to measure the temperature of photovoltaic modules [29,30]. Two main types of optical sensors considered for PV modules temperature monitoring are Fiber Bragg Grating [31] sensors and distributed temperature sensors [32]. Principle of operation of FBGs and Raman or Brillouin DTS is well known and it was described in numerous scientific papers [33,34]. The FBG sensing technique is based on the Bragg reflection principle, where a periodic modulation of the refractive index within the optical fiber core reflects a narrow spectrum of the incident broadband light. The value of the specific, reflected Bragg wavelength vary with temperature and mechanical strain. Consequently, shifts in the reflected wavelength provide a precise, localized measure of these quantities. Raman and Brillouin distributed temperature sensing systems measure temperature by launching laser pulses along an optical fiber and analyzing the backscattered light. FBG sensors are point sensor, but several can be connected in series—each with different central wavelengths—to form a sensing string [35]. This arrangement allows for multi-point temperature measurement and spatial temperature distribution analysis across a PV module. However, for large-scale installations comprising thousands of PV modules, the FBG approach is less suitable due to the high cost and complexity of deploying a large number of sensors [36]. Raman or Brillouin distributed temperature sensing method systems enable linear sensing over distances of several kilometers [37,38]. The typical spatial resolution for such systems ranges from about one meter in conventional systems to a few centimeters with advanced techniques [39]. However, as the sensing range increases, spatial resolution generally decreases, resulting in fewer measurement points per PV module [40]. This compromises the ability to detect and accurately locate hotspots.
In this paper, a comparative experimental study of DTS and FBG sensors was carried out to determine hotspots on PV modules. Real-time, continuous assessments of spatial temperature distribution on a PV module were performed and validated against thermocouple measurements and infrared imaging. The influence of factors such as proximity to the hotspot and cable sensor construction was examined. Both sensing approaches were systematically characterized. The findings indicate that FBG sensors provide thermal hotspot characteristics that are just as accurate as thermocouples; however, their effective sensing range is limited to 10 cm. Conversely, DTS technology facilitates detection and localization of hotspot regions on the photovoltaic module, though its sensing performance is highly dependent on the sensor’s structural design.

2. Materials and Methods

2.1. Sensor Distribution

During the research, two optical fiber temperature measurement techniques were employed: the first utilized FBGs, while the second was based on the Brillouin distributed temperature sensing method (BDTS). In the first case, three fiber Bragg gratings (Network Group) were used characterized by: central wavelength (1540–1560 nm), spectral width FWHM (<400 pm) and reflectivity (>60%). The FBGs were made on G.652.D optical fiber and secured by UV curable acrylate. In the second case, two types of optical fiber were examined: bare optical fiber with 0.25 mm primary acrylate coating (Corning SMF28e+, G.652.D) and loose tube type optical cable with a polyethylene (PE) jacket (KDP G.657.A2, 2.5 mm outside diameter). As a thermocouple, we selected the self-adhesive Omega SA1XL-K-120 (USA) surface thermocouple, which features Kapton/fiberglass junction insulation. The nominal thickness of the bare sensing element is only 25.4 µm. The thermocouples were mounted directly onto the PV module.
The FBGs were attached on the front of PV module with a 1 mm-thick layer of thermally conductive grease (Thermosilver with thermal conductivity k = 6 W/mK). The FBGs were not glued to the PV module to minimize potential strain in structures. The FBGs were coated with a 2 mm thick layer of UV-curable acrylate. It is assumed that the FBGs are positioned in the middle of this layer, which has a thermal conductivity of 0.19 W/mK.
DTS lines, including cable and bare optical fiber, were put on the surface of the PV module and glued only in 2 points per line to the outside frame. Taking into account that the PV module was placed horizontally during all tests and the hot plate was moved under PV module, the influence of the external strain on the sensors could be neglected
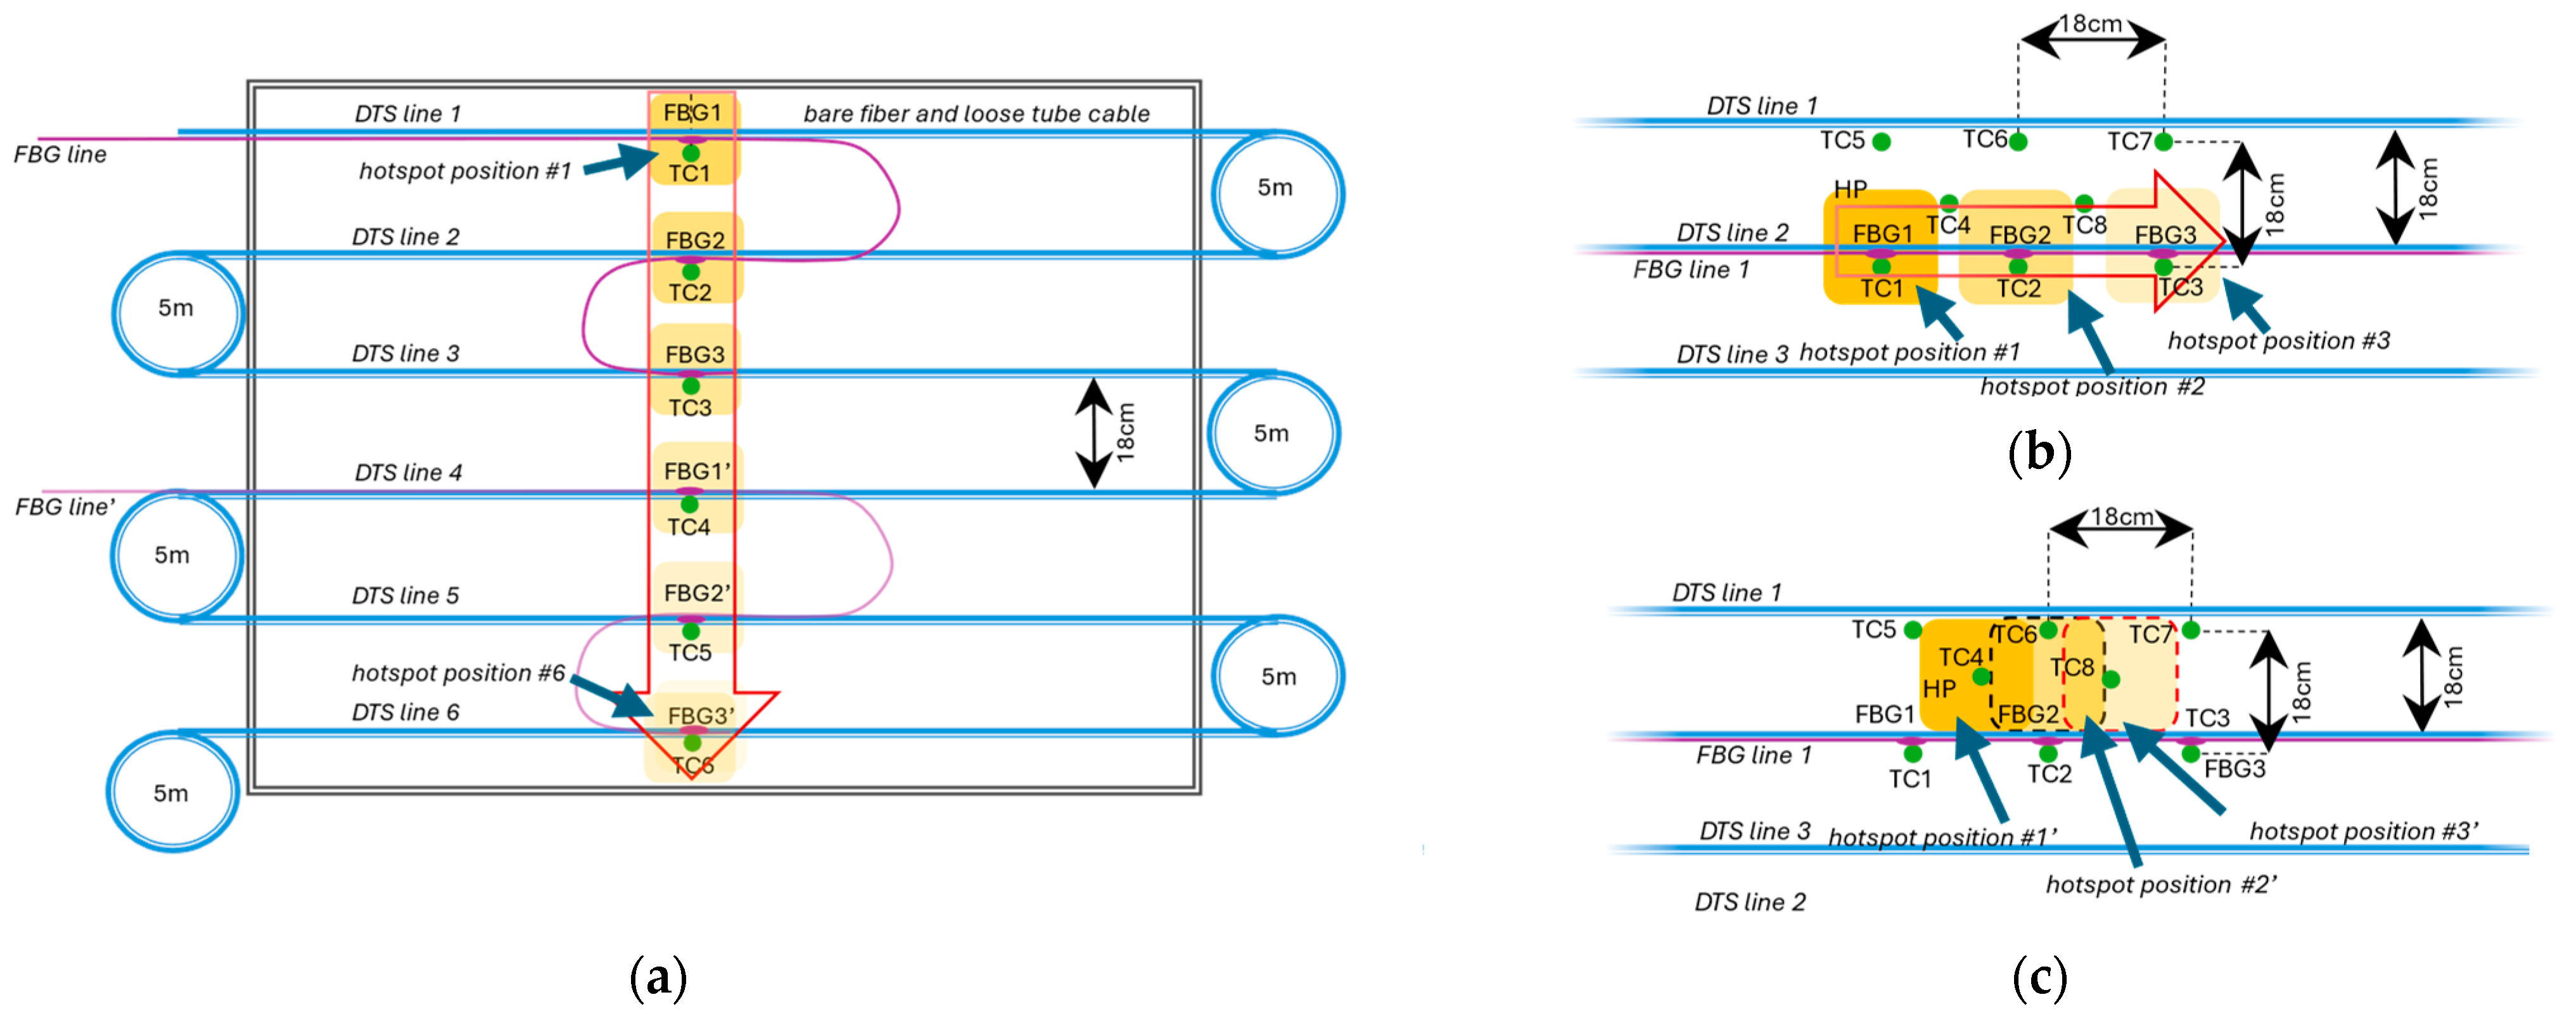
During the test, optical fibers were placed above the spaces between photovoltaic cells to prevent potential shadowing of the cells and interference with the operation of the PV module. Since the cell width is 18 cm (length is 9 cm), six parallel optical fiber lines were placed, with 18 cm spacing including bare fiber and loose tube cable, on the PV module (Figure 1a). A distribution of the optical fiber for FBG and BDTS with reference thermocouples (TC) sensors on the PV module is presented in Figure 1. Two measurement configurations were considered, named as transverse and horizontal in order to fully characterize the sensing potential. In the first case (Figure 1a), three FBG sensors and six thermocouples were positioned along the central axis of the PV module. The positions of FBGs were changed from the points FBG1-FBG3 to the points labeled FBG1′-FBG3′ to fully cover all investigated lines. During the transverse test, the position of the hot plate beneath the PV module was changed from position #1 to position #6 (Figure 1a).
In the second case (Figure 1b,c), the same point sensors (FBG and TC) were placed horizontally with an 18 cm spacing. In order to investigate the spatial detection ability of sensors, the hot plate was placed in six positions from #1 to #3 with an 18 cm spacing (Figure 1b), and from #1′ to #3′ with a 9 cm spacing (Figure 1c). For better separation of subsequent temperature lines, the necessary 5 m long buffers on bare fiber and loose tube cable were used.
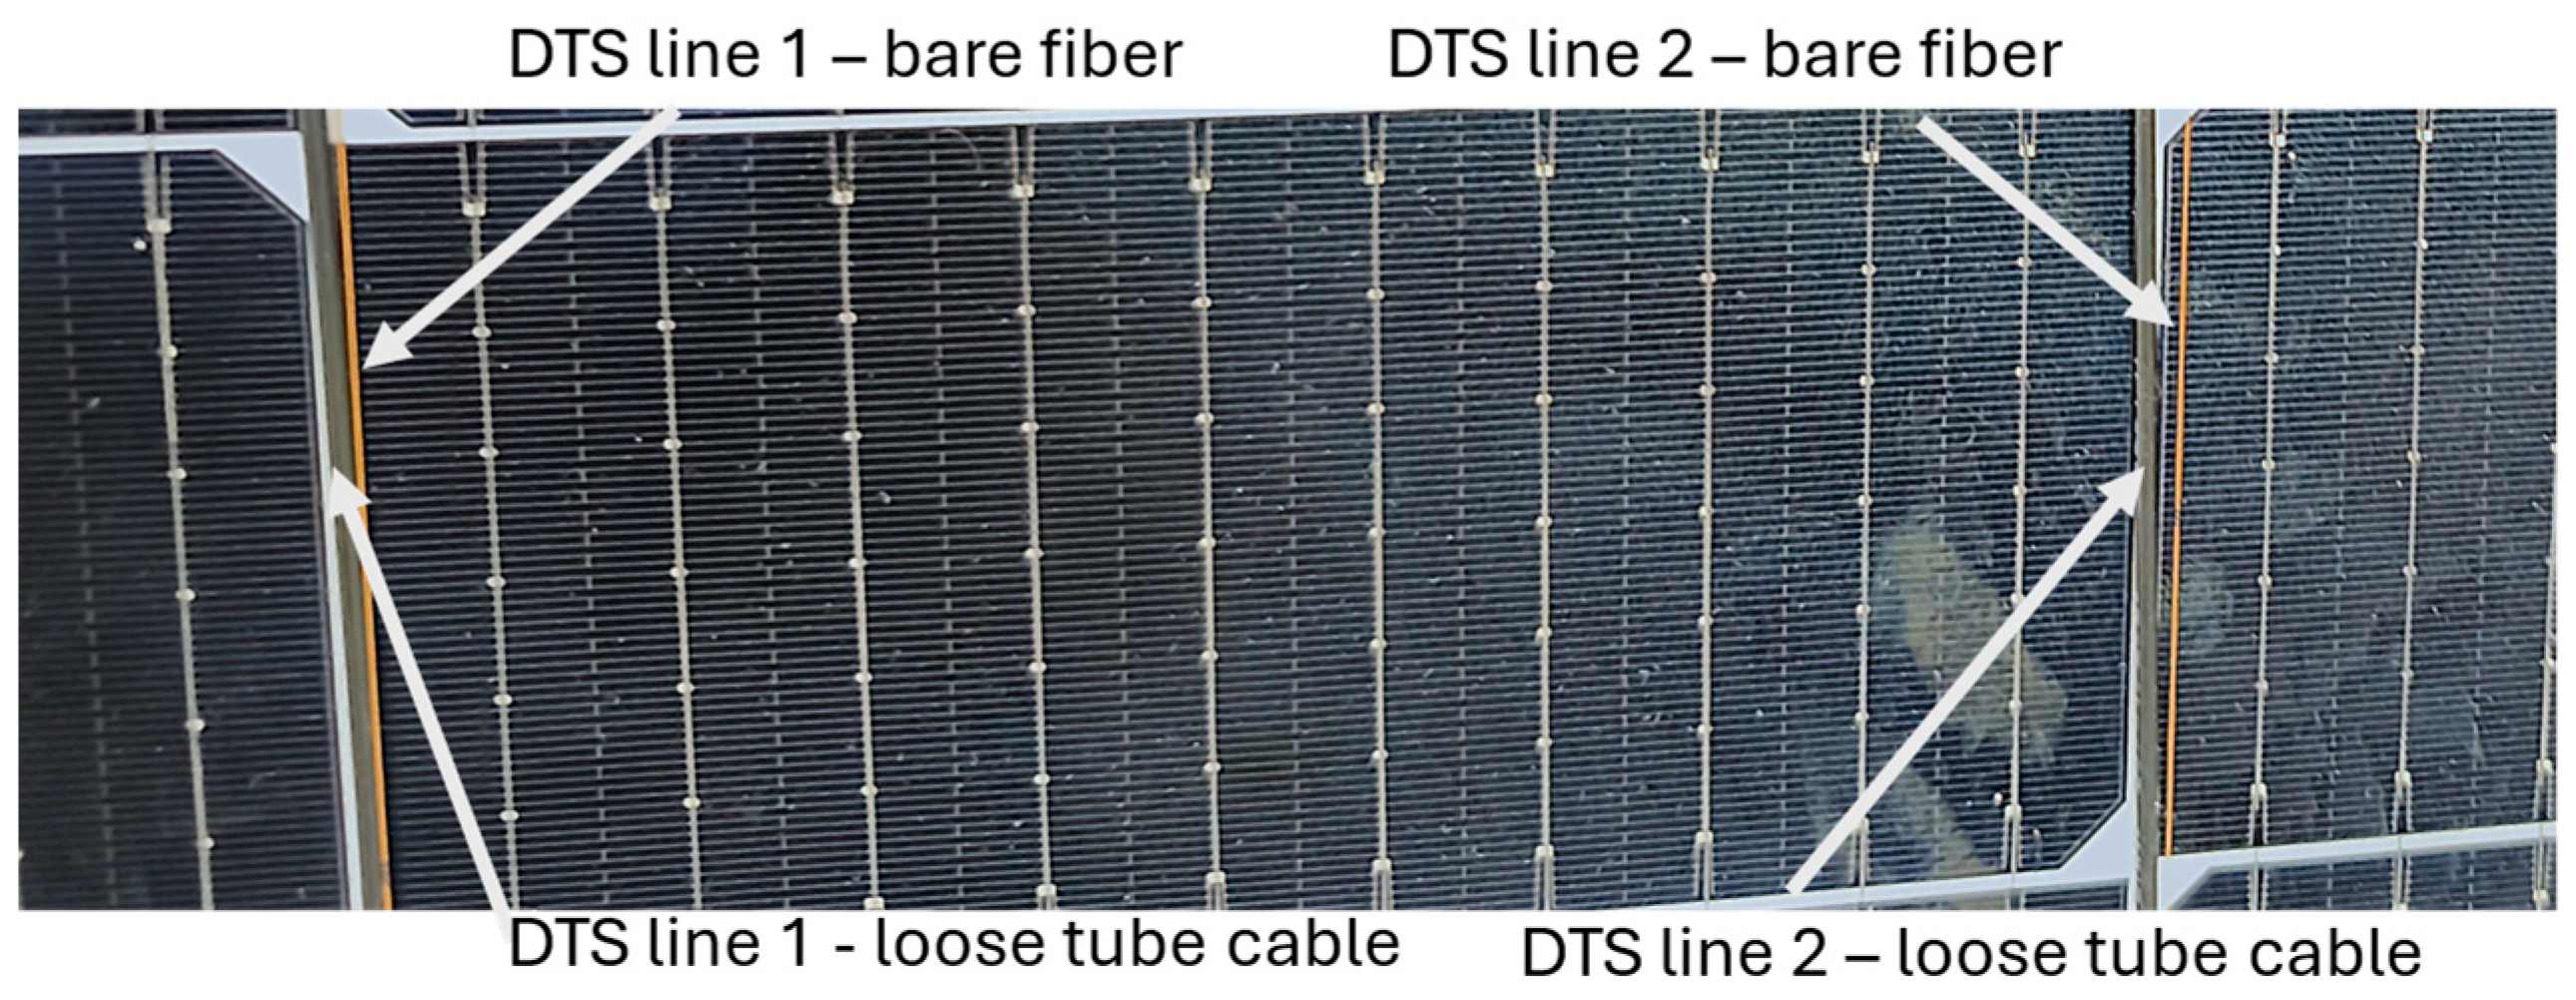
Figure 2 shows optical fibers (bare fiber and loose tube cable) placement on the top surface of PV module. A digital hot plate (Stuart, SD160) was placed against the underside of the PV module to simulate hotspot formation. It features an aluminum-silicon alloy plate measuring 160 × 160 mm, which closely matches the width of a single photovoltaic cell and provides precise control and predictability for both the hotspot location and temperature settings.

2.2. Measurement Setup

For the tests, the high-power bifacial monocrystalline photovoltaic module (Risen, RSM144-9-540BMDG-560BMDG) was used. This module is typically deployed in large-scale commercial and industrial photovoltaic installations. It consists of 144 cells, each measuring 9 × 18 cm, with a total rated power of 540 W. In order to simulate hotspot formation without damaging the PV module the temperature of hotplate was set to 90 °C, since the maximal operational temperature of PV module is 85 °C.
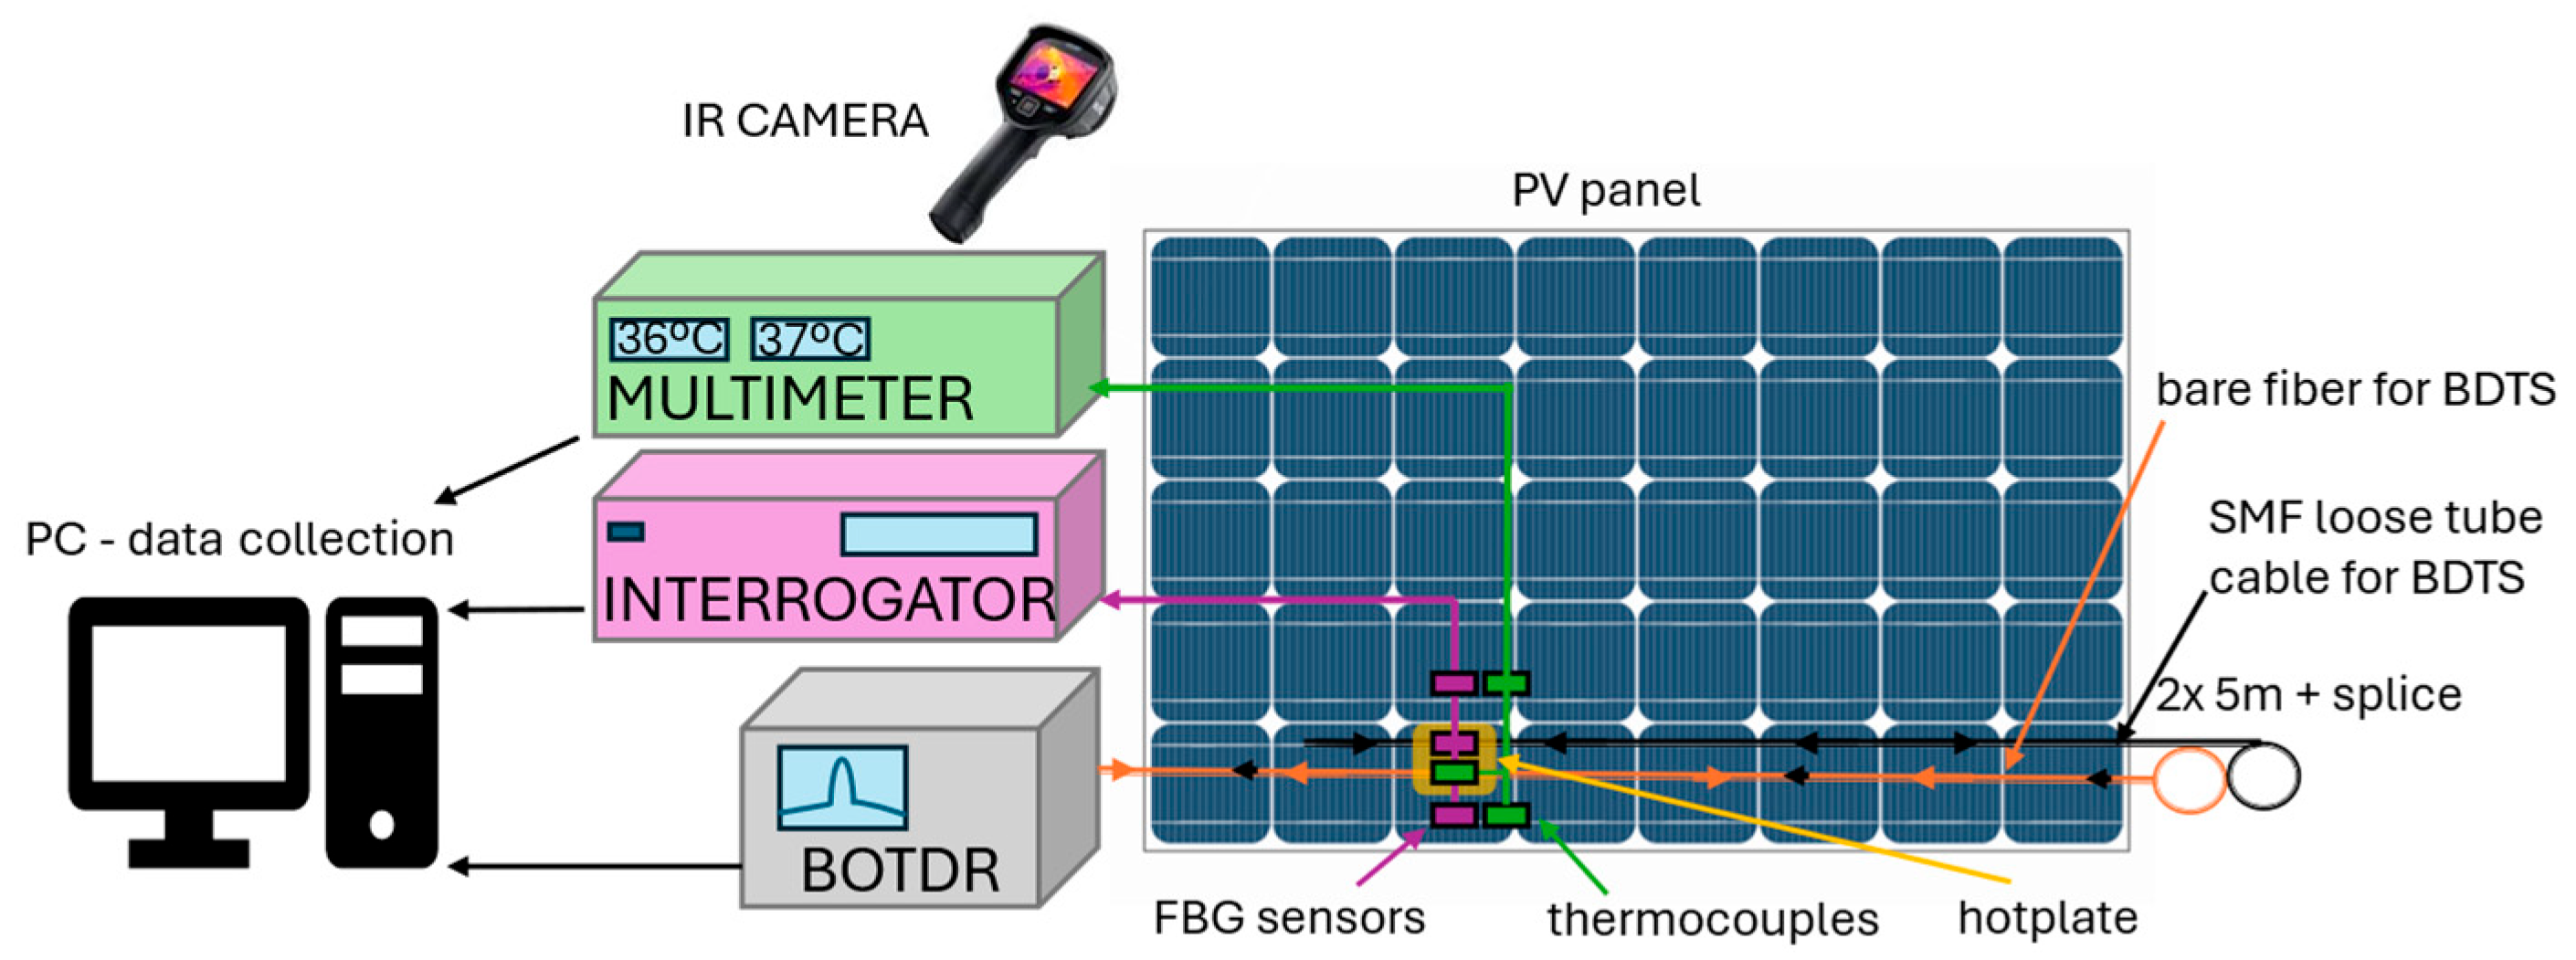
The reference measurements were performed with Keithley Data Acquisition and Multimeter System (DAQ6510) with Differential Multiplexer Module (7708) and eight K-type thermocouples (Omega, SA1XL-K-120). The temperature distribution on PV module was also investigated with IR camera FLIR E75. Measurement setup is presented in Figure 3.
The point temperature measurements of FBGs were performed using optical interrogator (Sentea DM-4120). In the conducted experiments, equipment was operated in the 1520–1610 nm spectral range and simultaneously measurement of three FBGs connected in series were carried out. The system offers a sampling rate up to 1 kHz, and wavelength resolution of 1 pm, corresponding to a temperature resolution lower than 0.1 °C. The assumed temperature coefficient for the bare FBG was equal to 10 pm/°C based on the FBG datasheet provided by manufacturer.
The distributed temperature measurement along the optical fiber path was carried out using a Brillouin Optical Time Domain Reflectometer (BOTDR, OZOptics). This technique relies on the analysis of spontaneous Brillouin backscattering, which arises from the interaction between incident optical pulses and acoustic phonons within the optical fiber core. The measured Brillouin frequency shift is directly dependent on local temperature and strain, enabling distributed sensing along the entire fiber length [41,42]. In this study, the BOTDR system operating at a wavelength of 1550 nm was employed, offering a maximum sensing range of up to 30 km, step resolution of 0.5 m and a temperature accuracy of ±1 °C. The temperature sensitiviti of the Brillouin shift were equal to 1.1 MHz/°C and 1.27 MHz/°C, respectively, for the used bare fiber and loose tube type cable [43].

3. Results

3.1. Thermocouples

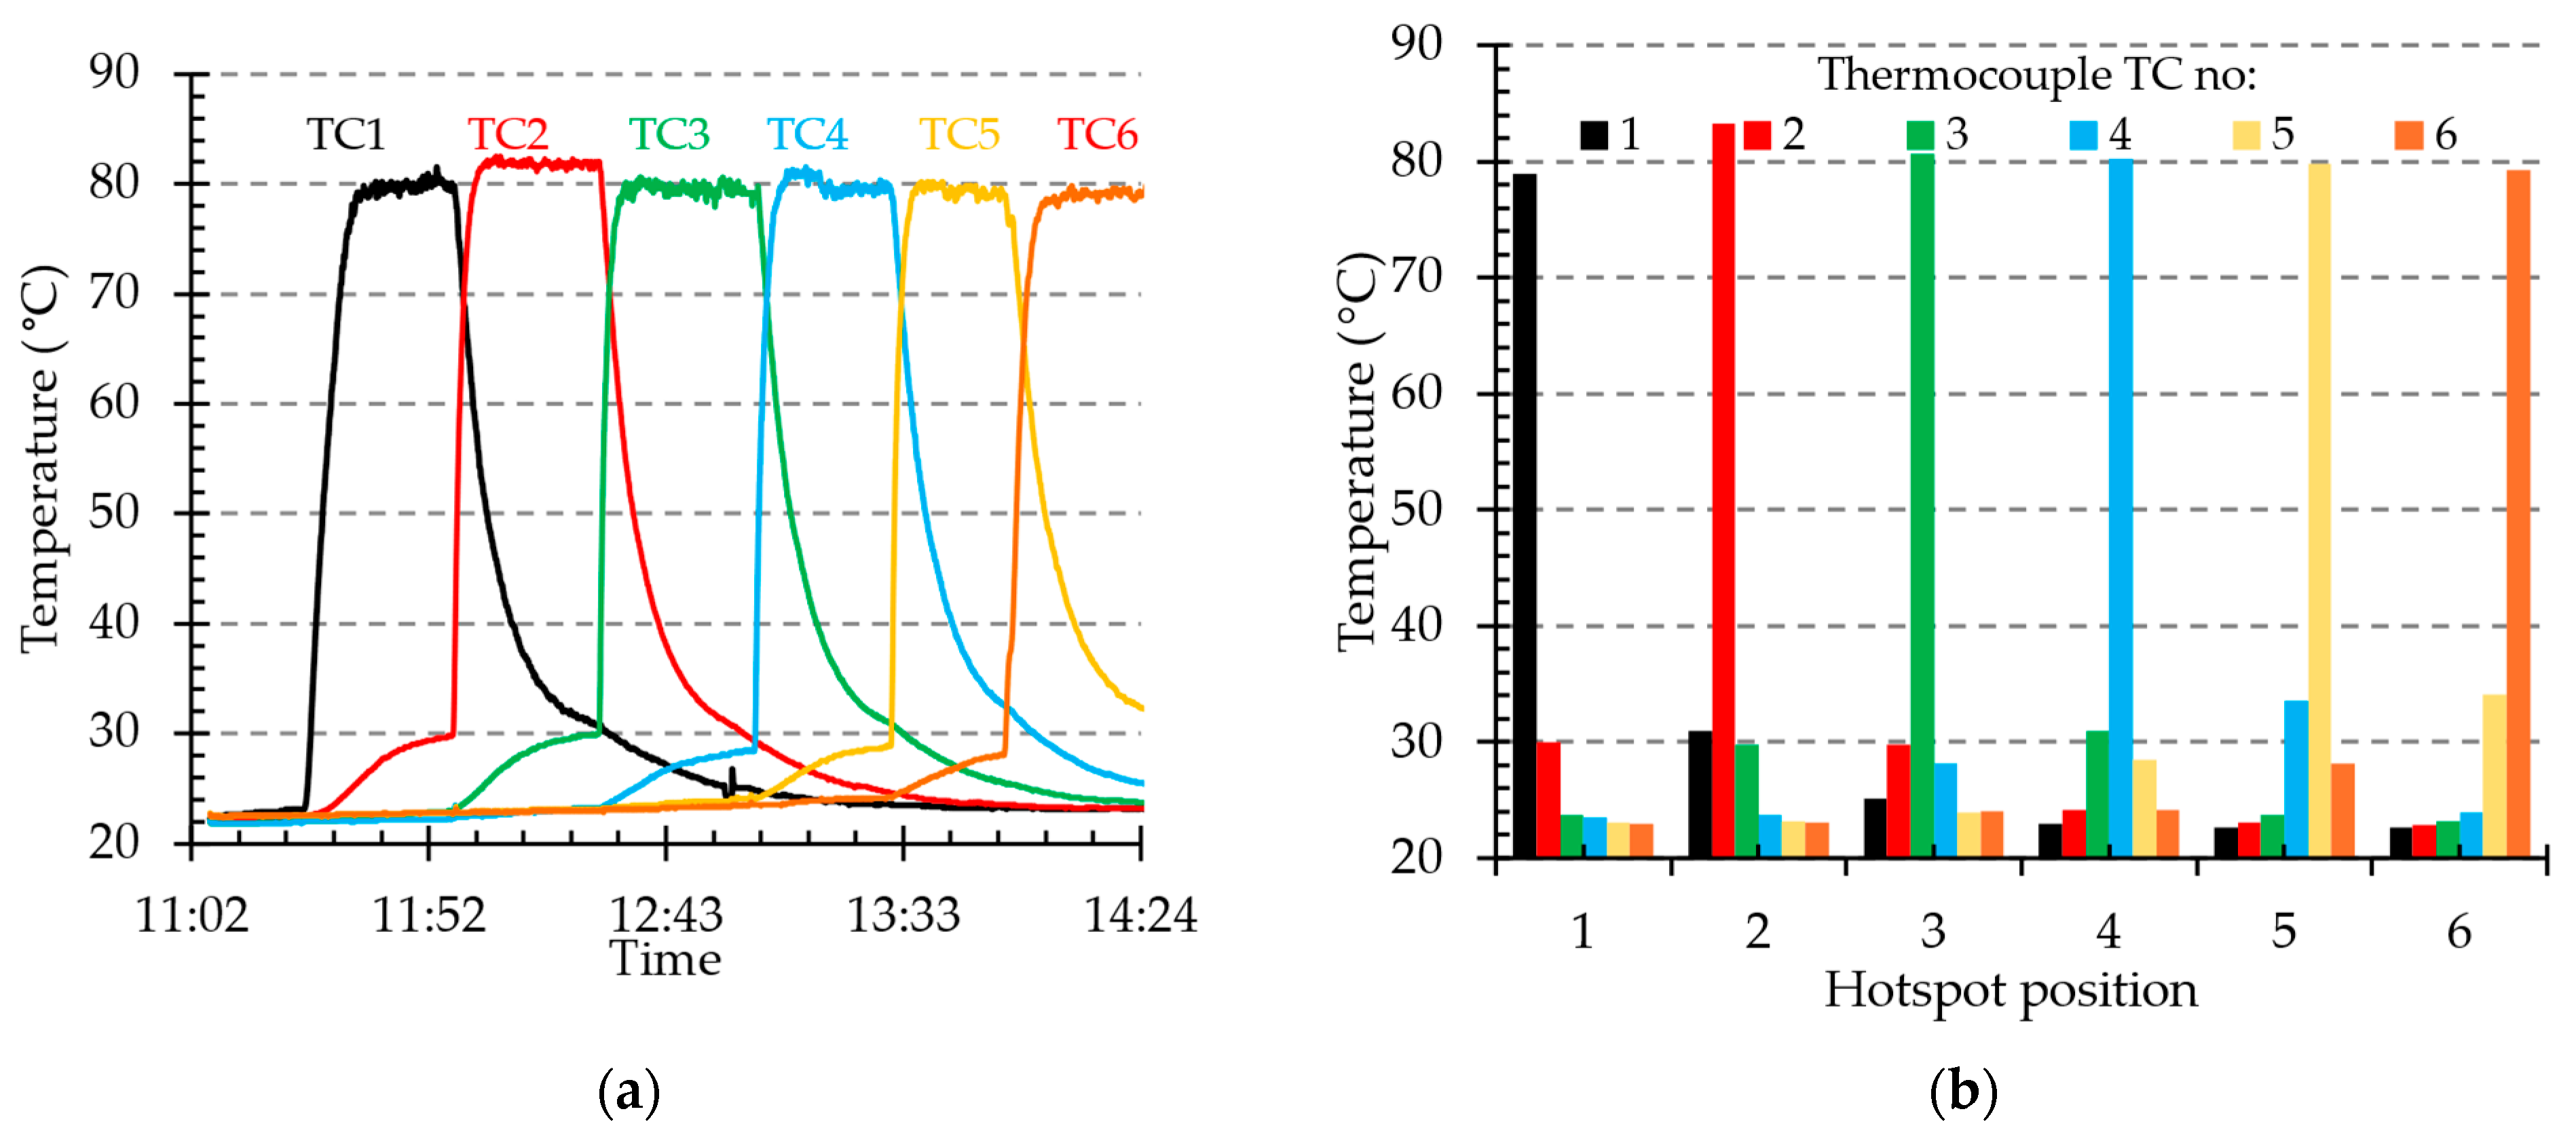
The temperature results presented in Figure 4a correspond to six thermocouples (T1–T6) linearly distributed along the surface of the PV module. Each thermocouple exhibits a characteristic temperature rise when the hotspot is positioned directly beneath it, followed by a gradual decay as the heating source moves to the next location. The peak temperatures recorded by the sensors vary slightly, ranging from 79.3 °C to 83.3 °C, with a mean value of 80.4 °C. Considering that the hotplate was set to 90 °C, the discrepancy of 9.6 °C can be attributed to several factors, such as heat conduction within the PV module, air convection above the hotspot, and imperfect thermal coupling between the hotplate and the module surface, as well as between the thermocouple and the PV module. This could result from surface roughness, air gaps, or the low thermal conductivity of the PV module’s cover.
The thickness of the PV module is 5.15 mm, consisting of two layers of 2 mm thick glass (thermal conductivity 1 W/mK), two 0.5 mm EVA foil layers (0.4 W/mK), and a 0.15 mm silicon cell (148 W/mK). Since the area of the PV module is 2.56 m2, the total thermal resistance R t h of the panel is 0.0025 K/W. However, a larger contribution to the total thermal resistance comes from the spreading thermal resistance and the convective resistance. At the same time, the equivalent thermal conductivity of the panel is quite low, so the heating plate does not require high power to maintain a stable temperature. According to calculations, less than 35 W is needed, corresponding to a temperature difference of about 9 K. A secondary observation concerns the influence of preheating on adjacent thermocouples. Each subsequent temperature rise occurs slightly before the hotspot reaches the corresponding position, with a measurable increase of up to 8 °C above ambient (Figure 4a). This lateral heat transfer indicates a thermal conduction length of at least 10 cm, consistent with the known thermal diffusion properties of glass and EVA encapsulant layers.
This heat transfer within the PV module is also clearly visible in Figure 4b. When the hotplate is placed at positions 2 to 5, a temperature rise (up to 8 °C) is also recorded by the thermocouples surrounding these positions. This enables approximate localization of the hotspot on the module surface. The temperature decay observed after each heating stage follows an exponential trend typical of passive cooling through radiation and conduction. The repeatability of the heating–cooling sequence across all sensors confirms both the stability of the experimental setup and the uniformity of the module’s thermal properties.
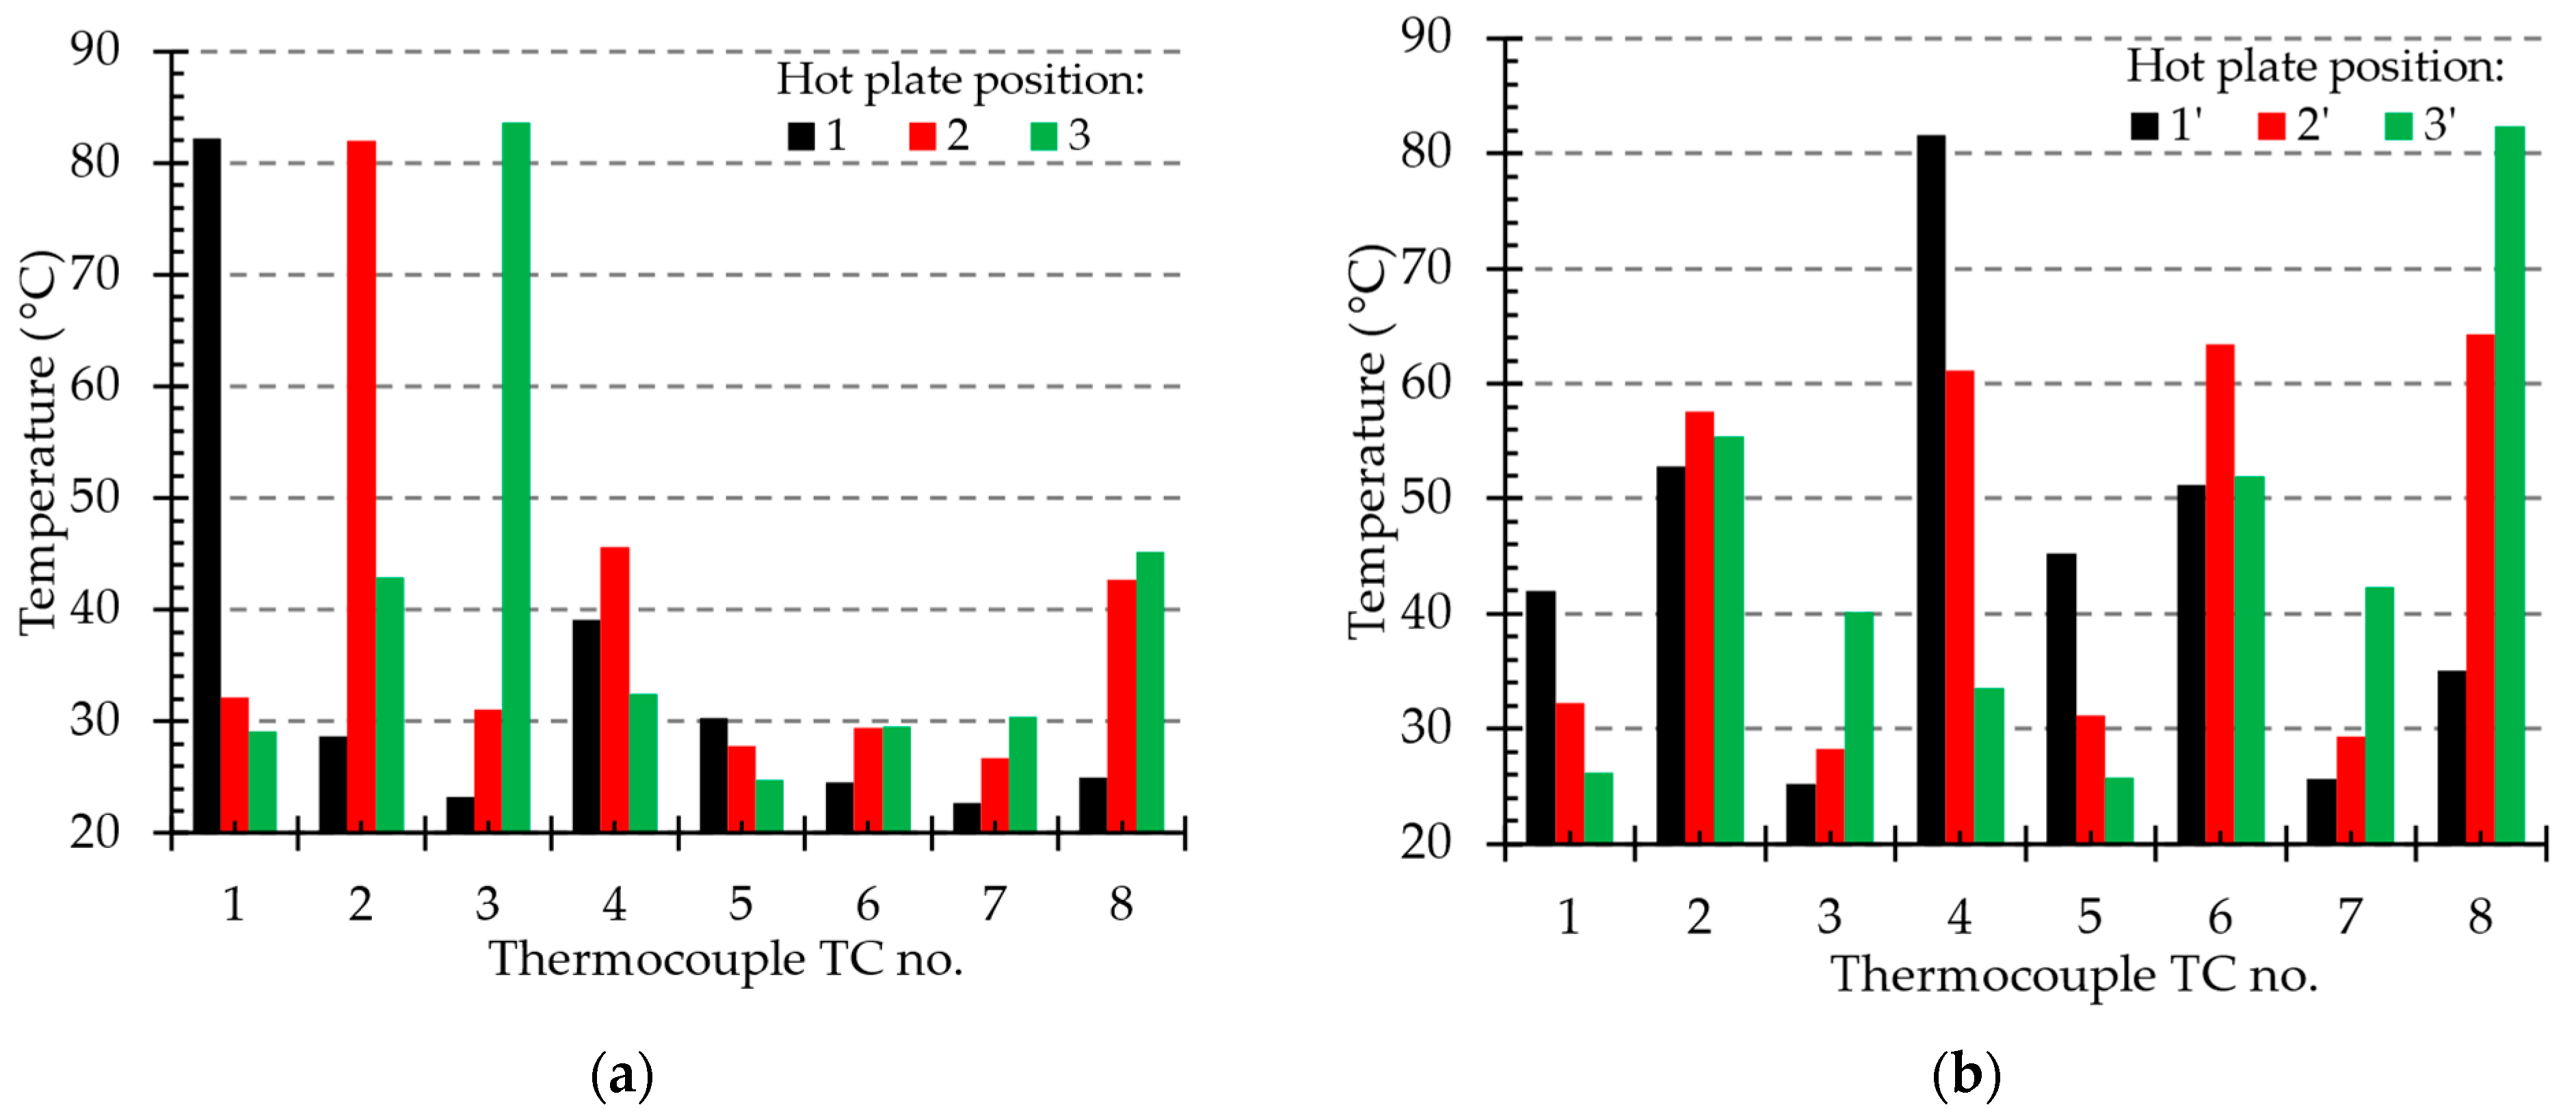
Figure 5 illustrates the results obtained during the horizontal tests (the hot plate and sensor positions are shown in Figure 1b,c). When the hot plate was placed directly under the DTS and FBG lines at position #2 (Figure 1b), the highest temperature (82.1 °C) was recorded by TC2, which was placed directly above the hot plate. Thermocouples TC4 and TC8, located 2 cm from the hot plate edge, detected temperatures around 44 °C. TC6, positioned 10 cm from the hotspot edge, measured approximately 30 °C, while TC5 and TC7, at 14 cm from the hotspot edge, recorded temperatures near 27 °C (Figure 5a).
The results shown in Figure 5b provide temperature information recorded on the top surface of the PV module when the hot plate was placed between the DTS and FBG lines and shifted by 9 cm, which corresponds to the width of a single cell (see Figure 1c). When the hot plate was at position #1′, TC4 was above the center of the hot plate and recorded 81.6 °C. Due to the poor thermal conductivity of the module materials, the temperature measured by TC4 dropped by 20.5 °C to 61.1 °C when the hotspot position shifted by 9 cm to position #2′, and further dropped to 33.6 °C with another 9 cm movement of the hot plate to position #3′.
The results show that the temperature recorded by thermocouples placed 10 cm from the edge of the hotspot can be approximately 50 °C lower than the temperature measured at the hotspot center. Fast temperature drop on the PV module’s top surface is also confirmed by TC8, which recorded 35.1 °C when the hot plate was in position #1′. This implies that to accurately detect and localize the hotspot on a PV module, a dense mesh of thermocouples must be used.

3.2. Fiber Bragg Grating

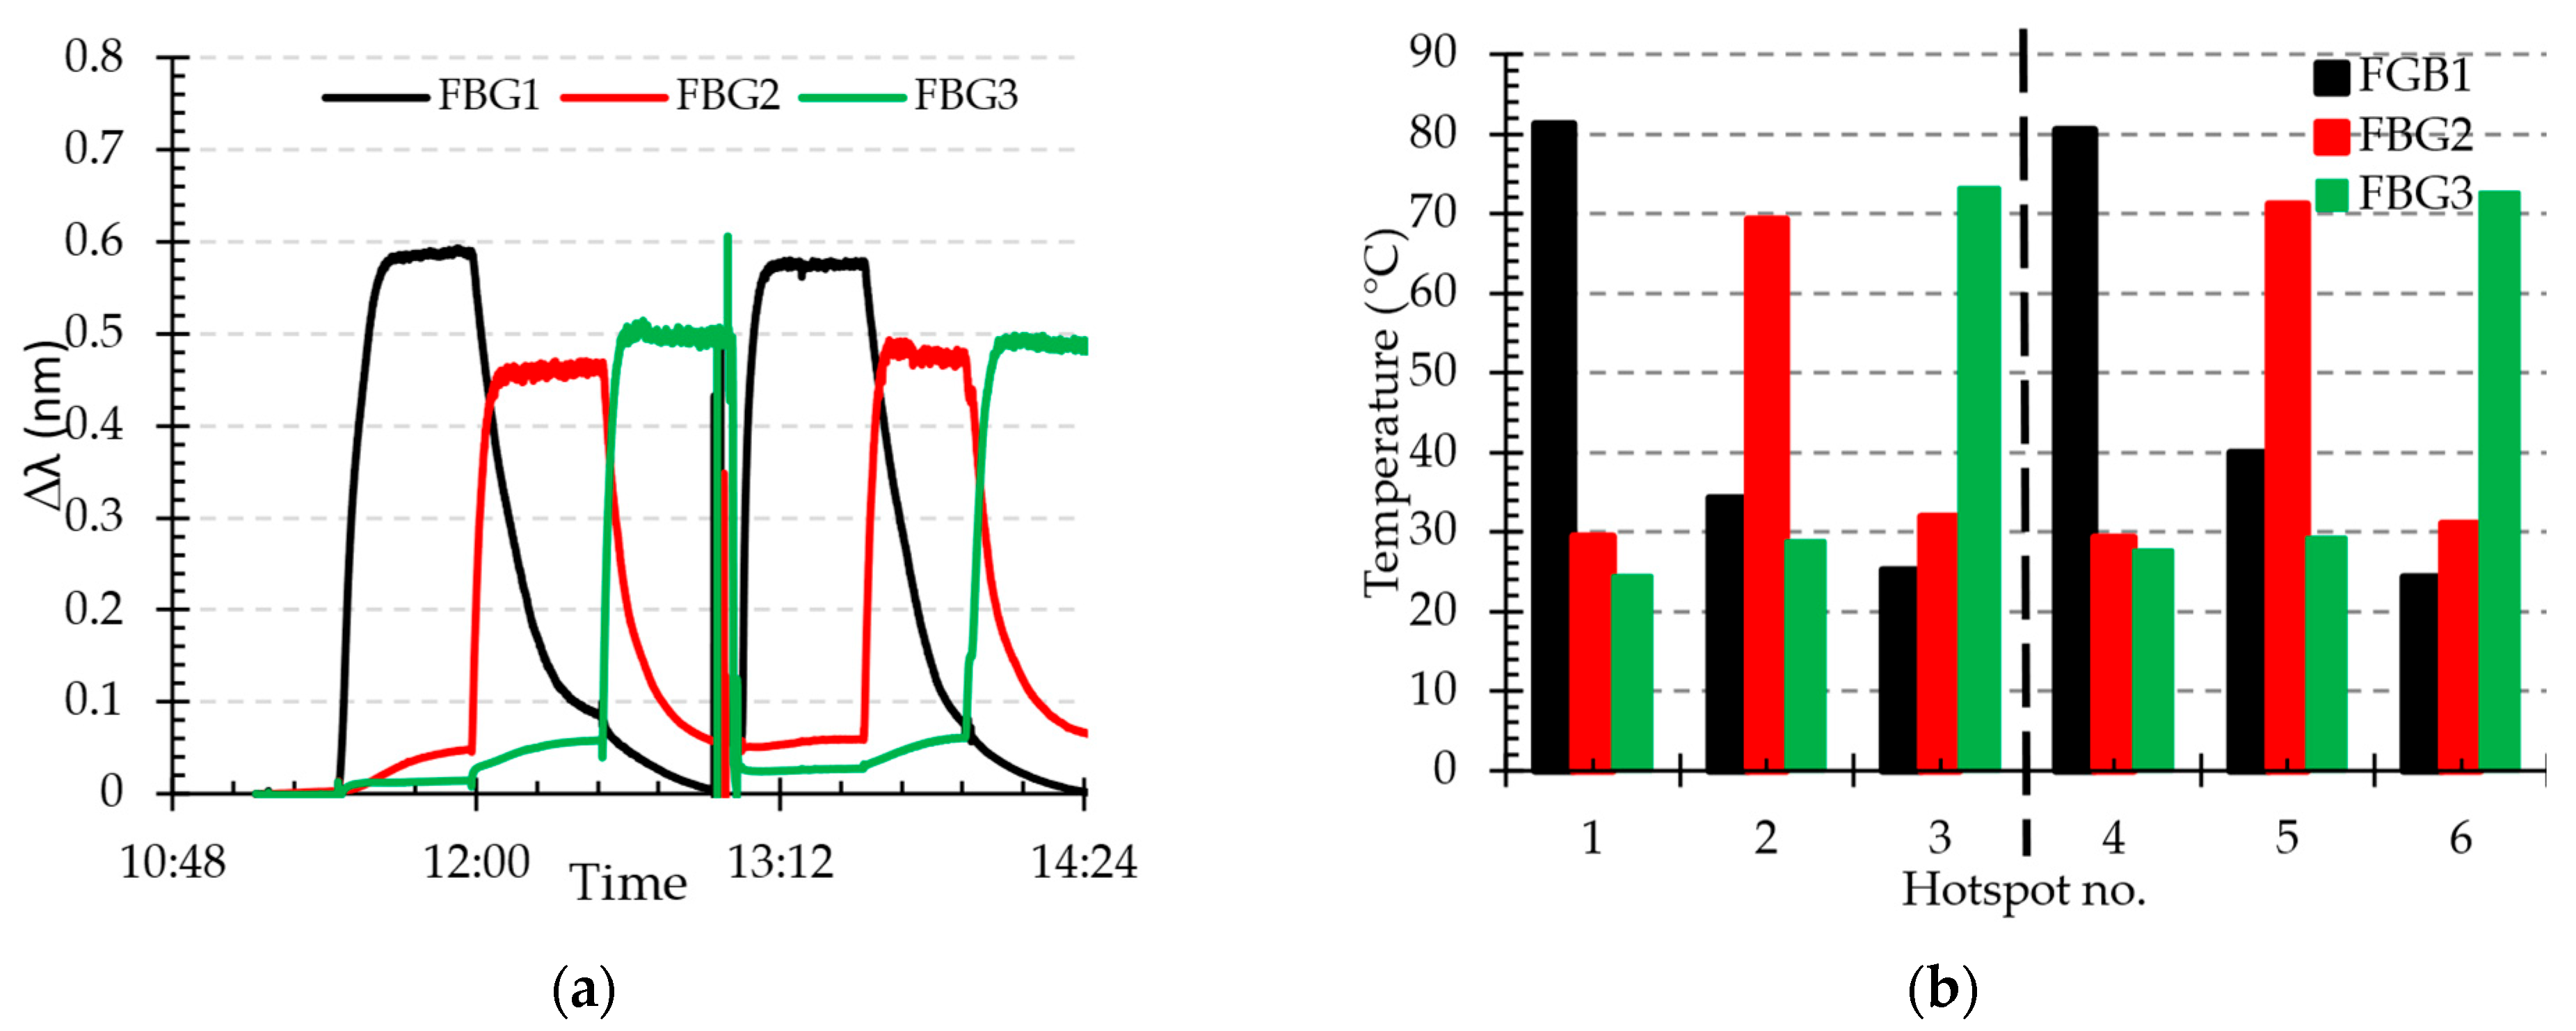
The temperature measurements for the transverse FBG configuration are shown in Figure 6a. The central wavelength (CWL) varies with temperature due to the hotspot, and adjacent sensors also respond, exhibiting increased CWL values. Figure 6b presents the stabilized maximum values for each hotspot location, derived using the assumed temperature coefficient. While the measured surface temperature was 74.7 ± 4.96 °C, the discrepancy reached 15.3 °C. Compared with thermocouples, these results are superior. However, the maxima across the six FBG positions ranged from 69.3 °C to 81.2 °C, indicating potential non-repeatable mounting conditions on the module surface. Another contributing factor may be the strain component affecting FBG operation, since the overall CWL drift depends on both ambient temperature and axial strain. This cross-sensitivity is well known in FBG sensing and arises from thermal expansion and the thermo-optic effect, as well as strain transfer effects from the host structure. This behavior is evident when comparing the two FBG lines separately. After displacing one FBG line, the maximum measured temperature shows an absolute difference between sensors of less than 2 °C.
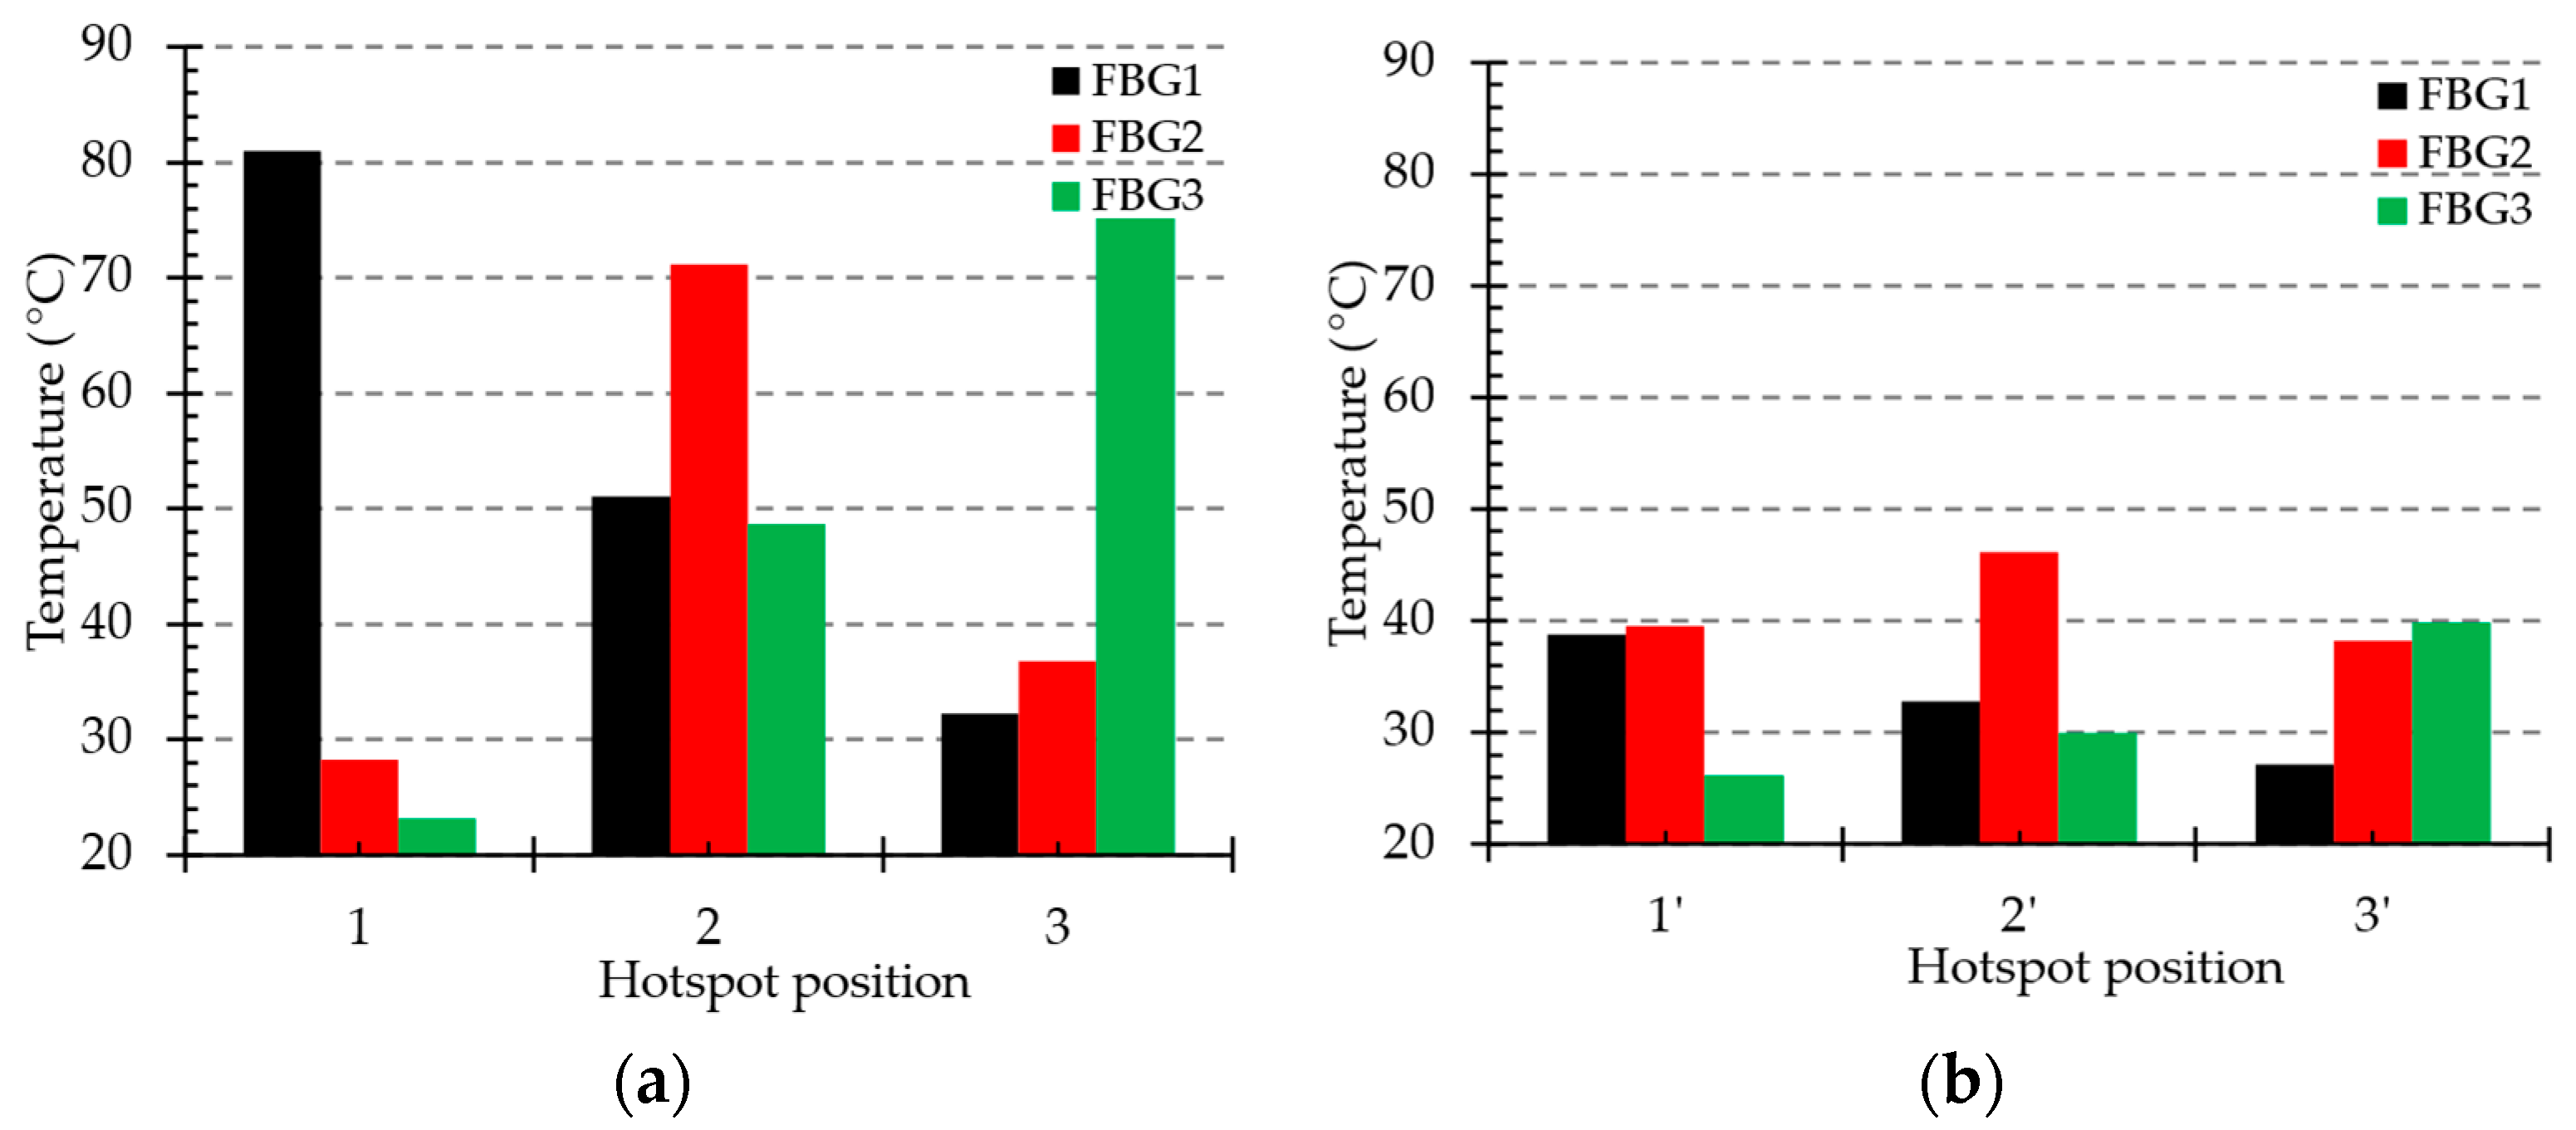
The results of three FBGs in a horizontal configuration are shown in Figure 7. In the first case, the hot plate was placed directly under the fiber Bragg grating, and the maximum temperatures achieved are consistent with those observed in the transverse configuration, as expected. In the second case, the hot plate was moved 2 cm away from the FBG line. Moreover, for the 1′ and 3′ positions, the hot plate was also placed between two adjacent FBGs, as shown in Figure 1c. The measured temperature decreased to a maximum of 46.1 °C at the 2′ position, since the FBGs were actually located outside the hot plate position but still within the temperature distribution area on the PV module. The results for the 1′ and 3′ locations are almost uniform for each pair of FBGs, confirming that the hotspot was placed between these two sensing points. This also demonstrates that hotspot localization is achievable using FBG sensors.

3.3. Distributed Temperature Measurement

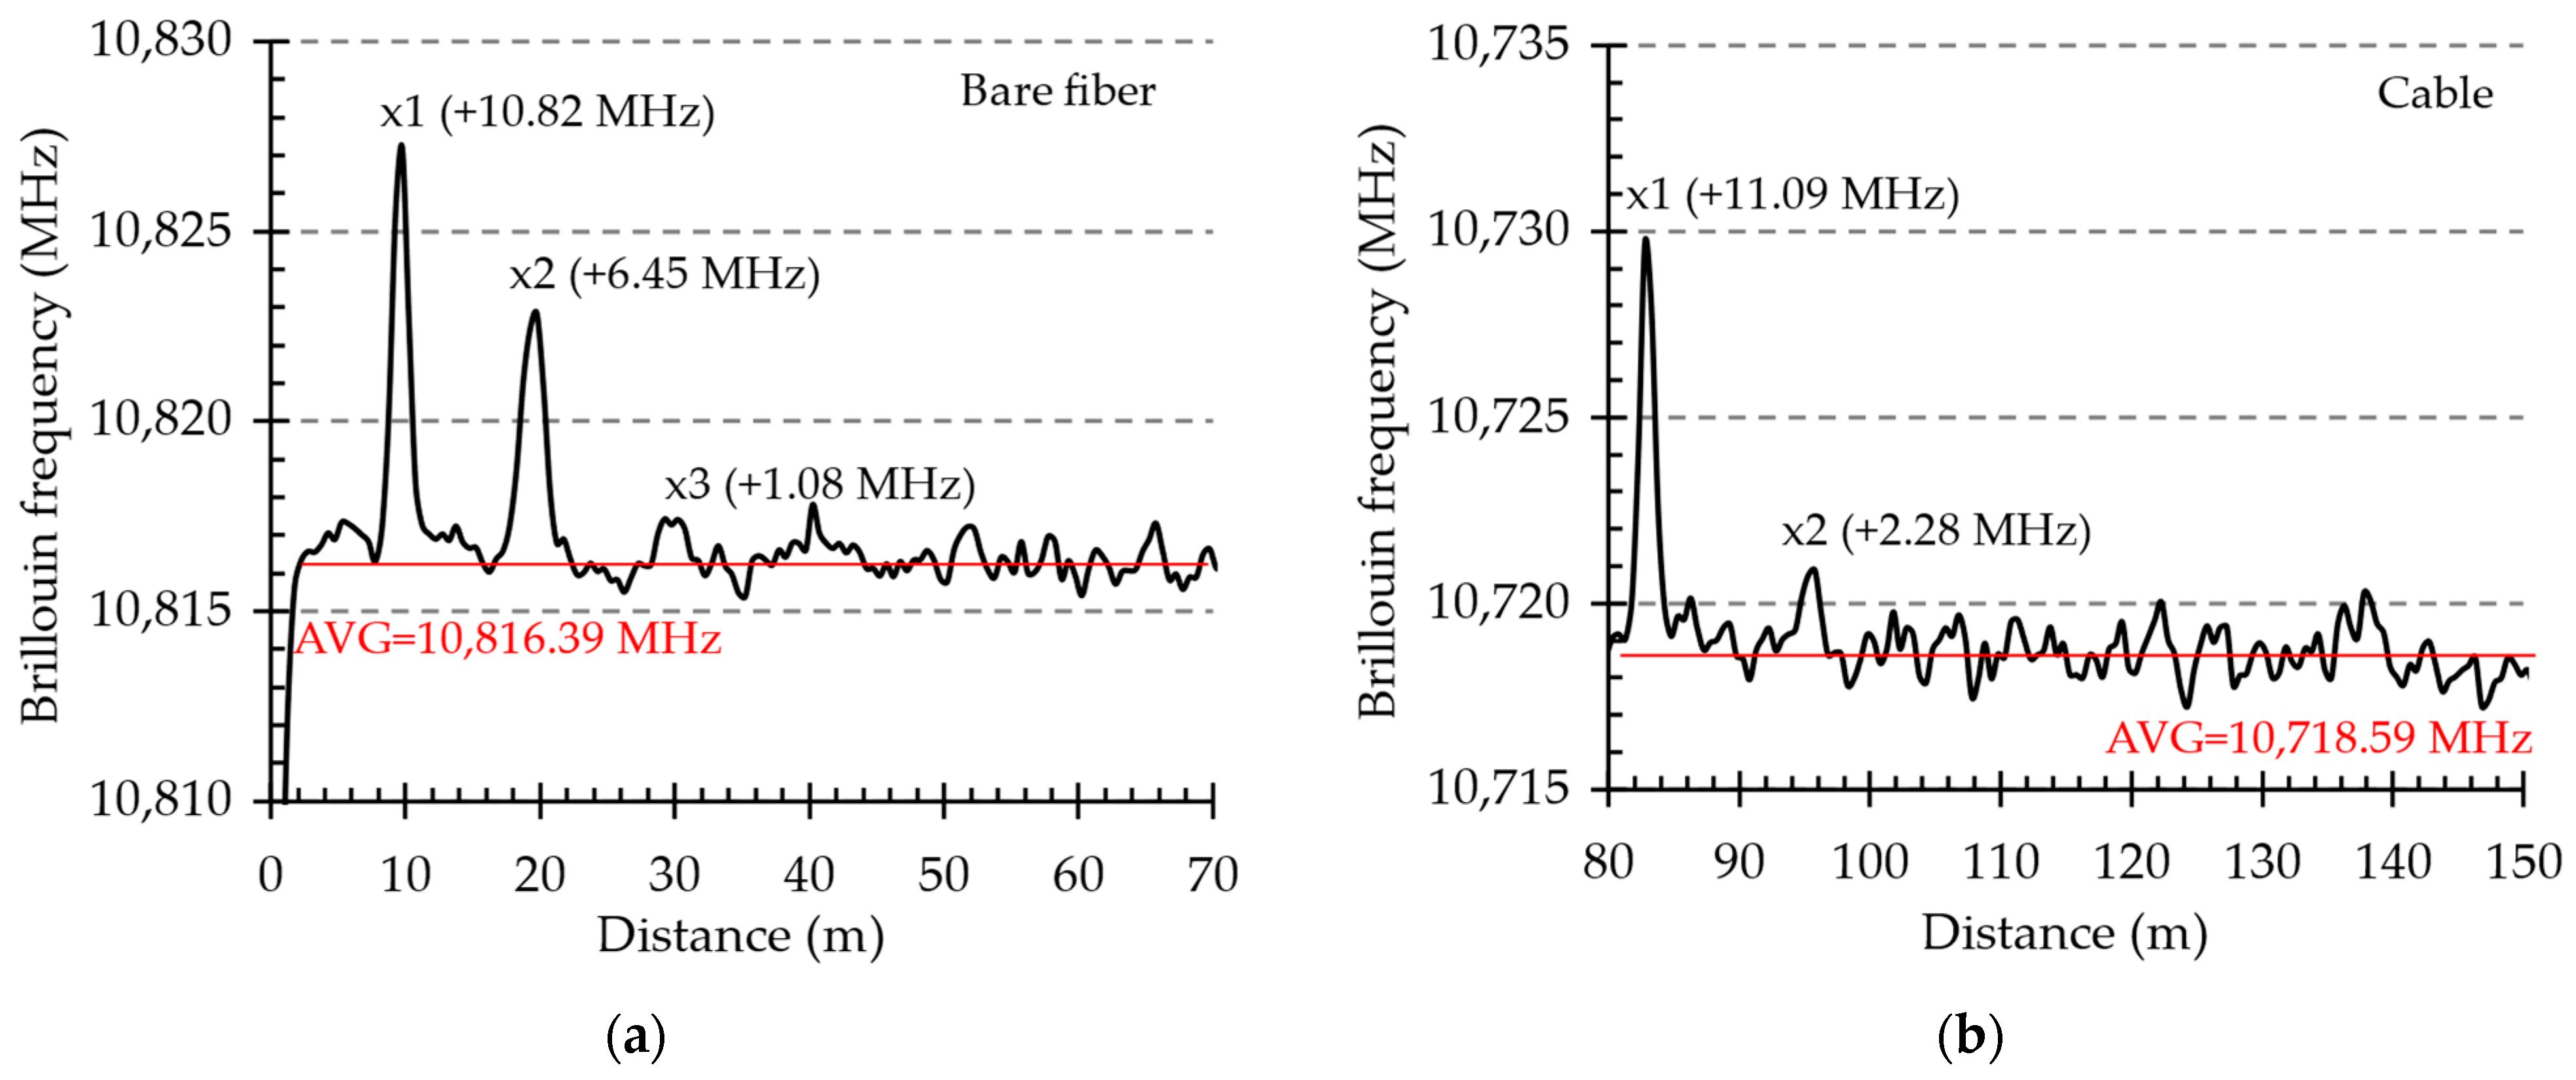
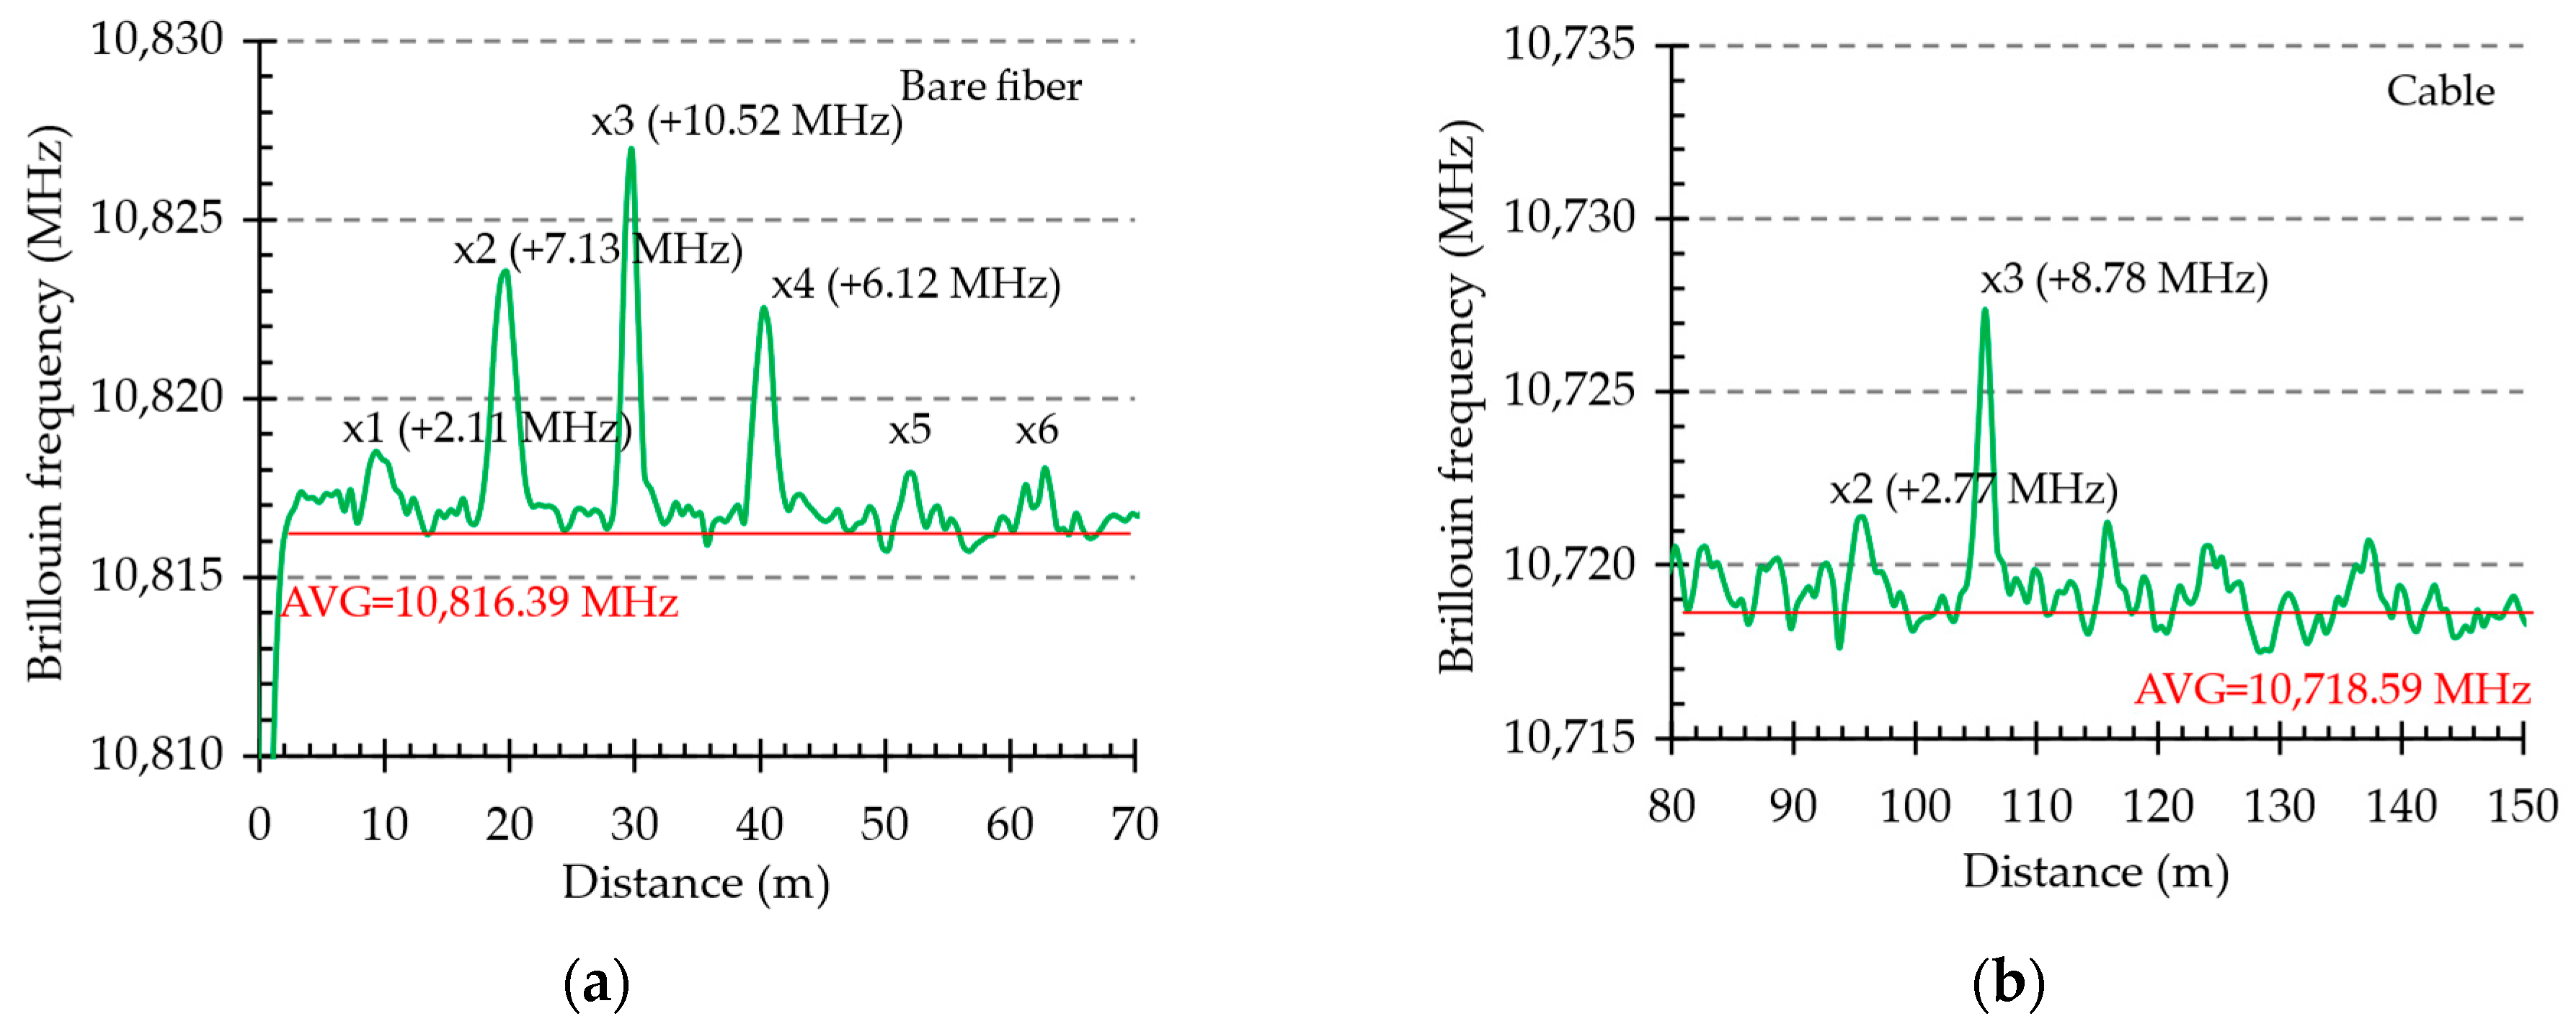
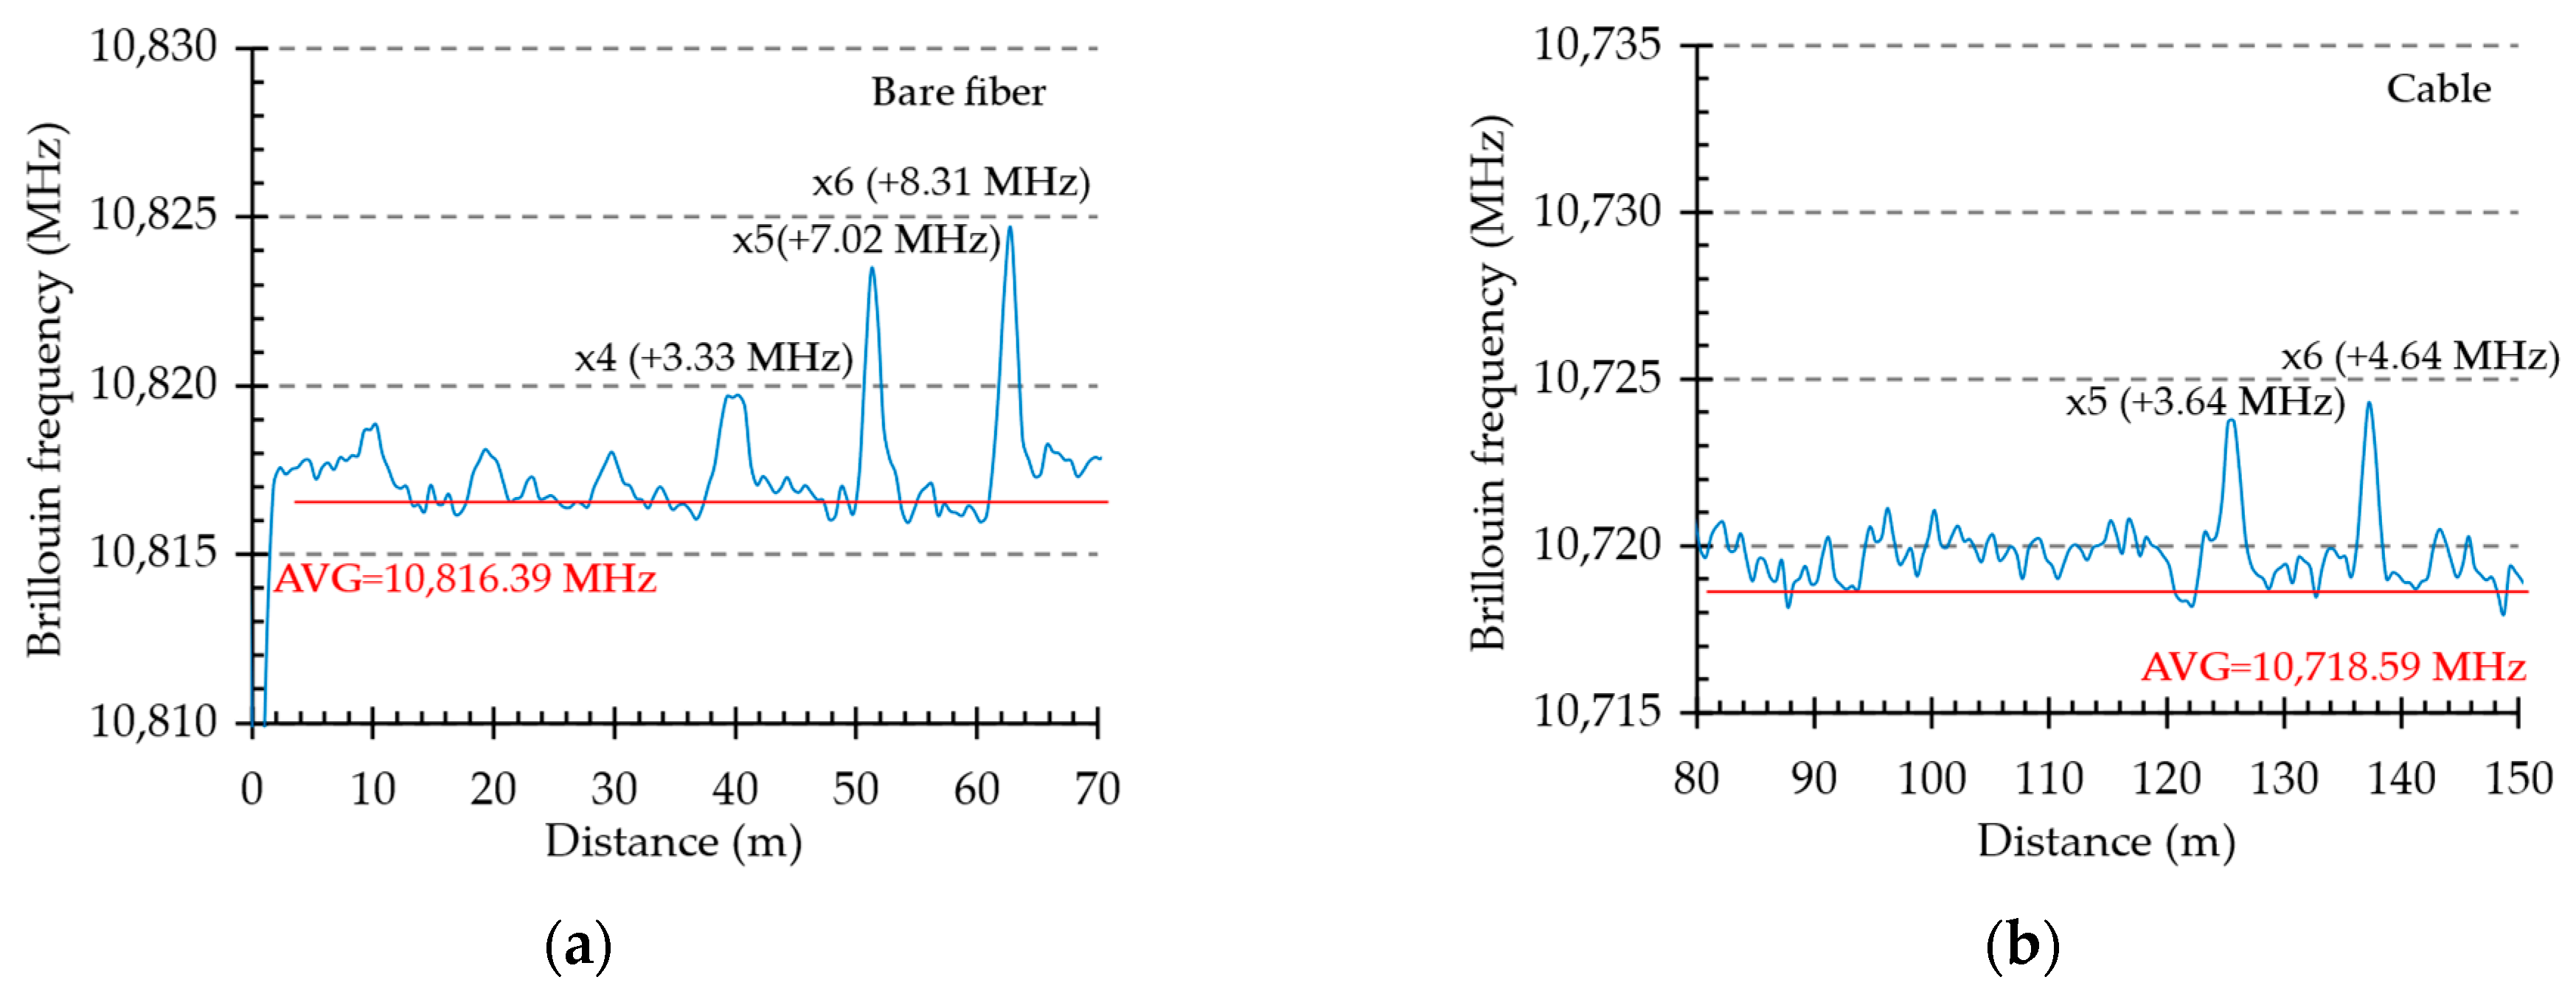
Temperature measurements on the parallel DTS lines placed on the PV module were conducted using both bare optical fiber and loose tube optical fiber cable. Figure 8 and Figure 9 present the Brillouin frequency characteristics for the hot plate placed under the first and third DTS line, respectively, for both fiber types. These optical fibers have specific Brillouin frequency values of 10,816 MHz (bare fiber) and 10,719 MHz (cable). As shown, frequency shifts were measured, particularly for the lines with the hot plate underneath. Moreover, for the bare optical fiber, the temperature distribution on adjacent lines is clearly visible. When the hotspot was formed at the center of the PV module, all six DTS lines were able to detect it (Figure 9a). However, the observed maximum frequency shift did not exceed 10.82 MHz (Figure 8a), corresponding to a temperature change of 9.83 °C based on the temperature coefficient defined in the second chapter.
The temperature values determined by this method do not exactly match the actual surface temperatures of the PV module and are significantly lower than those measured by thermocouples or FBGs. This discrepancy arises from the spatial resolution of the DTS system, which is approximately 1 m. Measurements are underestimated proportionally when the hotspot area (with a hot plate length of 16 cm) is smaller than the measurement step. Nevertheless, the study confirmed the capability to localize hotspots, especially using bare optical fiber, which demonstrated higher sensitivity.
Results obtained with the loose tube cable indicate that its spatial sensing capabilities are inferior to those of bare fiber, as the maximum sensing range for this cable is approximately 10 cm, comparable to that of thermocouples. Only two DTS lines adjacent to the hotspot area can potentially detect the hotspot, showing a low frequency shift of approximately 2.3–2.8 MHz (Figure 8b and Figure 9b). The highest observed frequency shift equals to 11.09 MHz (Figure 8b) corresponds to a calculated temperature rise of 8.73 °C above ambient temperature, which is much lower than the maximum temperature above the hot plate.
Figure 10 presents the Brillouin characteristics when the hotspot was positioned exactly between two DTS lines. In this scenario, a uniform Brillouin frequency shift was expected for both lines. However, as observed, shifts were detected for both optical fiber types, but their values were not consistent across the two lines. This discrepancy may suggest slight mispositioning of the heating point under the PV module, shifted toward the last DTS line, or suboptimal adhesion of the DTS line to the PV module. The study also demonstrated that optical fiber cables have reduced capability for detecting hotspots on the PV module due to their construction, which includes multiple protective layers.

3.4. Thermal Imaging

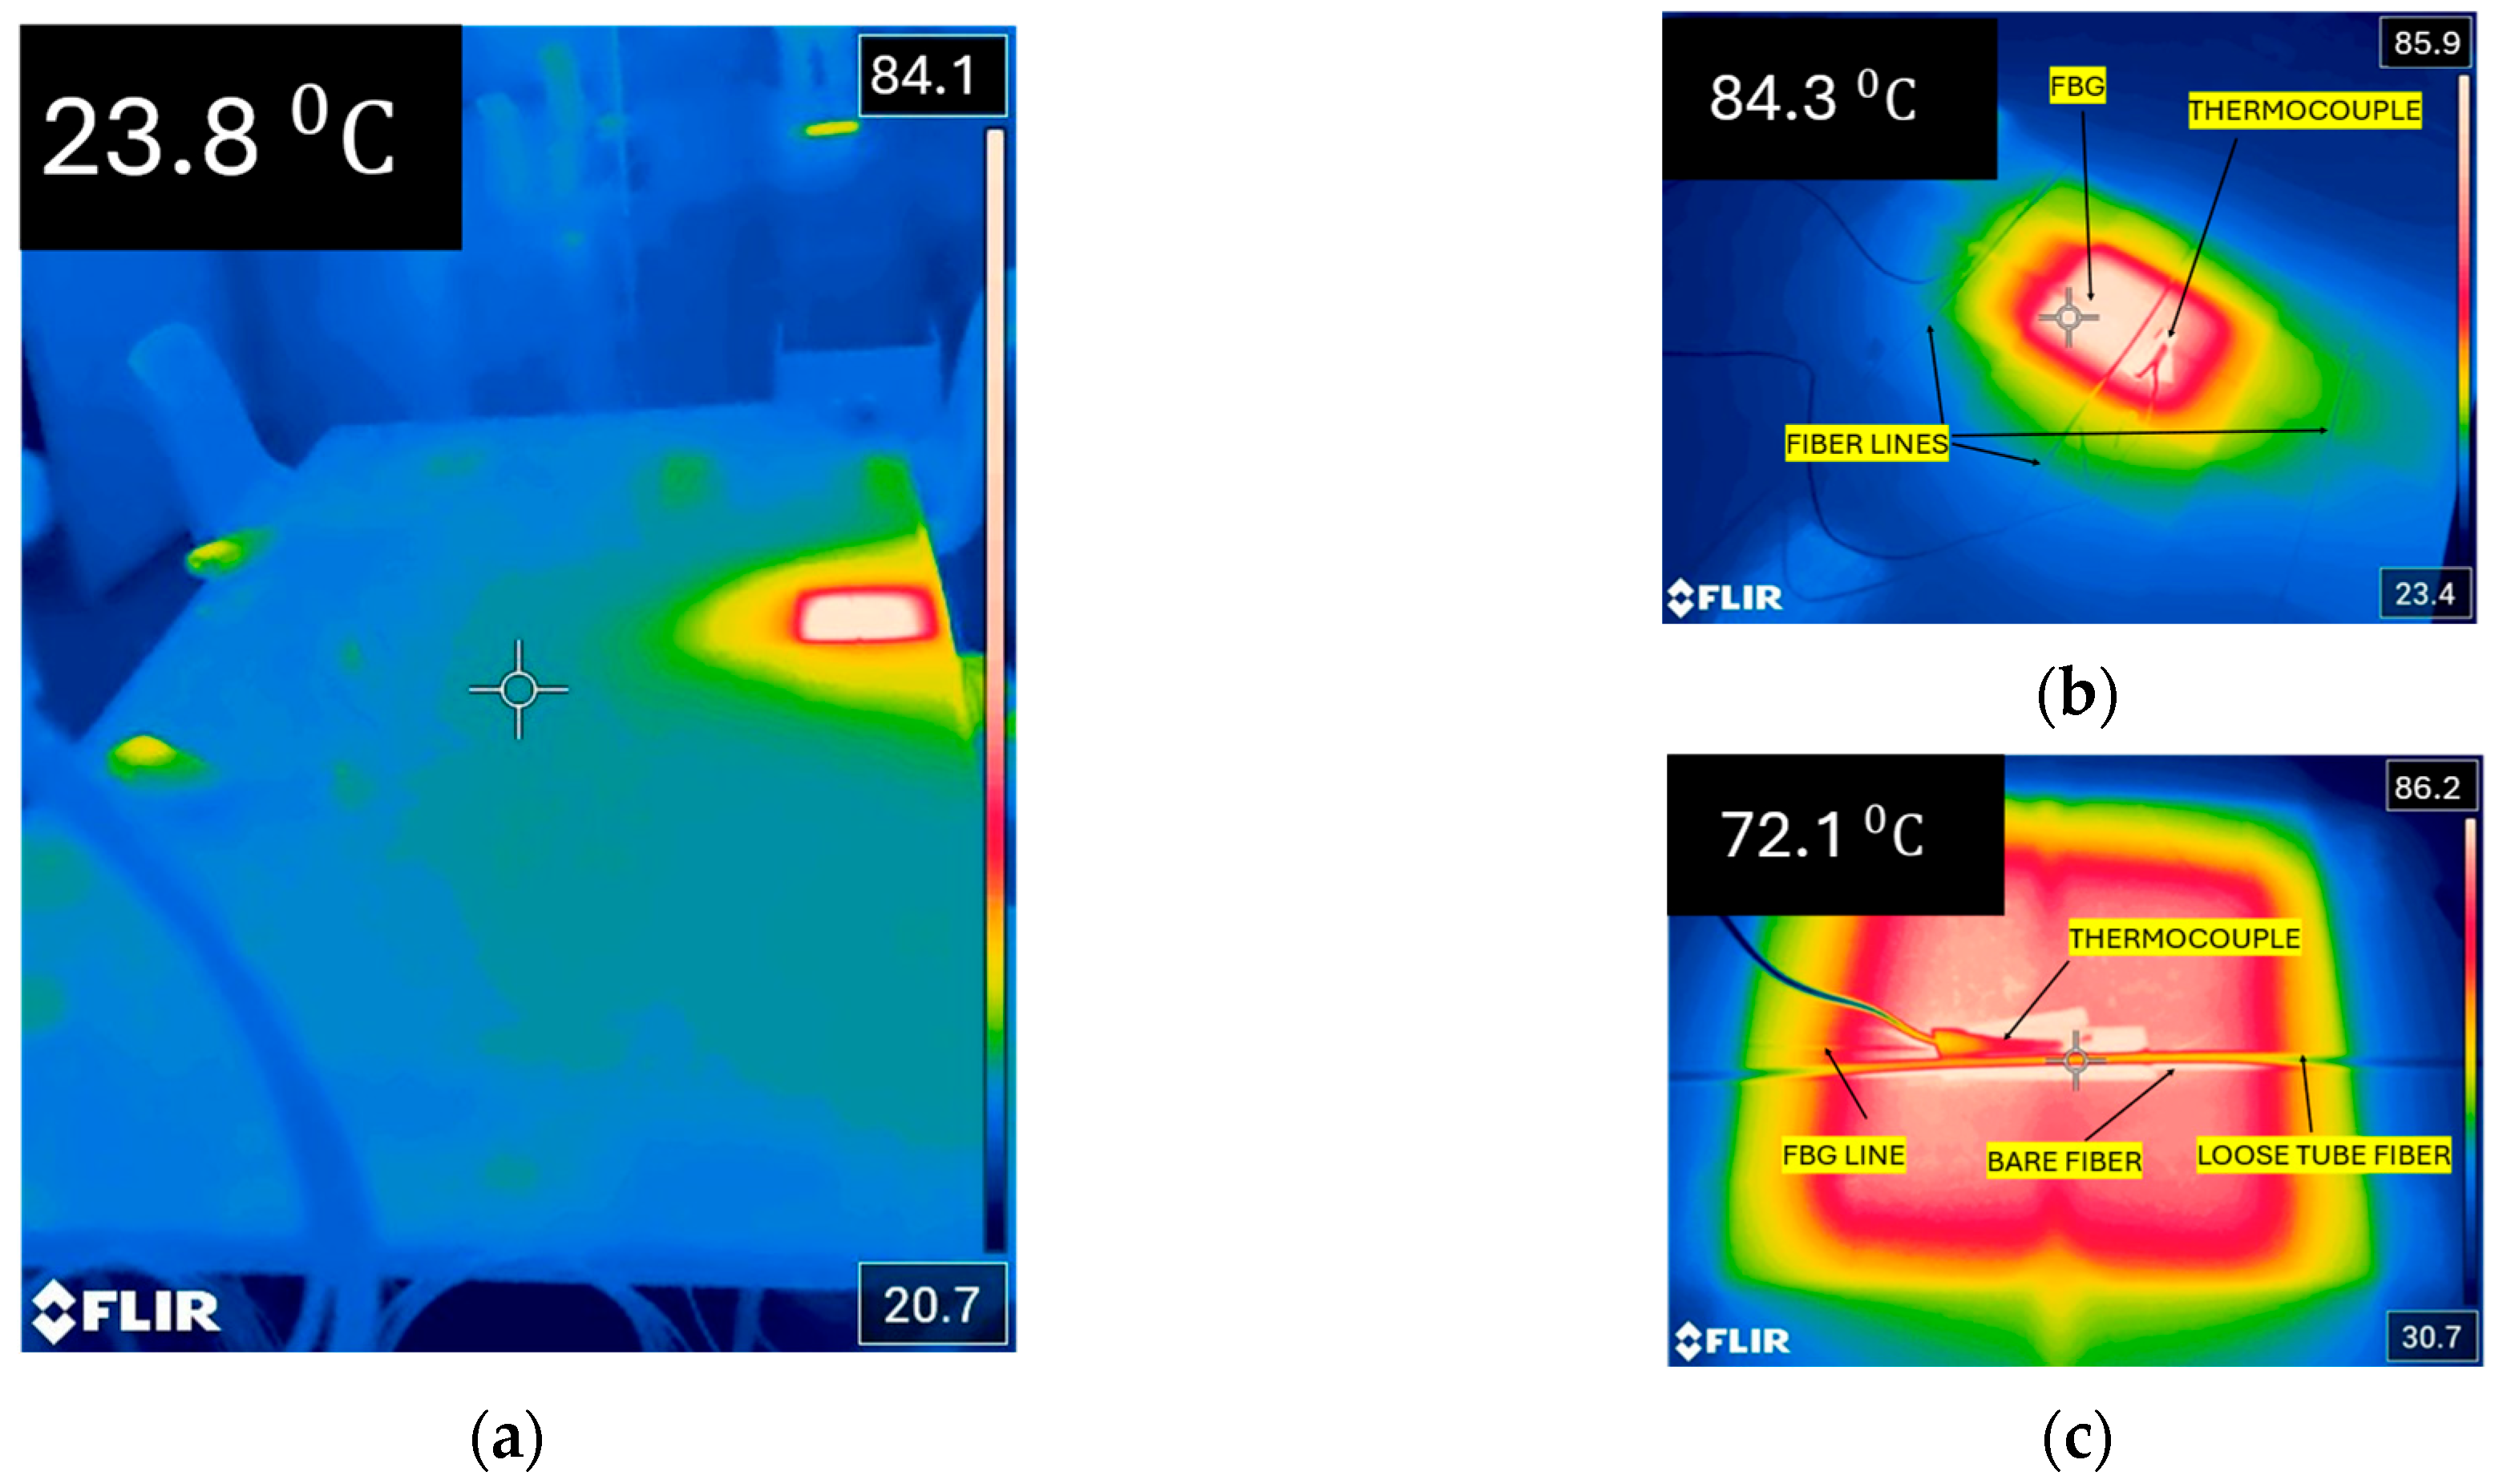
An infrared camera was used to obtain a detailed visualization of temperature variations in the hotspot area. The temperature of the PV module above the hot plate reached 84.3 °C (Figure 11b), while the temperature of the sensors placed above the hotspots was lower due to air convection, reaching 72 °C (Figure 11c).
The thermal image presented in Figure 11a confirms that during the tests, hotspot formation caused a local temperature rise covering approximately one-quarter of the PV module’s width. The IR image shows that the placement of the DTS lines allowed the detection of elevated temperatures by at least three of them. The length of the cable segment with increased temperature (approximately 34 cm) is greatest for the DTS lines positioned directly above the hotspot and decreases with distance from it. This observation substantiates the explanation for the discrepancy between the average temperature recorded by the DTS system and the true temperature of the hotspot. Furthermore, the presented images demonstrate that BDTS is a reliable technique for hotspot detection and localization.

4. Discussion

The investigated fiber optic sensing technologies demonstrate significant potential for enhancing PV module monitoring. FBGs provide precise point measurements, which are highly valuable for accurate hotspot detection and thermal characterization. The results obtained from FBGs are consistent with those from thermocouples, confirming the suitability of FBGs for temperature measurement in PV modules. However, our research indicates that the effective sensitivity range of FBG sensors is approximately 18 cm, necessitating the use of multiple gratings for comprehensive hotspot detection in high-power modules with a large surface. This requirement increases both the complexity and cost of the monitoring system.
The BDTS extends monitoring capabilities by enabling temperature measurements along the entire length of optical fibers, facilitating the detection of multiple hotspots across numerous PV modules as well as other critical components, such as electric cables or connectors. Additionally, BDTS allows precise localization of hotspots on the PV module surface. Nevertheless, the 1 m spatial resolution of our BOTDR, presents challenges for detecting hotspots, which are generally on the order of centimeters, resulting in spatially averaged temperature readings that reduce detection accuracy. Furthermore, measurement results indicate that optical fiber cables exhibit lower hotspot detection sensitivity compared to bare optical fibers. This is attributed to the cable’s construction, which involves multiple inner layers beneath the outer jacket, increasing the cable’s thermal resistance. On the other hand, fiber optic sensors deployed on PV modules must be robust against varying environmental conditions and possess adequate mechanical durability to ensure long-term operational reliability. The results achieved using BOTDR represent a compromise between spatial resolution, sensing range, cost, and field robustness. Unlike other commercially available DTS systems such as BOTDA or OFDR [44], BOTDR enables single-ended measurements over tens of meters with straightforward deployment across multiple PV strings. This balance between practicality and diagnostic sensitivity is critical for large-scale PV farms. Alternative DTS methods with higher spatial resolution, such as Optical Frequency Domain Reflectometry (OFDR), offer spatial resolutions of approximately 5 cm over distances up to 1.5 km, with a temperature measurement uncertainty of ±0.2 °C [45], or even 1 cm resolution with an uncertainty of ±0.7 °C [46]. However, the high cost and relatively limited range of these systems, especially for large-scale PV installations, pose significant challenges for practical implementation. While the 1 m spatial resolution of BOTDR inherently smooths localized centimeter-scale hotspots, the technique remains sufficient to detect abnormal temperature distributions indicative of module degradation or cell mismatch. In our opinion, for localized diagnostics, BOTDR could be complemented by IR imaging on selected modules with initially diagnosed risk.
The symmetrical placement of BDTS lines can be useful for detecting multiple hotspots. When two or more directly adjacent cells are damaged and form a large hotspot, a larger area of elevated temperature will appear. This results in a longer section of the optical fiber being heated and a higher shift in the Brillouin frequency being observed, as the averaging data obtained by BOTDR becomes more accurate.
A PV module built from cells arranged symmetrically in rows and columns is considered here. If hotspots form in different parts of the module but within the same column, the distance between them will affect the results. If the distance is smaller than the spatial resolution of BOTDR, it is expected that BOTDR average data will show increased Brillouin frequency shifts along the DTS lines. If the distance between hotspots (located in the same column) is greater than the spatial resolution, an additional peak in the Brillouin frequency shift is expected to be detected. Multiple peaks are expected to appear in DTS charts when hotspot formation occurs in cells located in different rows and columns of the PV module.
Detection of several hotspots using thermocouples and FBG sensors is highly correlated with their sensing range. Since both can detect hotspots from a distance of approximately 10 cm, at least 36 FBGs or thermocouples should be distributed across the 2nd, 4th, or 6th DTS lines (12 sensors per line, as there are 24 cells, each 9 cm wide, in a column) to ensure reliable detection of hotspot formation in any cell within the investigated PV module.
Challenges remain, including improving spatial resolution in BOTDR systems to enable detection of smaller hotspots and further miniaturizing FBG interrogation systems for field deployment. Additionally, sensor mounting techniques and environmental resilience require continuous refinement to ensure reliability in outdoor PV applications.

5. Conclusions

The study confirms that fiber optic sensors—both FBG-based and BDTS systems—are effective in detecting hotspots on photovoltaic modules. Their results closely correspond with traditional thermocouple measurements and provide high spatial fidelity, as corroborated by infrared thermography. These fiber optic techniques offer scalable, robust, and minimally invasive solutions for continuous thermal monitoring of PV systems, thereby enhancing safety and performance. With DTS, it is possible to detect hotspots formed up to 46 cm from the sensor, while FBG sensors offer a more localized sensing range of approximately 10 cm. However, this capability varies depending on the construction of the sensor cable.
Future work will focus on optimizing sensor array design, enhancing the spatial resolution of distributed sensing, conducting tests under operational conditions of PV modules, and integrating these sensors into functional PV monitoring networks for long-term validation.

Author Contributions

Conceptualization, B.G.; methodology, B.G. and M.L.; validation, B.G., M.L. and D.B., formal analysis, B.G. and M.L.; investigation, B.G. and M.L.; resources, B.G.; data curation, D.B. and B.G.; writing—original draft preparation, M.L. and B.G.; visualization, M.L.; supervision, B.G.; project administration, B.G.; funding acquisition, B.G. and M.L. All authors have read and agreed to the published version of the manuscript.

Funding

This research received no external funding.

Data Availability Statement

The data presented in this study are available on request from the corresponding author.

Conflicts of Interest

The authors declare no conflicts of interest.

Abbreviations

The following abbreviations are used in this manuscript:
BDTSBrillouin distributed temperature sensing method
DTSDistributed Temperature Sensor
FBGFiber Bragg Grating
IRInfrared
LHDLinear Heat Detection
HPHot Plate
TCThermocouple
PVPhotovoltaic

References

  1. Masson, G.; Jäger-Waldau, A.; Kaizuka, I.; Lindahl, J.; Donoso, J.; de L’Epine, M. A Snapshot of the Global PV Market and Industry. In Proceedings of the IEEE 53rd Photovoltaic Specialists Conference (PVSC), Montreal, QC, Canada, 8–13 June 2025. [Google Scholar]
  2. Arcipowska, A.; Blanco Perez, S.; Jakimow, M.; Baldassarre, B.; Polverini, D.; Cabrera, M. Role of solar PV in net-zero growth: An analysis of international manufacturers and policies. Prog. Photovolt. Res. Appl. 2024, 32, 607–622. [Google Scholar]
  3. Salmeron-Manzano, E.; Munoz-Rodriguez, D.; Perea-Moreno, A.J.; Hernandez-Escobedo, Q.; Manzano-Agugliaro, F. Worldwide scientific landscape on fires in photovoltaic. J. Clean. Prod. 2024, 461, 142614. [Google Scholar] [CrossRef]
  4. Mohd Nizam Ong, N.A.F.; Sadiq, M.A.; Md Said, M.S.; Jomaas, G.; Mohd Tohir, M.Z.; Kristensen, J.S. Fault tree analysis of fires on rooftops with photovoltaic systems. J. Build. Eng. 2022, 46, 103752. [Google Scholar] [CrossRef]
  5. Cancelliere, P. PV electrical plants fire risk assessment and mitigation according to the Italian national fire services guidelines. Fire Mater. 2016, 40, 355–367. [Google Scholar] [CrossRef]
  6. Mazziotti, L.; Cancelliere, P.; Paduano, G.; Setti, P.; Sassi, S. Fire risk related to the use of PV systems in building facades. In Proceedings of the MATEC Web of Conferences, Amsterdam, The Netherlands, 23–25 March 2016; Volume 46, p. 05001. [Google Scholar]
  7. Mohd Nizam Ong, N.A.F.; Mohd Tohir, M.Z.; Md Said, M.S.; Nasif, M.S.; Alias, A.H.; Ramali, M.R. Development of fire safety best practices for rooftops grid-connected photovoltaic (PV) systems installation using systematic review methodology. Sustain. Cities Soc. 2022, 78, 103637. [Google Scholar] [CrossRef]
  8. Aurrekoetxea-Arratibel, O.; Otano-Aramendi, N.; Valencia-Caballero, D.; Vidaurrazaga, I.; Oregi, X.; Olano-Azkune, X. Flame Spread on an Active Photovoltaic–Roof System. Fire 2025, 8, 105. [Google Scholar] [CrossRef]
  9. Rataj, M.; Berezovska, I. Assessing Fire Risks in Photovoltaic Panels: A Literature Review in the Context of Blackout Concerns. Energies 2025, 18, 3407. [Google Scholar] [CrossRef]
  10. Mao, M.; Tang, Y.; Chen, J.; Xu, Z.; Sun, H.; Yin, C. Monitoring and Suppression Strategies of the Interharmonic in the Grid-Connected Photovoltaic System: A Review. Energies 2025, 18, 3426. [Google Scholar] [CrossRef]
  11. Madeti, S.R.; Singh, S.N. Monitoring system for photovoltaic plants: A review. Renew. Sustain. Energy Rev. 2017, 67, 1180–1207. [Google Scholar] [CrossRef]
  12. Ansari, S.; Ayob, A.; Lipu, M.S.H.; Saad, M.H.M.; Hussain, A. A Review of Monitoring Technologies for Solar PV Systems Using Data Processing Modules and Transmission Protocols: Progress, Challenges and Prospects. Sustainability 2021, 13, 8120. [Google Scholar] [CrossRef]
  13. Wang, Y.; Itako, K.; Kudoh, T.; Koh, K.; Ge, Q. Voltage-Based Hot-Spot Detection Method for Photovoltaic String Using a Projector. Energies 2017, 10, 230. [Google Scholar] [CrossRef]
  14. Dhimish, M.; Mather, P.; Holmes, V. Evaluating Power Loss and Performance Ratio of Hot-Spotted Photovoltaic Modules. IEEE Trans. Electron Devices 2018, 65, 5419–5427. [Google Scholar] [CrossRef]
  15. Al-Samawi, A.A.; Atiyah, A.S.; Al-Jrew, A.H. Power Optimization of Partially Shaded PV System Using Interleaved Boost Converter-Based Fuzzy Logic Method. Eng 2025, 6, 201. [Google Scholar] [CrossRef]
  16. Dhimish, M.; Theristis, M.; D’Alessandro, V. Photovoltaic hotspots: A mitigation technique and its thermal cycle. Optik 2024, 300, 171627. [Google Scholar] [CrossRef]
  17. Rahaman, M.A.; Chambers, T.L.; Fekih, A.; Wiecheteck, G.; Carranza, G.; Possetti, G.R.C. Floating photovoltaic module temperature estimation: Modeling and comparison. Renew. Energy 2023, 208, 162–180. [Google Scholar] [CrossRef]
  18. Ye, Z.; Nobre, A.; Reindl, T.; Luther, J.; Reise, C. On PV module temperatures in tropical regions. Sol. Energy 2013, 88, 80–87. [Google Scholar] [CrossRef]
  19. Buerhop, C.; Pickel, T.; Deitsch, S.; Maier, A.; Gallwitz, F.; Riess, C. Infrared imaging of photovoltaic modules: A review of the state of the art and future challenges facing gigawatt photovoltaic power stations. Prog. Energy 2022, 4, 042010. [Google Scholar] [CrossRef]
  20. Bommes, L.; Buerhop-Lutz, C.; Pickel, T.; Hauch, J.; Brabec, C.J.; Peters, I.M. Computer vision tool for detection, mapping, and fault classification of photovoltaic modules in aerial IR videos. Prog. Photovolt. Res. Appl. 2021, 29, 1236–1251. [Google Scholar] [CrossRef]
  21. Zefri, Y.; Elkettani, A. Thermal Infrared and Visual Inspection of Photovoltaic Installations by UAV Photogrammetry—Application Case: Morocco. Drones 2018, 2, 41. [Google Scholar] [CrossRef]
  22. Olayiwola, O.I.; Elsden, M.; Dhimish, M. Robotics, Artificial Intelligence, and Drones in Solar Photovoltaic Energy Applications—Safe Autonomy Perspective. Safety 2024, 10, 32. [Google Scholar] [CrossRef]
  23. Kim, K.A.; Seo, G.S.; Cho, B.H.; Krein, P.T. Photovoltaic Hot-Spot Detection for Solar Panel Substrings Using AC Parameter Characterization. IEEE Trans. Power Electron. 2016, 31, 1121–1130. [Google Scholar] [CrossRef]
  24. Ma, M.; Liu, H.; Yun, P.; Liu, F. Rapid diagnosis of hot spot failure of crystalline silicon PV module based on I–V curve. Microelectron. Reliab. 2019, 100–101, 113402. [Google Scholar] [CrossRef]
  25. Yang, C.; Sun, F.; Zou, Y.; Lv, Z.; Xue, L.; Jiang, C.; Liu, S.; Zhao, B.; Cui, H. A Survey of Photovoltaic Panel Overlay and Fault Detection Methods. Energies 2024, 17, 837. [Google Scholar] [CrossRef]
  26. Jiang, S.F.; Qiao, Z.H.; Li, N.L.; Luo, J.B.; Shen, S.; Wu, M.H.; Zhang, Y. Structural health monitoring system based on FBG sensing technique for Chinese ancient timber buildings. Sensors 2020, 20, 110. [Google Scholar] [CrossRef] [PubMed]
  27. Kouhrangiha, F.; Kahrizi, M.; Khorasani, K. Structural health monitoring: Modeling of simultaneous effects of strain, temperature, and vibration on the structure using a single apodized π-Phase shifted FBG sensor. Results Opt. 2022, 9, 100323. [Google Scholar] [CrossRef]
  28. Li, R.; Tan, Y.; Chen, Y.; Hong, L.; Zhou, Z. Simultaneous Measurement of Temperature and Mechanical Strain Using a Fiber Bragg Grating Sensor. Sensors 2020, 20, 4223. [Google Scholar] [CrossRef]
  29. Li, G.; Feng, F.; Wang, F.; Wei, B. Hot Spot Detection of Photovoltaic Module Based on Distributed Fiber Bragg Grating Sensor. Sensors 2022, 22, 4951. [Google Scholar] [CrossRef]
  30. Guzowski, B.; Lakomski, M.; Peczek, K.; Ruta, L.; Sibinski, M. Gold-Coated Temperature Optical Fiber Sensor Based on a Mach-Zehnder Interferometer for Photovoltaic Monitoring. Materials 2025, 18, 1818. [Google Scholar] [CrossRef]
  31. Dhanalakshmi, S.; Chakravartula, V.; Narayanamoorthi, R.; Kumar, R.; Dooly, G.; Duraibabu, D.B.; Senthil, R. Thermal management of solar photovoltaic panels using a fibre Bragg grating sensor-based temperature monitoring. Case Stud. Therm. Eng. 2022, 31, 101834. [Google Scholar] [CrossRef]
  32. Minardo, A.; Bernini, R.; Zeni, L. Distributed Temperature Sensing in Polymer Optical Fiber by BOFDA. IEEE Photonics Technol. Lett. 2014, 26, 387–390. [Google Scholar] [CrossRef]
  33. Alhussein, A.N.D.; Qaid, M.R.T.M.; Agliullin, T.; Valeev, B.; Morozov, O.; Sakhabutdinov, A. Fiber Bragg Grating Sensors: Design, Applications, and Comparison with Other Sensing Technologies. Sensors 2025, 25, 2289. [Google Scholar] [CrossRef] [PubMed]
  34. Bao, X.; Zhou, Z.; Wang, Y. Review: Distributed time-domain sensors based on Brillouin scattering and FWM enhanced SBS for temperature, strain and acoustic wave detection. PhotoniX 2021, 2, 14. [Google Scholar] [CrossRef]
  35. Li, G.; Feng, F.; Wang, F.; Wei, B. Temperature Field Measurement of Photovoltaic Module Based on Distributed Fiber Bragg Grating. Materials 2022, 15, 5324. [Google Scholar] [CrossRef]
  36. Nivelle, P.; Maes, L.; Poortmans, J.; Daenen, M. In situ quantification of temperature and strain within photovoltaic modules through optical sensing. Prog. Photovolt. Res. Appl. 2023, 31, 173–179. [Google Scholar] [CrossRef]
  37. Failleau, G.; Beaumont, O.; Razouk, R.; Lesoille, S.; Landolt, M.; Courthial, B.; Henault, J.M.; Martinot, F.; Bertrand, J.; Hay, B. A metrological comparison of raman-distributed temperature sensors. Measurement 2018, 116, 18–24. [Google Scholar] [CrossRef]
  38. Zhang, X.; Zhu, H.; Jiang, X.; Broere, W. Distributed fiber optic sensors for tunnel monitoring: A state-of-the-art review. J. Rock Mech. Geotech. Eng. 2024, 16, 3841–3863. [Google Scholar] [CrossRef]
  39. Sun, X.; Wang, L.; Zhou, J.; Li, T.; Fu, Y.; Shum, P.P.; Rao, Y. Ultra-long Brillouin optical time-domain analyzer based on distortion compensating pulse and hybrid lumped–distributed amplification. APL Photonics 2022, 7, 126107. [Google Scholar] [CrossRef]
  40. Ochi, S.; Kikuchi, K.; Tsurugai, S.; Lee, H.; Mizuno, Y. High-resolution distributed temperature sensing along polymer optical fiber using Brillouin optical correlation-domain reflectometry. Opt. Fiber Technol. 2025, 90, 104144. [Google Scholar] [CrossRef]
  41. Lakomski, M.; Plona, M.; Guzowski, B.; Shatarah, I.S.M. The Impact of Optical Fiber Type on the Temperature Measurements in Distributed Optical Fiber Sensor Systems. Pomiary Autom. Robot. 2023, 27, 27–32. [Google Scholar] [CrossRef]
  42. Nikles, M. Fibre Optic Distributed Scattering Sensing System: Perspectives and Challenges for High Performance Applications. In Proceedings of the Third European Workshop on Optical Fibre Sensors, Napoli, Italy, 4–7 July 2007; Volume 6619, pp. 92–99. [Google Scholar]
  43. Lakomski, M.; Guzowski, B.; Plona, M.; Peczek, K. Determination of Brillouin backscattering strain and temperature coefficients in telecommunication optical fibers. Int. J. Electron. Telecommun. 2025, 71, 203–208. [Google Scholar] [CrossRef]
  44. Lu, P.; Lalam, N.; Badar, M.; Liu, B.; Chorpening, B.T.; Buric, M.P.; Ohodnicki, P.R. Distributed optical fiber sensing: Review and perspective. Appl. Phys. Rev. 2019, 6, 041302. [Google Scholar] [CrossRef]
  45. Li, X.; Zhu, Y.; Lin, C.; Zou, C.; Zhu, Y.; Dang, F.; Lin, Y.; Yuan, Y.; Yang, J. Performance improvement of a distributed temperature sensor with kilometer length and centimeter spatial resolution based on polarization-sensitive OFDR. Sens. Actuators A 2024, 373, 115430. [Google Scholar] [CrossRef]
  46. Yang, S.O.; Lee, S.; Song, S.H.; Yoo, J. Development of a distributed optical thermometry technique for battery cells. Int. J. Heat Mass Transfer 2022, 194, 123020. [Google Scholar] [CrossRef]
Figure 1. Schematic representation of optical fiber path for transverse (a) and horizontal (b,c) tests.
Energies 18 06117 g001
Figure 2. Close up of optical fibers distribution on the PV module.
Energies 18 06117 g002
Figure 3. Scheme block of laboratory measurement setup.
Energies 18 06117 g003
Figure 4. Temperature variation over time for transverse measurements at six positions of the hot plate (a) and maximum temperature recorded by TC as a function of hotspot position (b).
Energies 18 06117 g004
Figure 5. Temperature recorded by TC in horizontal test for hot plate position #1–#3 (a) and hot plate position #1′–#3′ (b).
Energies 18 06117 g005
Figure 6. Fiber Bragg gratings measurement results for transverse configuration: CWL drift during hot-spot simulated points displacement (a), and temperature results for six simulated hot-spots (b).
Energies 18 06117 g006
Figure 7. Temperature measurement results for the horizontal configuration with the hot plate placed underneath the PV module: (a) directly at positions 1–3, and (b) between the FBG at positions 1′–3′.
Energies 18 06117 g007
Figure 8. DTS measurement results for optical path based on: bare optical fiber (a), and loose tube cable (b), for position 1 of simulated hot-spot (transverse configuration).
Energies 18 06117 g008
Figure 9. DTS measurement results for optical path based on: bare optical fiber (a), and loose tube cable (b), for position 3 of simulated hot-spot (transverse configuration).
Energies 18 06117 g009
Figure 10. DTS measurement results for optical path based on: bare optical fiber (a), and cable (b), for position 2′ of simulated hot-spot (horizontal configuration).
Energies 18 06117 g010
Figure 11. Thermal images of PV module: view of heat distribution on a module (a), PV module temperature above hotplate (b), and close up of sensors thermal characterization above hotplate (c).
Energies 18 06117 g011
Disclaimer/Publisher’s Note: The statements, opinions and data contained in all publications are solely those of the individual author(s) and contributor(s) and not of MDPI and/or the editor(s). MDPI and/or the editor(s) disclaim responsibility for any injury to people or property resulting from any ideas, methods, instructions or products referred to in the content.