Article

Research on Power Supply Restoration in Flexible Interconnected Distribution Networks Considering Wind–Solar Uncertainties

by
Lin Jiang
1,
Canbin Wang
1,
Wei Qiu
1,
Hui Xiao
2,* and
Wenshan Hu
2
1
Zhuhai Power Supply Bureau, Guangdong Power Grid Co., Ltd., Zhuhai 519000, China
2
School of Electricity and Automation, Wuhan University, Wuhan 430072, China
*
Author to whom correspondence should be addressed.
Energies 2025, 18(22), 6051; https://doi.org/10.3390/en18226051
Submission received: 6 September 2025 / Revised: 15 November 2025 / Accepted: 16 November 2025 / Published: 19 November 2025
(This article belongs to the Section F1: Electrical Power System)

Abstract

The large-scale integration of Distributed Generation (DG) poses significant challenges to the stable operation of distribution networks. It is particularly crucial to explore the power supply restoration capability of Soft Open Points with Energy Storage (E-SOP) and enhance power supply dependability. To address this issue, this paper proposes a power supply restoration method for flexible interconnected distribution networks (FIDN) considering wind–solar uncertainty. First, the control strategy and mathematical model of E-SOP are analyzed. Second, a wind–solar uncertainty model is established, with the weighted sum of maximizing restored node active load and minimizing power loss as the objective function, followed by a detailed analysis of constraints. Then, chance constraints are introduced to transform the proposed problem into a Mixed-Integer Second-Order Cone Programming (MISOCP) model. The Dung Beetle Optimization (DBO) algorithm is improved through logistic chaotic mapping, golden sine strategy, and position update coefficient to construct a distribution network power supply restoration model. Finally, simulations are conducted on the IEEE 33-node system using a hybrid optimization algorithm that combines Improved Dung Beetle Optimization (IDBO) with MISOCP. The simulation results demonstrate that the proposed method can effectively maximize power supply restoration in outage areas, further enhance the self-healing capability of distribution networks, and verify the feasibility of the method.

1. Introduction

In the context of increasingly severe global energy and environmental issues, promoting the replacement of traditional fossil fuels with new energy sources is one of the crucial measures to achieve “carbon reduction”. However, the large-scale integration of Distributed Generation (DG) has introduced challenges such as voltage quality degradation and power flow reversal to distribution networks [1,2]. Renewable energy sources such as photovoltaic (PV) systems and wind turbines (WT) offer advantages such as minimal environmental impact and reduced energy costs. However, the randomness of wind–solar output not only affects normal operation but also reduces the dependability of power sources and decreases the precision of restoration strategies due to forecast errors during fault recovery, posing new challenges to traditional distribution networks [3,4].
Traditional distribution networks operate in a “closed-loop design, open-loop operation” mode [5], which cannot fully utilize DG potential. In contrast, Flexible Interconnected Distribution Networks (FIDN) can convert the open-loop operation to closed-loop operation through Flexible Interconnection Devices (FID), thereby enhancing the network’s capacity to accommodate DG. Self-healing capability is one of the crucial characteristics of FIDN, particularly when large-scale DG integration significantly impacts distribution network operations and threatens operational security and stability. Consequently, the self-healing capability of distribution networks has become a current research hotspot. Present studies in this field primarily focus on three objectives: maximizing load restoration, accelerating restoration time, and reducing power losses. Considering DG uncertainty, current research on distribution network fault restoration can be categorized into stochastic optimization [6] and robust optimization [7], with chance-constrained programming being one of the main stochastic optimization methods. Chen, X.Y. et al. [8] established a distribution network fault restoration model with chance constraints considering PV generation uncertainty, effectively utilizing PV output. Liu, S.C. et al. [9] established a multi-DG model based on chance constraints, which improved the utilization rate of DG. However, although chance-constrained methods have been applied to handle the uncertainty of DG, these studies either only consider PV or lack flexible interconnection devices, limiting their restoration capability. Second, while SOP has been used in fault restoration, these methods assume that DG outputs are deterministic, which may lead to infeasible solutions under actual uncertain conditions.
Flexible interconnection devices can balance DG instability in distribution networks, enabling efficient DG integration. Among FIDs, Soft Open Points (SOP) [10] are typical flexible devices. SOP can replace traditional tie switches to achieve power transfer between feeders, enabling closed-loop operation of distribution networks and improving equipment utilization. Currently, researchers have applied SOP in various fields, including post-fault power supply restoration [11], reactive power optimization [12], fault location, and network loss reduction [13]. This paper focuses on SOP-based power supply restoration. Regarding SOP applications in distribution network fault restoration, Hu, Y.F. et al. [14] combined energy storage systems with SOP for distribution network islanding restoration, proposing a topology search-based islanding partitioning method that improved power supply restoration effectiveness. Yu, Y.W. et al. [15] established a distribution network fault restoration model based on multi-terminal SOP, comprehensively considering economics and restoration capability, and solved it using a hybrid optimization algorithm combining improved particle swarm optimization and second-order cone programming, effectively maximizing power supply restoration in outage areas. Song, Y. et al. [16] proposed an SOP-based power supply restoration model solved through second-order cone programming, enhancing fault power supply capability. However, these methods did not consider the impact of DG uncertainty on distribution network power supply restoration. The randomness of DG output affects the dependability and precision of restoration schemes, and the coordinated operation between E-SOP and uncertain renewable sources lacks in-depth investigation.
With the continuous development of FIDs, researchers have begun studying the combination of SOP and Energy Storage Systems (ESS) [17]. E-SOP can more effectively improve power supply reliability, but current research related to E-SOP mainly focuses on planning or steady-state optimization, with limited studies on its coordinated operation with uncertain renewable energy sources during fault restoration. Although Li, et al. [18] incorporated E-SOP into optimization, they adopted a robust optimization approach, which tends to be overly conservative and results in insufficient utilization of DG resources. Furthermore, while hybrid metaheuristic-second-order cone programming methods have gradually emerged, the convergence speed and solution quality of existing metaheuristic algorithms still cannot meet the requirements of real-time restoration applications in large-scale distribution networks [15].
Therefore, this paper proposes a power supply restoration method for FIDN considering wind–solar uncertainty. The main contributions are as follows:
  • Thoroughly considers wind and solar power output uncertainties by establishing a Beta distribution model for photovoltaic generation and a Weibull distribution model for wind power, and employs confidence-level-adaptive chance-constrained programming to transform the stochastic optimization problem into a tractable second-order cone programming problem, enabling flexible trade-offs between restoration effectiveness and operational reliability.
  • Population initialization is implemented using logistic chaotic mapping, the golden sine strategy is introduced to enhance exploration capability, and dynamic weight coefficients are designed to improve exploitation capability, achieving faster convergence speed and higher solution quality. This is integrated with MISOCP to construct a bi-level hybrid optimization framework for solving the power supply restoration problem of distribution networks with E-SOP, where the outer layer handles discrete restoration decisions and the inner layer ensures the global optimality of continuous power flow variables.
  • Proposes a coordinated E-SOP control model that integrates energy storage system operation with dual-VSC power regulation under fault conditions. Under the E-SOP distribution network topology, the proposed model significantly improves post-fault restoration effectiveness through flexible power flow control and energy buffering capabilities and achieves efficient distributed generation integration by coordinating uncertain renewable outputs with controllable energy storage.
The remainder of this paper is organized as follows: Section 2 introduces the basic structure and control methods of SOP and analyzes the mathematical model of E-SOP. Section 3 establishes the objective function and constraints based on the wind–solar uncertainty model. Section 4 introduces the structure of intelligent optimization algorithms and second-order cone programming and proposes a fault restoration model for FIDN. Section 5 presents case studies for distribution networks with E-SOP. Finally, Section 6 concludes the paper.

2. Control Analysis of E-SOP

2.1. Control Strategy of SOP

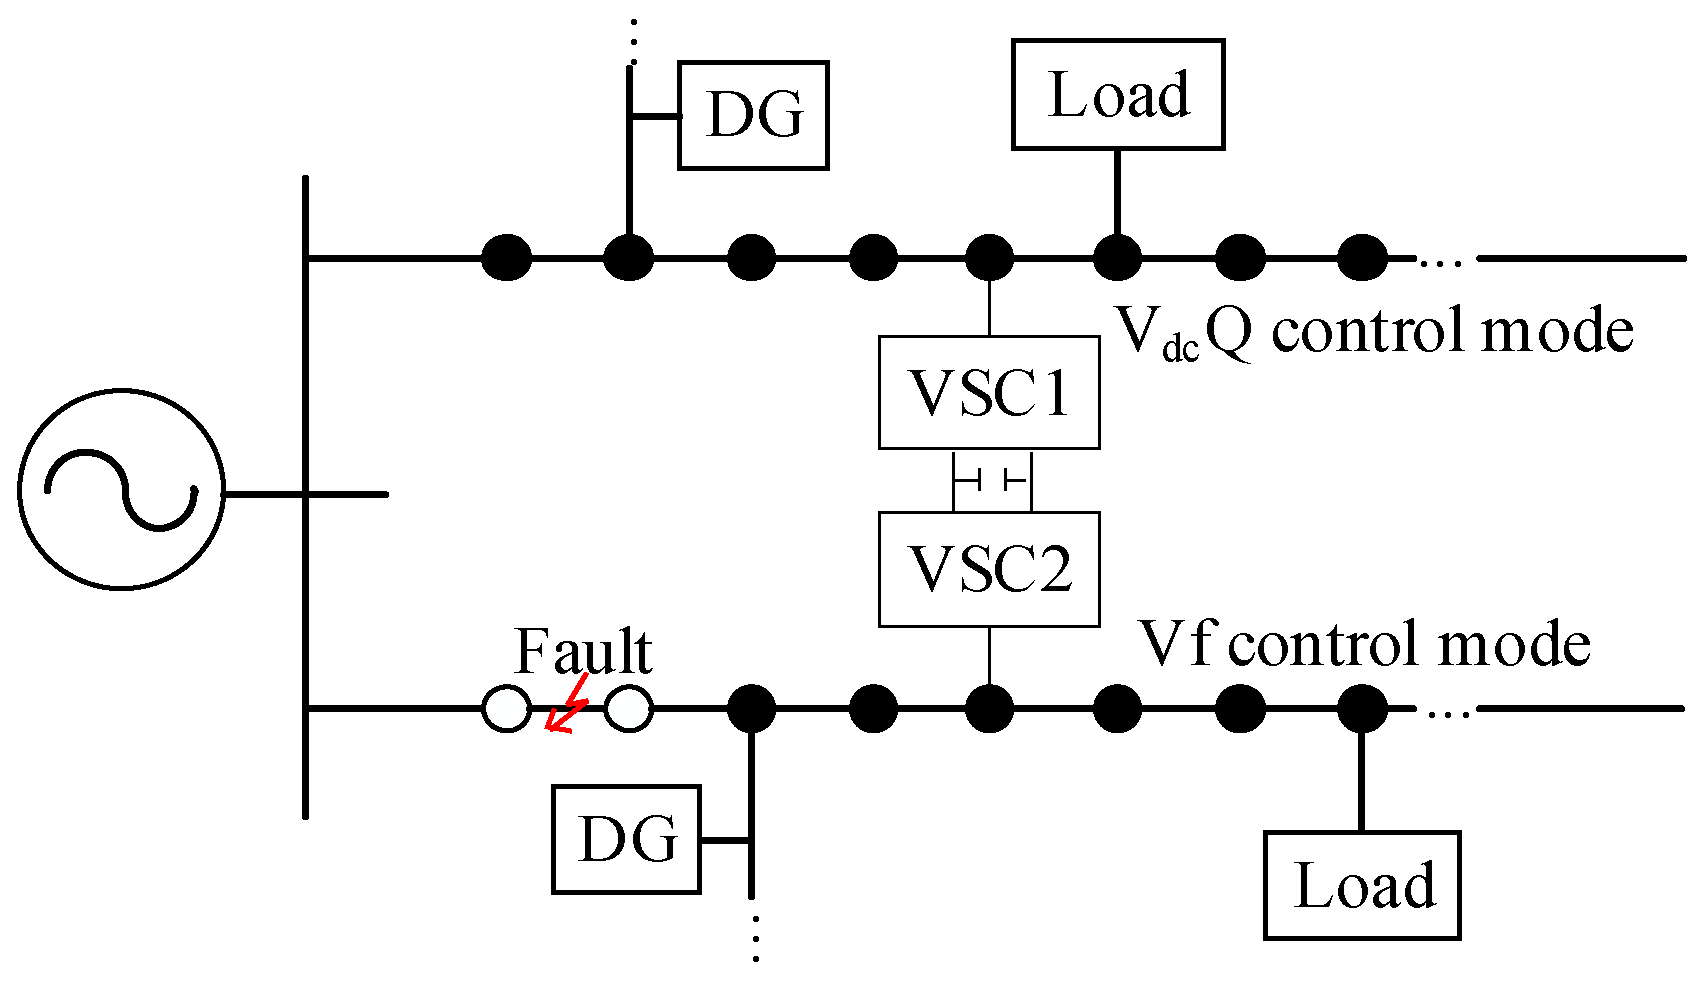
As a fully controlled power electronic device installed in distribution networks, Soft Open Points consist of Voltage Source Converters (VSC). Currently, SOP is mainly implemented in three ways: unified power flow controller, static synchronous series compensator, and back-to-back voltage source converter (B2B VSC) [19]. Taking B2B VSC as an example, the structure of distribution network with SOP is shown in Figure 1, and the control strategy of SOP under fault conditions is shown in Figure 2.
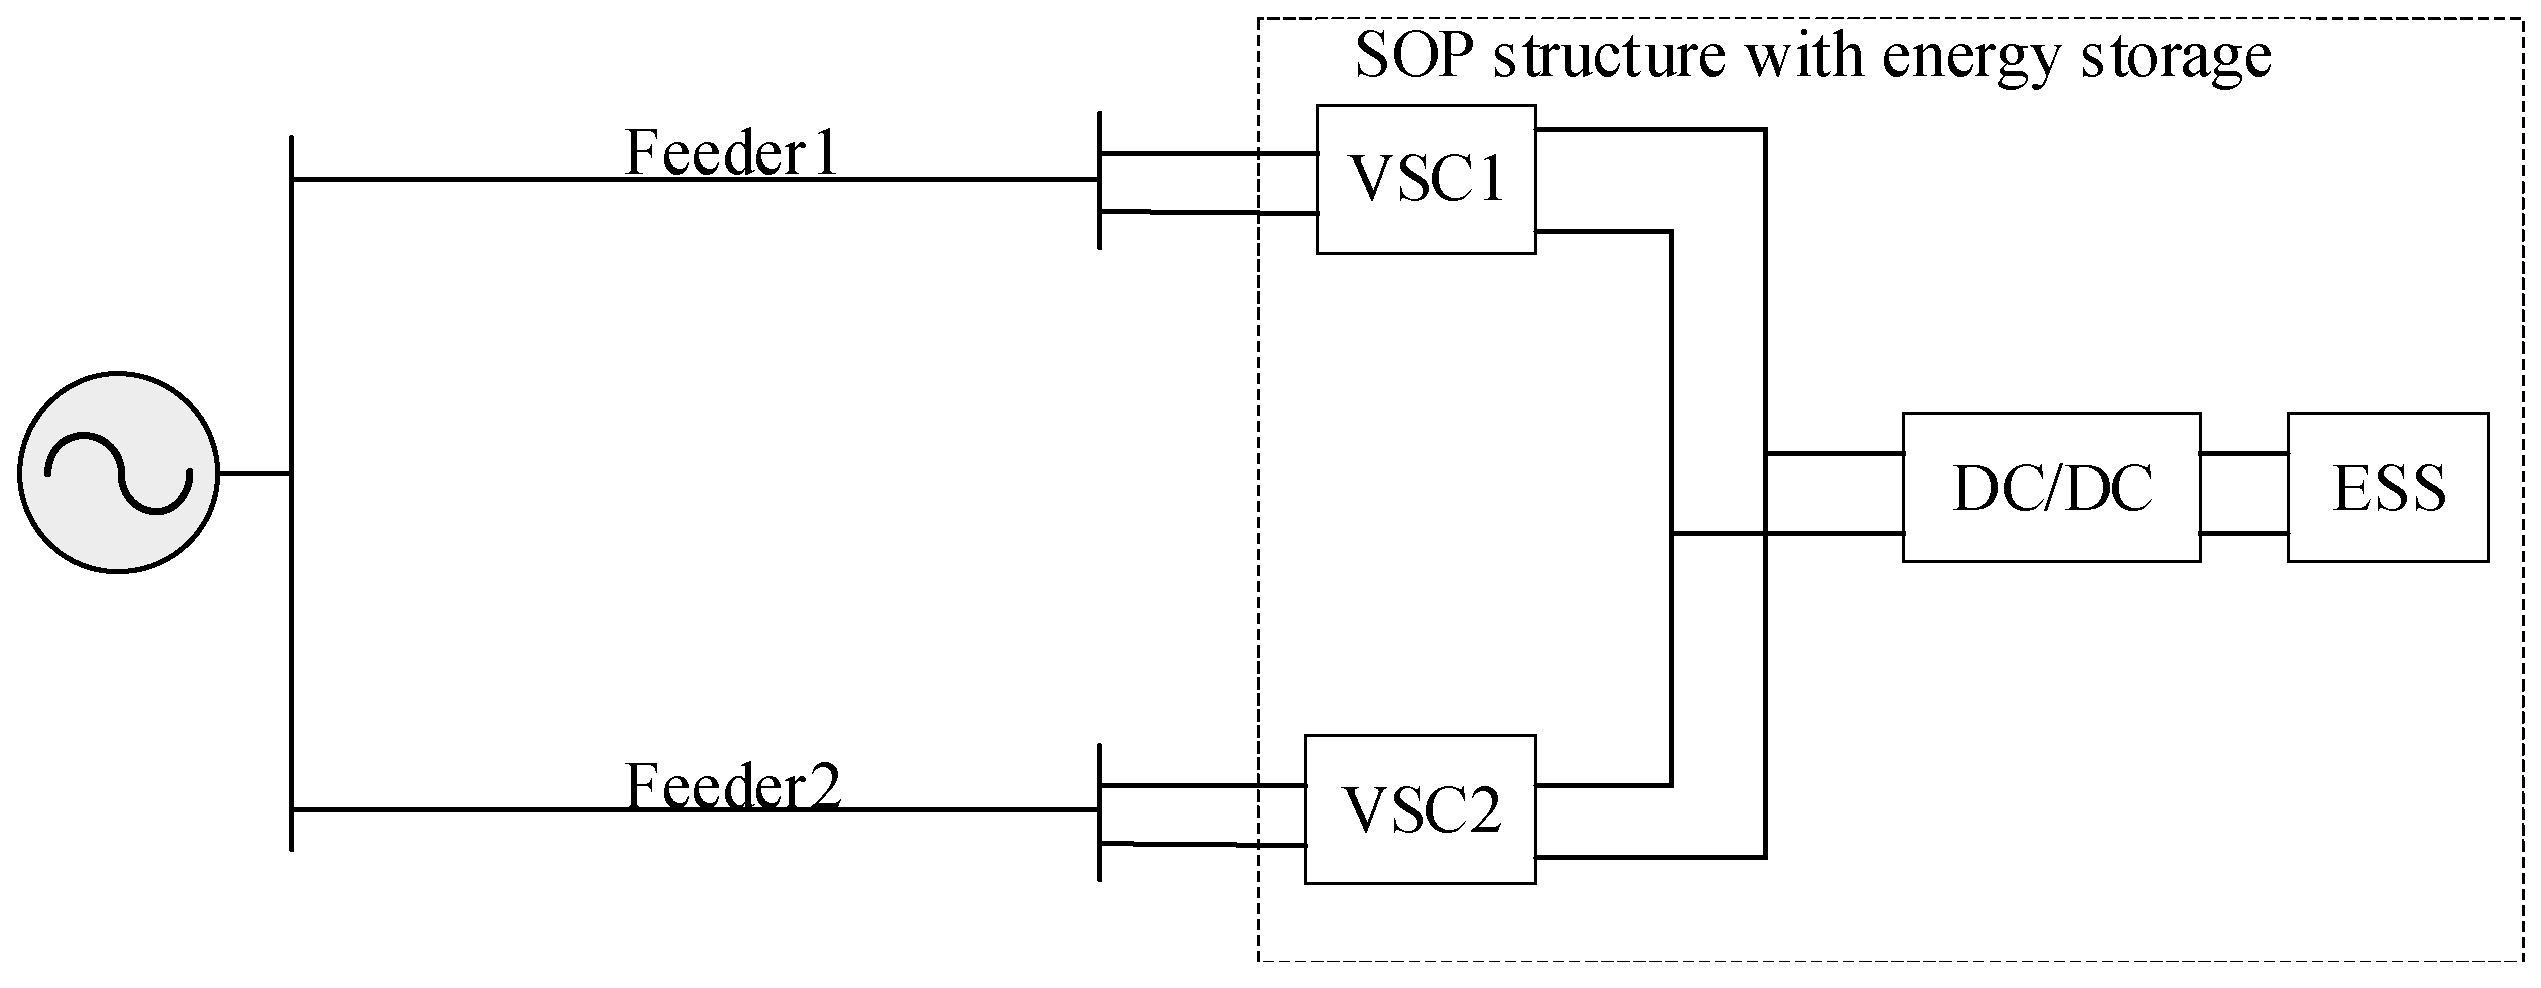
As shown in Figure 1 and Figure 2, the VSCs in SOP adopt a symmetrical configuration. Under normal operating conditions, one side operates in VdcQ control mode while the other side operates in PQ control mode. When a fault occurs in the distribution network, the VSC connected to the fault side adopts Vf control mode to provide voltage support for the fault area, while the other side continues to operate in VdcQ control mode. This paper mainly focuses on analyzing the distribution network structure with E-SOP, and the structure of the distribution network with E-SOP is shown in Figure 3.
As shown in Figure 3, E-SOP mainly consists of DC/DC converters, dual-terminal AC/DC converters, and ESS.

2.2. Mathematical Model of E-SOP

The mathematical model of E-SOP in this paper is established based on the research in [20], and the specific model is as follows:
δ c + δ d c 1
0 P c E S S δ c S D C 0 P d c E S S δ d c S D C
P E S S l o s s = P c E S S A E S S P c E S S P d c E S S + P d c E S S / A E S S
E t + 1 E S S = E t E S S + A E S S P c E S S P d c E S S / A E S S
0 E t E S S S E S S
where δc and δdc are charging and discharging flags, P c E S S and P d c E S S are charging and discharging power, respectively, E t E S S is the electric charge of the energy storage system in the E-SOP at time t, P E S S l o s s is the charging power loss, AESS is the charging loss coefficient, SDC and SESS represent the capacity of DC/DC converter and ESS, respectively.

2.3. Mathematical Model of SOP

The E-SOP needs to comply with the constraints of both SOP and ESS during operation. Taking the direction of the E-SOP output power as the positive direction, i.e., the positive power direction is toward the feeder, the soft open point (SOP) equipped with an energy storage system must satisfy certain constraints during operation. The expressions for capacity constraints and power transfer constraints are as follows:
P S O P i + P S O P j + P S O P i , l o s s + P S O P j , l o s s = P c E S S P d c E S S P E S S l o s s
P S O P i , l o s s = A S O P i ( P S O P i ) 2 + ( Q S O P i ) 2 P S O P j , l o s s = A S O P j ( P S O P j ) 2 + ( Q S O P j ) 2
P E S O P l o s s = P E S S l o s s + P S O P i , l o s s + P S O P j , l o s s
( P S O P i ) 2 + ( Q S O P i ) 2 S S O P i ( P S O P j ) 2 + ( Q S O P j ) 2 S S O P j
where i and j are the two port numbers of the E-SOP, P S O P i and P S O P j are the active power at ports i and j, respectively; Q S O P i and Q S O P j are the output power at ports i and j, respectively; P S O P i , l o s s and P S O P j , l o s s represent the power losses of SOP at ports i and j, respectively; A S O P i and A S O P j are the loss coefficients; S S O P i and S S O P j denote the capacity of SOP at ports i and j, respectively.

3. Distribution Network Model Analysis Based on Wind–Solar Uncertainty

To accurately capture these fluctuation characteristics, this paper employs the Beta distribution to model photovoltaic uncertainty and the Weibull distribution to model wind uncertainty

3.1. Photovoltaic Uncertainty Model

The output level of PV depends on solar irradiance. Regarding photovoltaic uncertainty, existing studies have shown that solar irradiance follows a Beta distribution [21], which has been validated against empirical meteorological data and demonstrates high accuracy in capturing real solar irradiance fluctuations. Beta distribution enhances the robustness of the optimization model by accurately representing the variation characteristics of solar irradiance within bounded intervals, thereby adapting to irradiance distribution patterns under different weather conditions. Therefore, the PV uncertainty model can be expressed as follows:
f ( G ) = Γ ( δ + ω ) Γ ( ω ) Γ ( δ ) ( G G max ) δ 1 ( 1 G G max ) ω 1
δ = μ μ ( 1 μ ) σ 2 1
ω = ( 1 μ ) μ ( 1 μ ) σ 2 1
P P V = P N P V G G N ,   i f   0 G G N P N P V ,   else
where f(G) is the probability density function of PV, G is the solar irradiance, Gmax is the maximum solar irradiance, GN is the rated solar irradiance. δ and ω are shape parameters following the Beta distribution, μ and σ are the expected deviation and standard deviation of solar irradiance, respectively. PPV is the output power of PV, P N P V is the rated output power of PV, and Γ is the gamma function.

3.2. Wind Power Uncertainty Model

The output level of WT depends on wind speed. Wind speed follows a Weibull distribution, which is well-established in wind energy literature and has been extensively validated against measured wind data across diverse geographical locations. Weibull distribution improves the feasibility of the optimization model under uncertainty by accurately capturing the stochastic characteristics of wind speed, thereby representing the probability distribution of wind resources. The WT uncertainty model can be expressed as follows [22]:
f ( v ) = φ α v α φ 1 exp v α φ
P W T ( v ) = 0 ,   v < v i n ,   o r ,   v > v o u t P N W T v v i n v r v i n ,   v i n v v r P N W T ,   v r v v o u t
where v is the wind speed, vin is the cut-in wind speed, vout is the cut-out wind speed, vr is the rated wind speed. f(v) is the probability density function of WT, α is the distribution characteristic of wind speed, φ is the average wind speed, P N W T is the rated output power of WT, and PWT is the output power of WT.

3.3. Objective Function

After a fault occurs in the distribution network, the outage area becomes stagnant due to power loss. Power supply needs to be restored to maintain the original operating state of the outage area. During this process, the system also experiences power losses. Therefore, this paper adopts a weighted sum of maximizing the total active load of restored nodes and minimizing losses as the objective function, as shown in the following equation:
f 1 = i N λ i P L O A D i
f 2 = i j b r i j I i j 2 + i N P S O P i , l o s s
min f = θ 1 f 1 + θ 2 f 2
where N is the set of outage nodes, b is the set of branches, Iij is the current of branch ij, Pi is the active power of node load, rij is the resistance of branch ij, f1 and f2 represent the sum of restored active power and total losses, respectively, and θ1 and θ2 are the weights of system restoration coefficient and loss coefficient, respectively. λi is the restoration coefficient, which is used to characterize the priority of node power supply restoration, and its value is set according to the node type.

3.4. Constraints

After fault isolation in the distribution network, certain constraints need to be considered during the restoration process. These constraints collectively determine the feasible restoration outcomes by limiting power transfer, ensuring voltage quality, and maintaining system stability. The constraints include power flow constraints, system security operation constraints, wind–solar power output constraints, and SOP operation constraints:
(1)
Power Flow Constraints
In this paper, the power flow calculation adopts the per-unit (p.u.) system with a base power of 100 MVA and a base voltage of 12.66 kV. The power flow constraints can be expressed as follows [23]:
P i = P D G i + P S O P i λ i P L O A D i
Q i = Q D G i + Q S O P i λ i Q L O A D i
i k b P i k = i j b ( P i j r i j I i j 2 ) + P i
i k b Q i k = i j b ( Q i j x i j I i j 2 ) + Q i
U j 2 = U i 2 2 ( r i j P i j + x i j Q i j ) + ( r i j 2 + x i j 2 ) I i j 2
I i j 2 = P i j 2 + Q i j 2 U i 2
where Pi and Qi are the active and reactive power at node i, respectively, P D G i and Q D G i are the active and reactive power of DG at node i, respectively, P L O A D i and Q L O A D i are the active power and reactive power of the node load, respectively, xij is the reactance of branch ij, Ui and Uj are the voltage amplitudes of node i and node j, respectively. Pij and Qij are the active and reactive power on branch ij, respectively.
(2)
Wind–Solar Power Output Constraints
Considering wind–solar uncertainty, the integration of DG into distribution networks will inevitably cause changes in node voltage. Therefore, wind–solar power output constraints need to be established, which can be expressed as follows:
0 P W T P max W T 0 P P V P max P V
where P max W T is the maximum power output of WT, and P max P V is the maximum power output of PV.
(3)
System Security Operation Constraints
Due to the introduction of chance constraints, the system security operation constraints can be expressed as follows:
p r { U i U i , min } γ U p r { U i U i , max } γ U
I i j , min 2 I i j 2 I i j , max 2
where Iij,max and Iij,min are the maximum and minimum branch currents, respectively, Ui,max and Ui,min are the maximum and minimum values at node i, respectively, pr(-) is the probability function, and γ is the confidence level.
(4)
SOP Operation Constraints
See Equations (6)–(9)
(5)
ESS Constraints
The constraints of ESS can be expressed as follows:
0 P c E S S δ c P c , max E S S 0 P d c E S S δ d c P d c , max E S S 0 δ c 1 0 δ d c 1 δ c + δ d c 1
E t + 1 S O C = E t S O C + δ c P c E S S β c δ d c P d c E S S β d c 1
E t , min S O C E t S O C E t , max S O C
where βc and βdc are the charging and discharging efficiencies, respectively, E t , max S O C and E t , min S O C are the maximum and minimum state of charge, respectively.

4. Solution Based on Hybrid Optimization Algorithm

4.1. Improved Dung Beetle Optimization Algorithm

The Dung Beetle Optimization algorithm simulates the social behavior of dung beetles in nature, mainly divided into rolling behavior, dancing behavior, breeding behavior, foraging behavior, and stealing behavior [24]:
(1)
Rolling Behavior(unobstructed mode)
Rolling dung beetles move forward according to light intensity. If there are no obstacles, the position update of rolling dung beetles can be expressed as follows:
x i ( t + 1 ) = x i ( t ) + α k x i ( t 1 ) + b Δ x Δ x = | x i ( t ) x worst |
where t is the current iteration number, xi(t) represents the position information of the dung beetle, α is a random number of −1 or 1, k is the deflection coefficient, b is a constant between 0 and 1, Δx represents the change in light intensity, and xworst is the worst position of the dung beetle.
(2)
Rolling Behavior(obstructed mode)
When obstacles are encountered during rolling, the position update of rolling dung beetles can be expressed as follows:
x i ( t + 1 ) = x i ( t ) + tan ( θ ) | x i ( t ) x i ( t 1 ) |
where θ ∈ [0, π].
(3)
Breeding Behavior
Female dung beetles first select a safe area for laying eggs. The egg-laying area and position update can be expressed as follows:
L B = max ( x ( 1 R ) ,   L B ) U B = min ( x ( 1 + R ) ,   U B ) R = 1 t T
B i ( t + 1 ) = x + b 1 ( B i ( t ) L B ) + b 2 ( B i ( t ) U B )
where UB* and LB* are the upper and lower bounds of the egg-laying area, UB and LB are the upper and lower bounds of the optimization problem, T is the maximum number of iterations, b1 and b2 are 1 × D vectors, D is the dimension of the problem, Bi(t) represents the position information of the dung ball, and x* is the global optimal position of the current dung beetle.
(4)
Foraging Behavior
Young dung beetles select suitable areas for foraging. The foraging area and position update of young dung beetles can be expressed as follows:
L B b = max ( x best ( 1 R ) , L B ) U B b = min ( x best ( 1 + R ) , U B )
x i ( t + 1 ) = x i ( t ) + c 1 ( x i ( t ) L B b ) + c 2 ( x i ( t ) U B B )
where UBb and LBb are the upper and lower bounds of the foraging area, xbest is the local optimal position of the current dung beetle, c1 is a random number following normal distribution, and c2 is a random vector between 0 and 1.
(5)
Stealing Behavior
Thief dung beetles steal dung balls from other dung beetles, and their position update can be expressed as follows:
x i ( t + 1 ) = x best + S g ( | x i ( t ) x | + | x i ( t ) x b e s t | )
where g is a 1 × D vector following a normal distribution, and S is a constant.
The standard DBO still faces problems such as easily falling into local optima and low convergence precision. Therefore, Logistic chaotic mapping, golden sine strategy, and position update coefficients are introduced for improvements:
(1)
Logistic Chaotic Mapping
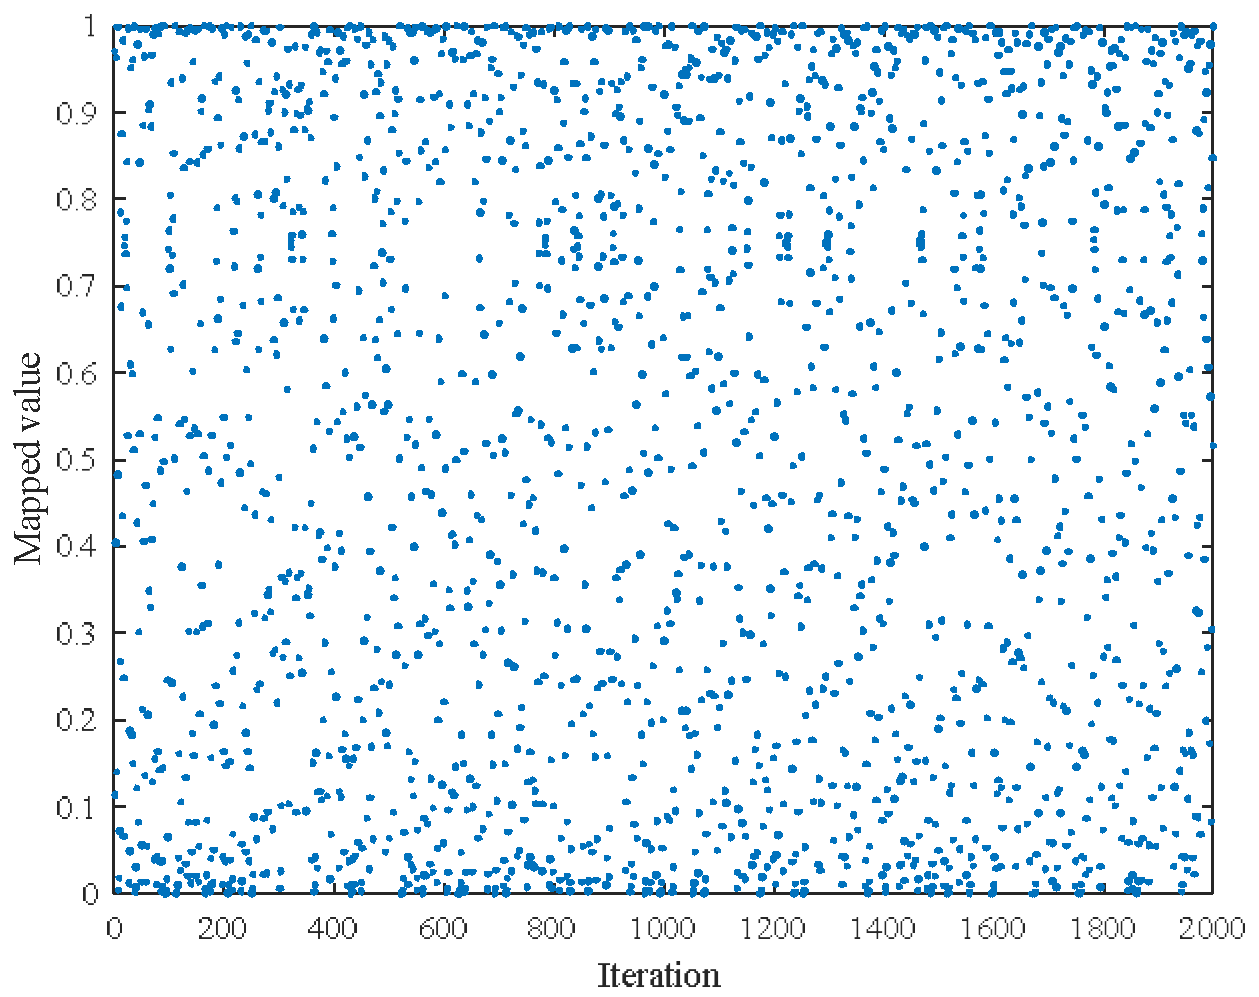
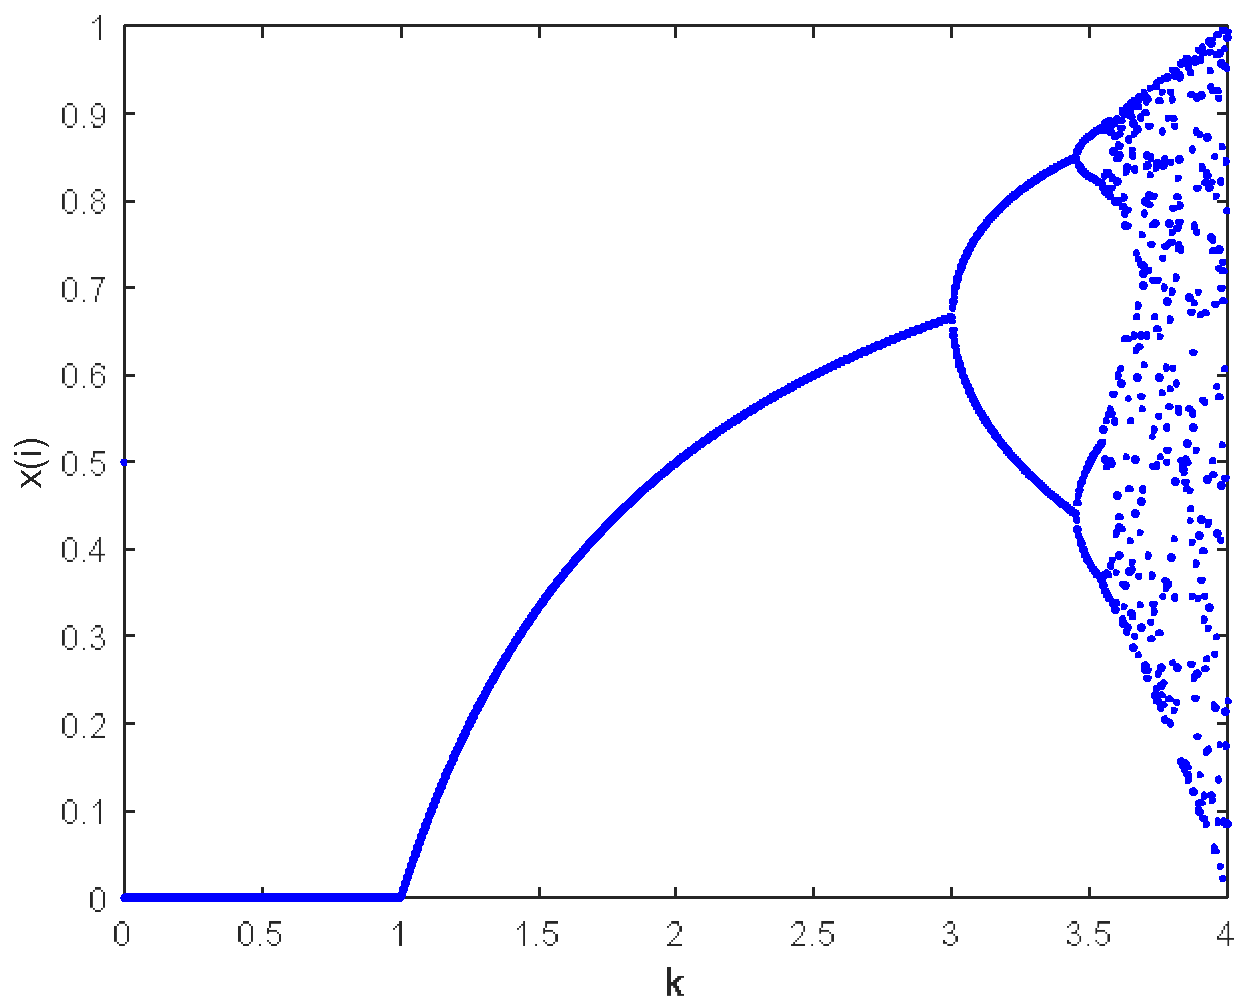
Introducing Logistic chaotic mapping to initialize the DBO algorithm can optimize the diversity of the dung beetle population, thereby improving the algorithm’s optimization efficiency. The space distribution diagram and bifurcation diagram of the logistic chaotic mapping are shown in Figure 4 and Figure 5, respectively.
As shown in Figure 4 and Figure 5, Logistic chaotic mapping exhibits good uniform distribution characteristics [25]. The mathematical expression of the logistic chaotic mapping is as follows:
x n + 1 = x n k ( 1 x n ) x n ( 0 , 1 ) , k [ 0 , 4 ]
where k is the bifurcation parameter, xn is the chaotic initial value, and xn + 1 is the chaotic value.
(2)
Golden Sine Strategy
To enable rolling dung beetles to conduct thorough searches in the solution space, the dancing behavior of rolling dung beetles is modified to the golden sine strategy [26]. This process can be expressed by the following Equation:
x i ( t + 1 ) = x i ( t ) × | sin ( R 1 ) | + R 2 × sin ( R 1 ) × | x 1 × x best x 2 × x i ( t ) | x 1 = π + ( 1 τ ) × 2 π x 2 = π + τ × 2 π τ = 5 1 2
where R1 ∈ [0, 2π] and R2 ∈ [0, π].
(3)
Dynamic Weight Coefficient for Position Update
To balance the algorithm’s global exploration and local exploitation capabilities during the stealing behavior phase, a dynamic weight coefficient for position update is introduced for improvement. This process can be expressed by the following Equation [27]:
k 1 = 1 t 3 T 3 k 2 = t 3 T 3 x i ( t + 1 ) = k 1 × x best + k 2 × S × g × ( | x i ( t ) x | + | x i ( t ) x best | )
where k1 and k2 are weight coefficients.
To verify the effectiveness of the proposed algorithm, performance validation is conducted using the Sphere function and the Schwefel 2.22 function. Comparative simulations are also conducted with the standard Dung Beetle Optimization (DBO) algorithm, Particle Swarm Optimization (PSO) [28], Differential Evolution (DE) [29], Genetic Algorithm (GA) [30], and Grey Wolf Optimizer (GWO) [31]. The characteristics of different benchmark algorithms are shown in Table 1.
The maximum number of iterations for each method is set to 800, and the population size is set to 30. To avoid simulation randomness, each algorithm is run independently 30 times. The mathematical expressions of the two functions are as follows:
F S p h e r e = i = 1 30 x i 2 F S c h w e f e l = i = 1 30 x i + i = 1 30 x i
where the optimal solutions for both FSphere and FSchwefel are 0, xi is i-th dimension of solution vector.
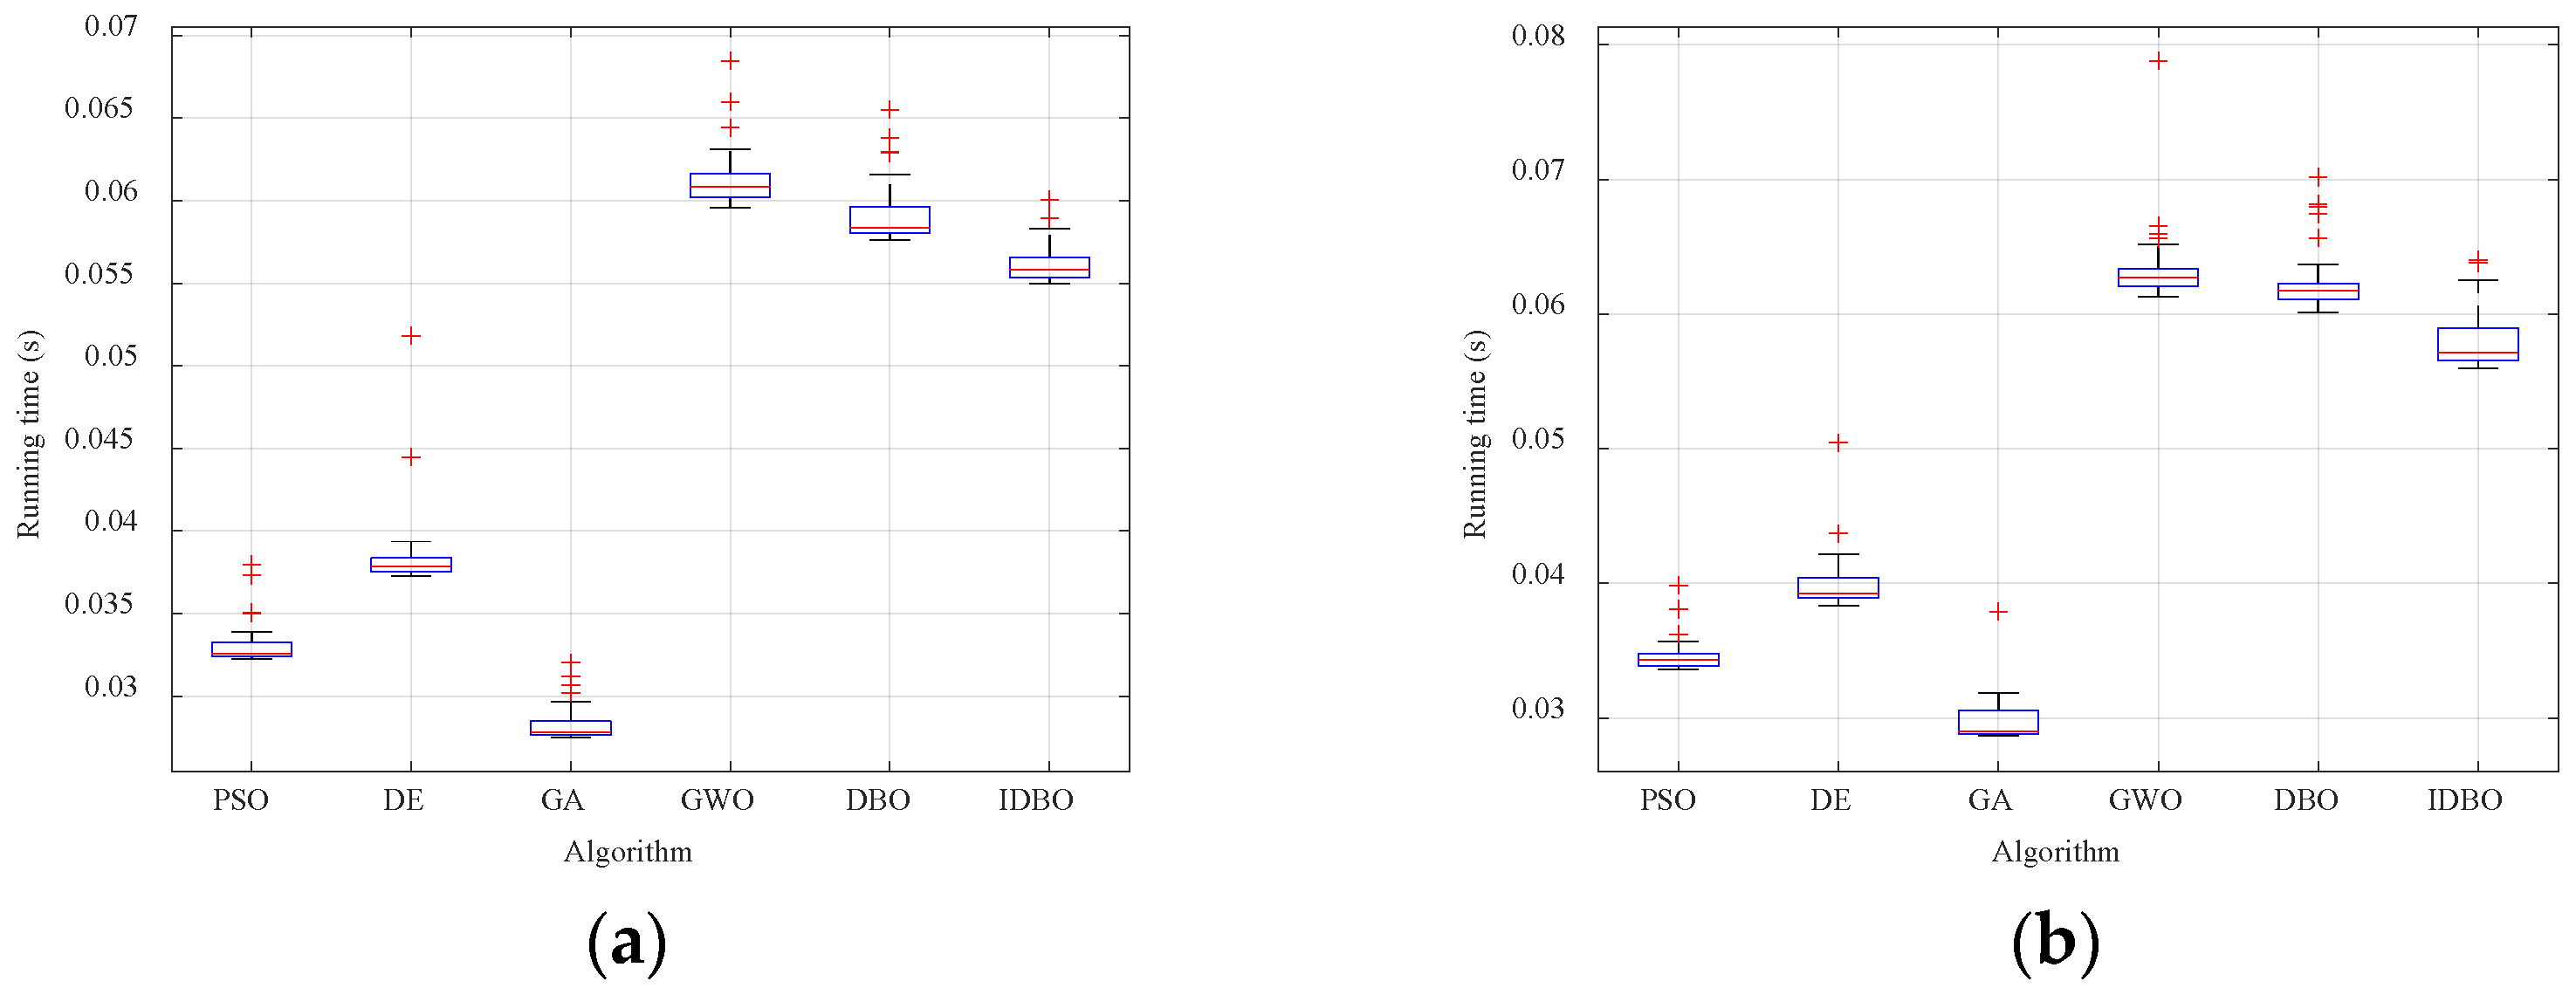
The optimization results of the proposed method are shown in Figure 6, the boxplots of the runtime of each algorithm are presented in Figure 7, and the detailed optimization results are listed in Table 2.
From the results presented in Figure 6 and Table 2, it can be observed that on the FSphere function, the proposed IDBO algorithm achieves the optimal solution with a Best Value of 0, while the best value of the DBO algorithm is 8.93 × 10−251. On the FSchwefel function, the IDBO algorithm also obtains the optimal solution: the Best Value of the DBO algorithm is 2.15 × 10−132, and algorithms such as PSO, DE, GA, and GWO all struggle to achieve excellent optimization performance. Meanwhile, the IDBO algorithm achieves a smaller average value on both functions, indicating that the algorithm has stronger convergence stability.
This indicates that the logistic chaotic mapping enhances the diversity of population initialization and avoids premature convergence; the golden sine strategy improves exploration capability by covering the search space more comprehensively, thereby converging to the global optimum faster; and the dynamic weight coefficients enhance solution quality by balancing global exploration and local exploitation during the “stealing behavior” phase.
However, the runtime of the proposed IDBO algorithm is longer than that of the other algorithms. This shows that IDBO spends more time finding better solutions. Nevertheless, the above results demonstrate significant improvements in the algorithm’s convergence speed and solution accuracy, validating the enhanced performance of the proposed method.

4.2. Second-Order Cone Programming and Chance-Constrained Programming

This paper adopts the Sample Average Approximation (SAA) method to handle the chance constraint problem. This method converts probabilistic constraints into deterministic mixed-integer constraints via Monte Carlo sampling. Additionally, since the proposed model in this paper is a complex nonlinear model that is difficult to solve, it needs to be transformed into a Mixed-Integer Second-Order Cone Programming (MISOCP) model. The specific steps are as follows: First, convert the constraints of the Solid State Transformer (SOP) into the following form [15]:
( P S O P i ) 2 + ( Q S O P i ) 2 2 P S O P i , l o s s 2 A S O P i P S O P i , l o s s 2 A S O P i ( P S O P j ) 2 + ( Q S O P j ) 2 2 P S O P j , l o s s 2 A S O P j P S O P j , l o s s 2 A S O P j
( P S O P i ) 2 + ( Q S O P i ) 2 2 S S O P i 2 S S O P i 2 ( P S O P j ) 2 + ( Q S O P j ) 2 2 S S O P j 2 S S O P j 2
2 P i j 2 Q i j I i j 2 U i 2 2 I i j 2 + U i 2
Second, considering the uncertainty in wind and solar power outputs, Monte Carlo random sampling is first performed on the wind and solar power outputs. Subsequently, the sample average approximation (SAA) method is adopted to rewrite the equations, converting the chance constraints into deterministic conic constraints, and further transforming the original problem into a mixed-integer second-order cone programming (MISOCP) problem. This process handles uncertainty through deterministic conic constraints, enabling the solution of the stochastic problem, which can be specifically expressed by the following equations:
U i , min | U S i | H Z j , min , j = 1 , 2 , , N s | U S i | U i , min H Z j , max , j = 1 , 2 , , N s j = 1 N s Z j , min ( 1 γ U ) N s j = 1 N s Z j , max ( 1 γ U ) N s Z j , min , Z j , max { 0 , 1 }
where Ns is the number of samples, U S i is the voltage value of node i under sample S, H is a large positive number, Zj is the binary variable introduced in scenario j, Zj = 0 indicates no voltage limit violation occurs, and Zj = 1 indicates voltage limitation is applied, and Zj,min and Zj,max are the upper and lower bounds of the scenario, respectively.
The MISOCP transformation preserves the physical constraints of the power system by maintaining the relationship between power flows, voltages, and currents. Compared to the conservative strategies of robust optimization, chance-constrained programming can better utilize distributed generation resources and achieve a better balance between operational safety and load restoration effectiveness while ensuring voltage and current limits are satisfied at the specified confidence level to maintain distribution network operational safety. The convex nature of MISOCP guarantees global optimality for the continuous variables, ensuring the precision and feasibility of the power supply restoration solution.

4.3. Analysis of Distribution Network Fault Restoration Model

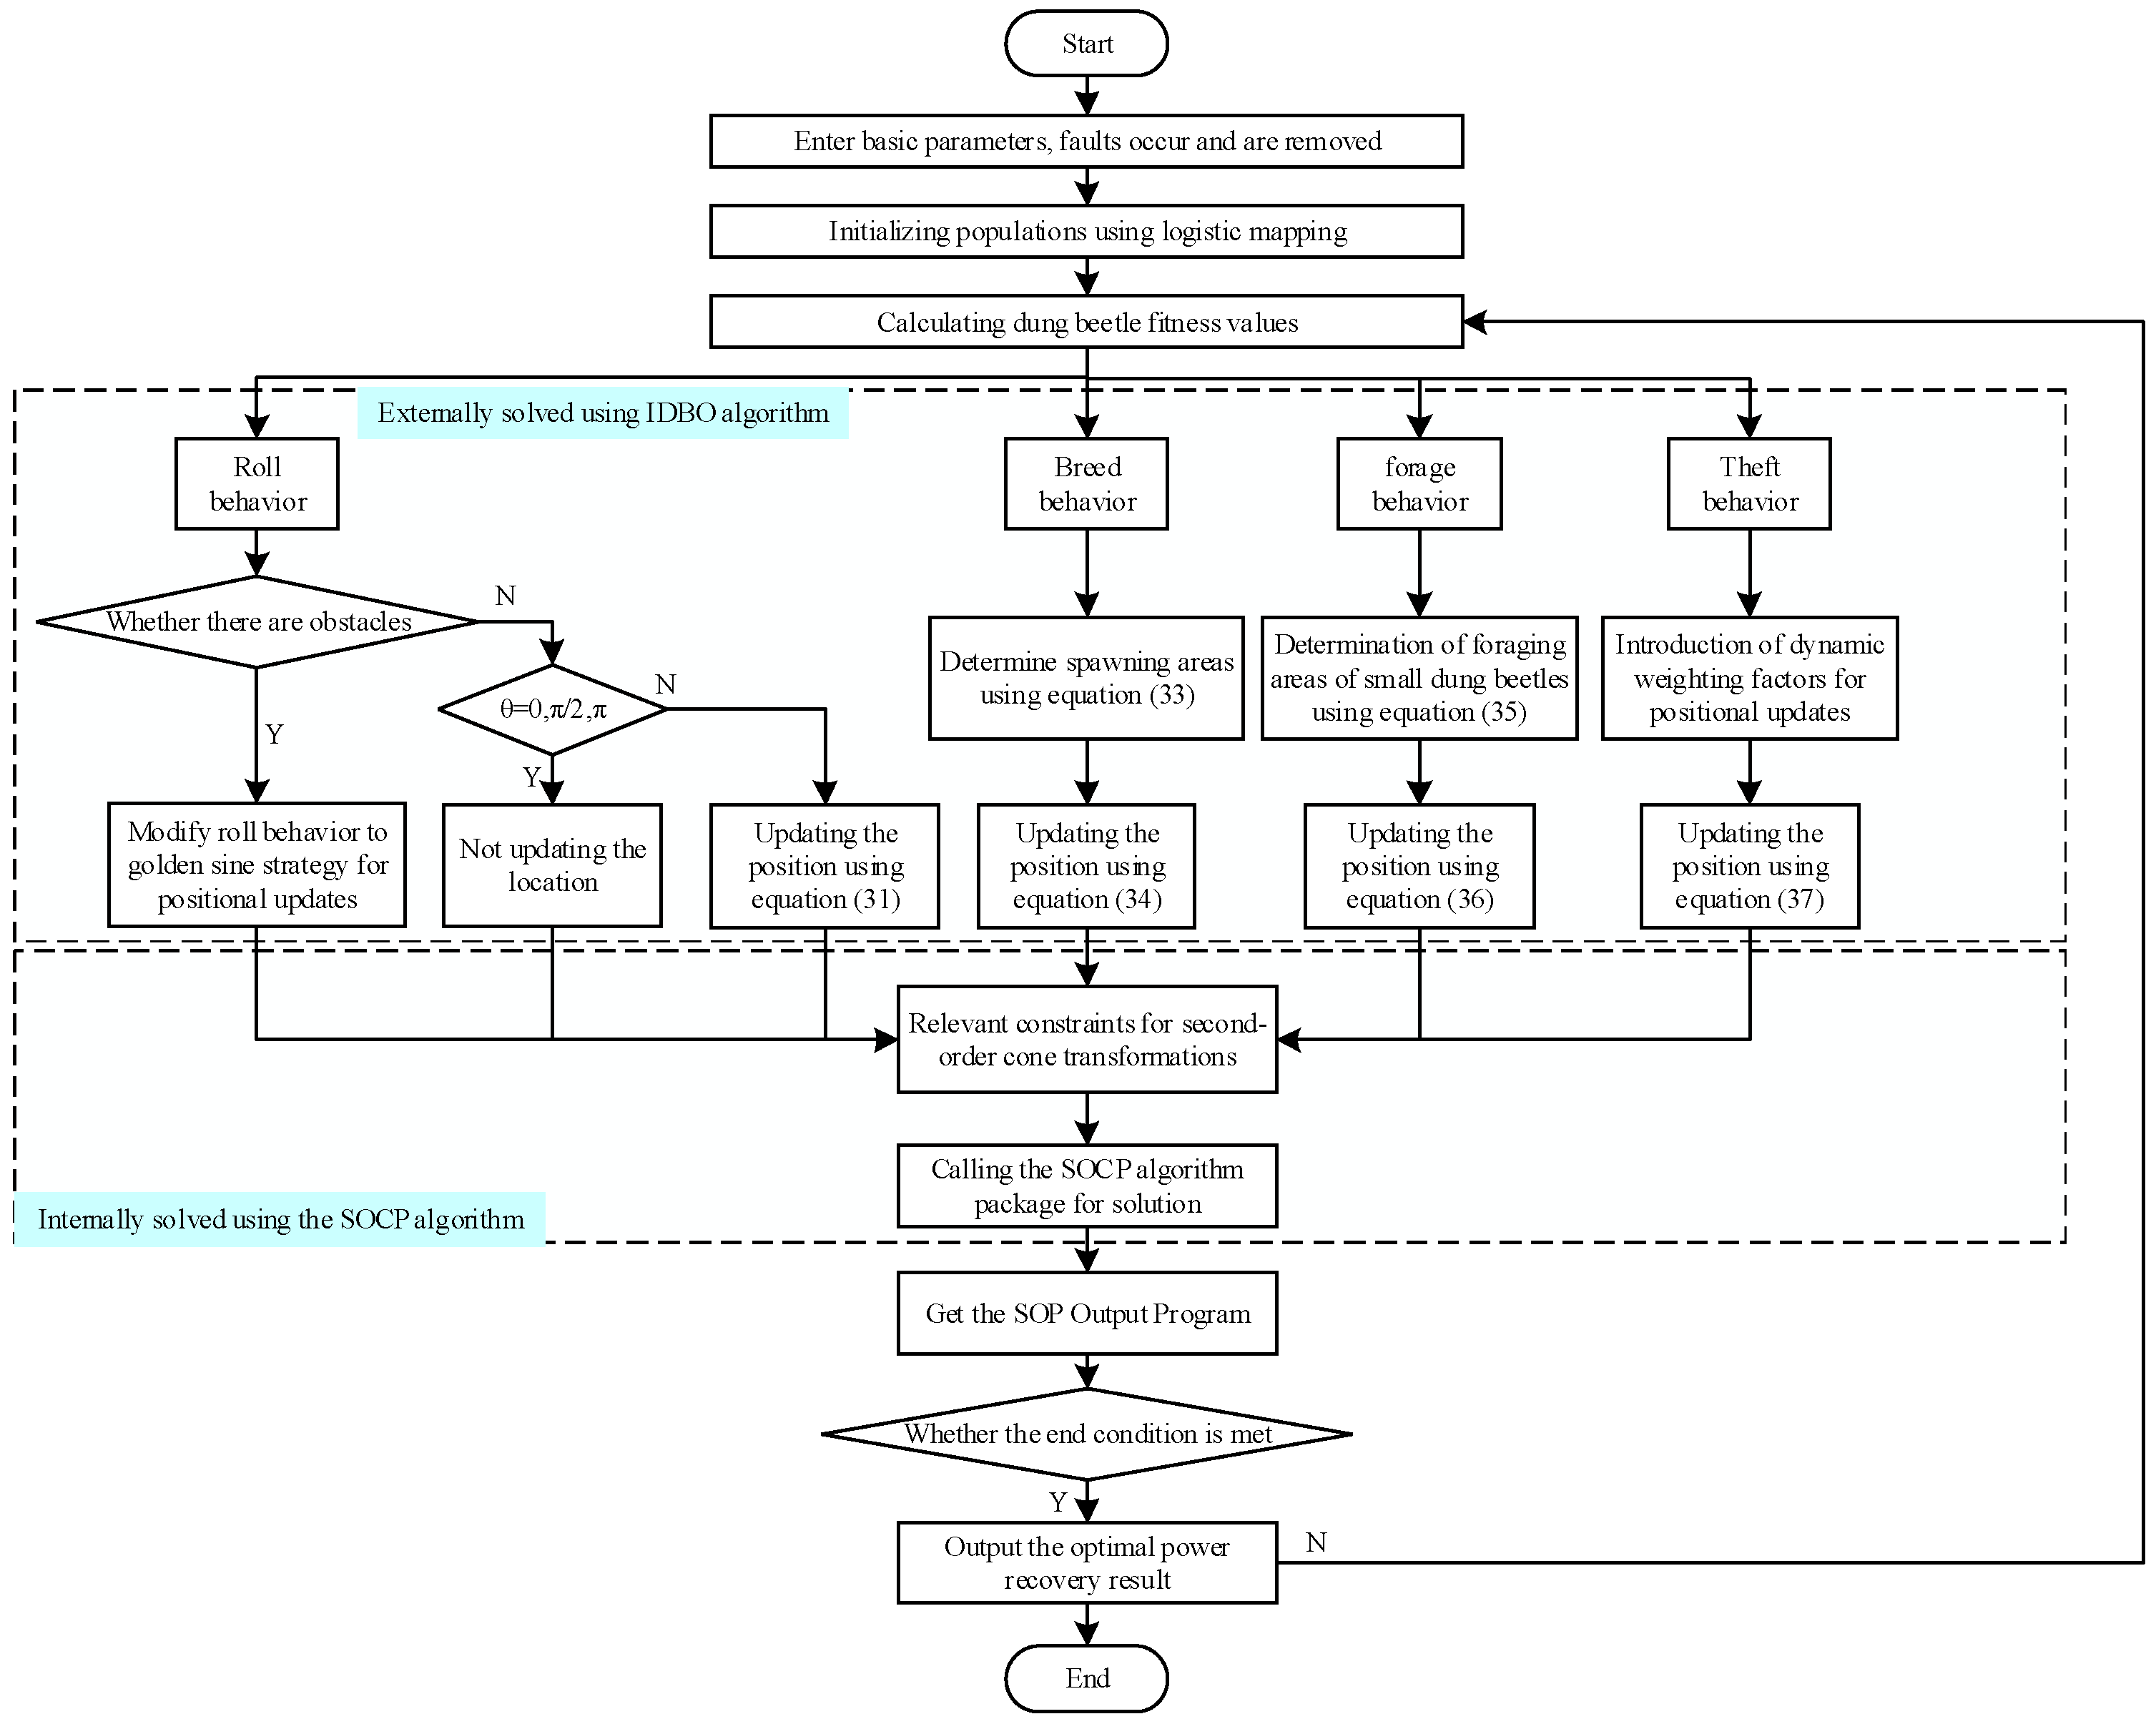
The flowchart of the model solution combining the IDBO algorithm and the MISOCP algorithm is shown in Figure 8.
The specific steps of the distribution network fault restoration model in this paper are as follows:
Step 1: Input the basic network parameters and isolate the fault after its occurrence.
Step 2: Initialize the dung beetle population using Logistic chaotic mapping and calculate fitness values.
Step 3: First, enter the rolling behavior and check for obstacles. If obstacles exist, modify the rolling behavior to the golden sine strategy for updates; if not, continue to check the value of θ. When θ equals 0, π, or 2π, do not update the position; otherwise, update the position using Equation (31).
Step 4: Conduct breeding behavior by first determining egg-laying positions using Equation (33), then update dung ball positions using Equation (34); next, perform foraging behavior by first determining foraging areas using Equation (35), then update young dung beetles’ positions using Equation (36); finally, introduce dynamic weight coefficients for position update into the stealing behavior of dung beetles and update positions using Equation (37).
Step 5: Transform relevant constraints into second-order cone form and solve internally using MISOCP.
Step 6: Check if the model meets the termination conditions. If satisfied, output the optimal power supply scheme; otherwise, continue the iteration.

5. Case Study

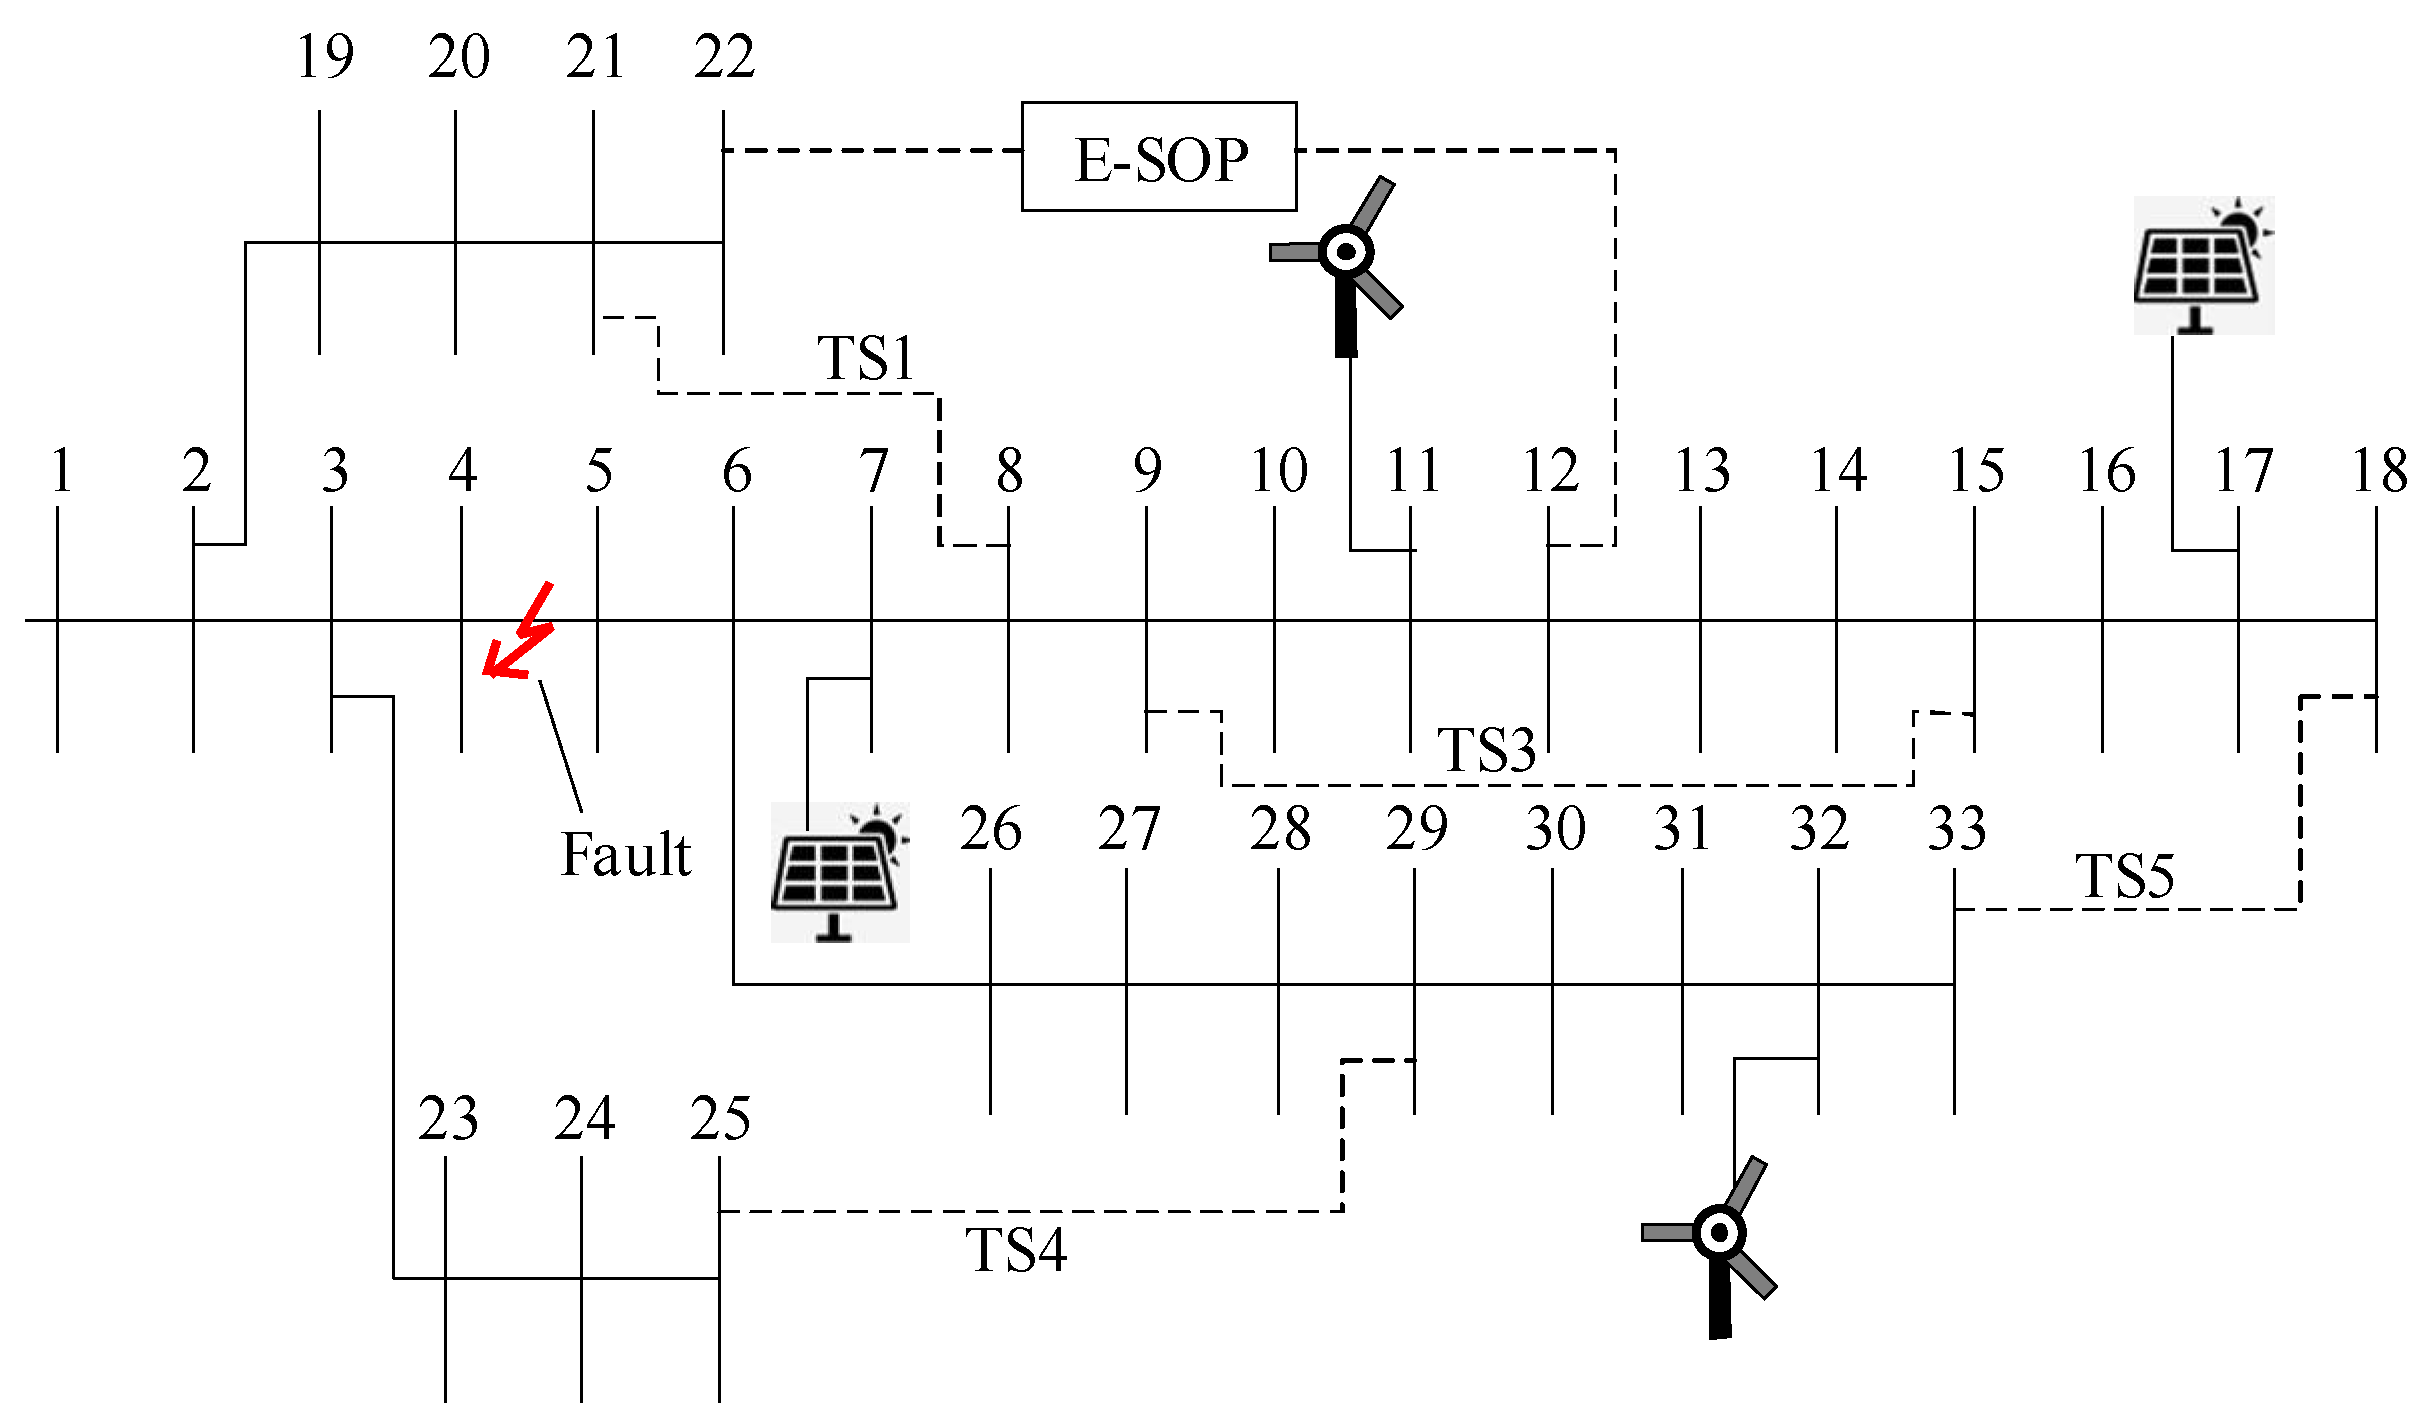
The proposed model is validated on a modified IEEE 33-node distribution network [32,33]. The system consists of 33 nodes and 5 tie switches, with a voltage level of 12.66 kV, an active load of 3715 kW, and a reactive load of 2300 kvar. Here, tie switch TS2 is replaced with E-SOP, and WTs with 200 kW power capacity are connected at nodes 11 and 32, while PVs with 200 kW power capacity are connected at nodes 7 and 17.
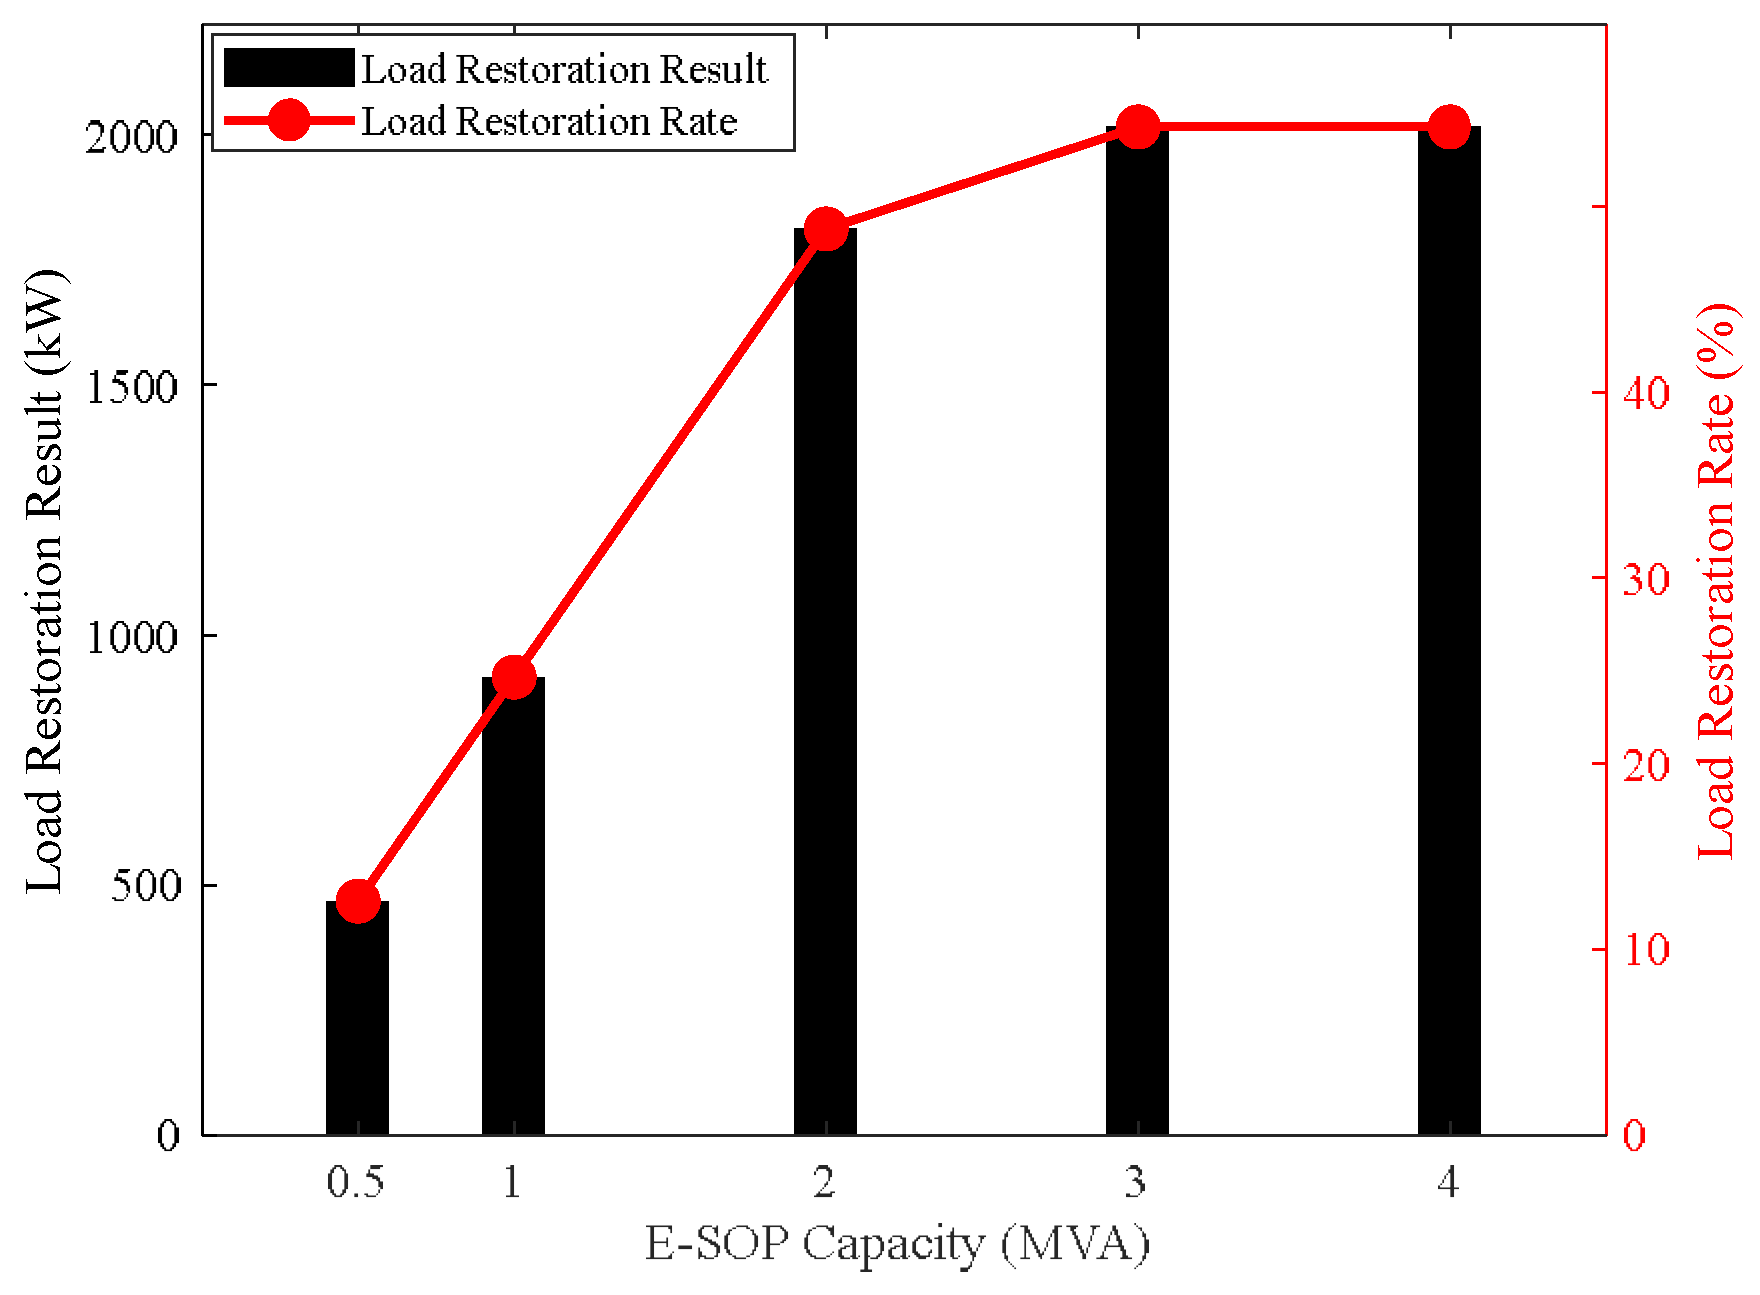
First, as shown in Figure 9, the power supply restoration effects under different E-SOP capacities are analyzed. Assuming a permanent fault occurs between branches 1–2, all nodes lose power after isolation. Five scenarios with capacities of 0.5 MVA, 1 MVA, 1.5 MVA, 2 MVA, and 3 MVA are analyzed. The power supply restoration results under different capacities are shown in Figure 10, and the detailed restoration results are presented in Table 3.
As shown in Figure 10 and Table 3, the load restoration of the distribution network increases with the increase in E-SOP capacity, with the restoration rate improving from 12.58% at 0.5 MVA to 54.32% at 3 MVA, indicating a positive correlation between storage capacity and restoration capability, highlighting the critical role of E-SOP in enhancing restoration reliability under varying fault scenarios.
E-SOP storage systems contribute to load restoration by providing immediate power support during DG output fluctuations and storing excess renewable energy during high generation periods for use during outages. However, when E-SOP capacity exceeds 3 MVA, the load restoration effect plateaus at 54.32%, indicating a saturation point where network topology constraints become the limiting factor rather than storage capacity. In radial distribution networks like the IEEE 33-node system, this saturation occurs due to limited alternative paths for power flow, whereas meshed networks would typically exhibit higher restoration limits before reaching topology-imposed constraints. Therefore, optimal E-SOP capacity determination requires balancing restoration benefits against capacity costs, necessitating appropriate E-SOP capacity selection based on actual conditions.

5.1. Case Study 1

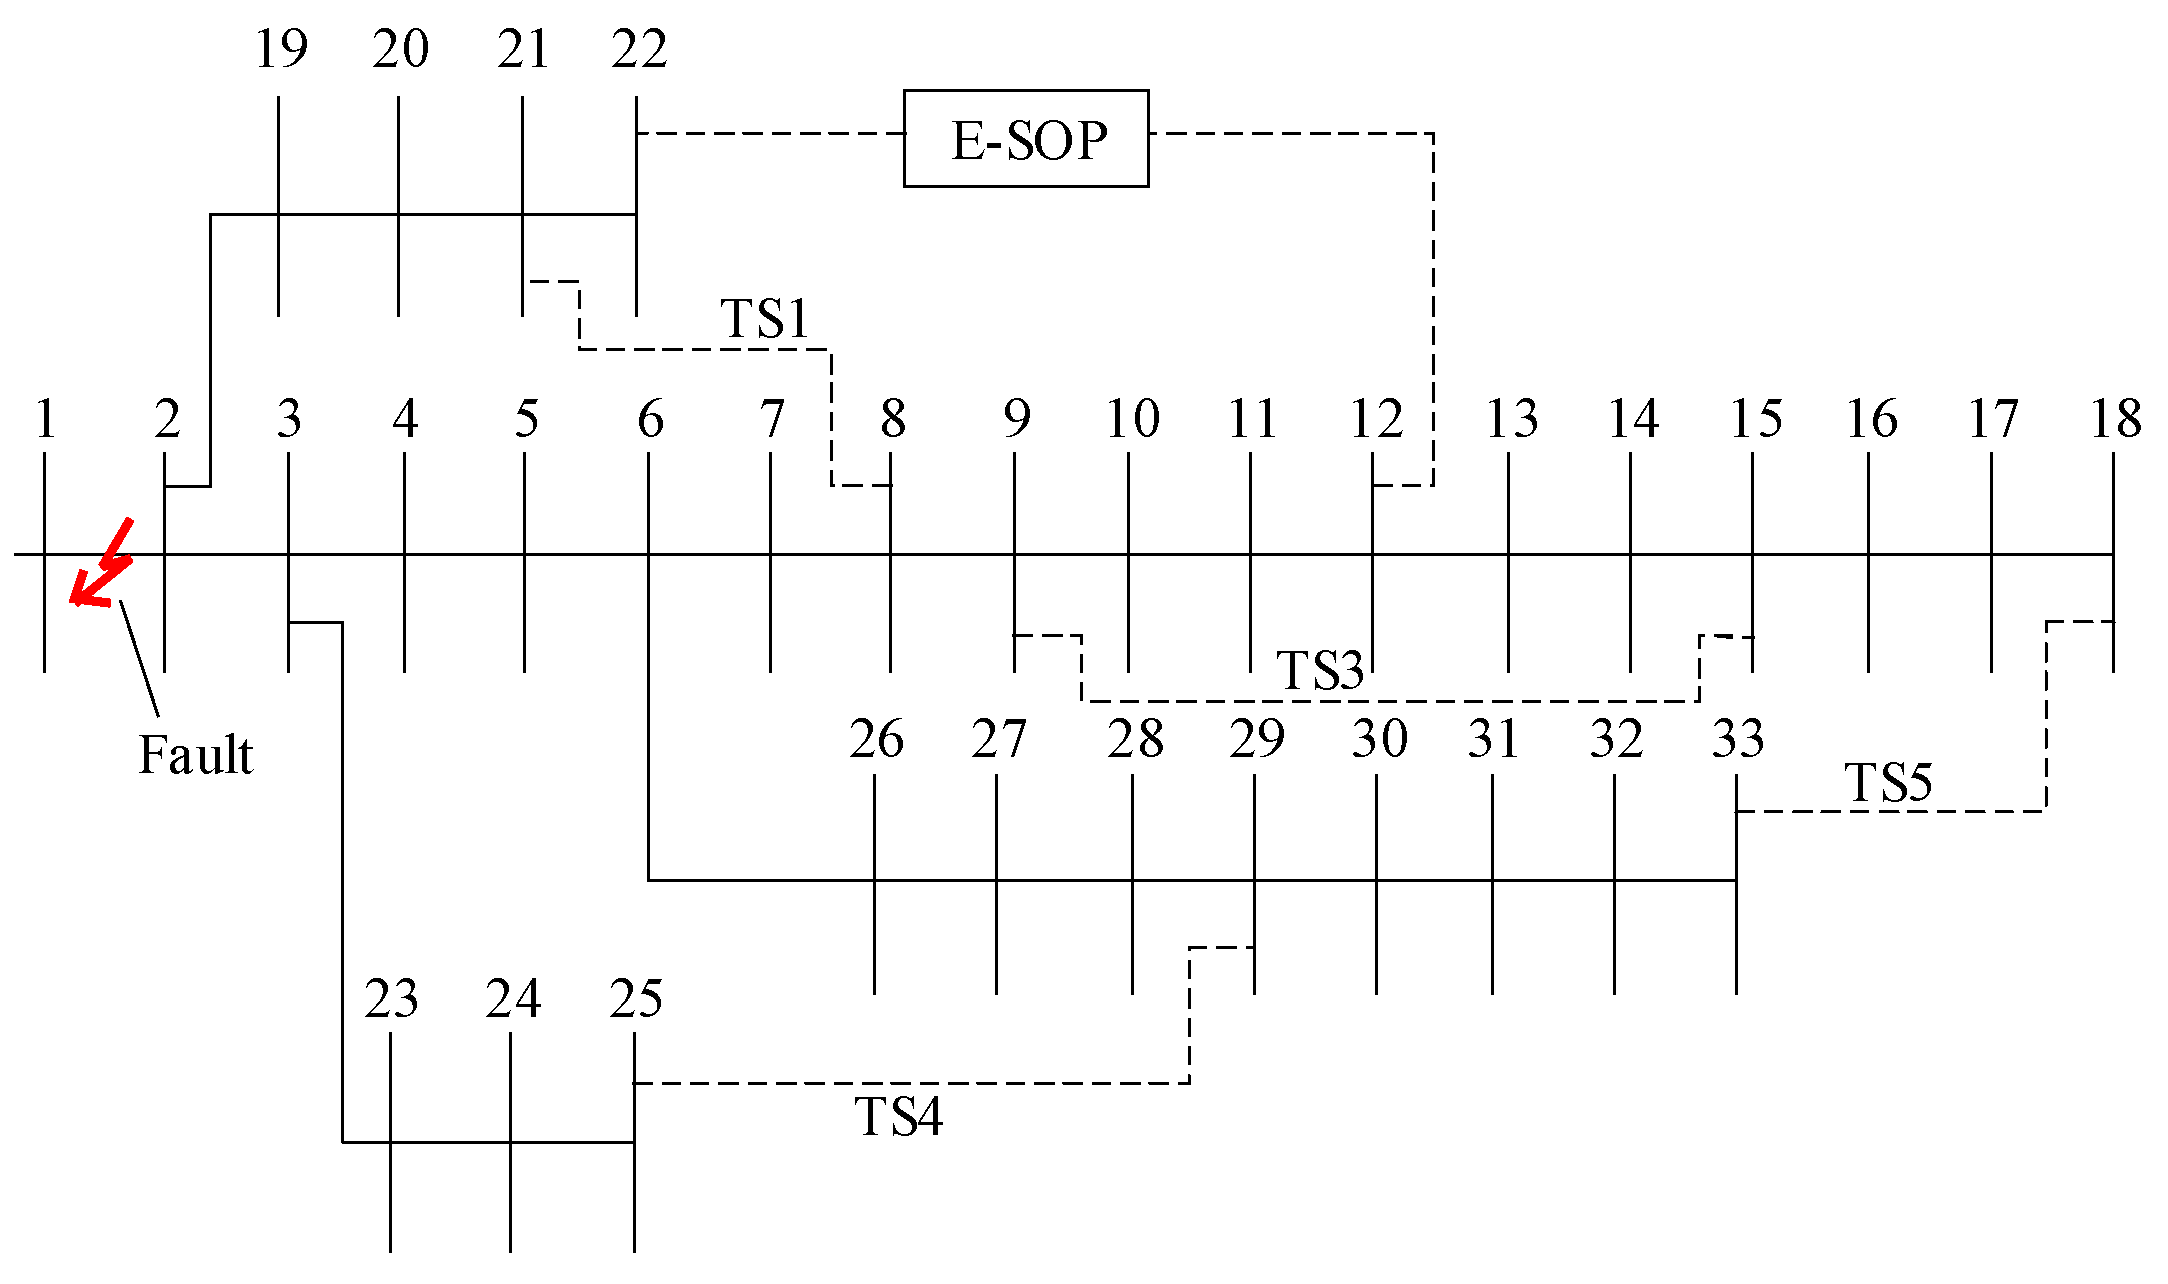
Assuming a three-phase permanent fault occurs between nodes 4 and 5, causing a power outage at nodes 5–18 and nodes 26–33, with an outage load of 2135 kW. The weights of system restoration coefficient θ1 and loss coefficient θ2 are set to 100 and 1, respectively. E-SOP capacity is set to 1 MVA, and the per-unit voltage range is [0.95, 1.05]. For WT, φ, a, vin, vout, vr, and power factor are set to 4.359, 1.213, 4 m/s, 21 m/s, 12 m/s, and 0.95, respectively. For PV, δ, ω, photoelectric conversion rate, Gmax, and power factor are set to 0.482, 1.885, 0.21, 1.08 kW/m2, and 0.95, respectively. The number of random scenarios is set to 100, and the number of iterations of the IDBO algorithm is set to 100. The case study structure is shown in Figure 11.
All simulations in this paper are conducted in MATLAB R2022b on a Windows 11 system equipped with a 13th Gen Intel® Core™ i5-13400F processor and 16 GB of RAM. The proposed Mixed-Integer Second-Order Cone Programming (MISOCP) model is solved using IBM ILOG CPLEX Optimization Studio Version 12.10, with the following key parameters: optimality gap tolerance of 1 × 10⁻⁶, barrier convergence tolerance of 1 × 10⁻⁶, and a solution time limit of 3600 s. The CPLEX solver adopts the barrier algorithm, combining the interior-point method to handle continuous relaxation problems and the branch-and-bound method to solve integer variables. To verify the effectiveness of the proposed method, three scenarios are set up for simulations:
Case 1: Power supply restoration using tie switches, where tie switches transfer loads from faulted feeders to normally operating feeders simply by closing, and the switches operate in binary mode (open/close).
Case 2: Power supply restoration using network reconfiguration. This method involves opening and closing multiple switches throughout the network to find an optimal radial configuration that maximizes load restoration while satisfying operational constraints.
Case 3: Power supply restoration using the proposed method. This method employs E-SOP as a flexible interconnection device that can actively control power flow between feeders and provide continuous power regulation and energy storage capabilities.
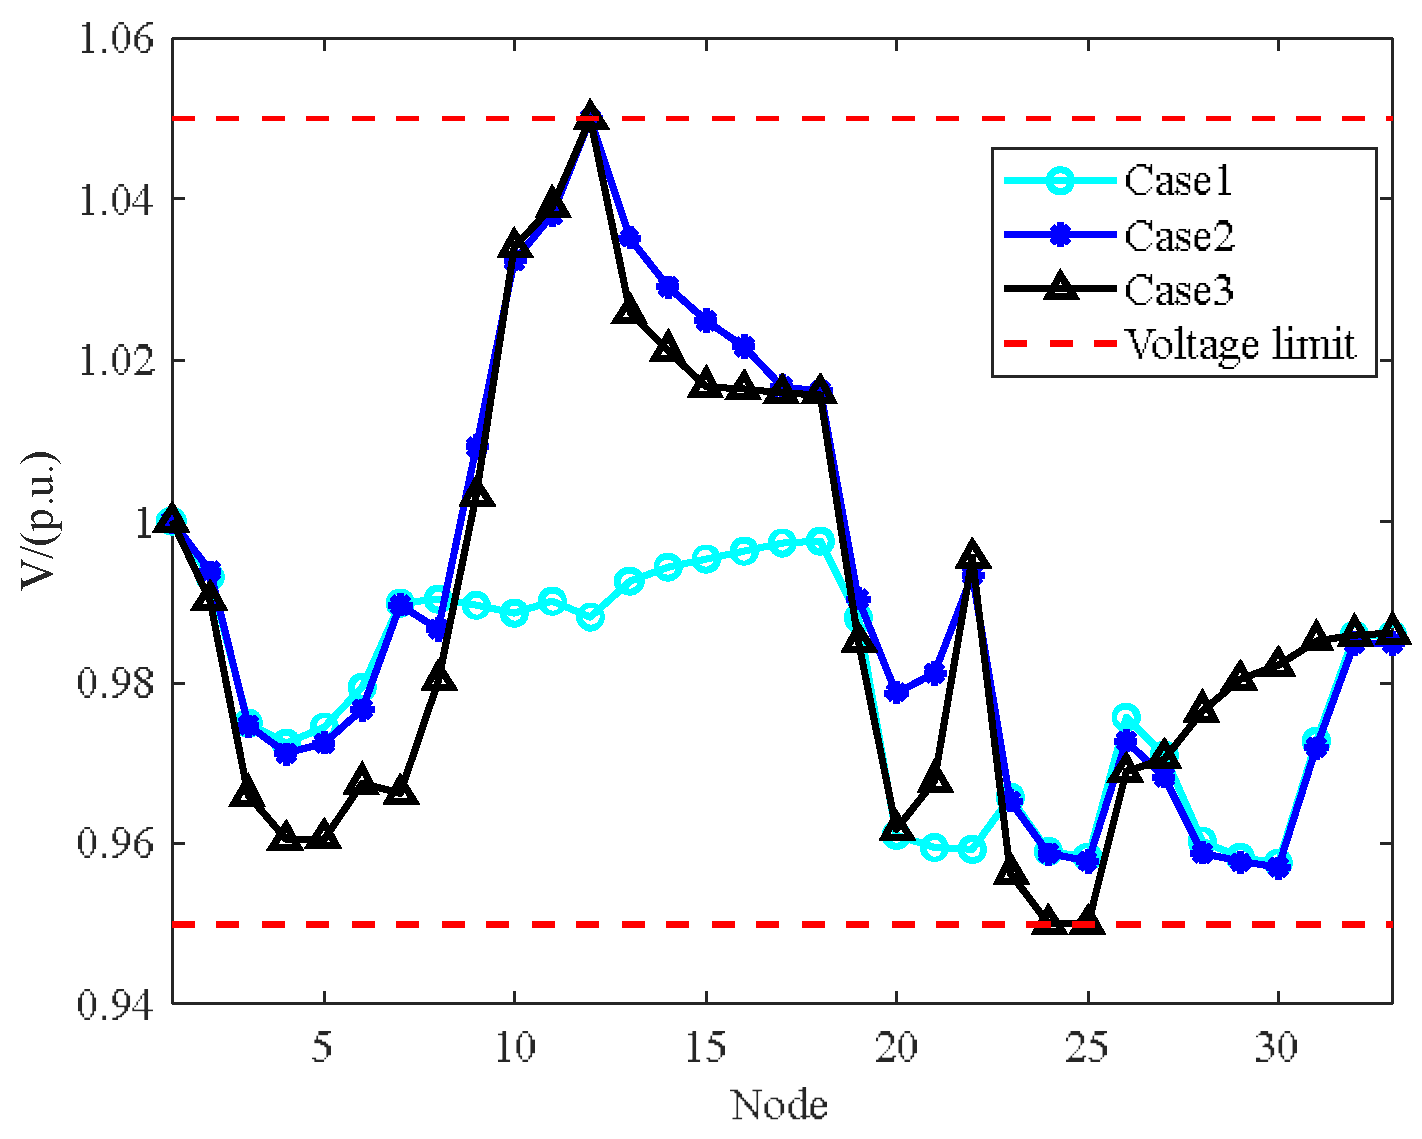
The reconfigured network structure for Case 2 is shown in Figure 12, the load restoration results of different methods are shown in Table 3, and the voltage distribution of different methods is shown in Figure 13.
As shown in Table 4 and Figure 13, compared with Case 1, using only tie switches for the power supply, the power supply restoration rate using network reconfiguration in Case 2 increased by 18.74%, achieving better restoration effects. This is because network reconfiguration can continuously optimize and adjust the operating state of the entire system, thereby providing better power supply to outage areas. For Case 3, the load restoration rate achieved 85.05% using the hybrid algorithm combining improved dung beetle optimization and MISOCP, showing increases of 34.23% and 15.49% compared to Case 1 and Case 2, respectively.
This demonstrates the significant functional advantages of E-SOP over conventional tie switches in post-fault scenario management. Although conventional tie switches have lower costs compared to E-SOP, they can only provide binary switching functionality, with their power supply capability entirely dependent on upstream power source quality and capacity, and unable to perform power regulation. In contrast, E-SOP possesses bidirectional active and reactive power regulation capabilities, enabling flexible power distribution according to load demands. Furthermore, E-SOP provides specific operational benefits, including voltage support during contingencies, power quality regulation through reactive power compensation, and real-time power flow control across feeders. Their energy storage systems can provide power support when the DG output is insufficient. This indicates that the proposed method demonstrates strong potential for enhancing restoration performance in solving power supply restoration problems.

5.2. Case Study 2

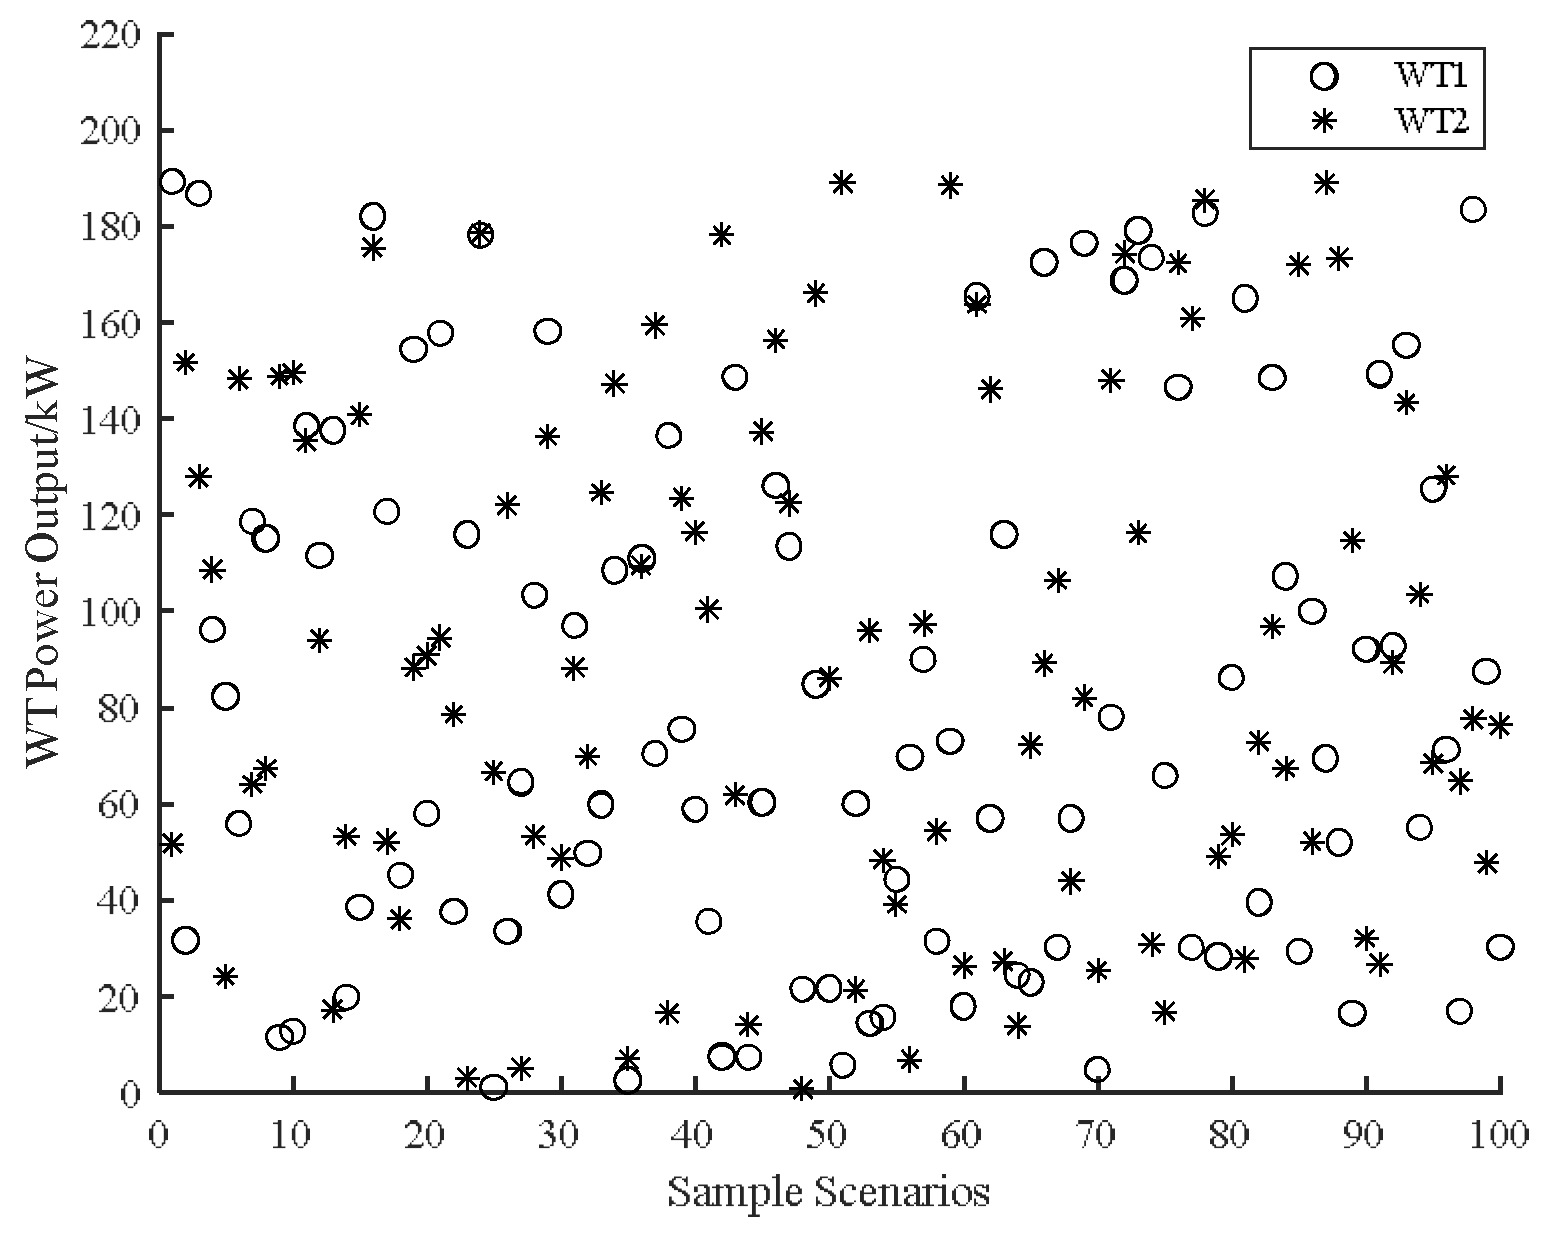
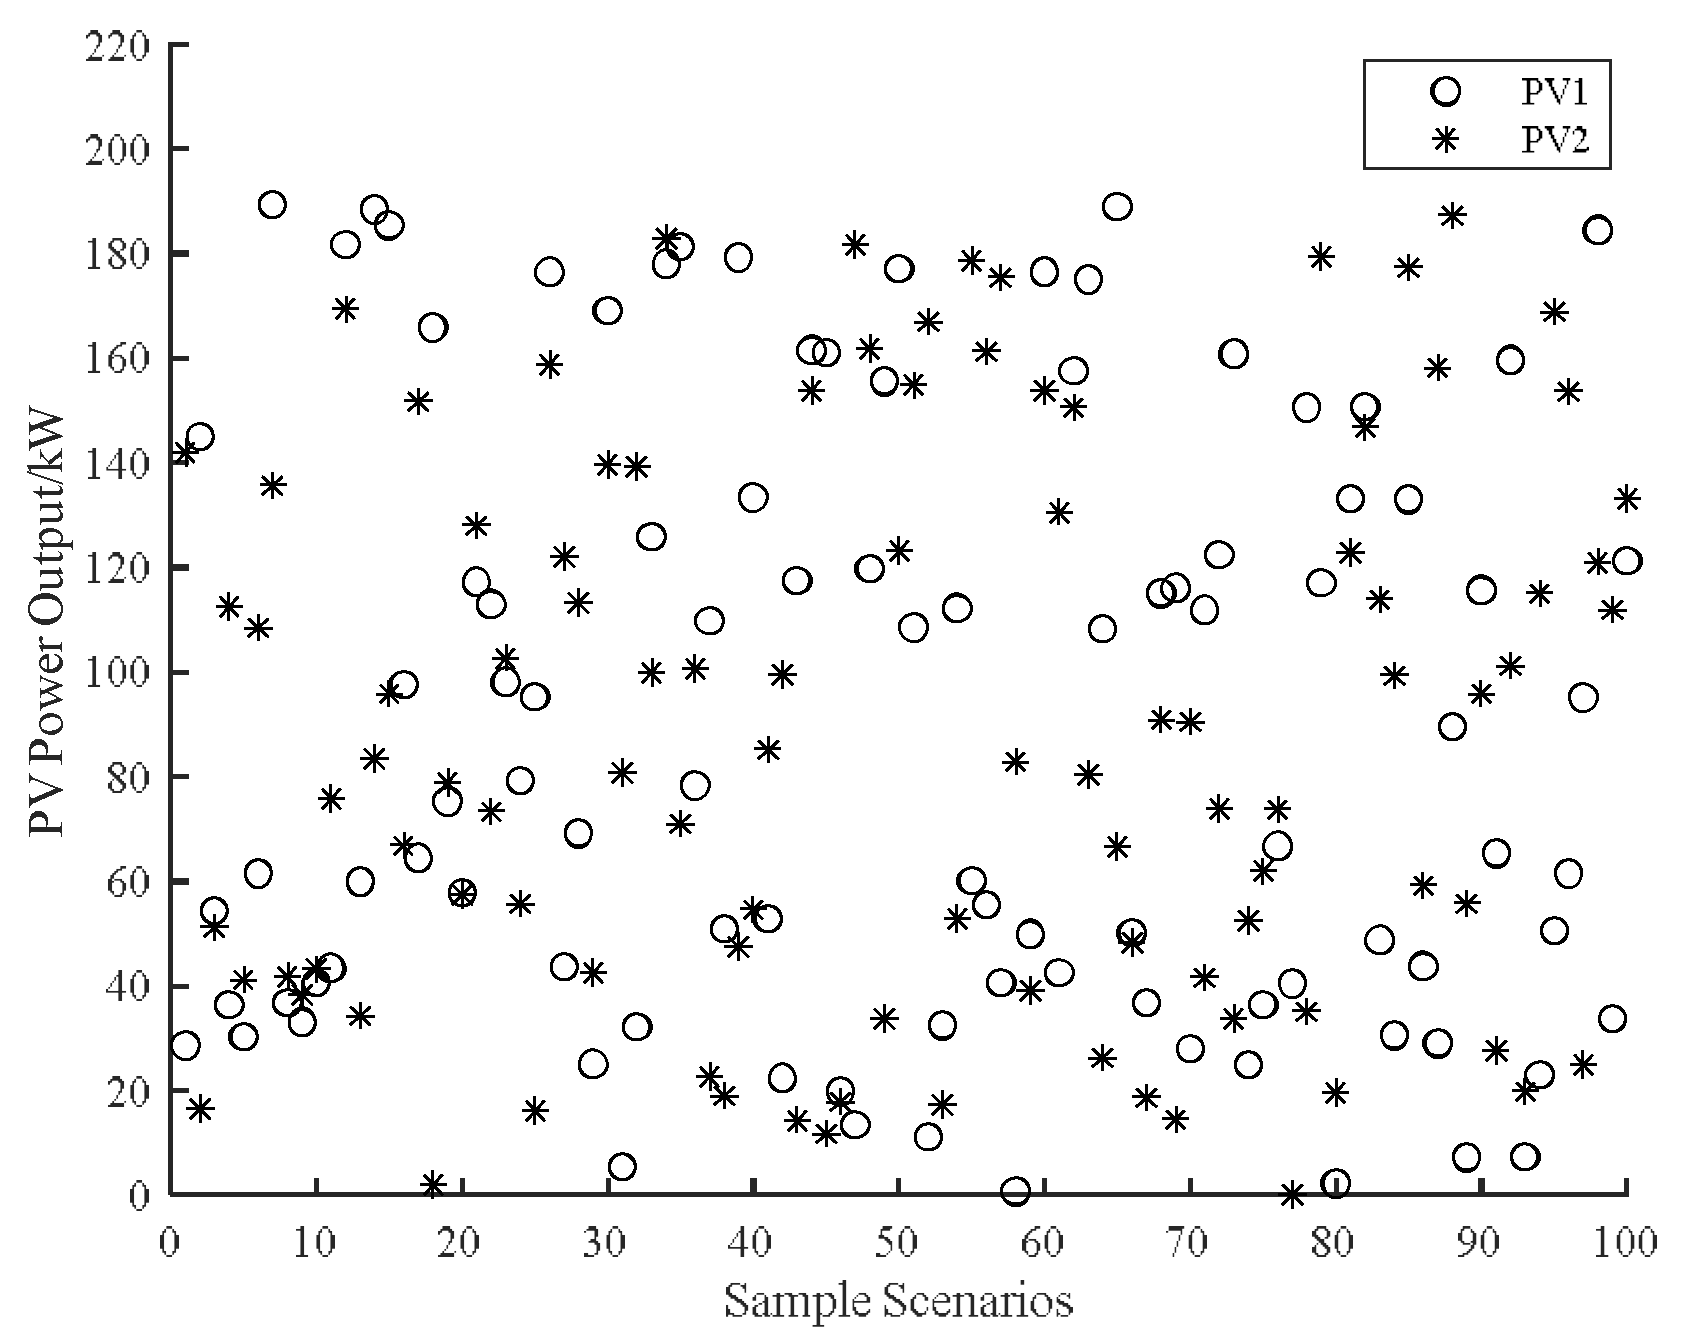
The Monte Carlo method is used to sample wind and solar power outputs, with sampling results shown in Figure 14 and Figure 15.
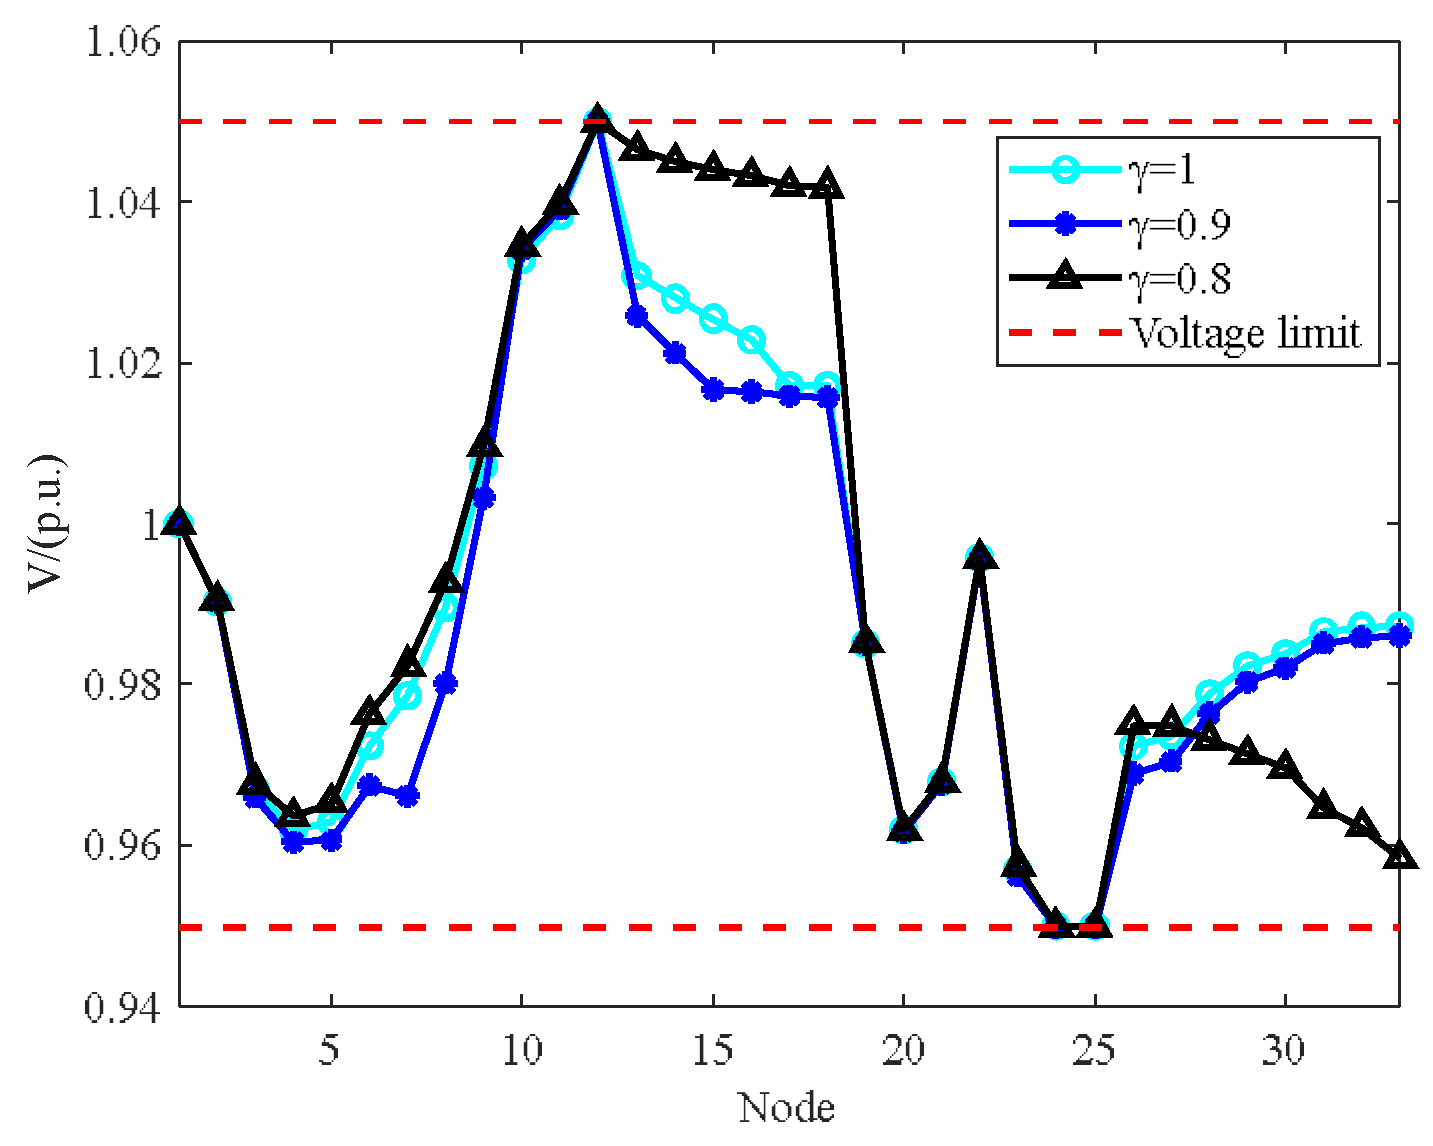
As shown in Figure 14 and Figure 15, both WT and PV exhibit power output intermittency and uncertainty. To analyze the power supply restoration problem of FIDN considering wind–solar uncertainty, different confidence levels are set to investigate the impact of wind–solar uncertainty. The load restoration results under different confidence levels are shown in Table 5, and the voltage distribution of Case 1 under different confidence levels is shown in Figure 16.
From the results shown in Table 5, all methods achieve optimal restoration performance when wind–solar uncertainty is excluded. After considering wind–solar uncertainty, the proposed method still demonstrates the best power supply restoration performance. When the confidence level decreases from 0.9 to 0.8, Case 1, Case 2, and Case 3 show significant deterioration in power supply restoration effectiveness, while the proposed method still exhibits better resilience with only a 3.93% decrease in load restoration rate. This indicates that lower confidence levels result in more conservative constraints to ensure system reliability due to a higher likelihood of constraint violations under uncertainty, leading to smaller confidence intervals and reduced utilization of uncertain renewable resources.
As shown in Figure 16, when the confidence level decreases, voltage control capability deteriorates, with voltage profiles showing larger deviations from nominal values, which may lead to voltage limit violations. Therefore, the selection of a confidence level needs to be considered in practical applications to ensure a balance between restoration effectiveness and operational safety.

6. Conclusions

For the power supply restoration problem of FIDN with DG integration, this paper proposes a power supply restoration method considering wind–solar uncertainty. Chance constraints are used to handle wind–solar uncertainty, transforming the model into a second-order cone model, and an IDBO is employed for solution. Finally, simulation verification is conducted on the IEEE 33-node system, and the results show that:
(1)
As a flexible regulation device, E-SOP can effectively enhance the power supply restoration capability of FIDN.
(2)
Without considering wind–solar uncertainty, the hybrid algorithm combining improved dung beetle optimization and MISOCP outperforms both the tie switch power supply and network reconfiguration methods, and the proposed method demonstrates better voltage control capability.
(3)
After considering wind–solar uncertainty, the power supply restoration effectiveness of the distribution network decreases, and the voltage control effect deteriorates as the confidence level decreases. Different E-SOP capacities and confidence levels both affect load restoration results. Therefore, in practical distribution network power supply restoration problems, E-SOP capacity and confidence level should be set according to actual needs to maximize restoration effectiveness.
Although the proposed method demonstrates superior power supply restoration capability, its solution time is relatively longer. Therefore, future research will focus on two core directions: first, exploring efficient computing mechanisms such as parallel processing to reduce the model’s solution time while maintaining good power supply restoration effectiveness; second, conducting extended analysis of different algorithms on larger-scale distribution networks and combining statistical significance tests to conduct in-depth research on the trade-off between algorithm scalability and computational efficiency so as to provide more comprehensive references for engineering applications.

Author Contributions

Writing—original draft, L.J.; methodology, C.W.; resources, W.Q.; conceptualization, H.X.; writing—review and editing, W.H. All authors have read and agreed to the published version of the manuscript.

Funding

This research was supported by the National Natural Science Foundation of China (62073247). The project host is Wenshan Hu, and the project name is “Research on the mechanism of networked online experiment for the whole process of control system evolution”.

Data Availability Statement

The original contributions presented in this study are included in the article. Further inquiries can be directed to the corresponding authors.

Conflicts of Interest

Author Lin Jiang, Canbin Wang, Wei Qiu were employed by the company Zhuhai Power Supply Bureau, Guangdong Power Grid Co., Ltd. The remaining authors declare that the research was conducted in the absence of any commercial or financial relationships that could be construed as a potential conflict of interest.

References

  1. Jia, Y.; Wan, C.; Cui, W.; Song, Y.; Ju, P. Peer-to-peer energy trading using prediction intervals of renewable energy generation. IEEE Trans. Smart Grid 2023, 14, 1454–1465. [Google Scholar] [CrossRef]
  2. Duong, M.Q.; Le, T.; Tran, T.H.; Le, T.M.C.; Tran, N.T.N. Challenge of modern photovoltaic systems under large-scale forms to distribution grid in preinstallation and operation: Vietnam study case evaluation. In Performance Enhancement and Control of Photovoltaic Systems; Elsevier: Amsterdam, The Netherlands, 2024; pp. 259–283. [Google Scholar]
  3. El-Khatib, M.F.; Sabry, M.N.; El-Sebah, M.I.A.; Maged, S.A. Hardware-in-the-loop testing of simple and intelligent MPPT control algorithm for an electric vehicle charging power by photovoltaic system. ISA Trans. 2023, 137, 656–669. [Google Scholar] [CrossRef]
  4. El-Khatib, M.F.; Sabry, M.N.; Maged, S.A. Experimental Modeling of a New Multi-Degree-of-Freedom Fuzzy Controller Based Maximum Power Point Tracking from a Photovoltaic System. Appl. Syst. Innov. 2022, 5, 114. [Google Scholar] [CrossRef]
  5. Wang, Z.; Liu, G.; Pang, D.; Wang, Y.; Yu, B.; Wang, Z. Optimal operation of flexible interconnected distribution grids based on improved virtual synchronous control techniques. Front. Energy Res. 2024, 12, 1356227. [Google Scholar] [CrossRef]
  6. Zhao, Y.; Xiong, W.; Yuan, X.; Zou, X. A fault recovery strategy of flexible interconnected distribution network with SOP flexible closed-loop operation. Int. J. Electr. Power Energy Syst. 2022, 142, 108360. [Google Scholar] [CrossRef]
  7. Zare, A.; Chung, C.Y.; Zhan, J.; Faried, S.O.A. Distributionally Robust Chance-Constrained MILP Model for Multistage Distribution System Planning With Uncertain Renewables and Loads. IEEE Trans. Power Syst. 2018, 33, 5248–5262. [Google Scholar] [CrossRef]
  8. Chen, X.Y.; Tang, W.; Chen, Y.; Bai, M.; Cong, P. Chance Constrained Programming Based Fault Recovery of Distribution Network Containing Photovoltaic Generations. Power Syst. Technol. 2014, 38, 99–106. [Google Scholar]
  9. Liu, S.C.; Zhou, B.X.; Song, J.; Hao, T. Multi-objective fault restoration considering the randomness of the output of distributed generator. Electr. Meas. Instrum. 2018, 55, 123–128. [Google Scholar]
  10. Zhang, S.; Fang, Y.; Zhang, H.; Cheng, H.; Wang, X. Maximum hosting capacity of photovoltaic generation in SOP-based power distribution network integrated with electric vehicles. IEEE Trans. Ind. Inform. 2022, 18, 8213–8224. [Google Scholar] [CrossRef]
  11. Li, P.; Ji, J.; Ji, H.R.; Song, G.; Wang, C.; Wu, J. Self-healing oriented supply restoration method based on the coordination of multiple SOPs in active distribution networks. Energy 2020, 195, 116968. [Google Scholar] [CrossRef]
  12. Xiong, M.; Yang, X.; Zhang, Y.; Wu, H.; Lin, Y.; Wang, G. Reactive power optimization in active distribution systems with soft open points based on deep reinforcement learning. Int. J. Electr. Power Energy Syst. 2024, 155, 109601. [Google Scholar] [CrossRef]
  13. Long, C.; Wu, J.Z.; Thomas, L.; Jenkins, N. Optimal operation of soft open points in medium voltage electrical distribution networks with distributed generation. Appl. Energy 2016, 184, 427–437. [Google Scholar] [CrossRef]
  14. Hu, Y.F.; Qian, F.; Li, H.L.; Liu, S.; Zhang, Q. Island fault recovery method of distribution network based on flexible interconnection device with energy storage. Distrib. Util. 2024, 41, 21–27. [Google Scholar]
  15. Yu, Y.W.; Yuan, X.F.; Xiong, W. A Power Supply Restoration Method for the Flexible Interconnected Distribution Network with Multi-Terminal Soft Open Point. Power Syst. Clean Energy 2021, 37, 75–82+90. [Google Scholar]
  16. Song, Y.; Sun, C.B.; Li, P.; Yuan, K.; Song, G.; Wang, C. SOP Based Supply Restoration Method of Active Distribution Networks Using Soft Open Point. Proc. CSEE 2018, 38, 4390–4398+4639. [Google Scholar]
  17. Yong, L.; Feng, L.; Xuebo, Q. Day-Ahead and Intra-Day Optimization of Flexible Interconnected Distribution System with Self-Energy Storage Based on the Grid-Side Resource Coordination. Trans. China Electrotech. Soc. 2024, 39, 758–773+923. [Google Scholar]
  18. Li, Z.Y.; Huang, J.H.; Zhao, W.; Zeng, R. Distributionally Robust Allocation of Multi-terminal E-SOP for Enhancing Distribution Network Resilience. J. Glob. Energy Interconnect. 2024, 7, 541–549. [Google Scholar]
  19. Bloemink, J.M.; Green, T.C. Increasing distributed generation penetration using soft normally-open points. In Proceedings of the 2010 IEEE Power and Energy Society General Meeting, Minneapolis, MN, USA, 25–29 July 2010; pp. 1–8. [Google Scholar]
  20. Huang, Z.T.; Xu, Y.H.; Ye, X.J. Optimal planning of soft open point integrated with energy storage system considering operation flexibility of active distribution network. Electr. Power Eng. Technol. 2023, 42, 143–153. [Google Scholar]
  21. Karaki, S.H.; Chedid, R.B.; Ramadan, R. Probabilistic performance assessment of autonomous solar-wind energy conversion systems. IEEE Trans. Energy Convers. 1999, 14, 766–772. [Google Scholar] [CrossRef]
  22. Luo, F.; Bu, Q.S.; Ye, Z.G.; Yuan, Y.; Gao, L.; Lv, P. Dynamic Reconstruction Strategy of Distribution Network Based on Uncertainty Modeling and Impact Analysis of Wind and Photovoltaic Power. IEEE Access 2024, 12, 64069–64078. [Google Scholar] [CrossRef]
  23. Baran, M.E.; Wu, F.F. Optimal capacitor placement on radial distribution systems. IEEE Trans. Power Deliv. 1989, 4, 725–734. [Google Scholar] [CrossRef]
  24. Xue, J.; Shen, B. Dung beetle optimizer: A new meta-heuristic algorithm for global optimization. J. Supercomput. 2023, 79, 7305–7336. [Google Scholar] [CrossRef]
  25. Sharafi, J.; Khedmati, Y.; Shabani, M.M. Image steganography based on a new hybrid chaos map and discrete transforms. J. Light-Electronoptic 2021, 226 Pt 2, 22. [Google Scholar] [CrossRef]
  26. Zhang, W.K.; Liu, S. Improved sparrow search algorithm based on adaptive t-distribution and golden sine and its application. Microelectron. Comput. 2022, 39, 17–24. [Google Scholar]
  27. Xu, Q.S.; He, Q.; Wei, K.Y. Modified Ant Lion Optimizer Based Coverage Optimization of Wireless Sensor Network. Chin. J. Sens. Actuators 2019, 32, 266–275. [Google Scholar]
  28. Kennedy, J.; Eberhart, R. Particle swarm optimization. In Proceedings of the ICNN95-International Conference on Neural Networks, Perth, WA, Australia, 27 November–1 December 1995; pp. 1942–1948. [Google Scholar]
  29. Storn, R.; Price, K. Differential Evolution—A Simple and Efficient Heuristic for global Optimization over Continuous Spaces. J. Glob. Optim. 1997, 11, 341–359. [Google Scholar] [CrossRef]
  30. Holland, J.H. Adaptation in Natural and Artificial Systems; MIT Press: Cambridge, UK, 1975. [Google Scholar]
  31. Mirjalili, S.; Mirjalili, S.M.; Lewis, A. Grey Wolf Optimizer. Adv. Eng. Softw. 2014, 69, 46–61. [Google Scholar] [CrossRef]
  32. Yu, W.S.; Li, M.; You, R. Power flow optimization Study on active distribution network based on three-terminal SOP with energy storage system. Acta Energiae Solaris Sin. 2022, 43, 101–110. [Google Scholar]
  33. Baran, M.E.; Wu, F.F. Network reconfiguration in distribution systems for loss reduction and load balancing. IEEE Trans. Power Deliv. 1989, 4, 1402–1407. [Google Scholar] [CrossRef]
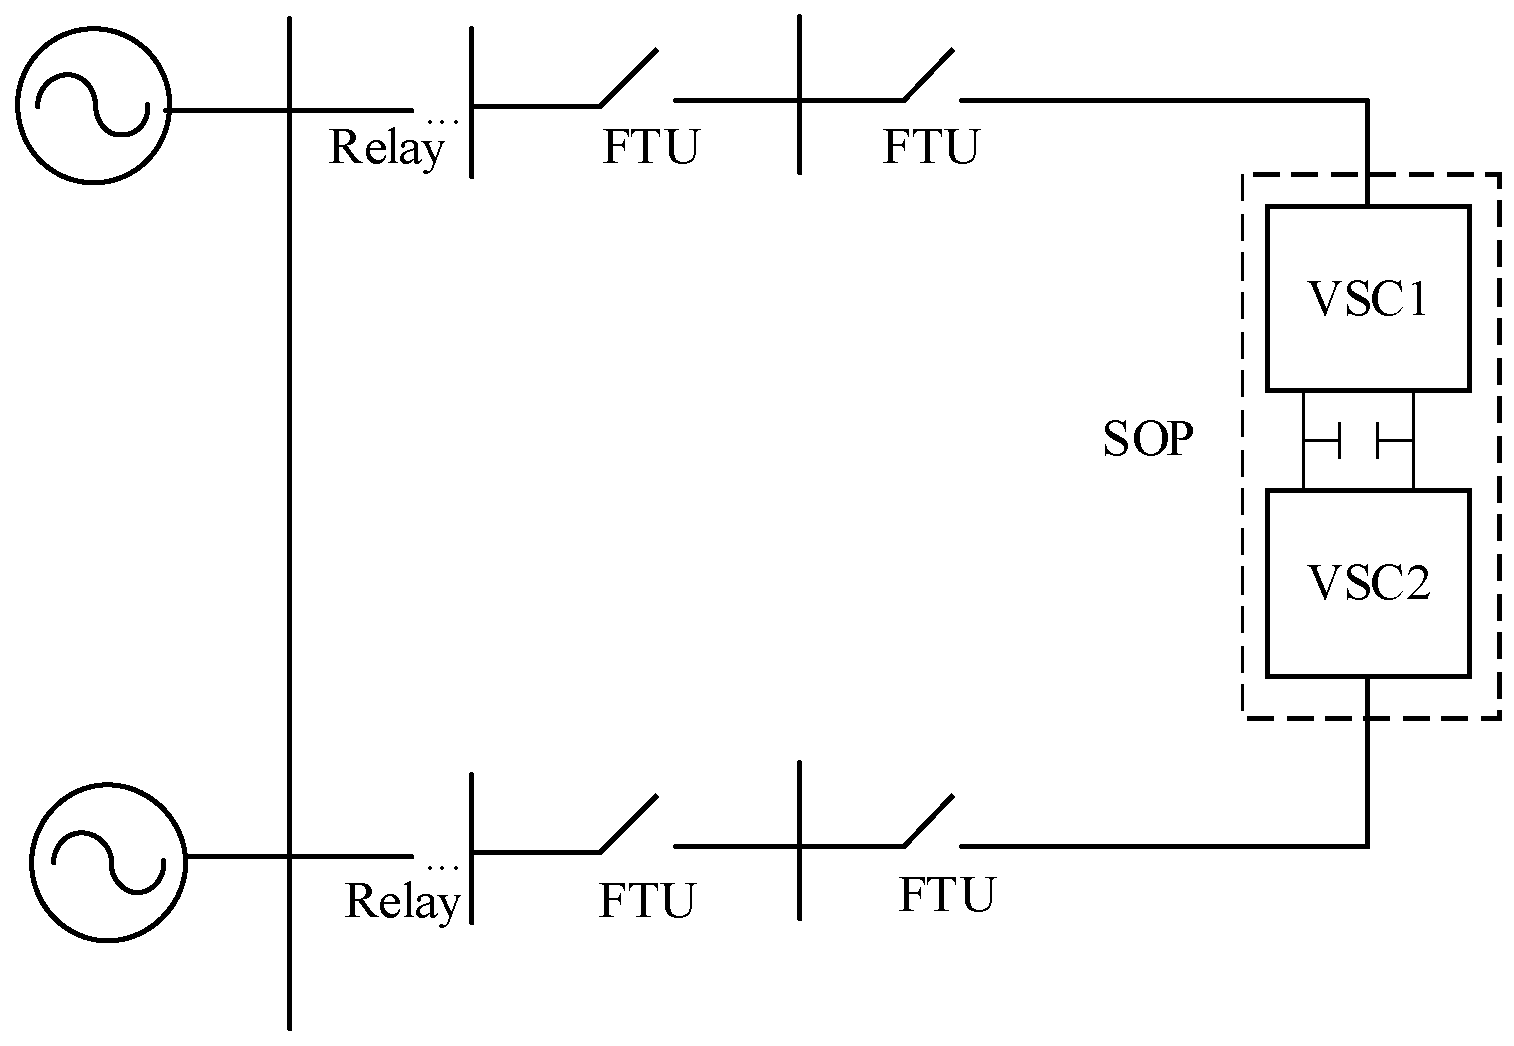
Figure 1. Structure of FIDN with SOP.
Energies 18 06051 g001
Figure 2. Control strategy of SOP under fault conditions.
Energies 18 06051 g002
Figure 3. Structure of SOP with energy storage.
Energies 18 06051 g003
Figure 4. Space distribution diagram of the logistic chaotic mapping.
Energies 18 06051 g004
Figure 5. Bifurcation diagram of the logistic chaotic map.
Energies 18 06051 g005
Figure 6. Algorithm optimization results. (a) Sphere function optimization results; (b) Schwefel function optimization results.
Energies 18 06051 g006
Figure 7. Boxplots of runtime for different methods. (a) runtime results of each algorithm on the FSphere function; (b) runtime results of each algorithm on the FSchwefel function.
Energies 18 06051 g007
Figure 8. Flowchart of distribution network fault restoration model.
Energies 18 06051 g008
Figure 9. Case analysis diagram.
Energies 18 06051 g009
Figure 10. Power supply restoration under different capacities.
Energies 18 06051 g010
Figure 11. Structure diagram of case study.
Energies 18 06051 g011
Figure 12. Power supply structure of Case 2.
Energies 18 06051 g012
Figure 13. Voltage distribution profiles of different methods.
Energies 18 06051 g013
Figure 14. Scenario sampling results of WT.
Energies 18 06051 g014
Figure 15. Scenario sampling results of PV.
Energies 18 06051 g015
Figure 16. Voltage distribution under different confidence levels.
Energies 18 06051 g016
Table 1. Comparison of the characteristics of different algorithms.
Algorithm NameCore MechanismAdvantages
Improved Dung Beetle Optimization (IDBO)Based on DBO, integrated with Logistic chaotic mapping for initialization, golden sine strategy for exploration, and dynamic weights for exploitationFast convergence, excellent population diversity, resistance to local optima, and adaptability to complex problems
Standard Dung Beetle Optimization (DBO)Simulates the behaviors of dung beetles: ball-rolling (global search), dancing (local search), and reproduction (population update)Simple principle, few parameters for easy implementation, and high efficiency in global exploration
Particle Swarm Optimization (PSO)Simulates group collaboration; updates position and velocity based on personal best (pbest) and global best (gbest)Fast convergence, simple iteration, and good adaptability to continuous variable optimization
Differential Evolution (DE)Generates offspring from parent individuals via three steps: mutation, crossover, and selection, based on parent differenceStrong global optimization capability and good stability in solving nonlinear problems
Genetic Algorithm (GA)Simulates biological evolution; iteratively optimizes the population through selection, crossover, and mutation operationsHigh robustness, adaptability to discrete/mixed variable problems, and easy parallelization
Grey Wolf Optimizer (GWO)Simulates grey wolf group hunting; updates population position under the guidance of α, β, and δ wolvesStable convergence, few parameters, and outstanding exploration capability for multimodal problems
Table 2. Optimization performance comparison.
MethodEvaluation Index
Best ValueMean ValueAverage Runtime/s
FSphereIDBO000.056
DBO8.93 × 10−2512.30 × 10−1830.059
PSO5.62 × 10−52 × 10−30.033
DE1.12 × 10−63.780.038
GA1.89 × 1025.95 × 1020.028
GWO3.52 × 10−485.26 × 10−460.061
FSchwefelIDBO000.058
DBO2.15 × 10−1321.30 × 10−950.062
PSO7.23 × 10−44.97 × 10−30.034
DE6.34 × 10−71.51 × 10−30.040
GA4.727.690.029
GWO9.70 × 10−291.63 × 10−270.063
Table 3. Load restoration rate vs. E-SOP capacity.
E-SOP CapacityLoad Restoration Results/kWLoad Restoration Rate/%
0.5 MVA467.2112.58
1 MVA915.0124.63
2 MVA1812.7448.80
3 MVA2017.9454.32
4 MVA2017.9454.32
Table 4. Load restoration results of different methods.
MethodRestored Load/kWLoad Restoration Rate/%Partially or Fully De-Energized Nodes
Case11085.050.825,7–9,13–18,33
Case21485.069.565,9,13–18,33
Case31734.785.058,30,31
Table 5. Load restoration results under different confidence levels.
MethodConfidence LevelRestored Load/kWLoad Restoration Rate/%
Without Uncertainty1085.050.82
Case10.91029.3248.21
0.8916.7942.94
Without Uncertainty1485.069.56
Case20.91408.7965.99
0.81140.3953.41
Without Uncertainty1734.7385.05
Case30.91457.0370.90
0.81376.1966.97
Disclaimer/Publisher’s Note: The statements, opinions and data contained in all publications are solely those of the individual author(s) and contributor(s) and not of MDPI and/or the editor(s). MDPI and/or the editor(s) disclaim responsibility for any injury to people or property resulting from any ideas, methods, instructions or products referred to in the content.