Article

Experimental Analysis of Heat Transfer in Multi-Mini-Channel Module: A Comparison with CFD Simulations

1
Faculty of Mechatronics and Mechanical Engineering, Kielce University of Technology, al. Tysiaclecia Panstwa Polskiego 7, PL-25-314 Kielce, Poland
2
Independent Researcher, Zagórska 72/1, PL-25-362 Kielce, Poland
*
Author to whom correspondence should be addressed.
Energies 2025, 18(22), 5992; https://doi.org/10.3390/en18225992 (registering DOI)
Submission received: 22 October 2025 / Revised: 10 November 2025 / Accepted: 12 November 2025 / Published: 15 November 2025

Abstract

This study presents comprehensive experimental, analytical, and numerical analyses of heat transfer during countercurrent flow of Fluorinert FC-72 and distilled water within a multi-mini-channel (MMCH) module under steady-state conditions. The experimental investigation was conducted in a test section inclined at an angle of 165 degrees relative to the horizontal plane, utilizing an infrared camera to measure the external temperature of the heated mini-channel (MCH) wall. The test module comprised twelve MCHs: six hot (HMCH) and six cold mini-channels (CMCH), each with a rectangular cross-section. The dimensions of each MCH are 140 mm in length, 18.3 mm in width, and 1.5 mm in depth, with a hydraulic diameter of dh = 2.77 mm. The heating system on the top wall of the external heated copper comprises a halogen heating lamp. Results include infrared thermographs, temperature distributions, and heat transfer coefficients (HTCs) along the channels. Local HTCs were calculated using a one-dimensional (1D) approach, a simple analytical method, at interfaces such as the heated plate—HMCHs, HMCHs—separating plate, separating plate—CMCHs, and CMCHs—closing plate. CFD simulations conducted with Simcenter STAR-CCM+ incorporated empirical data from experiments, using parameters like temperature, pressure, velocity profiles, and heat flux density to determine HTCs. The maximum difference between the 1D method and CFD results was 29% at the HMCHs/separating plate interface. In comparison, the minimum was 13.5% at the separating plate/CMCHs interface, with an average across all channels and heat flux densities.

1. Introduction

Recent research on heat transfer has increasingly focused on mini-channels (MCH) due to their essential role in the development of advanced cooling systems for electronic devices. The primary objective is to optimize heat transfer rates (heat fluxes) while concurrently reducing the temperature differential between the heated surface and the saturated liquid.
The term “small-diameter channels” lacks a uniform definition in the literature; classifications primarily depend on the hydraulic diameter (dh). Kandlikar and Grande [1] provide a comprehensive classification
  • Conventional Channels: dh > 3 mm
  • Minichannels: 3 mm ≥ dh > 200 µm
  • Microchannels: 200 µm ≥ dh > 10 µm
  • Transitional Channels:
  • Transitional Microchannels: 10 µm ≥ dh > 1 µm
  • Transitional Nanochannels: 1 µm ≥ dh > 0.1 µm
  • Molecular Nanochannels: dh ≤ 0.1 µm
Additional notable classifications include Shah’s categorization of non-compact heat exchangers into conventional (dh > 6 mm) and minichannels (dh < 6 mm). Similarly, Klemes et al. [2] define conventional compact heat exchangers with a hydraulic diameter (dh) ranging from 1 to 10 mm, in contrast with minichannels and microchannels characterized by dh ≤ 3 mm.
The primary objective of this research is to enhance our comprehension of fluid flow heat transfer across various configurations and groups of mini-channels (MCHs). The emphasis is placed on experimental investigations and computational fluid dynamics (CFD) modeling using Simcenter STAR-CCM+ software version 2020.2.1 Build 15.04.010 based on the obtained experimental data, as well as the validation of experimental and simulation outcomes within the same software. The aim is to improve the efficiency of heat transfer processes in MCHs, which are integral to applications such as PVT panel cooling. A concise literature review is presented, drawing on selected literature, with a particular focus on heat transfer issues, encompassing both experimental and numerical simulation studies.
Numerous studies have examined different aspects of heat transfer in mini- or microchannels. Shang et al. [3] studied R141b flow condensation in 2 mm hydraulic diameter mini-channels, showing that higher inlet vapor quality improved the condensation heat transfer coefficient. They noted significant decreases in local heat transfer coefficients at constant flow rates with changing vapor qualities. Additionally, Li et al. [4] looked into flow characteristics and pressure drop instability in a mini-channel heat sink with a phase-separated setup. Their aluminum alloy heat sink, featuring laser-micromachined grooves and vapor–liquid separation structures, effectively lowered two-phase pressure drop and enhanced flow stability. Bao et al. [5] proposed a novel comprehensive factor for comparing thermal and hydraulic efficiencies across various mini-channel design. Their research identified a transverse parallel mini-channel configuration as superior to 15 other types, showing substantial reductions in the Comprehensive Index of Thermal Management System (CITMS), thus confirming the effectiveness of transverse layouts for improved thermal performance. Ma et al. [6] developed a general model for frictional pressure drop during flow boiling in micro- and minichannels, based on experimental data and a thorough literature database. Their study of a micro-milled aluminum heat sink contributed to a model that predicts most data points within acceptable error margins. Zhang et al. [7] investigated flow boiling in a vertical mini-channel under a non-uniform electric field. They observed that the electric field reduced bubble volume, increased bubble count, minimized coalescence, and delayed flow pattern transitions, with numerical simulations providing support for their results. Building on this, Zhang et al. [8] explored the combined effects of electrohydrodynamic (EHD) forces and nanofluids, demonstrating notable heat transfer enhancement, particularly for stabilized nanofluids such as TiO2/Span80/R141b. Yin et al. [9] focused on the boiling instability of R134a in large heat sinks with interconnected parallel mini-channels. They proposed an instability criterion and map, identifying the heat flux/mass flux ratio as a key parameter, and found that local instability near the outlet did not prevent overall heat transfer. Ye et al. [10] demonstrated improved R134a flow boiling heat transfer in additively manufactured (AM) minichannels with micro-engineered surfaces, achieving a 210% higher average heat transfer coefficient with minimal pressure drop. Their findings offer valuable design guidance for AM two-phase cooling devices. Luo et al. [11] proposed hybrid-featured porous pin-fin arrays for efficient water flow boiling heat transfer, showing effective regulation of two-phase flow and high stability, with potential for large-scale intensified flow boiling. Yang et al. [12] examined the effect of hyper gravity on flow boiling in mini-channels, noting different outcomes based on flow mode—centripetal flow showed enhanced heat transfer, while centrifugal flow indicated an optimal hyper-gravitational acceleration for peak performance. Shang et al. [13] conducted experiments on HFE-7100 flow boiling in mini-channel heat sinks for server chip cooling, comparing smooth and porous designs. The porous design notably reduced wall temperature and maintained it below 75 °C with minimal pressure drop. Lan et al. [14] experimentally studied two-phase flow boiling in minichannels with inclined grooves, finding the grooves hindered bubble growth, provided nucleation sites, triggered earlier boiling, increased heat transfer coefficient by 18.31%, and reduced flow instability. Wang et al. [15] explored vapor separation in a mini-channel heat sink using gradient porous copper ribs—a novel design that greatly enhanced vapor removal, prevented backflow, and increased heat transfer performance by up to 2.3 times compared to traditional designs. Kokate et al. [16] reported their experimental study of R134a flow boiling in parallel microchannels, observing rapid bubble formation due to flow separation and thermal nucleation, along with the influence of local heat transfer on flow regime changes. Zhang et al. [17] performed experimental tests on R134a flow boiling in high-heat-flux microchannels. They found that the heat transfer coefficient increased with mass flux, and two-phase flow was more stable at high heat fluxes. They also introduced a new heat transfer coefficient model with a Mean Absolute Error (MAE) of 9.08%. Rohini et al. [18] investigated subcooled flow boiling heat transfer of FC-72 in multiple parallel rectangular microchannels, developing a new dimensionless correlation with an MAE of 21.9% after reviewing existing models. Mutumba et al. [19] studied the single-phase heat transfer and pressure drop characteristics of the refrigerant R1233zd(e) in a brazed plate heat exchanger (BPHE). They proposed correlations for the convective heat transfer coefficient on the hot water side and other novel correlations for both the hot (water) and cold (refrigerant) sides of single-phase heat transfer. Their model accurately predicted 97% of all data within ±10%, with a mean absolute error of 5.7%.
There are numerous well-known commercial CFD software packages dedicated to heat transfer analysis. The most widely used include Simcenter STAR-CCM+ and ADINA. Yaghoubi et al. [20] conducted a numerical simulation of R141b flow boiling in minichannels with wall cavities, determining that optimal cavity geometries enhanced the heat transfer coefficient by a factor of six through the promotion of earlier nucleation. Igaadi et al. [21,22] provide a numerical analysis of the deformation of the internal surface of pipes during the flow of Fluorinert FC-72. This analysis employs the Volume of Fluid (VOF) model and Lee’s phase change model. The study emphasizes the importance of considering shear-lift forces acting on bubbles, as well as conjugate heat transfer to the pipe walls, in the context of multiphase flow analyses. Agbodemegbe et al. [22] established a correlation for the cross-flow resistance coefficient derived from simulation data obtained using STAR CCM+, which demonstrated the water flow through a 5 × 5 rod bundle supported by a spacer grid with split-type mixing vanes. In Simcenter STAR-CCM+, an automatic wall treatment function with all y+ was employed in conjunction with the two-layer k-epsilon turbulence model. Li et al. [23] used the simulation platform Simcenter STAR-CCM+ 10.04 to emulate departure from nucleate boiling (DNB) in vertical heated tubes under high-pressure conditions with variable wall heat fluxes by combining the Eulerian two-fluid model with the extended wall boiling model.
Kielce University of Technology has conducted extensive research on flow boiling heat transfer in Multi-Chip Heat Sink (MCHS) systems over several years. The study employed analytical and numerical methodologies, including Trefftz, Piccard, and Beck techniques [24], to analyze experimental data. Furthermore, the commercial ADINA software version 9.2 was utilized in numerical simulations to evaluate advanced mathematical procedures applied to the experimental data [25]. Recently, results from computational fluid dynamics (CFD) and heat transfer simulations pertaining to the test module with mini-channels, conducted using the Simcenter STAR-CCM+ software version 2020.2.1 Build 15.04.010 [26,27], have been obtained.
In the previous publication [28], a comparison was made between the one-dimensional approach (which considers solely the direction of heat transfer perpendicular to the fluid flow direction) and the two-dimensional approach regarding the heat transfer coefficient (HTC), employing the Trefftz method. It was assumed that the temperatures of the copper plate and the heated plate, FC-72, conformed to the appropriate energy equations, a premise further substantiated by a set of boundary conditions. Experimental investigations were carried out on a test module equipped with two rectangular mini-channels, each measuring 1.5 mm in depth, 24 mm in width, and 240 mm in length.
While previous research has explored heat transfer in MCHs through experimental or numerical methods, few studies have integrated precise infrared heat flux measurements with CFD validation in setups with separate hot and cold MCH groups. We experimentally measured heat transfer coefficients for 12 MCHs, split into two groups (six hot and six cold), using a 1D method that helped analyze the effects of flow distribution and interchannel differences. The 1D results were then compared to STAR-CCM+ simulations, providing an in-depth experimental and numerical validation process that is rarely addressed in the existing literature. In summary, the primary novelties of the present publication include:
  • The innovative test module was constructed with two groups of mini-channels (MCHs) (hot and cold), and copper heating, separation, and closing plates. The components were significantly modified from earlier designs, which relied on alternative plate materials such as tempered glass, solar cells, and Haynes-230 alloy.
  • Each MCH measured 140 mm in length, 18.3 mm in width, and 1.5 mm in depth, with a hydraulic diameter of dh = 2.77 mm.
  • A copper hot plate, coated with a high-emissivity paint (ε = 0.97), was heated using a 1000 W halogen lamp.
  • Experimental data were collected for three distinct heat flux densities transferred to the fluid within the MCH: 1000 W/m2, 2000 W/m2, and 8000 W/m2. The measurements were conducted at an inclination of 165° relative to the horizontal plane, with two different mass flow rates of the fluids in countercurrent flow at 0.008 kg/s.
  • The study encompassed experimental, analytical (1D approach), and numerical (CFD) analyses of heat transfer phenomena occurring during the countercurrent flow of Fluorinert FC-72 and distilled water within a multi-mini-channels (MMCH) module under steady-state conditions.
  • The heating system on the upper wall of the external copper component includes a halogen lamp.
This article presents experimental, analytical, and numerical CFD analyses of heat transfer during countercurrent flow of FC-72 refrigerant and distilled water within a rectangular multi-mini-channel module, conducted under steady-state conditions. The experimental investigation was performed in a test section inclined at 165° relative to the horizontal plane, with the external surface temperature of the heated MCH wall measured using an infrared camera. The test module comprises 12 MCHs: six hot mini-channels (HMCH) and six cold mini-channels (CMCH), featuring a rectangular cross-section. The experimental results are displayed as infrared thermographs, along with temperature and heat transfer coefficients (HTCs) along the channels. Numerical simulations were performed utilizing Simcenter STAR-CCM+ software.

2. Experimental

2.1. Experimental Apparatus with the Test Section

Figure 1 schematically illustrates several interconnected components employed in this investigation, including a test module, two working fluid circuits with HMCH and CMCH, a data acquisition system, and a heating system. This study primarily concentrates on analyzing the performance of the MMCH module system with a smooth-surfaced separating copper plate.
Experiments were conducted at three heat flux densities: 1000 W/m2, 2000 W/m2, and 8000 W/m2, with countercurrent mass flow rates of two fluids (FC-72 and distilled water) set at 0.008 kg/s. Furthermore, the test module was positioned at an inclination of 165 degrees relative to the horizontal plane.
Before entering the experimental section, the working fluids passed through the filters installed upstream of the pumps (countercurrent flow of the FC-72 and distilled water). The hot FC-72 flow circuit system comprised a turbine Equflow 0045BP01XA flow meter, a circulating pump, and a heat exchanger, Aquaviva MF-200. The cold distilled water flow circuit system consisted of a magnetic SM6000 flow meter, a circulating pump, and a shell-and-tube heat exchanger B130 SECESPOL. The output of the magnetic circulation pumps GZD.Q57.JDS-B380 (BLDC) by MICROPUMP, INC (Vancouver, WA, USA) was regulated via three-phase electric inverters. Additionally, K-type thermocouples and Wika A-10 pressure transducer sensors, mounted on the MCH inlets and outlets, were utilized to measure the liquid temperature and pressure drops, respectively.
Table 1 compiles the basic physicochemical properties of refrigerant FC-72 and distilled water, as provided by the manufacturer, with all values determined at 25 °C unless specified otherwise.
The data acquisition system consisted of a data acquisition station, DaqLab/2005 IOtech, a computer, and an infrared camera, E60. By using an infrared camera, the temperature of the smooth external heated copper plate was monitored. The infrared camera was capable of self-calibration upon activation. It was imperative to configure parameters such as object emissivity, ambient temperature, distance to the object, and relative humidity. The external surface of the copper plate is coated with black paint to achieve an emissivity of 0.97 (NEXTEL Velvet-Coating 811-21, Warsaw, Poland) [31].
The heating system on the top surface of the external heated copper included a heating halogen bulb for generating heat flux, a luxmeter Delta OHM HD2102.1, and the LP471PHOT probe to measure light radiation intensity.
Further details and technical parameters of the experimental apparatus used in this study are summarized in Table 2.
The main components of the test module included three copper plates, namely the heated, separating, and closing plates, and two circuits containing working fluids with HMCHs and CMCHs.
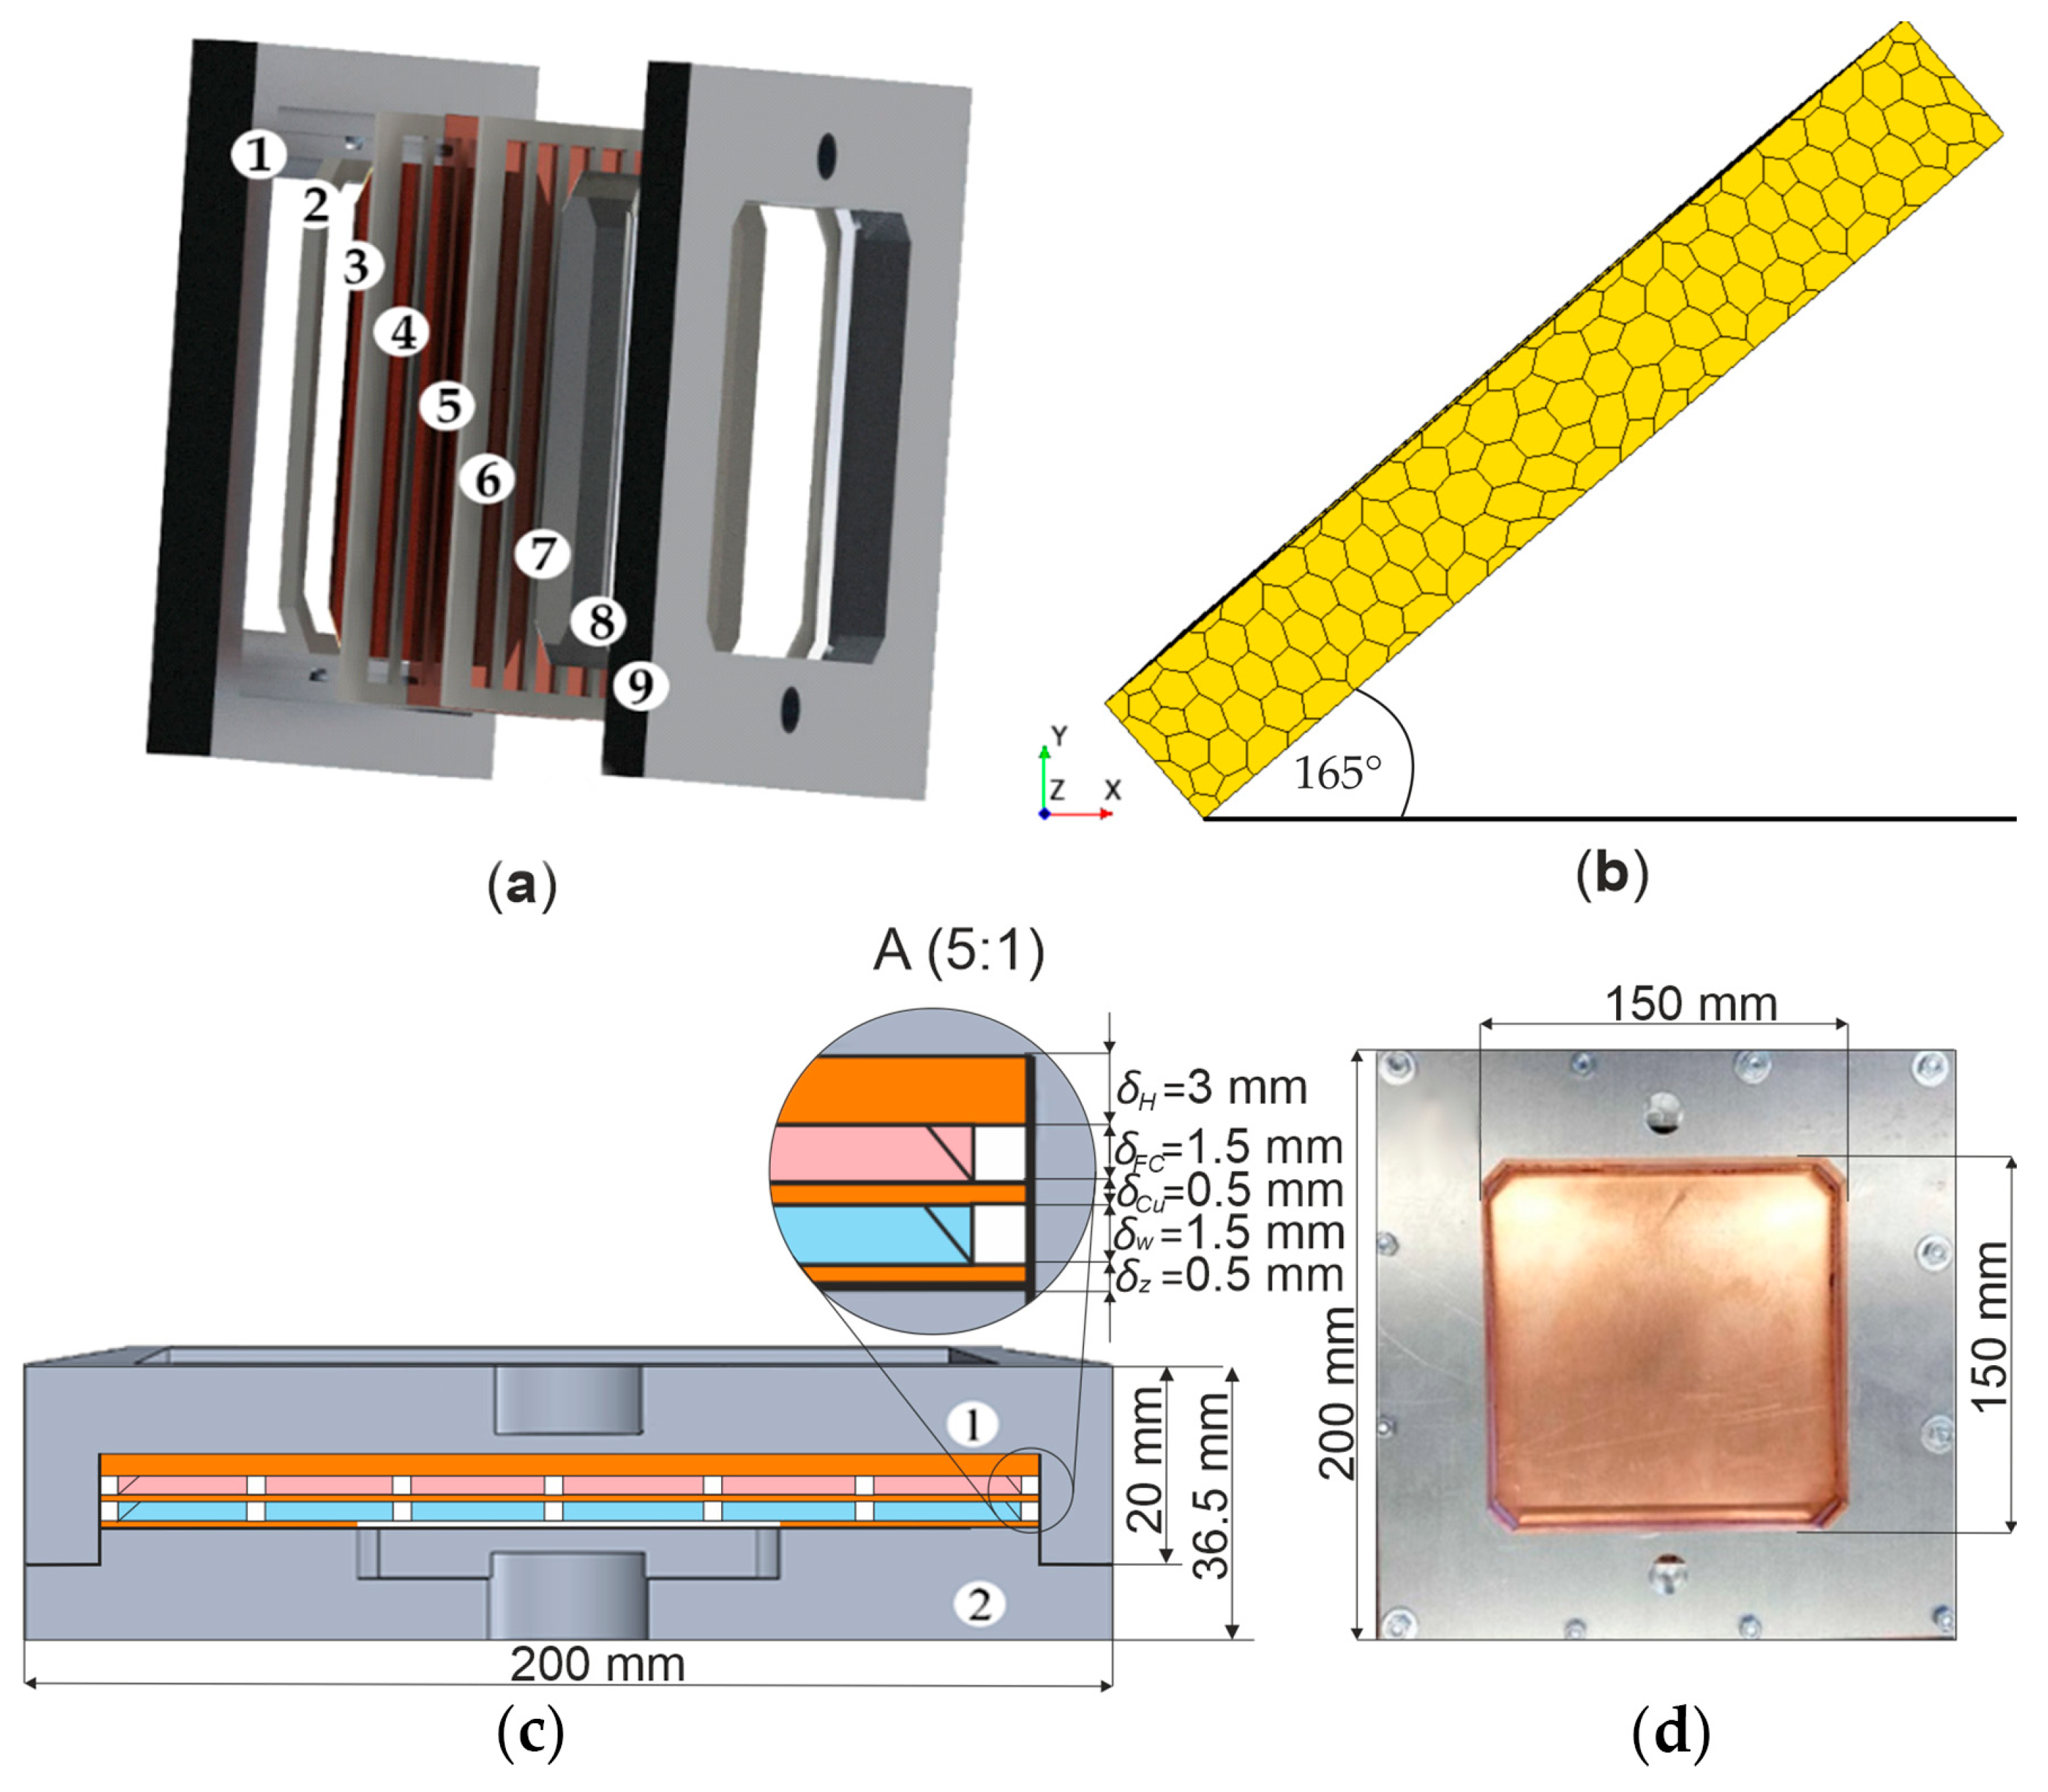
Figure 2 presents a CAD model of the test section featuring MCHs alongside the components of the compact heat exchanger (a), the positions (b), the cross-sectional view (c), and the positions of the MMCH module (d). The primary components of the test section with the MCHs included aluminum covers (Figure 2a—(1), (9)), silicone gaskets (Figure 2a—(2), (8)), the closing copper plate (3), silicone gasket forming the HMCH (4), silicone gasket constituting the CMCH (6), the copper plate positioned between the two MCHs (5), and the heated copper plate (7).
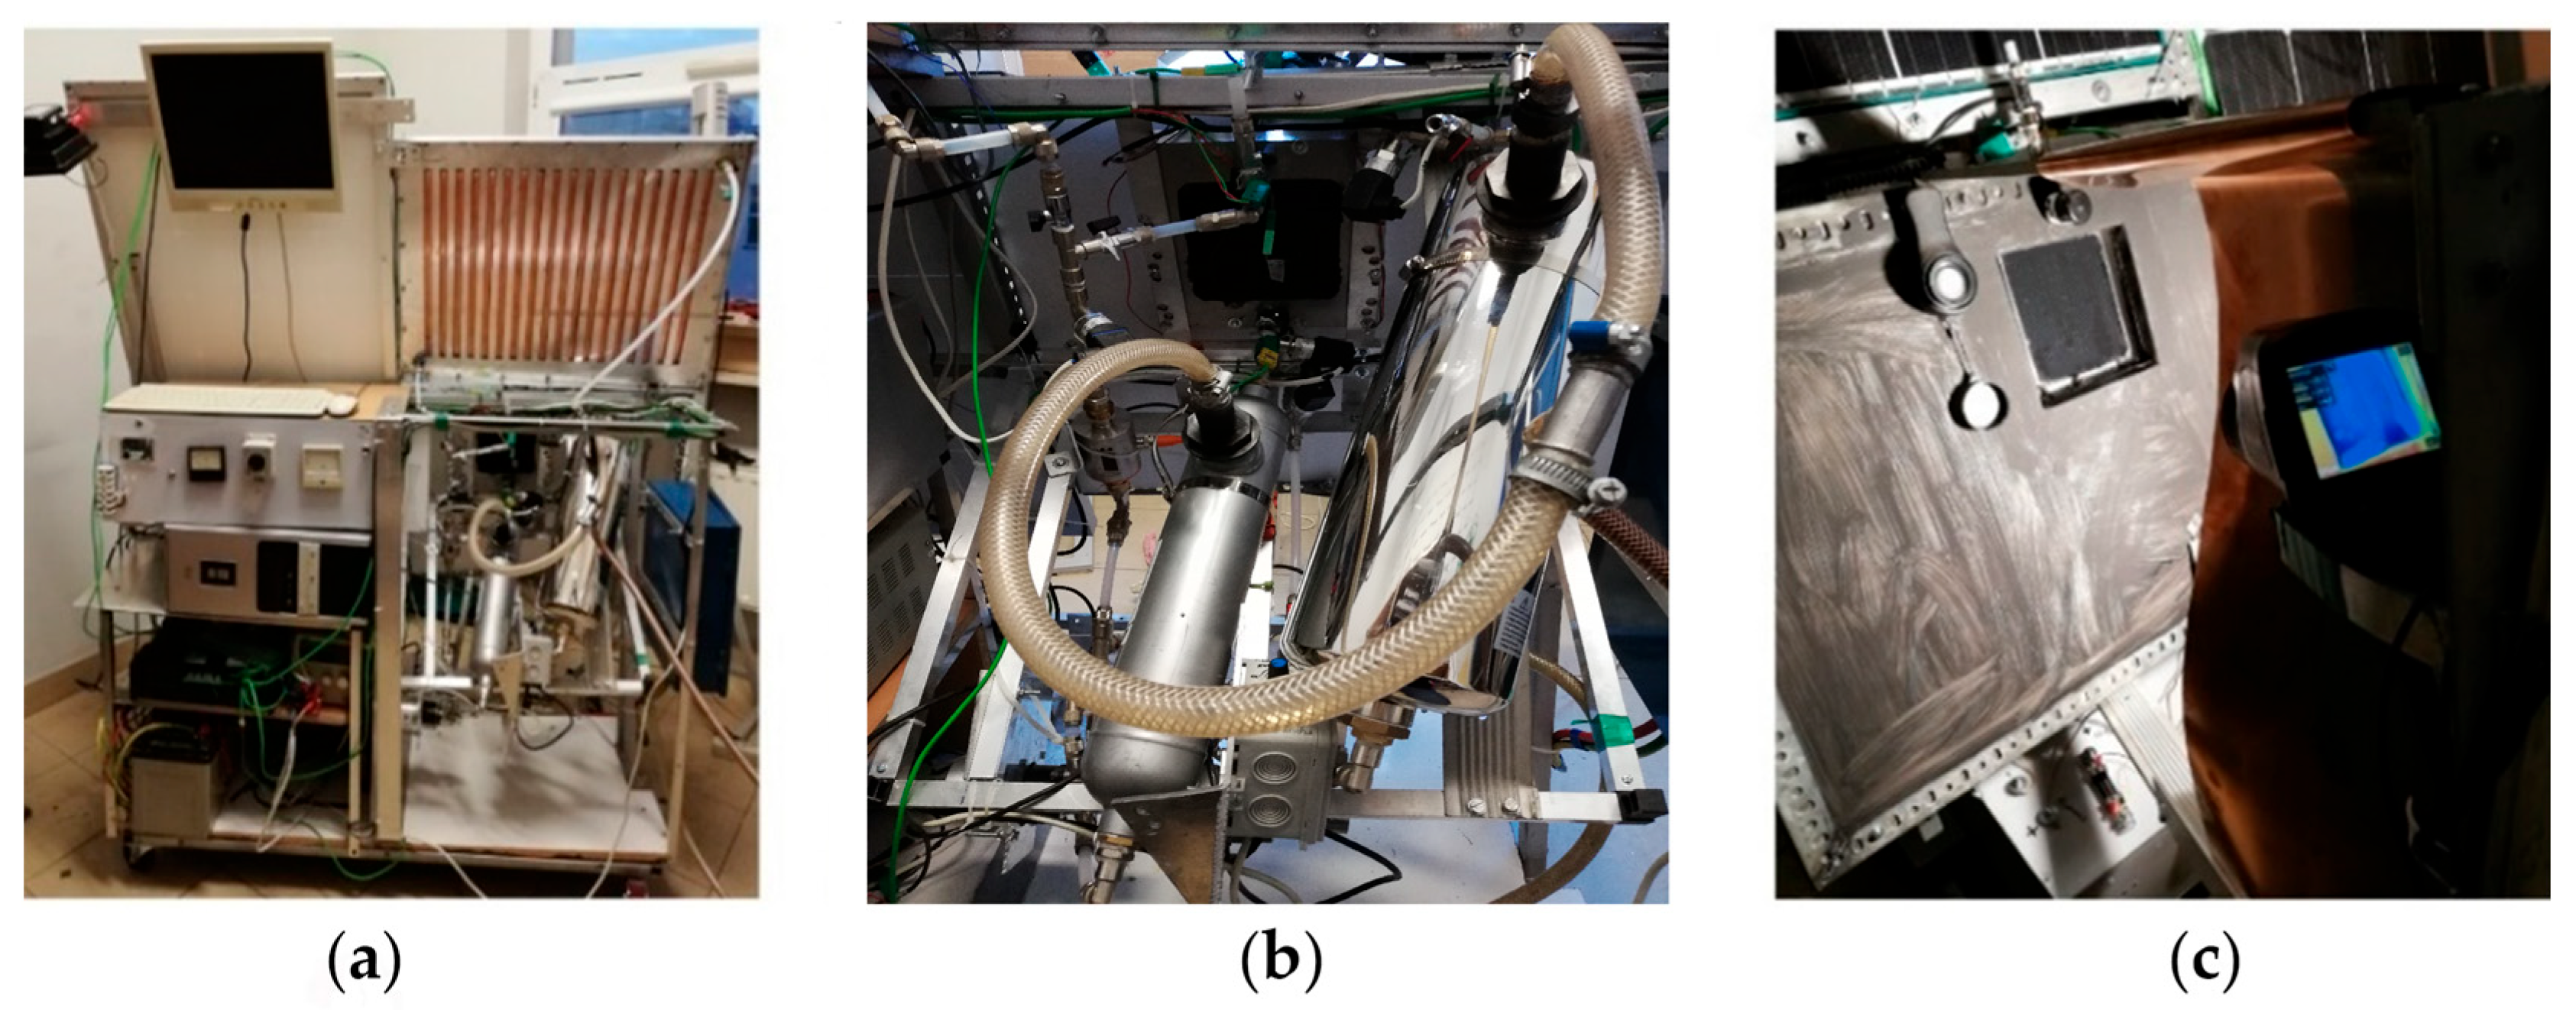
Figure 3a–c show the main systems of the experimental setup, which consists of a rectangular MMCH comprising 12 MCHs (six HMCHs and six CMCHs). Each MCH measures 140 mm in length, 18.3 mm in width, and 1.5 mm in depth, with a hydraulic diameter of dh = 2.77 mm. The copper heating plate has dimensions of 156 × 156 × 3 mm3, while the copper separating plate measures 159 × 159 × 0.5 mm3, and the copper bottom closing plate measures 156 × 156 × 0.5 mm3 (width × length × depth).

2.2. Data Reduction, Thermal and Flow Parameters

Throughout the experiments, data were systematically collected, encompassing fluid temperature at the mini-channel’s inlet and outlet, ambient temperature, atmospheric pressure or overpressure at both extremities, and the mass flow rate within the laboratory environment via the DaqLab/2005 acquisition station (IO-Tech). In each experimental set, 100 or 10 measurements were obtained and subsequently averaged into a single representative value using DaqView version 9.1.35 software. Additionally, the temperature of the heated copper plate was measured using an infrared camera, which covered the entire surface of the plate. The ResearchIR 4.0 software was used to determine a linear temperature distribution along the central axis of the channel for each test.
The ranges of the main experimental thermal and flow parameters of the experimental sets selected for the analyses are listed in Table 3.
Throughout each series of tests, subcooled liquid entered the mini-channels and heated as it flowed toward the outlet along the heated wall. The heat flux supplied to the heated wall of the MCHs was gradually increased. The heat transfer process transitioned from single-phase forced convection (at the lowest heat flux density) to subcooled boiling (during an increased heat flux density). The subcooled boiling was characterized by the fact that the liquid was superheated at the interface with the heated plate and subcooled at the core of the flow. At the outlet, a two-phase mixture of liquid and vapor emerged and was subsequently directed to an additional heat exchanger, the condenser.

3. Calculations of the Heat Transfer Coefficients—A One-Dimensional (1D) Approach

The physical parameters of the test section’s elements were considered temperature-independent, with known temperatures at the inlets and outlets of the MCHs.
The 1D approach was based on the following simplifying assumptions:
  • The flow of the two fluids (water and FC-72) was parallel, laminar, and countercurrent.
  • Both fluids had a constant mass flow rate of 0.008 kg/s on either side of the copper plate.
  • Heat transfer was modeled as one-dimensional, occurring perpendicular to the flow direction and the width of the mini-channel (MCH), and restricted to one direction: perpendicular to both the flow path and the MCH width.
  • Local heat transfer coefficients (HTCs) were used to determine the interface conditions between the heated plate and HMCHs, HMCHs and the separating plate, the separating plate and CMCHs, as well as between the CMCHs and the closing plate.
  • The system was insulated, so heat losses (radiative and convective) to the environment through the external surfaces of the test section were considered negligible.
  • The temperature independence of the physical parameters of the test section’s elements, with known temperatures at the inlets and outlets of the MCHs.
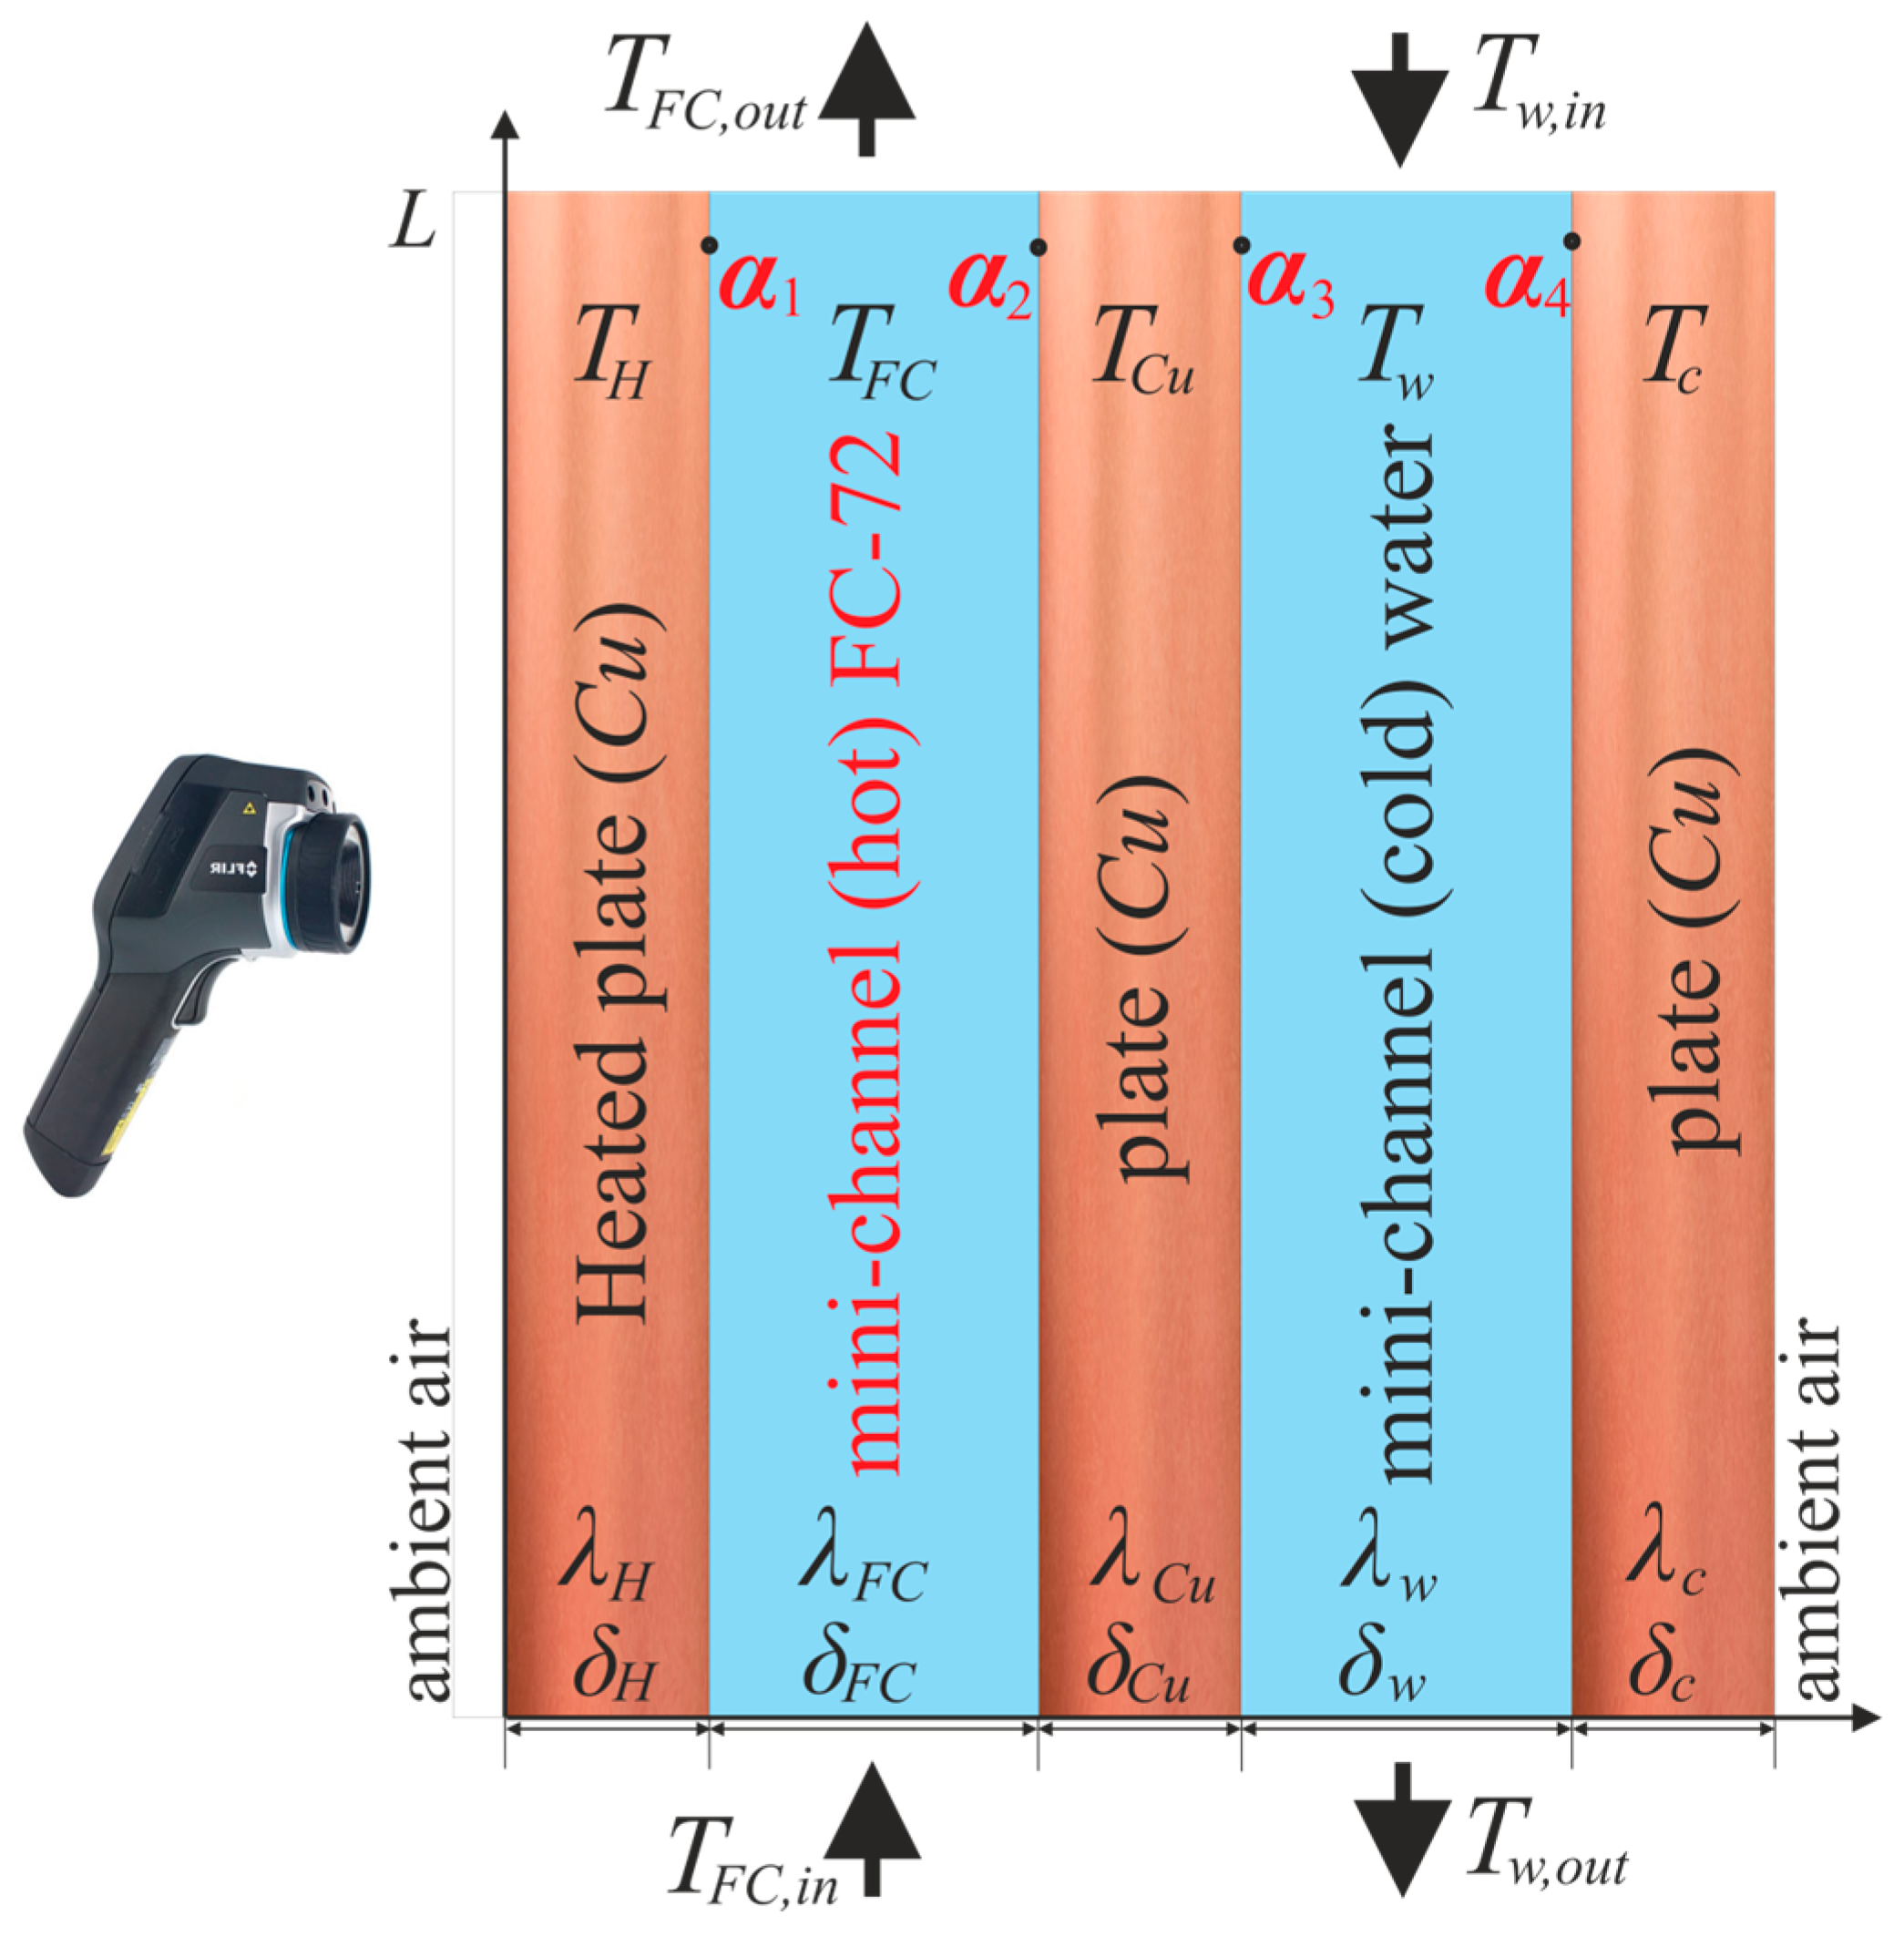
Figure 4 presents the schematic diagram of the main elements of the central part of the test section and the location of the HTCs.
To clarify, the heat flux q in Equation (1) represents the conductive heat flux within the copper heater plate, which can be inferred from the IR measurement of the surface. In our experiment, the copper plate (156 × 156 mm) was coated with a high-emissivity paint (ϵ = 0.97), and the measured radiative flux was EIR = 1000, and 8000 W/m2. Given the emissivity, the corresponding conductive heat flux was estimated as follows [28,32]:
q E I R ϵ
where
  • q—heat flux density,
  • EIR—the radiation intensity for the copper heated plate.
The HTC at the interface between the heated plate and the refrigerant FC-72 in the HMCH was determined using Equation (2), analogous to the methods described in references [28,32].
α 1 x = q λ H λ H T H , I R x T F C , l i n x q δ H
where
  • T H , IR x —the temperature of the external surface of the copper plate (measured by infrared camera),
  • λ H —thermal conductivity of the copper plate,
  • δ H —thickness of the copper plate.
  • T FC , lin x —refrigerant FC-72 temperature calculated from Equation (3):
T FC , lin x = T FC , out T FC , in L · x + T FC , in
where
  • L—the mini-channel length.
The HTC α 2 x at the interface between the refrigerant FC-72 in the HMCH and the copper separating plate was calculated using Formula (4) [28,32].
α 2 x = Q F C A 2 T F C , l i n x T C u , l i n ( x )
where
  • TCu,lin(x)—the temperature of the center partition is approximated linearly, measured using two type K thermocouples [28,32]: (channel inlet/outlet),
  • Q F C —heat flux reaching the refrigerant FC-72,
  • A 2 —surface area of the copper separating plate.
The HTC α 3 x at the interface between the copper separating plate and the distilled water in the CMCH was calculated using Formula (5) [28,32].
α 3 x = ( 1 k 1 α 1 x 1 α 2 x ( δ C u · 1 λ C u ) ) 1
where
  • λ Cu —thermal conductivity of the copper plate,
  • δ Cu —thickness of the copper plate.
The heat transfer resistance of the closing plate 1 α 4 x was calculated using Formula (6) [28,32].
1 k = 1 α 1 x + 1 α 2 x + δ C u λ C u + 1 α 3 x + 1 α 4 x
The HTC α 4 x at the interface between the water in the CMCH and the closing plate, was calculated in a similar manner based on Equation (6), by adding a closing plate calculated according to Equation (7) [29]:
α 4 x = ( 1 α 1 x + 1 α 2 x + ( δ C u · 1 λ C u ) 1 k + 1 α 3 x ) 1
The overall HTC k was calculated from Equation (8), as in references [28,32].
k = Q F C + Q w 2 A T
where
  • Q W —heat flux reaching the refrigerant FC-72,
  • T—the average logarithmic difference in liquid temperatures from Equation (9), calculated as in [28,32]:
T = T w T F C L n T w T F C
where the temperature difference between the countercurrent flow of Fluorinert FC-72 and distilled water was: T F C = ( T F C , i n T w , o u t ) and, T w = ( T F C , o u t T w , i n ) [29].
The component assumed in the calculation of the HTC mean relative error is presented in Table 4.
The mean relative errors determined by the one-1D approach were relatively low and tended to drop as the heat flux delivered to the heated plate increased. In the previous paper [28], the HTC mean relative error reached its highest value of 12.93% at the lower heat flux density, q = 12.26 kW/m2. Additionally, the mean relative error of heat flux density for the lowest heat flux density was 1.41%.

4. CFD—Simcenter STAR-CCM+ Software

Simcenter STAR-CCM+ is a software application that facilitates the numerical analysis of fluid movement through various simulation models, including computational fluid dynamics (CFD), computational structural mechanics (CSM), heat transfer, electromagnetics, multiphase flows, particle dynamics, reaction processes, electrochemistry, and aeroacoustics. This tool offers an extensive array of physical models designed for computer-aided engineering (CAE) [33].
The numerical analysis was conducted using the Simcenter STAR-CCM+ application. Numerical computations were performed with the Simcenter STAR-CCM+ software version 2020.2.1 Build 15.04.010, installed on a PC with the following configuration: 2× Intel Xeon E5-2698v4 40-core CPUs, a clock speed of 3.6 GHz, and 128 GB of RAM (Intel Corporation, headquartered in Santa Clara, CA, USA).
A three-dimensional CAD model, imported from SolidWorks, was used to generate the simulation geometry using the modeling functionalities available in STAR-CCM+. Subsequent operations were conducted on the created geometry to extract the hot and cold sections for module configuration, one of which incorporated a heated plate.
The hot section (HMCHs) was designated for the working fluid FC-72, while the cold section (CMCHs) used distilled water. Both sections were defined and mapped to the geometry for integration into the meshing and simulation processes. The fluid regions contained the two working fluids. The flow rates, the outlet pressure, and the inlet temperatures for FC-72 and distilled water were determined. Additionally, a uniform heat flux density was assumed on the copper plate’s external surface. Boundary conditions were set as a ‘mass flow inlet’ at the entry points of both fluid sections and a ‘pressure outlet’ at their exit points.
All numerical simulations were conducted as steady-state (time-independent) analyses. This choice reflected the experimental procedure, in which the MCH module reached thermal equilibrium before any temperature or heat-flux measurements were recorded. Steady modeling is sufficient because the system exhibits no significant transient effects once the flow rate and heat flux are stabilized. No time-dependent boundary conditions were applied.
Table 5 presents the main experimental parameters used in the numerical calculations within Simcenter STAR CCM+. Boundary conditions for the CFD simulations are summarized below to ensure reproducibility and clarity. All simulations were steady-state, three-dimensional, and included gravity effects (Y = −15° direction, 9.81 m/s).
Table 6 lists the boundary conditions used in the Simcenter STAR CCM+ numerical calculations.

4.1. Calculation of CFD—Simcenter STAR-CCM+

In these numerical calculations, a multiphase volume of fluid (VOF) model was used. The model is well-suited for simulating the flow of multiple immiscible fluids on dense numerical grids, enabling the resolution of the position and shape of the interface between the phases, as reported in [27]. In this approach, heat transfer and fluid flow problems were described by the following equations, which are similar to those presented in [27].
Energy equation in fluid
t V ρ E d V + A ρ H v · d a = A q · d a + A T · v d a + V f b · v d V + A i h i J i d a
where
  • E—the total energy,
  • H—the total enthalpy,
  • V—volume,
  • a—the area vector,
  • ρ—the density,
  • v—the velocity vector,
  • fb—the resultant of body forces,
  • q—the heat flux vector,
  • T—the viscous stress tensor,
  • hi—the total enthalpy of components i,
  • Ji—the diffusive flux of components i.
Continuity equation:
t V ρ d V + A ρ v · d a = V S u d V
where
  • t—time,
  • Sui—user-specified source term.
Momentum equation:
t V ρ v d V + A ρ v v · d a = A p I · d a + A T · d a + V f b d V + V S u d V
where
  • p—pressure,
  • I—identity tensor.
Energy equation in solid:
d d t V ρ C p T d V + A ρ C p T v s · d a = A q · d a + V S u d V
where
  • Cp—the specific heat,
  • T—the temperature,
  • vs—the solid convective velocity.
Volume fraction transport equation:
A α i v · d a = V . S α i d V V . 1 ρ i · α i ρ i v d , i d V
where
  • Sai—the mass source term of phase i.
Conjugate heat transfer:
q 0 = A 0 + B 0 T c 0 + C 0 T w 0 + D 0 T w 0 4 ˙
q 1 = A 1 + B 1 T c 1 + T w 1 + C 1 T w 1 + D 1 T w 1 4
q 0 ˙ S u 2 + T w 1 T w 0 R
where
  • R—thermal resistance,
  • q 0 —the heat flux from the fluid through boundary0,
  • q 1 —the heat flux leaves through boundary1 into the solid,
  • A, B, C, D—linearized heat flux coefficients,
  • Tc0, Tc1—are the cell temperatures next to boundary0 and boundary1 respectively,
  • T w 0 ,   T w 1 —the interface temperatures on the fluid side (boundary0) and on the solid side (boundary1), respectively.
    q 0 ˙ + q 1 ˙ = S u
The STAR-CCM+ simulations were based on the following assumptions:
The fluids (FC-72 and water) flowing countercurrently within two groups of MCHs (hot and cold) were considered incompressible with a constant mass flow rate of 0.008 kg/s. The boundary conditions incorporated the inlet and outlet fluid temperatures, as well as the outlet overpressure. Material properties of the test section were assumed to be temperature independent. Heat losses from the test section to the ambient air were accounted for within the boundary conditions.
Table 7 presents the main properties of the materials used in the numerical calculations: two fluids (FC-72, distilled water), copper plates (0.5 mm and 3 mm thick), aluminum, and silicon.
An advanced polyhedral mesh was generated to enhance the accuracy and numerical stability of the computational domain. The near-wall mesh layers were optimized to properly resolve boundary-layer phenomena essential for analyzing laminar flow regimes. Following mesh generation, the boundary and physical conditions were defined, which included specifying the working fluid properties, heat transfer mechanisms, thermal boundary constraints, and material characteristics. The flow regime was assessed using the measured mass flow rate, hydraulic diameter, and fluid properties were used to assess the flow regime. Based on the calculated Reynolds numbers (Re ≈ 1100–1300), the system was decisively classified as laminar. Accordingly, the laminar model was implemented for all simulations conducted in STAR-CCM+. The simulation then advanced to the solving and analysis phase. STAR-CCM+ solves a set of differential equations, presenting results via flow visualizations, graphs, and numerical data. The robust numerical algorithms achieved a high level of computational precision; for example, the continuity equation convergence reached an order of magnitude of 10−9. Numerical mathematical software (STAR-CCM+) libraries (solvers) were responsible for formulating and resolving the generalized governing equations. A total of 10,000 iterations were conducted for the numerical experiments, with the assumption that residuals should fall below 10−6 [34]. As demonstrated by the residual-iteration correlation, further increases in iteration count did not yield noticeable improvements since the residuals attained a steady-state asymptotic value. The generated data was subsequently subjected to post-processing using data visualization tools for interpretation and validation.

4.2. Validation of Numerical CFD Results

Validation of the results obtained from numerical CDF analysis is performed by:
  • Comparison of numerical results with experimental data.
  • Examination of the quality of the adopted computational meshes.
The Grid Convergence Index (GCI) method was employed to examine and evaluate the quality of the computational mesh and to quantify the discretization error in the CFD simulations, as described in [27].
The GCI was calculated similarly to [27]. Mesh sizes of 2 mm, 3 mm, and 5 mm were considered. The representative cell size h was calculated using the following formula [27]:
h = 1 N i = 0 n V i 1 3
where ΔVi is the volume of the i-th cell and N is the total number of cells in the CFD model.
The GCI method involves comparing solutions obtained from two distinct mesh resolutions. The grid refinement factor, r, is defined as [27]:
r = h c o a r s e h f i n e
where hfine characterizes the finer grid and hcorase represents the coarser grid, hence [27]:
r 21 = h 2 h 1 ; r 32 = h 3 h 2
Average temperatures at the contact surface between the working fluid and the heated mini-channel wall (ϕ1, ϕ2, and ϕ3) were selected for analysis. The following relationships were given [27]:
e 21 = ϕ 2 ϕ 1 ,   e 32 = ϕ 3 ϕ 2
Additionally, the approximate relative error was defined as [27]:
e a 21 = ϕ 1 ϕ 2 ϕ 1
Similarly to Equation (23), ea32 is calculated [27].
The order of convergence p was described by [27]:
p = ln e 32 e 21 + ln r 21 p 1 · s g n e 32 e 21 r 32 p 1 · s g n e 32 e 21 l n ( r 21
The order of convergence indicates how quickly the error term diminishes as we move from one term to the next [27].
GCI was determined from the following relationship [27]:
G C I 21 = F s · e a 21 ( r 21 p 1 )
where Fs is a safety factor.
The computational mesh quality was evaluated using three different mesh sizes: 2 mm, 3 mm, and 5 mm.
Table 8 presents the corresponding number of cells, faces, and vertices for each of these grids used in the simulations.
A polyhedral hybrid mesh, derived from the tetrahedral grid, was chosen for the analyzed module due to its capacity to represent complex geometries efficiently. The element size and density of the mesh were carefully determined based on the geometric characteristics of the model, particularly the thinnest component: the separating plate.
Table 9 compiles the calculation results of the grid convergence index derived from Equations (19)–(25).
To validate the computational mesh quality, three distinct base mesh sizes were selected and subjected to the GCI calculation procedure. The analysis yielded GCI values of 0.14% for the fine mesh and 0.35% for the coarse mesh. The decrease in GCI values between the coarse and fine meshes confirmed the reliability of the results. Consequently, the 5 mm mesh was selected as the preferred size for the simulations. The results obtained with this gird selection will differ from the results computed with infinitesimal mesh elements by no more than 0.99%.
Appropriate boundary conditions were configured in STAR-CCM+. This involved specifying the initial temperature, pressure, heat flux density, and other parameters that influence the system’s behavior.

5. Results

The one-dimensional mathematical approach is a simple analytical method for determining the heat flow. In the 1D approach, only the heat flow direction perpendicular to the fluid flow direction was assumed. In steady-state conditions, a parallel, laminar, and countercurrent flow of the two fluids (water and FC-72) occurred with a constant mass flow rate from both sides of the copper plate.
In the initial phase, experimental studies were conducted. Subsequently, a 1D approach was employed to determine the local heat transfer coefficients at the interface between the copper heated plate and FC-72 refrigerant, FC-72 refrigerant and copper separating plate, copper separating plate and distilled water, and distilled water and closing plate. Based on experimental studies, three-dimensional calculation results were proposed. The heat transfer coefficients obtained from the 1D approach were then compared with the results from the STAR-CCM+ program.
The experimental investigations were conducted under steady-state conditions. The analysis yielded data on three heat fluxes transferred to the fluid within the channel: 1000 W/m2, 2000 W/m2, and 8000 W/m2; a 165° orientation; and mass flow rate of two fluids flowing countercurrently 0.008 kg/s.

5.1. One-Dimensional Approach

The results are presented in Figure 5, Figure 6, Figure 7, Figure 8, Figure 9, Figure 10 and Figure 11 in the form of:
  • A thermogram obtained from the infrared camera program on the external surface of the heated plate for three heat flux densities: 1000 W/m2 (a), 2000 W/m2 (b), and 8000 W/m2 (c). Six channels are labeled from #1 to #6 (Figure 5).
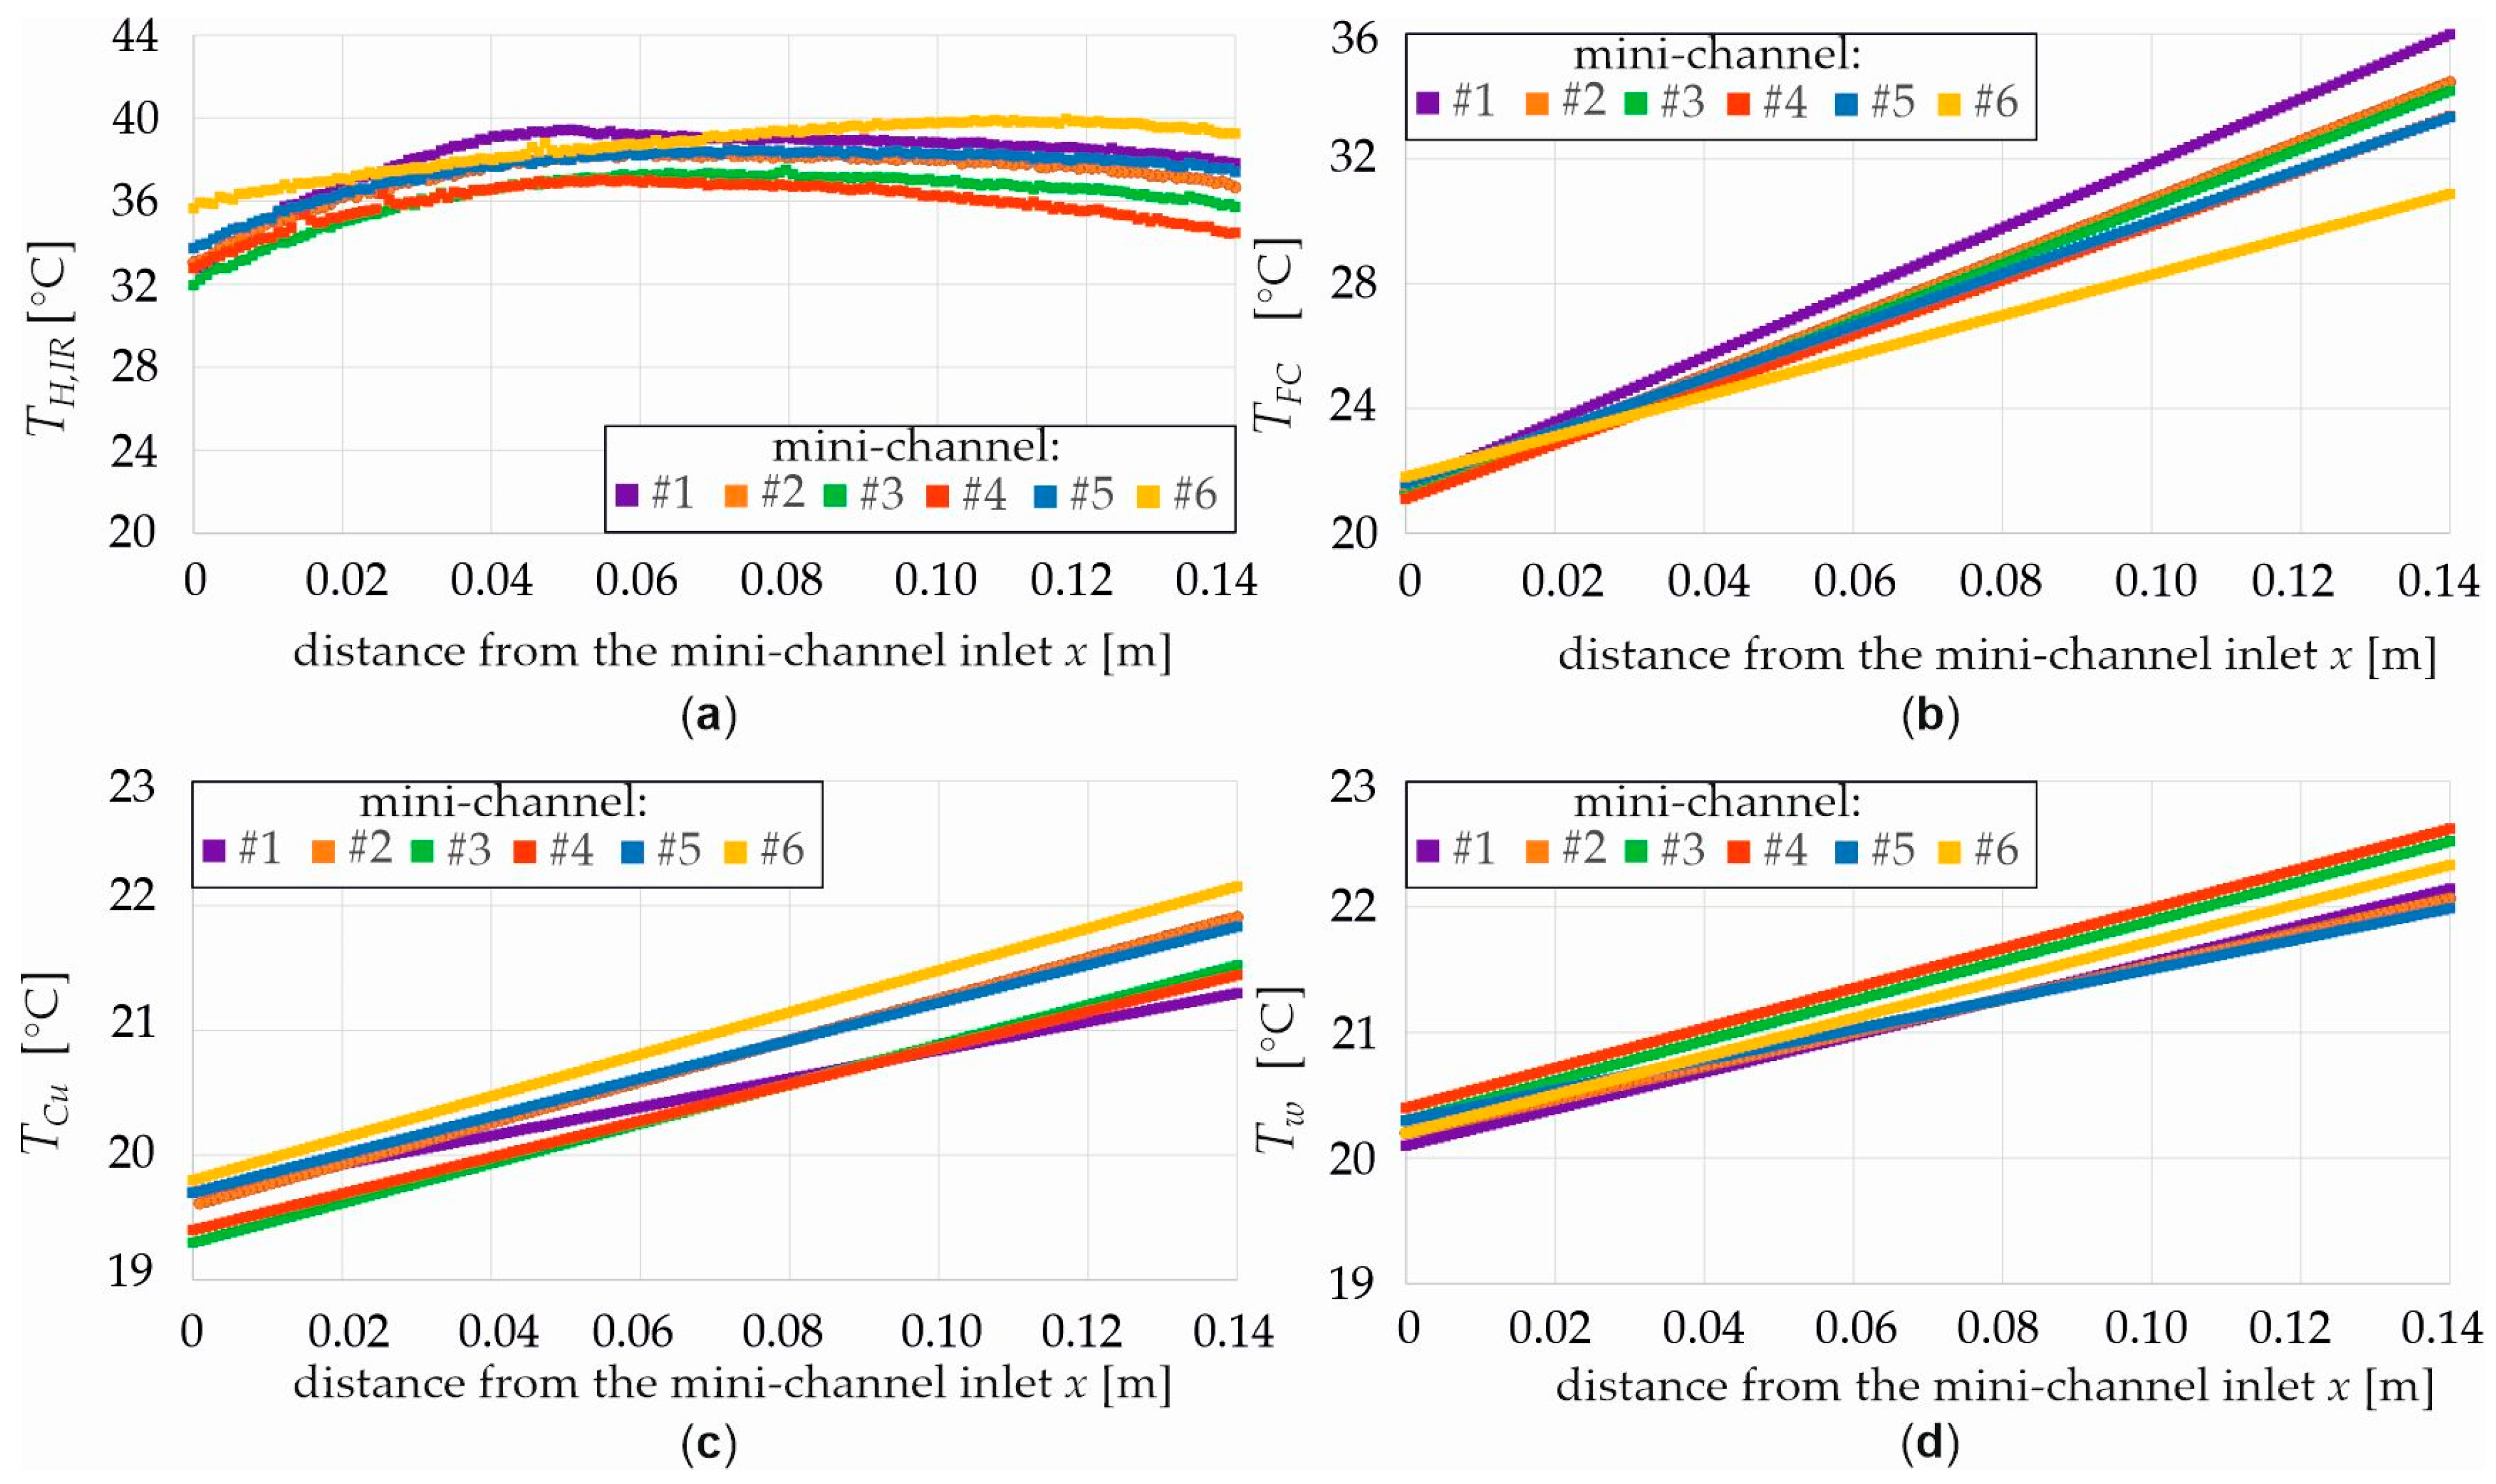
  • Dependencies for the temperature as a function of distance from the MCH (a) copper heated plate, (b) FC-72 fluid, (c) copper separate plate, (d) distilled water for three heat flux densities 1000, 2000, and 8000 W/m2, and six channels labeled from #1 to #6 (Figure 6, Figure 7, Figure 8 and Figure 9).
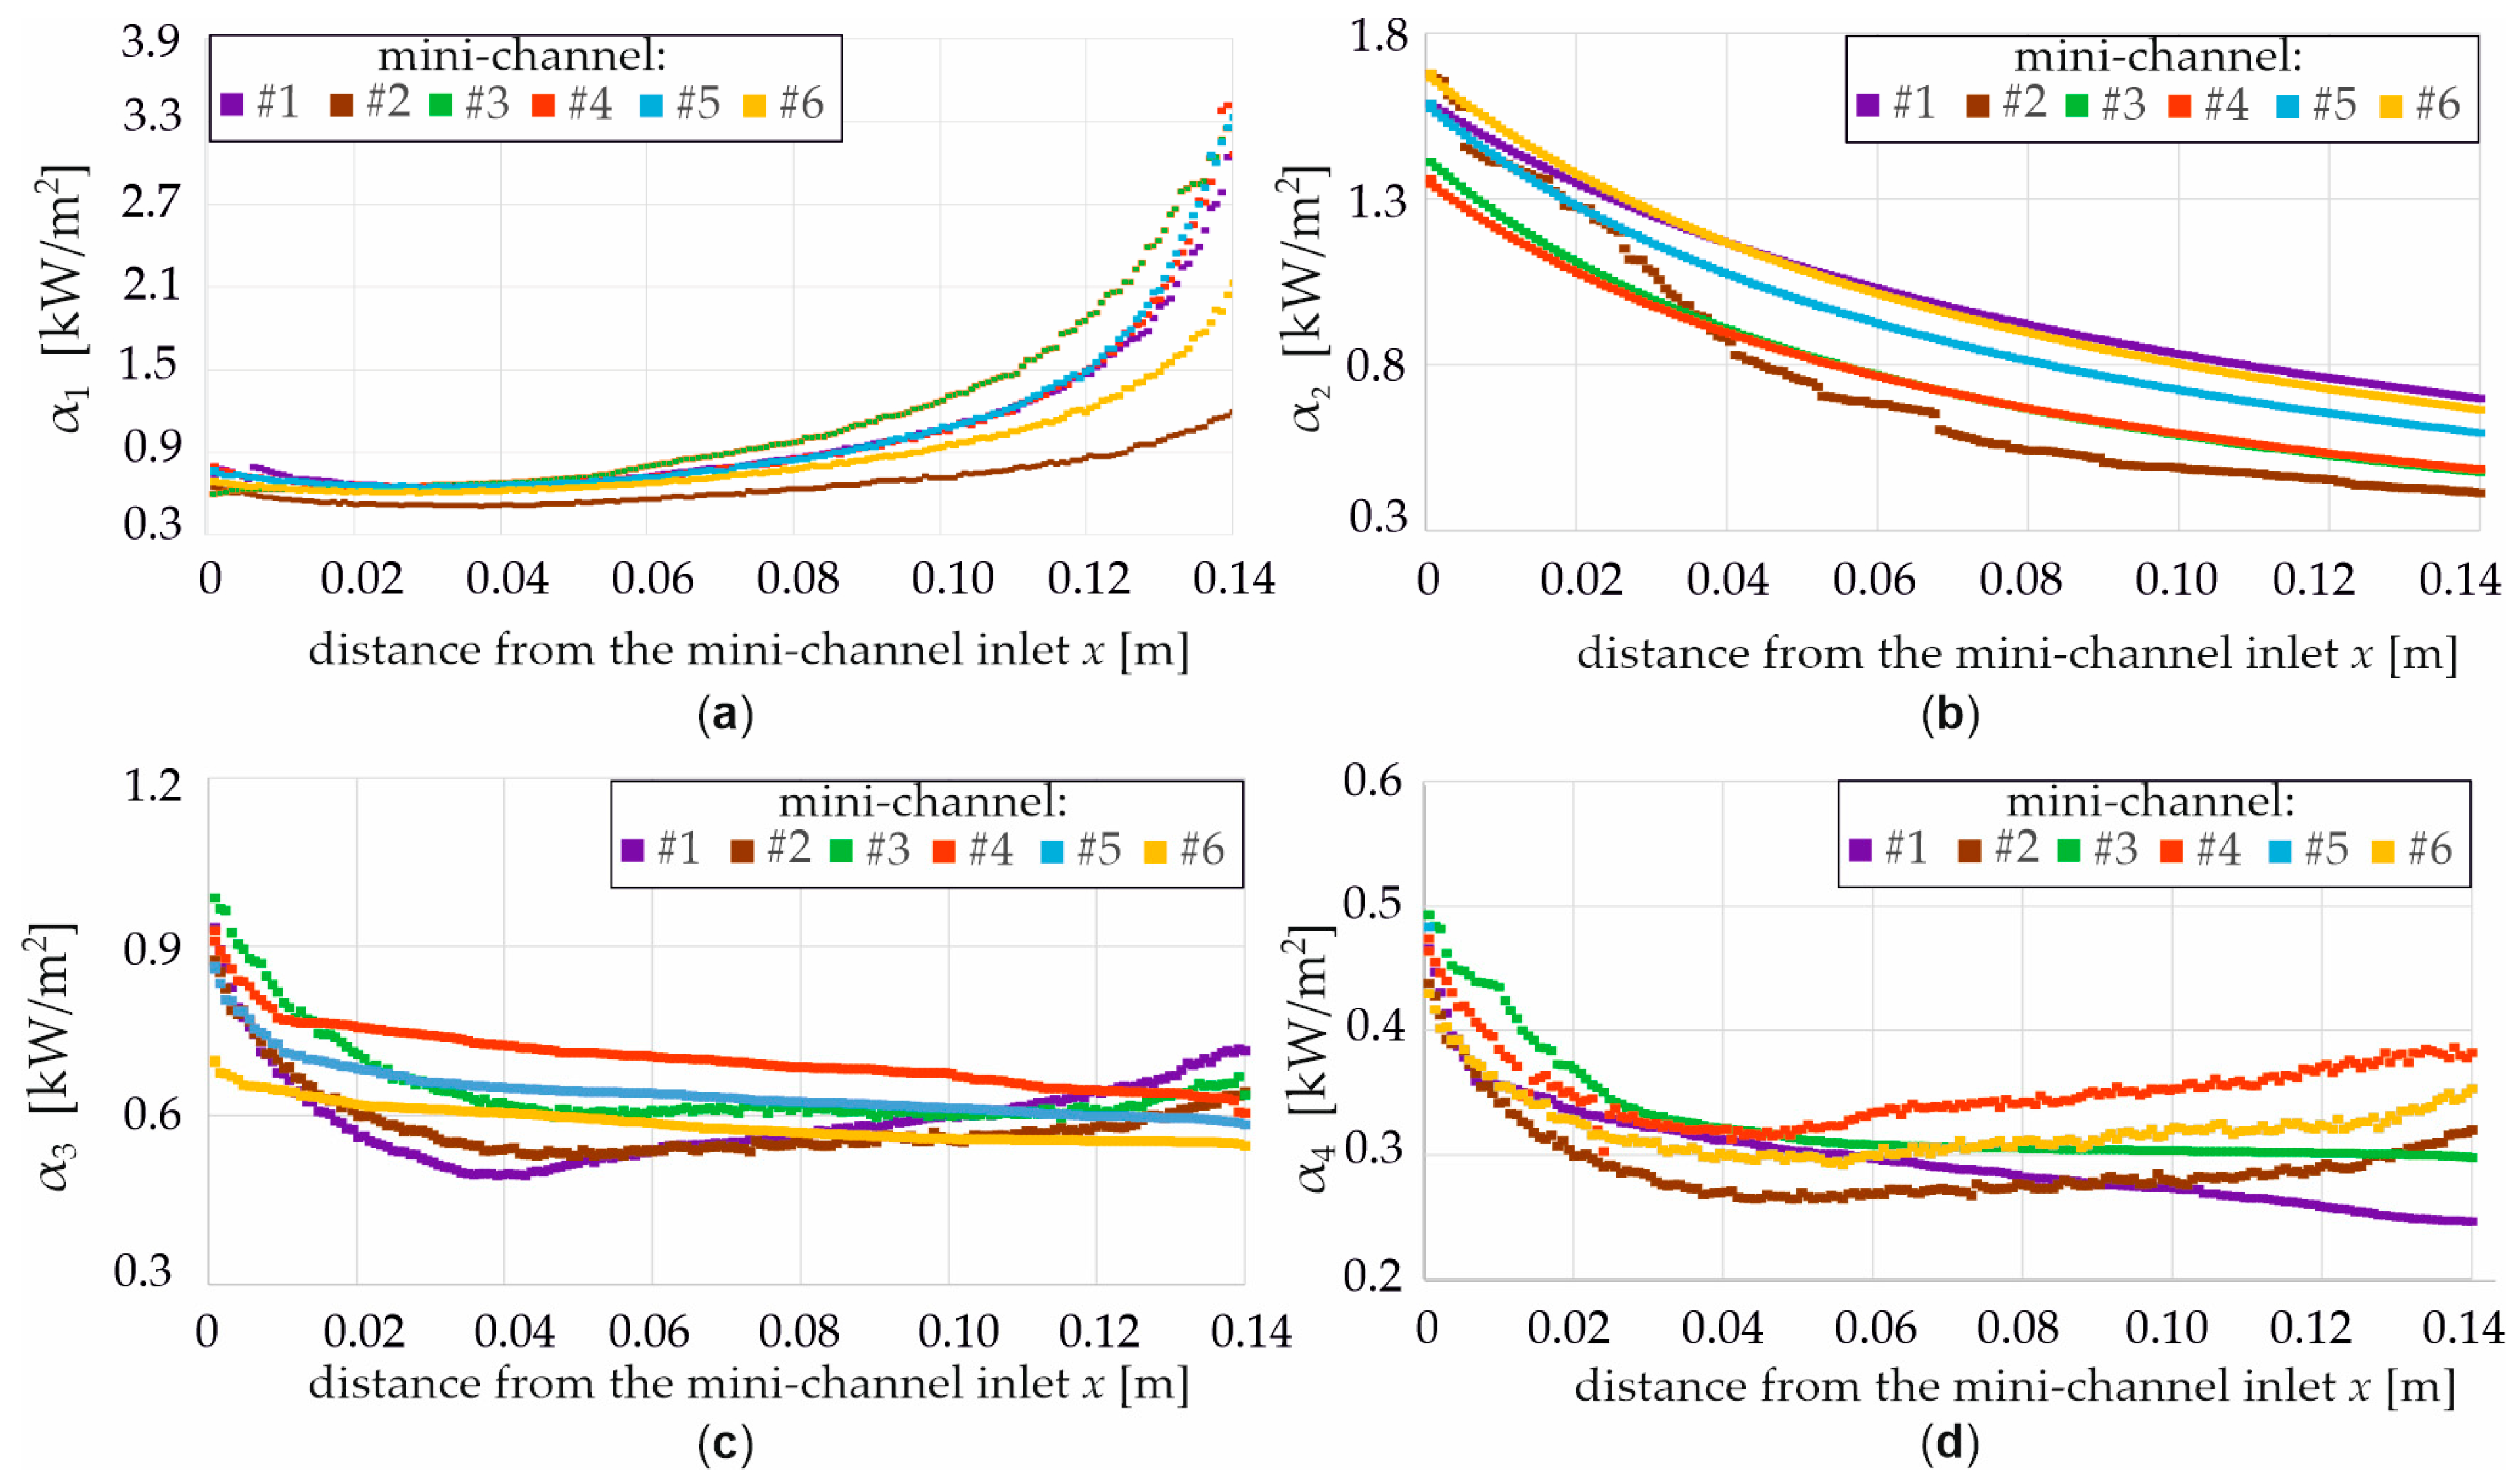
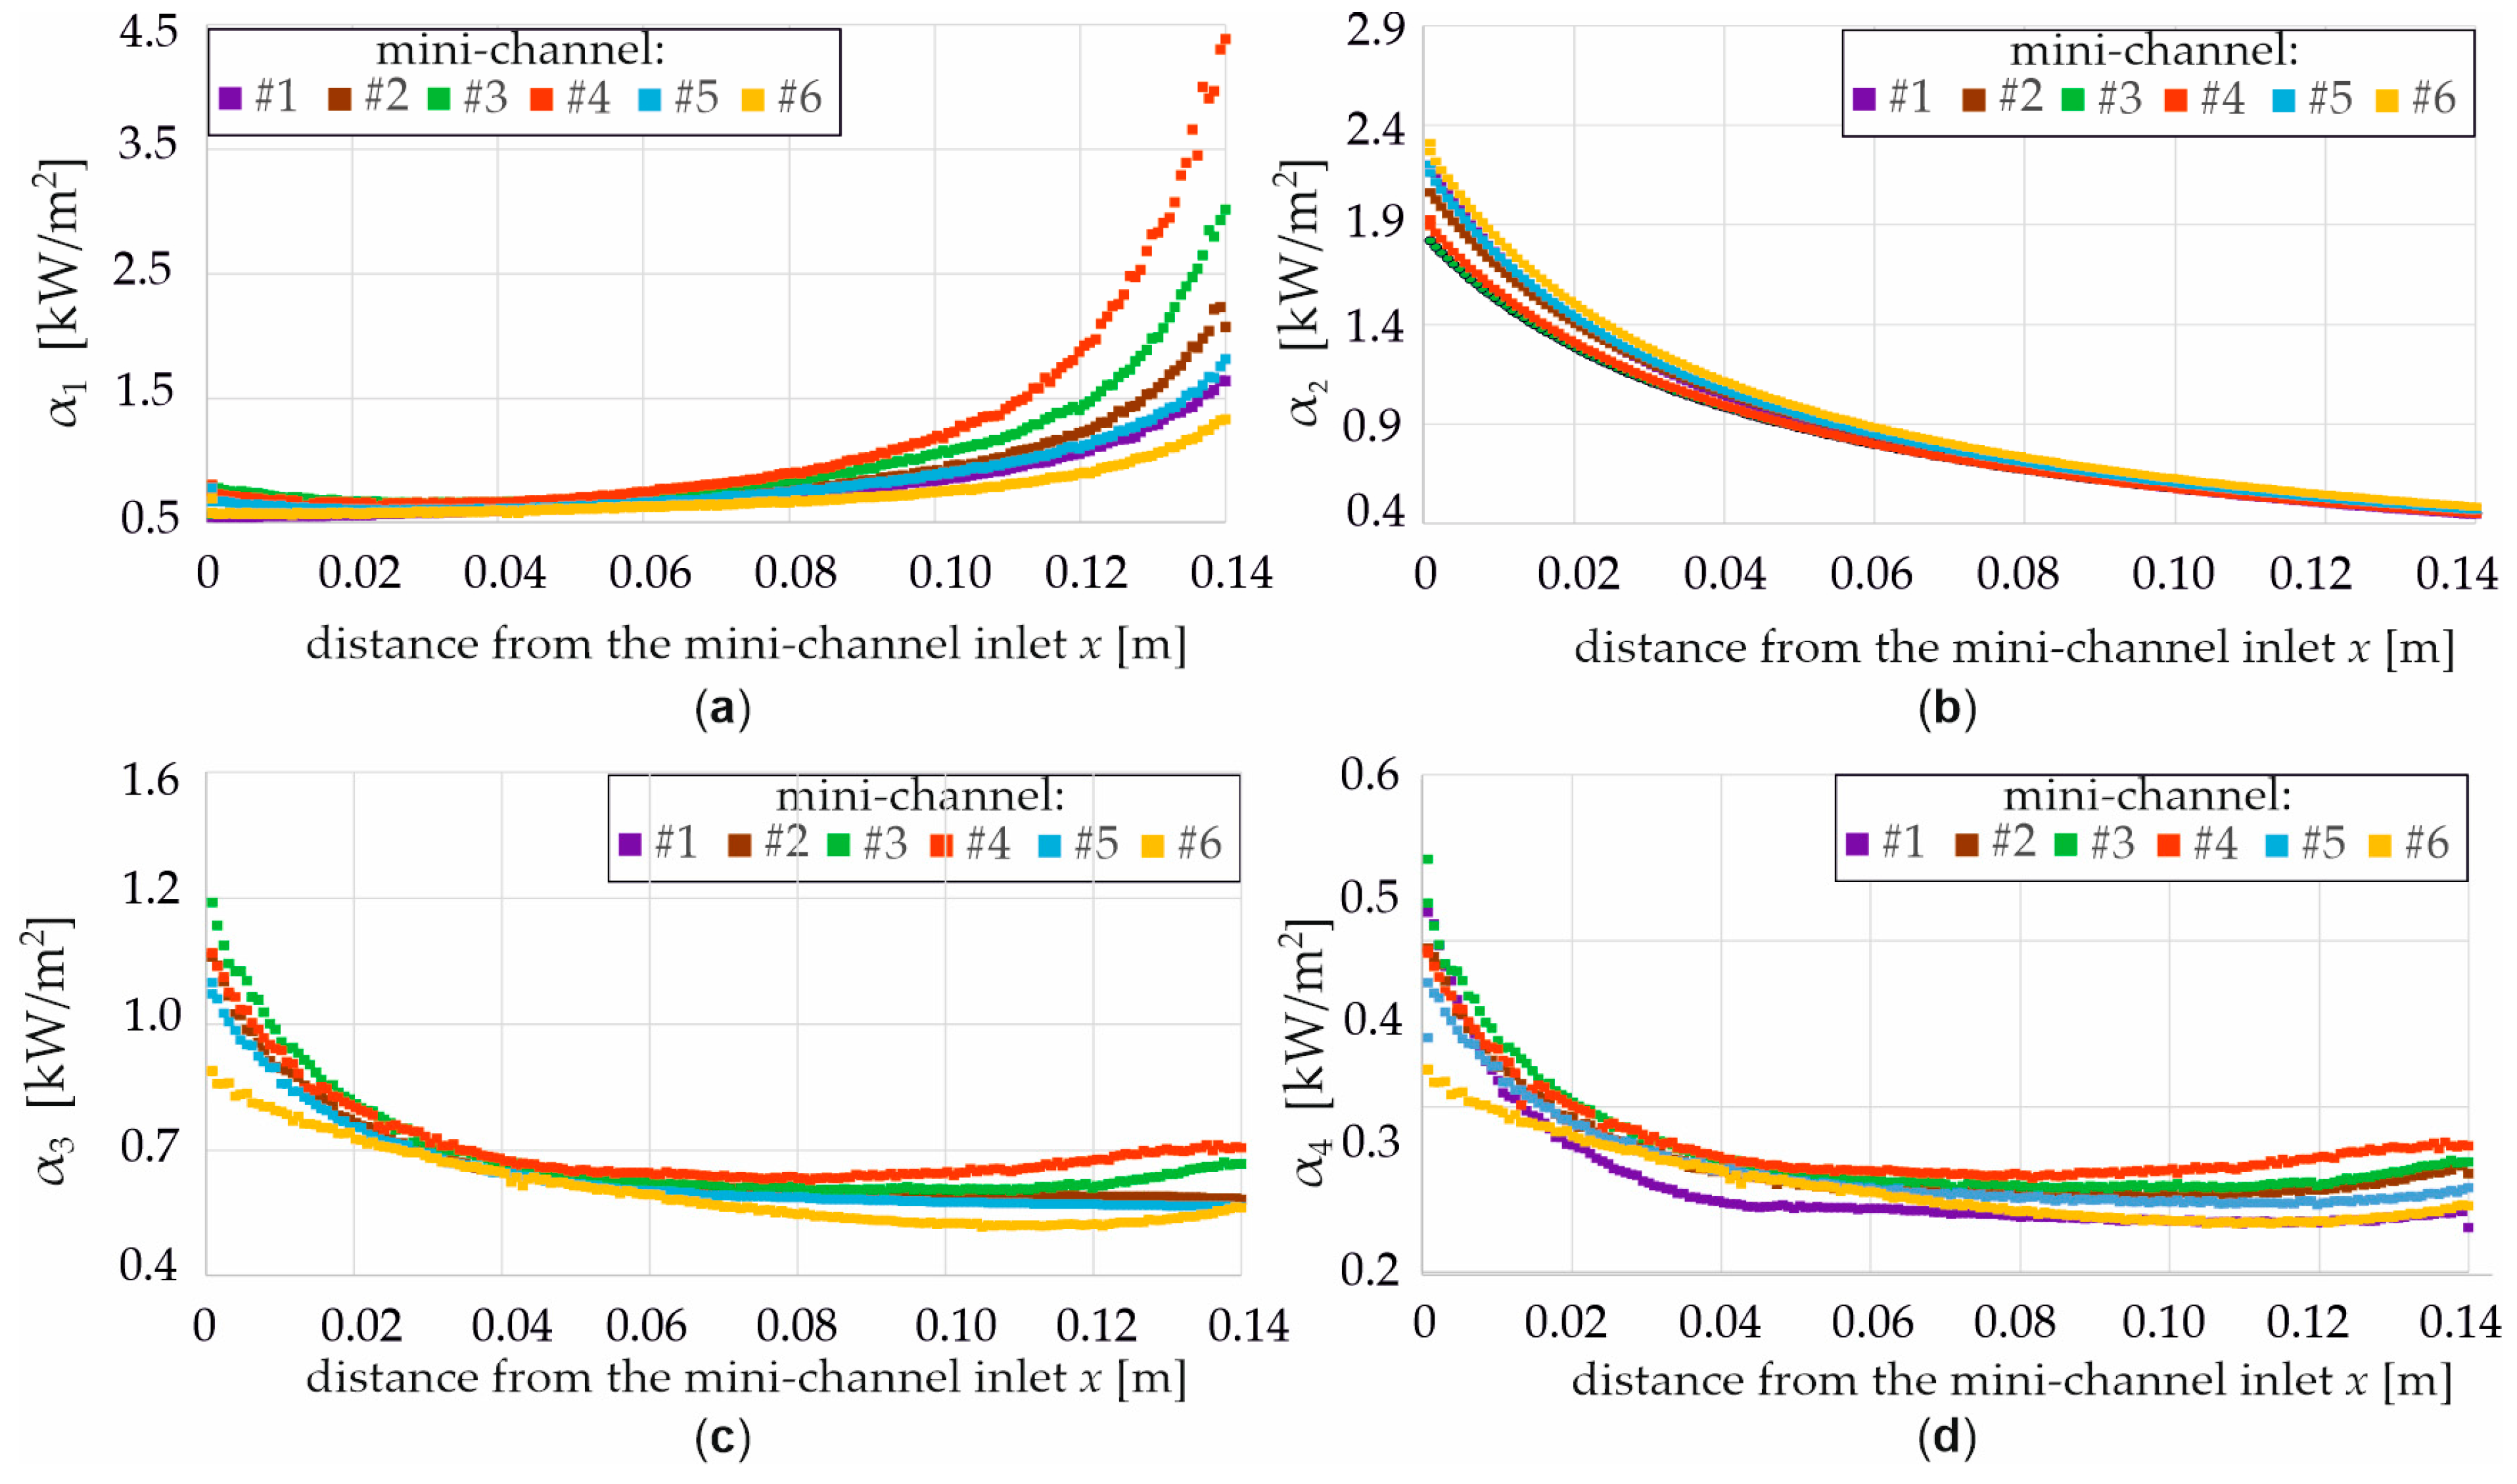
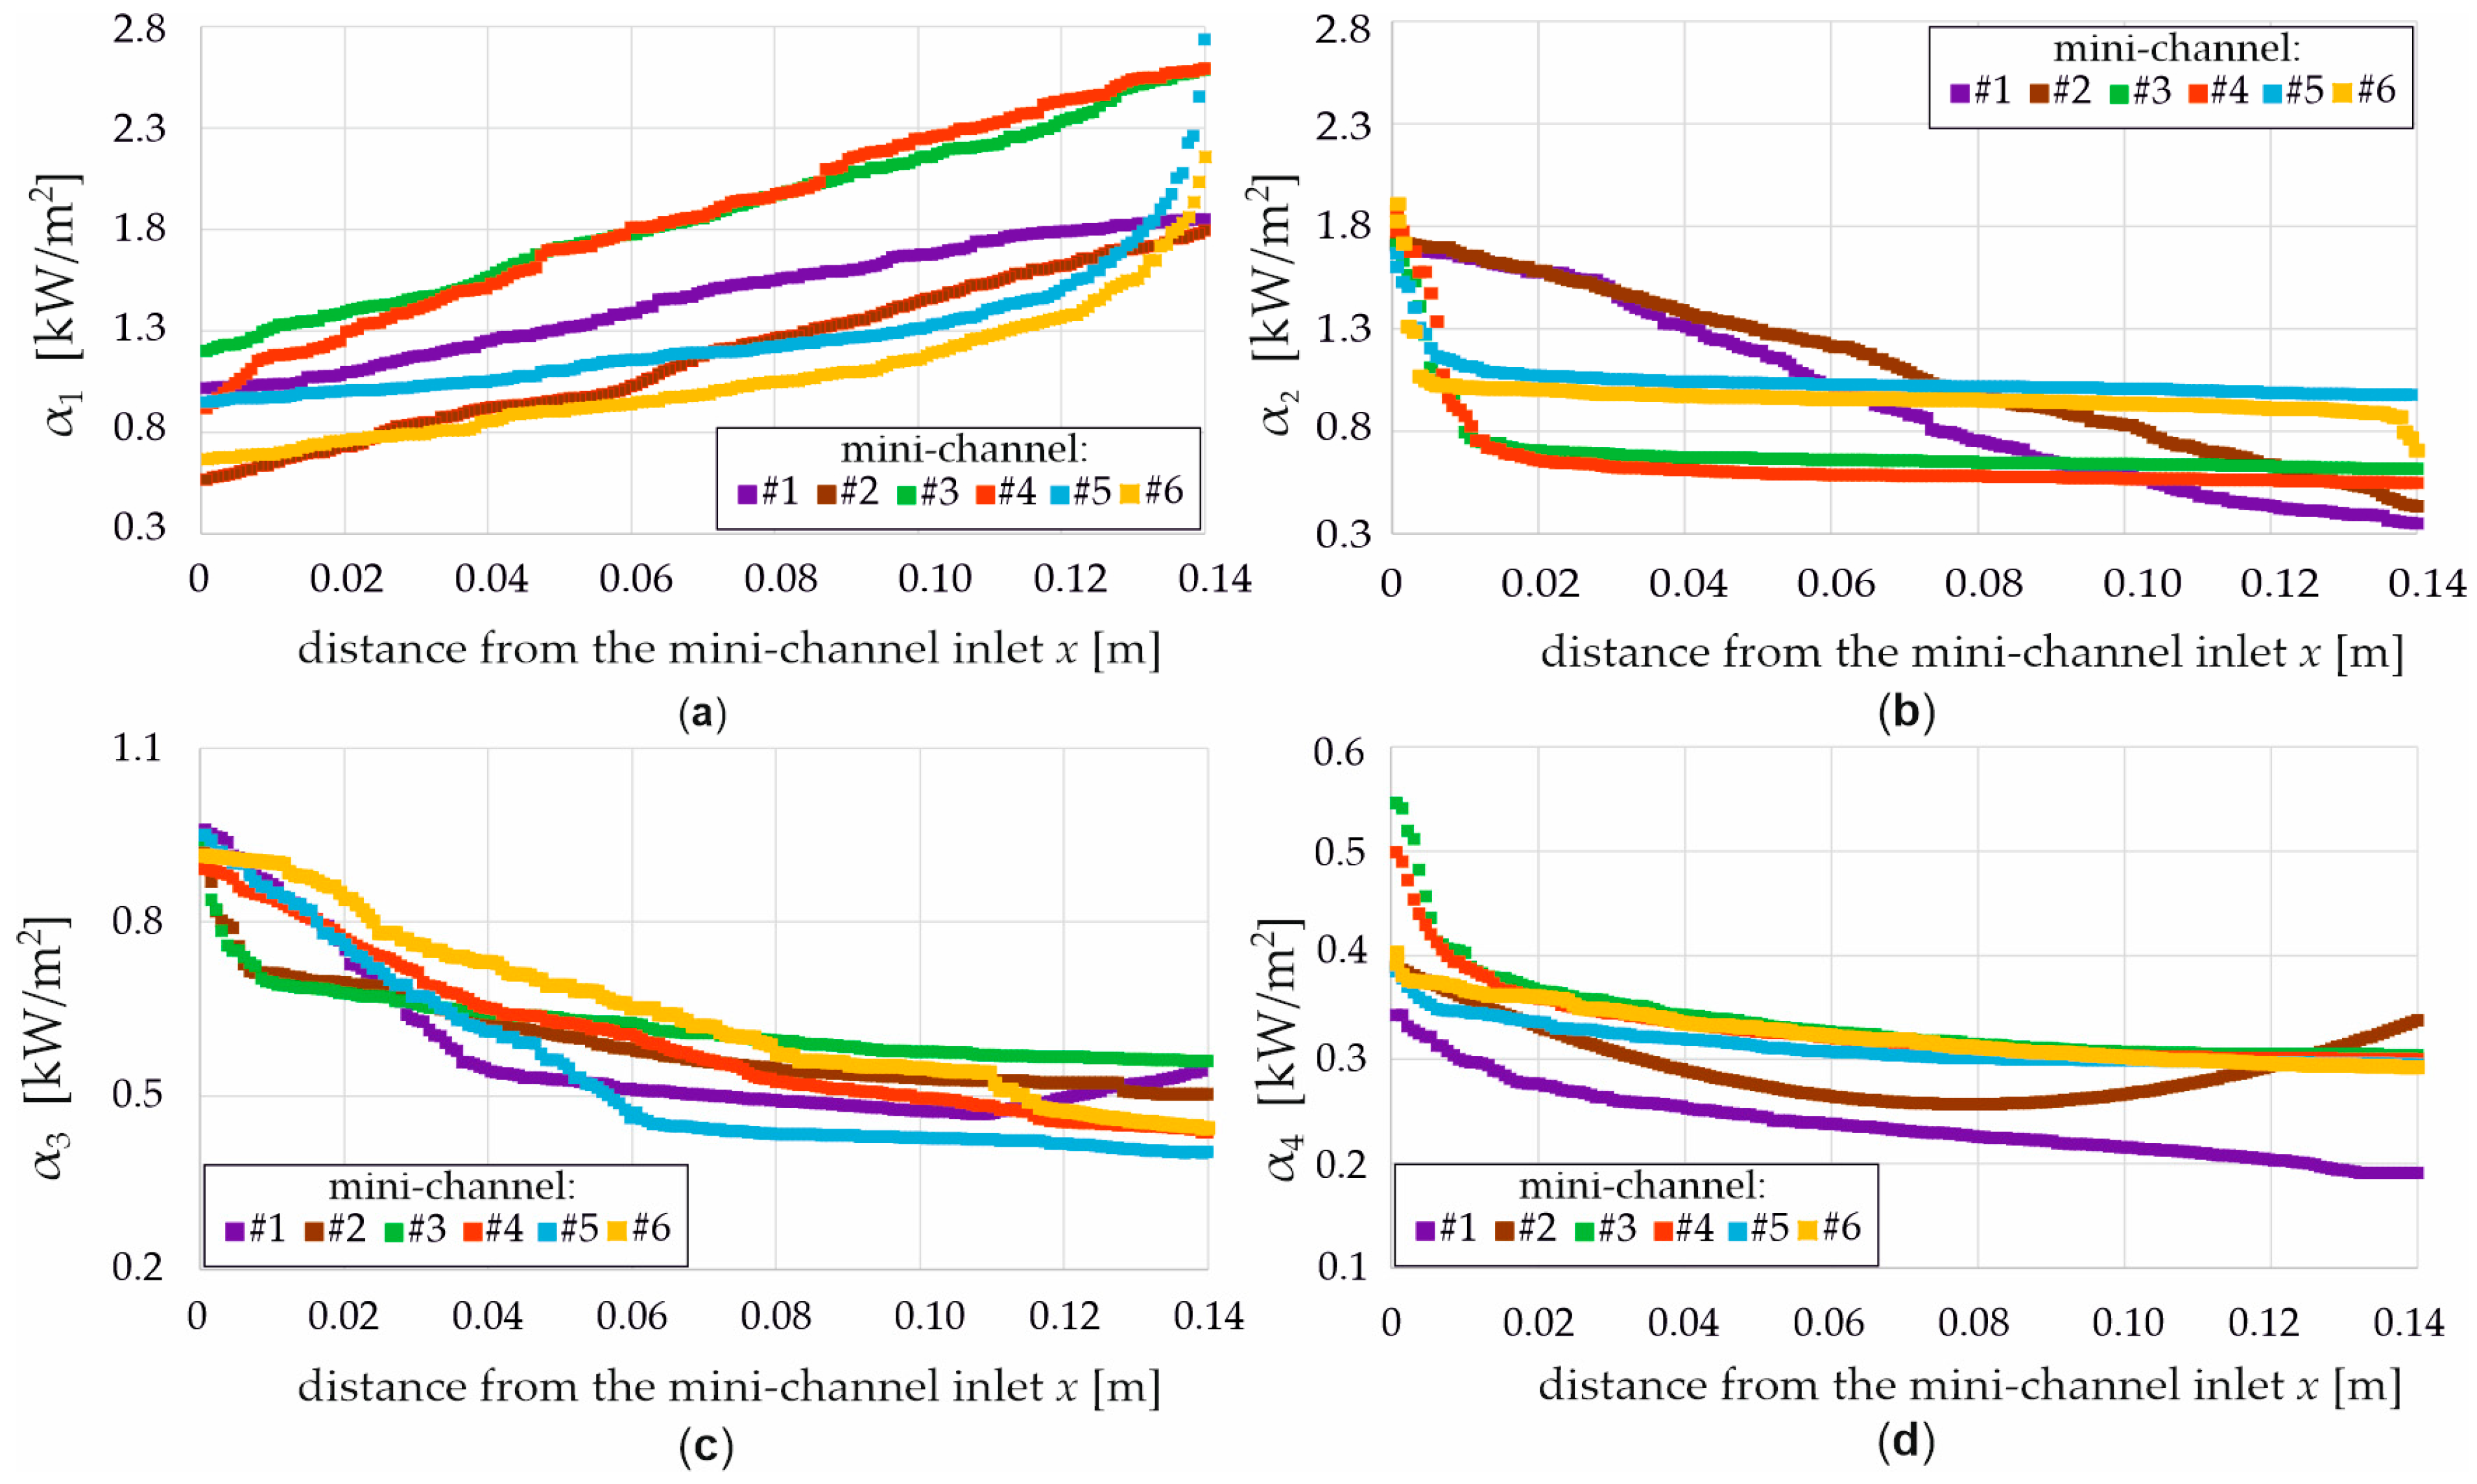
  • Dependencies for the HTC as a function of the distance from the MCH inlet from 1D approach for three flux densities 1000, 2000, and 8000 W/m2: (a) α1—heated plate and FC-72, (b) α2—FC-72 and copper separating plate, (c) α3—copper separating plate and water, (d) α4—water and copper closing plate, for six MCH (from #1 to #6) (Figure 10 and Figure 11).
Based on the experimental data, the surface temperature of the copper hot plate was analyzed under laboratory conditions at an ambient temperature of 26 °C, a relative humidity of 34%, and an atmospheric pressure of 1017 hPa. A luxmeter was employed to measure the light intensity on the surface of the hot plate.
Figure 5 shows the thermograms captured by the FLIR E60 infrared camera, illustrating the external surface of the heated plate corresponding to three distinct heat fluxes: 1000 W/m2 (a), 2000 W/m2 (b), and 8000 W/m2 (c), along with a test section oriented at 165°. Each of the six lines indicated in Figure 7 (labeled from #1 to #6) represents lines passing through the centers of the six MCHs.
An increase in heat flux density resulted in a rise in temperature on the surface of the copper heated plate, with the highest temperature observed at the outlet of the MCH and along the side walls. The maximum temperature recorded on the copper plate surface was 40 °C at the outlet (Figure 5c), while the minimum temperature of 26 °C was noted near the inlet edge of the MCHs (Figure 5a).
The thermograms exhibit symmetric temperature distributions around the module’s center line. The geometric arrangement of the mini-channels, the uniform heat flux applied to the heater plate, and the equal countercurrent mass flow rates in the hot and cold fluid streams are the reasons for this symmetry. The observed mirror symmetry confirmed the uniformity of the experimental setup and the numerical simulations.
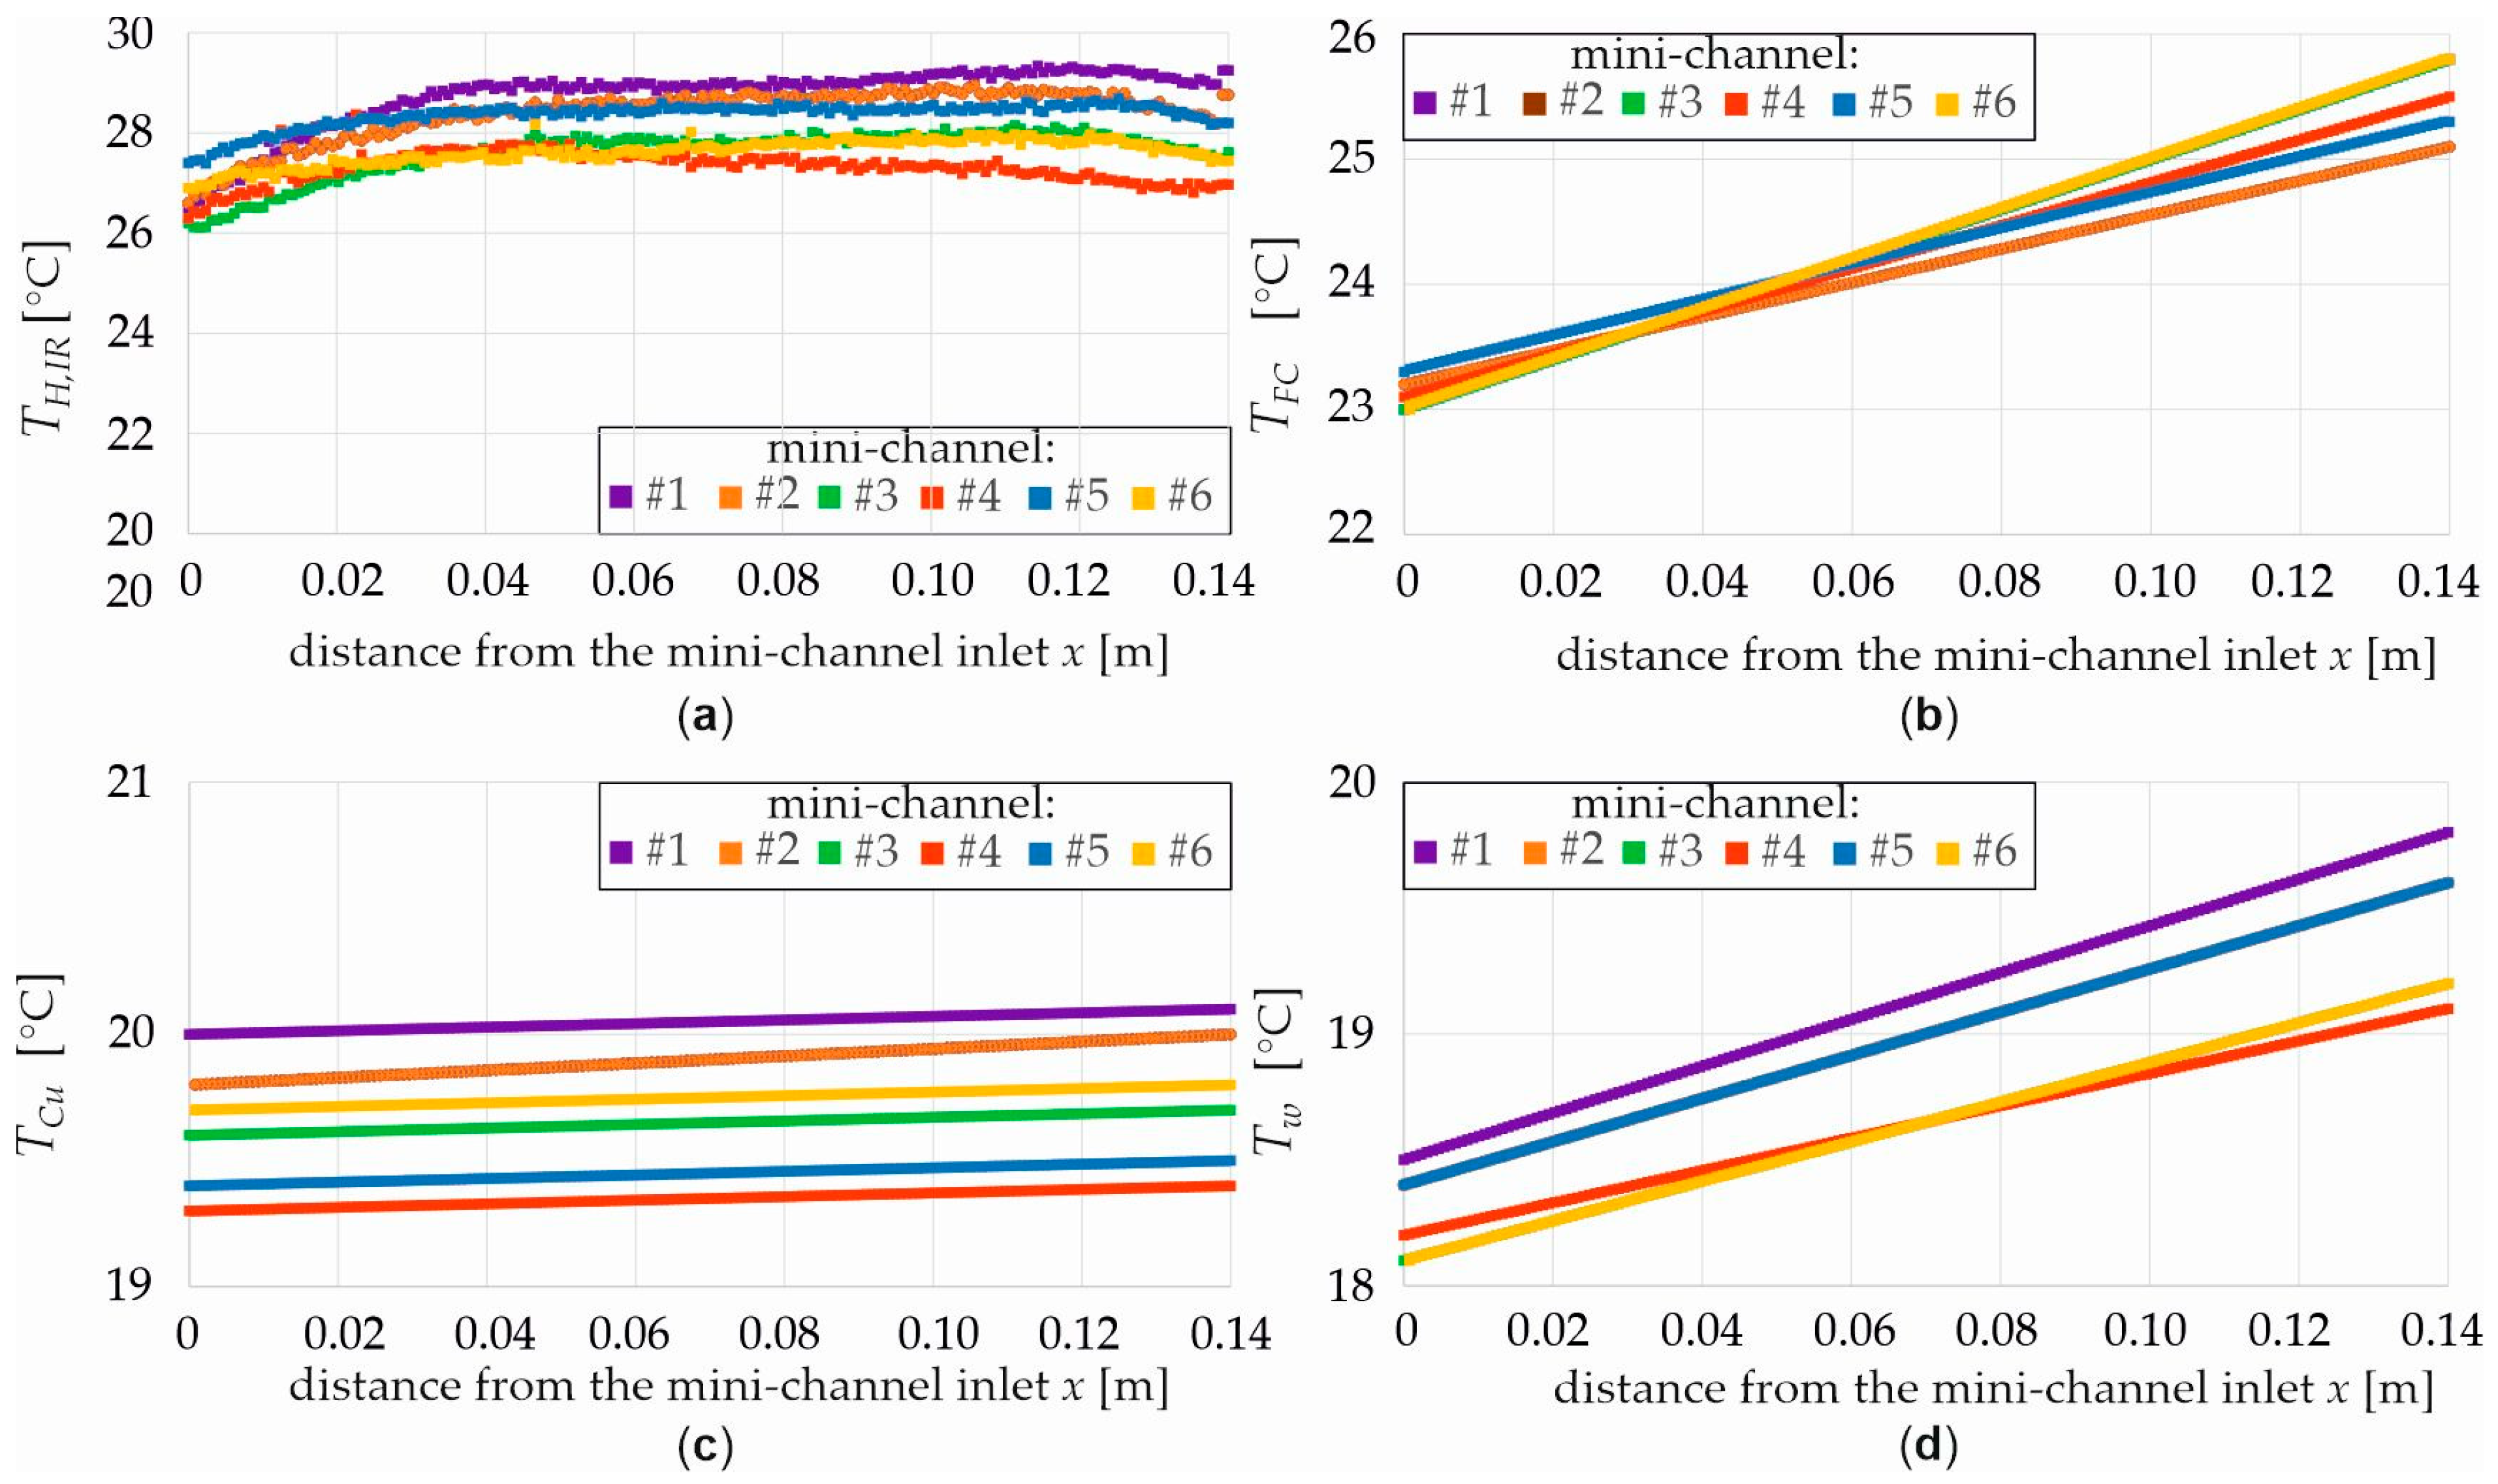
The temperature of the individual layers of the test module increased mainly with the distance from the inlet to the MCH. In the case of the copper heated plate (Figure 6a, Figure 7a and Figure 8a), the temperature increased to a certain distance from the MCH (2/3 of Figure 6a and 1/3 of Figure 7 and Figure 8a), while the outlet of the MCH showed a downward trend.
The maximum temperature readings on the copper heated plate were recorded at the MCHs situated along the side walls (Figure 6a, Figure 7a and Figure 8a, MCH #1 and #6), where the highest heat fluxes of approximately 8000 W/m2 resulted in temperatures of about 40 °C (Figure 10a, MCH #6). Conversely, the lowest temperature was observed at the central MCH, approximately 26.5 °C (Figure 6a, MCH #4). As the temperature of the copper plate decreased, an intensification of heat transfer was observed.
In the miniature channels with FC-72 refrigerant (Figure 6b, Figure 7b and Figure 8b), on the copper separating plate (Figure 6c, Figure 7c and Figure 8c), and within the miniature channels containing distilled water (Figure 6d, Figure 7d and Figure 8d), the temperature increased linearly with distance from the MCH inlet. The highest temperature readings were predominantly recorded in the side MCHs, with maximum values exceeding 36 °C (Figure 8b, #1), approximately 23.6 °C (Figure 7c, #1), and 22.7 °C (Figure 8d, #4) at the outlet MCH. The observations concerning the lowest temperatures of the plates and working fluids in relation to the MCH and the heat flux densities are not unequivocal.
The working fluid, FC-72, is heated by the copper plate upon entering the hot mini-channel (HMCH). Its temperature rises near the heated wall but then decreases as it flows away from the MCH entrance. A balanced fluid temperature is achieved at the center of the HMCH, which subsequently drops as the fluid flows through the cold mini-channel (CMCH). As the heat flux density increases, the increase in the number of bubbles in the flowing vapor–liquid mixture probably has no significant effect on heat transfer. In addition, the cold distilled water flowing through a second MCH cools the copper separating plate. In this CMCH area with distilled water, single-phase convection was observed along the entire length of the MCH. At higher heat flux densities, this process is more intense (see Figure 8d) compared to lower heat flux densities.
Figure 9, Figure 10 and Figure 11 illustrate the relationship between HTCs and the distance from the inlet to the MCH considering the specified heat flux density, countercurrent flow, and the experimental data provided in Table 7. The coefficients were determined using the proposed one-dimensional computational approach, at the interface between:
The local values of the HTC at the interface between the copper heated plate and the FC-72 refrigerant demonstrate an increasing trend with increasing distance from the MCH, except at the MCH inlet section (as in the case of the temperature drop of the copper heated plate at the MCH inlet, as shown in Figure 6a, Figure 7a and Figure 8a). The highest value of this coefficient was recorded at the MCH outlet, reaching 4.5 kW/(m2·K), for the central MCH of the test module (Figure 11a, MCH #4), where the lowest temperature was observed (Figure 10a). Elevated HTCs were also observed in another central MCH, #3 (Figure 9a, Figure 10a and Figure 11a). The HTC at the interface between the FC-72 refrigerant and the copper separating plate (Figure 9b, Figure 10b and Figure 11b) decreased with increasing distance from the MCH inlet, with a maximum value approximately between 2.35 kW/(m2·K) and 0.45 kW/(m2·K) (Figure 11b, MCH #6). The remaining HTCs at the interfaces, namely, between the copper separating plate and distilled water, and between the distilled water and the module closing plate, decreased in the inlet portion of the MCH (roughly one-third of its length), and slightly increased near the outlet (except at the MCH inlet section—significant decrease in value). This behavior may be attributable to a local rise in the temperature of the separating plate within this region.
The highest HTC was observed for the central #4 at the MCH inlet, approximately 1.1 kW/(m2·K) (Figure 11c), with a value of 0.5 kW/(m2·K) at the inlet to the MCH (Figure 11d). Conversely, the lowest temperature was observed for central MCH #4 (Figure 6a,c).

5.2. Simcenter STAR CCM+ CFD Results

In Simcenter STAR CCM+, simulations may be conducted under either steady or unsteady conditions to account for the influence of temporal variations on the fluid flow process. The computations were based on steady-state assumptions. By using constant values for mass flow rate and inlet pressure, the outlet pressure and fluid temperatures could be established. The primary objective was to determine the heat transfer coefficient for each interface between the fluids and the plates. Conducting several numerical calculations on the same model, with specified mass flow rate inputs, allows for the derivation of pressure characteristics related to flow rate.
The energy level was maintained consistently during the 800th iteration, remaining at 10−11. Consistency for the K-Epsilon model remained at 10−8, while the turbulent dissipation rate Tdr was recorded at 10−24, and Tke, representing turbulent kinetic energy, was at 10−16.
The Simcenter STAR CCM+ software facilitates the display of thermal and flow characteristics. The numerical calculations derived from the experimental data presented in Table 5 and Table 7 summarize the pressure and flow patterns, along with temperature distributions in specific cross-sections.
The CFD simulations were performed for fixed mass flow rates and inlet pressures, as shown in Table 10. Each fluid mass flow rate was distributed evenly across its six mini-channels. The values correspond to the experimental conditions and ensure accurate reproduction of flow distribution and heat-transfer characteristics.
A series of calculations was conducted using the STAR-CCM+ software, including the determination of individual layer temperatures and the HTC, analogous to the 1D approach. However, due to the extensive volume of data, only the HTCs corresponding to a single middle heat flux density (q = 2000 W/m2) and α3—copper separating plate/water were selected for detailed analysis and compared in pairs with the data derived from the 1D computational approach.
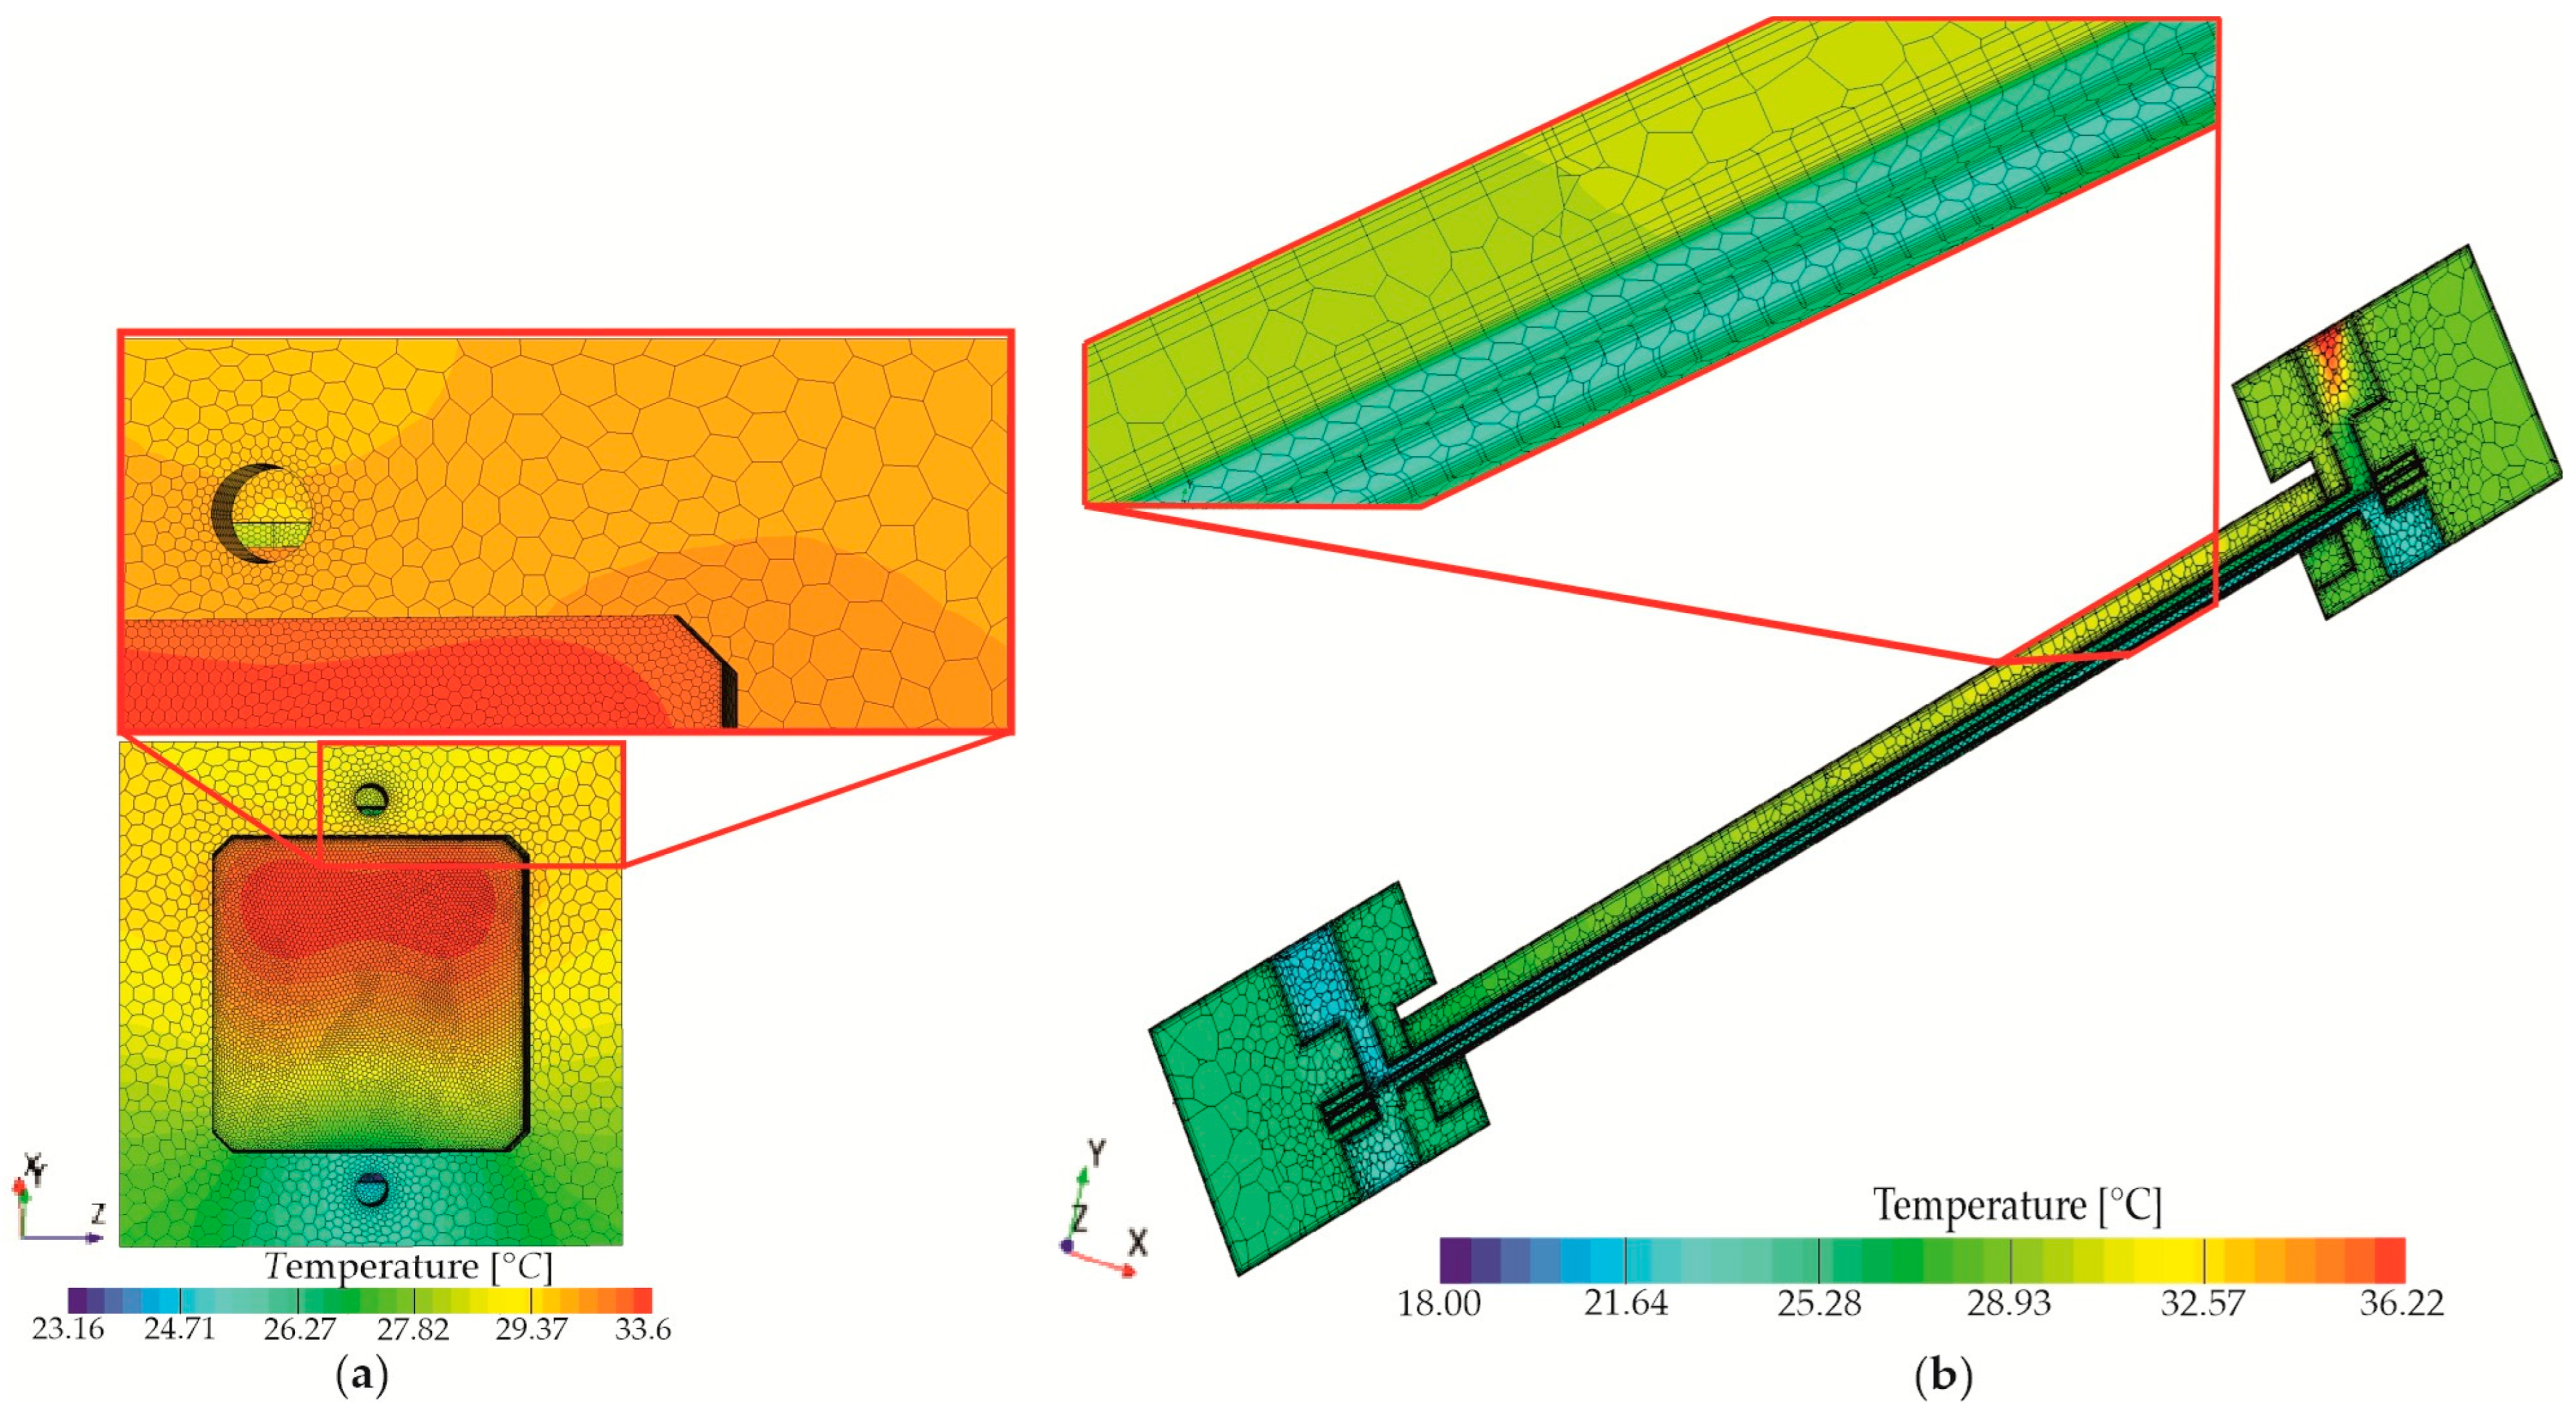
Figure 12 shows the design of the testing module for numerical analysis in Simcenter STAR-CCM+: (a) view of the polyhedral mesh, (b) fluid area moving through the HMCH and CMCH.
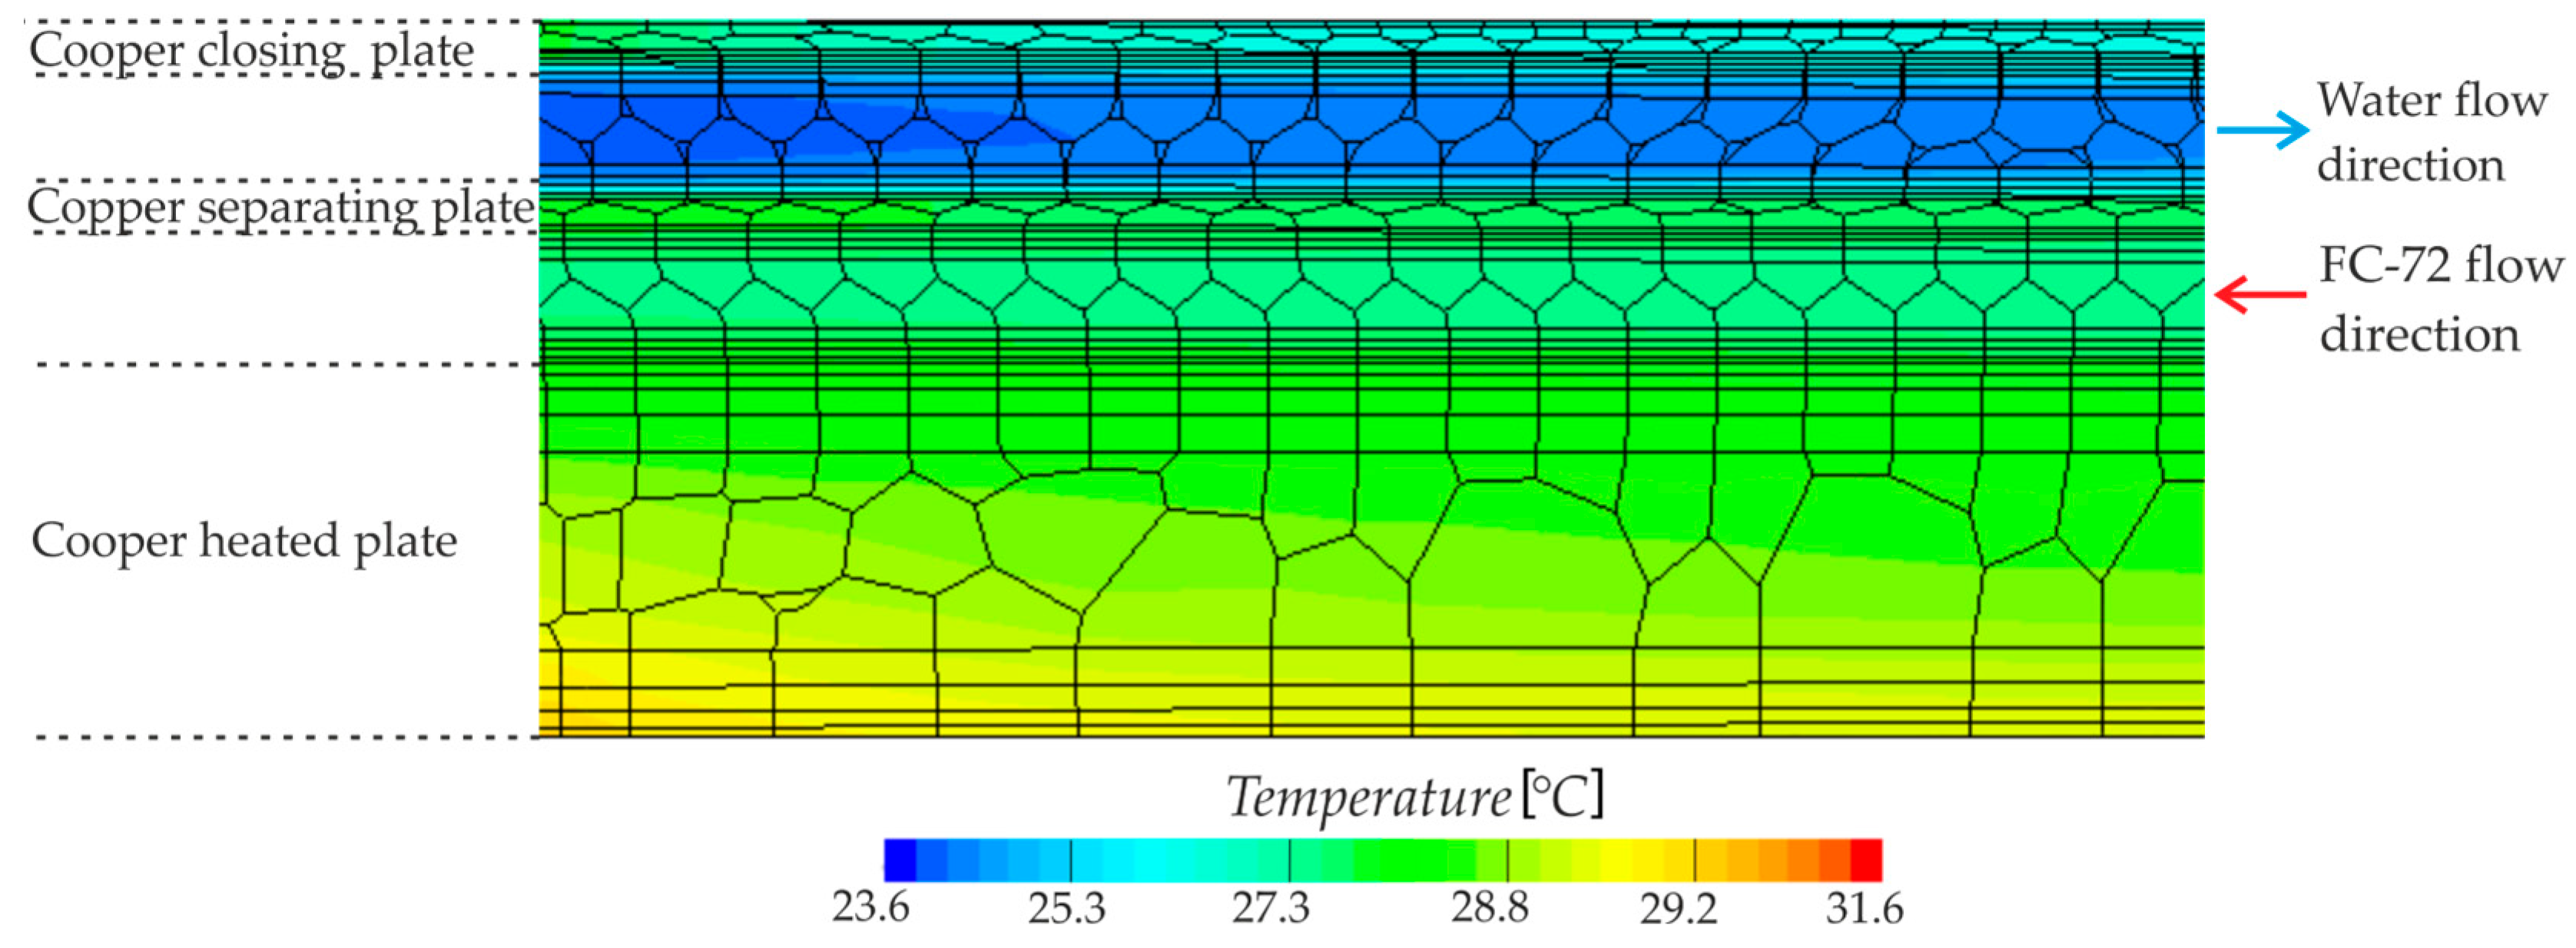
The configuration of the heat exchanger comprised multiple parts, each with a different thickness. The discretization of their volume used a polyhedral grid, which was created from the tetrahedral grid owing to its ability to represent complex geometries efficiently. Furthermore, by utilizing a higher-order grid, the polyhedral grid facilitates the generation of more precise results with a reduced number of elements. Furthermore, to enhance the precision of how the near-wall layer affects the flow pattern, the mesh was made finer in the areas surrounding the heated plate, the copper separating plate, and the component that seals the exchanger. The resulting layout is shown in Figure 13.
The data from STAR-CCM+ included:
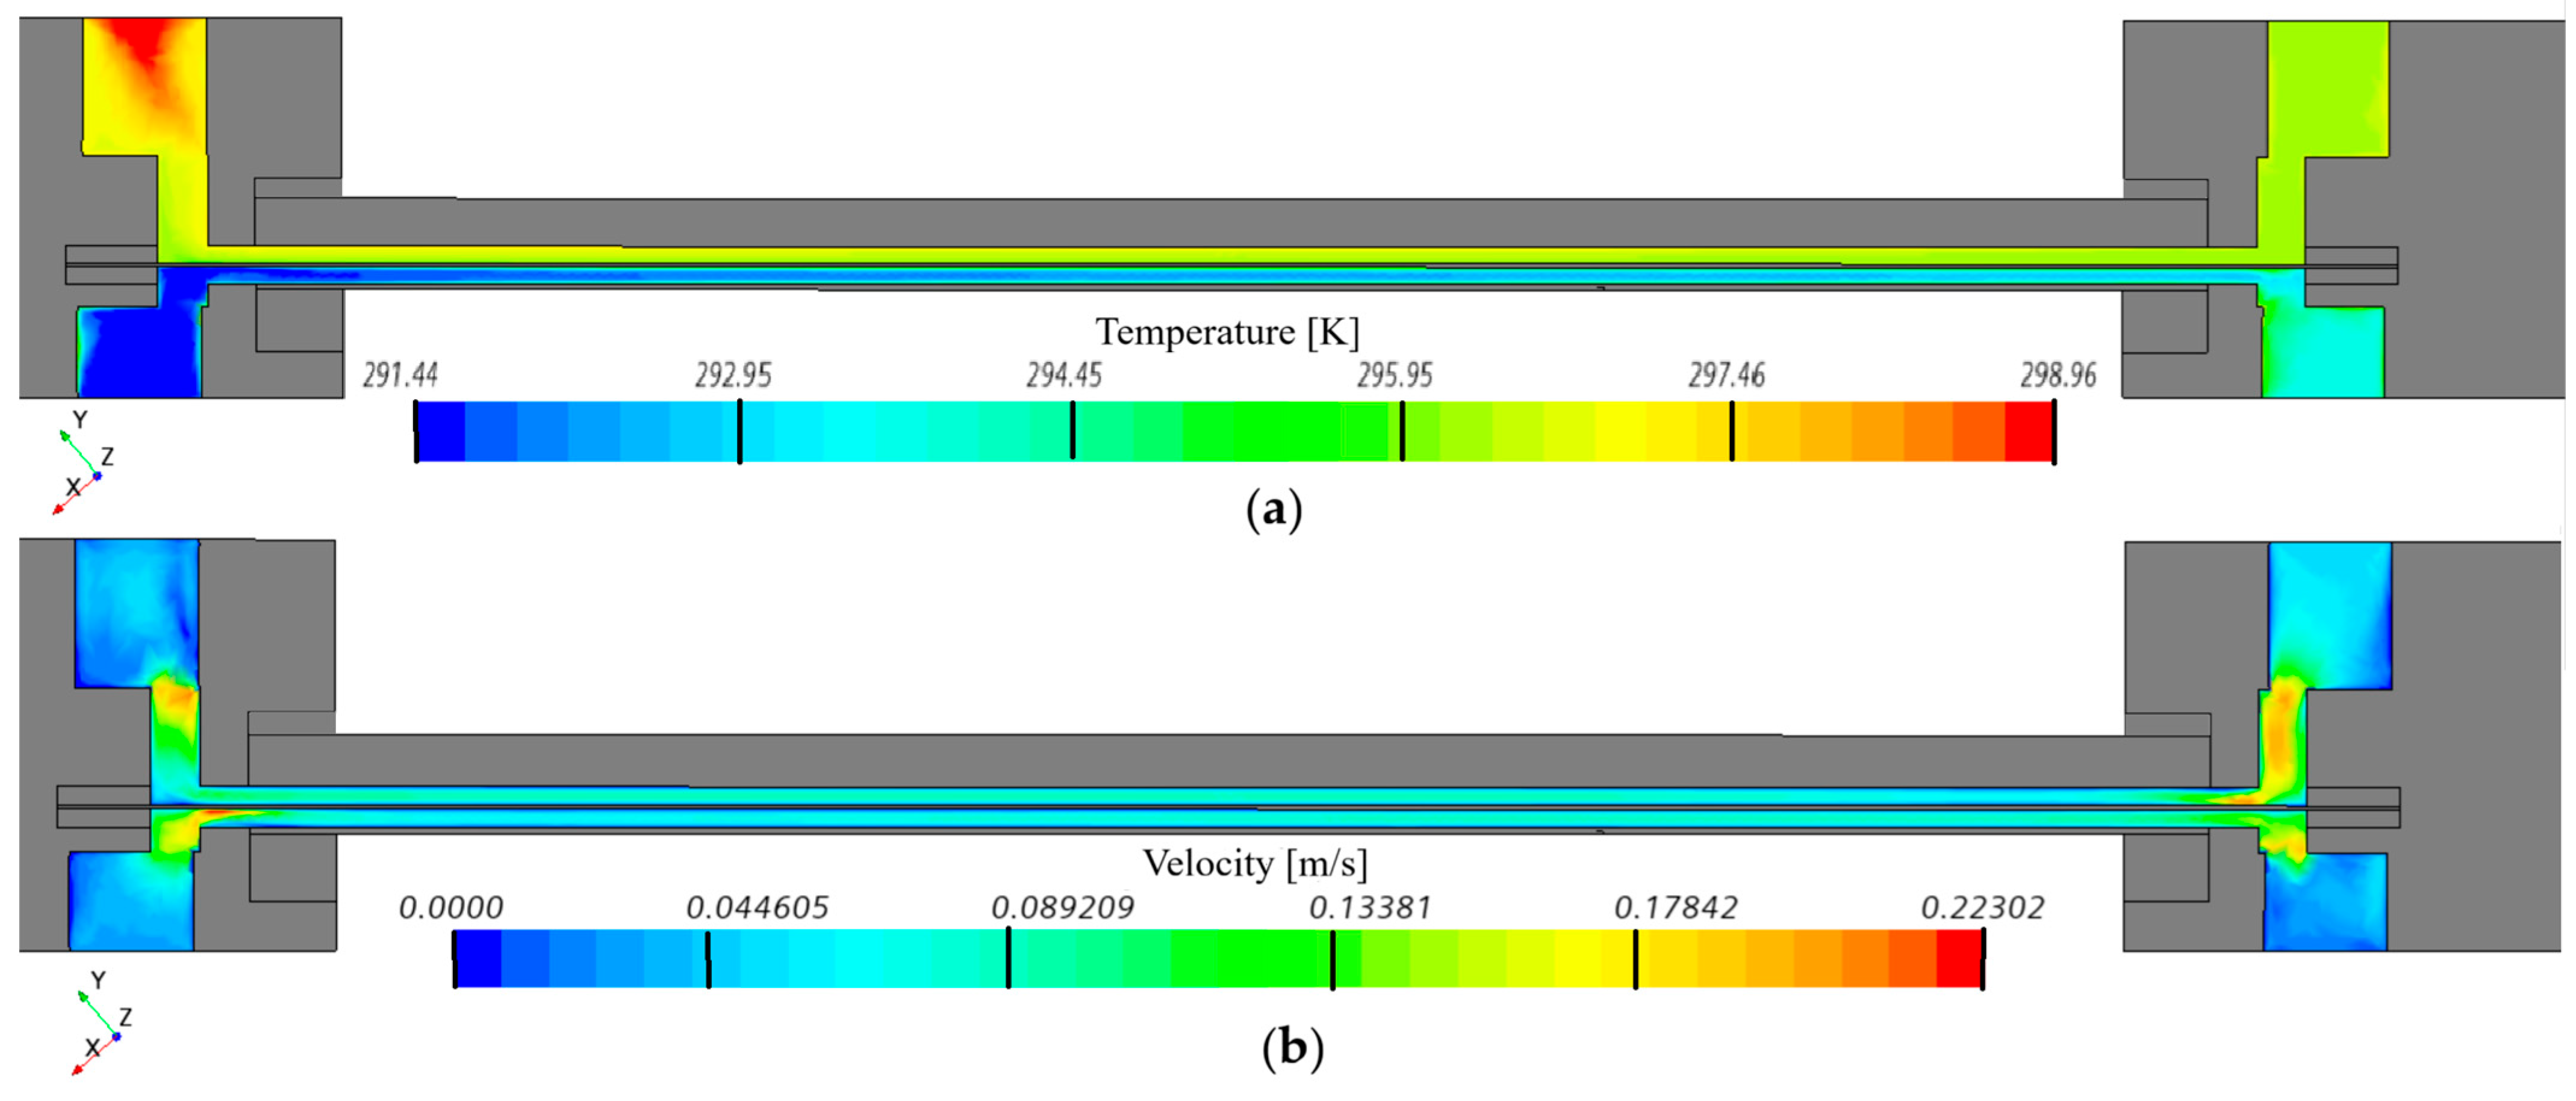
  • Two-dimensional calculation results illustrating velocity distributions: (a) temperature, (b) velocity, generated by the STAR-CCM+ software—Figure 14.
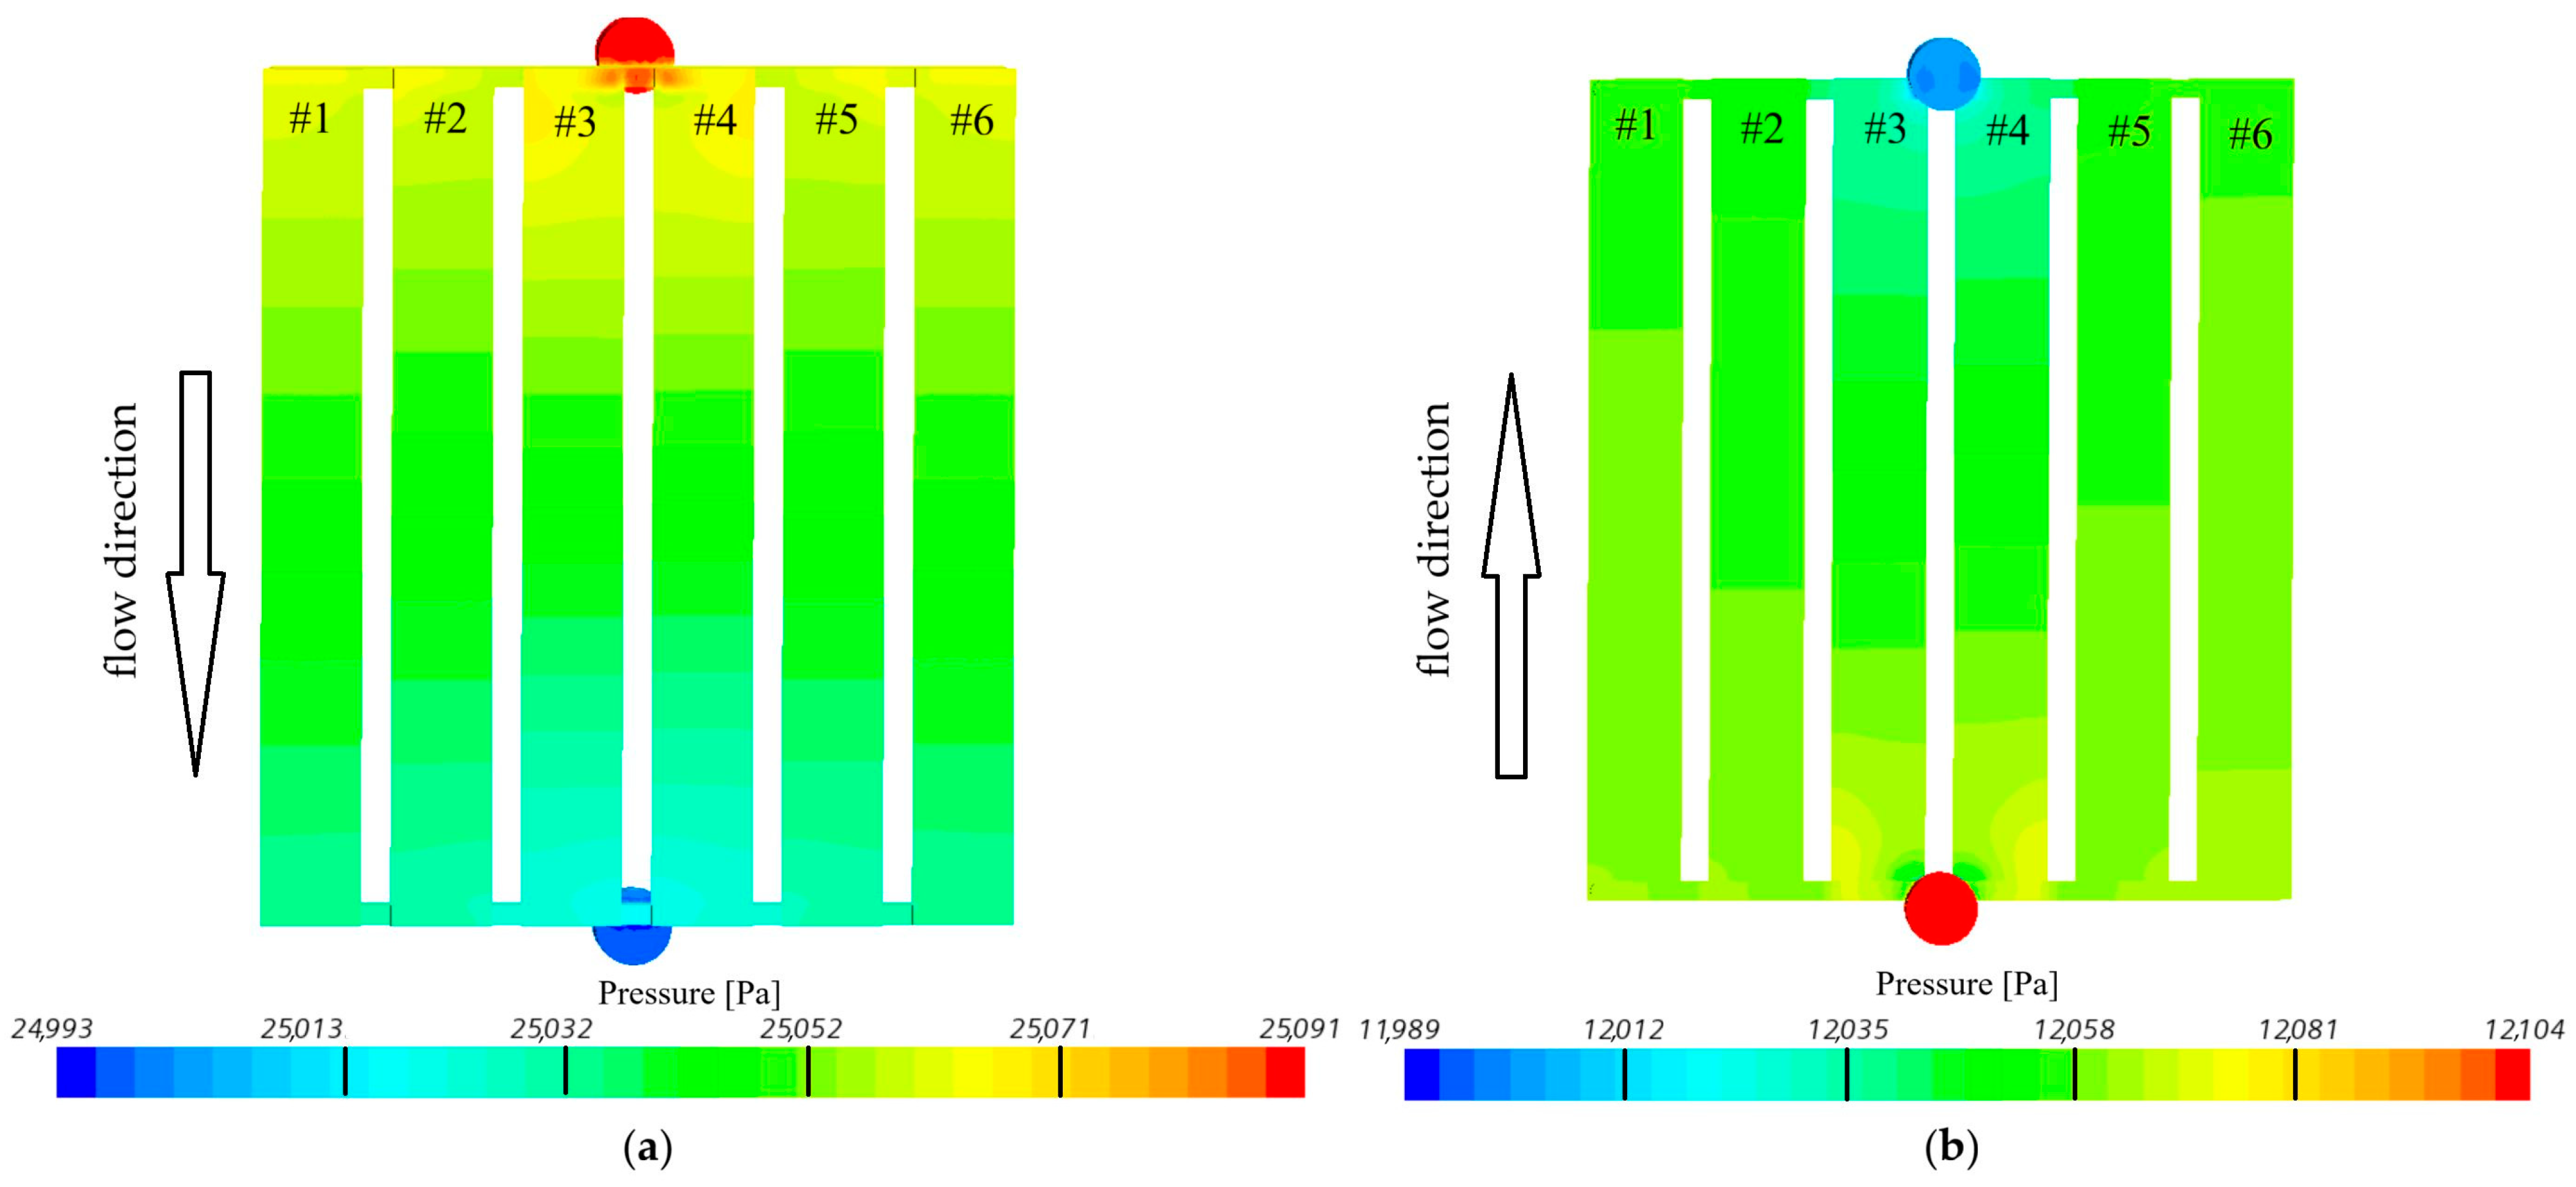
  • Two-dimensional calculation results illustrating pressure on the (a) hot wall, (b) cold wall generated by the STAR-CCM+ software—Figure 15.
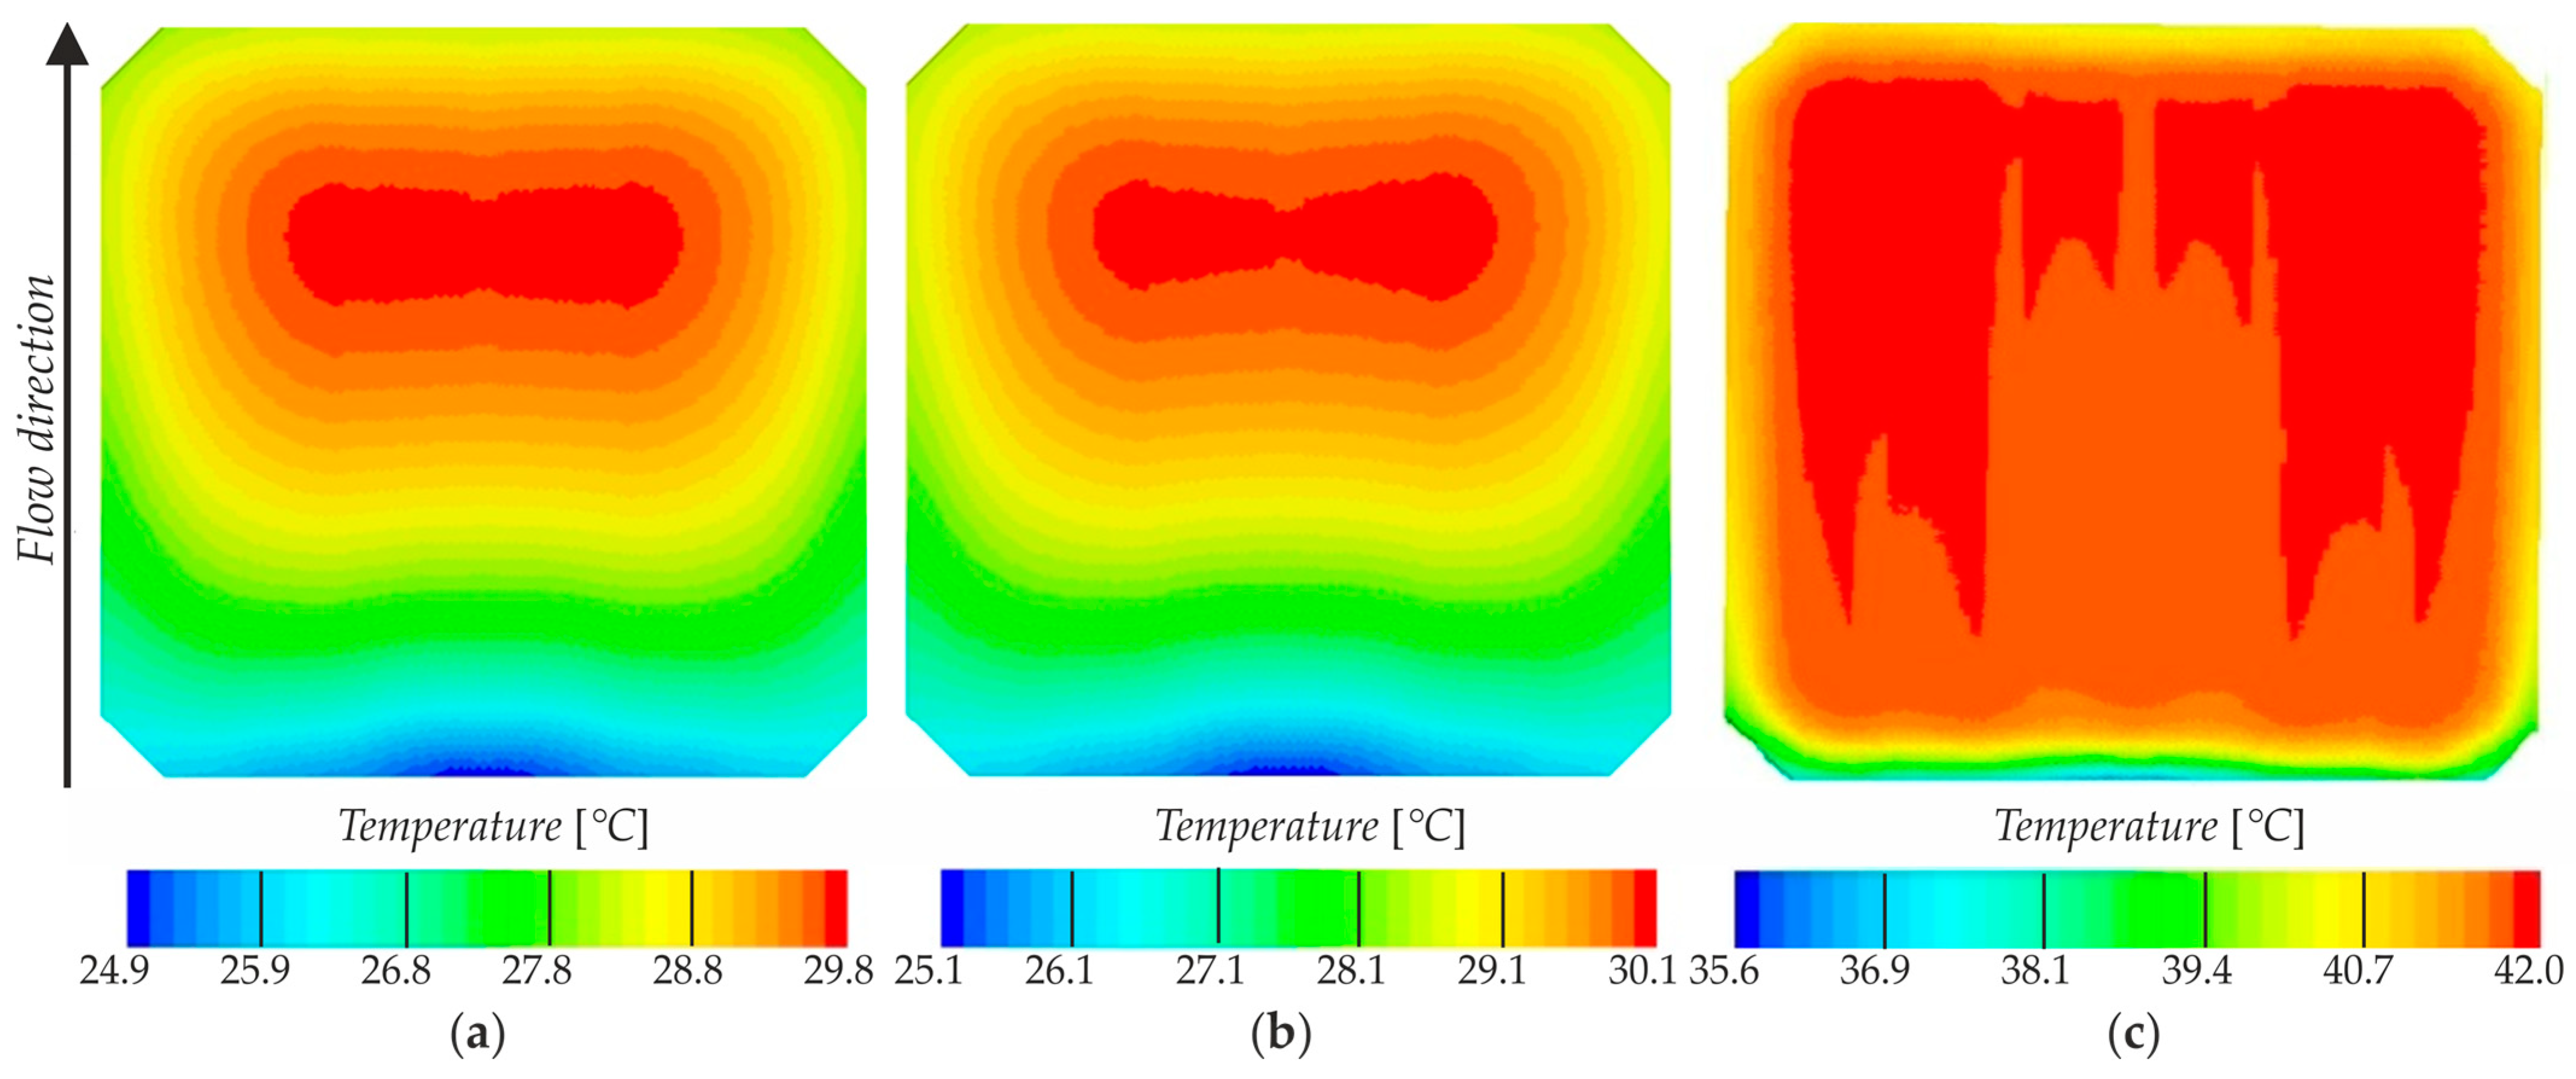
  • Two-dimensional temperature distribution generated by the STAR-CCM+ software depicting the external surface of the heated plate for three distinct heat flux densities: (a) q = 1000 W/m2, (b) q = 2000 W/m2, and (c) q = 8000 W/m2, as illustrated in Figure 16.
  • Dependencies for the HTC as a function of the distance from the MCH inlet, derived from the STAR-CCM+ program for: (a) α1—heated plate and FC-72, (b) α2—FC-72 and copper separating plate, (c) α3—copper separating plate and water, d) α4—water and copper closing plate for a heat flux density of 2000 W/m2Figure 17.
The 2D results of the computations using Simcenter STAR-CCM+ software are illustrated in Figure 14 and Figure 15.
The CFD simulations were performed for fixed mass flow rates and inlet pressures, as summarized in Table 5. The mass flow rate of water was uniformly distributed across the two outer, cold channels, #1 and #6 (Figure 14b). In the central mini-channels, #3 and #4, a pressure drop of Δp = 98 Pa was observed between the inlet and the outlet for both the hot and cold channel groups (Figure 15). The pressure values at the inlet to the hot and cold mini-channel groups are higher than those at their outlet. These values corresponded to the experimental conditions and ensured the accurate reproduction of both the flow distribution and the heat transfer characteristics.
Figure 16 presents the two-dimensional temperature distribution generated by STAR-CCM+ software, corresponding to the external surface of the heated plate at three different heat flux densities. The temperature readings showed that the inlet of the MCH had the coldest measurements, while the outlet recorded the warmest. At the lowest heat flux, q = 1000 W/m2 (Figure 16a), the temperature of the external surface of the heated plate ranged from 25 °C to 29.8 °C. At a higher heat flux density, q = 2000 W/m2 (Figure 16b), this temperature range extended from 25.1 °C to 30.1 °C. A notable increase in temperature was observed at the highest heat flux density, q = 8000 W/m2 (Figure 16c), with values ranging from 35.7 °C to 42.0 °C.
Figure 17 illustrates the local HTC versus the distance from the MCH inlet determined using STAR-CCM+ for α1—heated plate and FC-72 (a), α2—FC-72 and copper separating plate (b), α3—copper separating plate and water (c), α4—water and copper closing plate (d) for selected heat flux density—2000 W/m2 and six MCHs. The local values of the HTC, determined using STAR-CCM+, have a similar plot to those of the HTC obtained for the 1D approach. Local values of the HTC at the interface between the copper heated plate and the FC-72 fluid increased with the distance from the MCH. The HTCs at the interfaces between FC-72 and copper separating plate, the copper separating plate and distilled water, and distilled water and the closing plate, decreased in the inlet section of the MCH.

5.3. Comparison of the 1D Approach and STAR-CCM+ Simulations

The values of the HTC calculated from the 1D approach and determined in STAR-CCM+ simulations were compared for the representative 2000 W/m2 case. All remaining cases were cross-validated using global heat-transfer metrics, and the relative differences in HTC between the 1D approach and STAR CCM+ simulations remain small across the full spectrum of heat-flux values.
The findings, presented in Figure 18, Figure 19, Figure 20, Figure 21 and Figure 22, include:
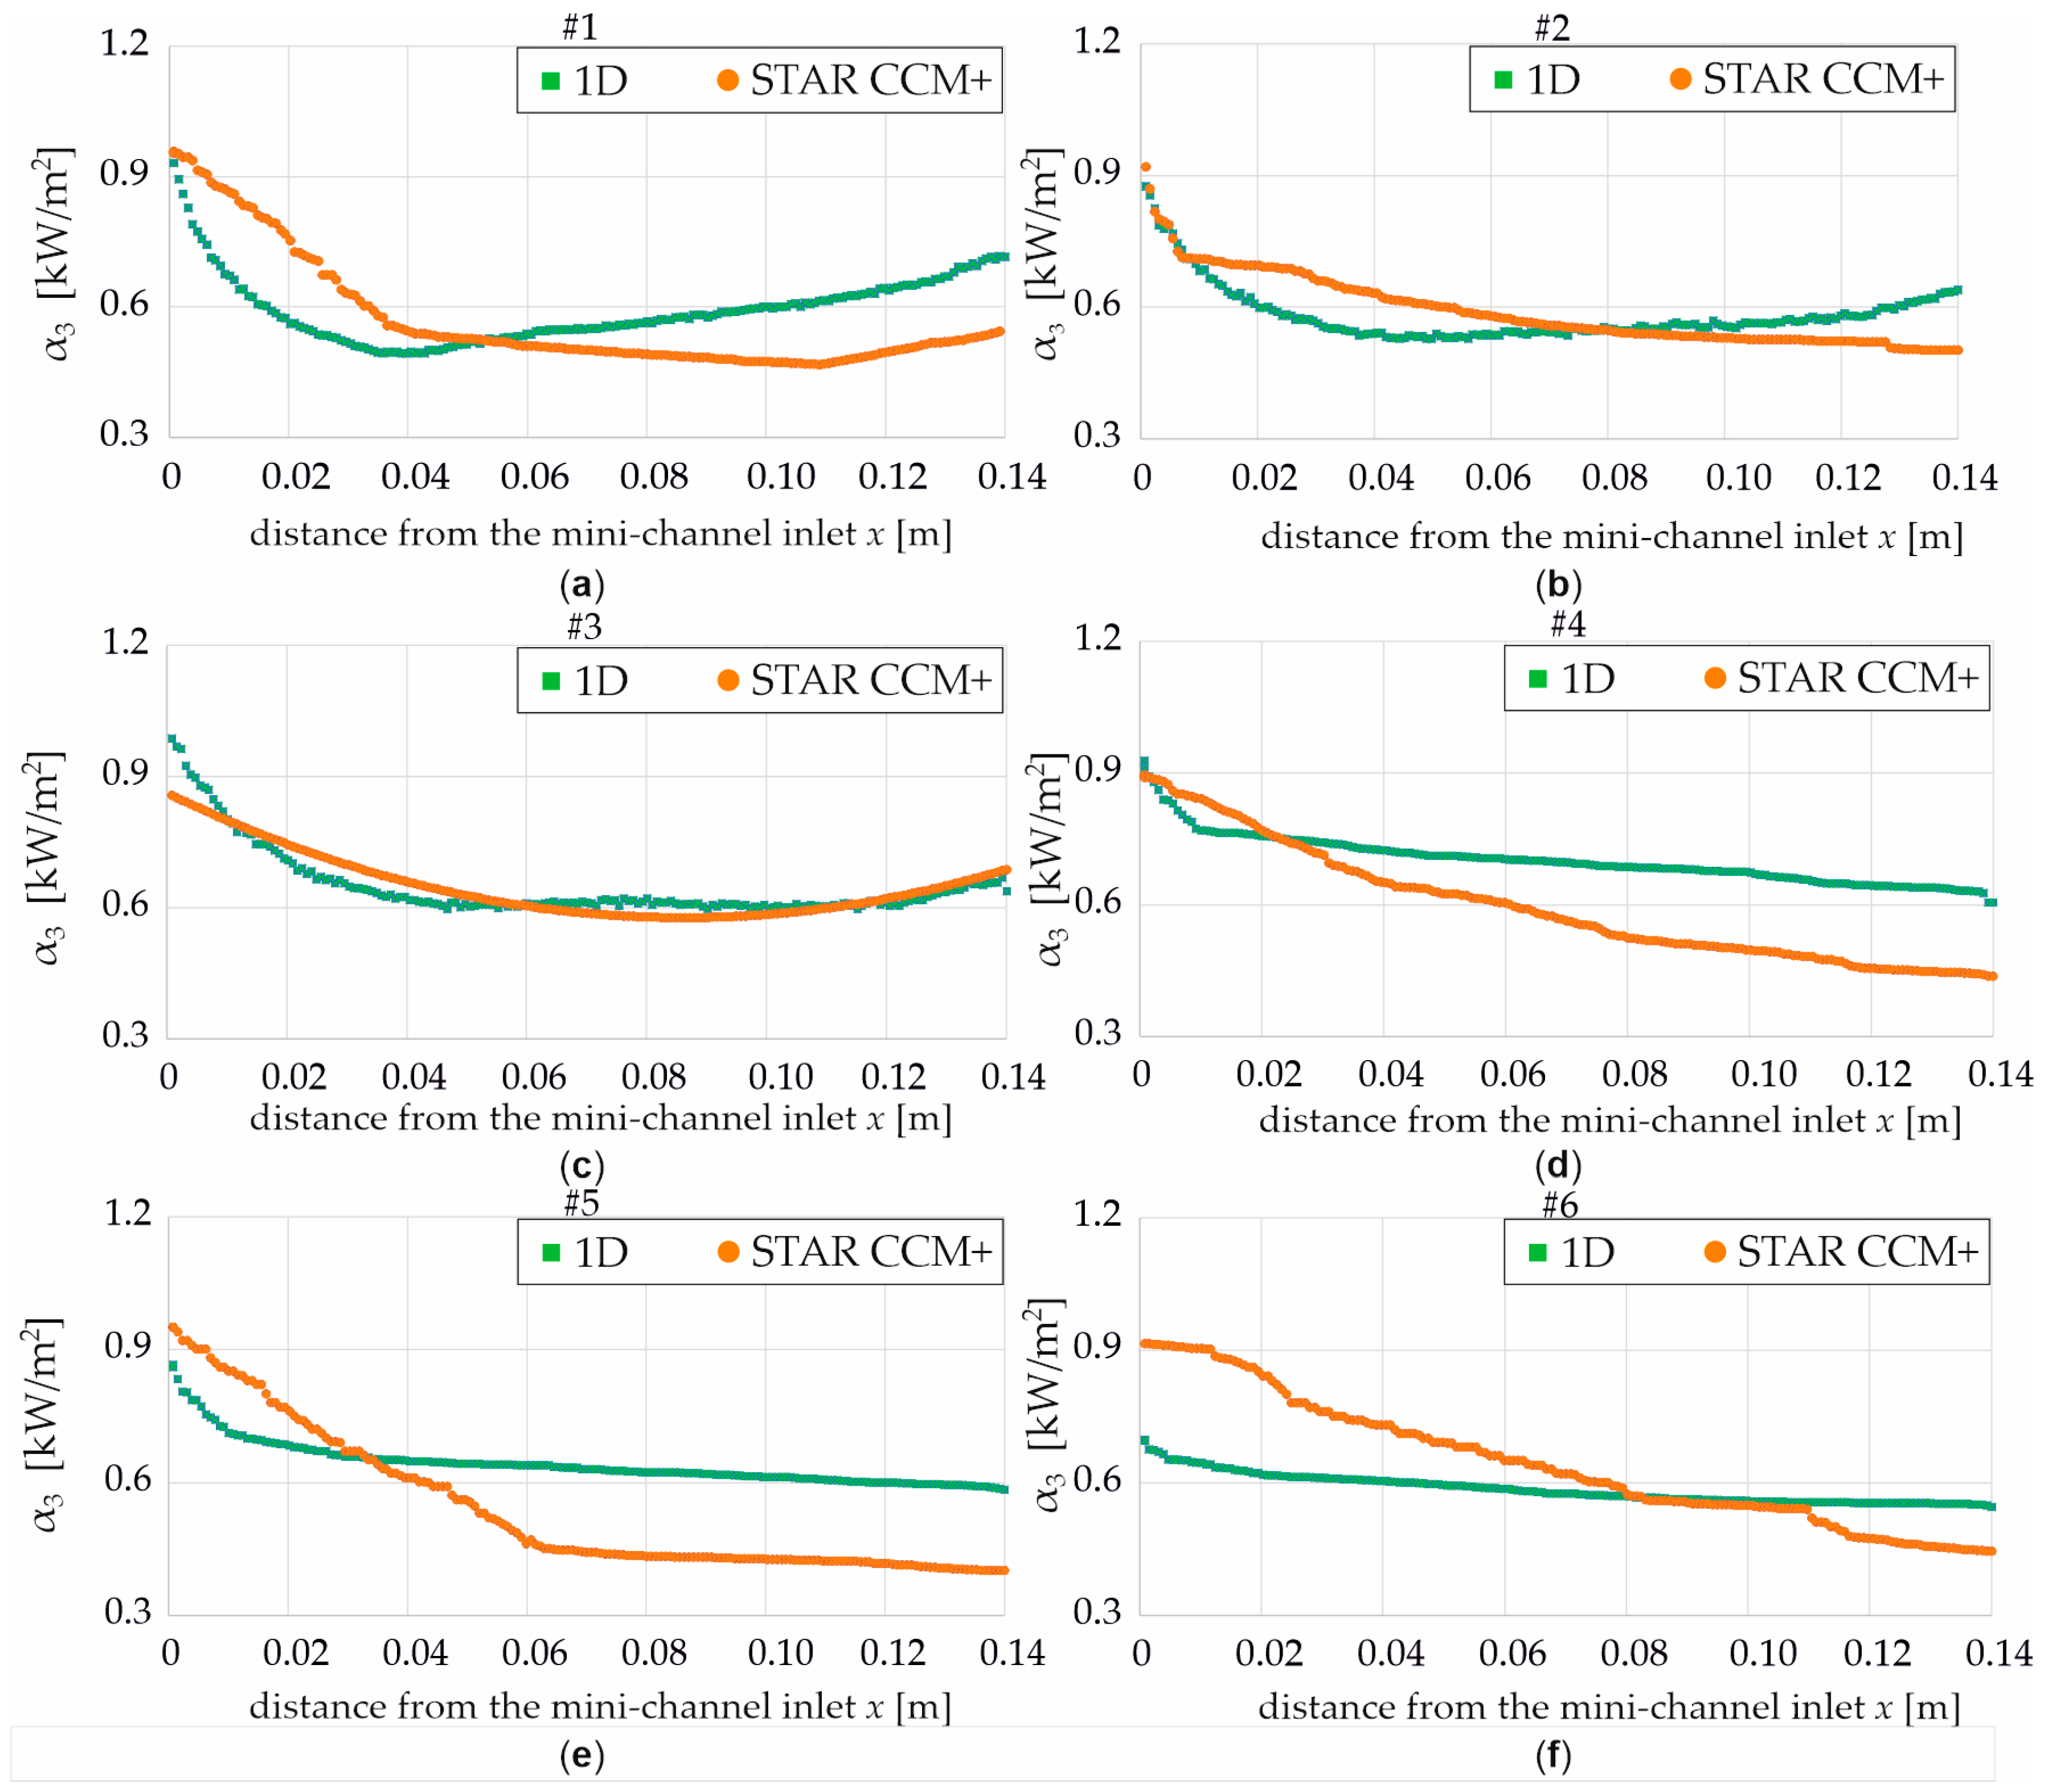
  • Relationships for the HTC as a function of the distance from the MCH inlet, derived from the STAR-CCM+ program and 1D approach, for a heat flux density of 2000 W/m2 and α3—copper separating plate/water—Figure 18.
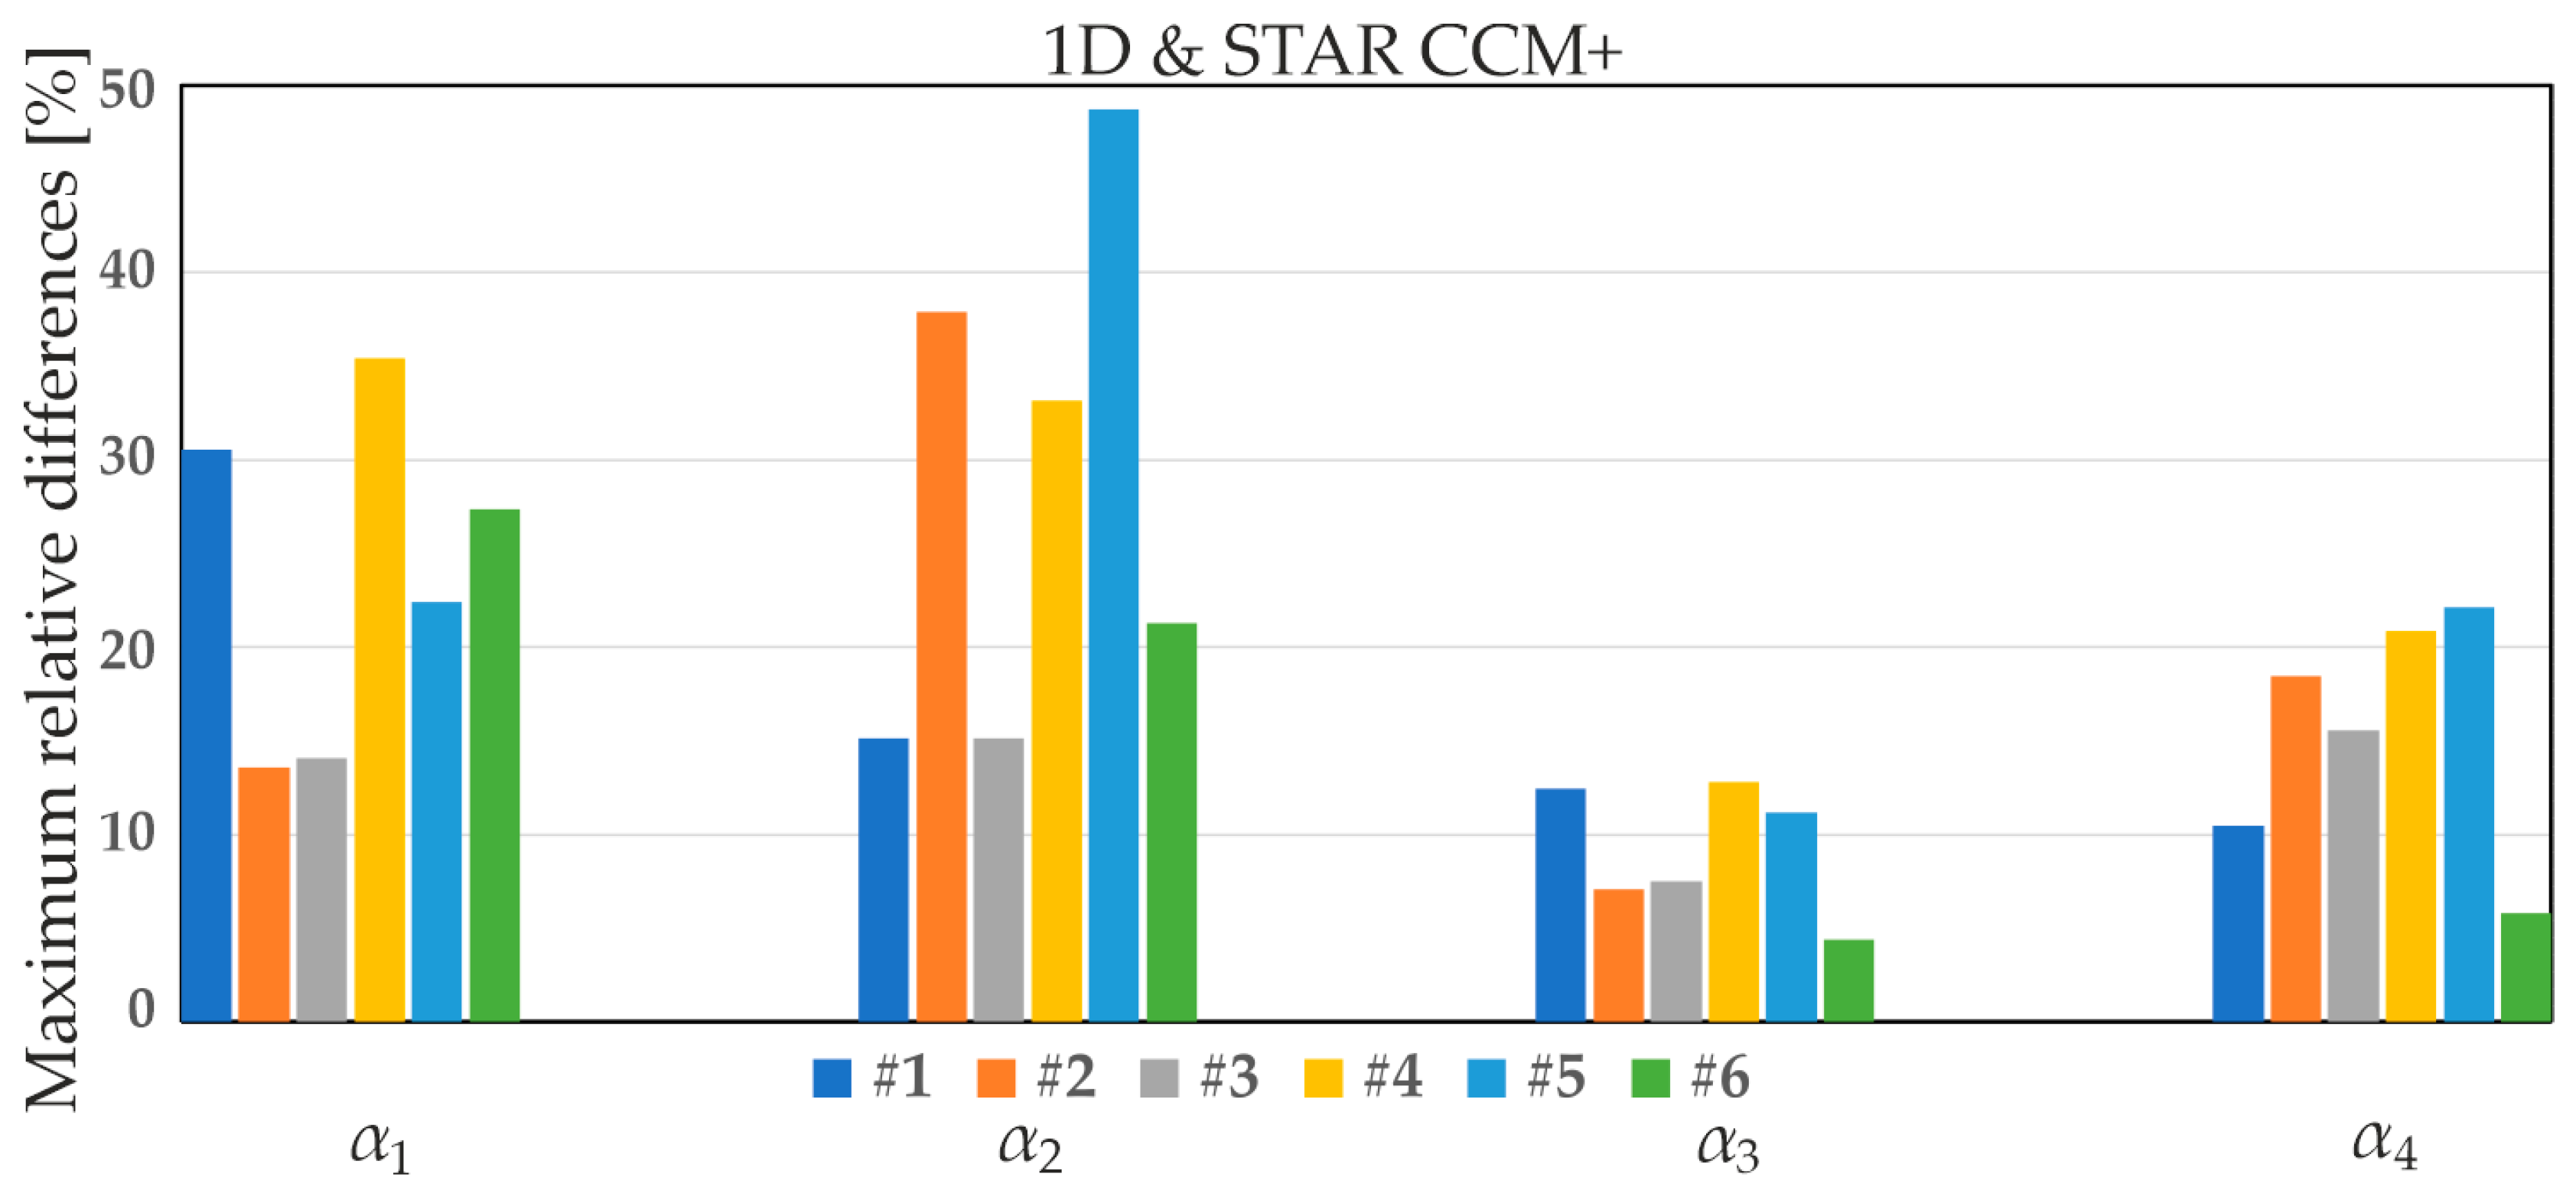
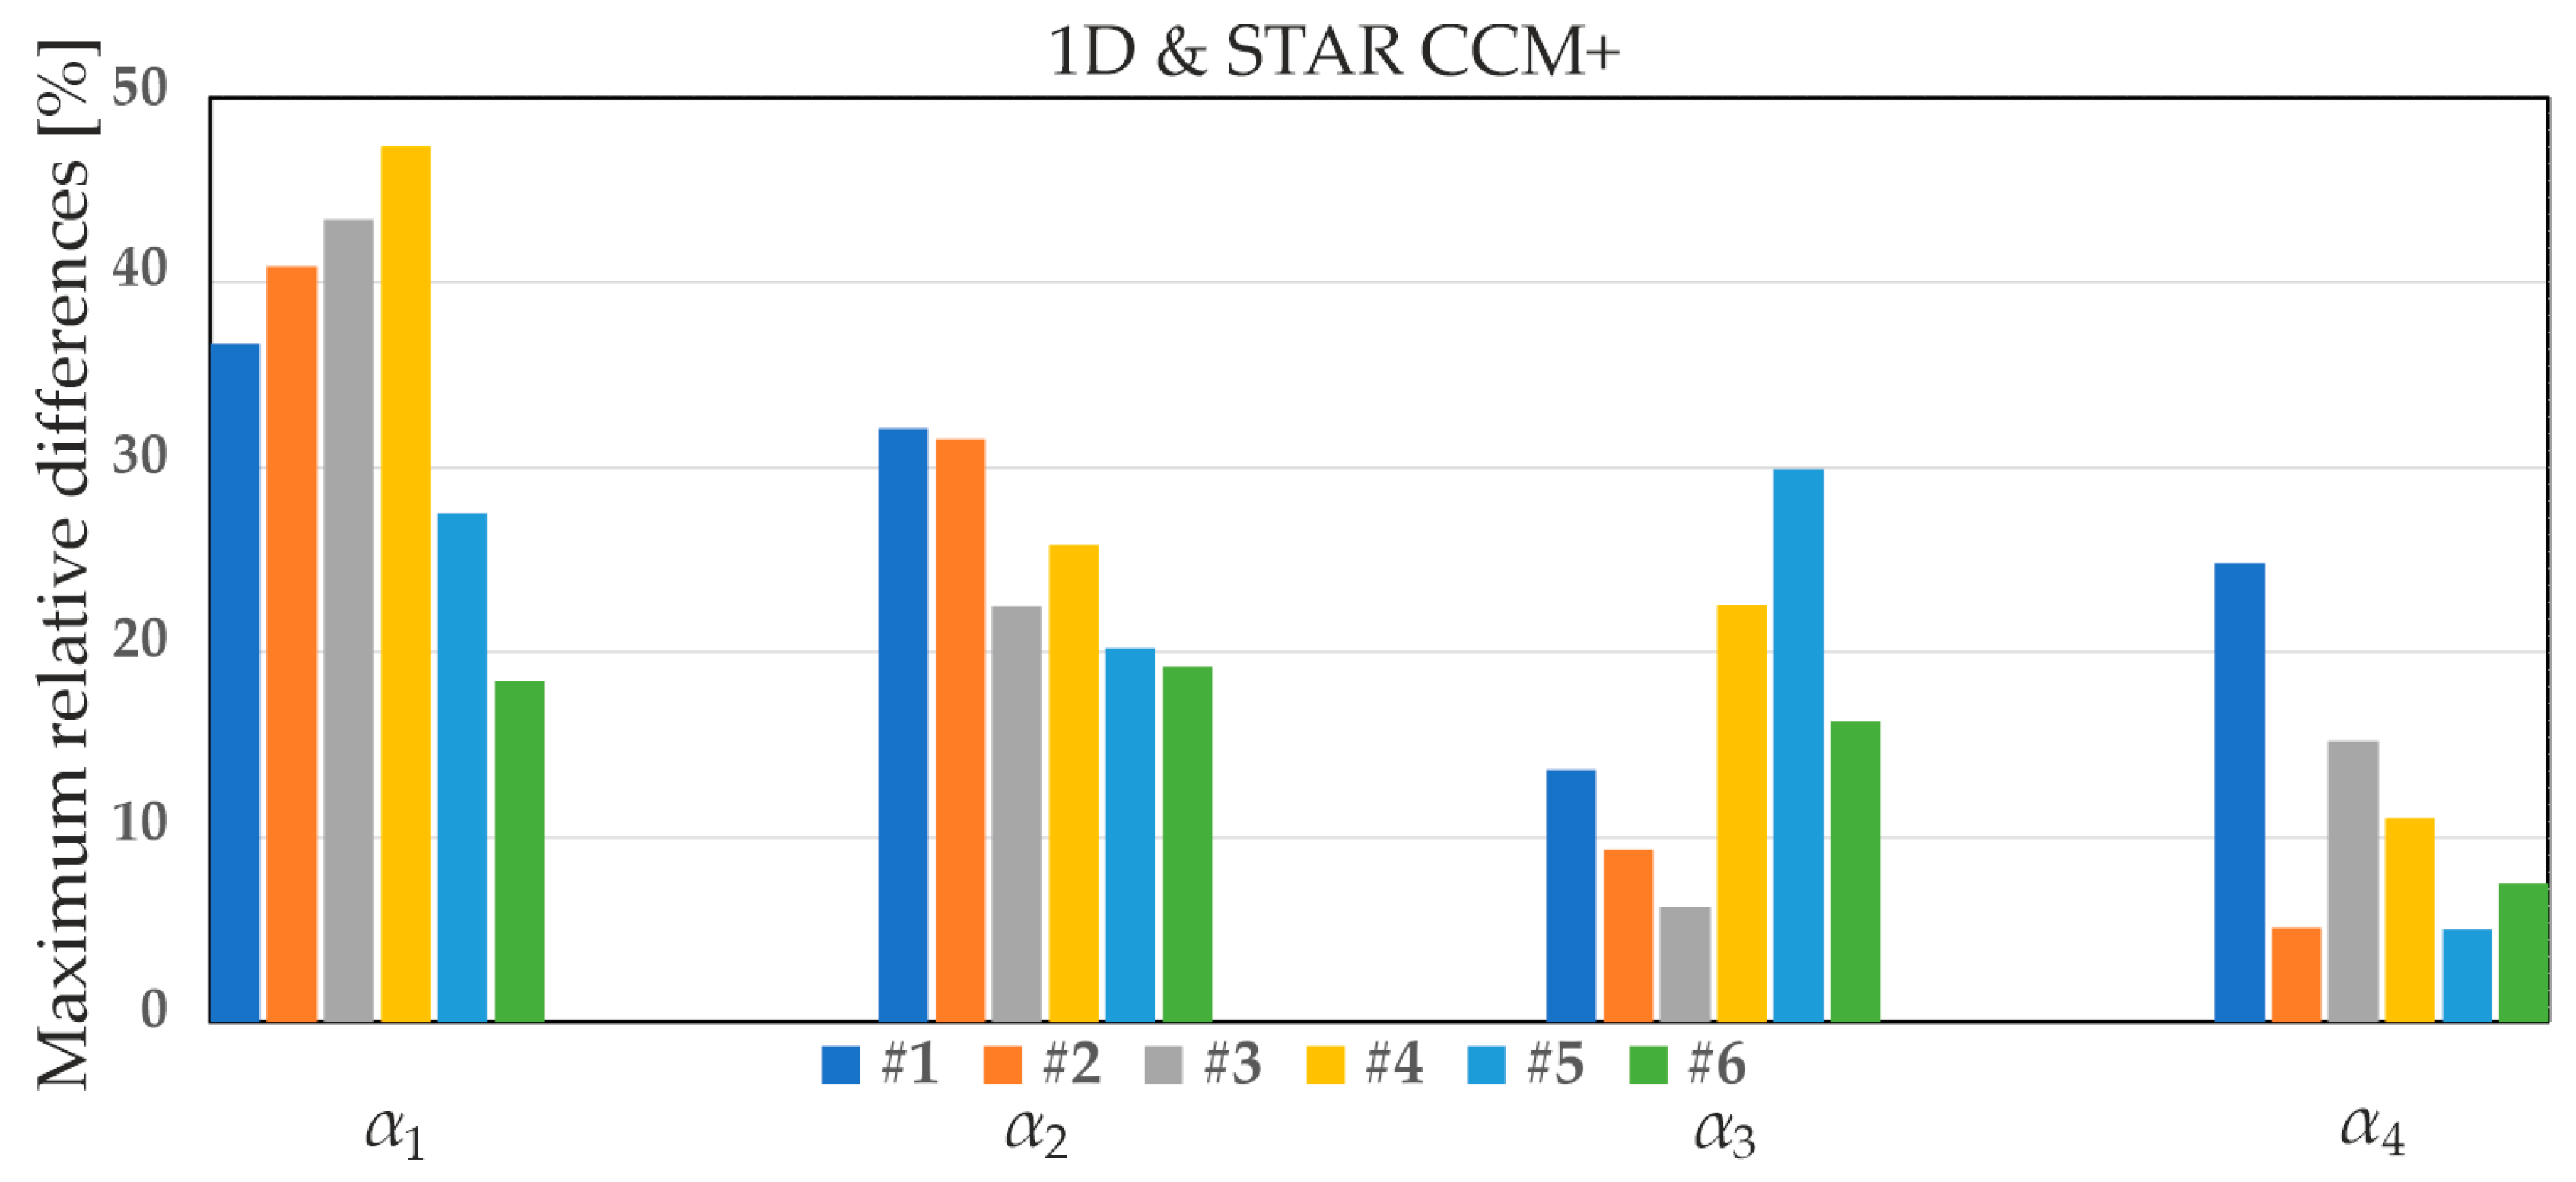
  • Maximum relative differences between the values of the HTC α1, calculated from Equation (2), and α2, α3, α4, derived from Equations (4), (5), and (7), respectively, including a comparison with HTCs obtained from the STAR CCM+ software for all MCHs (from #1 to #6) at heat flux densities of 1000 W/m2 (Figure 19), 2000 W/m2 (Figure 20), and 8000 W/m2 (Figure 21).
  • Maximum relative differences between the values of the HTC α1, calculated from Equation (2), and α2, α3, α4, derived from Equations (4), (5), and (7), respectively, are presented, along with a comparison of HTCs obtained from the STAR-CCM+ software for average values of all MCHs at heat flux densities of 1000, 2000, and 8000 W/m2 (Figure 22).
Figure 18 illustrates the dependencies for the HTC as a function of the distance from the MCH inlet, based on data obtained from the STAR-CCM+ program and the 1D computational approach for α3—copper separating plate/water, subjected to a heat flux density of 2000 W/m2 across six MCHs (labeled from #1 to #6). The local HTC increased with the distance from the MCH inlet, except at the inlet segment. It was observed that the highest consistency of results occurred for MCH #3 (central MCH). Conversely, the highest discrepancies were noted for the side MCH.
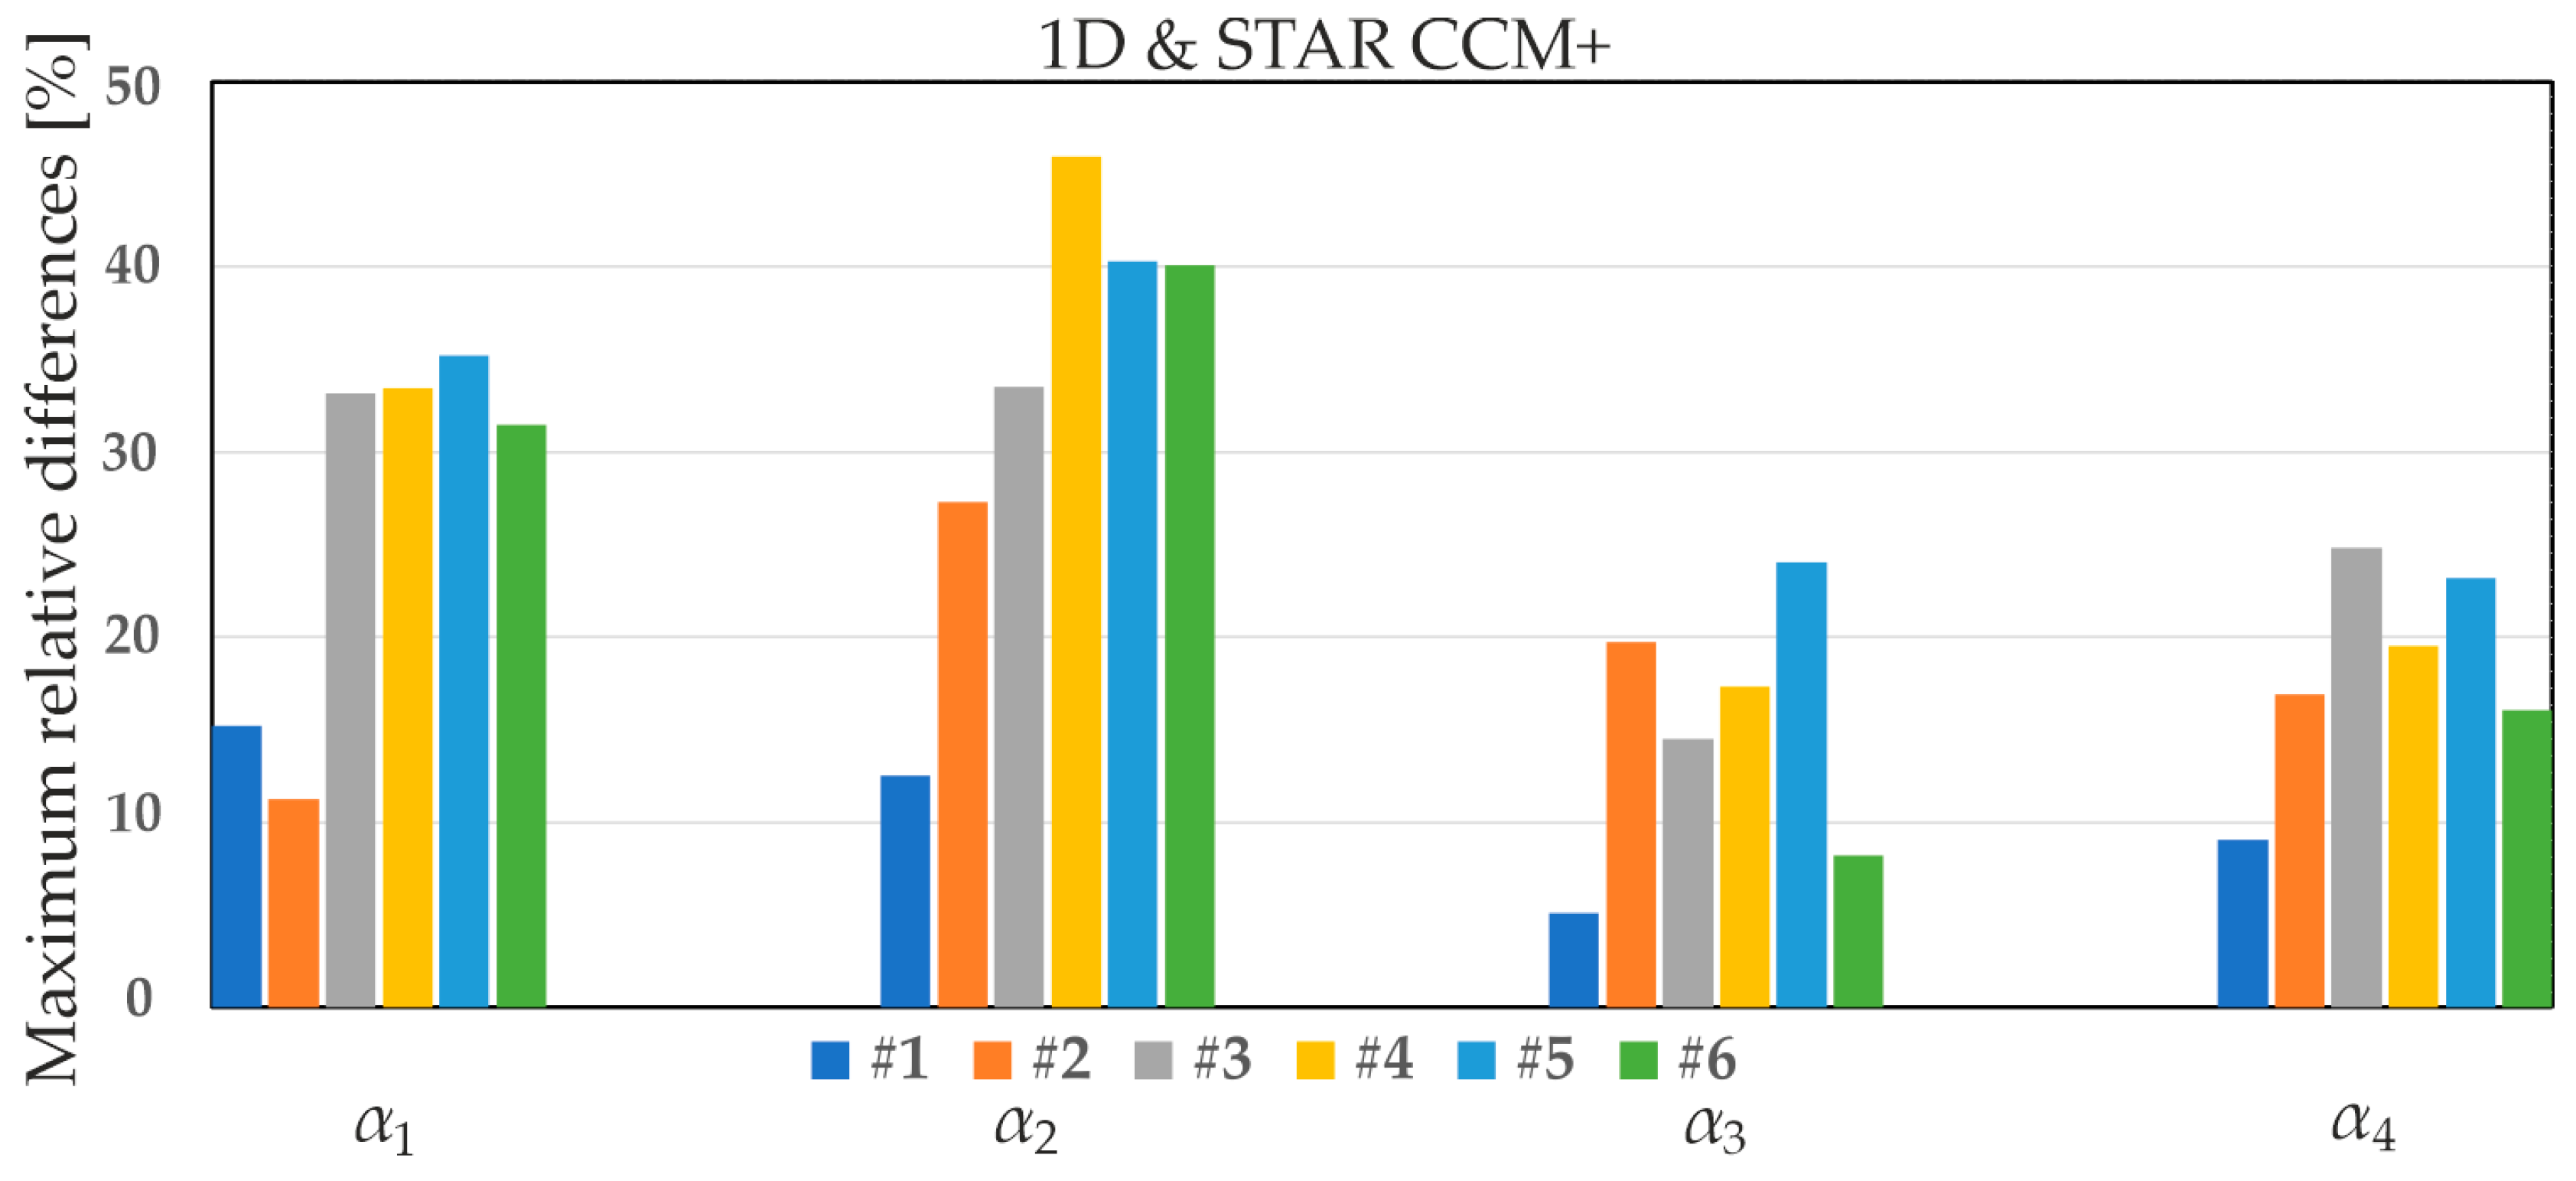
Figure 19, Figure 20 and Figure 21 show the maximum relative differences between the HTC α1, calculated from Equation (2), and α2, α3, α4, derived from Equations (4), (5) and (7), respectively, in addition to a comparison of HTCs from STAR-CCM+ for three heat flux densities: 1000 W/m2 (Figure 19), 2000 W/m2 (Figure 20), and 8000 W/m2 (Figure 21).
Analysis of the results in Figure 19 for a heat flux density of 1000 W/m2 revealed the highest values, reaching 48.7% for MCH #5 and 37.9% for MCH #2, corresponding to α2 and α1, respectively, and 35.4% for MCH #4 (α1). The smallest relative differences were observed across all MCHs for α3, particularly in MCH #6, where the value was 4.4%. As the heat flux density increased (see Figure 20, heat flux density of 2000 W/m2), an increase in the relative differences was observed. The maximum values of the relative differences were achieved for α1 in central MCHs #4 (47.4%) and #3 (43.4%). In contrast, the lowest values were observed for α4 in MCHs #2 (5.1%) and #5 (5.0%) (Figure 20). The pattern of decreasing maximum relative differences with increasing heat flux supplied to the heated plate was observed in Figure 21 for a heat flux density of 8000 W/m2. The smallest relative differences were shown for α3 and MCH #1 (5.1%), while the highest reached up to 45.9% for α2 in MCH #4.
In the previous paper [28], the analysis of the HTC within the contact area between the heated plate and the fluid FC-72 (α1), as well as the HTC at the interface between FC-72 and the copper plate (α2), was conducted utilizing both one-dimensional (1D) and two-dimensional (2D) approaches. It was observed that the maximum relative differences between the HTC values derived from the 1D and 2D methodologies diminished as the heat flux density increased.
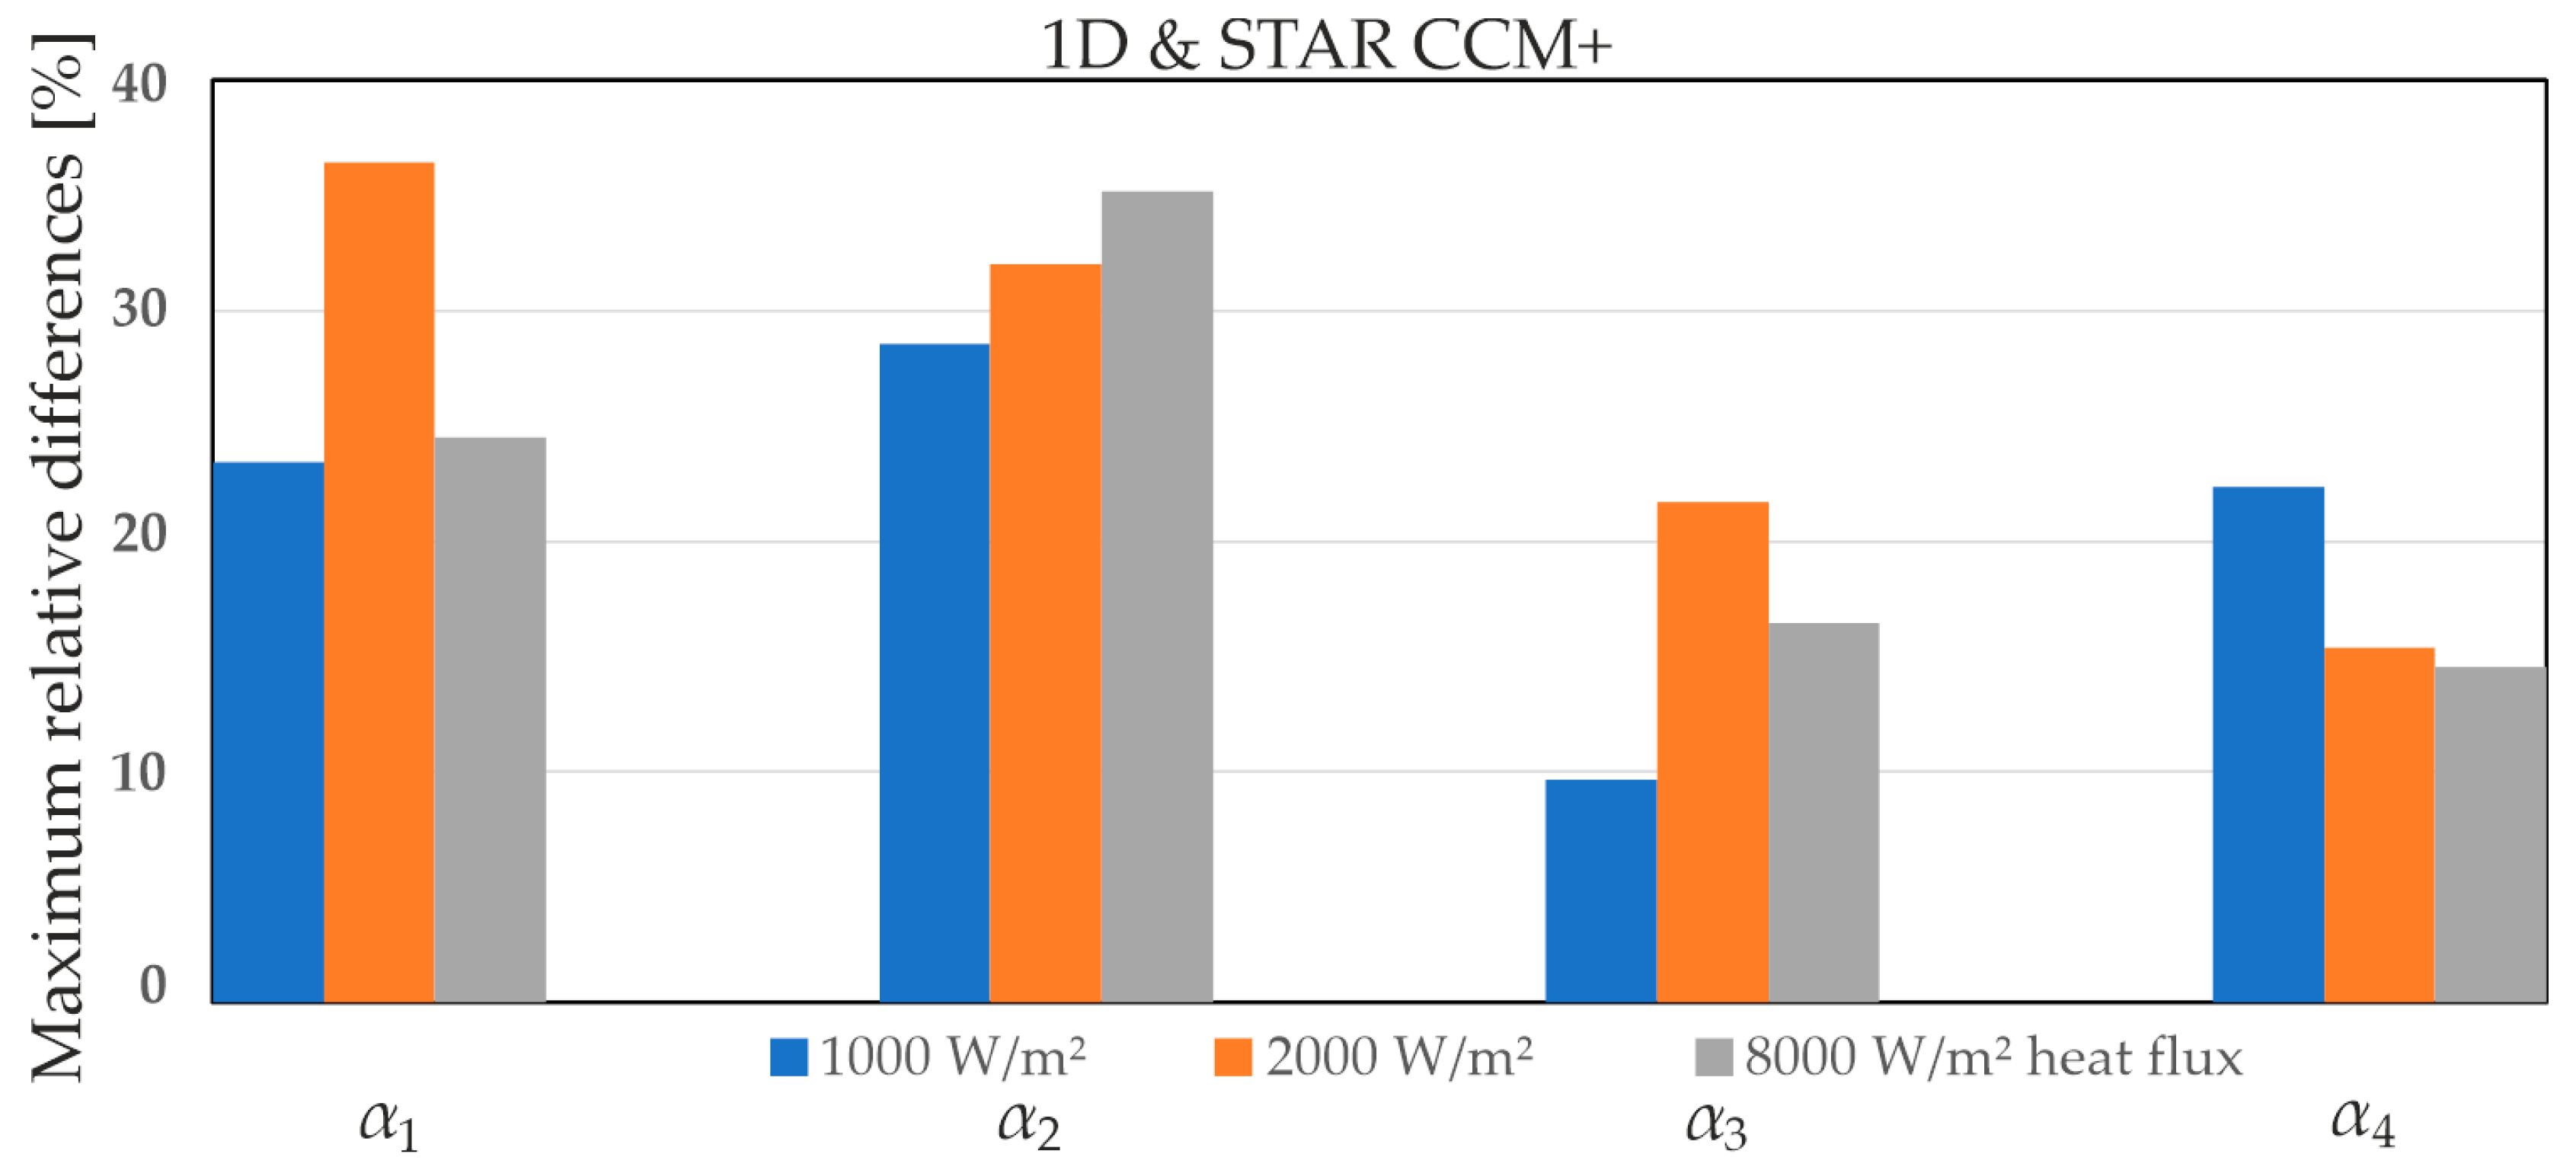
Figure 22 presents the maximum relative differences between the values of HTCs α1 to α4 and the comparison of HTCs obtained from the STAR CCM+ software for the calculated average values of all MCHs at three heat flux densities: 1000, 2000, and 8000 W/m2. The results showed the highest maximum relative differences for the HTC α2, and the lowest for α3 at all tested heat flux densities.
Notably, the highest maximum relative difference was recorded for α1 at the middle heat flux density of 2000 W/m2 (35.7%), whereas the lowest was observed for α3 at the lowest heat flux density of 1000 W/m2 (9.2%). Additionally, the highest maximum relative differences for the average value of all MCHs and three heat flux densities were recorded for α2 (29%), with the smallest observed for α3 (13.5%).

6. Conclusions

This work presents an experimental analysis of heat transfer during the countercurrent flow of FC-72 and distilled water within a multi-mini-channel module, supplemented by a comparison with CFD simulations. The experimental investigation was conducted in a test section oriented at 165°, utilizing an average mass flow rate of 0.008 kg/s and three heat flux densities (1000, 2000, and 8000 W/m2). An infrared camera recorded the temperature of the external surface of the heated MCH wall.
The results are presented as infrared thermographs, temperature distributions, and HTCs along the MCH length. In the hot mini-channel, heat transfer occurred via single-phase convection, with liquid heating concentrated near the MCH outlet. The HTCs were successfully determined for all four contact surfaces. The temperature on the copper heated plate surface increased with the heat flux density, reaching its highest value at the MCH outlet, as illustrated by the thermogram.
The overall conclusions are as follows:
  • The temperature of the copper heated plate, FC-72 fluid, copper separating plate, and distilled water generally increased with both distance from the MCH inlet and heat flux density across the six MCHs, except for the copper heated plate outlet.
  • In the cold mini-channel, only single-phase convection occurred across the entire MCH length, resulting in low temperature differences between the plates and the distilled water.
  • The local HTCs at the interface between the copper heated plate and the FC-72 fluid increased with the distance from the MCH, except at the MCH inlet.
  • Conversely, the HTCs at the copper separating plate/distilled water and distilled water/closing plate interfaces decreased in the inlet section (approximately the first one-third of the length) before showing a slight increase near the MCH outlet.
  • Numerical CFD calculations were performed using Simcenter STAR-CCM+ to determine temperatures and HTCs for individual layers, analogously to the 1D analytical approach for selected experimental data.
  • The two-dimensional temperature distribution generated by STAR-CCM+ for the heated copper plate demonstrated a similar external temperature distribution across all heat flux densities compared to the experimental infrared camera data.
  • A pairwise comparison of the HTCs for the central heat flux density (q = 2000 W/m2) showed the most accurate agreement between the 1D analytical approach and CFD for MCH #3, while MCH #5 exhibited the least accurate agreement.
  • The maximum relative differences between the 1D analytical approach and STAR-CCM+ were dependent on the MCH, the location, and the heat flux density. The highest average maximum relative differences across all heat flux densities were observed for α2 (29%), and the smallest were observed for α3 (13.5%).
  • The employed numerical method demonstrated reliability and accuracy in validating simplified analytical models. The comparison between the CFD-based three-dimensional model and the one-dimensional analytical method affirmed the correctness and consistency of the 1D approach, thus corroborating its suitability for preliminary thermal design and analysis.
  • At the maximum heat flux density (8000 W/m2), the first group of MCHs showed a significant temperature increase, indicating greater localized thermal heat exchange. The second section of the heat exchanger, however, maintained temperatures comparable to those observed at lower flux densities, suggesting the system can sustain relatively uniform thermal conditions in that region.
The findings at the highest heat flux density demonstrate the viability of further experimental investigations using a parabolic mirror concentrator to examine thermal performance under concentrated solar irradiation. This setup would allow for surface temperatures exceeding 150–200 °C and permit the systematic examination of thermal efficiency, losses, and material durability under realistic solar load scenarios.
Future studies will focus on developing a new correlation for the HTCs at the interface between the hot mini-channel (HMCH) and the separating plate, as this region exhibited the highest maximum relative differences in HTC values.

Author Contributions

Conceptualization, K.S. and D.S.; Data curation, K.S. and D.S.; Formal analysis, K.S. and D.S.; Funding acquisition, K.S. and D.S.; Investigation, D.S.; Methodology, D.S.; Project administration, K.S.; Software, D.S.; Supervision, K.S.; Validation, K.S. and D.S.; Visualization, K.S. and D.S.; Writing—original draft, K.S. and D.S.; Writing—review & editing, K.S. and D.S. All authors have read and agreed to the published version of the manuscript.

Funding

This research received no external funding.

Data Availability Statement

The original contributions presented in this study are included in the article. Further inquiries can be directed to the corresponding author.

Acknowledgments

The calculations were made using the Simcenter STAR-CCM+ software developed by Siemens PLM Software Inc., provided by GMSystem which is a supplier of Siemens Digital Industries Software in Poland.

Conflicts of Interest

The authors declare no conflicts of interest.

Nomenclature

Symbols
Asurface area, m2
dhhydraulic diameter, m
Ethe radiation intensity for copper heated plate, W/m2
Gmass flux, kg/(m2 s)
kowerall heat transfer coefficient, W/(m2 K)
Llength of the mini-channel, m
ppressure, Pa
ReReynolds number
Qmmass flow rate, kg/s
qheat flux density, W/m2
Ttemperature, K
xcoordinate in the direction of flow, m
Greek letters
αheat transfer coefficient, W/(m2 K)
Δdifference,
δthickness, depth, m
λthermal conductivity, W/(m K)
µdynamic viscosity, Pa∙s
ρdensity, kg/m3
σsurface tension, N/m
Abbreviations
1Done-dimensional approach
CFDComputational Fluid Dynamics
CMCHcold mini-channel
HMCHhot mini-channel
HTCheat transfer coefficient
MCHmini-channel
MMCHmulti-mini-channel
Subscripts
Cucopper plate
ffluid
FCFC-72 fluid
Hheated plate
llinear
IRTinfrared thermography
wdistilled water
ininlet
outoutlet

References

  1. Kandlikar, S.G.; Grande, W.J. Evolution of Microchannel Flow Passages—Thermohydraulic Performance and Fabrication Technology. Heat Transf. Eng. 2003, 24, 3–17. [Google Scholar] [CrossRef]
  2. Klemes, J.J.; Arsenyeva, O.; Kapustenko, P.; Tovazhnyanskyy, L. Compact Heat Exchangers for Energy Transfer Intensification Low Grade Heat and Fouling Mitigation; CRC Press: Boca Raton, FL, USA, 2015; ISBN 9781138748330. [Google Scholar]
  3. Shang, H.; Yan, Z.; Xia, G. Analysis of Influence of Inlet Vapor Quality on Heat Transfer and Flow Pattern in Mini-Channels during Flow Condensation Process. Appl. Therm. Eng. 2024, 236, 121864. [Google Scholar] [CrossRef]
  4. Li, T.; Luo, X.; Li, G. Instability Analysis of Pressure Drop and Flow Characteristics in Mini-Channel Heat Sink with Phase-Separated Configuration. Appl. Therm. Eng. 2024, 253, 123755. [Google Scholar] [CrossRef]
  5. Bao, Y.; Chen, J.; Shao, S. Comparison on Thermal and Hydraulic Performances of Transverse Mini-Channel Based on a Novel Comprehensive Evaluation Factor. Appl. Therm. Eng. 2024, 253, 123795. [Google Scholar] [CrossRef]
  6. Ma, X.; Hu, C.; Ji, X.; Yang, X.; Xu, N.; Zhang, Y.; Wei, J.; Feng, Y.; Sundén, B. Flow Boiling Frictional Pressure Drop inside Micro/Mini-Channels: A New General Model and Experimental Investigation. Appl. Therm. Eng. 2024, 247, 123111. [Google Scholar] [CrossRef]
  7. Zhang, J.; Luo, X.; Feng, Z. Effect of Pin Electrodes on Flow Boiling Heat Transfer and Bubble Dynamic Behaviors in Vertical Minichannels. Int. J. Therm. Sci. 2024, 200, 108964. [Google Scholar] [CrossRef]
  8. Zhang, J.; Luo, X.; Feng, Z. Compound Effect of EHD and Nanofluid on Flow Boiling Characteristics in Minichannels. Powder Technol. 2024, 442, 119895. [Google Scholar] [CrossRef]
  9. Yin, L.; Wang, Y.; Jia, L. Flow Boiling Instability of R134a in the Large-Area Heat Sink with Interconnected Parallel Multi-Minichannels. Int. J. Therm. Sci. 2024, 204, 109193. [Google Scholar] [CrossRef]
  10. Ye, H.; Lum, L.Y.X.; Kandasamy, R.; Zhao, H.; Ho, J.Y. Flow Boiling Heat Transfer Enhancement of R134a in Additively Manufactured Minichannels with Microengineered Surfaces. Appl. Therm. Eng. 2024, 256, 124150. [Google Scholar] [CrossRef]
  11. Luo, K.; Chang, W.; Foysal, F.; Santi, E.; Li, C. Hybrid-Featured Porous Pin-Fin Arrays to Enhance Flow Boiling in a Large Minichannel Heatsink. Int. J. Heat Mass Transf. 2025, 248, 127213. [Google Scholar] [CrossRef]
  12. Yang, R.; Fan, C.; Li, B.; Zhang, C.; Chen, Y. Role of Hypergravity in Minichannel Flow Boiling. Int. J. Heat Mass Transf. 2025, 237, 126429. [Google Scholar] [CrossRef]
  13. Shang, H.; Xia, G.; Li, R.; Miao, S. Experimental Study on Flow Boiling Heat Transfer of HFE-7100 in Minichannel Heat Sinks for Professional-Grade Server Chips Cooling. Int. Commun. Heat Mass Transf. 2025, 164, 108825. [Google Scholar] [CrossRef]
  14. Lan, Y.; Feng, Z.; Hu, Z.; Zheng, S.; Zhou, J.; Zhang, Y.; Huang, Z.; Zhang, J.; Lu, W. Experimental Investigation on the Effects of Swirling Flow on Flow Boiling Heat Transfer and Instability in a Minichannel Heat Sink. Appl. Therm. Eng. 2023, 219, 119512. [Google Scholar] [CrossRef]
  15. Wang, L.; Zhang, J.; Huang, S. Vapor Separation in Minichannel Heat Sink Flow Boiling Application Using Gradient Porous Copper Ribs. Appl. Therm. Eng. 2025, 259, 124930. [Google Scholar] [CrossRef]
  16. Kokate, R.; Park, C.; Mitsingas, C.; Schroen, E. Flow Boiling in Parallel Microchannels in a Pumped Two-Phase Loop: Flow Visualization and Thermal Characteristics. Int. Commun. Heat Mass Transf. 2024, 155, 107566. [Google Scholar] [CrossRef]
  17. Zhang, Z.; Jia, L.; Dang, C.; Ding, Y. Experimental Study on Flow Boiling Characteristics of R134a inside High-Heat-Flux Microchannels. Int. J. Heat Fluid Flow 2024, 107, 109372. [Google Scholar] [CrossRef]
  18. Rohini, A.K.; Choi, W.W.; Kim, S.M. Subcooled Flow Boiling in Multiple Parallel Rectangular Micro-Channel Heat Sink: Development of Heat Transfer Correlation. Appl. Therm. Eng. 2024, 250, 123444. [Google Scholar] [CrossRef]
  19. Mutumba, A.; Coletti, F.; Reip, A.; Mahmoud, M.M.; Karayiannis, T.G. Experiments and Correlations for Single-Phase Convective Heat Transfer in Brazed Plate Heat Exchangers. Heat Transf. Eng. 2023, 44, 211–231. [Google Scholar] [CrossRef]
  20. Yaghoubi, M.S.; Ahmadpour, A.; Saffar-Avval, M. Geometrical Design of Minichannels with Rectangular Wall Cavities for Flow Boiling Heat Transfer Enhancement. Results Eng. 2025, 25, 103989. [Google Scholar] [CrossRef]
  21. Igaadi, A.; El Amraoui, R.; El Mghari, H. CFD Investigation on Heat Transfer Improvement of Subcooled Flow Boiling in a Vertical Upflow Minichannel with Straight and Enhanced Geometrical Structure. e-Prime-Adv. Electr. Eng. Electron. Energy 2023, 5, 100231. [Google Scholar] [CrossRef]
  22. Igaadi, A.; El Amraoui, R.; El Mghari, H. Thermo-Hydrodynamic Investigation into the Effects of Minichannel Configuration on the Thermal Performance of Subcooled Flow Boiling. Nucl. Eng. Technol. 2023, 56, 265–274. [Google Scholar] [CrossRef]
  23. Li, Q.; Avramova, M.; Jiao, Y.; Chen, P.; Yu, J.; Pu, Z.; Chen, J. CFD Prediction of Critical Heat Flux in Vertical Heated Tubes with Uniform and Non-Uniform Heat Flux. Nucl. Eng. Des. 2018, 326, 403–412. [Google Scholar] [CrossRef]
  24. Piasecka, M.; Hożejowska, S.; Maciejewska, B.; Pawińska, A. Time-Dependent Heat Transfer Calculations with Trefftz and Picard Methods for Flow Boiling in a Mini-Channel Heat Sink. Energies 2021, 14, 1832. [Google Scholar] [CrossRef]
  25. Piasecka, M.; Maciejewska, B.; Łabędzki, P. Heat Transfer Coefficient Determination during FC-72 Flow in a Minichannel Heat Sink Using the Trefftz Functions and ADINA Software. Energies 2020, 13, 6647. [Google Scholar] [CrossRef]
  26. Piasecka, M.; Piasecki, A.; Dadas, N. Experimental Study and CFD Modeling of Fluid Flow and Heat Transfer Characteristics in a Mini-Channel Heat Sink Using Simcenter STAR-CCM+ Software. Energies 2022, 15, 536. [Google Scholar] [CrossRef]
  27. Maciejewska, B.; Piasecka, M.; Dadas, N.; Strąk, K. Fluid Flow and Heat Transfer Characteristics in Minichannels—CFD Calculations in Simcenter STAR-CCM+. Heat Mass Transf. 2025, 61, 22. [Google Scholar] [CrossRef]
  28. Piasecka, M.; Hożejowska, S.; Pawińska, A.; Strąk, D. Heat Transfer Analysis of a Co-Current Heat Exchanger with Two Rectangular Mini-Channels. Energies 2022, 15, 1340. [Google Scholar] [CrossRef]
  29. 3M™ Fluorinert™ Electronic Liquid FC-72. Available online: https://multimedia.3m.com/mws/media/64892O/3m-fluorinert-electronic-liquid-fc-72.pdf (accessed on 11 November 2025).
  30. Physical Characteristics of Water. Available online: https://www.thermexcel.com/english/tables/eau_atm.htm (accessed on 1 June 2003).
  31. Tang-Kwor, E.; Matteï, S. Emissivity Measurements for Nextel Velvet Coating 811-21 between −36 °C and 82 °C. High Temp. Press. 2001, 33, 551–556. [Google Scholar] [CrossRef]
  32. Dariusz, S. Performance Investigation of Hybrid Photovoltaic Thermal-Heat with Mini-Channels for Application in Electric Vehicles. Arch. Automot. Eng.-Arch. Motoryz. 2023, 100, 1–26. [Google Scholar] [CrossRef]
  33. Simcenter STAR-CCM+. Available online: https://plm.sw.siemens.com/en-US/simcenter/fluids-thermal-simulation/star-ccm/ (accessed on 25 April 2021).
  34. Residuals in Simcenter STAR-CCM+. Available online: https://volupe.com/Simcenter-Star-Ccm/Residuals-in-Simcenter-Star-Ccm/ (accessed on 26 April 2024).
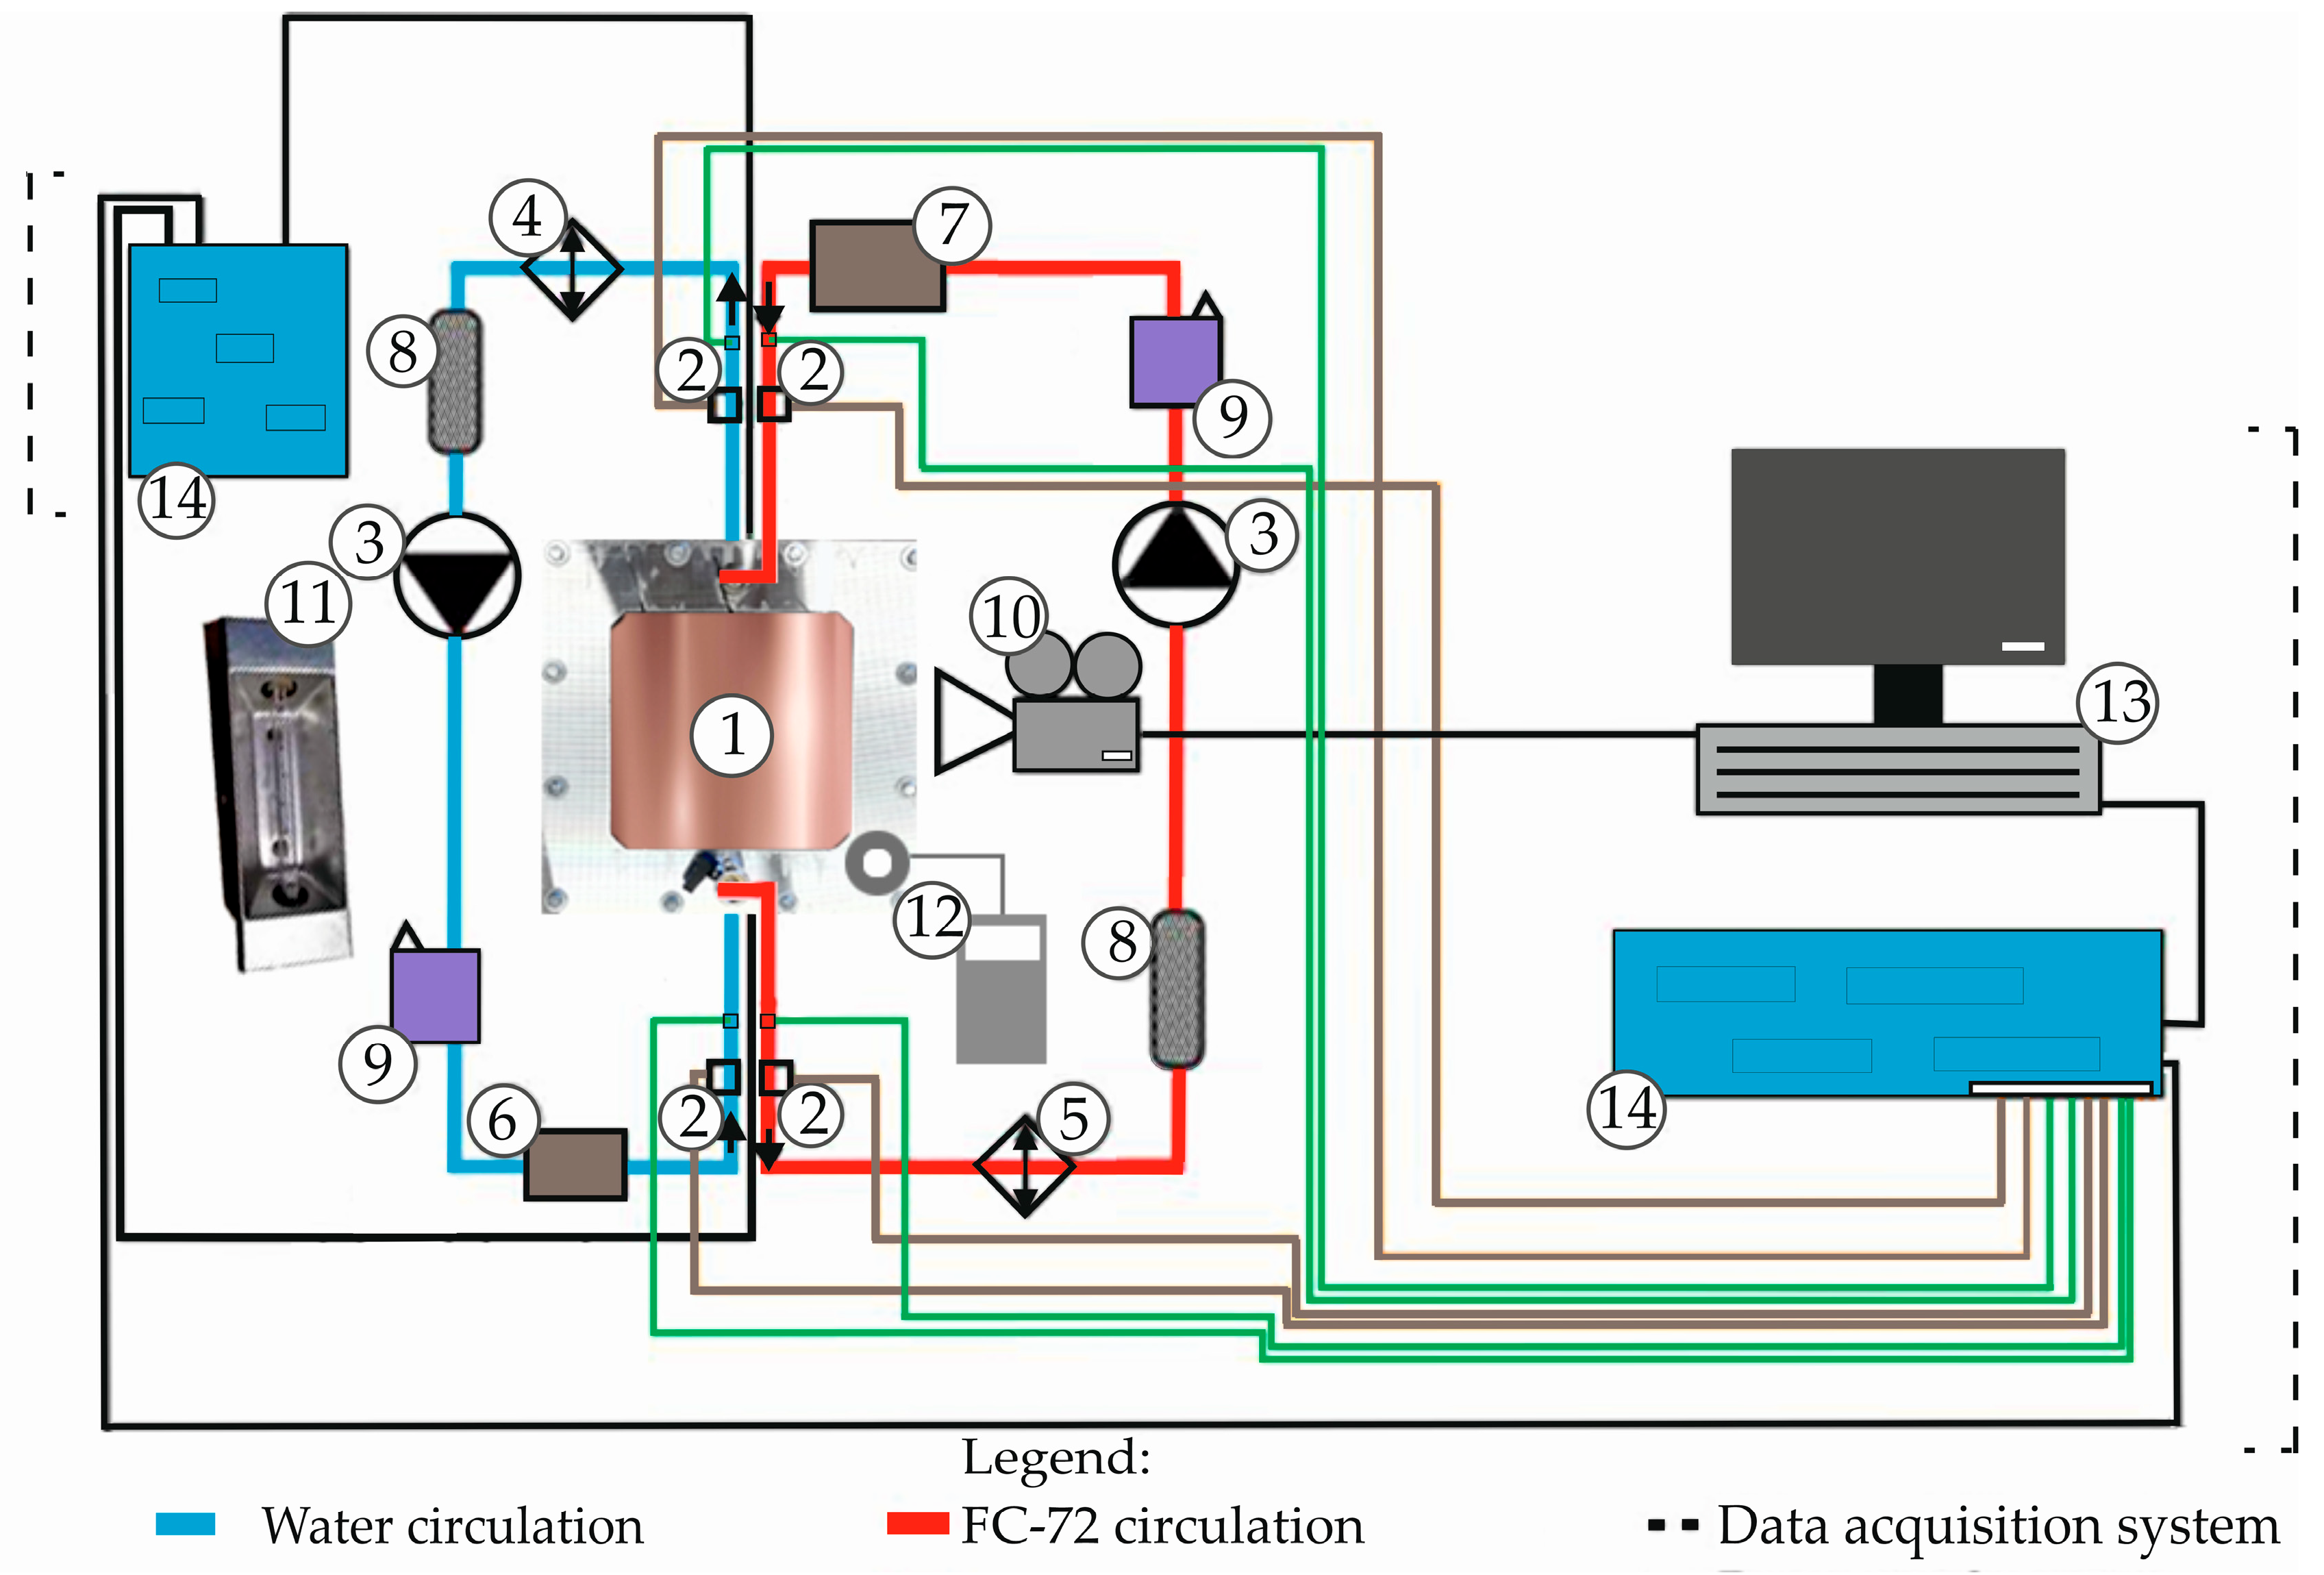
Figure 1. A schematic diagram of the experimental setup: 1—a test module with MCHs; 2—a pressure transducer; 3—circulating pumps; 4, 5—heat exchangers; 6—a turbine flow meter; 7—a magnetic flow meter; 8—a filter; 9—a thermal management system; 10—an infrared camera; 11—a heating bulb; 12—a luxmeter; 13—a PC; 14—a data acquisition station.
Energies 18 05992 g001
Figure 2. A CAD model of the test section: MCHs alongside the components of the compact heat exchanger developed using the SolidWorks 2023 SP05 software: 1, 9—aluminum covers, 2, 4, 6, 8—silicone gaskets, 3—copper closing plate, 5—separating copper plate, 7—heated copper plate (a), the positions of the test section (modeled using Simcenter STAR-CCM+ software) (b), the cross-sectional view of the MMCH module (c), the view of the test module with main dimensions (d).
Energies 18 05992 g002
Figure 3. An illustration of the primary components of the testing setup: (a) a rear perspective of the testing configuration, (b) the rear testing area showing the experimental apparatus, including the MMCH module, (c) the front section of the testing module fitted with a heat shield and an infrared component camera.
Energies 18 05992 g003
Figure 4. The schematic diagram of the main elements of the central part of the test section (illustrative view, not to scale).
Energies 18 05992 g004
Figure 5. Thermograms obtained by an IR camera on the external surface of the heated plate for three heat flux densities: (a) q = 1000 W/m2; (b) q = 2000 W/m2; (c) q = 8000 W/m2; countercurrent mass flow rate of two fluids: 0.008 kg/s.
Energies 18 05992 g005
Figure 6. Temperature vs. distance from the mini-channel: (a) copper heated plate, (b) refrigerant FC-72, (c) copper separating plate, (d) distilled water; countercurrent mass flow rate of two fluids: 0.008 kg/s; heat flux density q = 1000 W/m2.
Energies 18 05992 g006
Figure 7. Temperature vs. distance from the mini-channel: (a) copper heated plate, (b) FC-72 refrigerant, (c) copper separating plate, (d) distilled water; countercurrent mass flow rate of two fluids: 0.008 kg/s; heat flux density q = 2000 W/m2.
Energies 18 05992 g007
Figure 8. Temperature vs. distance from the mini-channel: (a) copper heated plate, (b) refrigerant FC-72, (c) copper separating plate, (d) distilled water; countercurrent mass flow rate of two fluids: 0.008 kg/s; heat flux density q = 8000 W/m2.
Energies 18 05992 g008
Figure 9. HTC calculated by 1D approach vs. the distance from the mini-channel inlet: (a) α1—heated plate and FC-72, (b) α2—FC-72 and copper separating plate, (c) α3—copper separating plate and water, (d) α4—water and copper closing plate; countercurrent mass flow rate of two fluids: 0.008 kg/s; heat flux density q = 1000 W/m2.
Energies 18 05992 g009
Figure 10. HTC calculated by 1D approach vs. the distance from the mini-channel inlet: (a) α1—heated plate and FC-72, (b) α2—FC-72 and copper separating plate, (c) α3—copper separating plate and water, (d) α4—water and copper closing plate; countercurrent mass flow rate of two fluids: 0.008 kg/s; heat flux density q = 2000 W/m2.
Energies 18 05992 g010
Figure 11. HTC calculated by 1D approach vs. the distance from the mini-channel inlet: (a) α1—heated plate and FC-72, (b) α2—FC-72 and copper separating plate, (c) α3—copper separating plate and water, (d) α4—water and copper closing plate; countercurrent mass flow rate of two fluids: 0.008 kg/s; heat flux density q = 8000 W/m2.
Energies 18 05992 g011
Figure 12. Design of the testing module for numerical analysis in Simcenter STAR-CCM+: (a) view of the polyhedral mesh, (b) fluid area moving through the HMCH and CMCH.
Energies 18 05992 g012
Figure 13. View of the mesh of the layers of the test module, Simcenter STAR-CCM+.
Energies 18 05992 g013
Figure 14. Two-dimensional calculation results illustrating velocity distributions: (a) temperature, (b) velocity, generated by the STAR-CCM+ software.
Energies 18 05992 g014
Figure 15. Two-dimensional calculation results illustrating pressure on the (a) hot wall (FC-72), (b) cold wall (water), generated by the STAR-CCM+ software.
Energies 18 05992 g015
Figure 16. Two-dimensional temperature distribution generated by STAR-CCM+, corresponding to the external surface of the heated plate for three heat flux densities (a) q = 1000 W/m2; (b) q = 2000 W/m2, (c) q = 8000 W/m2; countercurrent mass flow rate of two fluids: 0.008 kg/s.
Energies 18 05992 g016
Figure 17. STAR-CCM+ HTC calculated for (a) α1—heated plate and FC-72, (b) α2—FC-72 and copper separating plate, (c) α3—copper separating plate and water, (d) α4—water and copper closing plate, 2000 W/m2 heat flux density and six MCHs; countercurrent mass flow rate of two fluids: 0.008 kg/s.
Energies 18 05992 g017
Figure 18. STAR-CCM+ HTC and 1D computational approach HTC vs. the distance from the MCH inlet for α3—copper separate plate/water, 2000 W/m2 heat flux density and six MCHs: (a) #1, (b) #2, (c) #3, (d) #4, (e) #5, (f) #6, mass flow rate of the two fluids: 0.008 kg/s.
Energies 18 05992 g018
Figure 19. Maximum relative differences between the values of the HTC α1—calculated from Equation (2), α2—Equation (4), α3—Equation (5), and α4—Equation (7), and comparison of HTCs from the STAR CCM+ software for all six MCHs and 1000 W/m2 heat flux density.
Energies 18 05992 g019
Figure 20. Maximum relative differences between the HTC values: α1—calculated from Equation (2), α2—Equation (4), α3—Equation (5), and α4—Equation (7), and comparison of HTCs from the STAR-CCM+ software for all six MCHs and 2000 W/m2 heat flux density.
Energies 18 05992 g020
Figure 21. Maximum relative differences between the values of the HTC α1—calculated from Equation (2), α2—Equation (4), α3—Equation (5), and α4—Equation (7), and comparison of HTCs from the STAR CCM+ software for all six MCHs and 8000 W/m2 heat flux density.
Energies 18 05992 g021
Figure 22. Maximum relative differences between the values of the HTC α1—calculated from Equation (2), α2—Equation (4), α3—Equation (5), and α4—Equation (7), and comparison of HTCs from the STAR CCM+ software for values obtained for the average value of all MCHs and three heat flux densities 1000, 2000, 8000 W/m2.
Energies 18 05992 g022
Table 1. Basic physicochemical properties of refrigerant FC-72 and distilled water.
Boiling Point (K)Critical
Temperature (K)
Kinematic
Viscosity (m2/s)
Liquid Density (kg/m3)Vapor Pressure (Pa)Liquid Specific Heat (J/(kg∙K))Liquid Thermal Conductivity (W/(m∙K))Surface Tension (N/m)
Refrigerant FC-72 [29]
3294490.38 × 1031680.030.9 × 10311000.0570.01
Distilled water [30]
3736470.89 × 103997.13.17 × 10341800.6070.07
Table 2. The technical parameters of the experimental apparatus used for measurements, along with the maximum measurement errors as specified by the manufacturers.
ParameterDeviceType/Model,
Manufacturer,
City, Country
Basic Technical Data
(Measurement Range)
The Maximum
Measurement Error
Mass flow rateTurbine mass flow meter (water)0045BP01XA,
Equflow,
Oss, The Netherlands
Inner diameter 4.8 mm
Medium temperature −20 to
+80 °C
(0.1…1.8 L/min)
1% of reading *
Magnetic flow meter
(FC-72)
SM6000,
IFM,
Essen, Germany
Analogue current output 4…20 mA
Medium temperature −10 to +70 °C
(0.1…25 L/min)
±0.8% measured value
+0.5% final value of the measuring range *
Atmospheric pressure, overpressure at the inlet/outlet of the test sectionPressure meterA-10,
Wika,
Klingenberg am Main, Germany
Output signal 4…20 mA,
Temperature ranges 0 to +80 °C
(0…2.5 bar)
0.5% of full scale *
TemperatureThermocoupleType K 221 b,
Czaki Thermo-Product,
Rybie, Poland
NiCr-NiAl sensor with
a galvanically isolated weld
(−40…375 °C)
calibration tolerance
1.5 °C *
Thermal imaging cameraE60,
FLIR,
Wilsonville, OR, USA
Spectrum range
7.5…13 μm, resolution
320 × 240 pixels
(−20…120 °C)
±1 °C or ±1% in the range of 0…120 °C
and ±2 °C or ±2% outside this range *
Light radiation intensityLuxmeterD2102.1,
Delta OHM,
Caselle di Selvazzano, Italy
Visible light intensity measurement 380…780 nm
(0…1999.9 W/m2)
±0.02 W/m2 or ±2% *
Data acquisition stationDaqLab/2005, IOtech
Norton, MA, USA
Analog Inputs (16 bit/200 kHz): 16
100% Digital Calibration
512 Location Channel/Gain FIFO
0.5% *
Heat exchangerMF-200,
Aquaviva,
Vescovato, Italy
Pool heat exchanger
output power 60 kW
hot water flow: 1.8 m3/h
maximum temperature: 110 °C *
-
B130,
SECESPOL,
Gdańsk, Poland
Shell and tube heat exchanger
output power 130 kW
maximum water flow: 20.94 m3/h
maximum temperature: 203 °C *
-
* according to the data provided by the apparatus manufacturer.
Table 3. Experimental thermal and flow parameters.
ParameterRange of Values/Values
Heat Flux Density, q (W/m2)1000, 2000, 8000
Inlet Pressure, pin (kPa)110–118
Mass Flux, GFC (kg/(m2∙s))277–286
Mass Flux, GW (kg/(m2∙s))279–296
Inlet Liquid Subcooling, ΔTsub (K)60–64
Overall HTC, k (W/(m2 K))428–972
Reynolds Number, Re,FC (-)1201–1299
Reynolds Number, Re,W (-)1108–1226
Table 4. The components assumed in the calculation of the HTC mean relative error.
Component of the HTCAbsolute Error
Plate Temperature Measurement by Infrared ThermographyTIRT(x) = 2.0 K
Fluid Temperature Measurement by K-Type ThermocoupleTf(x) = 0.32 K
Thermal Conductivity of the Copper Heated PlateΔλH = 0.1 W/(m∙K)
Thickness of the Heated PlateΔδH = 5 × 10⁻⁵ m
Heated Plate AreaΔA = 2.9 × 10⁻⁵ m2
Heat Flux DensityΔq,Cu = 0.323 kW/m2
Table 5. Main values of the experimental parameters.
Main Experimental Data
Heat Flux1000 W/m22000 W/m28000 W/m2
Working FluidFC-72WaterFC-72WaterFC-72Water
Temperature at Inlet (°C)23.1218.1321.3219.3321.8420.25
Temperature at Outlet (°C)25.8120.4127.2221.6136.2222.63
Temperature of Ambient Air (°C)20.0020.0020.0020.0020.0020.00
Atmospheric Pressure (bar)1.01.01.01.01.01.0
Overpressure at the Outlet (bar)0.120.080.160.140.220.12
Table 6. Boundary conditions for numerical calculations in Simcenter STAR CCM+.
Region/BoundaryTypeValue/Setting
Aluminum CoverStatic Temperature20 °C…26.8 °C
Silicon GasketSolid
Static Temperature
Reference Values
Si-silicon
18 °C
Minimum Allowable Temperature: 15 °C, Maximum Allowable Temperature: 60 °C
Fluid domain cold (MMCH)Pressure100,000 Pa
Static Temperature15 °C
Turbulence intensity0.01
Turbulence SpecificationIntensity/Viscosity + Ratio
Turbulent Velocity Scale0.01 m/s
Turbulent Viscosity Ratio1.0
Velocity[0.0; 0.0; 0.0] m/s
Fluid domain hot (MMCH)Pressure900,000 Pa
Static Temperature15 °C
Turbulence Intensity0.01
Turbulence SpecificationIntencity/Viscocity + Ratio
Turbulent Velocity Scale0.01 m/s
Turbulent Viscosity Ratio1.0
Velocity[0.0; 0.0; 0.0] m/s
Separated copper plateSolidCu
Reference ValuesMinimum Allowable Temperature: 15 °C
Maximum Allowable Temperature: 40 °C
Initial Condition20 °C
Closing copper plateSolidCu
Reference ValuesMinimum Allowable Temperature: 15 °C
Maximum Allowable Temperature: 30 °C
Initial Condition18 °C
Table 7. Characteristics of the plates and experimental data.
MaterialDensity (kg/m3)Dynamic
Viscosity (Pa·s)
Specific Heat (J/(kgK))Thermal Conductivity (W/(mK))
Fluid
FC-721680.006.4 × 10−41100.000.057
Distilled water997.568.89 × 10−44181.720.59
Solid
Copper8940-386398
Aluminum2702-903237
Silicon2160-7020.21
Table 8. Number of elements in the grid for the 2 mm, 3 mm, and 5 mm base sizes.
ElementCellsFacesVertsCellsFacesVertsCellsFacesVerts
2 mm Base Size3 mm Base Size5 mm Base Size
Aluminum Cover1,444,8377,198,2315,047,5931,048,7325,133,3503,554,235737,5863,505,3752,373,171
Silicon Gasket97,157391,672229,14096,092383,557222,13695,930381,481220,118
Copper Plate132,595740,831642,456134,044743,447637,551128,914704,903603,914
Silicon Gasket
(forming a MMCH)
Fluid domain hot
3,896,84617,371,03111,137,6371,723,9107,241,0184,398,724808,1433,335,3211,990,058
Copper Plate4,312,34219,487,66612,644,1001,992,4808,426,3075,149,921903,6763,736,0722,232,098
Silicon Gasket
(forming a MMCH)
10,145,73442,547,32926,298,0483,451,82814,479,2078,942,527997,6844,304,5192,970,490
Fluid domain cold4,731,73021,364,99414,101,4912,297,4499,866,8286,115,940899,8763,740,6772,247,285
Copper Plate6,544,39730,299,97420,035,0563,588,71415,205,3219,813,4701,123,7804,701,0812,839,070
Silicon Gasket97,167391,682229,15096,192383,657222,14695,940381,581220,218
Table 9. Results of the calculations of the grid convergence index.
h (-)N (-) ϕ (K)r (-) e (-)p (-)ea (%)GCI (%)
2.00 × 10⁻³
(h1)
37,051,628 (N1) [2 mm]300.241567 ( ϕ 1 ) 1.3607
( r 21 )
-
( e 21 )
4.67-
( e a 21 )
-
( G C I 21 )
2.55 × 10⁻³
(h2)
17,896,414 (N2) [3 mm]300.9499 ( ϕ 2 ) 1.2745 ( r 32 ) 0.7084 ( e 32 ) 0.24 ( e a 32 ) 0.14 ( G C I 32 )
3.54 × 10⁻³
(h3)
6,707,410 (N3) [5 mm]297.950452 ( ϕ 3 ) 1.3869−2.99950.990.35
Table 10. Inlet boundary conditions used in CFD simulations for hot and cold fluid.
Heat Flux
(W/m2)
FluidMass Flow Rate (kg/s)Inlet Total Pressure (Pa)Inlet Temperature (K)Type of Flow
1000Cold Fluid (6 mini-channels)0.008118,000291.28Countercurrent Flow
Hot Fluid (6 mini-channels)0.008112,325296.27
2000Cold Fluid (6 mini-channels)0.008125,000292.48Countercurrent Flow
Hot Fluid (6 mini-channels)0.008116,325294.47
8000Cold Fluid (6 mini-channels)0.008114,000293.40Countercurrent Flow
Disclaimer/Publisher’s Note: The statements, opinions and data contained in all publications are solely those of the individual author(s) and contributor(s) and not of MDPI and/or the editor(s). MDPI and/or the editor(s) disclaim responsibility for any injury to people or property resulting from any ideas, methods, instructions or products referred to in the content.