Article

Evaluation of CO2 Injectivity and Geological Storage Scenarios Using Nodal Analysis and Tubing Injectivity Index in a Depleted Gas Field in Malaysia

Energy and Mineral Resources Engineering, Dong-A University, Busan 49315, Republic of Korea
*
Author to whom correspondence should be addressed.
Energies 2025, 18(22), 5983; https://doi.org/10.3390/en18225983
Submission received: 16 October 2025 / Revised: 5 November 2025 / Accepted: 11 November 2025 / Published: 14 November 2025

Abstract

This study presents a CO2 injectivity analysis for the depleted gas field Z offshore Malaysia using nodal analysis and sensitivity analysis. Reservoir permeability was estimated from the appraisal well DST report, which recorded an absolute open flow (AOF) of 253 MMscfd, and sensitivity analyses were conducted for injection pressure, tubing diameter, reservoir pressure, permeability, and thickness. The base-case nodal analysis resulted in an optimal CO2 injection rate of 52.3 MMscfd. Injection pressure, permeability, and thickness were linearly proportional to injection rate, whereas reservoir pressure showed an inverse relationship. The analysis of injection rate per tubing diameter indicated that 4.548-inch tubing, with 15.11 MMscfd per inch, provided the highest efficiency. A total CO2 injection volume of 5 Tcf was distributed among five wells, and four injection period scenarios (20, 15, 10, 5 years) were designed based on flow efficiency. In the 5-year scenario, the bottomhole pressure of all wells exceeded the formation parting pressure at a reservoir pressure of approximately 1000 psia, indicating that the target injection rate of 2739 MMscfd could not be achieved. Tubing injectivity index (TII) analysis showed that higher TII values represented greater injection efficiency from a vertical flow perspective.

1. Introduction

Carbon capture and storage (CCS) is a climate change mitigation technology that captures carbon dioxide (CO2), a major greenhouse gas, and safely stores it. This process involves three main stages: capture, transport, and storage. Among the various strategies for reducing atmospheric CO2 emissions, CCS is widely recognized as one of the most effective options [1]. According to the International Energy Agency (IEA), CCS alone could reduce global CO2 emissions by approximately 19% by 2050 [2]. In the absence of CCS, the cost of achieving an equivalent reduction is projected to increase by approximately 70%, underscoring the economic necessity of CCS as a key mitigation strategy [3].
Within the CCS chain, CO2 geological storage constitutes the final stage, which involves injecting CO2 into subsurface formations such as depleted oil and gas reservoirs, deep saline aquifers, and coal beds. Depleted reservoirs, in particular, are considered promising storage sites due to their stable structural geology consisting of permeable reservoir rocks overlain by impermeable caprocks, which have successfully retained pressurized hydrocarbons over geological times. Since these reservoirs have already been characterized, extensive geological and engineering data are typically available [4]. Moreover, existing production infrastructure can often be repurposed, making these sites technically feasible and cost-effective for safe CO2 storage within relatively short timeframes [5]. Additionally, injecting CO2 into depleted reservoirs can help restore formation pressure, thereby reducing the risk of ground deformation [6].
A 2013 assessment by the Asian Development Bank (ADB) estimated that Southeast Asian countries, including Vietnam, Indonesia (specifically South Sumatra), Thailand, and the Philippines, possessed a combined CO2 storage potential of approximately 50 Gt [7]. A more recent estimate by the Global CCS Institute (2021) [1] reported that the entire Southeast Asian region holds around 165 Gt of CO2 storage capacity, with Malaysia alone accounting for nearly half of this total [8].
Malaysia’s national CCUS development was reported to be guided by several strategic policy frameworks, including the NEP 2022–2040, NETR, and NIMP 2030, which collectively emphasized carbon capture retrofits and offshore storage initiatives [9]. It was also noted that decades of offshore oil and gas operations had provided extensive platform and pipeline infrastructure that could be repurposed for CO2 transport and storage, supporting a potential regional hub-and-spoke CCS network in Southeast Asia [10]. In addition, Malaysia was identified as hosting numerous high-CO2 gas fields, highlighting both its substantial storage potential and the need for integrated CCS planning. The country’s readiness for large-scale deployment was demonstrated by PETRONAS’s Kasawari Project, recognized as the first major offshore CCS development in Southeast Asia [11].
Malaysia has emerged as one of the most promising countries for CO2 geological storage in Southeast Asia, supported by its extensive offshore sedimentary basins—such as the Malay, Sarawak, and Sabah basins—characterized by thick, well-sealed formations and widespread hydrocarbon accumulation. The country also hosts multiple high-CO2 gas fields, providing abundant depleted-reservoir and saline-aquifer candidates suitable for storage [12,13].
Beyond these regional assessments, several recent studies have continued to broaden the discussion on CCS and its integration with subsurface energy systems. Wu and Ansari highlighted the evolving role of depleted gas reservoirs in future low-carbon energy frameworks, suggesting their potential as multipurpose underground storage sites beyond CO2 sequestration [14]. Meanwhile, Cao et al. investigated how reservoir conditions and fracture-related parameters influence formation behavior, emphasizing the importance of geomechanical understanding for safe and efficient injection operations [15]. These studies collectively underscore the growing global attention toward both the functional versatility and operational integrity of geological storage environments.
Designing an appropriate injection system is essential for CO2 storage in depleted reservoirs. Similar system-based modeling approaches have been increasingly applied in field optimization, particularly through digital-twin and systems-analysis methods that enable process-level prediction and control [16]. In practical applications, CO2 injection design typically requires nodal analysis and reservoir simulation. Well-test analysis provides key reservoir parameters necessary for injection system design, while nodal analysis estimates injectivity and reservoir simulation assesses post-injection plume migration and subsurface flow mechanisms [17,18,19].
Since injectivity tests are generally not performed before storage site selection, particularly for potential CO2 storage candidates, nodal analysis based on existing well-test and completion data is often necessary to evaluate injection performance.
This study extends the author’s previous master’s thesis, which developed a CO2 injectivity evaluation framework using nodal analysis for depleted gas reservoirs in Malaysia [20]. The present work refines that framework by introducing the Tubing Injectivity Index (TII) to assess vertical flow efficiency and by designing multiple geological storage scenarios for field-scale application.
In this study, a well-test report from an appraisal well drilled in a depleted gas field (Field Z) located in Sarawak of Malaysia was analyzed to determine key reservoir parameters, including pressure, temperature, thickness, and borehole diameter. Based on the Absolute Open Flow (AOF) test results, a production nodal analysis was conducted to estimate reservoir permeability. These input parameters were then used to design a CO2 injection well model. Subsequently, injection nodal analysis was performed to evaluate the injection rate and bottomhole pressure (BHP) as functions of injection pressure, tubing size, reservoir pressure, permeability, and thickness.
Finally, a field-scale CO2 injection scenario was designed for the entire Gas Field Z. The total CO2 injection was set to 5 Tcf and distributed across five injection wells. Injection rates for each well were allocated proportionally according to flow efficiency, defined as the product of reservoir permeability and thickness. Four scenarios were constructed by varying the total injection period. For each scenario, operating injection rates and BHPs were calculated, and the reservoir pressure at which the BHP exceeded the formation parting pressure (FPP) was identified. The tubing injectivity index (TII) was used to assess injectivity performance under these varying conditions.

2. Materials and Methods

2.1. Nodal Analysis for CO2 Injection

As illustrated in Figure 1, when the analysis node is placed at the bottomhole (Pwf, Node 5), the CO2 injection nodal analysis differs from that of oil and gas production systems. In this context, the flow from the wellhead through the tubing to the bottomhole is defined as the inflow performance relationship (IPR), whereas the flow from the bottomhole into the reservoir is referred to as the output performance relationship (OPR).
Although the graphical structure of the CO2 injection nodal analysis is similar to that of production nodal analysis, the interpretations of the IPR and OPR curves are fundamentally different. In the injection system, the flow from the wellhead through the tubing to the bottomhole is defined as the IPR, whereas the flow from the bottomhole into the reservoir is referred to as the OPR. The IPR curve represents the relationship between injection rate and bottomhole pressure ( P w f ) under constant wellhead pressure, showing that the injection rate increases as P w f decreases. Conversely, the OPR curve illustrates that the injection rate increases with increasing P w f under constant reservoir pressure conditions.
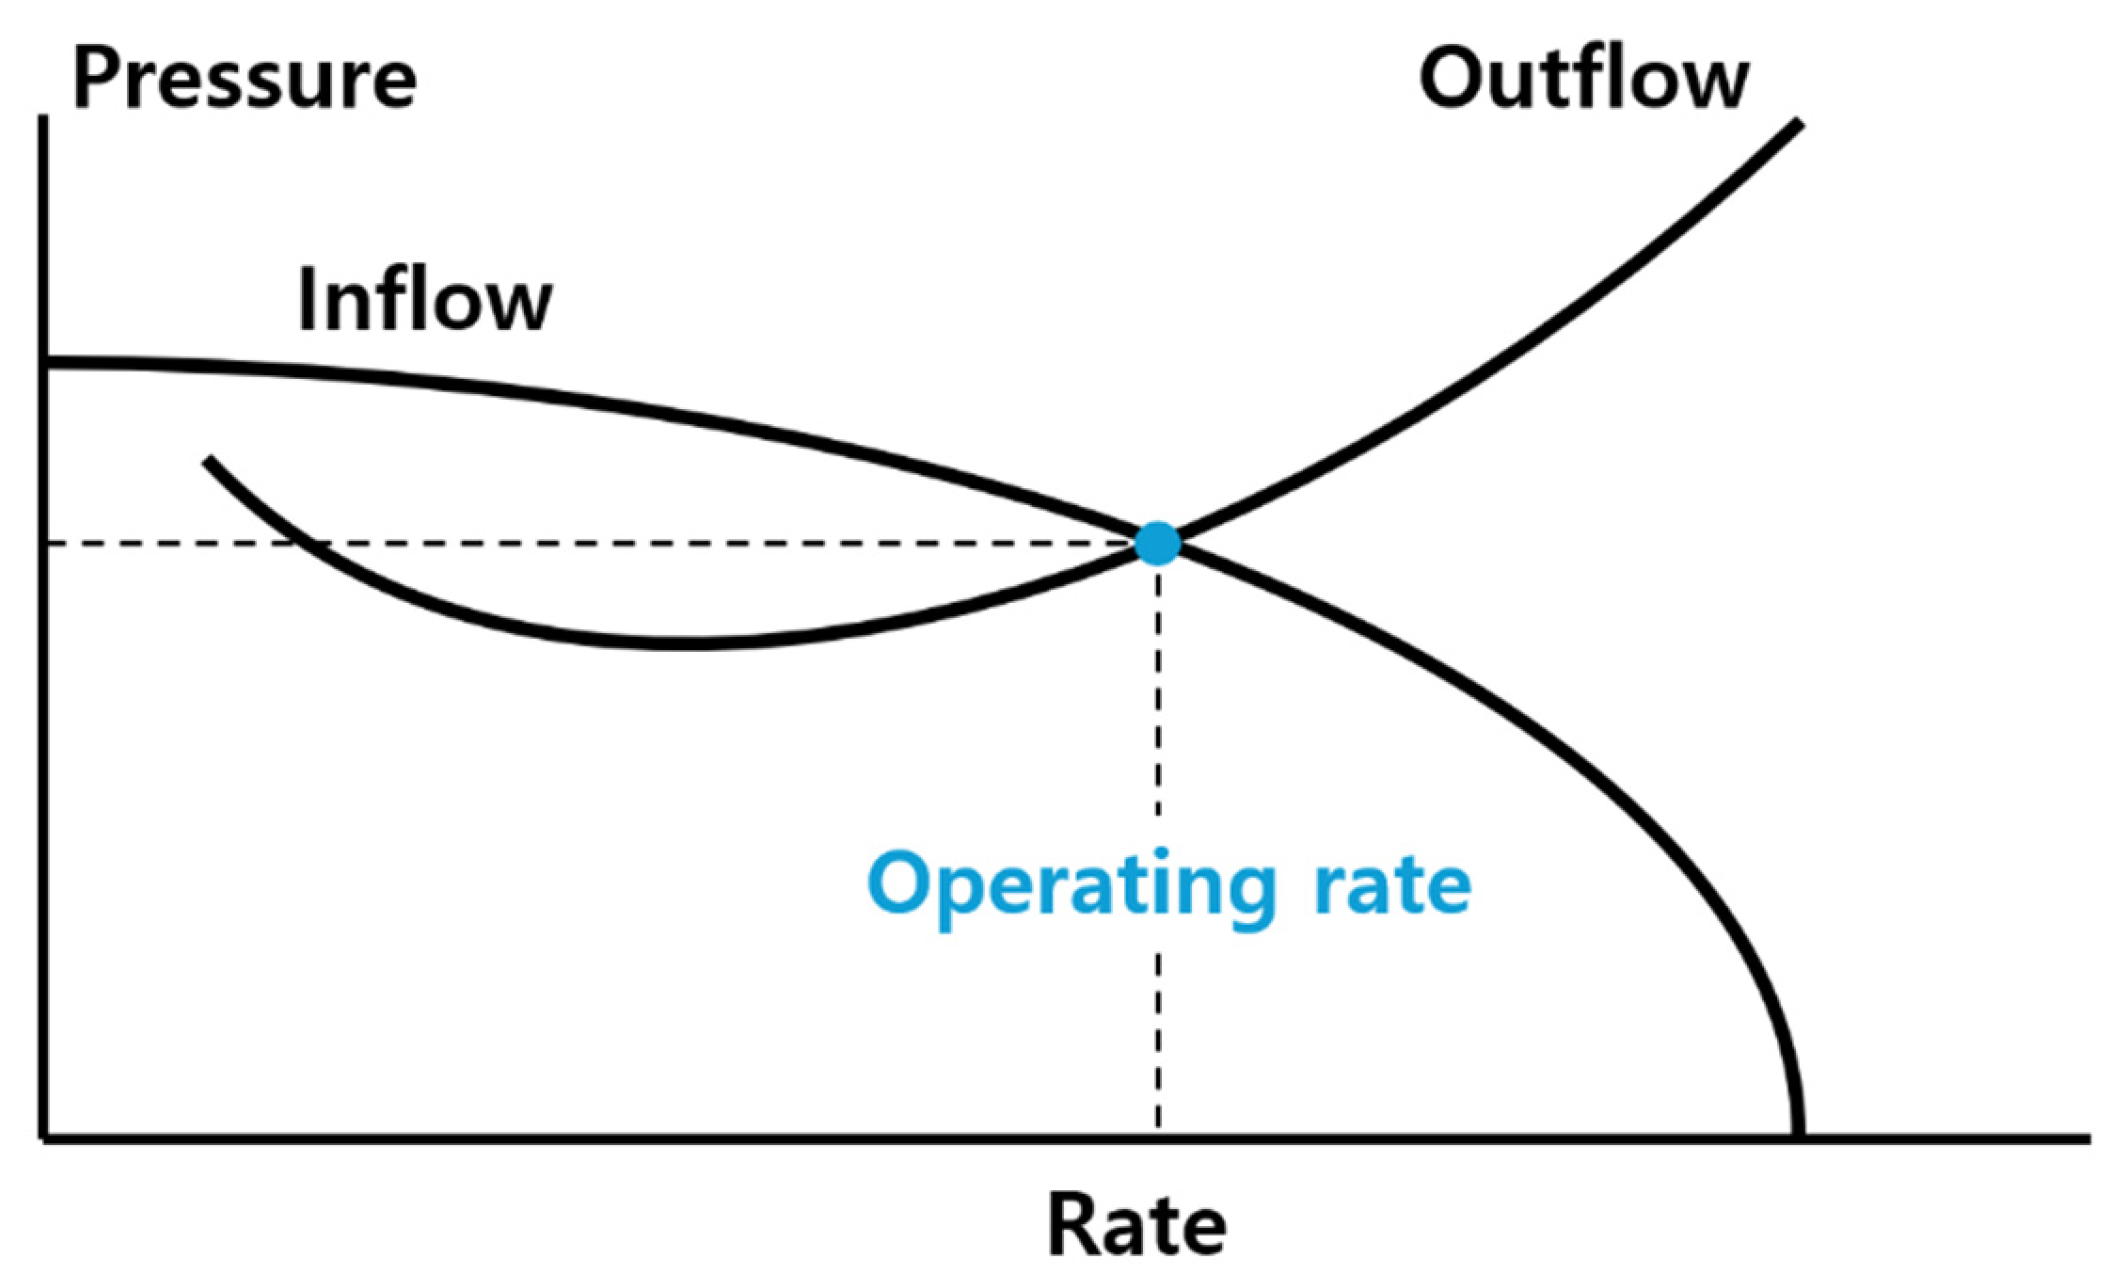
As in production nodal analysis, the intersection of the IPR and OPR curves determines the optimal CO2 injection rate and the operating BHP for the system (Figure 2).

2.1.1. IPR Input Parameters

The key parameters influencing the IPR during CO2 injection include tubing size, injection depth, injection pressure, injection temperature, pipe roughness, and the presence of impurities. A larger tubing diameter allows for a higher flow rate, making tubing design a critical factor in CO2 injectivity for new wells.
Injection depth significantly affects injectivity due to the geopressure gradient, with deeper reservoirs generally exhibiting higher pressures. Injection pressure is also critical, as it directly affects the CO2 rate that can be delivered into the reservoir. If the injection pressure is insufficient to maintain CO2 in its supercritical phase, phase transitions may occur within the tubing due to rising pressure and temperature, thereby reducing injectivity.
Similarly, an excessively low injection temperature can cause CO2 to undergo phase transition during flow through the tubing, negatively affecting injectivity. Pipe roughness also influences injectivity by contributing to pressure losses: higher frictional resistance leads to lower injection rates at the same injection pressure. Finally, impurities in CO2 alter its critical point and thermophysical properties, including density and viscosity. Consequently, impure CO2 typically exhibits lower injectivity than pure CO2 under identical flow conditions [21].

2.1.2. OPR Input Parameters

The OPR during CO2 injection is primarily controlled by reservoir properties, such as permeability, lithology, thickness, pressure, skin factor, and well stimulation practices. Among these, permeability is one of the most critical, as higher permeability allows for greater injectivity. If CO2 injection testing has been conducted, the OPR can be empirically derived from the well-test results; otherwise, permeability must be estimated from production well tests.
Typical reservoir lithologies, such as sandstone and limestone, possess petrophysical properties, including porosity, fluid saturation, permeability, capillary pressure, and relative permeability, that directly affect the rate at which CO2 can be stored. Reservoir thickness, when combined with permeability, defines flow efficiency, making it a key factor in injectivity assessment [21].
As CO2 injection progresses, reservoir pressure gradually increases, which may reduce injection rates. Similarly, if injection begins long after production has ceased, partial recovery of reservoir pressure can affect injectivity. This underscores reservoir pressure as a critical variable governing CO2 injection performance.
The skin factor also affects injectivity but is difficult to estimate accurately without dedicated injectivity tests. Finally, well stimulation techniques such as acidizing or hydraulic fracturing can enhance permeability and, consequently, improve CO2 injectivity [21].

2.2. CO2 Injectivity Analysis of the Injection Well in Gas Field Z

The Gas Field Z is an offshore producing gas field located in Sarawak, Malaysia, with an estimated maximum daily production rate of approximately 490 MMscfd. In this study, the injection well model was designed based on data from a drill stem test (DST) conducted on an evaluation well within the field. The total measured depth (MD) from rotary kelly bushing (RKB) of the well was 1710 m. The well was completed with 30-inch casing down to 203 m, a 20-inch casing down to 577 m, a 13.375-inch casing down to 1550 m, and a 9-5/8-inch casing down to 1698 m.
The well test report revealed the following: DST-1 was conducted between depths of 1621 and 1631 m, and DST-2 between 1610.5 and 1660 m. Log interpretation of DST-1 indicated average porosity and water saturation of 19% and 46%, respectively. After acid stimulation, a gas-production rate of 45.2 MMscfd was recorded at a formation drawdown pressure of 343 psia.
For DST-2, the average porosity and water saturation were 24% and 26%, respectively, with a net-to-gross (N/G) ratio of 88%. The reservoir pressure and temperature for this interval were 3600 psia and 230 °F, respectively. A modified isochronal gas-well test was conducted, yielding a maximum AOF of 253 MMscfd.
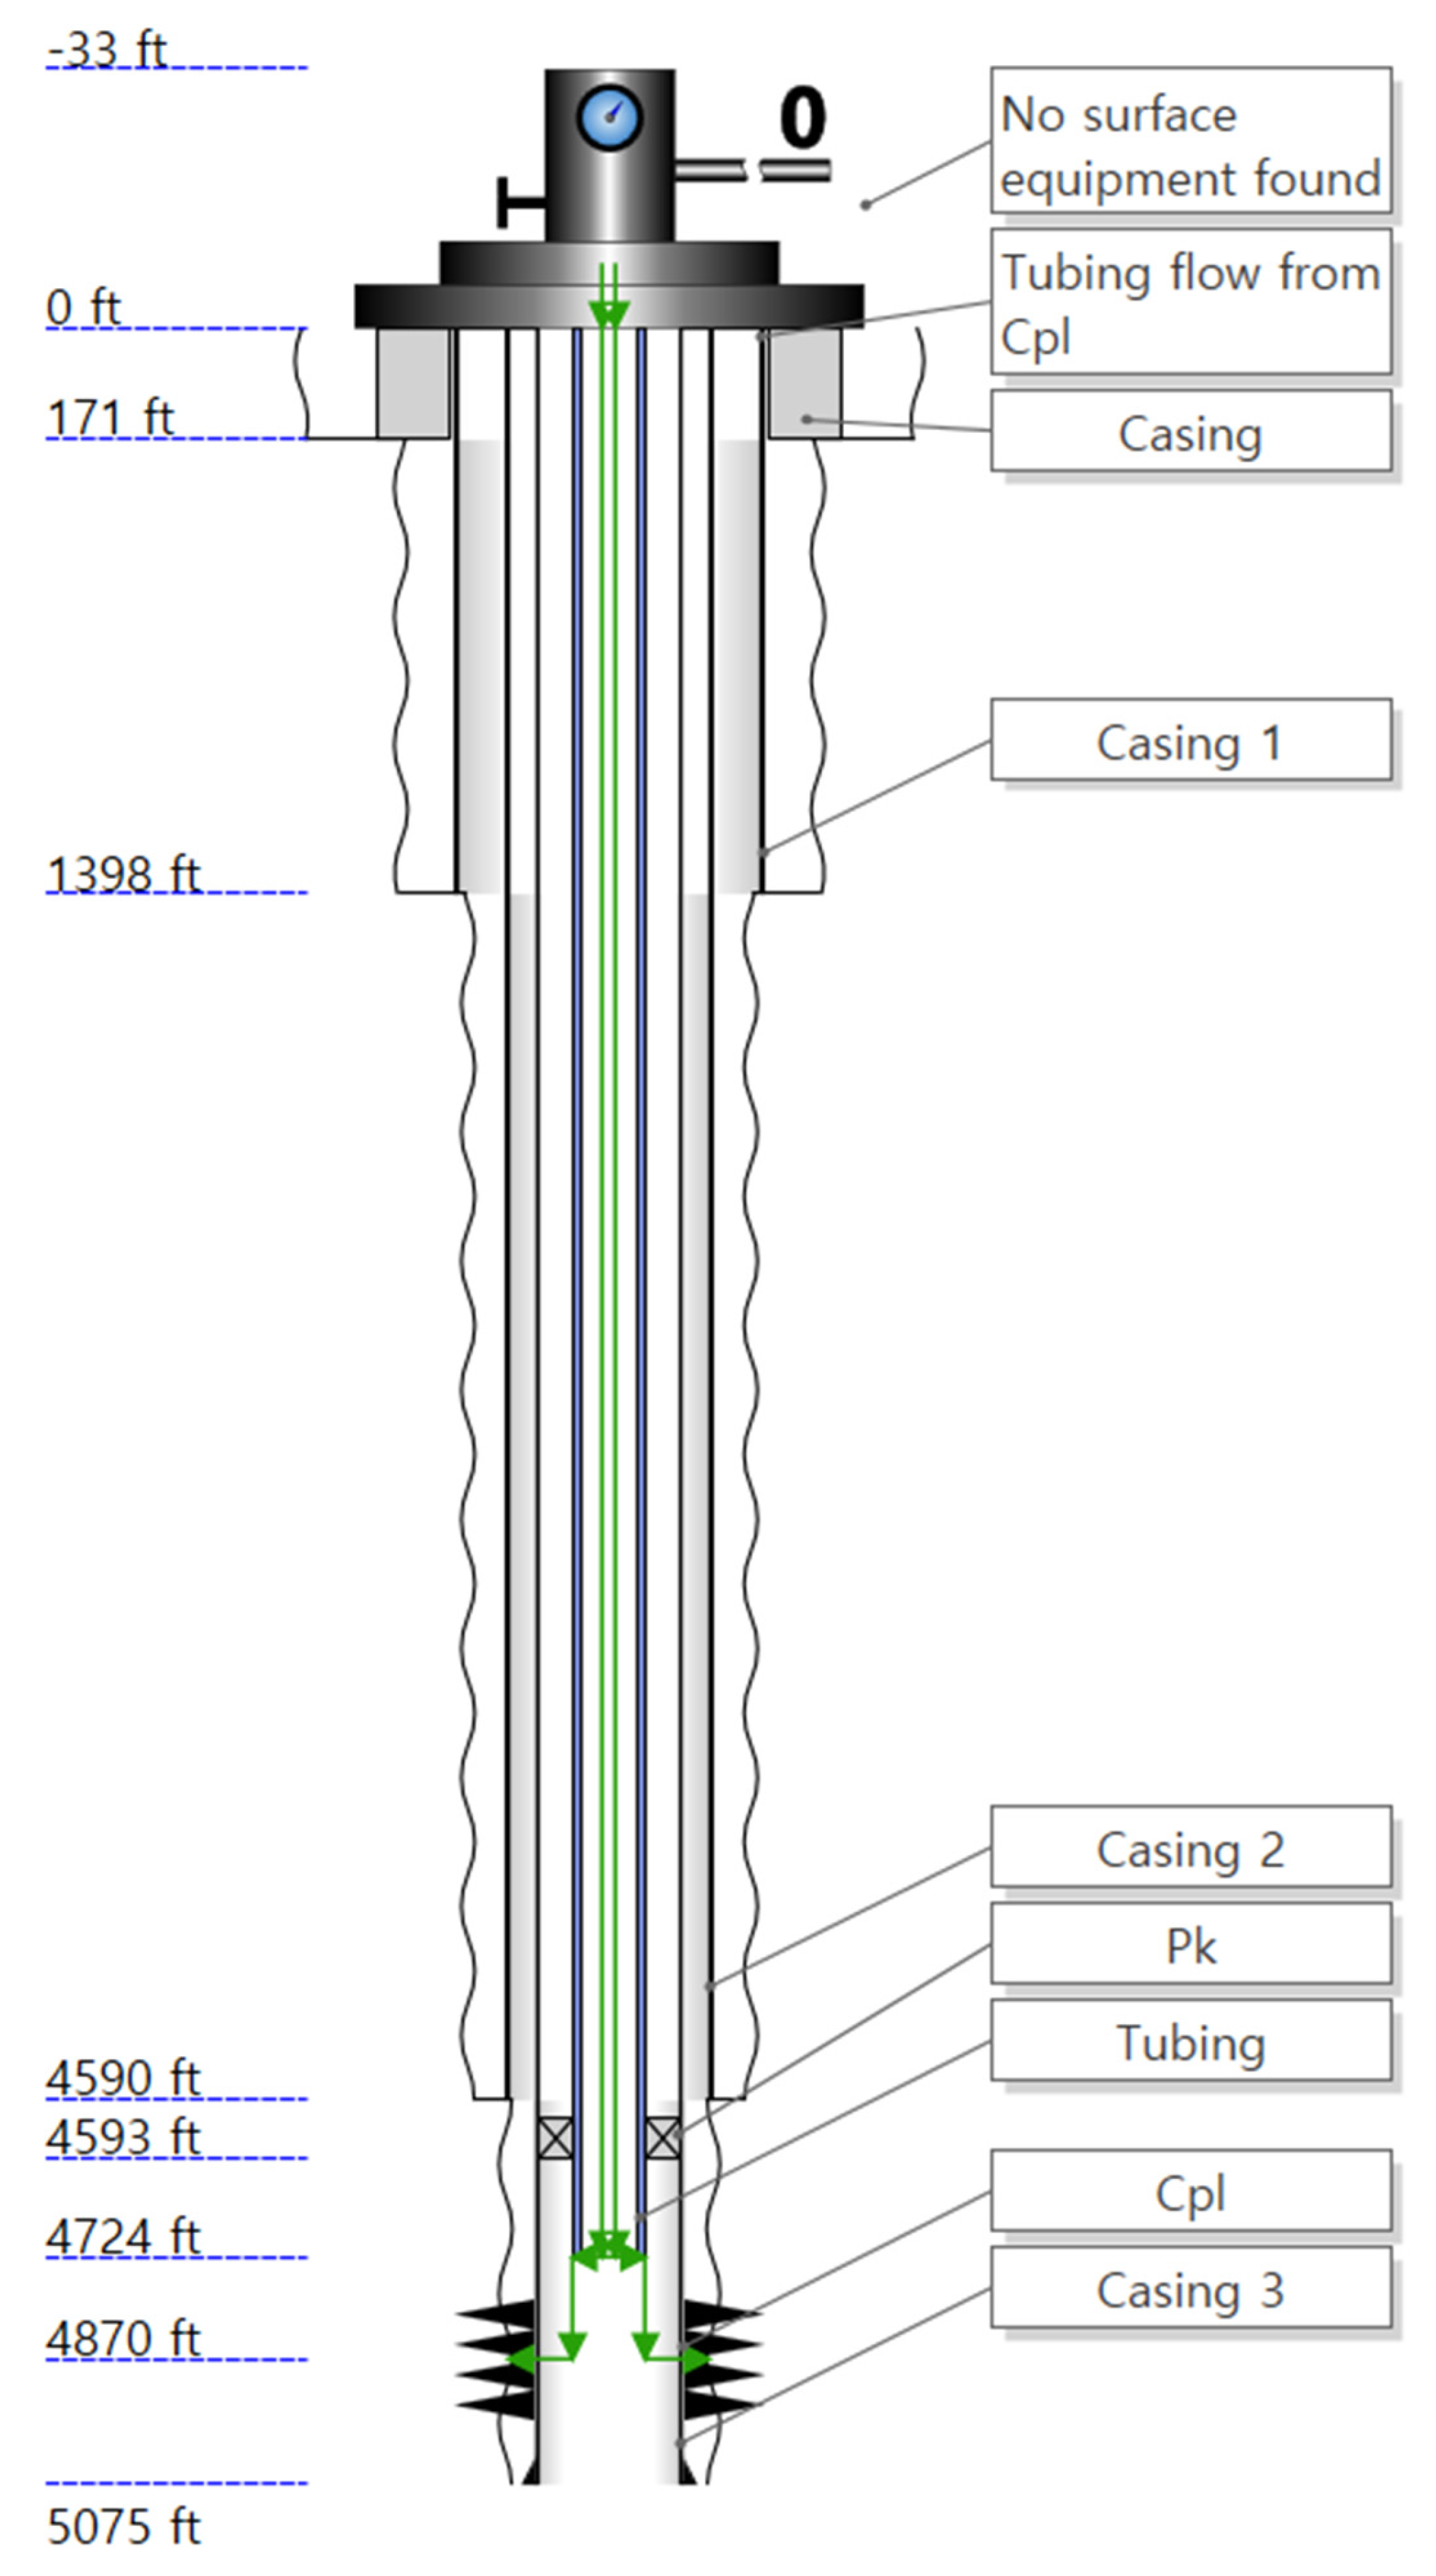
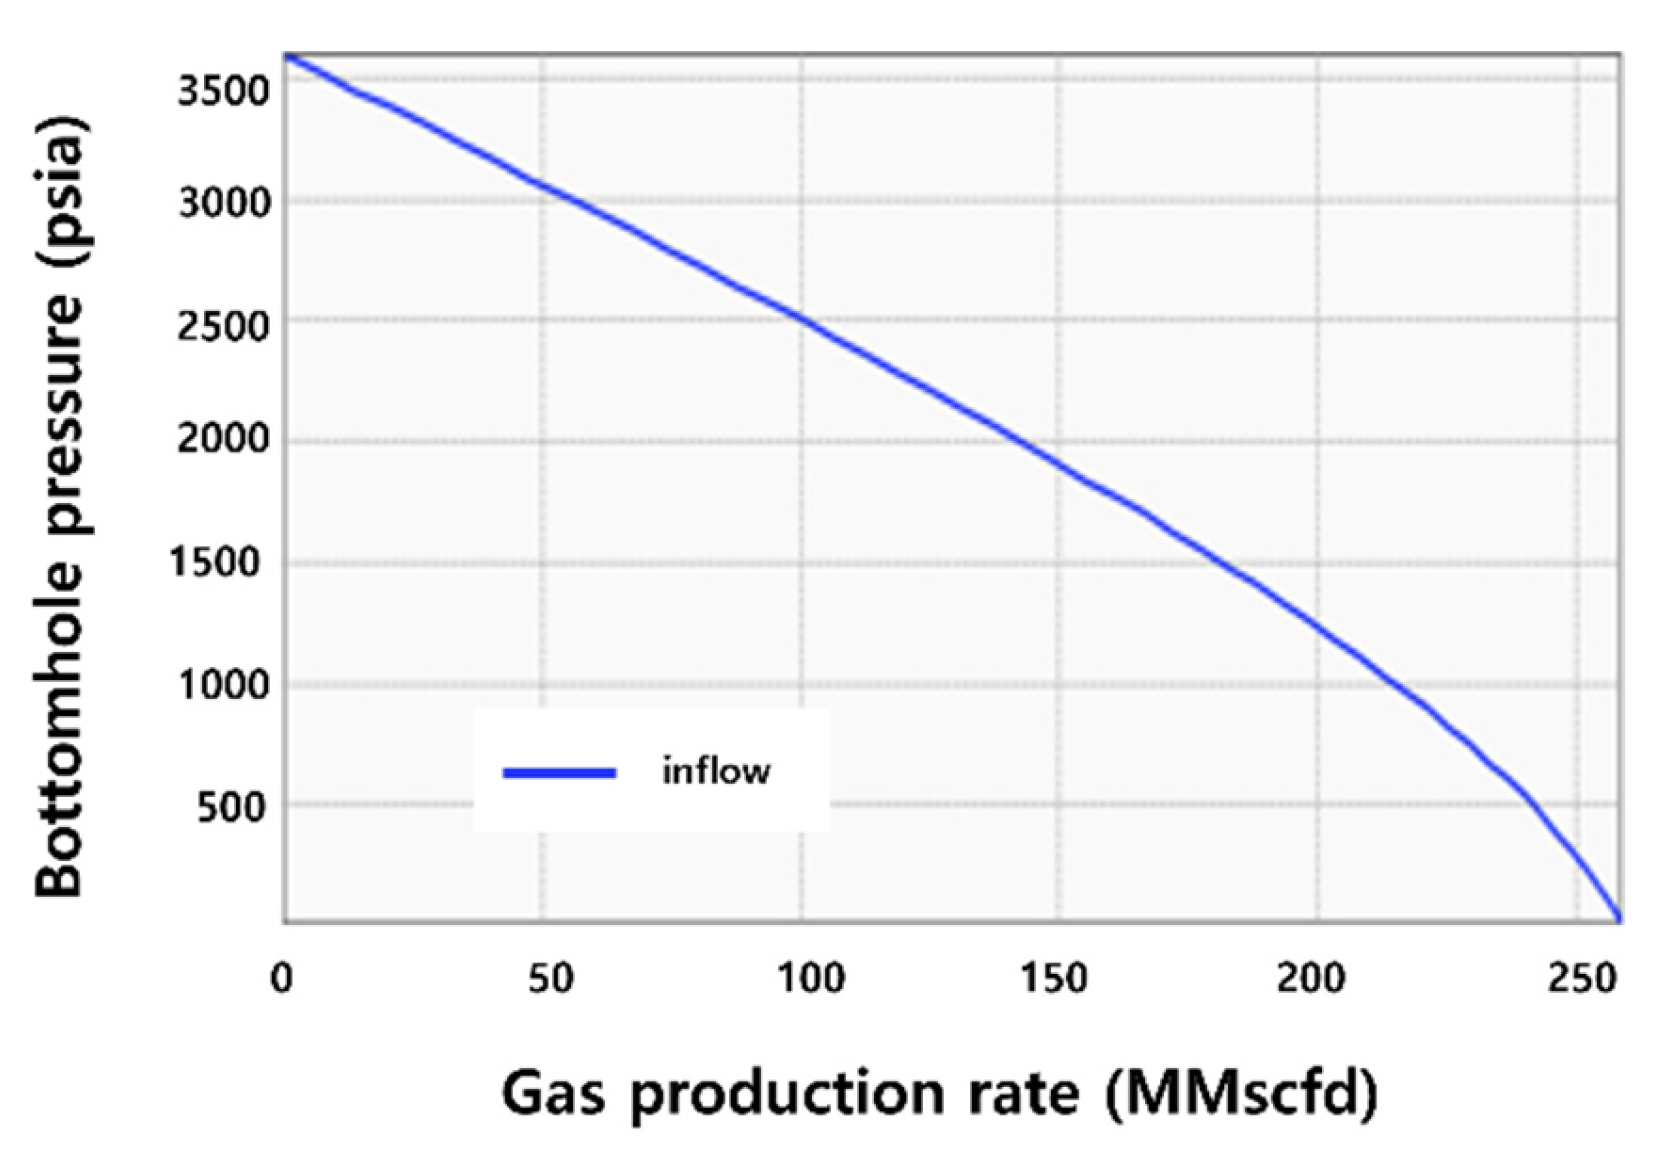
Based on the evaluation well data, key reservoir parameters were determined as follows: depth of 1611–1675 m, thickness of 209.97 ft, initial reservoir pressure of 3600 psia, reservoir temperature of 230 °F, and borehole diameter of 12.5 in (Table 1, Figure 3). Using the DST-2 maximum AOF value of 253 MMscfd (Figure 4), reservoir permeability was calculated as 10.5 md using the pseudo-steady state equation (Equation (1)). This equation, derived from the radial flow equation for gas wells under pseudo–steady-state conditions, relates the flow rate to the reservoir and well parameters [22,23].
q g = k h ( m ( p ¯ ) m ( p w f ) ) 1424 T ( l n r e r w 3 4 + S )
where qg represents the gas flow rate, k represents the reservoir permeability (md), ℎ represents the reservoir thickness (ft), p ¯ represents the average reservoir pressure (psia), p w f represents the flowing BHP (psia), T represents the reservoir temperature (°R), re represents the drainage radius (ft), rw represents the wellbore radius (ft), and S represents the skin factor. The pseudo pressure term m ( p ) re0presents the real-gas potential, defined to account for gas compressibility and viscosity variations with pressure [22].
The skin factor is influenced by parameters such as partial penetration, mud infiltration, and mineral swelling. Given that the injection well was still in the design stage, the skin factor was assumed to be zero. This assumption was made because the skin factor can only be accurately determined through field testing, and therefore it is not feasible to assign a realistic value to a well that has not yet been drilled.
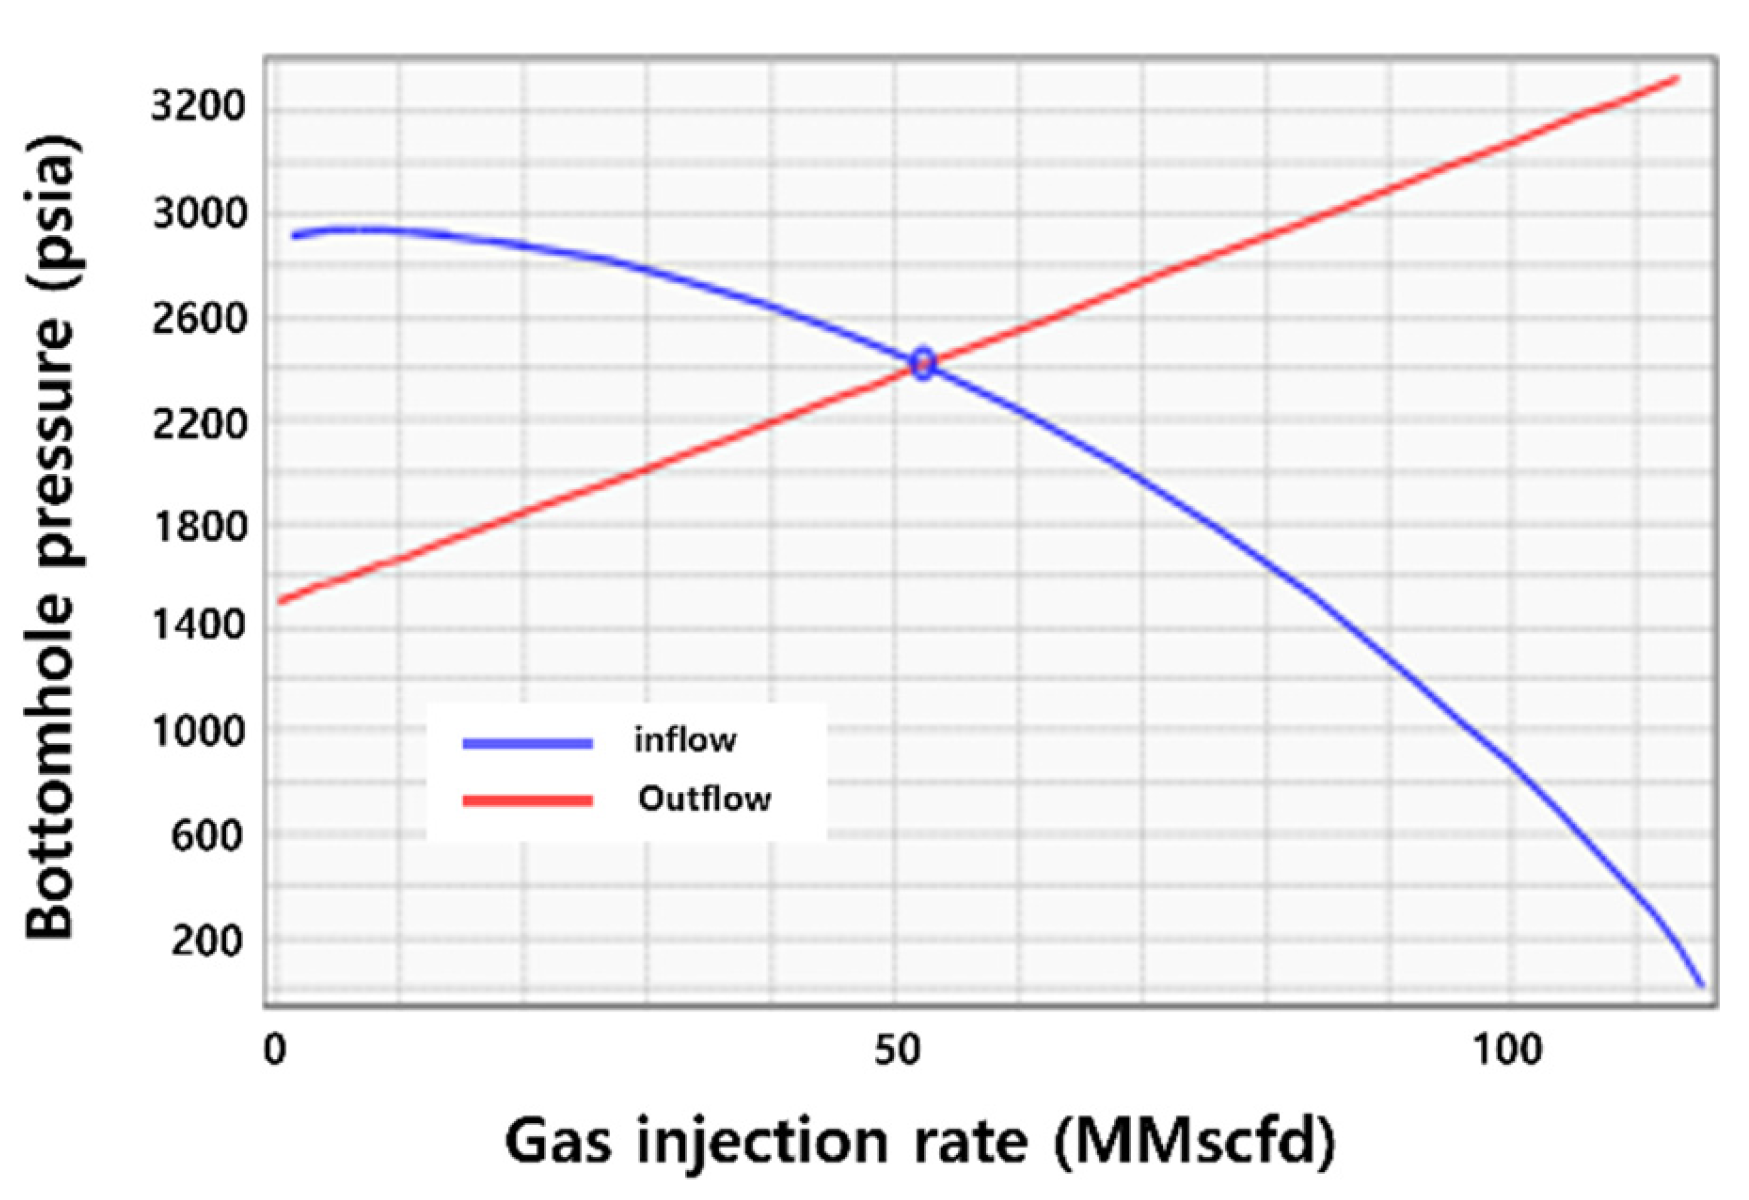
Considering the supercritical condition of CO2, the injection temperature and pressure were set to 50 °F and 1100 psia, respectively. Using these inputs, a CO2 injection nodal analysis was conducted. The optimal injection rate for the well Z was calculated as 52.30 MMscfd at a bottomhole pressure of 2417.13 psia (Figure 5). When the skin factor decreased from 0 to −2, the injection rate increased from 52.30 to approximately 55.21 MMscfd (+5.56%). Conversely, increasing the skin factor to +2 and +5 reduced the injection rate to approximately 46.49 MMscfd (−11.11%) and 40.68 MMscfd (−22.22%).
All simulations were carried out using the PIPESIM software (version 2024, Schlumberger, Houston, TX, USA) developed by Schlumberger. The correlation of Hagedorn and Brown [24] was used to estimate the pressure gradient of the CO2 flow within the injection tubing under multiphase conditions. The model expresses the total pressure gradient ( d P d L ) as the sum of three components: the elevation (hydrostatic) gradient, the frictional gradient, and the acceleration gradient, as shown in Equation (2) [24].
d P d L = ( d P d L ) e l e v + ( d P d L ) f r i c + ( d P d L ) a c c
where
  • ( d P d L ) e l e v = ρ m g s i n   θ represents the hydrostatic pressure gradient,
  • ( d P d L ) f r i c = f v m 2 ρ m 2 D is the frictional pressure loss, and
  • ( d P d L ) a c c = v m d ( ρ m v m ) d L accounts for the acceleration term.
Here,
  • ρ m is the mixture density (lbm/ft3),
  • v m is the mixture velocity (ft/s),
  • f is the friction factor,
  • D is the inner diameter of the tubing (ft),
  • θ is the deviation angle from the horizontal (°), and
  • g is the gravitational acceleration (32.174 ft/s2).
The Hagedorn and Brown correlation was originally developed from experimental data on vertical two-phase flow in small-diameter pipes and is widely recognized as one of the most reliable mechanistic correlations for predicting pressure drop in gas–liquid systems under high-pressure conditions [24]. Its implementation in PIPESIM allows accurate estimation of the vertical lift performance for CO2 injection and production scenarios.

Sensitivity Parameters

The sensitivity parameters influencing CO2 injectivity were defined as injection pressure, tubing size, reservoir permeability, reservoir pressure, and reservoir thickness. The base input values for the injection well Z model were derived from the DST report of the evaluation well Z, and the parameter ranges were established as shown in Table 2.
Injection pressure was analyzed at three levels: 1100 psia, 1650 psia, and 2000 psia, with 1100 psia adopted as the baseline. Tubing sizes ranged from 2.5 to 6.5 inch (corresponding to inner diameters (ID) of 1.548 to 5.548 inch), and the ID was the design basis. A tubing size of 3.548 inch was adopted as the base value.
Given that the Gas Field Z is still in production, predicting the reservoir pressure during CO2 injection remains difficult. Therefore, the reservoir pressure range was set between 1000 and 2000 psia, considering the minimum pressure required for supercritical CO2, with 1500 psia selected as the base value.
The reservoir permeability at the injection well Z was calculated to be 10.5 md; however, 10 md was used as the base value for sensitivity analysis, and multiples of this base value were evaluated. Finally, the reservoir thickness was measured as 64 m (209.97 ft), but 60 m (196.85 ft) was selected as the base case, and multiples thereof were analyzed.

2.3. CO2 Injection Scenario Design for Gas Field Z

To design a realistic CO2 injection scenario for field implementation, the total injection volume is first estimated based on the cumulative production and recovery of the target gas field. Once the amount of CO2 supplied from a capture facility is defined, the daily injection rate can be determined, thereby establishing the total injection period. Conversely, if the amount of CO2 supplied is not predetermined, the injection period may be set first, and the daily injection rate can be determined accordingly. Subsequently, the number of injection wells is determined, and the target daily injection rate per well is calculated. Injectivity analysis is then performed to verify whether each well can accommodate the target rate. Finally, specifications of the surface injection facilities, including compressor sizing, are selected based on the required injection pressure and rate per well.
In this study, several CO2 injection scenarios were designed for the Gas Field Z, following the procedure outlined above. The total CO2 injection rate was assumed to be 5 Tcf. The total CO2 injection volume was determined as approximately three to four times the cumulative gas production expected at the end of field life. Four injection periods were considered: 20, 15, 10, and 5 years. The number of injection wells was fixed at five, with each well modeled identically to the schematic shown in Figure 5. Based on prior sensitivity analyses, reservoir thickness and permeability for each well were assigned within the ranges of 150–350 ft and 5–25 md, respectively (Table 3).
The initial reservoir pressure before production was assumed to be 3600 psia, and the Formation Parting Pressure (FPP) was set to 1.6 times the initial reservoir pressure (5760 psia), following the empirical guideline proposed by Dake (1978) [25]. This correlation is commonly used in reservoir engineering to estimate fracture initiation pressure when detailed geomechanical data are unavailable. This value was considered as a reference upper limit to ensure that CO2 injection remained within safe operating conditions. Reservoir pressures used in the modeling ranged from 1000 psia upward, considering the minimum pressure required to maintain CO2 in a supercritical state. The tubing ID was fixed at 4.548 inch based on prior analysis, indicating that this size provided the highest unit injection rate.
Tubing and packer depths were customized for each well based on the top of the reservoir. Specifically, the tubing was positioned 10 m (~32.808 ft) above the reservoir top, while the packer was placed 50 m (~164.041 ft) above the reservoir top. For example, in Well 1, the reservoir thickness was 150 ft, placing the reservoir top 75 ft above the midpoint depth of 4869.587 ft and 4794.587 ft. Thus, the tubing and packer were set at 4764.787 ft and 4630.547 ft, respectively. This methodology was applied to all five wells, and the final configurations are summarized in Table 4.
In Scenario 1, with a 20-year injection period, the daily CO2 injection rate across all wells was calculated by dividing the total injection rate (5 tcf) by the total number of days (20 years × 365), resulting in 684.94 MMscfd (Equation (3)). This equation was defined in this study to convert the total injection volume into a daily rate for all wells under steady-state injection conditions.
D a i l y   I n j e c t i o n   R a t e   ( f o r   a l l   w e l l s ) = 5 t c f t o t a l in j e c t i o n p e r i o d × 365 d a y s
Given that the flow efficiency of Well 1 was 3750 ft·md, its proportional allocation of the total injection rate was approximately 21.79% (Equation (4)), corresponding to an injection rate of 149.29 MMscfd. Similar allocations were calculated for other wells based on their respective flow efficiencies (Table 4). This proportional distribution was determined using the formation coefficient method (also referred to as the KH-weighted allocation method), which assumes that the injection or production rate of each well is directly proportional to its permeability–thickness product ( k h ) under uniform pressure conditions [18,25,26].
I n j e c t i o n   R a t e   A l l o c a t i o n   ( % ) = k h k h × 100

3. Results

3.1. Sensitivity Analysis

3.1.1. Injection Pressure

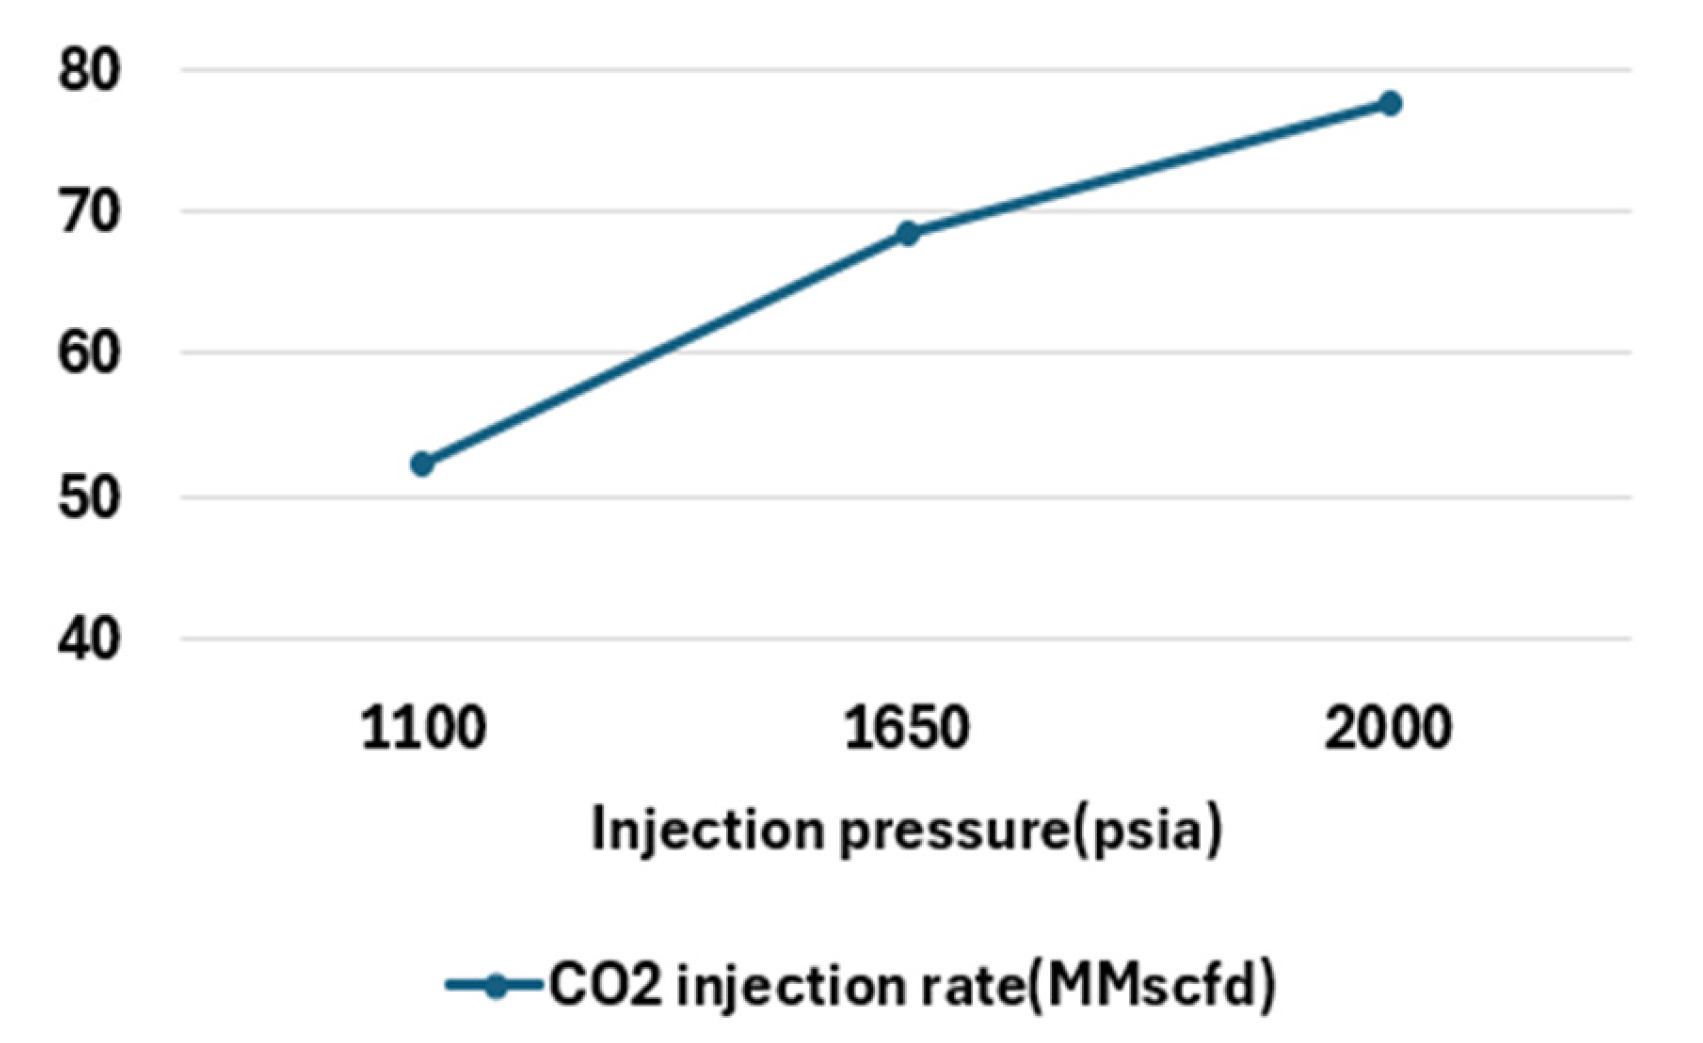
The injection pressure at well Z was determined based on the minimum requirement for maintaining supercritical CO2, with 1100 psia set as the lowest value. Sensitivity analysis was conducted for injection pressures of 1100, 1650, and 2000 psia. At 1100 psia, the BHP was 2417.13 psia, and the CO2 injection rate was 52.30 MMscfd (Figure 6). Increasing the injection pressure to 1650 psia raised the BHP to 2716.59 psia and the injection rate to 68.50 MMscfd. At 2000 psia, the BHP reached 2886.26 psia, with an injection rate of 77.60 MMscfd. These results confirm that higher injection pressure increases CO2 injection rates, with the trend consistent across the analyzed range (Figure 7).
However, excessive injection pressure may cause the BHP to exceed the FPP, creating a risk of reservoir fracturing. Additionally, tubing corrosion and gas hydrate formation may reduce injectivity. Thus, appropriate injection pressure must be selected by carefully considering the FPP.

3.1.2. Tubing Size

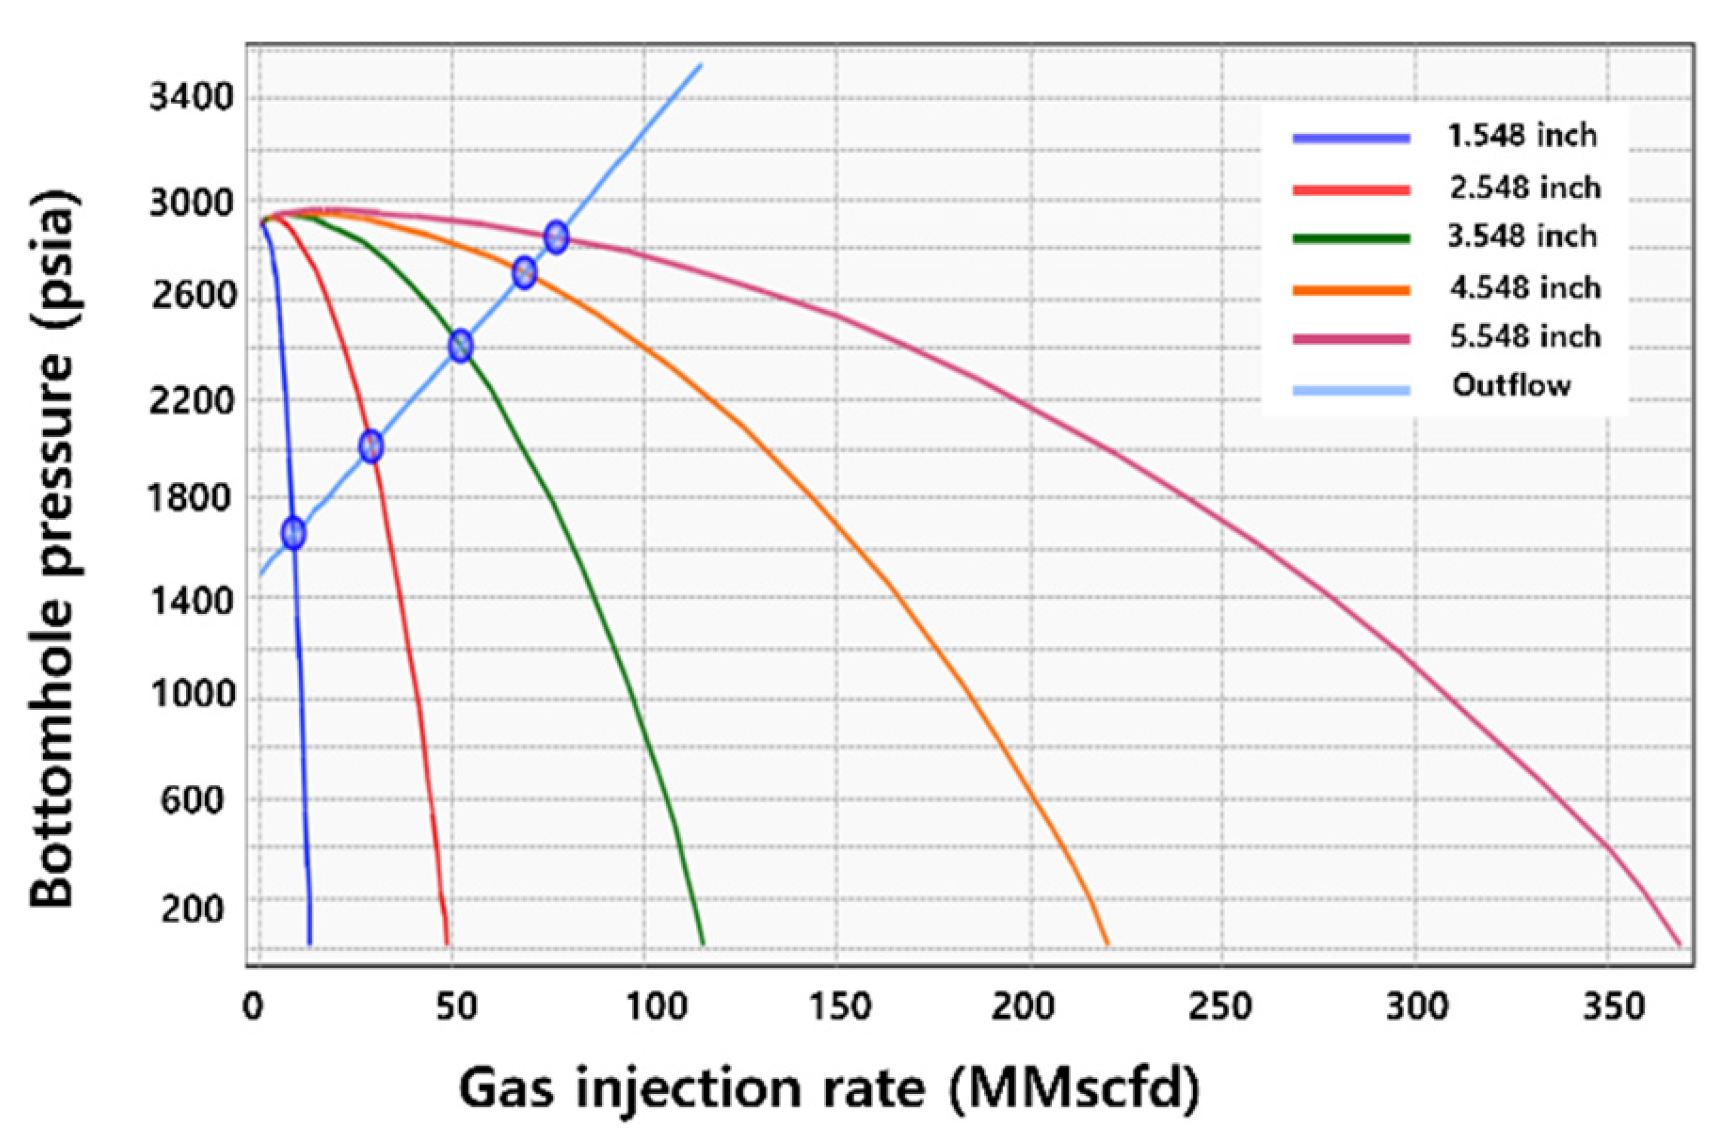
As shown in Figure 8, when the tubing ID was 1.548 inch, the BHP was 1658.53 psia, and the CO2 injection rate was 9.1 MMscfd, corresponding to a unit injection rate of 5.86 MMscfd per inch. With 2.548 inch, the BHP increased to 2005.61 psia, the injection rate to 28.90 MMscfd, and the unit rate to 11.35 MMscfd per inch, representing an approximately 93% increase over the 1.548 inch case.
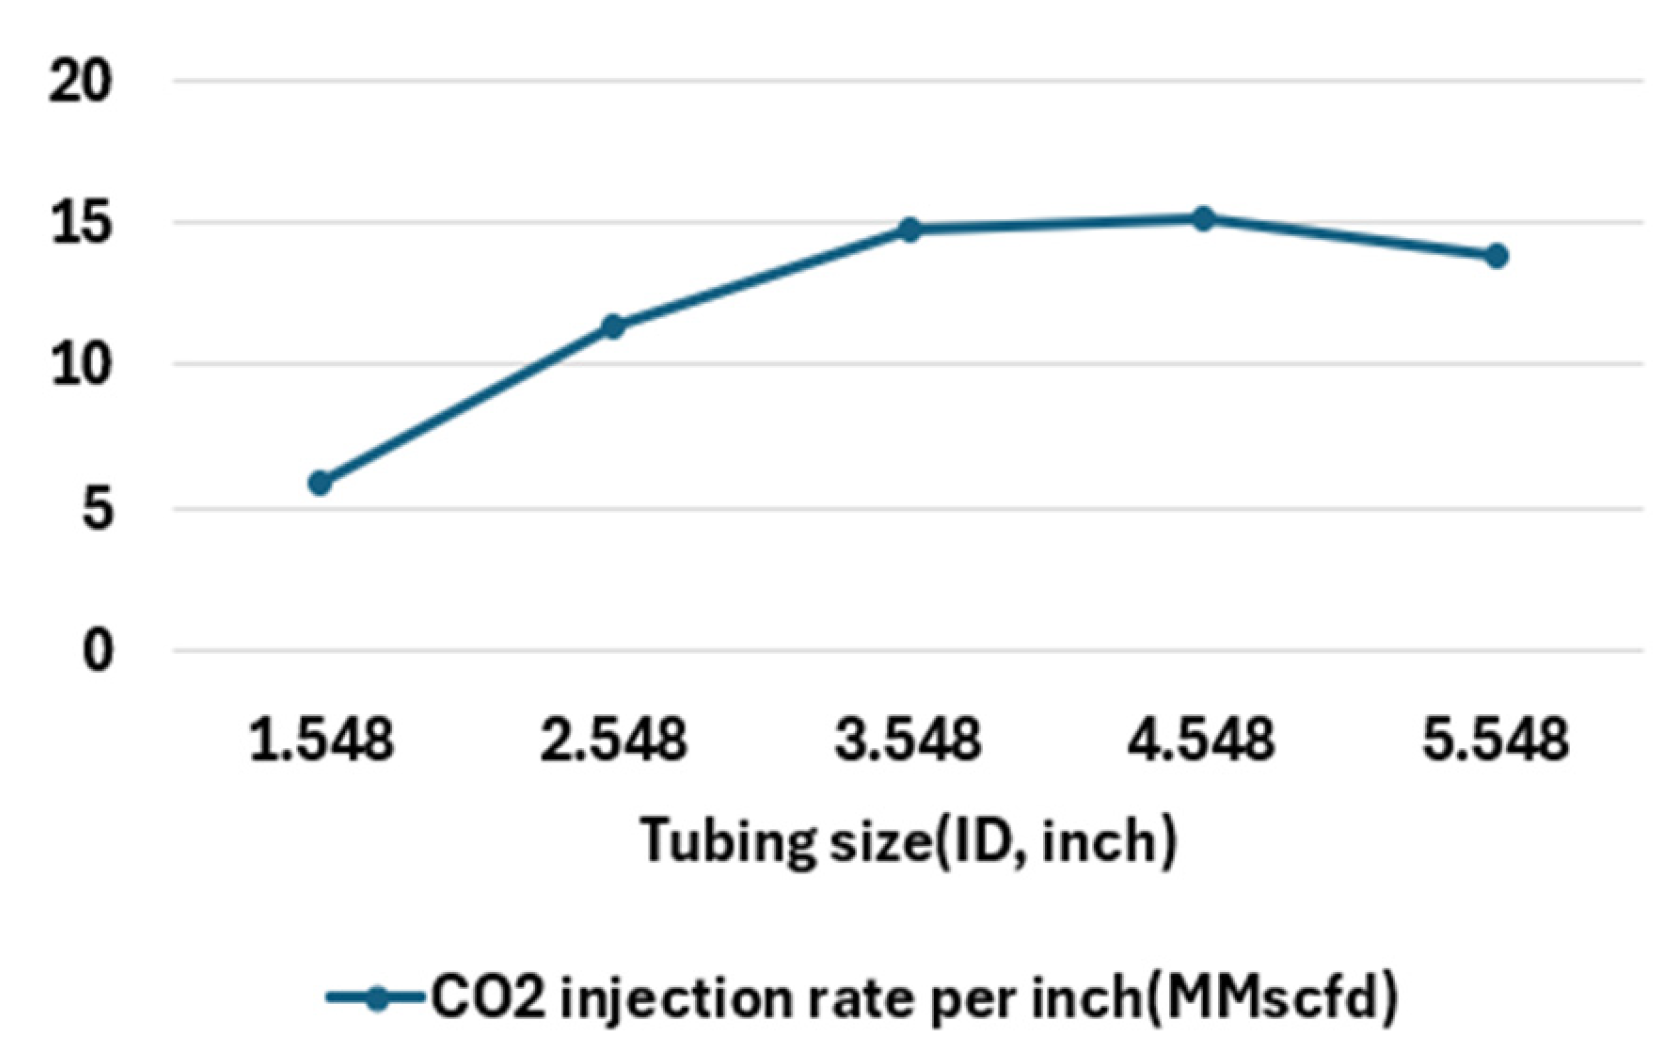
Subsequently, additional tubing sizes were analyzed using the same method. For 3.548 inch of tubing, the BHP was 2417.13 psia, the injection rate reached 52.30 MMscfd, and the unit injection rate was 14.73 MMscfd per inch, approximately 30% higher than that of the 2.548-inch case. For 4.548 inch, the BHP was 2708.16 psia, the injection rate was 68.73 MMscfd, and the unit injection rate was 15.11 MMscfd per inch, representing only a 3% increase compared to the 3.548-inch case. Finally, at a tubing diameter of 5.548 inch, the BHP was calculated to be 2852.08 psia, with an injection rate of 76.90 MMscfd and a unit injection rate of 13.86 MMscfd per inch, representing an 8% decrease compared with the 4.548-inch result (Figure 9).
Although larger tubing diameters yielded higher overall injection rates, analysis of the unit injection rate revealed that the 4.548 inch tube provided the highest CO2 injection efficiency per inch, making it the most optimal selection.

3.1.3. Reservoir Pressure

As the Gas Field Z is still in production, the reservoir pressure during CO2 injection cannot be precisely predicted. The minimum reservoir pressure was assumed to be 1000 psia, based on the minimum pressure condition for supercritical CO2. A sensitivity analysis was conducted at reservoir pressures of 1000, 1250, 1500, 1750, and 2000 psia.
At 1000 psia, the BHP was 2122.73 psia, and the CO2 injection rate was 64.54 MMscfd. At 1500 psia, the BHP was 2417.13 psia with an injection rate of 52.30 MMscfd. At 2000 psia, the BHP increased to 2674.77 psia while the injection rate decreased to 38.10 MMscfd. These results indicate that higher reservoir pressure leads to reduced CO2 injection rates, as shown in Figure 10.
However, excessively high injection rates may elevate the bottomhole pressure (BHP) beyond the FPP, potentially causing reservoir fracturing, CO2 leakage, or formation collapse [27,28]. Identifying the FPP through nodal analysis enables the determination of the critical BHP and corresponding reservoir pressure at the fracturing threshold. Conversely, as the depleted gas reservoir gradually equilibrates with the surrounding aquifer after production, a slow increase in reservoir pressure can be expected [29,30]. This pressure recovery reduces the pressure differential (ΔP = Pwf − Pr) that drives CO2 flow into the formation, thereby decreasing the achievable injection rate under a given wellhead or bottomhole pressure. Based on the sensitivity results, an increase in reservoir pressure from 1000 to 2000 psia lowered the CO2 injection rate by approximately 40%, indicating an average injectivity reduction of about 0.026 MMscfd per psi of pressure recovery. Conducting nodal analysis under these evolving reservoir conditions enables the prediction of CO2 injection rates at specific injection timings, providing a practical framework for designing long-term injection operations in depleted gas reservoirs [31].

3.1.4. Reservoir Permeability

Reservoir permeability can vary substantially even within the same gas field and plays a critical role in injection performance. Thus, permeability represents one of the most important parameters for analyzing injectivity.
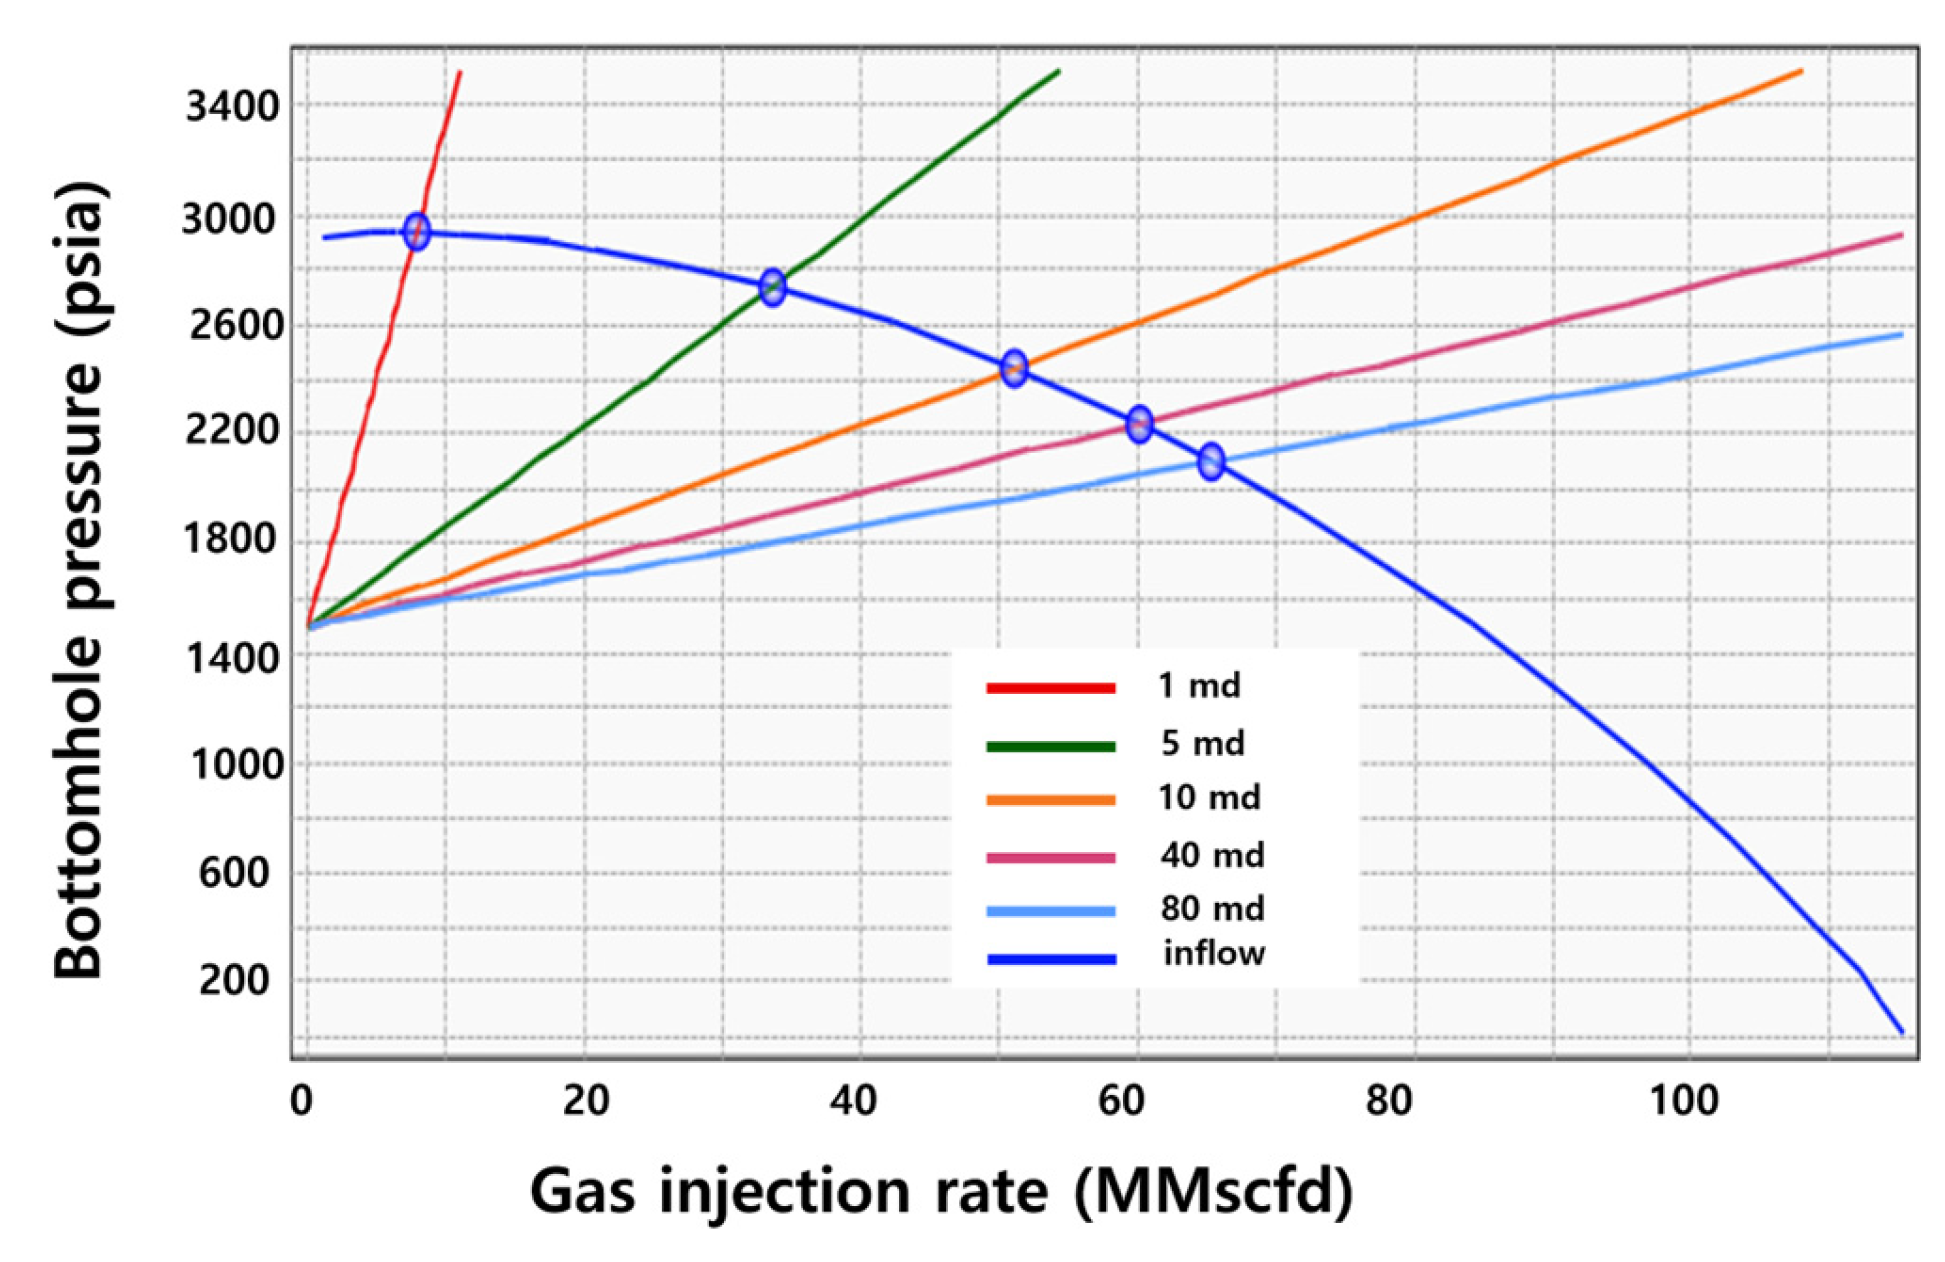
In this study, a sensitivity analysis was conducted using permeability values of 1, 5, 10, 40, 80, and 160 md. At 1 md, the BHP was 2940.30 psia, and the CO2 injection rate was 7.85 MMscfd. At 5 md, the BHP was 2739.08 psia, with an injection rate of 33.60 MMscfd. These results indicate that even in reservoirs with relatively low permeability, significant CO2 injection is possible if reservoir thickness is sufficiently large (209.97 ft in this case). This finding underscores the importance of considering both thickness and permeability when designing injection systems for gas fields.
As shown in Figure 11, the injection rate consistently increased with higher permeability, confirming a clear positive correlation.

3.1.5. Reservoir Thickness

Reservoir productivity is commonly represented by the product of permeability and thickness, referred to as flow efficiency. Higher flow efficiency corresponds to greater hydrocarbon productivity, and the same principle applies to CO2 injection. When reservoir permeability is held constant, an increase in reservoir thickness leads to higher flow efficiency, thereby increasing CO2 injection capacity.
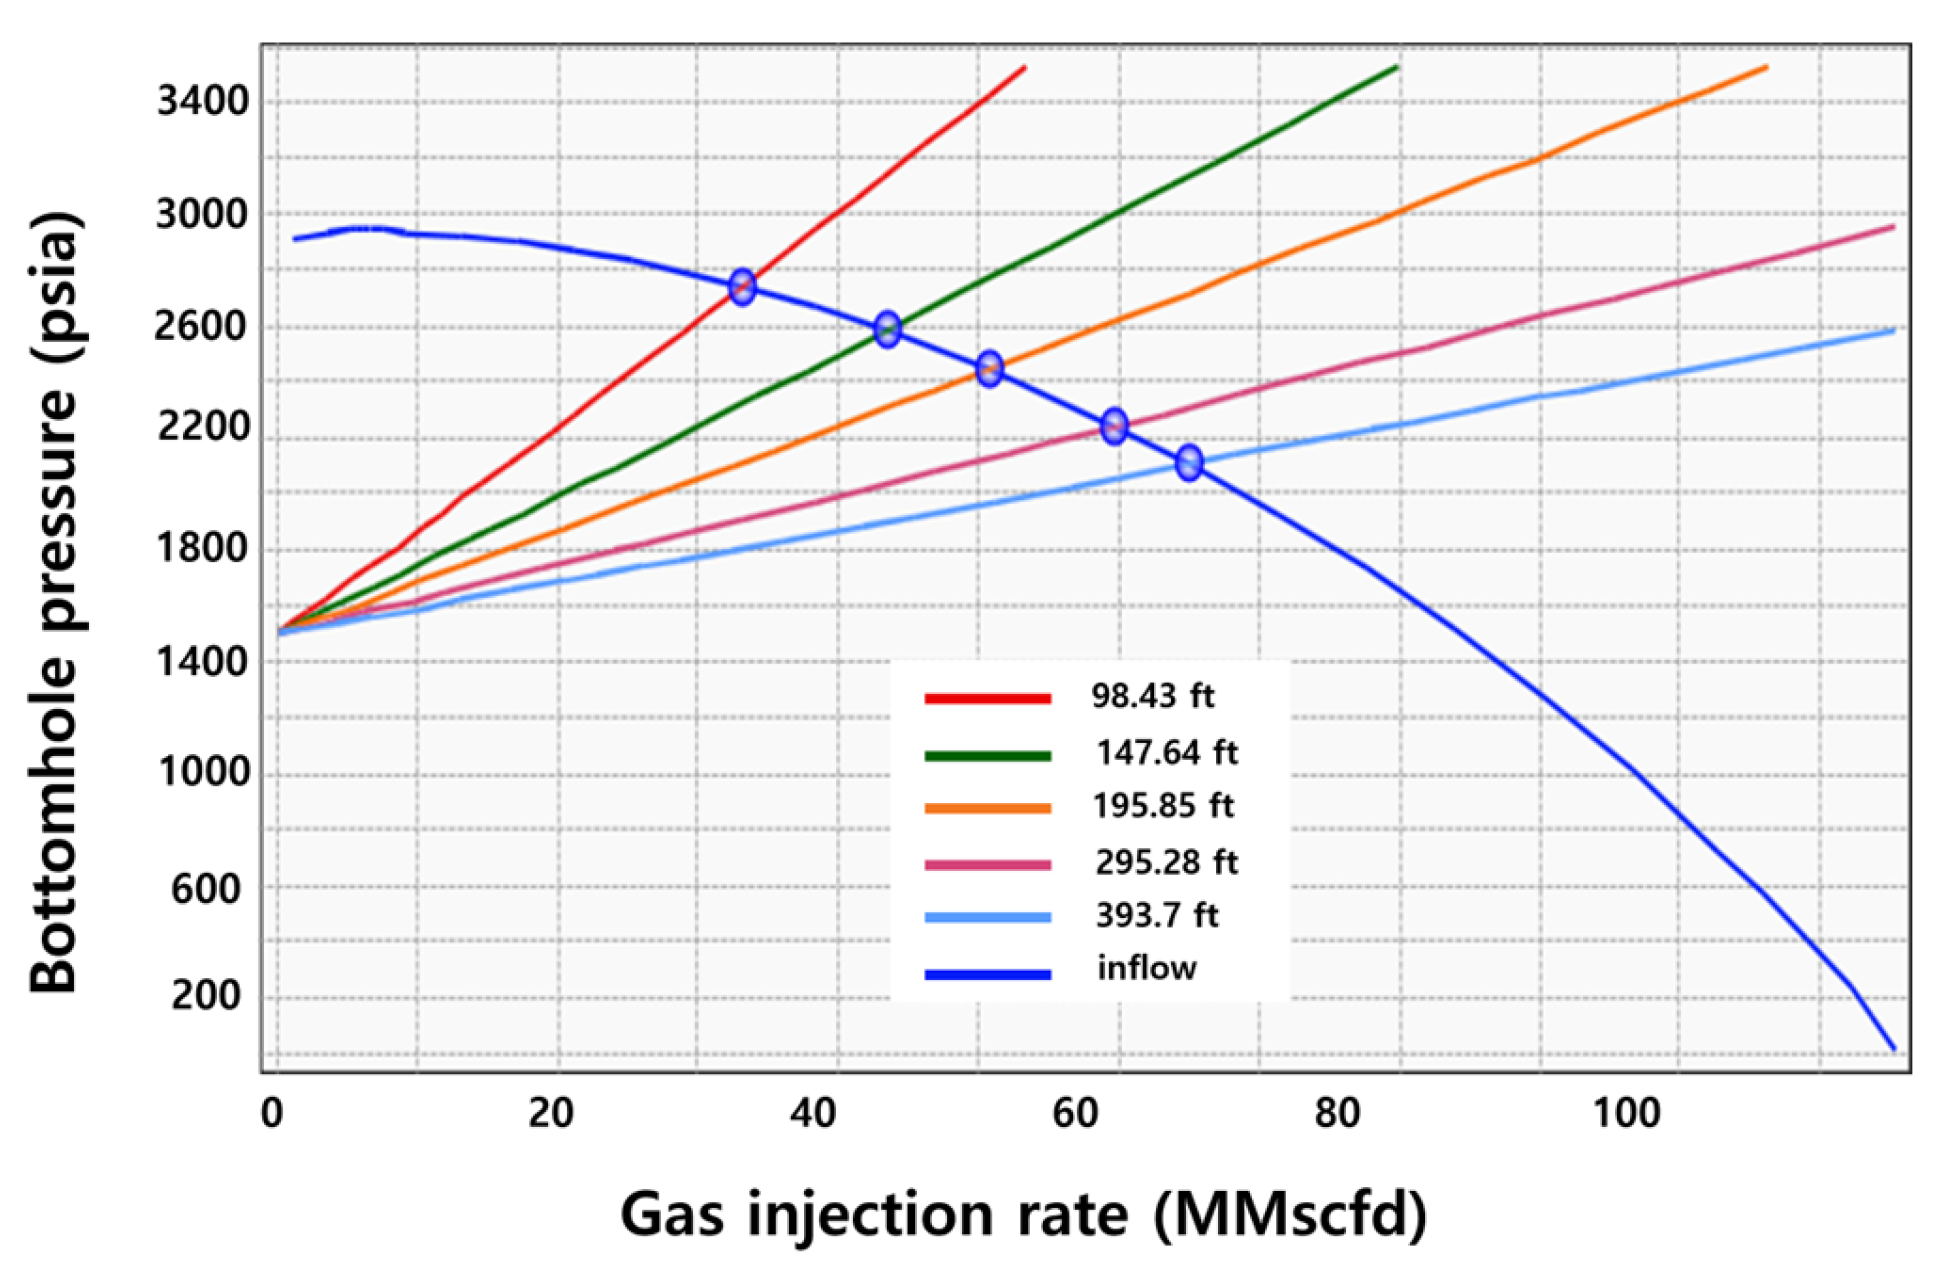
For the sensitivity analysis, five reservoir thickness values ranging from 98.42 ft to 393.7 ft were selected as input variables. At 98.42 ft, the BHP was 2744.36 psia, and the CO2 injection rate was 33.20 MMscfd. At 196.85 ft, the BHP was 2448.92 psia, and the injection rate was 50.73 MMscfd. At 393.7 ft, the BHP decreased to 2108.55 psia, while the injection rate rose to 65.07 MMscfd. These results, summarized in Table 5 and illustrated in Figure 12, demonstrate a consistent positive correlation between thickness and injection rate.
However, even with a large thickness, low permeability can limit flow efficiency and thus reduce injectivity. Therefore, both permeability and thickness must be considered comprehensively when selecting optimal injection well locations.

3.2. Results of CO2 Injection Scenario Design for Gas Field Z

As the injection progressed, the reservoir pressure increased incrementally from 1000 to 4500 psia in 500-psia steps. Injection and bottomhole pressure were computed for each scenario. Modeling was terminated when the BHP exceeded the FPP (5760 psia). Based on these conditions, Scenario 1 was evaluated up to a reservoir pressure of 4500 psia, Scenario 2 up to 4000 psia, Scenario 3 up to 3000 psia, and Scenario 4 up to 1000 psia.
Figure 13, Figure 14, Figure 15 and Figure 16 illustrate the injection and bottomhole pressure trends for each well as the reservoir pressure increased under different CO2 injection scenarios. In all scenarios, the BHP increased proportionally with reservoir pressure. However, the BHP values among wells were similar within each scenario, as daily injection rates were allocated according to flow efficiency (k·h), resulting in comparable BHPs across the wells.
Conversely, injection pressures varied significantly among the wells, despite following a generally increasing trend with reservoir pressure. This discrepancy arose because all wells used the same tubing size (ID = 4.548 inch), yet injection rate allocations varied. Wells assigned higher injection rates required higher injection pressures, resulting in greater pressure drops across the tubing.
In Scenario 4, all wells exceeded the FPP at a reservoir pressure of only 1000 psia, demonstrating that the target injection rates could not be achieved without inducing formation damage (Table 6). This scenario, which assumed a 5-year injection period, involved the highest daily injection rates per well. For instance, Well 3, which had the highest flow efficiency (5000 ft·md), was allocated a target injection rate of 796.22 MMscfd. Despite its high flow efficiency, Well 3 could not sustain this assigned rate due to the substantial pressure difference between the wellhead and bottomhole, which limited injectivity. Moreover, high injection pressures may induce phase changes or hydrate formation in the tubing due to steep pressure gradients, which can adversely affect injectivity. Therefore, these operational risks must be considered when designing the injection system.
In Scenario 1, Well 3 was allocated a lower rate of 199.05 MMscfd. At a reservoir pressure of 1000 psia, the required injection pressure was 3309.73 psia, and the corresponding BHP was 2471.37 psia (Table 7). As the injection progressed, both the injection pressure and the BHP increased proportionally. However, at a reservoir pressure of 4500 psia, the BHP exceeded the FPP, suggesting that injection at the target rate could fracture the formation. Further analysis indicated that the Well 3’s BHP reached 5760.078 psia at a reservoir pressure of 4229 psia. The average reservoir pressure at which BHP reached the FPP across all five wells in Scenario 1 was 4240.6 psia.
In Scenario 2, Well 3’s target rate increased to 265.40 MMscfd because of the shorter injection period (15 years). The reservoir pressure at which BHP reached the fracture pressure was 3727.50 psia (Table 8). In Well 5, with a target rate of 92.89 MMscfd, the BHP exceeded 5760.49 psia at a reservoir pressure of 3746.00 psia.
Scenario 3 results are shown in Table 9. For Well 3, the target injection rate was 398.11 MMscfd, and the BHP reached 5760.32 psia when the reservoir pressure was 2763.00 psia. Similarly, for Well 5, the BHP reached 5760.31 psia at a reservoir pressure of 2760.50 psia, corresponding to an injection rate of 139.34 MMscfd (Table 10).
Although nodal analysis enables estimation of optimal injection and bottomhole pressures, it does not directly determine the injection endpoint based on cumulative injection volume and FPP. However, this study demonstrates that it is possible to estimate the exact reservoir pressure at which fracturing occurs using nodal analysis. By integrating this pressure estimate with a material balance approach, both the total cumulative CO2 injection and the appropriate injection cutoff time can be determined.
Furthermore, injection performance was evaluated under different conditions. The reservoir injectivity index (RII), defined as the ratio of daily injection rate to the pressure difference between the reservoir pressure and BHP (Equation (5)), was calculated following the formulation proposed by Valluri et al. (2021) [32]. The RII was found to remain constant for each well across different scenarios and reservoir pressures This consistency arises because injection rates were proportionally allocated based on flow efficiency, resulting in nearly identical BHPs across wells.
R e s e r v o i r   I n j e c t i v i t y   I n d e x   = q P w f P r
where q represents the CO2 injection rate (MMscfd), Pwf represents the BHP (psia), and pr represents the reservoir pressure (psia).
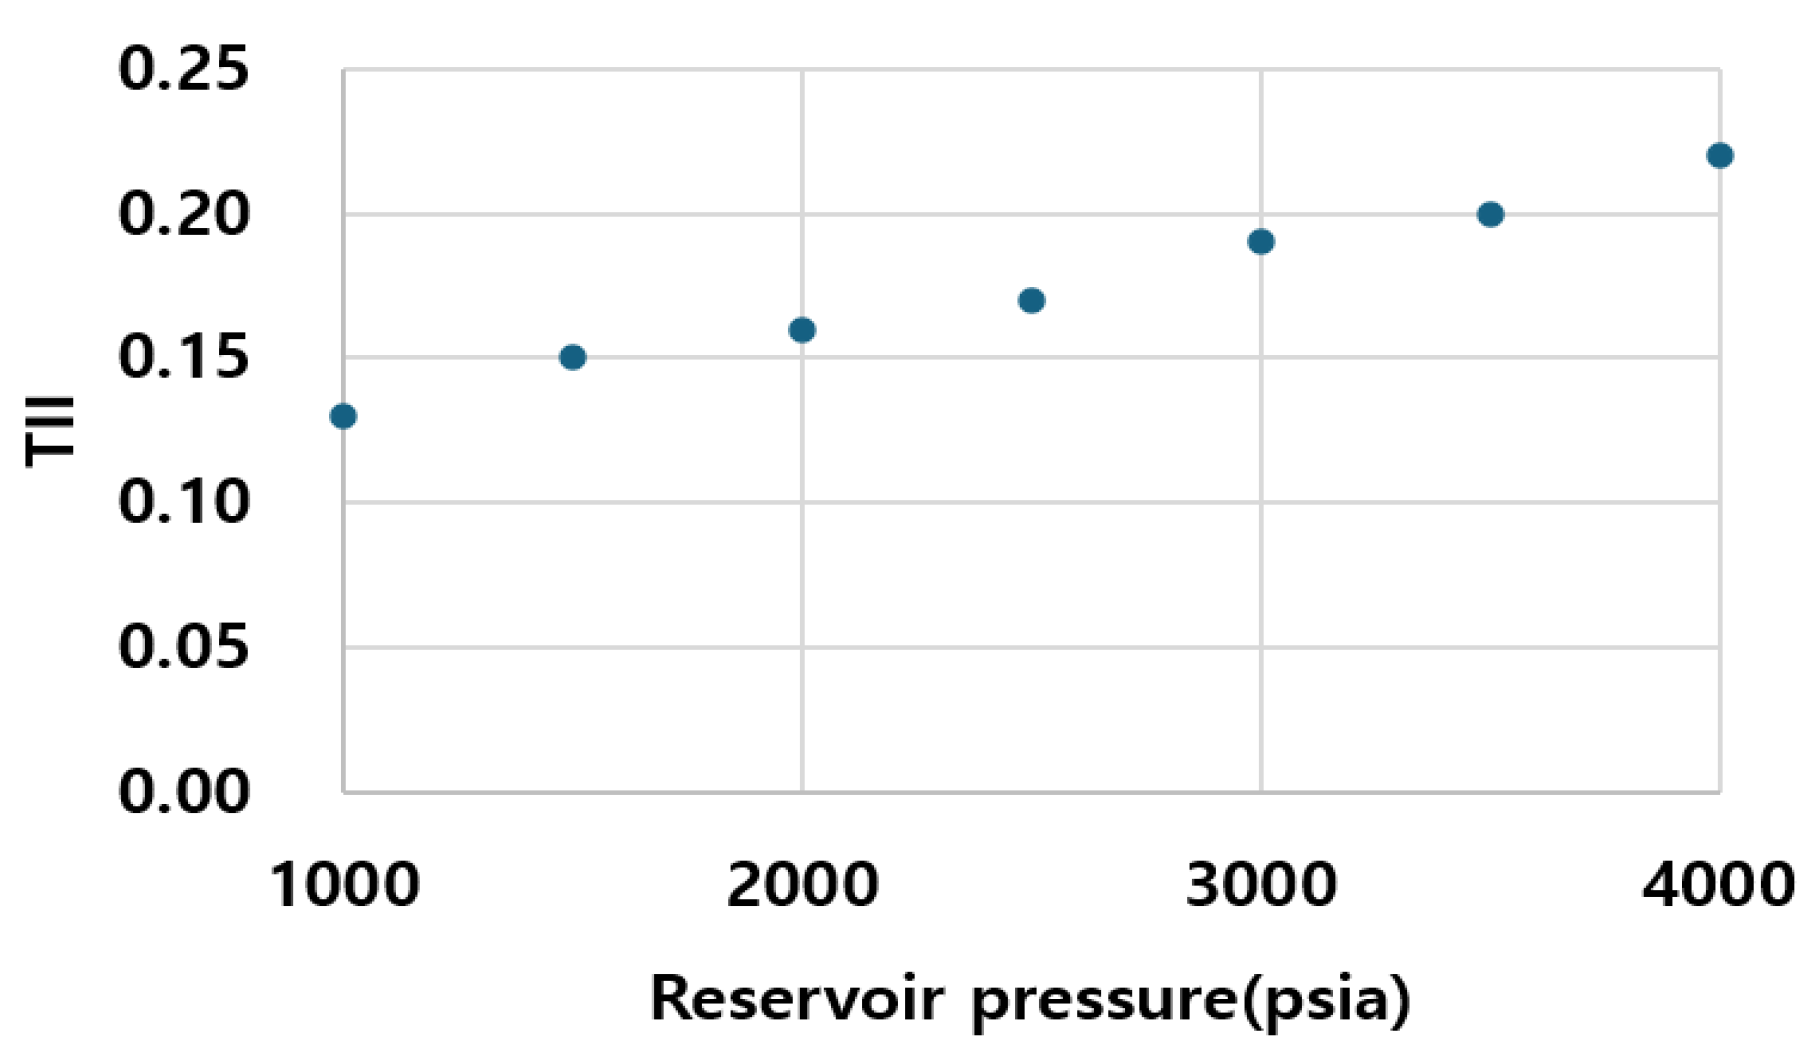
Next, the Tubing Injectivity Index (TII) was formulated by the authors based on the concept of the RII [32], to quantify the efficiency of vertical flow within the injection tubing. The TII was calculated using Equation (6) as the ratio of the injection rate to the pressure difference between the wellhead and bottomhole pressures:
T u b i n g   I n j e c t i v i t y   I n d e x   =   q P w h P w f
where Pwh represents the wellhead injection pressure (psia). A higher TII indicates improved injectivity efficiency. Specifically, TII increases as the pressure difference (Pwh − Pwf) decreases for a target injection rate.
Unlike the RII, which remained constant across scenarios and reservoir pressures, the TII varied significantly with both parameters. As shown in Figure 17, increasing reservoir pressure shifted the OPR curve upward, resulting in a higher BHP at the system operating point (that is, the intersection of the IPR and OPR curves). Consequently, the pressure difference (Pwh − Pwf) decreased, thereby increasing the TII.
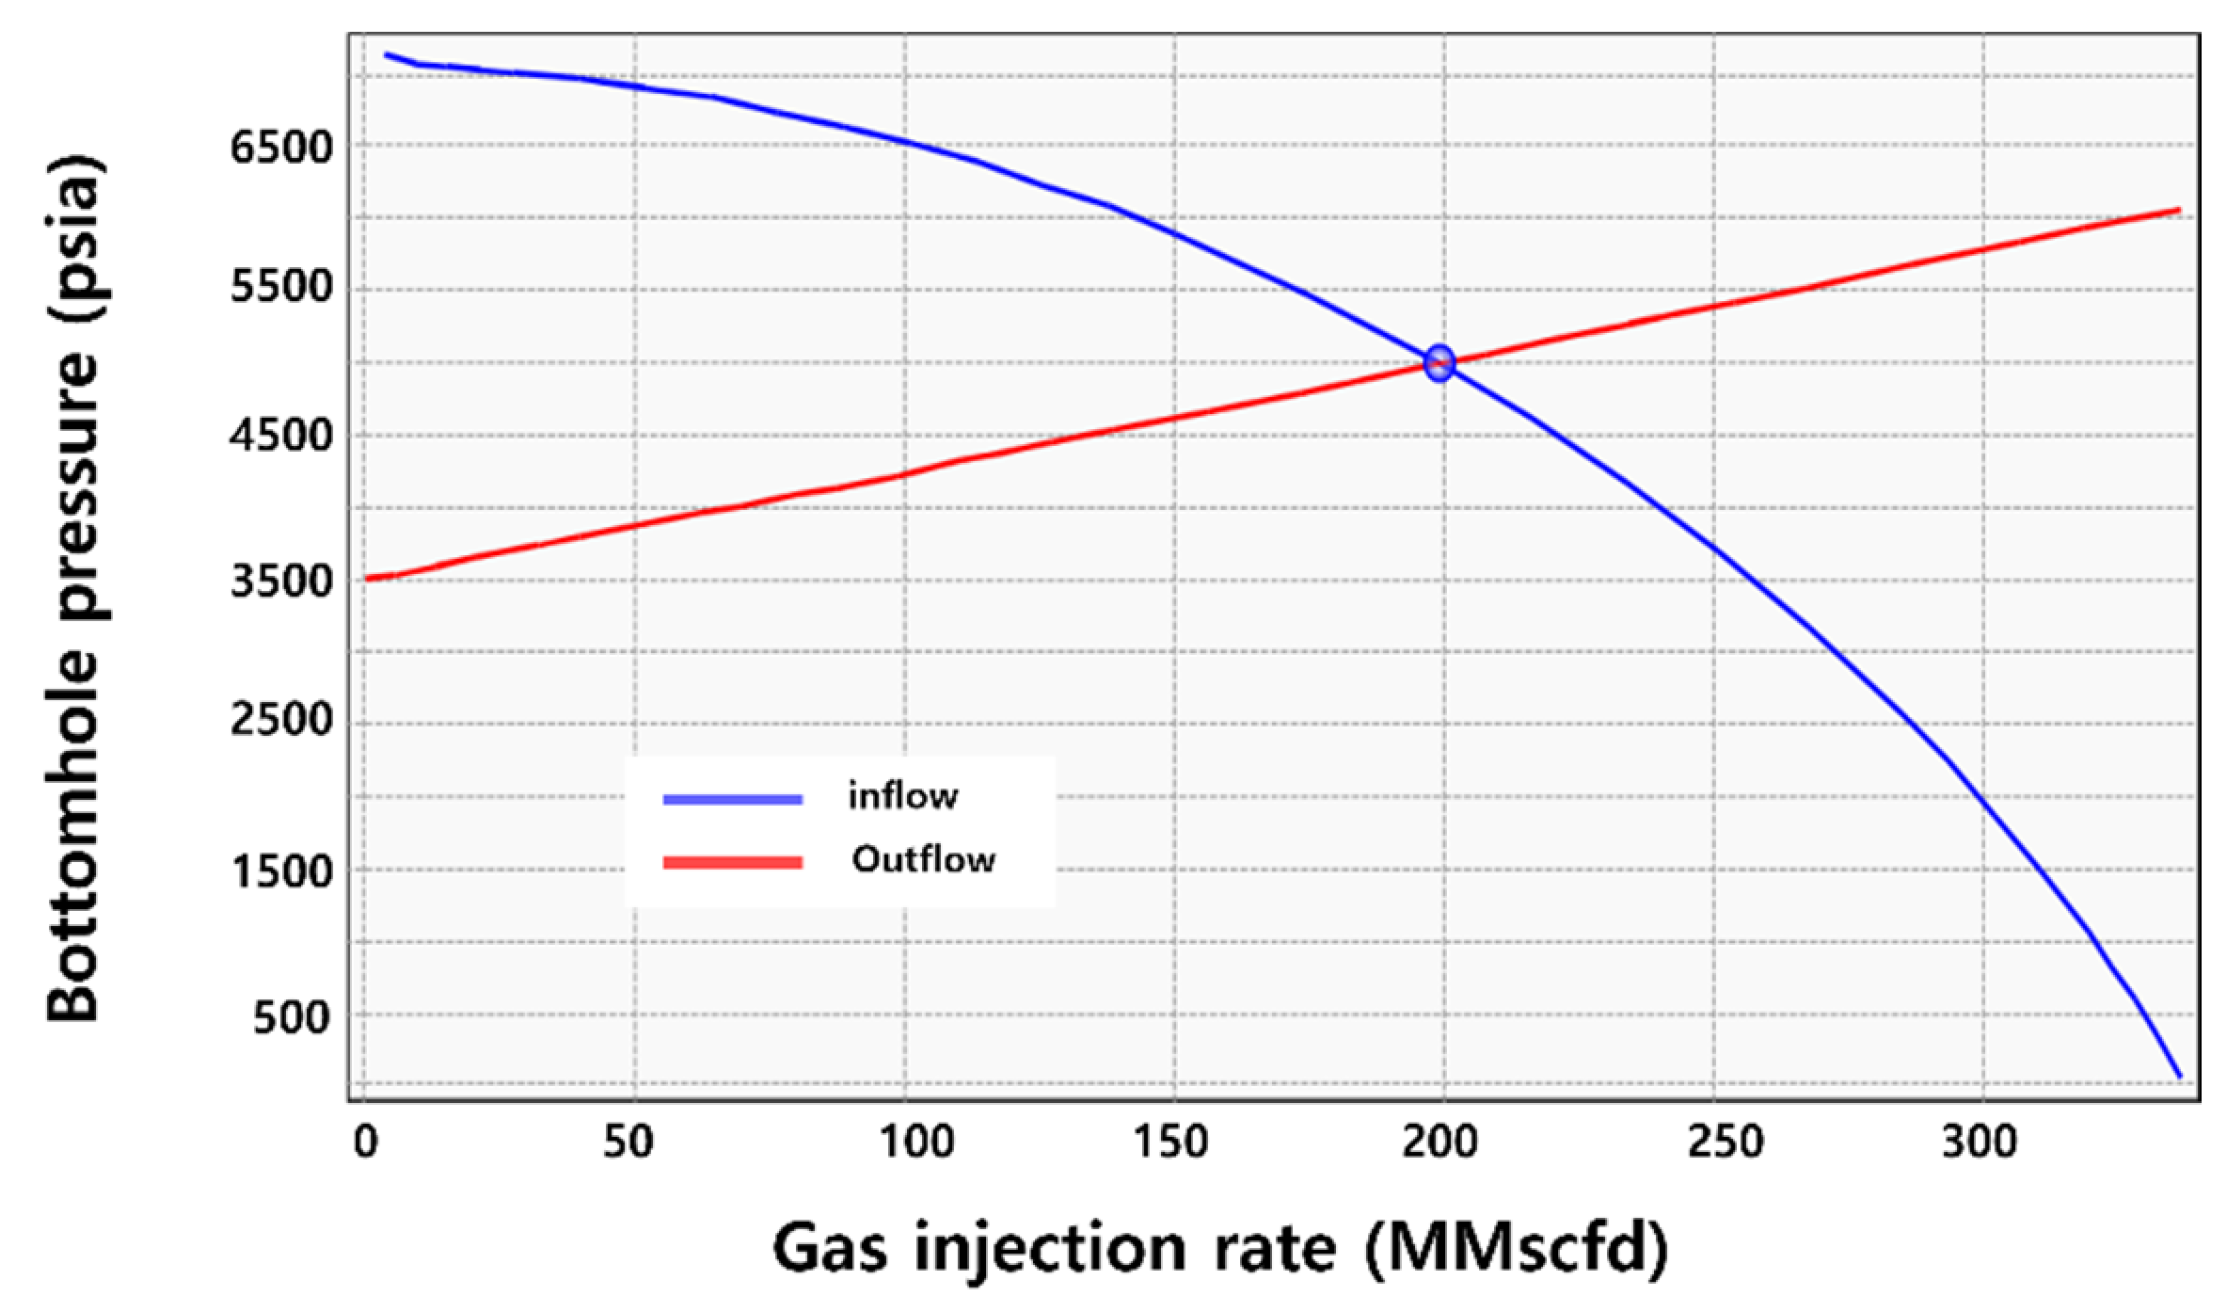
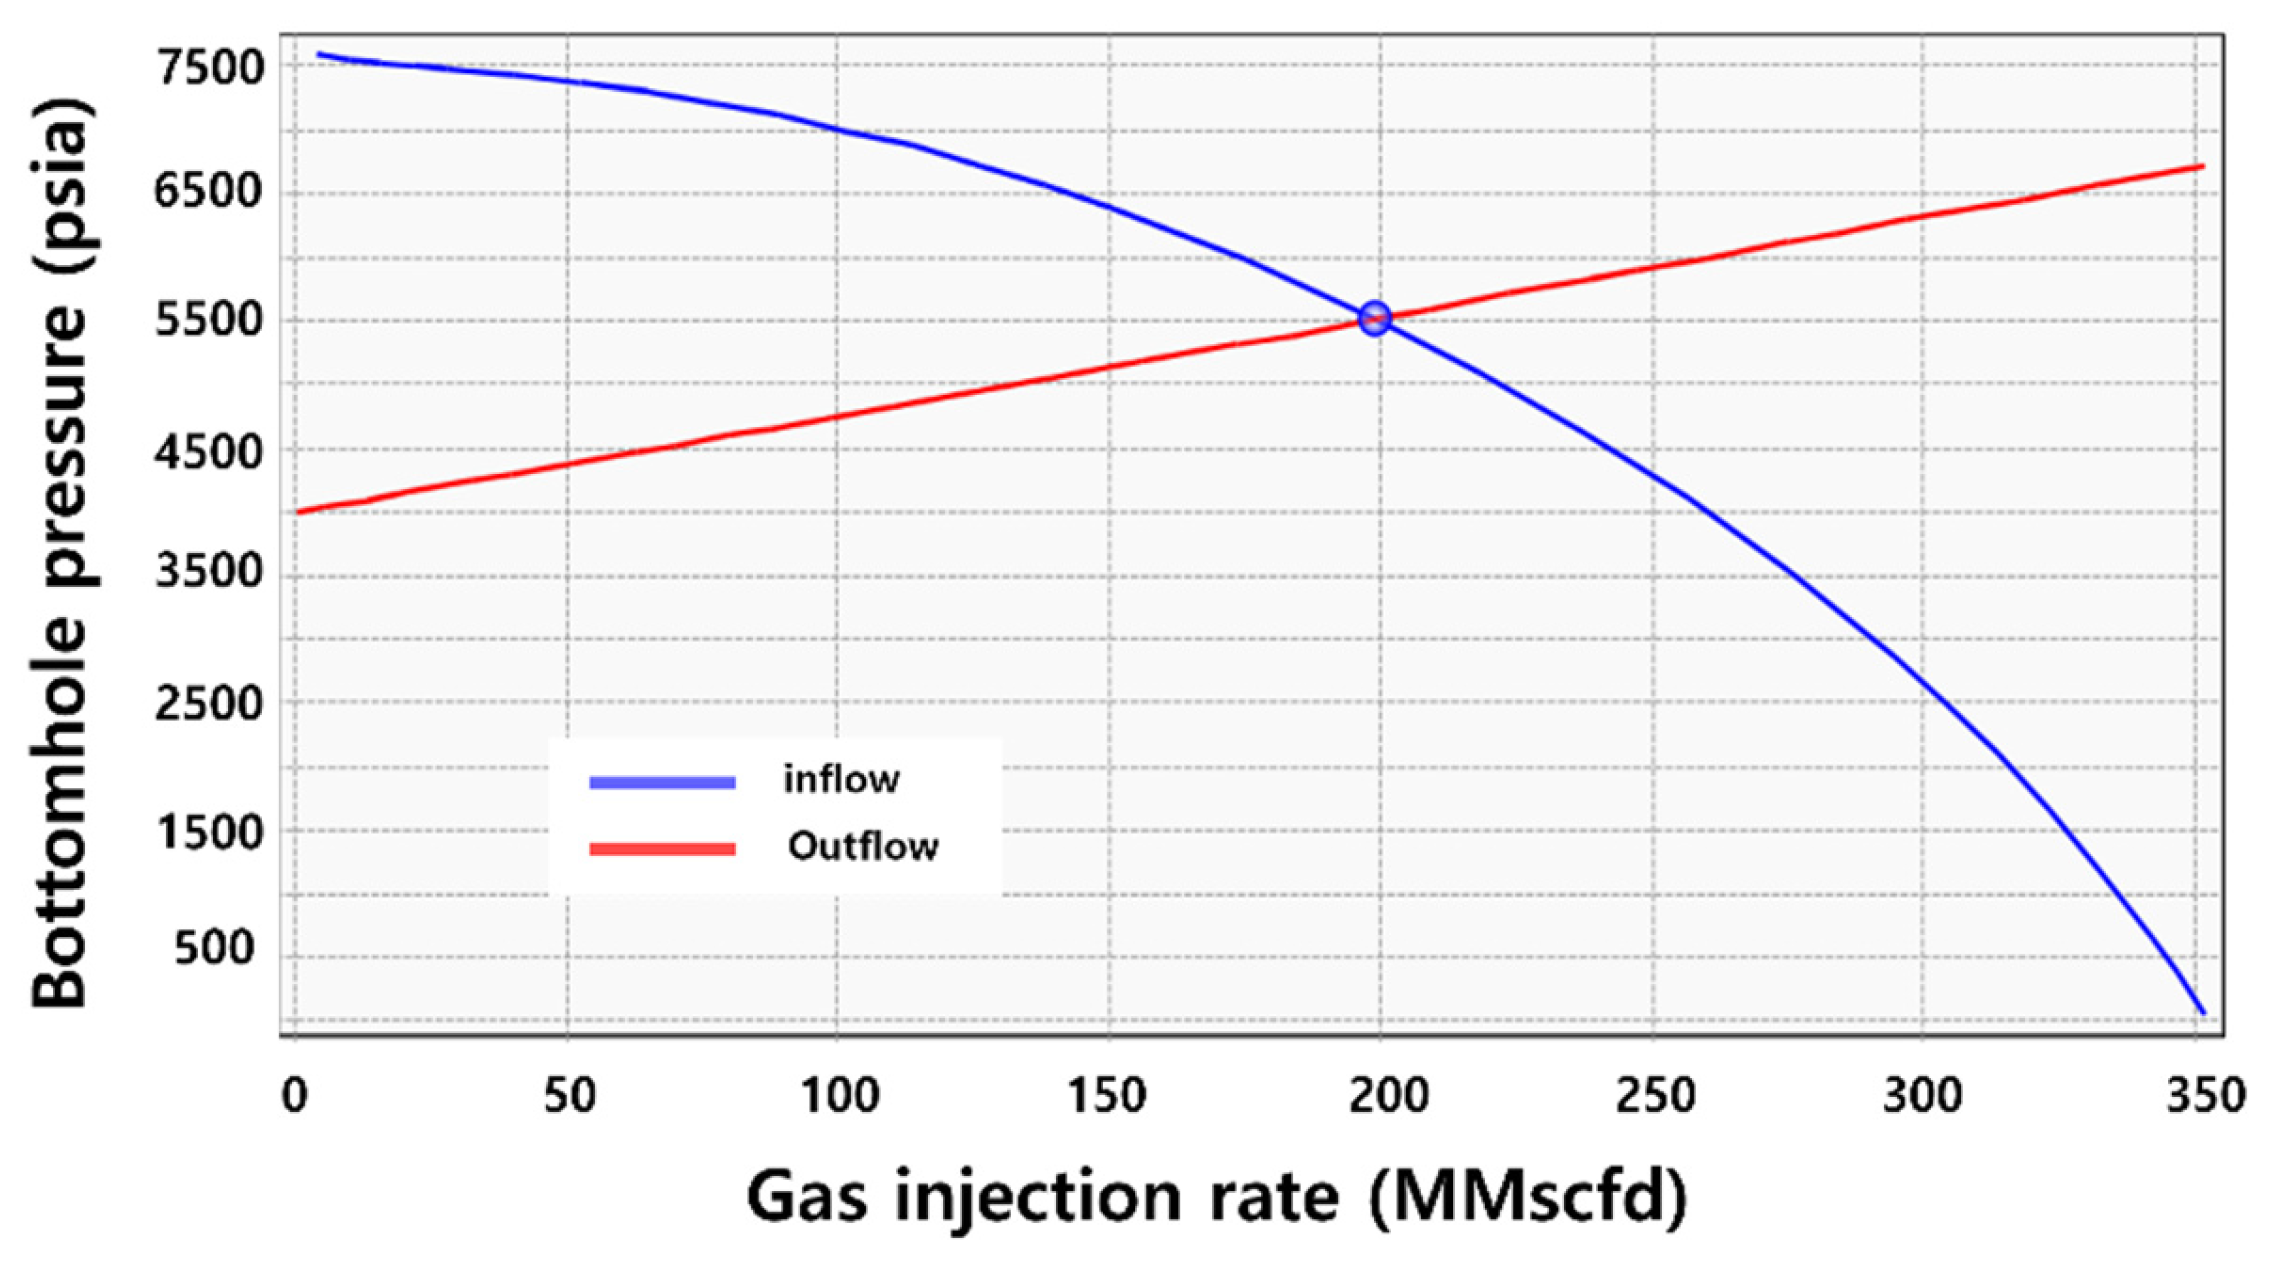
Figure 18 and Figure 19 illustrate the nodal analysis results for Well 3 in Scenario 1. At a reservoir pressure of 3500 psia, the TII was +2.31 MMscfd/psia, indicating a positive value. Conversely, at a reservoir pressure of 4000 psia, the TII was −39.98 MMscfd/psia, indicating a negative value. In both cases, the IPR and OPR curves intersected, confirming that an optimal injection rate and operating BHP could be identified.
Negative TII values observed in some wells and scenarios were not considered computational errors. Instead, they were attributed to the physical phenomena associated with injecting supercritical CO2 into deep wells. Supercritical CO2 is highly compressible and dense. During vertical injection, the hydrostatic column of CO2 can exert substantial hydrostatic pressure, potentially causing the BHP to exceed the wellhead pressure. This phenomenon has been reported in prior studies, particularly in deep-injection scenarios [33]. In depleted gas reservoirs, such as the one analyzed in this study, the high injection depth likely contributed to this reversal, where BHP surpassed the wellhead pressure.

4. Discussion

In this study, a CO2 injection modeling framework was developed using nodal analysis based on well test data from a depleted offshore gas field in Malaysia. Reservoir permeability was estimated from the reported AOF, and key input parameters were defined accordingly. A sensitivity analysis was conducted to evaluate the impact of key injection parameters, including injection pressure, tubing diameter, reservoir pressure, permeability, and thickness, on CO2 injectivity. Furthermore, field-scale scenarios were also designed and analyzed to assess the injection performance under various operational strategies.
The sensitivity analysis of reservoir pressure revealed that as reservoir pressure increased during injection, the CO2 injectivity decreased. This finding suggests that delayed injection after production termination may lead to pressure recovery and, consequently, reduced injectivity. Additionally, while greater reservoir thickness and higher permeability enhanced injection rates, flow efficiency was identified as a more reliable indicator of injectivity potential.
For Gas Field Z, a total CO2 injection of 5 Tcf and five injection wells were assumed. The target injection rates for each well were allocated proportionally based on flow efficiency. Four scenarios were defined by varying the total injection period, and nodal analysis was employed to compute the wellhead and BHPs. For each case, the reservoir pressure at which the BHP exceeded the FPP was determined. The analysis revealed that increasing reservoir pressure led to a proportional increase in BHP, which eventually exceeded the fracture pressure, particularly in scenarios involving high daily injection rates (for example, Scenario 4). In such cases, the required injection conditions were deemed infeasible. These findings underscore the need to design injection systems that simultaneously consider both the FPP limit and tubing flow characteristics.
Additionally, this study demonstrates that higher reservoir pressures shift the OPR curve upward, raising the BHP at the IPR–OPR intersection point. This reduces the pressure drop across the tubing (Pwh − Pwf), thereby increasing TII. The broader implication is that nodal analysis can be used not only for well performance assessment but also as a decision-making framework for evaluating operational feasibility under fracture pressure constraints.
While nodal analysis provided a reliable framework for estimating CO2 injectivity, it did not fully capture dynamic pressure variations or spatial heterogeneity within the reservoir. As a result, this study primarily focused on evaluating injectivity rather than storage capacity, and the migration behavior of the injected CO2 was not analyzed. Since nodal analysis alone cannot simulate the spatial distribution of CO2 or its long-term migration, future work will integrate nodal analysis with material balance and dynamic reservoir simulation to better predict total storage capacity and assess plume evolution under variable operating conditions.

5. Conclusions

This study highlights the applicability of nodal analysis for designing CO2 injection scenarios in depleted offshore gas reservoirs. The base-case analysis indicated an optimal injection rate of 52.30 MMscfd at a BHP of 2417.13 psia.
Sensitivity analysis on tubing size revealed that a 4.548-inch tubing diameter provided the most favorable hydraulic performance, yielding 15.11 MMscfd per inch, which was approximately 3% higher than the 3.548-inch case and 8% lower than the 5.548-inch case. It was confirmed that the 4.548-inch tubing was the most suitable configuration for the studied system.
Scenario analyses demonstrated that the 5-year injection case was infeasible due to excessive pressure buildup. The FPP was estimated at approximately 5760 psia, and in the 5-year injection scenario, the bottomhole pressure exceeded this limit during the initial injection stage, indicating a risk of fracturing the reservoir caprock. In contrast, 10-year or longer injection scenarios exhibited more gradual pressure increases, allowing injection to continue safely until the BHP approached but did not exceed the FPP. The TII analysis showed a gradual decline in injectivity with increasing reservoir pressure, emphasizing the importance of dynamic pressure management during long-term CO2 injection.
Overall, this study provides practical insights for optimizing CO2 injection design and operational strategies in depleted gas reservoirs. Future research will focus on incorporating chemical-assisted injection techniques and CO2–formation water–rock interactions into the simulation framework to enhance predictive accuracy, applicability, and long-term storage stability.

Author Contributions

S.K., as the principal investigator, takes the primary responsibility for this research. Y.A. performed the modeling and analysis. All authors have read and agreed to the published version of the manuscript.

Funding

This work was partly supported by Energy & Mineral Resources Development Association of Korea (EMRD) grant funded by the Korea government (MOTIE) (2021060001, Educational-Industrial Cooperation Consortium of Energy and Mineral Resources Development) and Technology development Program funded by the Ministry of SMEs and Startups (202300267289, Development of Corrosion inhibitor for High-temperature and high-pressure conditions in the oil and gas and blue hydrogen production).

Data Availability Statement

The datasets used and/or analyzed during the current study are available from the corresponding author upon reasonable request. The data are not publicly available due to [confidentiality agreements with the data provider and restrictions related to proprietary field information.].

Acknowledgments

This paper was written by using PIPESIM Software donated from SLB.

Conflicts of Interest

The authors declare no conflicts of interest.

References

  1. Global CCS Institute. Global Status of CCS 2021—CCS Accelerating to Net Zero; Global CCS Institute: Melbourne, Australia, 2021. [Google Scholar]
  2. International Energy Agency (IEA). Energy Technology Perspectives: Scenarios & Strategies to 2050; OECD/IEA: Paris, France, 2006. [Google Scholar]
  3. Cao, C.; Li, J.; Yang, Y.; Zhang, Z. A Review of CO2 Storage in View of Safety and Cost-Effectiveness. Energies 2020, 13, 600. [Google Scholar] [CrossRef]
  4. Kang, S.-G.; Song, Y.-H. R&D Trends and Future Utilization Plans of CO2 Geological Storage in Submarine Geological Structures. J. Korean Mar. Environ. Eng. 2008, 11, 24–34. (In Korean) [Google Scholar]
  5. Korea Institute of Ocean Science and Technology (KIOST). CO2, the Main Cause of Climate Change, Is Stored in the Ocean Subsurface. Available online: https://www.kiost.ac.kr/cop/bbs/BBSMSTR_000000000011/selectBoardArticle.do?nttId=16853 (accessed on 22 September 2025). (In Korean).
  6. Kim, H.-M.; Park, E.-J.; Synn, J.H.; Park, Y.-C. Geological Storage of Greenhouse Gas (CO2) and Rock Engineering Aspects. Tunn. Undergr. Space (J. Korean Soc. Rock Mech.) 2008, 18, 175–184. (In Korean) [Google Scholar]
  7. Asian Development Bank (ADB). Financial Report 2013: Management’s Discussion and Analysis and Annual Financial Statements; ADB: Manila, Philippines, 2013. [Google Scholar]
  8. Kang, S.-Y. Global CCS Trends and Policy Implications of Major Countries; POSRI Issue Report; POSCO Research Institute: Seoul, Republic of Korea, 2023. (In Korean) [Google Scholar]
  9. Afifi, M.; Ng, C.Y. Strategic Integration of Carbon Capture, Utilisation and Storage (CCUS) Technologies in Malaysia: Leveraging Existing Infrastructure for Sustainable Decarbonisation. In Proceedings of the SPE Asia Pacific CCUS Conference, Kuala Lumpur, Malaysia, 26–27 August 2025; Society of Petroleum Engineers: Richardson, TX, USA,, 2025. SPE-225913-MS. [Google Scholar]
  10. Jalil, M.A.; Chidambaram, P.; Yakup, M.H.; Affandi, R.A. CO2 Injection Strategies in a Depleted Multi-Stacked Clastic Gas Reservoirs: A Case Study of Carbon Capture and Storage Project Offshore Peninsular Malaysia. In Proceedings of the SPE Asia Pacific CCUS Conference, Kuala Lumpur, Malaysia, 26–27 August 2025; Society of Petroleum Engineers: Richardson, TX, USA,, 2025. SPE-225914-MS. [Google Scholar]
  11. Putra, I.W.E.; Anuar, N.K.; Nesan, T.P.; Ahmad, W.Z.; Yunus, M.J.; Johar, J.M.; Sidek, A.M.M. Overcoming the Challenges of Developing High CO2 Gas Fields with Carbon Capture and Sequestration (CCS) in Malaysia. In Proceedings of the SPE Asia Pacific CCUS Conference, Kuala Lumpur, Malaysia, 26–27 August 2025; Society of Petroleum Engineers: Richardson, TX, USA,, 2025. SPE-225836-MS. [Google Scholar]
  12. Offshore Energy. Malaysia: PETRONAS, Total to Study K5 Field Development—K5 Sour Gas up to ~70% CO2; Offshore Energy: Schiedam, The Netherlands, 2022. [Google Scholar]
  13. ERIA (Economic Research Institute for ASEAN and East Asia). Geological Storage Potential of CO2 in Southeast Asia—Malay, Sarawak, and Sabah Basins; ERIA Report; ERIA (Economic Research Institute for ASEAN and East Asia): Jakarta, Indonesia, 2021. [Google Scholar]
  14. Wu, J.; Ansari, U. From CO2 Sequestration to Hydrogen Storage:Further Utilzation of Depleted Gas Reservoir. Reserv. Sci. 2025, 1, 19–35. [Google Scholar] [CrossRef]
  15. Cao, L.; Lv, M.; Li, C.; Sun, Q.; Wu, M.; Xu, C.; Dou, J. Effects of Crosslinking Agents and Rservoir Conditions on the Propagation of Fractures in Coal Reservoirs During Hydraulic Fracturing. Reserv. Sci. 2025, 1, 36–51. [Google Scholar] [CrossRef]
  16. Ilyushin, Y.; Nosova, V.; Krauze, A. Application of Systems Analysis Methods to Construct a Virtual Model of the Field. Energies 2025, 18, 1012. [Google Scholar] [CrossRef]
  17. Beggs, H.D. Production Optimization Using Nodal Analysis; OGCI Publications: Tulsa, OK, USA, 1991. [Google Scholar]
  18. Ahmed, T. Reservoir Engineering Handbook, 5th ed.; Gulf Professional Publishing: Houston, TX, USA, 2019. [Google Scholar]
  19. IPCC. IPCC Special Report on Carbon Dioxide Capture and Storage; Cambridge University Press: Cambridge, UK, 2005. [Google Scholar]
  20. An, Y. A Study on CO2 Injectivity with Nodal Analysis in Depleted Oil and Gas Reservoirs. Master’s Thesis, Dong-A University, Busan, Republic of Korea, 2023. Available online: https://www.riss.kr/link?id=T16944284 (accessed on 10 October 2025). (In Korean).
  21. Lee, J.-H.; Park, Y.-C.; Kwon, S.-I.; Lee, Y.-S.; Wang, J.-H.; Jang, Y.-H.; Son, H.-A.; Jang, H.-C.; Sung, W.-M. CCS—Geological Storage Technology for Carbon Neutrality Era; CIR: Seoul, Republic of Korea, 2022; ISBN 979-11-6856-069-7. Available online: https://product.kyobobook.co.kr/detail/S000061585389 (accessed on 12 October 2025). (In Korean)
  22. Al-Hussainy, R.; Ramey, H.J.; Crawford, P.B. The Flow of Real Gases Through Porous Media. J. Pet. Technol. 1966, 18, 624–636. [Google Scholar] [CrossRef]
  23. Guo, B.; Lyons, W.C.; Ghalambor, A. Petroleum Production Engineering: A Computer-Assisted Approach; Gulf Professional Publishing: Houston, TX, USA, 2007. [Google Scholar]
  24. Hagedorn, A.R.; Brown, K.E. Experimental Study of Pressure Gradients Occurring During Continuous Two-Phase Flow in Small-Diameter Vertical Conduits. J. Pet. Technol. 1965, 17, 475–484. [Google Scholar] [CrossRef]
  25. Dake, H.P. Fundamentals of Reservoir Engineering; Elsevier: Amsterdam, The Netherlands, 1978. [Google Scholar]
  26. Cheng, G.; Zhao, W.; Li, J.; Zhang, C. A Novel Approach to Production Allocation for Multi-Layer Commingled Tight Gas Wells: Insights from the Ordos Basin, NW China. Energies 2025, 18, 456. Available online: https://doi.org/10.3390/en18030456 (accessed on 10 November 2025). [CrossRef]
  27. Rutqvist, J. The Geomechanics of CO2 Storage in Deep Sedimentary Formations. Geotech. Geol. Eng. 2012, 30, 525–551. [Google Scholar] [CrossRef]
  28. Buscheck, T.A.; Bielicki, J.M.; White, J.A.; Sun, Y.; Hao, Y.; Bourcier, W.L.; Carroll, S.A.; Aines, R.D. Pre-Injection Brine Production in CO2 Storage Reservoirs: An Approach to Augment the Development, Operation, and Performance of CCS While Generating Water. Int. J. Greenh. Gas Control 2016, 54, 499–512. Available online: https://doi.org/10.1016/j.ijggc.2016.04.018 (accessed on 10 November 2025). [CrossRef]
  29. Michael, K.; Neal, P.R.; Allinson, G.; Ennis-King, J.; Hou, W.; Paterson, L.; Sharma, S.; Aiken, T. Injection Strategies for Large-Scale CO2 Storage Sites. Energy Procedia 2011, 4, 4267–4274. [Google Scholar] [CrossRef]
  30. Bachu, S. Review of CO2 Storage Efficiency in Deep Saline Aquifers. Int. J. Greenhouse Gas Control 2015, 40, 188–202. [Google Scholar] [CrossRef]
  31. Benson, S.M.; Cole, D.R. CO2 Sequestration in Deep Sedimentary Formations. Elements 2008, 4, 325–331. [Google Scholar] [CrossRef]
  32. Valluri, M.; Mishra, S.; Ravi Ganesh, P. Injectivity Index: A Powerful Tool for Characterizing CO2 Storage Reservoirs—A Technical Note. Greenh. Gases Sci. Technol. 2021, 11, 251–265. [Google Scholar] [CrossRef]
  33. Kristensen, M.; De Gennaro, V.; Dumont, H.; Gisolf, A.; Dubost, F.-X. A New Method for CO2 Injectivity Evaluation: Feasibility Modeling and Sensitivity Analysis. In Proceedings of the GHGT-17, Calgary, AB, Canada, 20–24 October 2024; SSRN: Rochester, NY, USA, 2024. [Google Scholar]
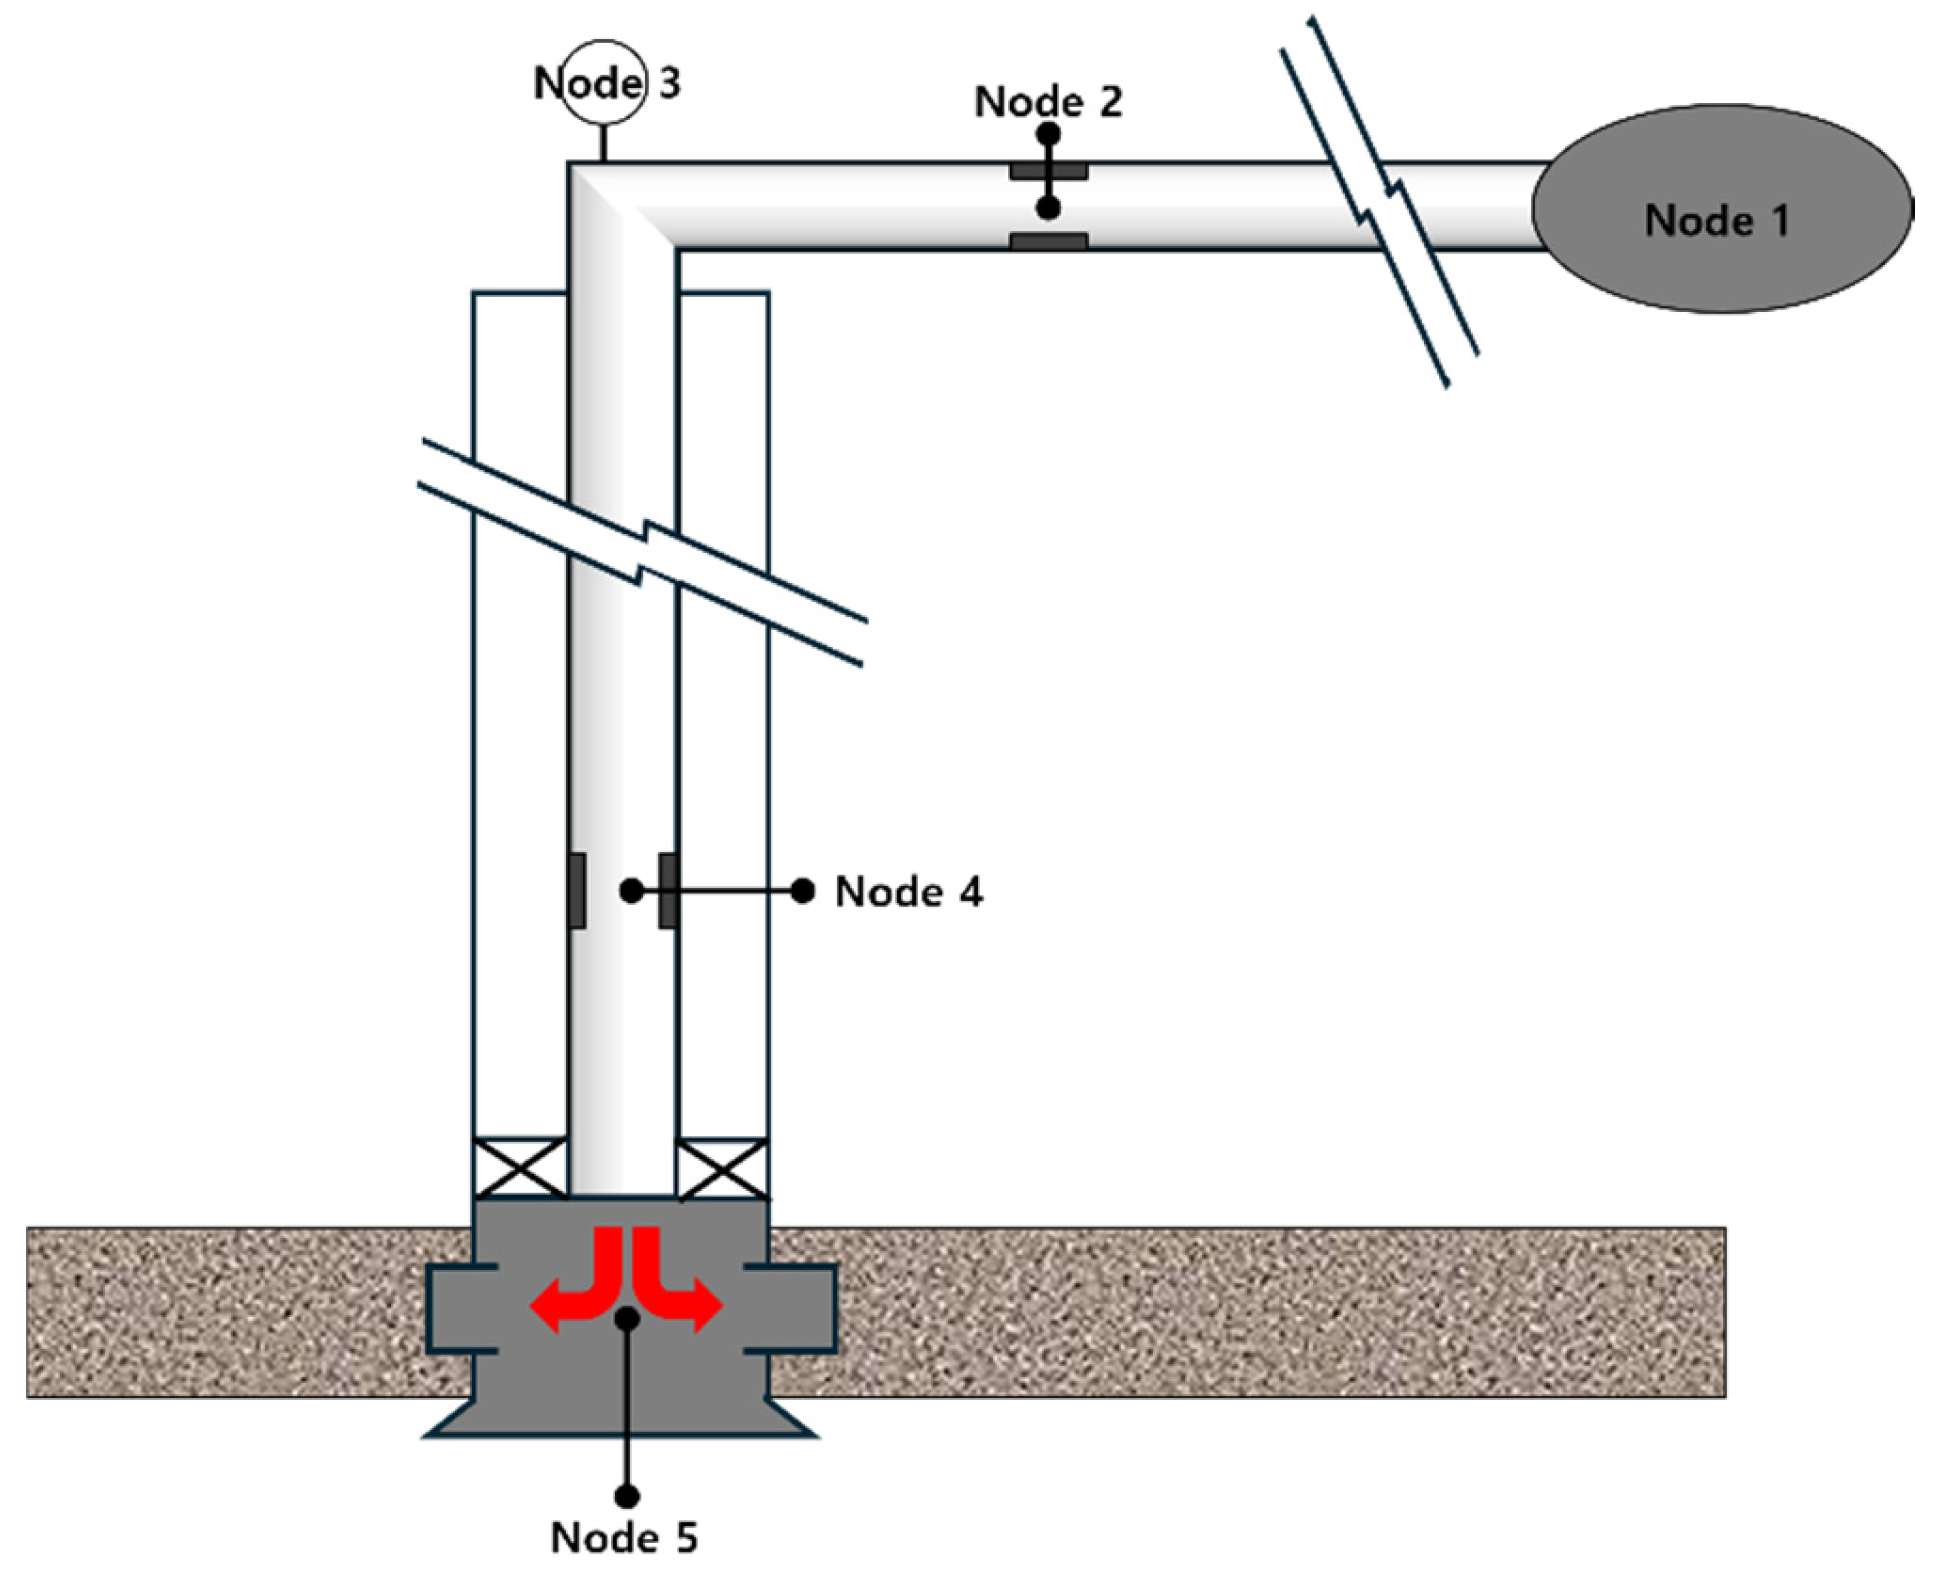
Figure 1. Examples of possible nodes in CO2 injection nodal analysis.
Energies 18 05983 g001
Figure 2. Example graph of CO2 injection nodal analysis.
Energies 18 05983 g002
Figure 3. Injection well model made using PIPESIM.
Energies 18 05983 g003
Figure 4. IPR curve of Well Z.
Energies 18 05983 g004
Figure 5. Nodal analysis result for the base case in injection Well Z. The circle indicates the intersection point between the IPR and OPR curves, which represents the optimal CO2 injection rate for the system.
Energies 18 05983 g005
Figure 6. Nodal analysis result for Well Z at a CO2 injection pressure of 1100 psia. The circle indicates the intersection point between the IPR and OPR curves, which represents the optimal CO2 injection rate for the system.
Energies 18 05983 g006
Figure 7. CO2 injection rates of Well Z at varying injection pressures.
Energies 18 05983 g007
Figure 8. Nodal analysis results of tubing size sensitivity analysis of Well Z. The circle indicates the intersection point between the IPR and OPR curves, which represents the optimal CO2 injection rate for the system.
Energies 18 05983 g008
Figure 9. CO2 injection rates per tubing size from sensitivity analysis of Well Z.
Energies 18 05983 g009
Figure 10. Nodal analysis results of reservoir pressure sensitivity analysis for Well Z. The circle indicates the intersection point between the IPR and OPR curves, which represents the optimal CO2 injection rate for the system.
Energies 18 05983 g010
Figure 11. Nodal analysis results of reservoir permeability sensitivity analysis for Well Z. The circle indicates the intersection point between the IPR and OPR curves, which represents the optimal CO2 injection rate for the system.
Energies 18 05983 g011
Figure 12. CO2 injection rates from reservoir thickness sensitivity analysis of Well Z. The circle indicates the intersection point between the IPR and OPR curves, which represents the optimal CO2 injection rate for the system.
Energies 18 05983 g012
Figure 13. Injection pressure and BHP in Scenario 1.
Energies 18 05983 g013
Figure 14. Injection pressure and BHP in Scenario 2.
Energies 18 05983 g014
Figure 15. Injection pressure and BHP in Scenario 3.
Energies 18 05983 g015
Figure 16. Injection pressure and BHP in Scenario 4.
Energies 18 05983 g016
Figure 17. TII results for Well 3 in Scenario 2.
Energies 18 05983 g017
Figure 18. Nodal analysis result for Well 3 in Scenario 1 at a reservoir pressure of 3500 psia. The circle indicates the intersection point between the IPR and OPR curves, which represents the optimal CO2 injection rate for the system.
Energies 18 05983 g018
Figure 19. Nodal analysis result for Well 3 in Scenario 1 at reservoir pressure of 4000 psia. The circle indicates the intersection point between the IPR and OPR curves, which represents the optimal CO2 injection rate for the system.
Energies 18 05983 g019
Table 1. Input variables derived from the final well report for Gas Field Z.
Input VariableInput ValueInput VariableInput Value
Reservoir depth (m)1611~1675Tubing size (inch)3.548
Reservoir thickness (ft)209.97Borehole diameter (inch)12.5
Initial reservoir pressure (psia)3600AOF (MMscfd)253
Reservoir temperature (°F)230Reservoir permeability (md)10.5
Table 2. Input variable ranges for the nodal analysis model of Well Z.
Input VariableInput Value
Injection pressure (psia)1100/1650/2000
Tubing size (ID, inch)1.548/2.548/3.548/4.548/5.548
Reservoir pressure at injection (psia)1000/1250/1500/1750/2000
Reservoir permeability (md)1/5/10/40/80/160
Table 3. Input variables for the Gas Field Z.
Well 1Well 2Well 3Well 4Well 5
Reservoir depth (top, ft)4734.5954764.6024744.5874719.5874694.587
Reservoir thickness (ft)150209.97250300350
Permeability (md)2510.520155
Flow efficiency (ft·md)37502204.69500045001750
Injection rate allocation (%)21.7912.8129.0626.1510.17
Table 4. CO2 injection rate for each scenario across all wells.
Total Injection Rate
(MMscfd)
Well 1Well 2Well 3Well 4Well 5
Scenario 1
(20 year)
684.94149.2987.78199.05179.1569.67
Scenario 2
(15 year)
913.23199.05117.03265.4238.8692.89
Scenario 3
(10 year)
1369.87298.58175.54398.11358.3139.34
Scenario 4
(5 year)
2739.73597.16351.08796.22716.59278.68
Table 5. Sensitivity analysis results for Well Z.
Injection Pressure (psia)Tubing Size
(ID, inch)
Reservoir Pressure at CO2 Injection (psia)Reservoir Permeability (md)Reservoir Thickness (ft)Bottomhole Pressure (psia)CO2 Injection Rate (MMscfd)
11003.548150010196.852147.1352.30
16502716.5968.50
20002886.2677.60
11001.548150010196.851658.539.10
2.5482005.6128.92
3.5482417.1352.30
4.5482708.1668.73
5.5482852.0876.90
11003.548100010196.852122.7364.54
12502273.7858.59
15002417.11352.30
17502551.4245.46
20002674.7738.10
11003.54815001196.852940.307.85
52739.0833.60
102441.8751.08
401841.3474.24
801681.8379.13
11003.54815001098.432744.3633.20
147.642586.5841.50
196.852448.9250.73
295.282245.5359.75
393.72108.5565.07
Table 6. Results for Scenario 4 across all wells.
ScenarioWellPres (psia)Pi (psia)Pwf (psia)
41100020,416.277586.24
2100010,400.886931.76
3100030,503.196583.18
4100025,927.96644.86
510008483.886956.55
Table 7. Results for Scenario 1 across all wells.
ScenarioWellPres (psia)Pi (psia)Pwf (psia)
1110002525.732486.13
15002856.593015.96
20003157.473452.20
25003534.203962.15
30003938.144478.74
35004360.354998.14
40004795.885519.12
45005241.816041.17
210001807.992374.76
15002082.052891.40
20002439.403438.89
25002814.713950.75
30003222.514469.27
35003652.064990.82
40004097.525514.68
45004554.196038.96
310003309.732471.37
15003628.892964.37
20003975.713460.57
25004355.013970.66
300047544486.85
35005169.525004.95
40005599.525525.45
45006035.086045.03
410002969.642478.27
15003277.782959.89
20003624.273458.65
25004001.653968.99
30004403.764483.63
35004822.735003.06
40005252.065522.83
45005694.666043.93
510001678.052343.27
15001962.882914.81
20002299.493442.34
25002647.053955.56
30003083.744474.92
35003516.134997.22
40003964.185520.73
45004424.486046.13
Table 8. Results for Scenario 2 across all wells.
ScenarioWellPres (psia)Pi (psia)Pwf (psia)
2110003548.692845.85
15003963.453443.39
20004340.283951.30
25004741.164470.69
30005160.924994.26
35005593.985518.81
40006035.266045.24
210002387.962923.14
15002722.163422.46
20003095.113930.35
25003503.174452.01
30003934.214978.78
35004380.775507.71
40004838.176037.09
310005064.043016.22
15005371.513453.47
20005745.113961.22
25006139.084478.76
30006551.275001.31
35006973.095524.70
40007405.596048.59
410004460.453014.83
15004767.523450.90
20005140.533957.20
25005539.454476.40
30005953.424999.29
35006380.465523.03
40006816.196047.82
510002139.332909.78
15002407.613327.12
20002842.813926.53
25003251.494447.90
30003684.864975.41
35004135.415506.27
40004596.386036.73
Table 9. Results for Scenario 3 across all wells.
ScenarioWellPres (psia)Pi (psia)Pwf (psia)
3110006547.423926.08
15006929.894434.79
200073434963.72
25007767.115495.91
30008202.856029.78
210003895.683906.10
15004290.834415.78
20004715.404944.95
25005160.155483.04
30005617.896022.21
310009535.763923.72
15009909.904430.86
200010,306.144955.80
250010,715.365482.89
300011,132.726011.49
410008250.503926.60
15008628.834434.27
20009031.304960.98
25009448.735491.75
30009872.616021.82
510003446.663586.78
15003742.504404.27
20004171.614934.34
25004624.125476.20
30005088.106016.82
Table 10. Reservoir pressure at which operating BHP exceeds FPP.
Well 1
(psia)
Well 2
(psia)
Well 3
(psia)
Well 4
(psia)
Well 5
(psia)
Average
(psia)
Scenario 1
(20 year)
4264.54239.54229.04231.04239.04240.6
Scenario 2
(15 year)
3732.53743.03727.53728.53746.03735.5
Scenario 3
(10 year)
2750.52763.02763.02755.52770.52760.5
Disclaimer/Publisher’s Note: The statements, opinions and data contained in all publications are solely those of the individual author(s) and contributor(s) and not of MDPI and/or the editor(s). MDPI and/or the editor(s) disclaim responsibility for any injury to people or property resulting from any ideas, methods, instructions or products referred to in the content.