Article

An Efficient Method for Simulating High-Velocity Non-Darcy Gas Flow in Fractured Reservoirs Based on Diffusive Time of Flight

1
School of Energy Resources, China University of Geosciences (Beijing), Beijing 100083, China
2
CNOOC China Limited, Zhanjiang Branch, Zhanjiang 524057, China
*
Author to whom correspondence should be addressed.
Energies 2025, 18(22), 5891; https://doi.org/10.3390/en18225891 (registering DOI)
Submission received: 20 September 2025 / Revised: 26 October 2025 / Accepted: 3 November 2025 / Published: 9 November 2025

Abstract

In gas reservoirs, high gas velocity causes significant inertial effects, leading to a nonlinear relationship between pressure gradient and velocity, especially near wellbores or fractures. In such cases, Darcy’s law is inadequate, and the Forchheimer equation is commonly used to model nonlinear flow behavior. Although the Forchheimer equation improves simulation accuracy for high-velocity flow in porous media, incorporating it into conventional numerical simulations greatly increases computational time, as nonlinear flow equations must be solved over the entire reservoir. This difficulty is exacerbated in heterogeneous fractured reservoirs, where complex fracture–matrix interactions and localized high-velocity flow complicate solving nonlinear equations. To address this, this work proposes a fast numerical simulation method based on diffusive time of flight (DTOF). By using DTOF as a spatial coordinate, the original three-dimensional flow equations incorporating the Forchheimer equation are reduced to a one-dimensional form, enhancing computational efficiency. DTOF represents the diffusive time for a pressure disturbance from a well to reach a specific reservoir location and can be efficiently computed by solving the Eikonal equation via the fast marching method (FMM). Once the DTOF field is obtained, the three-dimensional problem is transformed into a one-dimensional problem. This dimensionality reduction enables fast and reliable modeling of nonlinear high-velocity gas transport in complex reservoirs. The proposed method’s results show good agreement with those from COMSOL Multiphysics, confirming its accuracy in capturing nonlinear gas flow behavior.

1. Introduction

Gas flow simulation in porous media is important for a range of gas-related subsurface applications, such as gas reservoir development, carbon capture and storage, and underground hydrogen storage [1,2,3,4,5]. In these applications, high-velocity flow often occurs near wellbores and fractures. When this happens, inertial effects become significant, and the assumption of a linear relationship between pressure and velocity in Darcy’s law is no longer applicable [6,7]. To account for the deviation from Darcy flow at high velocities, the Forchheimer equation was proposed as an extension of Darcy’s law. It includes an additional velocity-squared term to capture inertial resistance, which becomes significant in regions with high flow rates [8]. The Forchheimer equation has been widely used to describe non-Darcy gas flow behavior in porous and fractured media under high-velocity conditions. Friedel and Voigt [9] used a fully implicit numerical simulator incorporating the Forchheimer equation to investigate how inertial effects influence gas production in fractured tight reservoirs. Their results showed that non-Darcy flow in fractures dominates the early production stage. In addition, neglecting non-Darcy flow in the reservoir matrix can lead to an overestimation of gas recovery during the later production period. Mustapha et al. [10] applied the Forchheimer equation to simulate gas–water flow in fractured reservoirs during water injection. They found that inertial effects became significant in regions with high flow rates and large fracture apertures. Moreover, capillary pressure can further enhance the influence of non-Darcy flow on gas mobility. Fan et al. [11] used a lattice Boltzmann model incorporating the Forchheimer equation to simulate gas flow in proppant-filled fractures and proposed a method to calculate the non-Darcy coefficient directly from microscale flow behavior. The results showed that inertial effects reduce the apparent permeability as fluid velocity increases. Berawala and Andersen [12] developed a dual-permeability model based on the Forchheimer equation to analyze early-time gas transport in hydraulically fractured shale reservoirs. Their results demonstrated that non-Darcy flow can cause additional pressure drops along the fracture and reduce effective fracture conductivity during the early production period. These studies have demonstrated the effectiveness of using the Forchheimer equation to simulate nonlinear gas flow in reservoirs. However, incorporating this equation with traditional numerical simulation methods for gas flow modeling in reservoirs is time-consuming, especially in heterogeneous fractured reservoirs. One reason is that the entire reservoir needs to be divided into fine grids to accurately capture the complex fracture networks and the varying physical properties, which results in heavy computation [13,14]. Another reason is that the equation is nonlinear and requires multiple iterations at each time step to obtain a solution, which further increases the computational cost [15]. These challenges highlight the need for a more efficient simulation method that reduces computational demand while maintaining the accuracy of the simulation.
One concept that has been increasingly employed to address these challenges is the diffusive time of flight (DTOF). This concept was first proposed by Kulkarni et al. [16], and it represents the diffusive time required for a pressure disturbance to propagate from a well to a specific location in the reservoir. Following its development, DTOF has been widely used to improve the computational efficiency of reservoir simulation by reducing model size or through dimensional reduction of the flow problem. Zhang et al. [17] employed the concept of DTOF to transform the three-dimensional governing equations into one-dimensional equations, enabling rapid simulation of shale gas reservoirs. Their results demonstrated that this transformation significantly reduced simulation time while maintaining accuracy. Fujita et al. [18] developed a simulator for unconventional reservoirs by using DTOF as a coordinate to reformulate the 3D dual-porosity flow equation into a 1D form along the DTOF direction. The results showed that the method enabled efficient simulation of multiscale flow behavior while significantly reducing simulation time. Teng [19] proposed a DVOI-IMFD method, which reduces simulation costs by dynamically updating the simulated region based on the DTOF field. The results indicated that this method significantly reduced computational time while yielding results consistent with those of commercial simulators. Chen et al. [20] introduced a multidomain multiresolution simulation method based on DTOF to simulate multiwell unconventional reservoirs. By using DTOF contours, they partitioned the reservoir into local and shared domains and applied different spatial resolutions accordingly. The simulation results showed that this method could accelerate multiwell simulations with minimal accuracy loss. While DTOF has been widely applied in reservoir simulation, most existing studies have focused on Darcy flow conditions. Its application in high-velocity non-Darcy flow simulation has received limited attention.
In this work, a fast simulation method is proposed to model the non-Darcy gas flow in reservoirs by combining the concept of diffusive time of flight (DTOF) with the Forchheimer equation. By using DTOF as a spatial coordinate, the original three-dimensional nonlinear flow problem is transformed into a one-dimensional problem, which significantly reduces the computational cost while maintaining the essential nonlinear flow behavior. Furthermore, with the aid of the proposed method, the authors conducted a comprehensive study to investigate the influence of key parameters, including the Forchheimer coefficient β, matrix permeability, the number of natural fractures, and initial reservoir pressure on gas production performance and velocity distribution under high-velocity non-Darcy flow conditions.

2. Methodology

In this section, the authors provide a detailed description of the proposed method for the rapid simulation of high-velocity non-Darcy gas flow in reservoirs. The method consists of two parts. In the first part, the diffusion equation is reformulated using the normalized pseudo-pressure and pseudo-time to account for the strong pressure dependence of gas properties, resulting in a form with constant coefficients. Subsequently, based on the reformulated equation, the Eikonal equation is derived to describe the propagation of pressure disturbances in the reservoir. It is then solved using the fast marching method (FMM) to obtain the spatial distribution of the diffusive time of flight (τ), which represents the arrival time of pressure disturbances at each location in the reservoir. In the second part, the obtained τ-distribution is used to create a new coordinate system, where reservoir regions with the same τ are grouped into separate layers. This transformation reduces the original three-dimensional flow problem to one dimension along the τ direction, which greatly improves computational efficiency while still capturing the nonlinear behavior of high-velocity gas flow. The proposed method requires several assumptions to simplify the modeling process, which are as follows:
  • The reservoir temperature is constant during the simulation.
  • The effect of gravity on gas flow is neglected to simplify the model and focus on pressure-driven flow behavior.
  • The effect of pressure on matrix and fracture permeability is ignored.
  • Single-phase gas flow is assumed, with no adsorption or desorption effects, to maintain modeling simplicity.
  • No-flow boundary conditions are imposed on all outer boundaries of the reservoir.

2.1. Derivation of the Eikonal Equation for Pressure Front Propagation

In this part, the diffusion equation for gas flow in porous media is introduced to investigate the propagation of pressure disturbances in gas reservoirs. This equation not only captures the essential transport behavior but also forms the basis for deriving the Eikonal equation [18]. Accordingly, the diffusion equation takes the following form:
ρ k μ p p = ρ ϕ t
where ρ is gas density, k is permeability, μ is gas viscosity (varies with pressure), p is pressure, ϕ is porosity, and t is time. The gas compressibility and rock compressibility are given by [21,22]:
c g = 1 ρ d ρ d p , c r = 1 ϕ d ϕ d p
Substituting Equation (2) into the right-hand side of Equation (1) and applying the chain rule, Equation (1) can be simplified as:
ρ k μ p p = ρ ϕ c t p p t
where ct = cg + cr is the total compressibility (which varies with pressure). To further express the diffusivity in terms of pressure, the gas density ρ is expressed as ρ = pM/ZRT according to the real gas law [23], where M, Z, R, and T are the gas molar mass, compressibility factor, universal gas constant, and reservoir temperature, respectively. Substituting ρ = pM/ZRT into Equation (3) yields the following form:
p Z ( p ) k μ p p = p Z ( p ) ϕ c t p p t
As one can see in Equation (4), both sides of the equation include pressure-dependent terms such as Z(p), μ(p), and ct(p). This strong pressure dependence leads to a nonlinear flow equation. Although an Eikonal equation can be derived from this nonlinear form, the resulting τ-distribution would not accurately represent the propagation of pressure disturbances, as the coefficients vary with pressure. Therefore, it is necessary to reformulate the diffusion equation (i.e., Equation (4)) in a form with constant coefficients. To this end, the normalized pseudo-pressure and pseudo-time are introduced. The normalized pseudo-pressure is defined as [24]:
p n = μ Z p i 0 p p μ p Z p d p
and the normalized pseudo-time is defined as [24]:
t n = μ c t i 0 t 1 μ p c t p d t
where subscript i is the initial state.
By applying the normalized pseudo-pressure and normalized pseudo-time defined in Equations (5) and (6), Equation (4) can be reformulated as:
p n t n = k ϕ μ c t i 2 p n
After reformulation, the pressure-dependent parameters are replaced by their values at the initial reservoir pressure, so that the equation becomes a constant-coefficient diffusion equation. This form is similar to the oil diffusion equation, where all parameters are assumed to be constant and independent of pressure during the derivation of the Eikonal equation [25,26]. Therefore, the approach used to derive the Eikonal equation for oil reservoirs can also be applied to gas reservoirs. It should be noted that Equation (7) represents a linearized Darcy-flow approximation obtained through the pseudo-pressure and pseudo-time transformation, which yields a constant-coefficient diffusion form for efficient computation of the τ-field; the nonlinear velocity-dependent Forchheimer term is subsequently incorporated in Equation (18) to restore the inertial effects. Based on Equation (7) (i.e., the reformulated gas diffusion equation), the Eikonal equation describing the propagation of the pseudo-pressure front in the gas reservoir can be written as [25,26]:
α τ = 1
where α is diffusivity, which is defined as α = k/ϕ[μct]i, and τ is the diffusive time required for the pseudo-pressure disturbance to propagate from the well to a specific location in the reservoir (i.e., diffusive time of flight). Equation (8) can be efficiently solved by the fast marching method (FMM) to obtain the spatial distribution of τ, and the corresponding numerical procedure for solving the Eikonal equation with FMM is detailed in the Appendix A. Once the spatial distribution of τ is obtained, it is used to transform the original flow problem into a lower-dimensional problem along the τ direction.

2.2. Dimensional Reduction of the Flow Problem Along the τ Direction

The mass conservation for gas flow in gas reservoirs is governed by the continuity equation, which can be expressed as [23]:
ρ v = ρ ϕ t
where v is gas flow velocity, which is calculated using the Forchheimer equation to account for non-Darcy flow effects at high velocities. The Forchheimer equation takes the form as follows [8]:
p = μ p k v + β ρ v v
where β is the non-Darcy coefficient (i.e., Forchheimer coefficient), it is typically obtained through experimental data or empirical models. In this study, the Forchheimer coefficients of the matrix and fractures are determined using the empirical correlations summarized by Friedel and Voigt [9], which describe β as a power-law function of permeability. The model is expressed as:
β m = 4.1 × 10 11 k m 1.5 , β f = 1 × 10 11 k f 1.11
where βm and βf are non-Darcy coefficients of matrix and fracture, respectively, while km and kf denote the permeability of matrix and fracture, respectively.
Inserting Equation (10) into Equation (9), we obtain the continuity equation for high-speed non-Darcy flow:
ρ k μ p + β ρ k v p = ρ ϕ t
Equation (12) is a strongly nonlinear partial differential equation, as the gas density, gas viscosity, and gas flow velocity are all pressure-dependent. Therefore, solving this equation directly in full 3D space is computationally expensive in traditional reservoir simulations, as it requires iteration to determine the pressure-dependent parameters in each grid at each timestep.
To improve computational efficiency, the flow problem is reduced to one spatial dimension by assuming that the pseudo-pressure varies only along the direction of τ. This implies that the contour surfaces of pseudo-pressure pn coincide with the contour surfaces of τ. By substituting ρ = pM/ZRT into the continuity equation and applying the pseudo-pressure transformation defined in Equation (5), the continuity equation is reformulated as:
k μ p n μ p n + β ρ k v p n = ϕ μ p n c t p n p n t
where pn is normalized pseudo-pressure. With the continuity equation expressed in pseudo-pressure form, the focus shifts to its transformation into the (τ, φ, λ) coordinate system. In this new coordinate system, τ represents the diffusive time of flight for pseudo-pressure propagation, while φ and λ denote two perpendicular directions on the iso-τ surfaces. The local basis vectors in this new coordinate system are defined as:
e τ = r τ , e φ = r φ , e λ = r λ
where r is the position vector in the original Cartesian coordinate. Consequently, the scale factors, which represent the local distances corresponding to unit changes in each direction, are given as hτ = | e τ |, hφ = | e φ |, hλ = | e λ |. Specifically, hτ = | e τ | = α , which follows from the Eikonal equation presented in Equation (8).
Using these definitions, the gradient in the (τ, φ, λ) coordinate system can be written as:
= 1 h τ τ e ^ τ + 1 h φ φ e ^ φ + 1 h λ λ e ^ λ
where e ^ τ , e ^ τ and e ^ λ are unit vectors in τ, φ, and λ direction, respectively. Similarly, the divergence of a vector field B in the (τ, φ, λ) coordinate is given by:
B = 1 J τ J h τ B τ + φ J h φ B φ + λ J h λ B λ
where J = hτhφhλ is the local volume scaling factor. By substituting the gradient and divergence expressions (Equations (15) and (16)) into Equation (13), the continuity equation is transformed into:
τ J h τ k μ p n μ p n + β ρ k v 1 h τ p n τ = J ϕ μ p n c t p n p n t
In this equation, the partial derivatives with respect to φ and λ disappear because both the pseudo-pressure pn and the local volume scaling factor J are constant along the φ and λ directions on iso-τ surfaces. To further simplify the equation to depend on τ only, Equation (17) is integrated over the φ and λ directions, resulting in:
τ ω τ μ c t i μ p n μ p n + β ρ k v p n τ = ω τ μ p n c t p n p n t
where ω(τ) represents the derivative of the pore volume along the τ direction, which takes the form:
ω τ = J ϕ d φ d λ = d V p d τ
This relationship arises from the definition of the cumulative pore volume Vp in the (τ, φ, λ) coordinate system, given by the following integral:
V p = J ϕ d φ d λ d τ
Moreover, after obtaining the spatial distribution of τ by solving the Eikonal equation using the fast marching method (FMM) in Section 2.1, the cumulative pore volume Vp corresponding to any specific τ can be determined by summing the pore volumes within the iso-τ region. This allows the calculation of ω(τ) without performing explicit integration over φ and λ. Consequently, Equation (18) can be fully expressed as a function of τ alone, thereby reducing the original three-dimensional flow problem into a one-dimensional flow problem along the τ-direction. This dimensional reduction greatly improves computational efficiency while maintaining the essential characteristics of high-speed non-Darcy gas flow.
It is worth noting that Equation (18) involves a velocity term that cannot be directly expressed. To determine the velocity required in Equation (18), Equation (10) reformulated in the τ-space by applying a derivation similar to that used in the DTOF-based one-dimensional formulation. The velocity is thus given by:
v = p c t Z i M ω τ A R T ρ μ p n μ p n + β ρ k v p n τ
where A is the flow cross-sectional area enclosed by the iso-τ contour at a given τ, is the total flow cross-sectional area normal to the flow direction.

2.3. Numerical Framework of the Proposed Method

This section introduces a numerical framework for implementing the proposed method for rapid simulation of high-velocity non-Darcy gas flow. The framework involves the determination of the spatial distribution of diffusive time of flight τ, the calculation of the cumulative pore volume Vp at each τ, its derivative ω(τ) = dVp/dτ, the computation of flow area A at each τ, and the discretization of the τ-space into a one-dimensional grid. For fractured reservoirs, the flow area A is obtained by summing the cross-sectional areas of both matrix and fracture cells along the iso-τ surface. This ensures that the calculated flow area reflects the true effective flow capacity of complex fracture networks. These steps enable the transformation of the original three-dimensional flow problem into a one-dimensional problem with significantly reduced computational cost, while capturing the essential characteristics of high-velocity non-Darcy gas flow. The detailed implementation steps (shown in Figure 1) are as follows:
1.
Grid discretization and diffusivity calculation. Discretizing the reservoir model into structured grids, each grid is assigned physical properties such as porosity (ϕ), permeability (k), and rock compressibility (cr). The diffusivity is then calculated in each grid as α = k/ϕ[μct]i, which serves as the key parameter for solving the Eikonal equation.
2.
Determination of τ distribution. By solving the Eikonal equation numerically on the grids using the fast marching method (FMM), the τ value for each grid is calculated, thus obtaining the spatial distribution of τ.
3.
Calculation of Vp, A, ω(τ). For each τ value, summing the pore volumes of all grids with τ values less than or equal to the given τ yields the corresponding cumulative pore volume Vp. The value of ω(τ) is then obtained as the derivative dVp/dτ. In addition, the flow area A is computed as the total cross-sectional area of the iso-τ surface corresponding to the given τ.
4.
Construction of one-dimensional grids in τ-space. The range of τ values, from the minimum value at the wellbore (typically τmin = 0) to the maximum value corresponding to the τ required for the pseudo-pressure disturbance to propagate to the reservoir boundary, is discretized into a series of segments. This results in a set of one-dimensional grids in τ-space.
5.
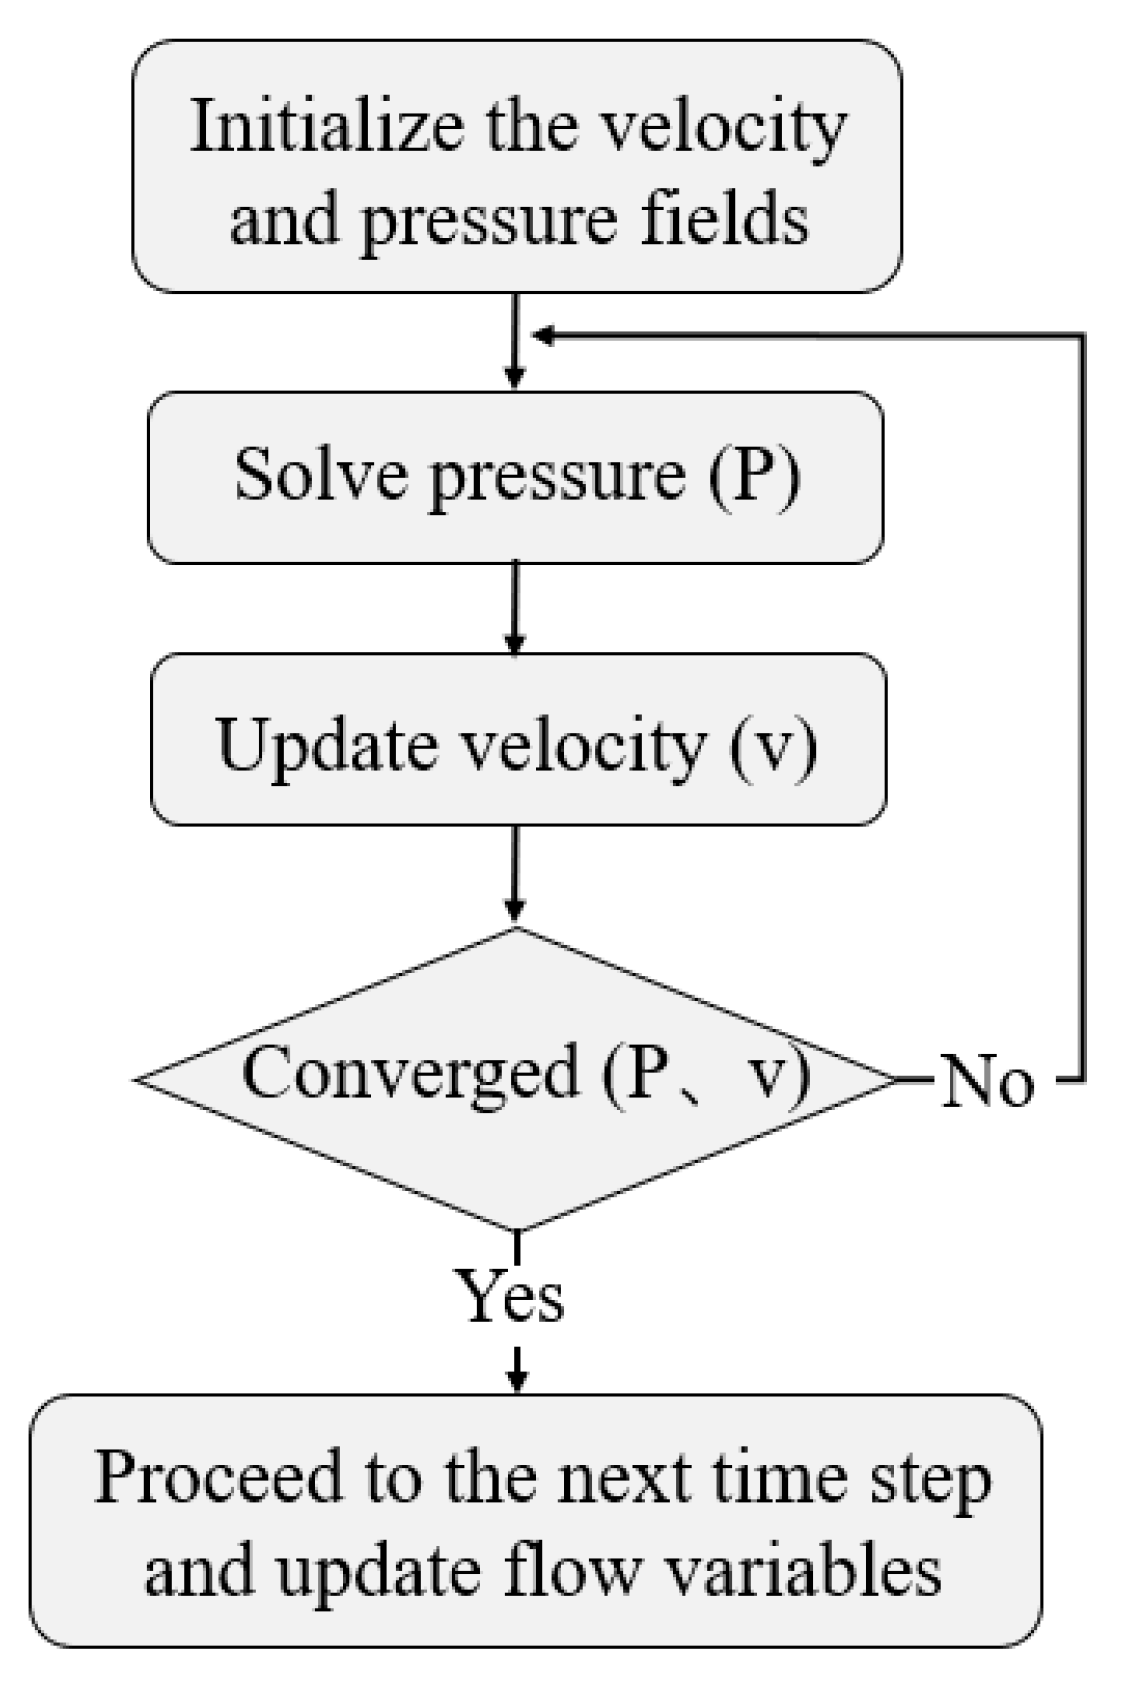
Pressure–velocity coupling in τ-space. The one-dimensional flow equation and the velocity equation (i.e., Equations (18) and (21)) are solved on the discrete grids constructed in step 4 to simulate high-velocity non-Darcy gas flow. At each time step, the simulation starts with the initial velocity. For the first time step, the initial gas velocity is assumed to be 0. For all subsequent time steps, the initial gas velocity is set equal to the gas velocity from the previous time step. With the initial velocity given, Equation (18) is first solved to calculate the pseudo-pressure. The result is then used in Equation (21) to update the velocity. The updated velocity is then used in Equation (18) again to recalculate the pseudo-pressure. The iteration proceeds until the differences in pressure and velocity between two iterations are below a given threshold. Once this condition is met, the simulation moves on to the next time step. To ensure rapid and stable convergence of this nonlinear coupling, the Newton–Raphson iteration method is employed. The iteration continues until the relative change in the velocity field is satisfactory.
x 1 x 0 x 1 < 10 4
Sensitivity tests show that tightening the tolerance to 10−5 changes the production rate by less than 0.3% but increases computation time significantly; therefore, 10−4 is adopted as an optimal balance between accuracy and efficiency. This iterative procedure updates the velocity and pressure fields until convergence is achieved, ensuring the numerical stability of the nonlinear coupling in Equation (18). The detailed computational workflow of this pressure–velocity coupling algorithm is illustrated in Figure 2.
6.
Gas production calculation. The one-dimensional flow equations are solved along the τ grids to calculate the gas production rates.

3. Validation

To assess the capability and investigate the computational efficiency of the proposed method in accurately capturing the behavior of high-velocity non-Darcy gas flow in reservoirs, its results were compared with those obtained from the commercial software COMSOL Multiphysics (6.2), which is a commercial finite element software widely used for reservoir modeling. The validation was conducted using two-dimensional gas reservoir models with varying numbers of randomly distributed natural fractures (nf = 0, 50, 100, and 200). Figure 3 shows the fracture distribution and numerical mesh for each model. Figure 3a–d illustrate the spatial distribution of natural fractures, while Figure 3e–h displays the corresponding mesh discretizations generated using COMSOL Multiphysics. These reservoir models have a length of 2000 m along the x-axis, 1200 m along the y-axis, and a depth of 10 m. The porosity and the permeability of the reservoir are 0.4 and 0.1 mD, respectively. The lengths of the natural fractures range from 10 to 100 m, with a uniform width of 0.01 m and a permeability of 1 × 10⁴ mD. To simulate realistic production conditions, a constant bottom-hole pressure is applied at the vertical well, while no-flow boundary conditions are imposed on all outer boundaries of the reservoir model. The simulation is run for 730 days, and the other parameters used for the simulation are summarized in Table 1. For validation, a reference simulation was conducted in COMSOL Multiphysics using the Darcy–Forchheimer interface within the Porous Media Flow module. The computational domain and boundary conditions were kept identical to those in the DTOF-based model to ensure direct comparability. The COMSOL model directly solves the full Forchheimer flow equations and therefore serves as a high-fidelity reference. Grid independence was confirmed when the variations in pressure drop and total flow rate were below 1%, demonstrating the reliability of the benchmark results.
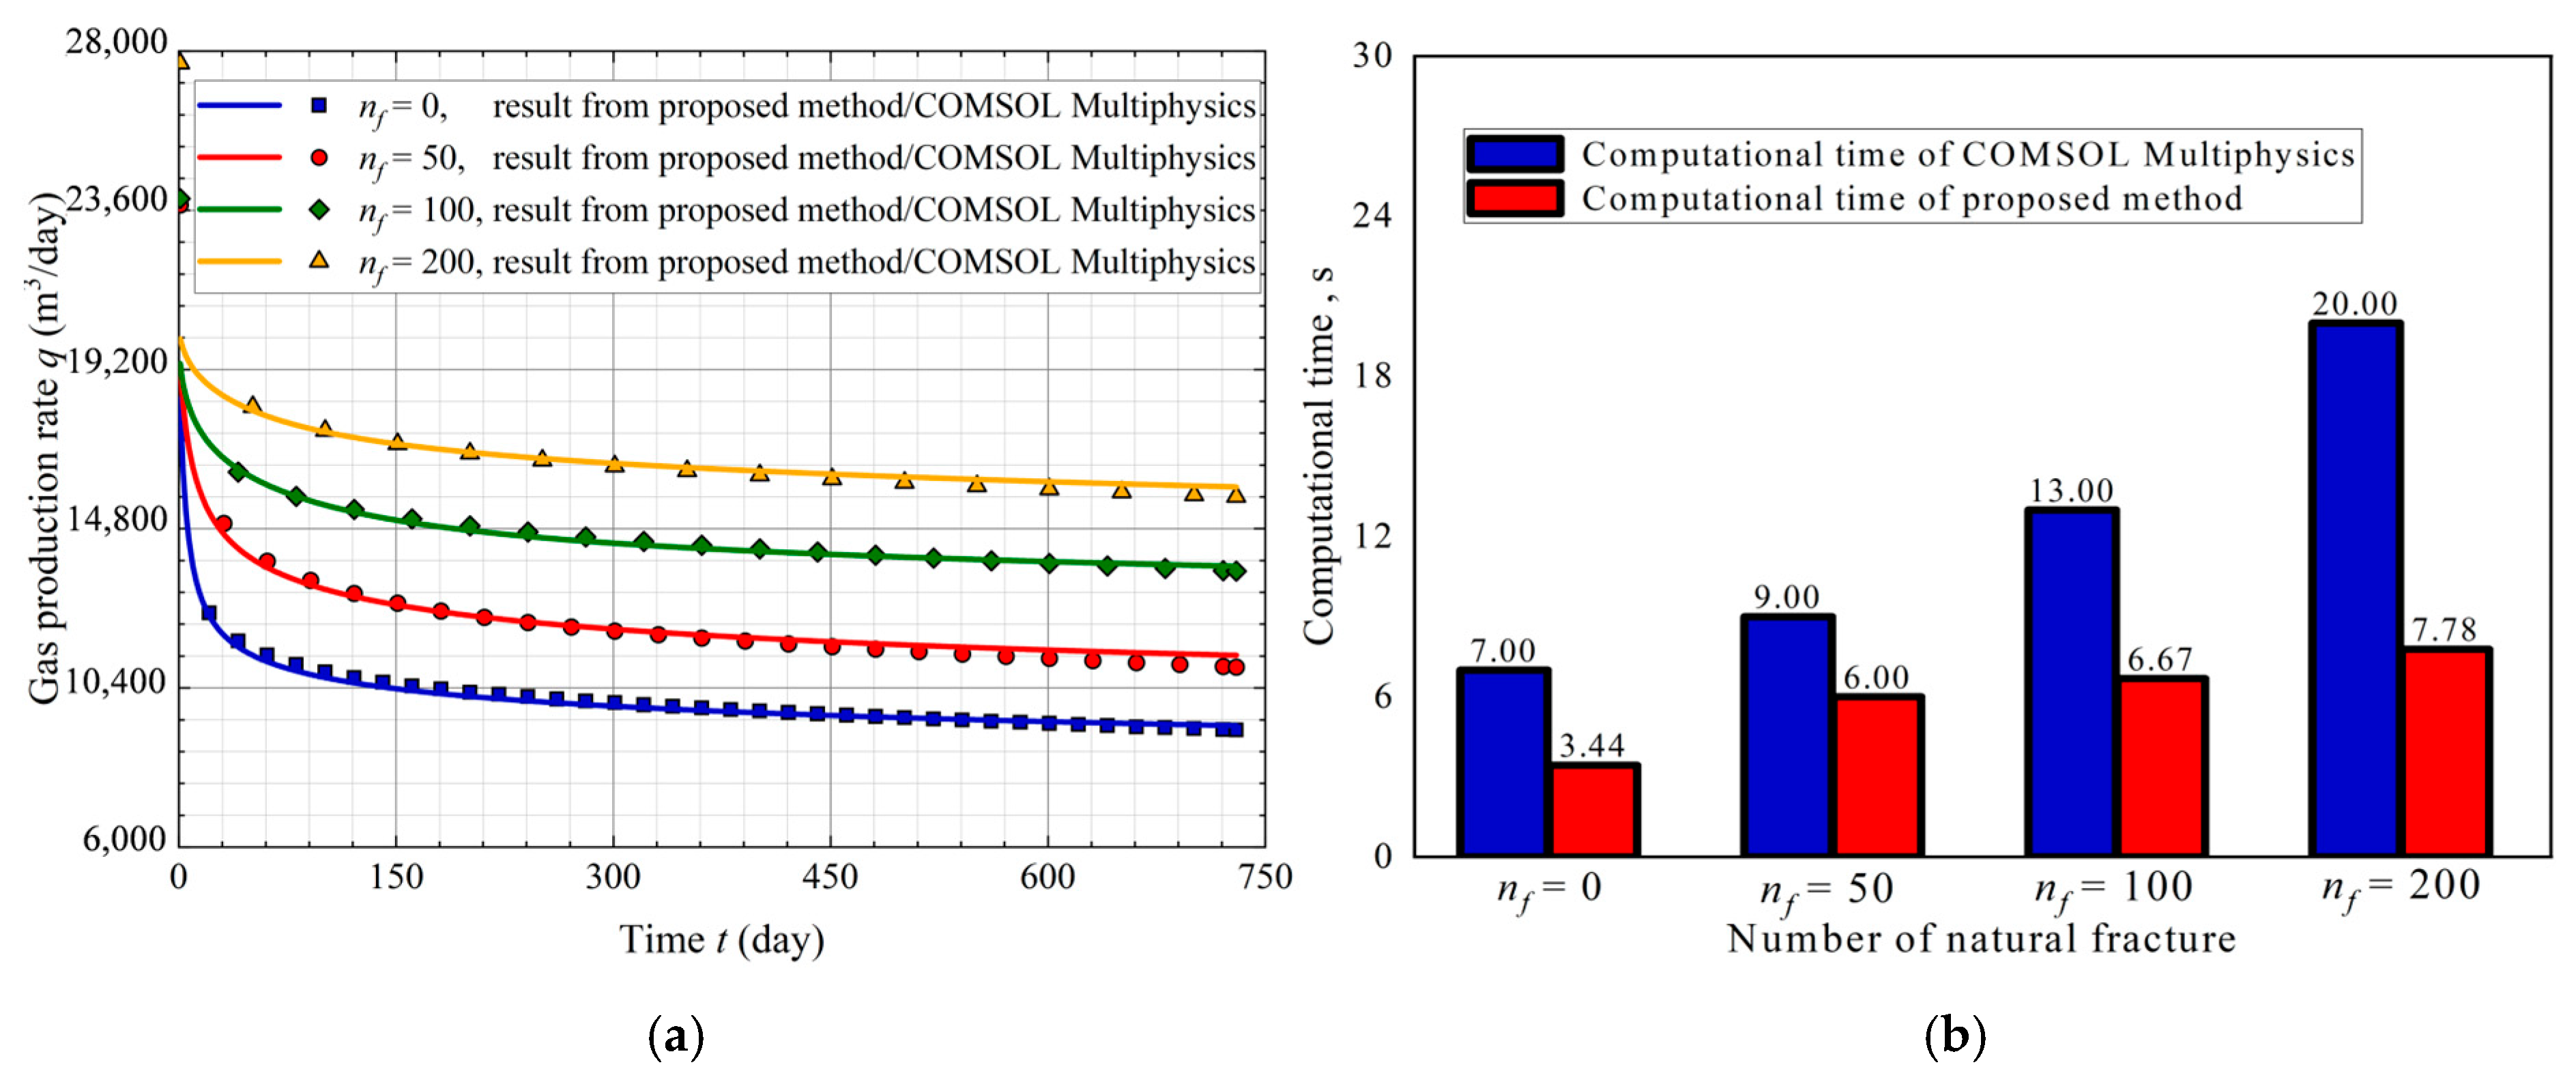
Figure 4a compares the gas production rates obtained by the proposed method (solid lines) and COMSOL Multiphysics (scattered points) for reservoir models with different numbers of natural fractures. As one can see from this figure, the solid lines and scattered points exhibit excellent agreement across all cases, demonstrating that the proposed method can accurately capture production performance even in the presence of complex fracture networks. Figure 4b shows the computational time of the proposed method and COMSOL Multiphysics under different numbers of natural fractures. As the number of fractures increases, the computational time of COMSOL Multiphysics increases significantly, from 7.0 s for the case with no fractures to 20.0 s for the case with 200 fractures. In contrast, the computational time of the proposed method increases more slowly, from 3.44 s to 7.78 s. For all cases, the proposed method runs faster than COMSOL Multiphysics: approximately 2.0 times faster when nf = 0, 1.5 times faster when nf = 50, 2.0 times faster when nf = 100, and 2.6 times faster when nf = 200. The results shown in Figure 4a,b demonstrate that the proposed method achieves comparable accuracy to the COMSOL.

4. Results and Discussion

4.1. Effects of Flow and Reservoir Parameters on Non-Darcy Gas Transport

In this section, a benchmark gas reservoir model is constructed as a foundation for the numerical investigation. As shown in Figure 5a, the model contains 200 randomly generated natural fractures distributed throughout the domain. The reservoir dimensions are 2000 m × 1200 m × 10 m, with fracture lengths ranging from 10 m to 100 m and a permeability of 1 × 10⁴ mD. Figure 5b shows the distribution of the matrix permeability. The matrix permeability is randomly generated and exhibits strong heterogeneity, with values ranging from 0.03 mD to 5.4 mD. As observed in this figure, higher permeability is concentrated near the center of the domain and gradually decreases toward the boundaries. The average matrix permeability is 1 mD. The Forchheimer coefficients for both the matrix and fractures are calculated using the empirical model presented in Equation (11). The values of other parameters applied in the benchmark model are shown in Table 2, and the simulation time is 730 days.

4.1.1. Forchheimer Coefficient

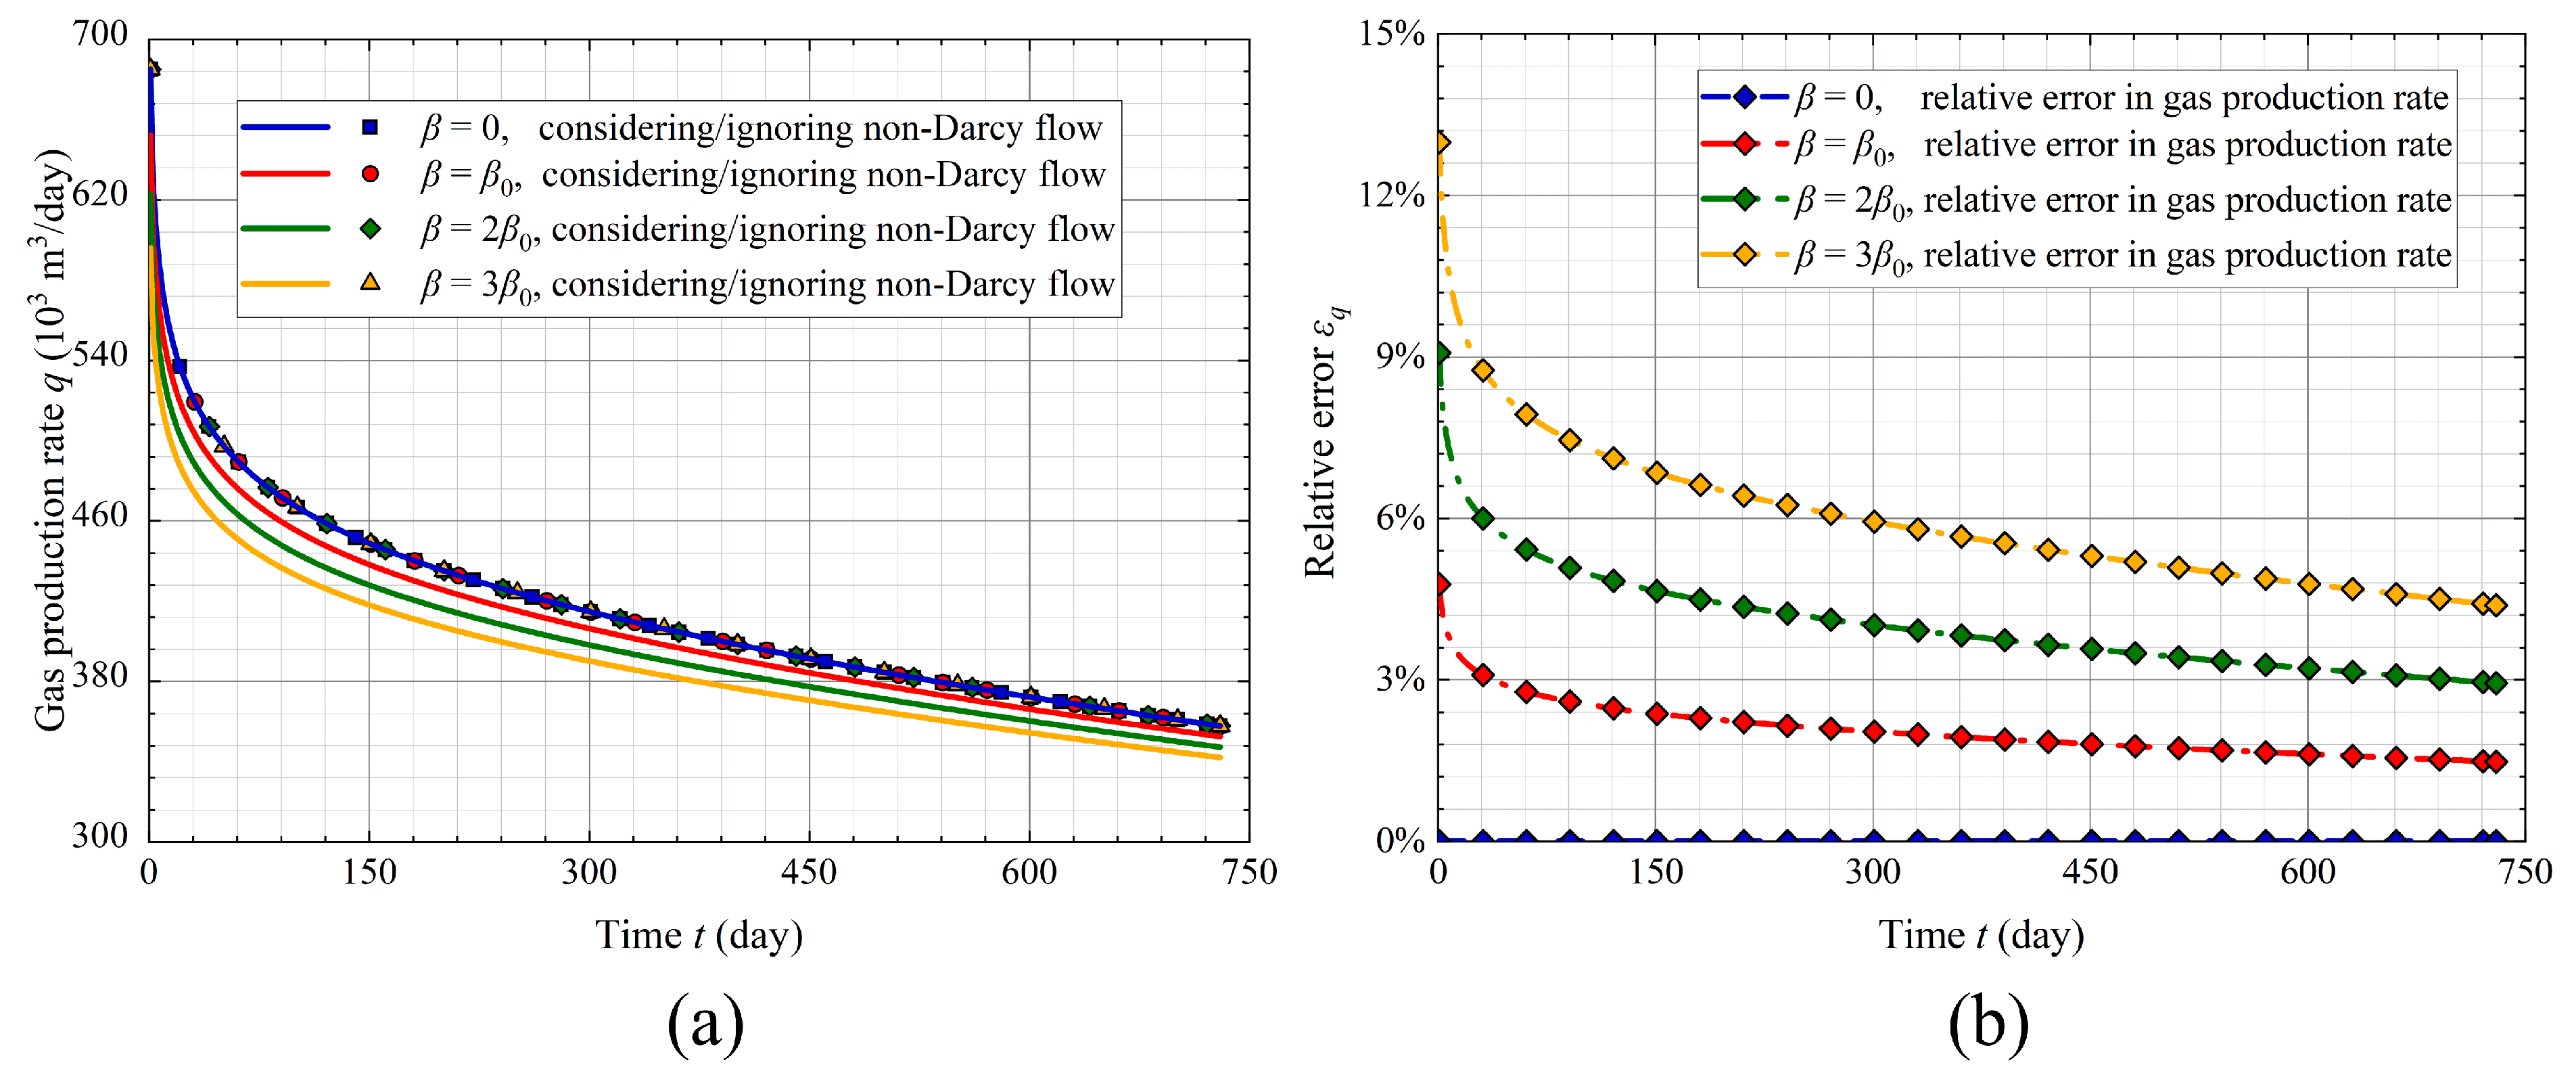
To investigate the effect of high-velocity non-Darcy flow on gas production and velocity distribution, the Forchheimer coefficient β is varied based on different multiples of its base value β0, which is calculated from an empirical model introduced in Section 2.2 (i.e., Equation (11)). The four cases considered are β = 0 (Darcy flow), β = β0, β = 2β0, and β = 3β0. Figure 6a presents the gas production rates for these four cases. For each β value, two results are shown: the solid curves represent simulations considering non-Darcy flow, while the scattered points correspond to cases ignoring it. As observed in this figure, the case with β = 0 yields the highest gas production rate, followed by those for β = β0, 2β0, and 3β0, which reflects increasing flow resistance as β increases. This trend highlights the growing effect of non-Darcy effects. In contrast, the scattered points for each β value, which represent simulations ignoring non-Darcy flow, consistently lie above the corresponding solid curves. This indicates that ignoring non-Darcy flow results in an overestimation of the gas production rate.
Figure 6b presents the relative errors in gas production rate between simulations ignoring and considering non-Darcy flow under different Forchheimer coefficients. The relative error is defined as:
ε q = q D a r c y q n o n D a r c y q D a r c y × 100 %
where qDarcy and qnon-Darcy denote the production rates ignoring and considering non-Darcy flow, respectively. As one can see from this figure, the relative error increases as the Forchheimer Coefficient β increases, indicating that the effect of non-Darcy flow becomes more significant with larger β. The relative error for each β reaches its maximum during early production times, when the flow velocity is highest. Particularly for β = 3β0, the relative error reaches approximately 13% during the early stage, demonstrating that ignoring non-Darcy flow results in a substantial overestimation of gas production. In addition, the error remains non-negligible even at later stages. For instance, at the end of the simulation (i.e., 730th day), the relative error for β = 3β0 still exceeds 5%, indicating that the gas production rate continues to be significantly overestimated if the non-Darcy flow is ignored. These results highlight the importance of accounting for non-Darcy flow, especially in high-velocity gas reservoirs.
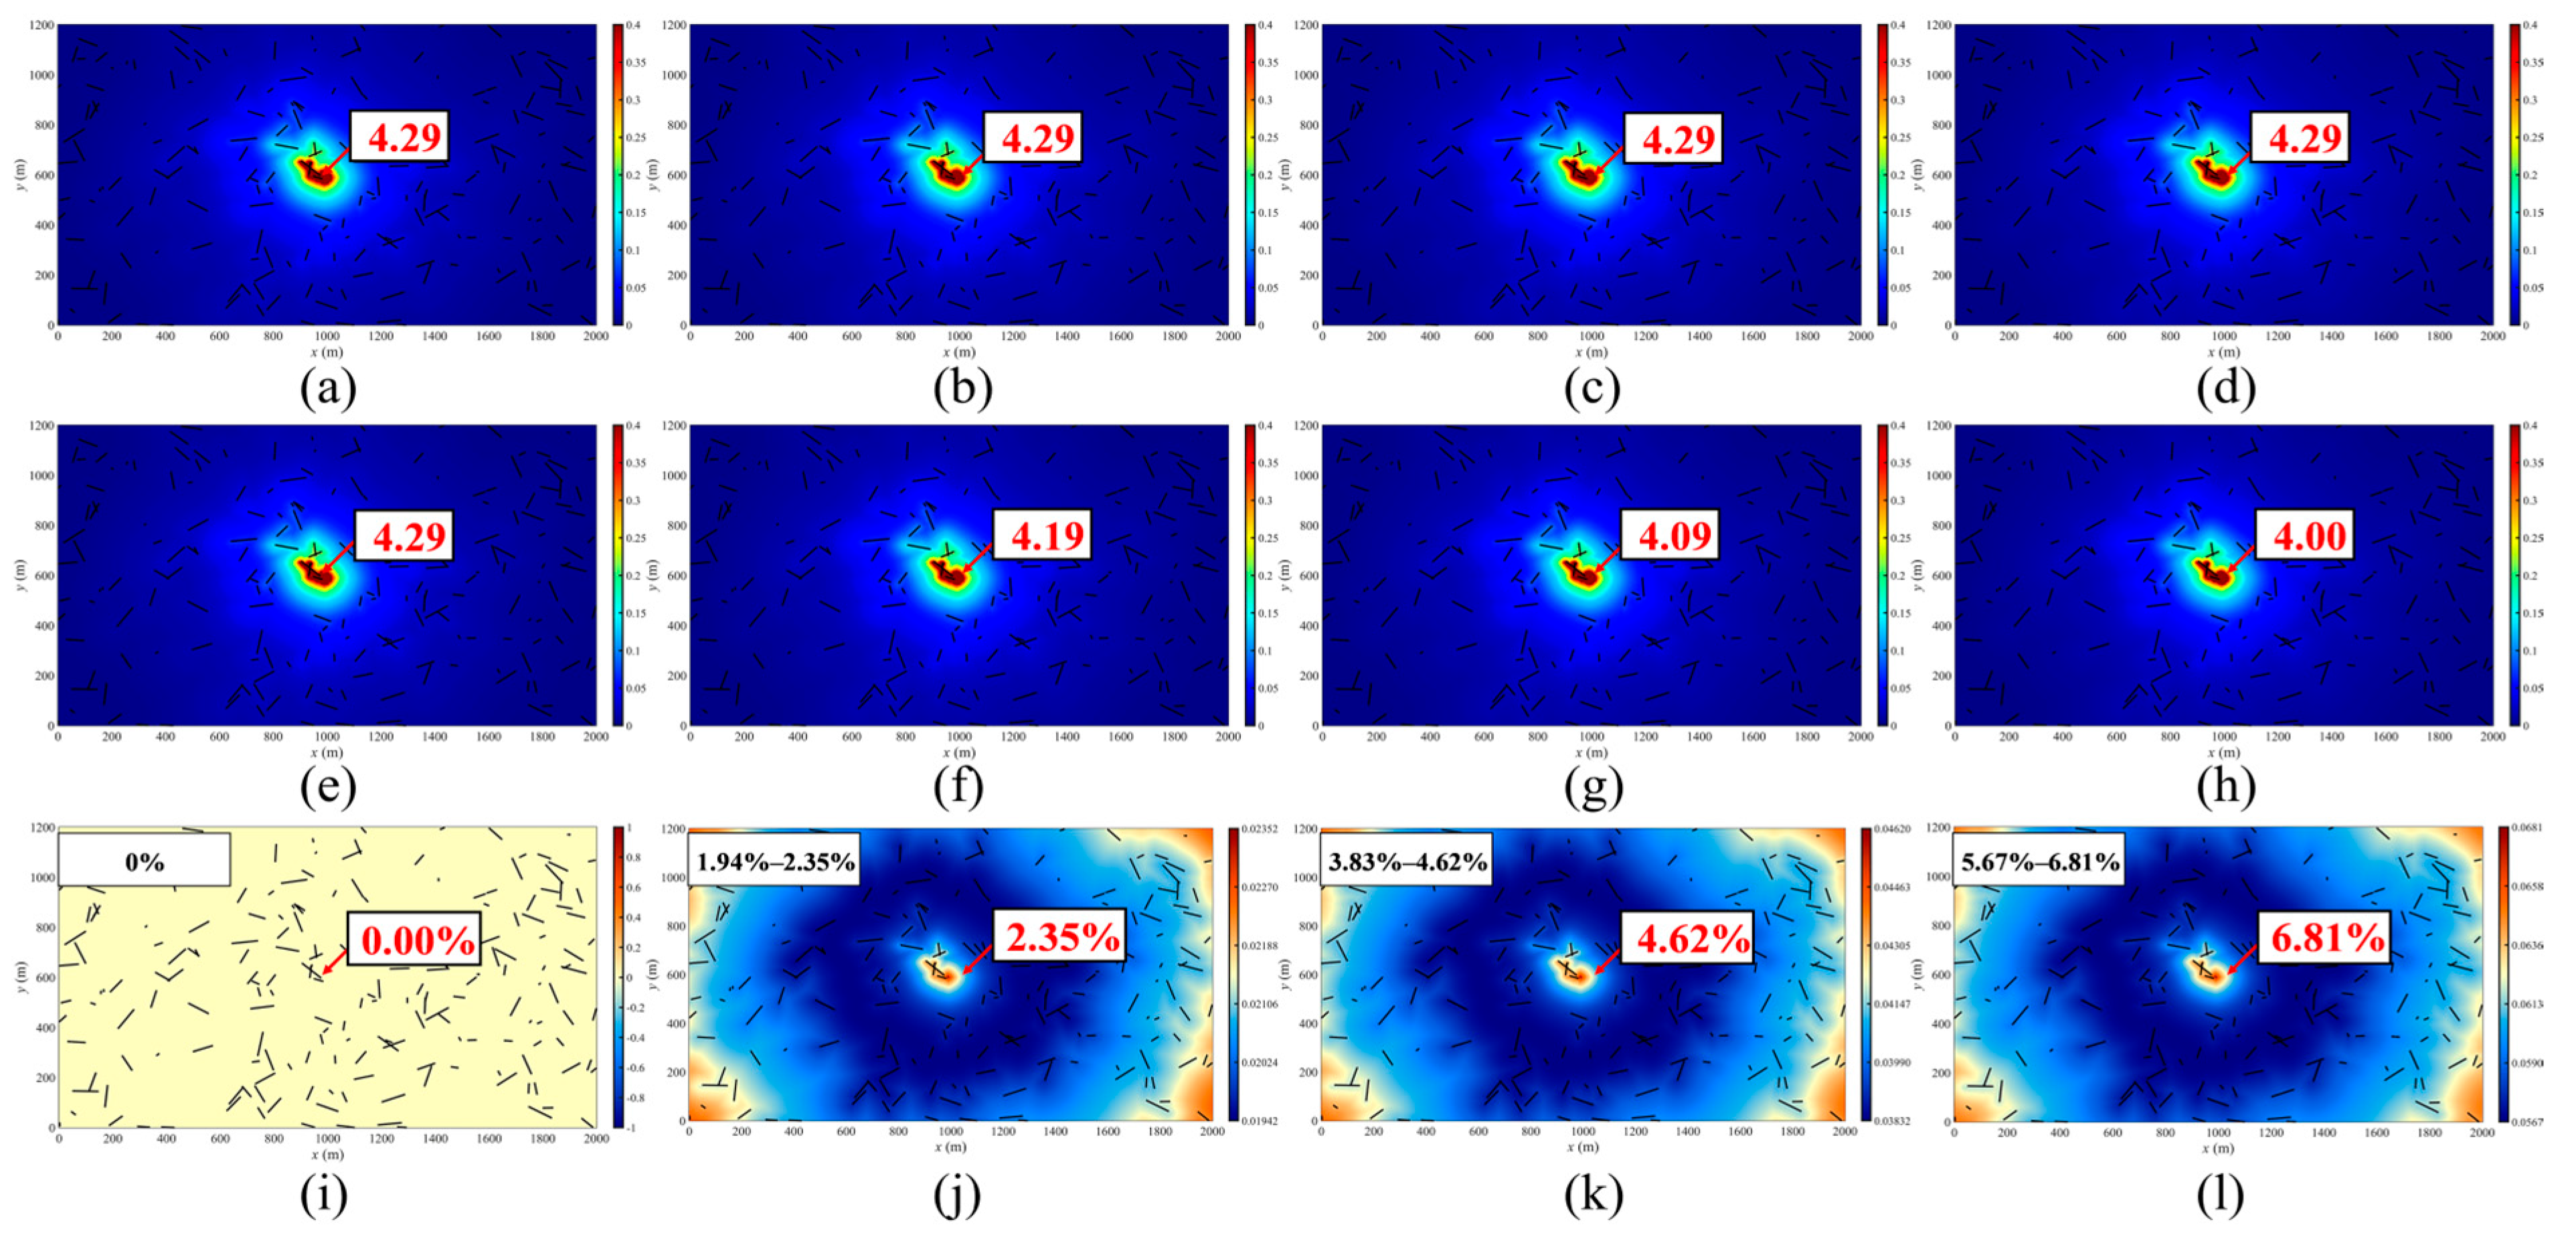
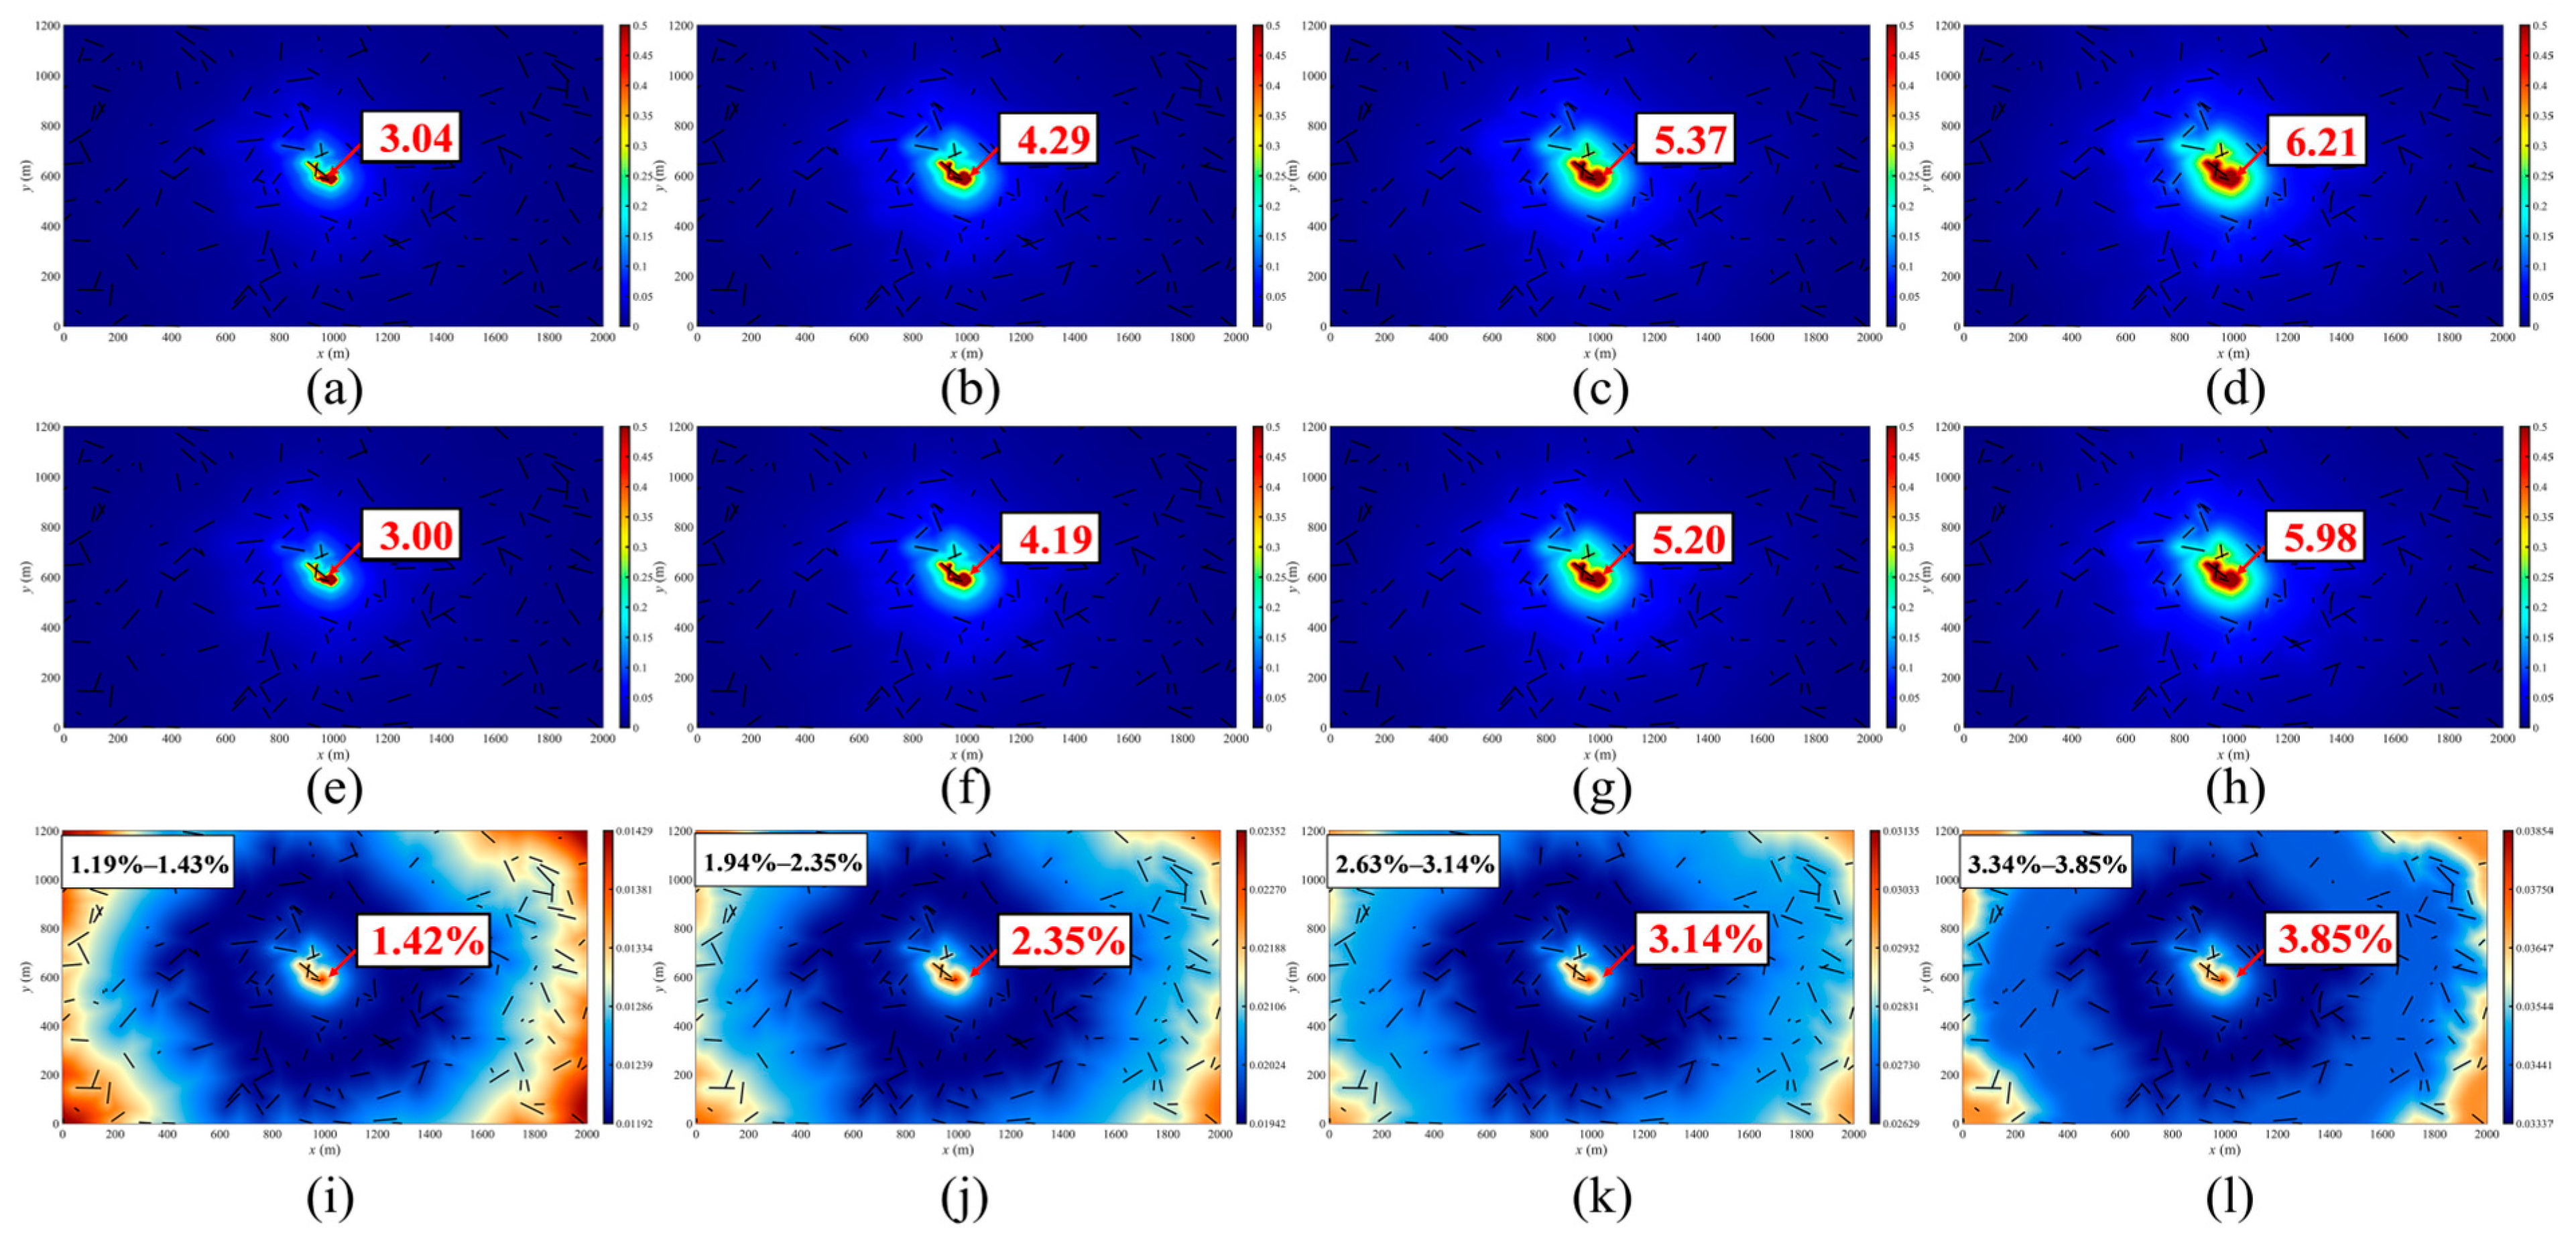
Figure 7 illustrates the velocity field distributions and their corresponding relative errors at the end of the simulation (i.e., 730th day) under different Forchheimer coefficients (β = 0, β0, 2β0, and 3β0). The first row (Figure 7a–d) shows the velocity field distributions when the non-Darcy flow is ignored, while the second row (Figure 7e–h) presents the corresponding results with non-Darcy flow considered. The third row (Figure 7i–l) displays the relative errors between these two velocity fields, which are calculated as:
ε v = v D a r c y v n o n D a r c y v D a r c y × 100 %
where vDarcy and vnon-Darcy represent the velocities obtained from simulations ignoring and considering non-Darcy flow, respectively.
As one can see from this figure, although the overall velocity field exhibits similar patterns across different β values, noticeable differences appear near the wellbore where the velocity is relatively high. In the first and second rows, the red labels indicate the gas velocity at the wellbore. When non-Darcy flow is ignored (Figure 7a–d), the gas velocity at the wellbore remains constant at 4.29 m/day across all β values, as the same Darcy flow model is used. However, when the non-Darcy flow is considered (Figure 7e–h), the gas velocity at the wellbore gradually decreases as β increases. This is because a larger β corresponds to a stronger inertial effect, which introduces more flow resistance and consequently reduces the gas velocity near the wellbore. This trend is further confirmed by the third row (Figure 7i–l), which shows the relative error between the two velocity fields across the entire reservoir. When β = 0, the relative error is 0% throughout the reservoir, indicating that both simulations yield identical results since inertial effects are not present in either case. As β increases, the inertial resistance becomes stronger, leading to growing differences between the two velocity fields. When β = 3β0, the relative error in velocity reaches approximately 5.67% to 6.81% across the reservoir (as shown by the black label in the top left corner of Figure 7l), with the maximum relative error reaching 6.81% at the well (see the red label in Figure 7l), where the inertial effects are especially significant due to high gas velocity. Furthermore, an interesting distribution of the relative error can also be observed in the third row. Specifically, the relative error is highest at the well location and gradually decreases in the surrounding area but then increases again at greater distances from the well. This is because the gas velocity is relatively low in regions far from the well. In such low-velocity areas, even small absolute differences between the two velocity fields can result in high relative errors, as relative errors tend to be more sensitive when the absolute velocity is low.

4.1.2. Average Matrix Permeability

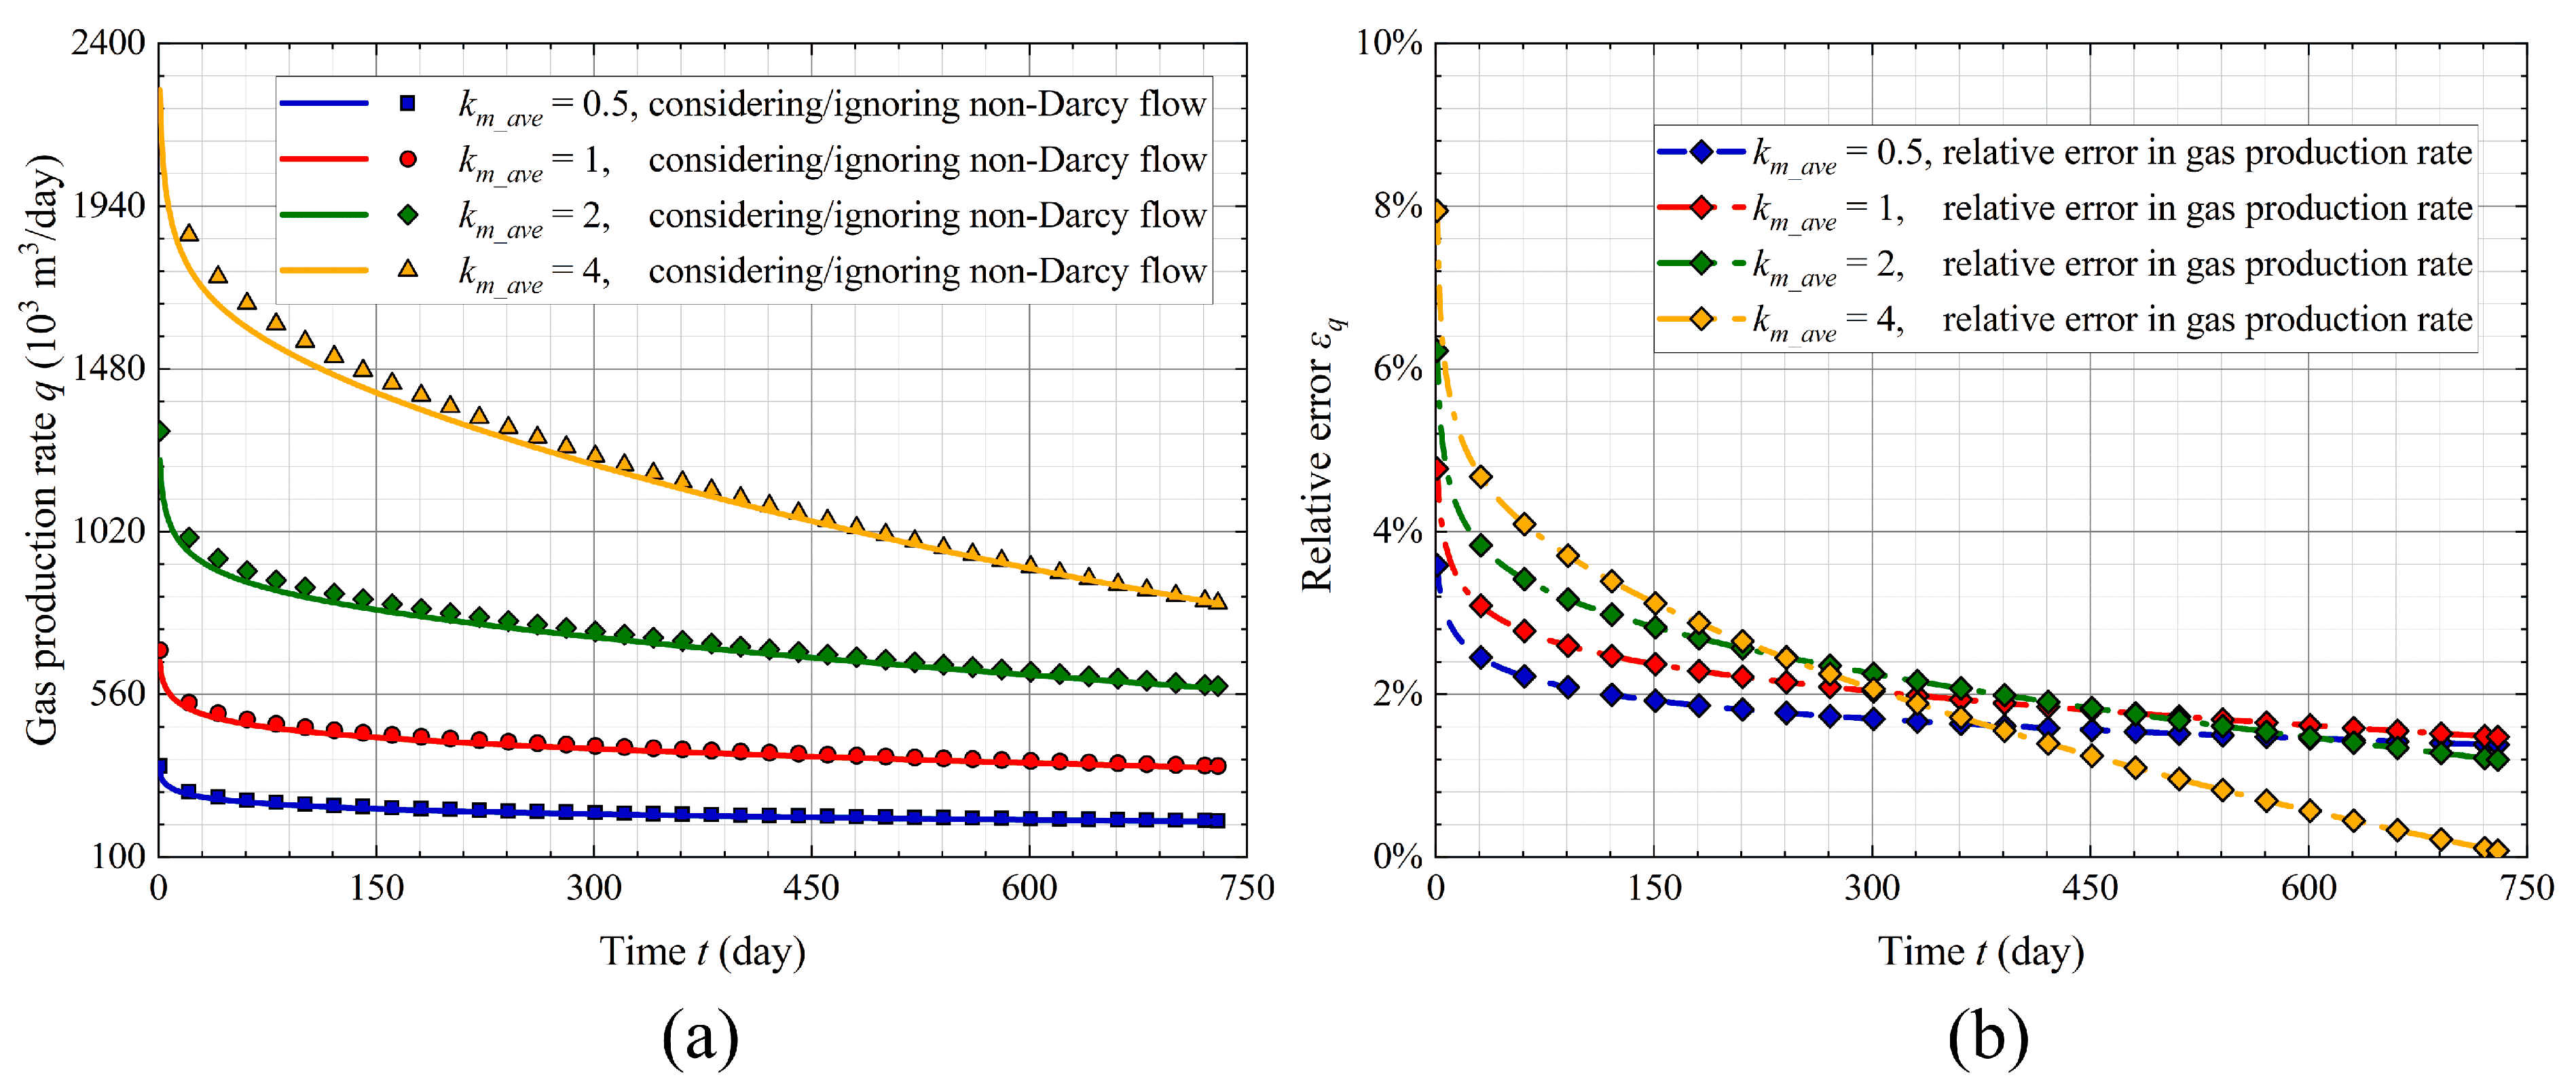
The average permeability of the matrix varies from 0.5 mD to 4 mD to assess its effect on the gas production and velocity distribution under high-velocity non-Darcy flow conditions. These values are based on previously generated random values of the benchmark models, scaled by a multiplier. Figure 8 compares the gas production rates and relative errors under different average matrix permeabilities, ranging from 0.5 mD to 4 mD. As shown in Figure 8a, the gas production rate increases with higher matrix permeability. When the permeability is low (e.g., 0.5 mD), the results from the two simulations (solid lines for considering non-Darcy flow and scatter points for ignoring it) are nearly identical, indicating that the effect of non-Darcy flow is slight under low-permeability conditions. However, as the matrix permeability increases, a noticeable deviation appears between the two results. For example, at 4 mD, the production rate predicted without considering non-Darcy flow is significantly higher, especially during the early stage of production. This suggests that the effect of non-Darcy flow becomes increasingly important and cannot be ignored in high-permeability gas reservoirs. This observation is further supported by the relative error curves shown in Figure 8b. For low-permeability cases (e.g., 0.5 mD), the relative error in production remains below 4% throughout the simulation, suggesting that the effect of non-Darcy flow is minor. In contrast, for higher-permeability cases (e.g., 1 mD, 2 mD, and 4 mD), the relative error reaches around 5–8% in the early stages and gradually decreases over time. This trend reflects the fact that the effect of non-Darcy flow is more pronounced when flow velocity is high but becomes less significant as the reservoir depletes and the flow slows down. The observed non-monotonic variation of relative error with permeability further reflects the nonlinear coupling between gas velocity and density in high-velocity flow regimes.
Figure 9 shows the gas velocity fields at the end of the simulation under different average matrix permeabilities. The first and second rows present the velocity distributions obtained by ignoring and considering non-Darcy flow, respectively. It can be observed that the gas velocity across the reservoir increases with increasing matrix permeability, consistent with the trend in production rates shown in Figure 9a. For example, when km_ave = 4 mD, the maximum gas velocities reach 12.77 m/day and 12.50 m/day for the cases ignoring and considering non-Darcy flow, respectively, both of which are significantly higher than the corresponding velocities of 2.30 m/day and 2.25 m/day at km_ave = 0.5 mD. The third row of Figure 9 (Figure 9i–l) presents the spatial distribution of relative error between the two velocity fields. As the average matrix permeability increases from 0.5 mD to 4 mD, the overall relative error does not continuously grow. Instead, it increases at first, reaches a peak at km_ave = 2 mD, and then decreases. For instance, the maximum relative error reaches 2.55% at km_ave = 2 mD but drops to 2.14% when km_ave = 4 mD. This non-linear trend results from the combined effect of flow velocity and reservoir pressure: as described in Equation (10), the non-Darcy term βρ| v | v depends not only on the flow velocity but also on the gas density ρ, which is highly sensitive to pressure variations. For high-permeability cases (e.g., km_ave = 4 mD), both the velocity and gas density are initially high, resulting in a pronounced effect of non-Darcy flow, as reflected by the large relative errors at early production times in Figure 9b. However, as production progresses, the reservoir pressure drops rapidly, causing a substantial reduction in gas density. In the later stages of production, although the flow velocity remains high, the non-Darcy correction term becomes less significant due to the decreased gas density. As a result, the relative error at the end of the simulation becomes smaller than that observed in lower-permeability cases (e.g., km_ave = 2 mD), where the velocity is lower, but the gas density remains relatively higher.

4.1.3. Number of Natural Fractures

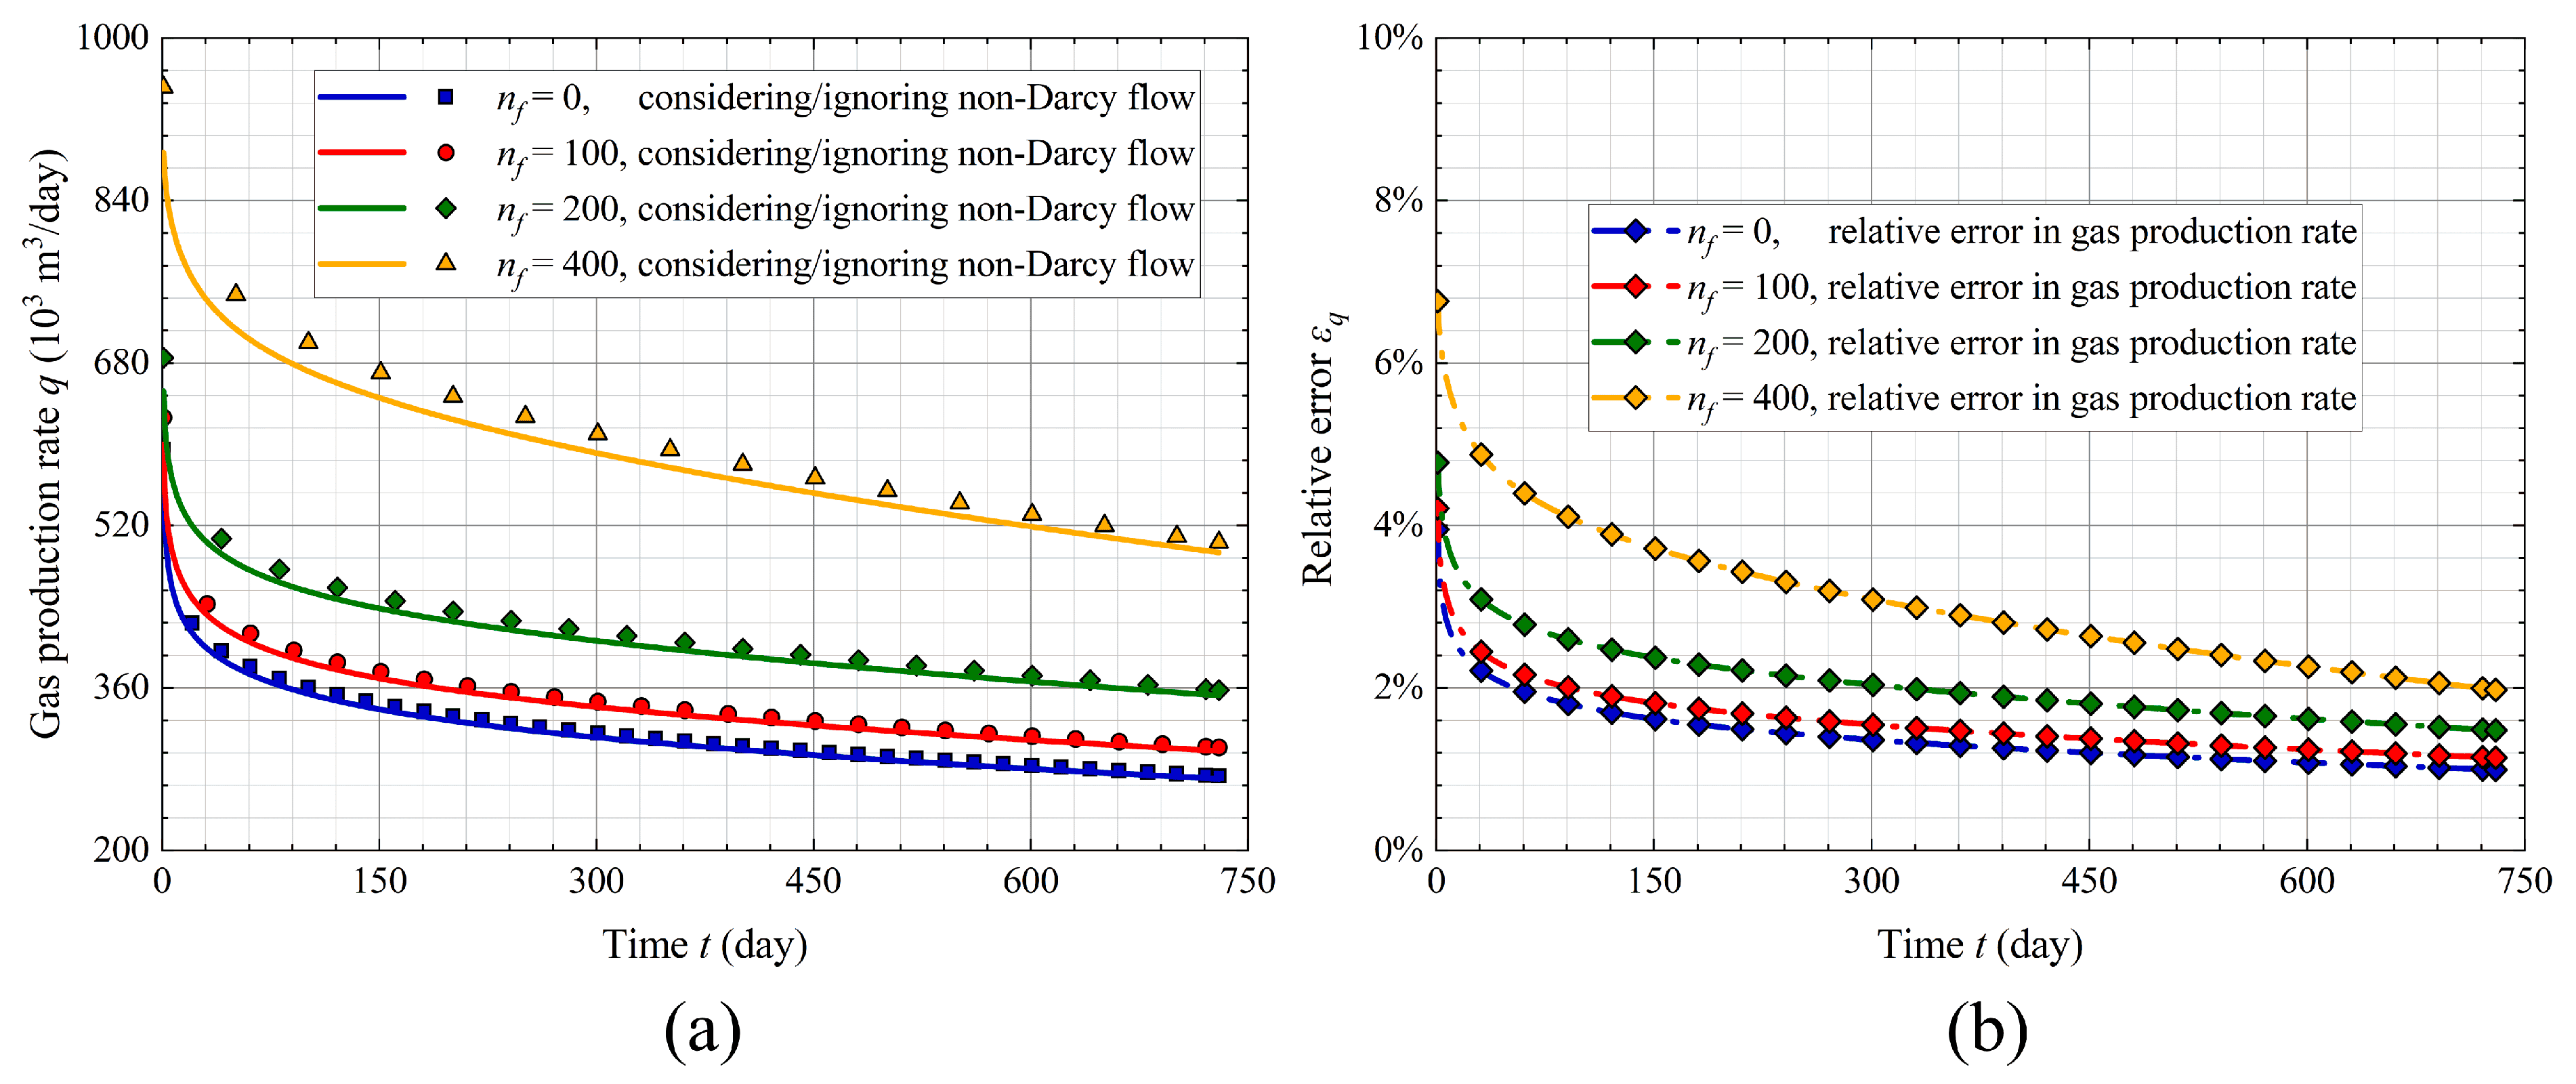
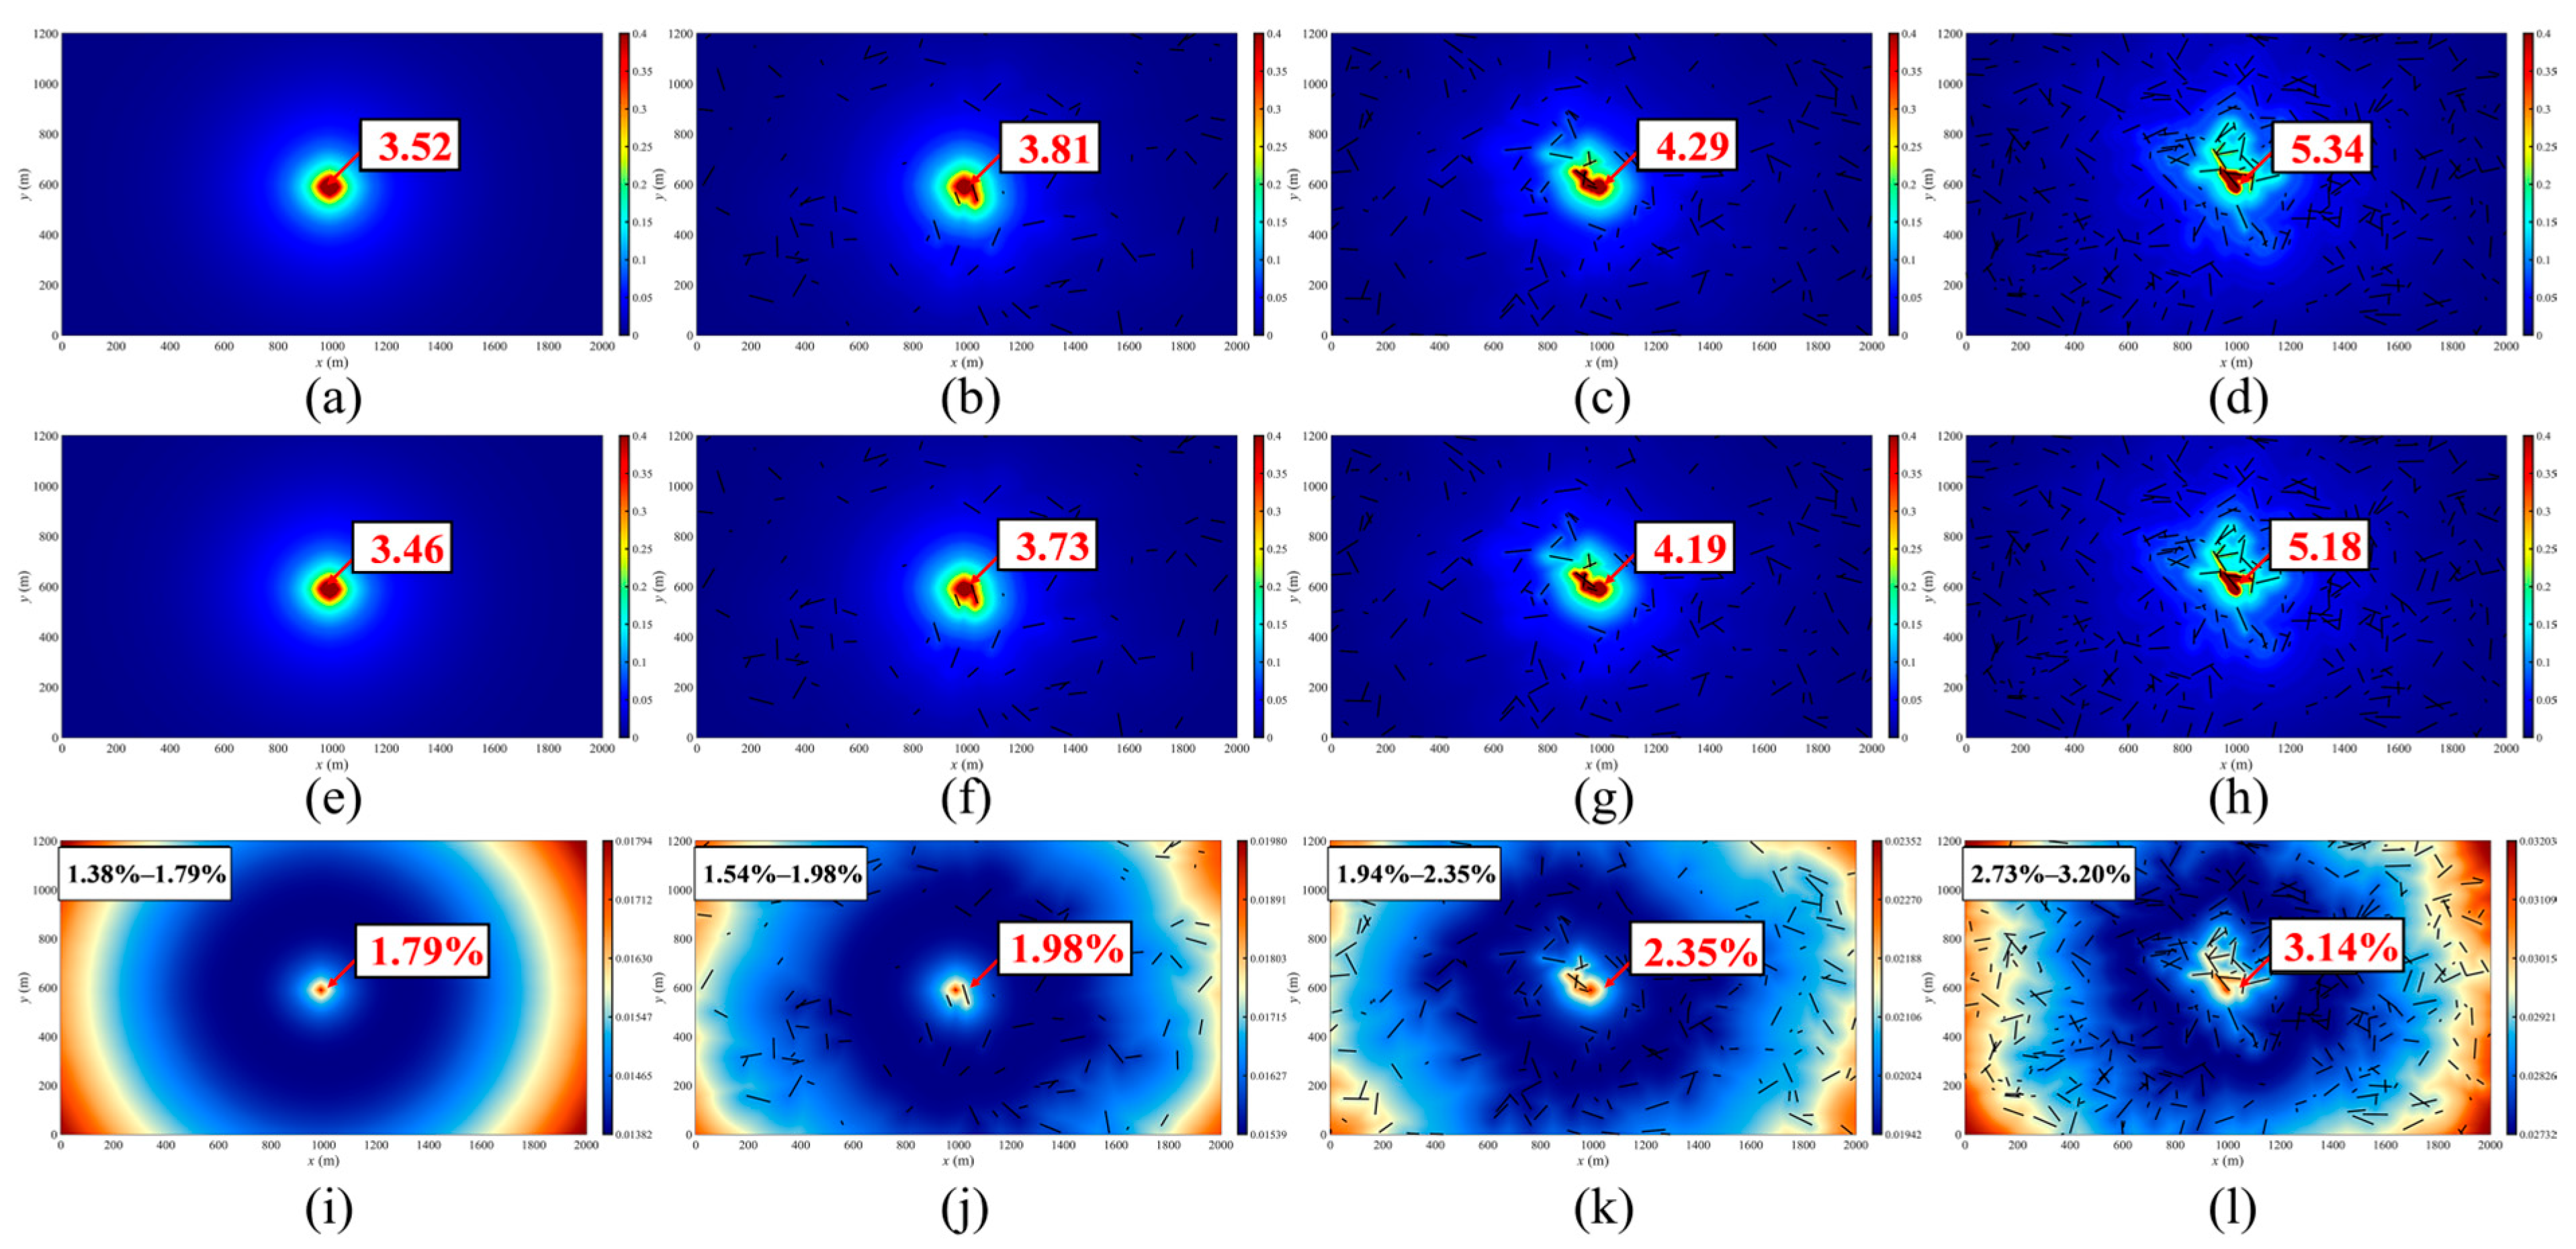
A series of natural fractures, ranging from 0 to 400 in number, is used to investigate its effect on gas production and velocity distribution under high-velocity non-Darcy flow conditions.
Figure 10 compares the gas production rates and corresponding relative errors under different numbers of natural fractures. It can be observed from Figure 10a that as the number of fractures increases from 0 to 400, the overall production rate rises significantly. This is because additional fractures enhance the reservoir connectivity and provide more flow paths, allowing for more efficient gas transport toward the wellbore. Moreover, the difference between the two simulation results (ignoring and considering non-Darcy flow) also becomes more noticeable as the number of fractures increases. This trend is further supported by the relative error curves in Figure 10b. For example, the relative error rises from approximately 3.95% when there are no natural fractures to around 6.76% when 400 fractures are present. This indicates that the effect of non-Darcy flow becomes more significant as the number of fractures increases, due to the higher flow velocities induced by improved reservoir connectivity. Furthermore, during the early production stage, the relative error exhibits a nonlinear growth trend with respect to the number of natural fractures. Specifically, when the number of natural fractures increases from 0 to 200, the relative error increases by approximately 48% compared to the case without fractures. In contrast, increasing the number from 200 to 400 leads to a further 58% increase relative to the case with 200 natural fractures. This nonlinear growth occurs because a larger number of fractures tends to form a more connected fracture system. As the connectivity increases, gas velocity rises more rapidly, which strengthens the effect of non-Darcy flow and leads to higher relative errors between gas production rates obtained with and without considering this effect.
Figure 11 shows the velocity fields at the end of the simulation under different numbers of natural fractures. The first and second rows illustrate the velocity distributions obtained by ignoring and considering non-Darcy flow, respectively. As previously discussed, increasing the number of fractures enhances reservoir connectivity and creates additional flow channels. As a result, the gas velocity within the reservoir also increases, which can be clearly observed in Figure 11. For example, when no natural fractures are present, the maximum velocities are 3.52 m/day and 3.46 m/day for the cases ignoring and considering non-Darcy flow, respectively, whereas, with 400 fractures, these values increase to 5.34 m/day and 5.18 m/day. The third row of Figure 11 (Figure 11i–l) presents the spatial distribution of relative errors between the two velocity fields. As the number of natural fractures increases, the overall relative error becomes more pronounced due to the increased flow velocities. This increase in relative error is caused by the higher flow velocities associated with a more densely connected fracture system, which strengthens the effect of non-Darcy flow and leads to larger differences between the two velocity fields.

4.1.4. Initial Reservoir Pressure

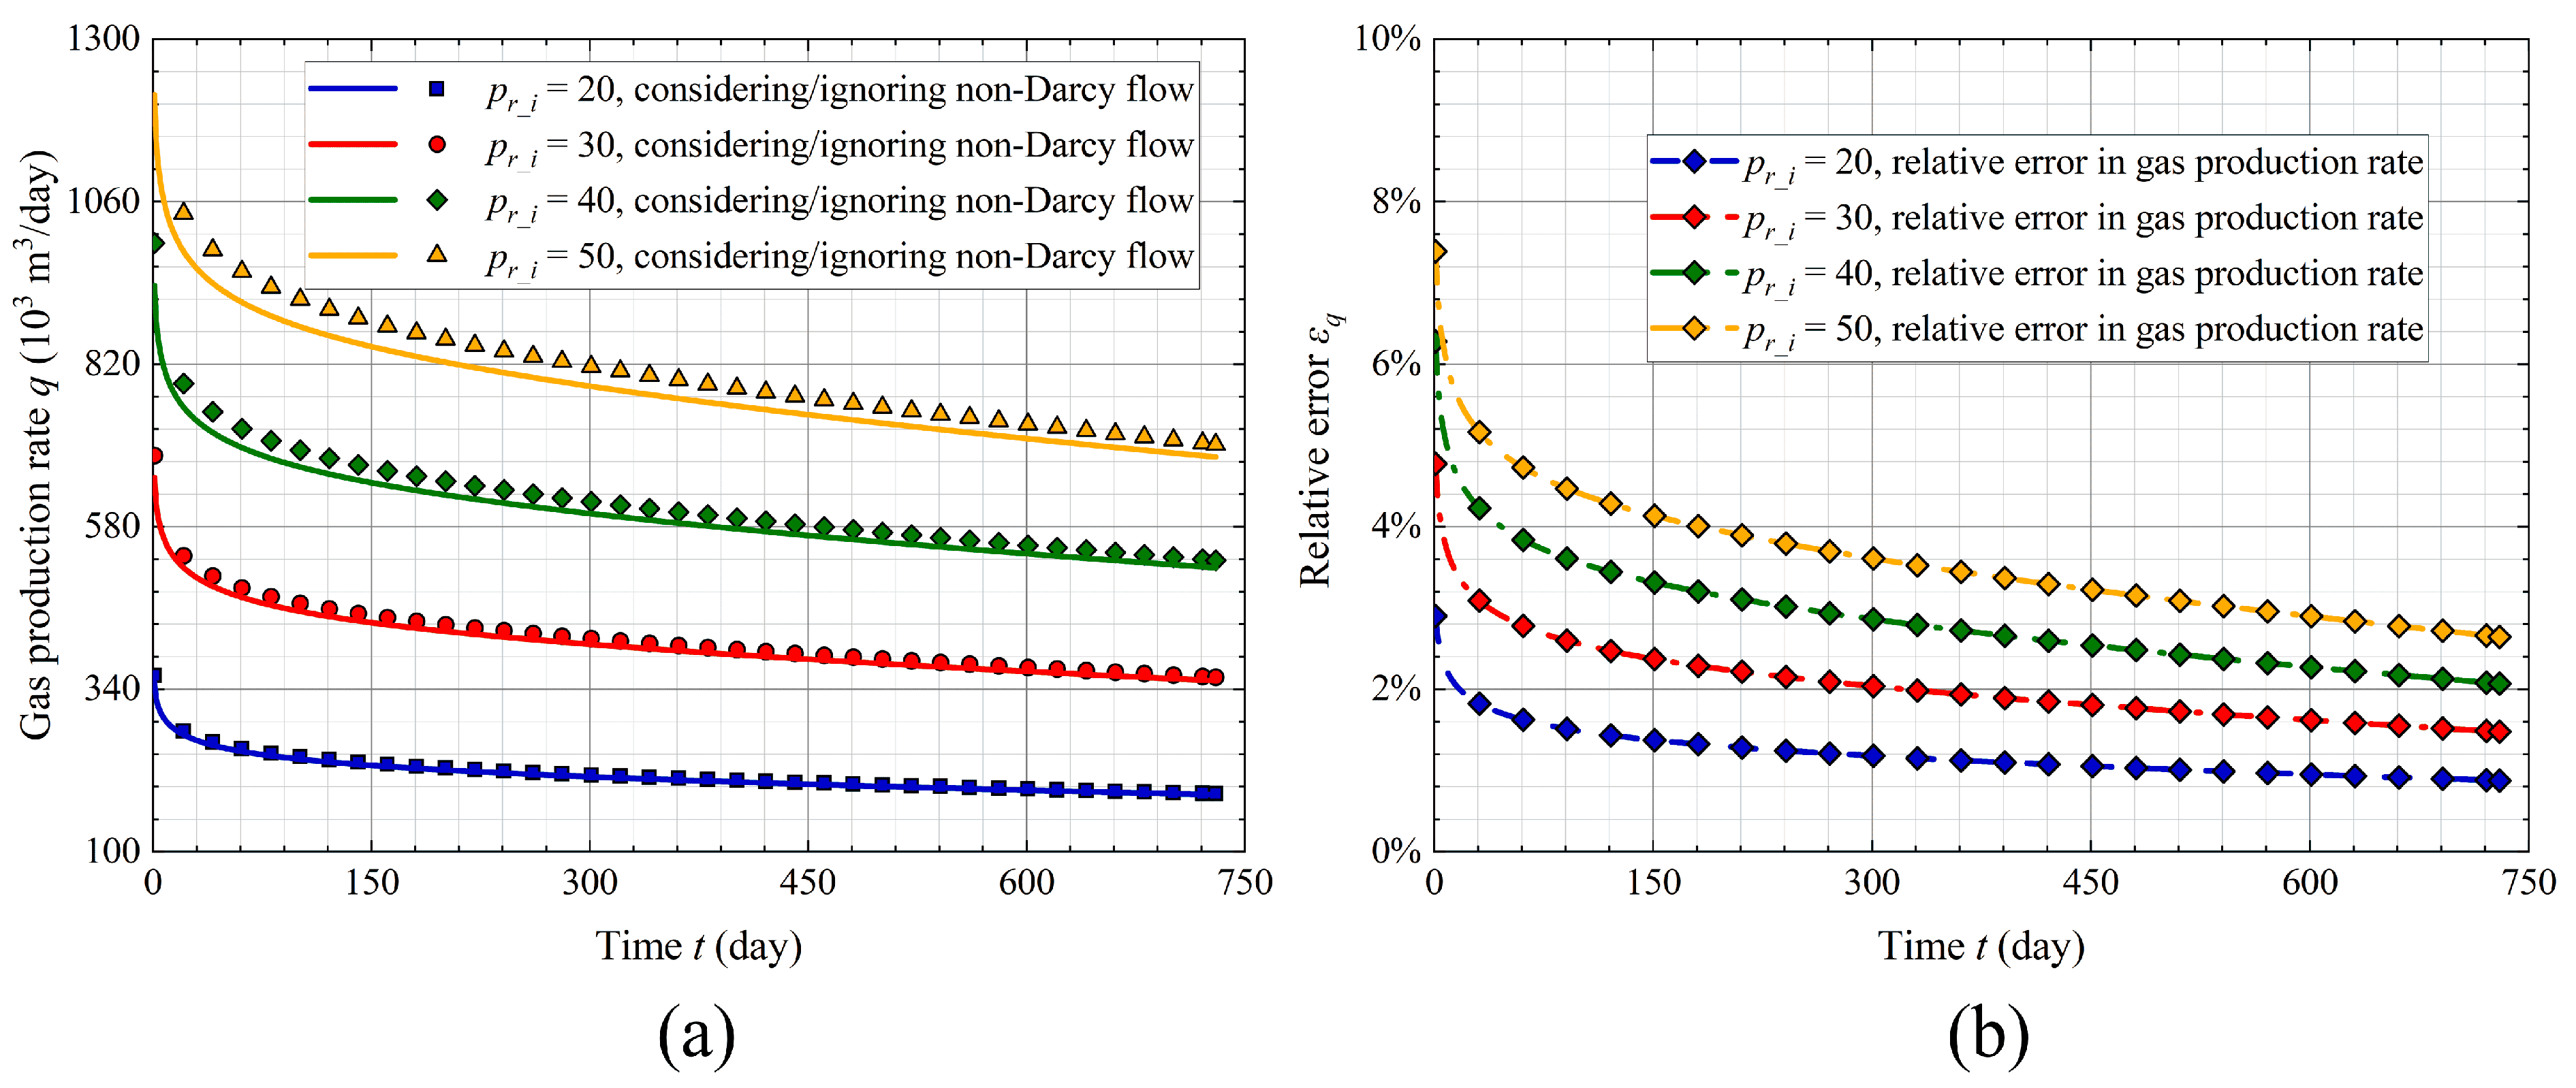
The initial reservoir pressure varies from 20 MPa to 50 MPa to examine its effect on the gas production and velocity distribution under high-velocity non-Darcy flow conditions. Figure 12 compares the gas production rate and the corresponding relative error under different initial reservoir pressures. As shown in Figure 12a, the overall production rate increases significantly with higher initial reservoir pressure. This is because a higher pressure gradient enhances the driving force for gas flow, resulting in higher gas production rates. In addition, the difference between the two simulation results (ignoring and considering non-Darcy flow) becomes more noticeable at higher pressures. This indicates that the effect of non-Darcy flow becomes increasingly significant as initial pressure increases, showing a similar trend to that observed under varying matrix permeabilities. However, despite this similarity, the temporal behaviors of relative errors exhibit obvious differences between the two cases. In the high-permeability scenarios (e.g., km_ave = 4 mD), the relative error is initially large but declines rapidly as production progresses. In contrast, as shown in Figure 12b, for higher initial reservoir pressures (e.g., 50 MPa, the yellow dotted line), the relative error remains consistently high throughout most of the production period and is significantly greater than that observed in the low-pressure case (e.g., 40 MPa, the green dotted line). This difference arises because higher initial pressure leads to a slower pressure decline, thereby maintaining higher gas density during the simulation. Since the non-Darcy correction term βρ| v | v depends on both velocity and gas density, the effect of non-Darcy flow remains strong over time. In contrast, in high-permeability cases (e.g., km_ave = 4 mD), the reservoir pressure drops rapidly, resulting in a sharp decrease in gas density, which in turn reduces the effect of non-Darcy flow in the later production stage.
Figure 13 displays the velocity fields at the end of the simulation for different initial reservoir pressures. The first and second rows represent the velocity fields without and with consideration of non-Darcy flow, respectively. As initial pressure increases from 20 MPa to 50 MPa, the maximum velocity in the reservoir also rises. For example, when pr_i = 20 MPa, the maximum velocities are 3.04 m/day and 3.00 m/day for the cases ignoring and considering non-Darcy flow, respectively, whereas for pr_i = 50 MPa, these values increase to 6.21 m/day and 5.98 m/day. The third row of Figure 13i–l shows the spatial distribution of relative errors between the two velocity fields. As the initial reservoir pressure increases, the relative error becomes more pronounced. This is because the larger pressure gradients can induce higher gas velocities, which enhance the effect of non-Darcy flow and result in greater differences in velocity fields.

4.2. Field Case Demonstration

In particular, field reservoirs frequently exhibit high initial pressures and substantial pressure gradients near the wellbore. As discussed in the previous section, the impact of non-Darcy flow becomes increasingly significant under such high-pressure conditions, where the inertial resistance can no longer be neglected. Therefore, the proposed method is used to fit production data of gas wells under realistic reservoir conditions.
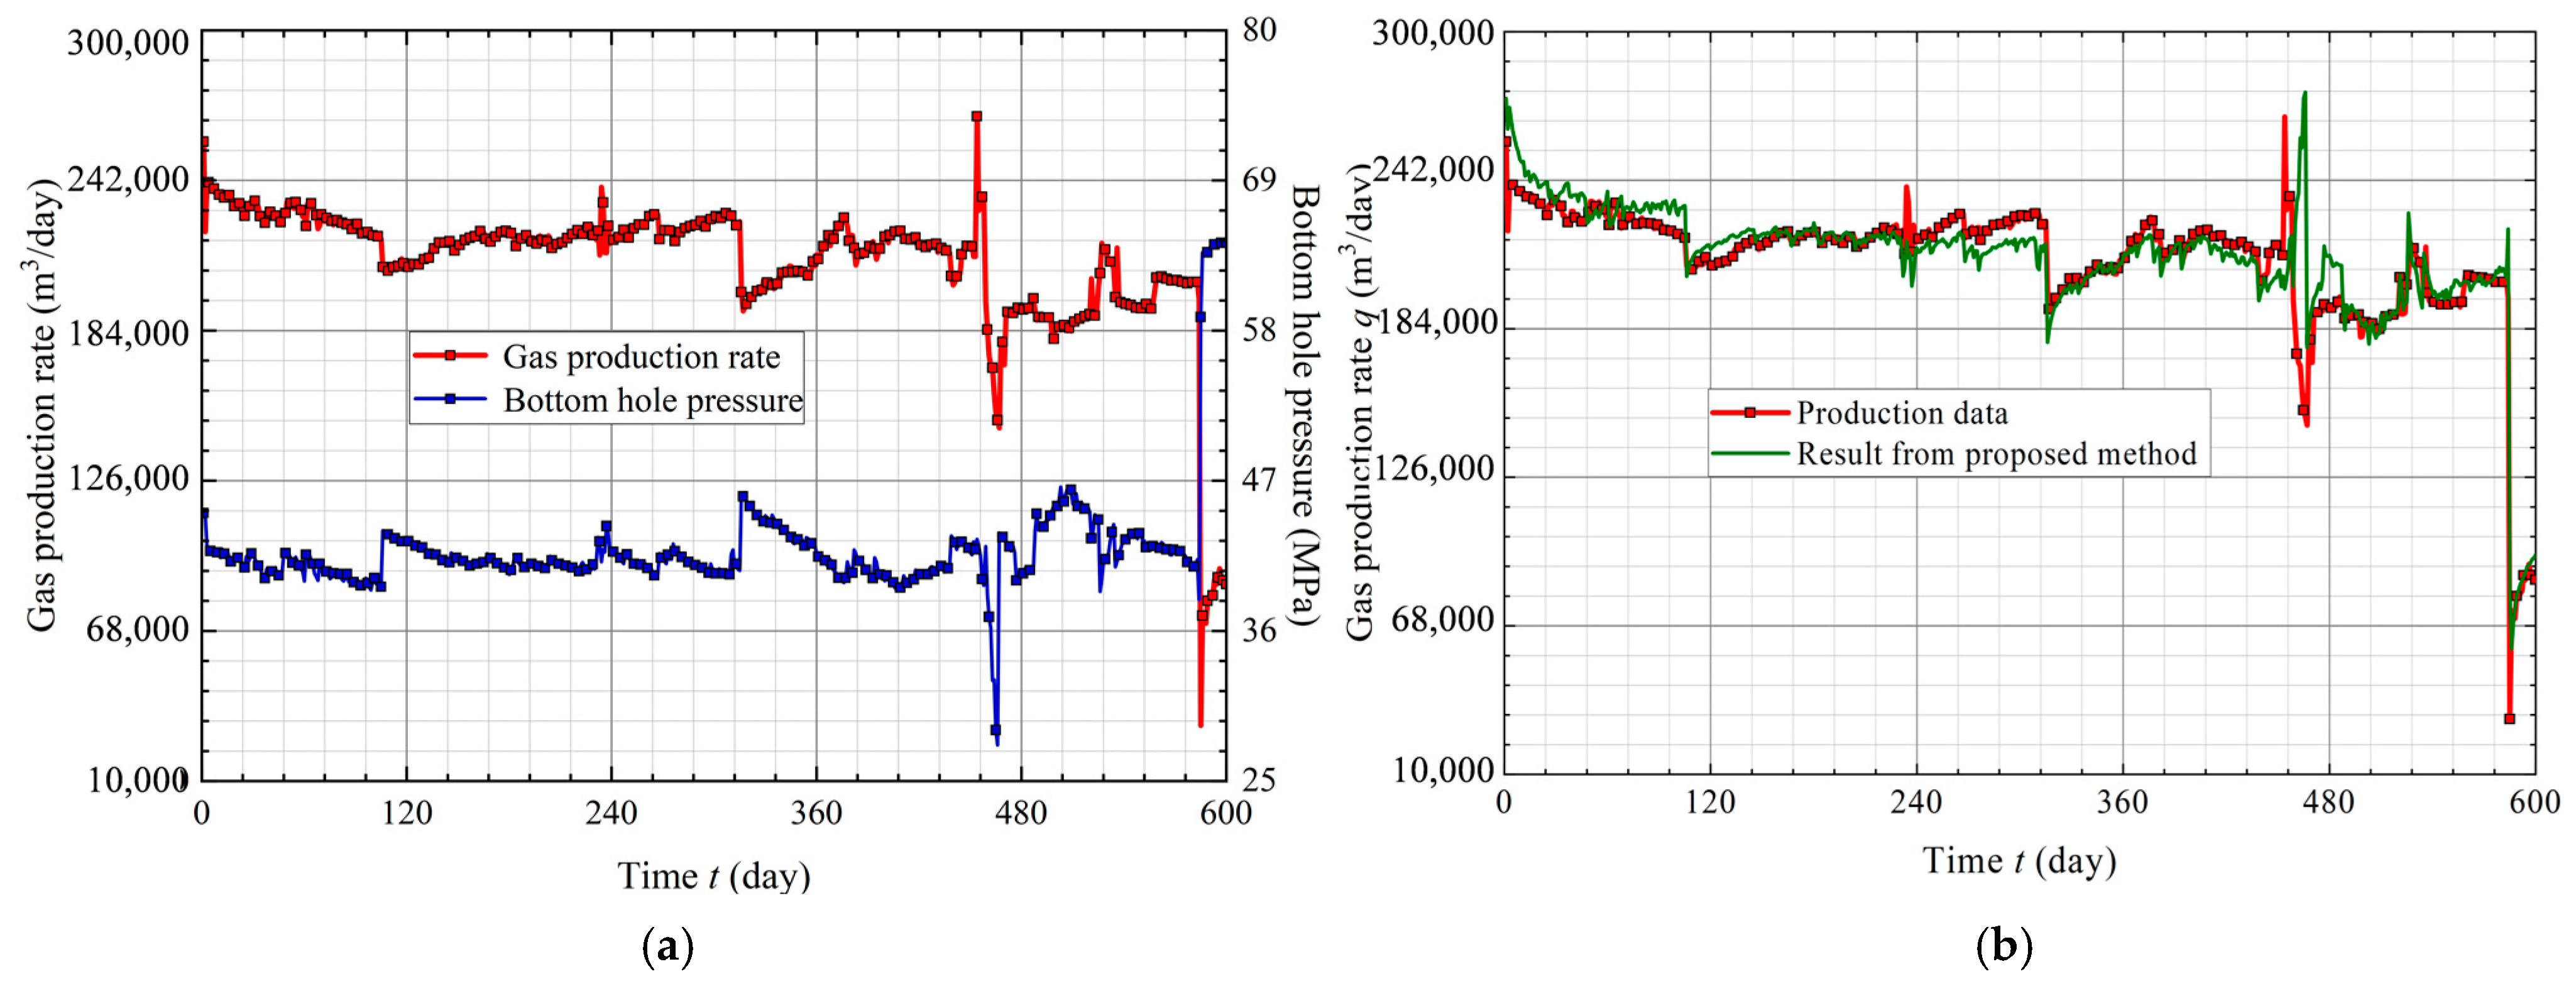
The production data analyzed in this section are from a gas well that operates under high-pressure conditions, producing naturally without artificial lift. The gas production rate and bottom-hole pressure over time are shown in Figure 14a. The reservoir has a porosity of 0.102, an initial pressure of 64.71 MPa, and a temperature of 152.16 °C. Its dimensions are 500 m × 500 m × 81.7 m, and the wellbore radius is 0.0723 m. Since the matrix permeability and the Forchheimer coefficient are not directly available from measurements, they are obtained through history matching. The fitted values are 0.1072 mD for matrix permeability and 1.1681 × 10¹³ m−1 for the Forchheimer coefficient. As shown in Figure 14b, the simulated results agree well with the measured production data throughout the 600-day production period, demonstrating that the proposed method can accurately capture the dynamic performance of the self-flowing gas well. The minor local discrepancies are primarily due to operational and measurement uncertainties in the field, rather than limitations of the model itself. Although this field case involves temperature and pressure conditions that differ significantly from those in the validation models, the pseudo-pressure and pseudo-time transformations inherently capture the pressure dependence of gas properties, while the DTOF approach ensures physical consistency under varying thermodynamic conditions. The close match between the two indicates that the method effectively captures the production dynamics of self-flowing gas wells under high-pressure, non-Darcy flow conditions. This demonstrates the method’s potential for practical applications where the effect of non-Darcy flow is non-negligible.

5. Recommendations and Conclusions

In this work, by incorporating the concept of diffusive time of flight (DTOF) with the Forchheimer equation, the authors proposed a fast simulation method for modeling high-velocity non-Darcy gas flow in heterogeneous fractured reservoirs. The accuracy of the proposed method is validated through comparison with commercial software COMSOL Multiphysics, showing good agreement in gas production results. According to the results obtained in this work, the authors provided the following recommendations and conclusions:
1.
In this work, the gas continuity equation is transformed into a linear form using the definition of normalized pseudo-pressure and pseudo-time, effectively accounting for the pressure dependence of gas properties. Based on this transformed equation, the Eikonal equation is derived to determine the spatial distribution of the diffusive time of flight (DTOF), which characterizes the propagation of pseudo-pressure disturbances through the reservoir.
2.
By using DTOF as a spatial coordinate, the proposed method allows the pseudo-pressure and velocity to be solved in a one-dimensional domain instead of the original three-dimensional Cartesian space. This approach simplifies the numerical procedure and enables fast simulation of high-velocity non-Darcy gas flow in complex heterogeneous and fractured reservoirs.
3.
The proposed method can accurately capture gas production performance while significantly reducing computational time compared to the conventional numerical approaches, and this computational advantage becomes increasingly evident in more complex fracture scenarios.
4.
In high-velocity gas reservoirs, the flow resistance caused by the effect of non-Darcy flow becomes significant, which leads to a noticeable reduction in gas velocity and production rate. Ignoring this effect can result in significant overestimation of gas recovery. Therefore, it is necessary to incorporate non-Darcy flow in gas production simulations to ensure reliable results.
5.
The effect of non-Darcy flow on gas production and velocity becomes more significant with increasing Forchheimer coefficient, number of natural fractures, and initial reservoir pressure, as these factors lead to higher flow velocities. In comparison, under high matrix permeability, the effect of non-Darcy flow is significant at the early production stage but decreases quickly due to rapid pressure decline.
6.
As reflected in the non-Darcy correction term βρ| v | v , the effect of non-Darcy flow depends not only on gas velocity but also on gas density (highly sensitive to pressure). Therefore, both velocity and pressure should be considered when evaluating the effect of non-Darcy flow in gas reservoir simulations.
7.
The proposed method effectively captures the nonlinear behavior of high-velocity non-Darcy gas flow, though several simplifications remain, including the Darcy-based τ-field, single-phase flow, and 2D configuration. While current validation focuses on production rates and computational efficiency, future work will incorporate detailed analysis of local non-Darcy characteristics—particularly the nonlinear velocity–pressure relationship—to further verify the physical accuracy of the model. These aspects will be systematically addressed in future multiphase and 3D model extensions.

Author Contributions

Methodology, J.B.; Software, J.L.; Validation, W.Z.; Investigation, J.B.; Resources, Q.L.; Writing—original draft, J.B.; Writing—review & editing, B.T. All authors have read and agreed to the published version of the manuscript.

Funding

The authors would like to acknowledge the financial support provided by “National Natural Science Foundation of China” (No. 52474051).

Data Availability Statement

The original contributions presented in this study are included in the article. Further inquiries can be directed to the corresponding author.

Conflicts of Interest

Author Jiazheng Liu was employed by the company CNOOC China Limited, Zhanjiang Branch. The remaining authors declare that the research was conducted in the absence of any commercial or financial relationships that could be construed as a potential conflict of interest.

Nomenclature

Aflow area enclosed by the iso-τ contour at a given τ, m2
B divergence of a vector field in the (τ, φ, λ) coordinate
ccompressibility, MPa−1
hthe local distances corresponding to unit changes in each direction of the (τ, φ, λ) coordinate
Jlocal volume scaling factor in the (τ, φ, λ) coordinate
kpermeability, mD
Mgas molar mass, g/mol
ppressure, MPa
qgas production rate, m3/day
Runiversal gas constant, J/(mol·K)
r position vector in the original Cartesian coordinate
Treservoir temperature, K
ttime, day
v gas flow velocity, m/day
VPcumulative pore volume, m3
Zcompressibility factor
τdiffusive time of flight required for a pressure disturbance from a well to propagate to a specific location in the reservoir, day0.5
βForchheimer coefficient, m−1
ρgas density, kg/m3
μgas viscosity, mPa·s
ϕporosity
αdiffusivity, m2/day
ω(τ)derivative of the pore volume along the τ direction, m3/ day0.5
εrelative error
Subscripts
Darcyignoring the non-Darcy flow
ffracture
ggas
iinitial state
mmatrix
Non-Darcyconsidering the non-Darcy flow
nnormalized pseudo
qgas production rate
rreservoir
ttotal
vvelocity

Appendix A. Fast Marching Method for Solving the Eikonal Equation

The FMM is a numerical method proposed for quickly solving the front propagation problem, which is based on the idea of Dijkstra’s method and gradually updates the distance field or time field, thereby ensuring the optimality of each step of calculation and avoiding the backtracking and iteration problems that may occur in traditional methods. The FMM can be used to efficiently solve the Eikonal equation (i.e., Equation (8)) to calculate the diffusive time of flight τ. The Eikonal equation in the 3D Cartesian coordinates can be written as [6]:
max ( D x , D + x , 0 ) 2 + max ( D y , D + y , 0 ) 2 + max ( D z , D + z , 0 ) 2 = 1
where the operator D for ±x takes form as D+x = (τi,j,kτi+1,j,k)/s+x and D−x = (τi,j,kτi−1,j,k)/s−x. The operators in the ±y and ±z directions can be obtained by similar equations. The s+x and sx are the average slowness, which are inverse to the pseudo-pressure front propagation speed and can be calculated by [6]:
s + x = L i , j , k 2 α i , j , k + L i + 1 , j , k 2 α i + 1 , j , k s x = L i , j , k 2 α i , j , k + L i 1 , j , k 2 α i 1 , j , k
where Li,j,k, Li+1,j,k, Li−1,j,k, is the length of the ith, (i + 1)th and (i − 1)th grids in the x direction, respectively, α is the diffusivity. s±y, s±z can be calculated with similar equations.
However, Equations (A1) and (A2) primarily account for matrix-to-matrix fluid flow. To extend the calculation to include fluid flow within the matrix–fracture system, Li and Teng [27] introduced the EDFM method to compute the operator D. The operator Dmf between matrix grids and fracture cells can be calculated by [27]:
D m f = τ m τ f s m f   , s m f = d m f 2 α m + L f 2 α f
where dmf is the weighted average of normal distances from the sub-element centers of the matrix grids to the fracture cell, Lf is the fracture cell length. The operator Df_int of intersecting fracture cells can be calculated by [27]:
D f _ int = τ i n t 1 τ i n t 2 s f _ int   , s f _ int = d i n t 1 2 α i n t 1 + d i n t 2 2 α i n t 2
where dint1 and dint2 are the weighted average of normal distances from the sub-element centers of the intersection fracture cells to the intersection line. For fracture cells within an individual fracture, the operator D f_celi+ and D f_celi− can be calculated by [27]:
D f _ c e l l + = τ c e l l _ i τ c e l l _ i + 1 s f _ c e l l +   , s f _ c e l l + = d c e l l _ i α c e l l _ i + d c e l l _ i + 1 α c e l l _ i + 1 D f _ c e l l - = τ c e l l _ i τ c e l l _ i - 1 s f _ c e l l -   , s f _ c e l l - = d c e l l _ i α c e l l _ i + d c e l l _ i - 1 α c e l l _ i - 1
where dcell_i−1, dcell_i, and dcell_i+1 are the distance from the cell centers to the common surface. By incorporating Dmf, Df_int, D f_cell+, and D f_cell− into Equation (A1), the equation is extended to account for complex fracture networks. For matrix grids, the modified equations are expressed as:
τ m 1 = max D x , D + x , 0 2 + max D y , D + y , 0 2 = 1
and
τ m 2 = max D m f , 0 2 = 1
Equation (A6) is used to calculate the τ value for a grid based on the τ values of its adjacent matrix grids (denoted as τm1), while Equation (A7) is based on the τ values of the embedded fracture cells (denoted as τm2). The final τ value for the matrix grid is chosen as the minimum of these two values, which is given as follows:
τ m = min τ m 1 , τ m 2
For fracture cells, the modified equations take the forms of:
τ f 1 = max D f _ c e l l , D f _ c e l l + , 0 2 = 1
τ f 2 = max D f _ int , 0 2 = 1
τ f 3 = max D m f , 0 2 = 1
Equation (A9) is used to calculate the τ value for a cell based on the τ values of its non-adjacent connected fracture cells within the same fracture (denoted as τf1), while Equations (A10) and (A11) are based on the τ values of the intersecting fracture cells (denoted as τf2) and the matrix grid it embed (denoted as τf3), respectively. The final τ value for the fracture cell is chosen as the minimum of these three values, which is given as follows:
τ f = min τ f 1 , τ f 2 , τ f 3
It is worth noting that if the τ value of the grids surrounding the ith matrix grid is unknown, the corresponding operator D in Equation (A6) needs to be discarded. For example, if the τ value of the (i + 1)th grid is unknown, Equation (A6) will be written as:
max D x , 0 2 + max D y , D + y , 0 2 = 1
As such, the only unknown parameter is the τi,j, and it can be easily obtained by solving the quadratic Equation (A13). In addition, if there is no fracture cell embedded in the ith matrix grid, the τ value of the ith matrix grid can be directly calculated using Equation (A6), as Equation (A7) relies on the τ value of the embedded fracture cells, which are not present in this case. A similar approach is used when calculating the τ values for fracture cells. The core of the FMM is to calculate the τ of neighboring cells of known τ points by using Equations (A6) and (A7). The framework for solving the Eikonal equation using FMM is as follows [6,28]:
(1)
Determine the initial grids (cells) and assign them a τ value, then label the initial grids (cells) as the frozen grids (cells). (Generally, the τ of the initial grids is set to 0).
(2)
Find the grids adjacent to the frozen grids (cells) and label the adjacent grids (cells) as the pre-frozen grids (cells).
(3)
Calculate the τ value of all pre-frozen matrix and fracture grids using Equations (A6)–(A8) and Equations (A9)–(A12), respectively. Then compare the τ values of all pre-frozen grids (cells) and label the grid (cell) with the smallest τ value as the frozen grid (cell).
(4)
Repeat steps 2 to 3 until all grids (cells) are labeled as frozen grids (cells).

References

  1. Holditch, S.A.; Morse, R.A. The effects of non-Darcy flow on the behavior of hydraulically fractured gas wells (includes associated paper 6417). J. Pet. Technol. 1976, 28, 1169–1179. [Google Scholar] [CrossRef]
  2. Zhang, R.; Wu, Y.S.; Fakcharoenphol, P. Non-Darcy displacement in linear composite and radial aquifer during CO2 sequestration. Int. J. Oil Gas Coal Technol. 2014, 7, 244–262. [Google Scholar] [CrossRef]
  3. Liu, X.; Geng, S.; Sun, J.; Li, Y.; Guo, Q.; Zhan, Q. Novel coupled hydromechanical model considering multiple flow mechanisms for simulating underground hydrogen storage in depleted low-permeability gas reservoir. Int. J. Hydrogen Energy 2024, 85, 526–538. [Google Scholar] [CrossRef]
  4. Wang, L.; Zhu, L.; Cao, Z.; Liu, J.; Xue, E.; Wang, P.; Cao, X.; Liu, Y. Thermo-mechanical degradation and fracture evolution in low-permeability coal subjected to cyclic heating–cryogenic cooling. Phys. Fluids 2025, 37, 086617. [Google Scholar] [CrossRef]
  5. Cao, Z.; Xiong, Y.; Xiong, Y. Diffusion Evolution Rules of Grouting Slurry in Mining-induced Cracks in Overlying Strata. Rock Mech. Rock Eng. 2025, 58, 6493–6512. [Google Scholar] [CrossRef]
  6. Zhang, F.; Yang, D.T. Effects of non-Darcy flow and penetrating ratio on performance of horizontal wells with multiple fractures. In Proceedings of the SPE Unconventional Resources Conference Canada, Calgary, AB, Canada, 5–7 November 2013. [Google Scholar]
  7. Zhang, W.; Dai, B.; Liu, Z.; Zhou, C. A pore-scale numerical model for non-Darcy fluid flow through rough-walled fractures. Comput. Geotech. 2017, 87, 139–148. [Google Scholar] [CrossRef]
  8. Forchheimer, P. Wasserbewegung durch Boden. Z. Ver. Dtsch. Ing. 1901, 45, 1782–1788. [Google Scholar]
  9. Friedel, T.; Voigt, H.D. Investigation of non-Darcy flow in tight-gas reservoirs with fractured wells. J. Pet. Sci. Eng. 2006, 54, 112–128. [Google Scholar] [CrossRef]
  10. Mustapha, H.; de Langavant, L.; Giddins, M.A. Darcy and non-Darcy flows in fractured gas reservoirs. In Proceedings of the SPE Reservoir Characterisation and Simulation Conference and Exhibition, Abu Dhabi, United Arab Emirates, 14–16 September 2015. [Google Scholar]
  11. Fan, M.; McClure, J.; Han, Y.; Ripepi, N.; Westman, E.; Gu, M.; Chen, C. Using an experiment/simulation-integrated approach to investigate fracture-conductivity evolution and non-Darcy flow in a proppant-supported hydraulic fracture. SPE J. 2019, 24, 1912–1928. [Google Scholar] [CrossRef]
  12. Berawala, D.S.; Andersen, P.Ø. Numerical investigation of Non-Darcy flow regime transitions in shale gas production. J. Pet. Sci. Eng. 2020, 190, 107114. [Google Scholar] [CrossRef]
  13. Jaber, A.K.; Al-Jawad, S.N.; Alhuraishawy, A.K. A review of proxy modeling applications in numerical reservoir simulation. Arabian J. Geosci. 2019, 12, 701. [Google Scholar] [CrossRef]
  14. Rios, V.S.; Avansi, G.D.; Schiozer, D.J. Practical workflow to improve numerical performance in time-consuming reservoir simulation models using submodels and shorter period of time. J. Pet. Sci. Eng. 2020, 195, 107547. [Google Scholar] [CrossRef]
  15. Wang, J.G.; Kabir, A.; Liu, J.; Chen, Z. Effects of non-Darcy flow on the performance of coal seam gas wells. Int. J. Coal Geol. 2012, 93, 62–74. [Google Scholar] [CrossRef]
  16. Kulkarni, K.N.; Datta-Gupta, A.; Vasco, D.W. A streamline approach for integrating transient pressure data into high-resolution reservoir models. SPE J. 2001, 6, 273–282. [Google Scholar] [CrossRef]
  17. Zhang, Y.; Bansal, N.; Fujita, Y.; Datta-Gupta, A.; King, M.J.; Sankaran, S. From streamlines to Fast Marching: Rapid simulation and performance assessment of shale-gas reservoirs by use of diffusive time of flight as a spatial coordinate. SPE J. 2016, 21, 1883–1898. [Google Scholar] [CrossRef]
  18. Fujita, Y.; Datta-Gupta, A.; King, M.J. A comprehensive reservoir simulator for unconventional reservoirs that is based on the fast marching method and diffusive time of flight. SPE J. 2016, 21, 2276–2288. [Google Scholar] [CrossRef]
  19. Teng, B. Simulation model size reduction using volume of investigation by fast marching method. J. Pet. Sci. Eng. 2020, 191, 107183. [Google Scholar] [CrossRef]
  20. Chen, H.; Li, A.; Terada, K.; Datta-Gupta, A. Rapid simulation of unconventional reservoirs by multidomain multiresolution modeling based on the diffusive time of flight. SPE J. 2023, 28, 1083–1096. [Google Scholar] [CrossRef]
  21. Ghedan, S.G.; Aljawad, M.S.; Poettmann, F.H. Compressibility of natural gases. J. Pet. Sci. Eng. 1993, 10, 157–162. [Google Scholar] [CrossRef]
  22. Zimmerman, R.W. Compressibility of Sandstones; Elsevier: New York, NY, USA, 1991. [Google Scholar]
  23. Al-Hussainy, R.; Ramey, H.J., Jr.; Crawford, P.B. The flow of real gases through porous media. J. Pet. Technol. 1966, 18, 624–636. [Google Scholar] [CrossRef]
  24. Lee, W.J.; Rollins, J.B.; Spivey, J.P. Pressure-Transient Testing; SPE Textbook Series; Society of Petroleum Engineers: Richardson, TX, USA, 2003. [Google Scholar]
  25. Kim, J.U.; Datta-Gupta, A.; Brouwer, R.; Haynes, B. Calibration of high-resolution reservoir models using transient pressure data. In Proceedings of the SPE Annual Technical Conference and Exhibition, New Orleans, LA, USA, 4–7 October 2009. [Google Scholar]
  26. Xie, J.; Yang, C.; Gupta, N.; King, M.J.; Datta-Gupta, A. Depth of investigation and depletion in unconventional reservoirs with fast-marching methods. SPE J. 2015, 20, 831–841. [Google Scholar] [CrossRef]
  27. Li, Q.; Teng, B. Rapid Numerical Simulation of Heat Transfer in Fractured Geothermal Reservoirs Based on Dynamic Thermal Influence Volume. SPE J. 2025, 30, 3029–3047. [Google Scholar] [CrossRef]
  28. Sethian, J.A. Fast Marching Methods. SIAM Rev. 1999, 41, 199–235. [Google Scholar] [CrossRef]
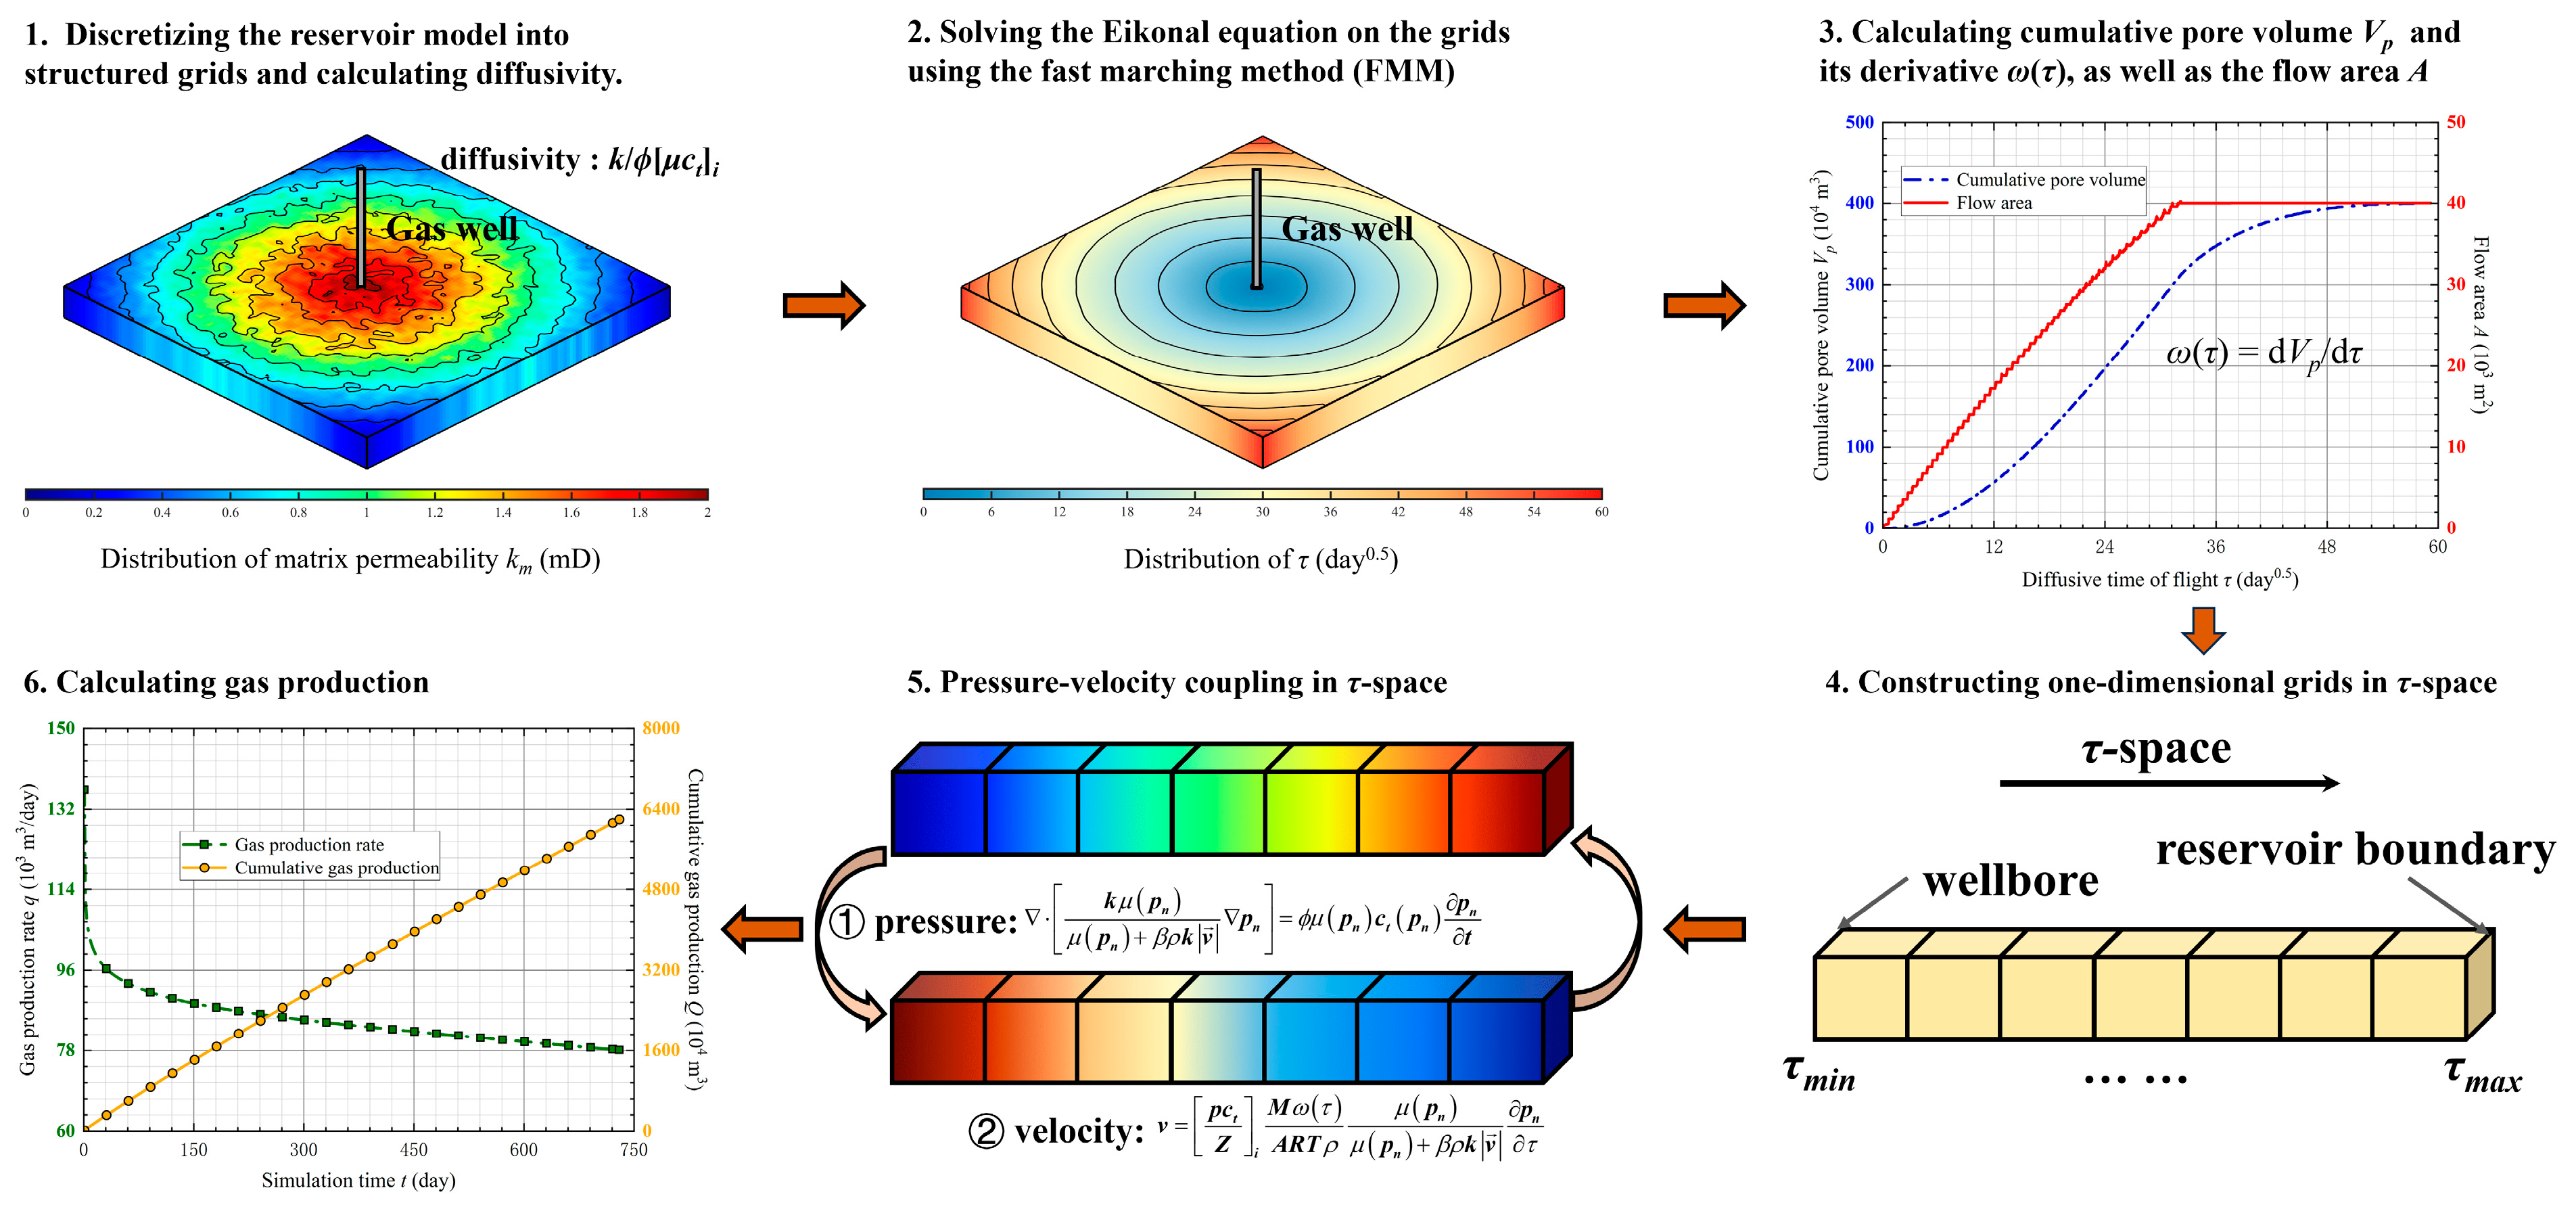
Figure 1. Numerical framework of the proposed method for reducing 3D high-velocity non-Darcy gas flow to a 1D problem via diffusive time of flight.
Energies 18 05891 g001
Figure 2. Pressure–velocity coupling and iteration procedure.
Energies 18 05891 g002
Figure 3. Illustrations of fracture distributions and corresponding mesh discretizations for two-dimensional gas reservoir models with different numbers of natural fractures: (ad) illustrations of fracture distributions; (eh) mesh discretization of gas reservoir models using COMSOL Multiphysics. In each row, subfigures from left to right correspond to nf = 0, 50, 100, 200, respectively.
Energies 18 05891 g003
Figure 4. Validation of the proposed method by comparison with COMSOL Multiphysics: (a) comparison of gas production rates over time; (b) comparison of computational time.
Energies 18 05891 g004
Figure 5. Illustration of the benchmark gas reservoir model: (a) spatial distribution of the well and randomly generated natural fractures; (b) spatial distribution of the heterogeneous matrix permeability.
Energies 18 05891 g005
Figure 6. Comparison of gas production rate and relative error under different Forchheimer coefficients: (a) gas production rate considering and ignoring non-Darcy flow; (b) relative errors in gas production rate between simulations considering and ignoring non-Darcy flow.
Energies 18 05891 g006
Figure 7. Comparison of velocity fields at the end of the simulation (i.e., 730th day) under different Forchheimer coefficients: (ad) velocity fields ignoring non-Darcy flow (m/day); (eh) velocity fields considering non-Darcy flow (m/day); (il) relative errors between the two velocity fields. In each row, subfigures from left to right correspond to β = 0, β0, 2β0, and 3β0, respectively.
Energies 18 05891 g007
Figure 8. Comparison of gas production rate and relative error under different average matrix permeabilities: (a) gas production rate considering and ignoring non-Darcy flow; (b) relative errors in gas production rate between simulations considering and ignoring non-Darcy flow.
Energies 18 05891 g008
Figure 9. Comparison of velocity fields at the end of the simulation (i.e., 730th day) under different average matrix permeabilities: (ad) velocity fields ignoring non-Darcy flow (m/day); (eh) velocity fields considering non-Darcy flow (m/day); (il) relative errors between the two velocity fields. In each row, subfigures from left to right correspond to km_ave = 0.5 mD, 1 mD, 2 mD, and 4 mD, respectively.
Energies 18 05891 g009
Figure 10. Comparison of gas production rate and relative error under different numbers of natural fractures: (a) gas production rate considering and ignoring non-Darcy flow; (b) relative errors in gas production rate between simulations considering and ignoring non-Darcy flow.
Energies 18 05891 g010
Figure 11. Comparison of velocity fields at the end of the simulation (i.e., 730th day) under different numbers of natural fractures: (ad) velocity fields ignoring non-Darcy flow (m/day); (eh) velocity fields considering non-Darcy flow (m/day); (il) relative errors between the two velocity fields. In each row, subfigures from left to right correspond to nf = 0, 100, 200, and 400, respectively.
Energies 18 05891 g011
Figure 12. Comparison of gas production rate and relative error under different initial reservoir pressures: (a) gas production rate considering and ignoring non-Darcy flow; (b) relative errors in gas production rate between simulations considering and ignoring non-Darcy flow.
Energies 18 05891 g012
Figure 13. Comparison of velocity fields at the end of the simulation (i.e., 730th day) under different initial reservoir pressures: (ad) velocity fields ignoring non-Darcy flow (m/day); (eh) velocity fields considering non-Darcy flow (m/day); (il) relative errors between the two velocity fields. In each row, subfigures from left to right correspond to pr_i = 20, 30, 40, and 50, respectively.
Energies 18 05891 g013
Figure 14. Comparison between field production data and simulation results using the proposed method under non-Darcy flow conditions over a 600-day production period: (a) measured gas production rate and bottom-hole pressure of the self-flowing gas well; (b) comparison of measured production data with simulation results obtained using the proposed method.
Energies 18 05891 g014
Table 1. Parameters used for validation.
PropertyValuesPropertyValues
Initial reservoir pressure
pini (MPa)
30Reservoir temperature
T (°C)
65
Bottom-hole pressure
Pbh (MPa)
5Compressibility of matrix
cm (MPa−1)
1.2 × 10⁻³
Gas molar mass
Mmg (g/mol)
16.043Universal gas constant
R (J/mol·K)
8.314
Table 2. Parameters used in the benchmark gas reservoir model.
PropertyValuesPropertyValues
Initial reservoir pressure
pini (MPa)
30Reservoir temperature
T (°C)
65
Bottom-hole pressure
Pbh (MPa)
5Compressibility of the matrix
cm (MPa−1)
1.2 × 10⁻³
Compressibility of natural fracture
cf (MPa−1)
1.2 × 10⁻³Natural fracture width
wf (m)
1 × 10⁻²
Matrix porosity
ϕm
0.4Natural fracture
ϕnf
0.8
Disclaimer/Publisher’s Note: The statements, opinions and data contained in all publications are solely those of the individual author(s) and contributor(s) and not of MDPI and/or the editor(s). MDPI and/or the editor(s) disclaim responsibility for any injury to people or property resulting from any ideas, methods, instructions or products referred to in the content.