Article

Investigation of Gas Evolution on Nickel Wire Electrodes During Alkaline Water Electrolysis

Key Laboratory of Thermal Science and Power Engineering of Ministry of Education, Department of Energy and Power Engineering, Tsinghua University, Beijing 100084, China
*
Author to whom correspondence should be addressed.
Energies 2025, 18(22), 5888; https://doi.org/10.3390/en18225888 (registering DOI)
Submission received: 25 September 2025 / Revised: 22 October 2025 / Accepted: 5 November 2025 / Published: 8 November 2025

Abstract

The pursuit of higher current densities and device miniaturization intensifies gas evolution in alkaline water electrolysis, thereby reducing catalyst utilization and degrading system performance. In this work, a visualized alkaline electrolysis system was developed to investigate bubble dynamics on vertically oriented nickel wire electrodes. High-speed imaging coupled with a Yolov8 deep learning model enabled quantitative analysis of oxygen evolution behavior, revealing distinct bubble evolution modes such as isolated growth and coalescence. Systematic experiments demonstrated that current density, electrode diameter, and KOH concentration exert significant influences on bubble size distribution. Further correlation with electrochemical performance showed that increases in bubble population and size result in higher overpotentials, while bubble volume exhibits a strong linear relationship with the system’s ohmic resistance. These findings provide mechanistic insights into the coupling between bubble evolution and electrochemical performance, offering guidance for the design of efficient alkaline electrolyzers.

1. Introduction

The global energy landscape is gradually shifting toward a “net-zero carbon” era dominated by renewable energy sources. Compared with hydropower, solar, and wind energy, hydrogen offers distinct advantages, including high combustion enthalpy and environmentally benign combustion products. Consequently, hydrogen is expected to become a critical component of future energy systems and to drive the transformation of next-generation energy structures [1]. However, hydrogen production from conventional fossil fuel-based pathways is accompanied by considerable carbon emissions, whereas water electrolysis coupled with renewable power sources has emerged as a key strategy for enabling the low-carbon transition of the hydrogen industry [2]. Water electrolysis for hydrogen production can be categorized into alkaline water electrolysis (AWE), proton exchange membrane water electrolysis (PEMWE), anion exchange membrane water electrolysis (AEMWE), and solid oxide electrolysis (SOEC) [3]. Among water electrolysis technologies, alkaline water electrolysis (AWE) has achieved the highest commercialization and market share, owing to its cost-effectiveness, operational stability, and technological maturity [4]. Nevertheless, the advancement of AWE continues to face critical challenges, including performance enhancement, efficiency optimization, and relatively slow dynamic response [5,6]. A particularly pressing issue is the evolution of gas bubbles during electrolysis, which reduces catalyst utilization and induces performance fluctuations, thereby limiting the further development of AWE. Furthermore, under industrial operating conditions, the gas plugging induced by bubble accumulation can significantly elevate ohmic loss and the non-uniform current density distribution caused by bubble coverage exacerbates the electrode corrosion rate, thereby shortening the service life of the electrolyzer.
For alkaline water electrolysis systems, the evolution of a single bubble on a microelectrode typically consists of three stages: nucleation, growth, and detachment [7]. Bubble nucleation can be classified as homogeneous [8] and heterogeneous nucleation [9,10]. Bubble growth is commonly described by a power-law relationship, R(t) = β × tb, where the time exponent b typically takes values of 1 [11], 1/2, or 1/3 [12]. Bubble detachment is primarily governed by the balance of forces acting on the bubble [13]. However, practical electrolysis processes commonly employ electrodes with large reaction areas and operate under high current densities, leading to the co-evolution of multiple bubbles within the system. Compared with single-bubble dynamics, multi-bubble systems exhibit more complex behaviors, such as bubble sliding and coalescence. To characterize these phenomena, statistical parameters such as bubble density and size distribution are often employed. Prior studies have demonstrated that current density, electrolyte concentration and electrode materials [14] significantly influence bubble evolution.
Hayata et al. [15] reported that only a few oxygen bubbles were generated on horizontal nickel electrodes at low current density (0.05 A·cm−2). As the current density increased, both the bubble growth rate and average detachment diameter rose, and the bubble layer on the electrode surface became thicker. Similarly, Liu et al. [16] conducted experiments at moderate current densities (0.15–0.35 A·cm−2) and observed that the oxygen bubble size distribution approximated a normal distribution. Nevertheless, most studies to date have been limited to relatively low current densities (<0.4 A·cm−2), and fundamental investigations under industrially relevant high-current conditions remain scarce.
Zhang et al. [17] systematically examined the effect of KOH concentration on hydrogen bubble detachment at low current density (0.0006 A·cm−2). Their results revealed that as the KOH concentration increased from 0.5 M to 4 M, the average detachment diameter decreased markedly, along with reductions in bubble detachment frequency. Filipe et al. [18] further validated this trend at higher concentration ranges. However, existing research has primarily focused on single-bubble behaviors, and systematic studies addressing multi-bubble interactions under high-concentration conditions are still lacking.
In practical AWE systems, the required cell voltage for water splitting always exceeds the reversible voltage at a given current density, consisting of several components: the equilibrium potential (Urev), activation overpotential (Uact), ohmic overpotential (Uohm), and concentration overpotential (Ucon):
U = U rev + U act + U ohm + U con
Gas bubbles generated during electrolysis significantly affect performance by altering these voltage components. First, bubbles nucleating and growing on the catalyst surface physically block active sites, thereby reducing the effective triple-phase boundary and increasing the activation overpotential [19]. Second, bubbles entrapped in the electrolyte are electrically insulating, lowering the overall conductivity of the solution and raising the ohmic overpotential [20,21]. Furthermore, strong adhesion between bubbles and catalyst surfaces may lead to catalyst detachment during bubble release, compromising catalyst stability [22]. Although some studies have shown that introducing magnetic fields [23], supergravity [24], pressure swings [25], or ultrasonic fields [18] into water electrolysis systems can promote bubble detachment, such approaches inevitably lead to additional energy consumption and capital investment, which are inconsistent with the objectives of sustainable development.
In summary, systematic investigation of gas evolution behaviors on vertically oriented electrodes under different electrolysis conditions is of great significance for optimizing the performance of alkaline electrolyzers. To this end, this study developed a visualization-based method for observing oxygen bubble evolution on nickel wire electrodes. The experiments were extended to industrially relevant current densities and a wide range of electrolyte concentrations. Furthermore, electrochemical measurements were combined with bubble evolution analysis to elucidate the impact of gas evolution on electrolysis performance, thereby providing guidance for regulating gas evolution and improving the efficiency of AWE systems.

2. Materials and Methods

2.1. Visual Observation

The experimental system consisted of a customized polytetrafluoroethylene (PTFE) electrolyzer, an electrochemical workstation, a high-speed camera, and an LED light source, as illustrated in Figure 1. Prior to experiments, the working electrodes were mechanically polished and chemically cleaned. The nickel wires were first polished with 2000-grit sandpaper to ensure a uniform surface roughness. They were then immersed in 1 mol·L−1 dilute sulfuric acid (c(H+) = 1 mol·L−1) for 2 min to remove the surface oxide layer. Finally, the electrodes were rinsed thoroughly with distilled water and dried using lint-free tissue. The recorded region covered a length of 1.6 mm, positioned approximately 0.5 mm above the electrode bottom. Two types of experiments were conducted: (i) determination of single-bubble detachment size and (ii) investigation of multi-bubble evolution behavior. All experiments were performed at 25 °C under ambient pressure. The instruments, devices and raw materials used are detailed in Table 1.
Electrolysis was carried out in galvanostatic mode. After oxygen bubble evolution on the electrode surface reached a steady state (approximately 5 min), high-speed imaging was employed for data collection. Each experiment was repeated three times, and every record lasted 10 s, yielding a total of 18,000 images to minimize random errors. The high-speed camera operated at 600 frames per second, a resolution of 1920 × 1080 pixels. The tested current densities (A·cm−2) were 0.1, 0.2, 0.4, 0.6, 0.8, and 1.0; the diameters of cylindrical nickel wire electrodes (mm) were 0.1, 0.25, 0.3, and 0.4; and the KOH concentrations (% w/v) were 10, 20, 30, 40, and 50.
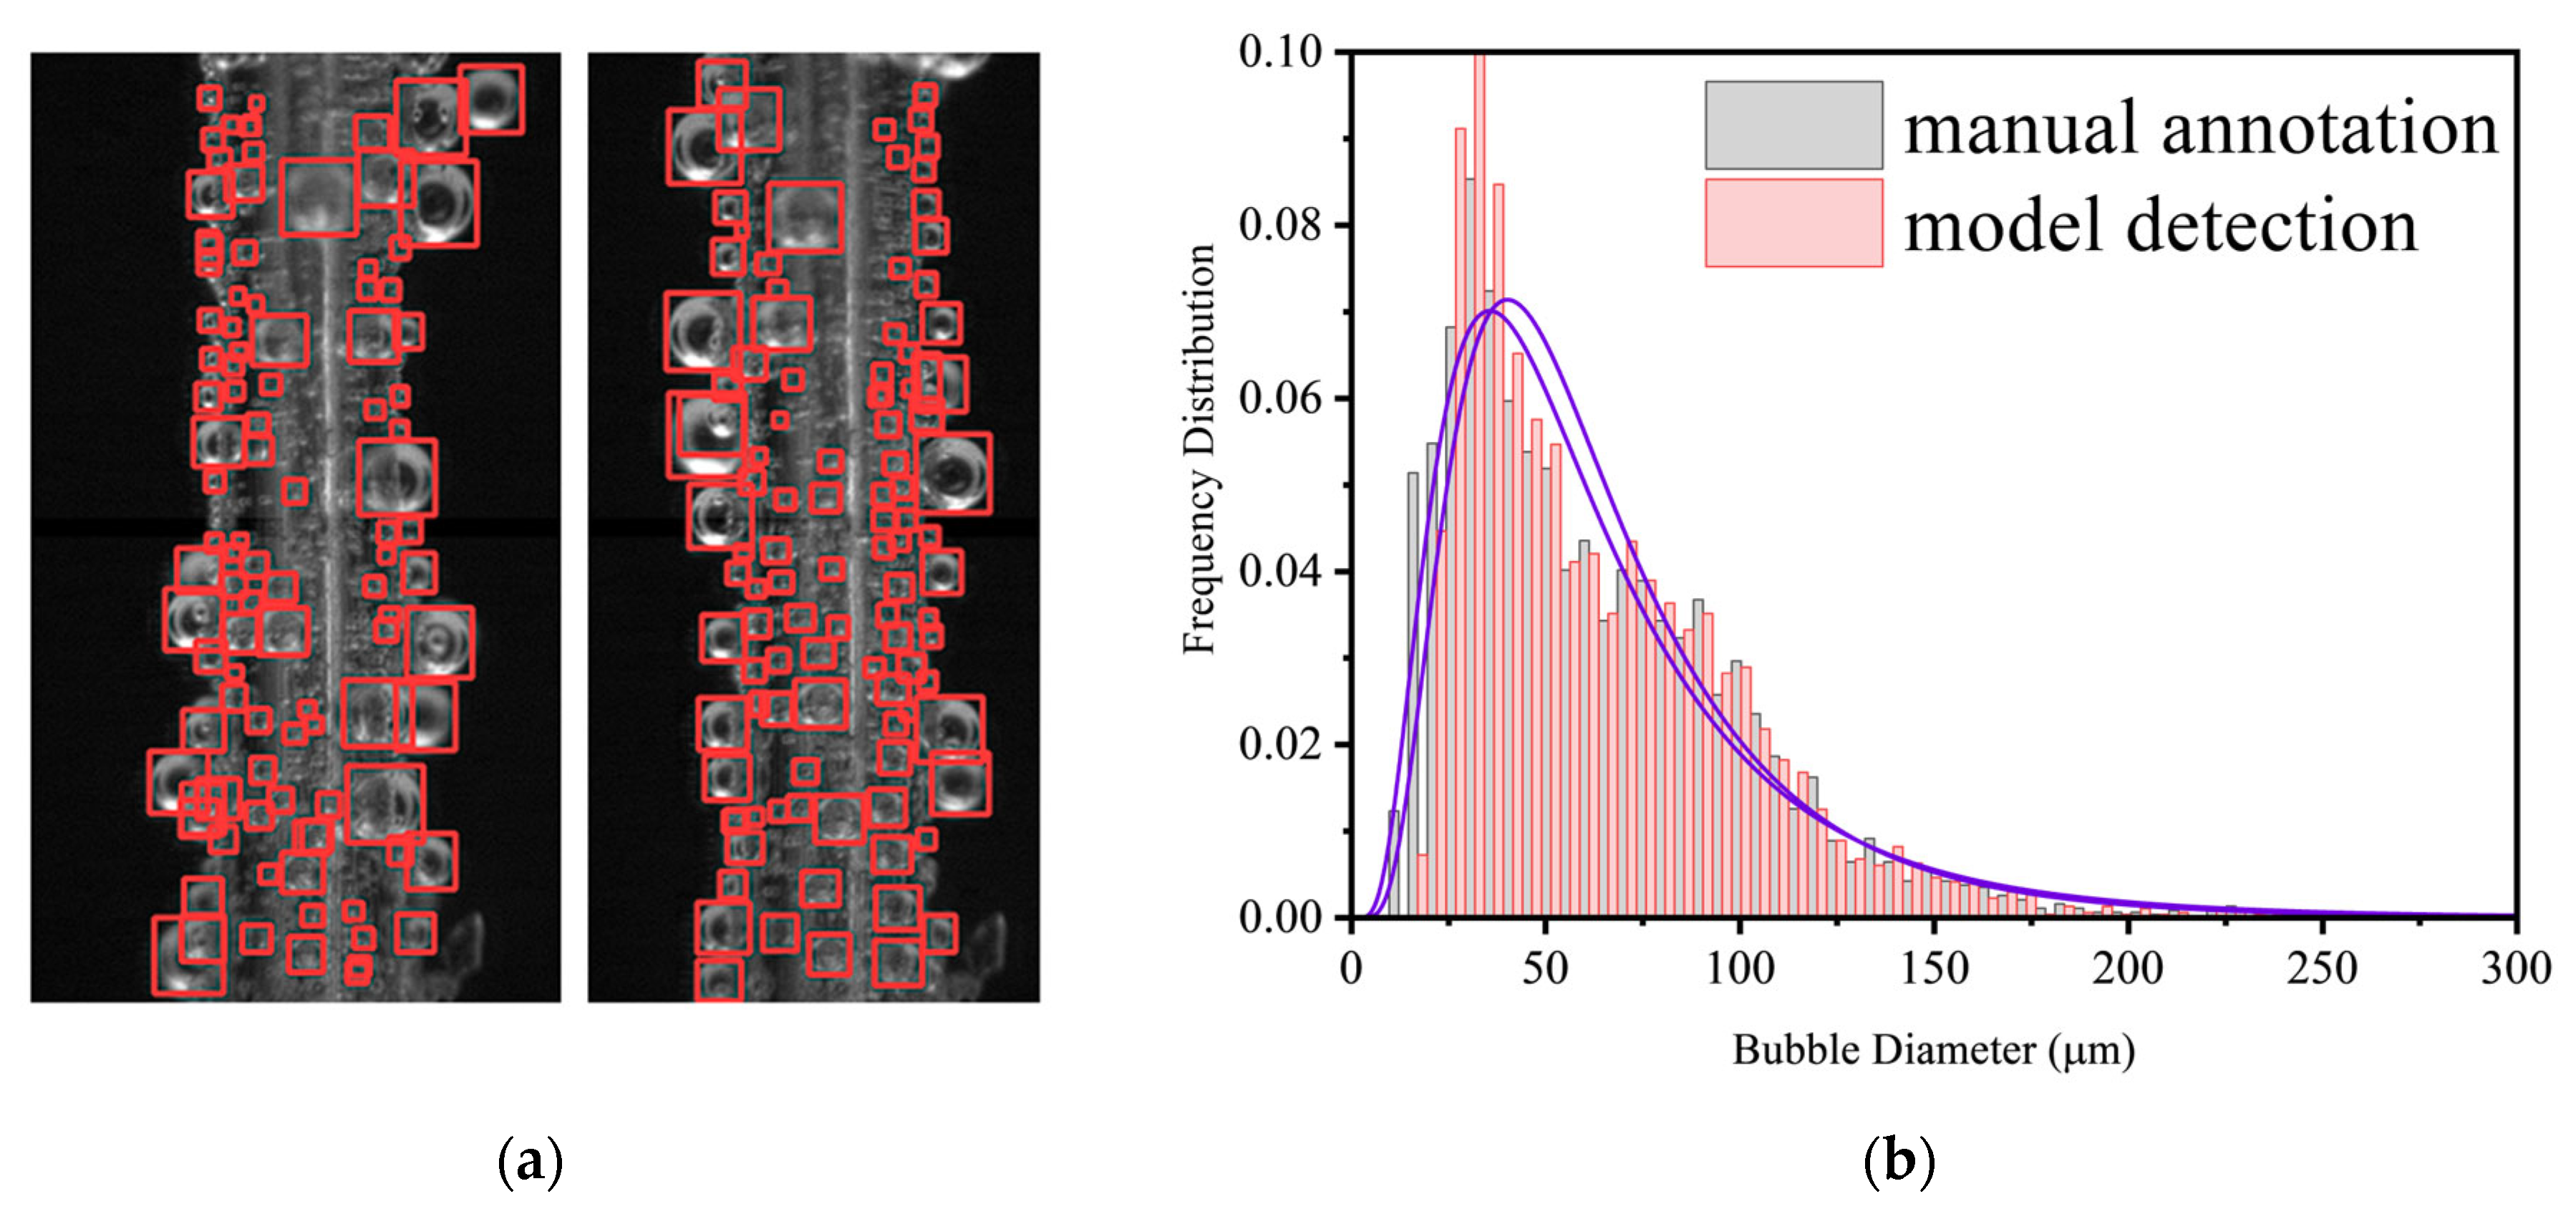
A deep learning-based object detection model, Yolov8, was employed for efficient and accurate bubble recognition [19]. First, a subset of images was selected as training and validation datasets, with bubbles manually annotated. The labeled datasets were then used to train the Yolov8 model to improve detection accuracy. Finally, the trained model was applied to detect oxygen bubbles under different electrolysis conditions [26]. As shown in Figure 2, the detection results were compared with manual annotations. The error rate in bubble counting was below 2%, and the bubble size distributions obtained by both methods exhibited similar patterns (Figure 3). These results confirmed the reliability and accuracy of the deep learning–based model. Model training and testing were performed on a desktop computer equipped with an Intel Core i5-12600KF CPU and 32 GB RAM. The average detection time per image was approximately 70 ms, which was significantly faster than manual annotation (~1 h).
To characterize multi-bubble systems, the bubble size distribution, average diameter, and total bubble volume were analyzed. The bubble size distribution described the statistical distribution of all bubbles, from which both the arithmetic mean diameter and the Sauter mean diameter were calculated. The Sauter mean diameter (D32) was calculated according to:
D 32 = D i 3 D i 2
where D is the equivalent diameter of each bubble.
The Sauter mean diameter is widely applied in gas–liquid mass transfer, combustion, and bubble stability studies, as it better reflects the specific surface area relevant to mass transport–controlled processes [18]. However, it may also introduce relatively large errors. Therefore, both arithmetic and Sauter mean diameters were reported in this work.
Since the bubbles observed exhibited good sphericity, their total volume was approximated using the spherical volume equation:
V bub = π 6 D i 3

2.2. Electrochemical Characterization

Electrochemical measurements were conducted to evaluate the effect of bubble evolution on oxygen evolution reaction (OER) performance, including linear sweep voltammetry (LSV) and electrochemical impedance spectroscopy (EIS).
Prior to LSV, the electrodes were electrochemically activated to ensure stable performance. The cylindrical nickel wire electrodes were first polarized at the OER potential for 30 min, followed by 30 cycles of cyclic voltammetry (CV) within a current density range of 0–1.0 A·cm−2 at a scan rate of 2 mV·s−1 to stabilize the surface oxidation state. The current–voltage curves obtained from LSV were converted into polarization curves by normalizing the current to the geometric surface area of the electrode. The overall electrode surface area was determined according to the following equation:
S Electrode = π × D Electrode × L Electrode
According to the Butler–Volmer equation, when the overpotential is low, a linear relationship exists between overpotential (η) and log(i), which is known as the Tafel law. The Tafel region was determined by identifying the interval where the second derivative of η versus log(i) equaled zero, and the Tafel slope was subsequently obtained by linear fitting.
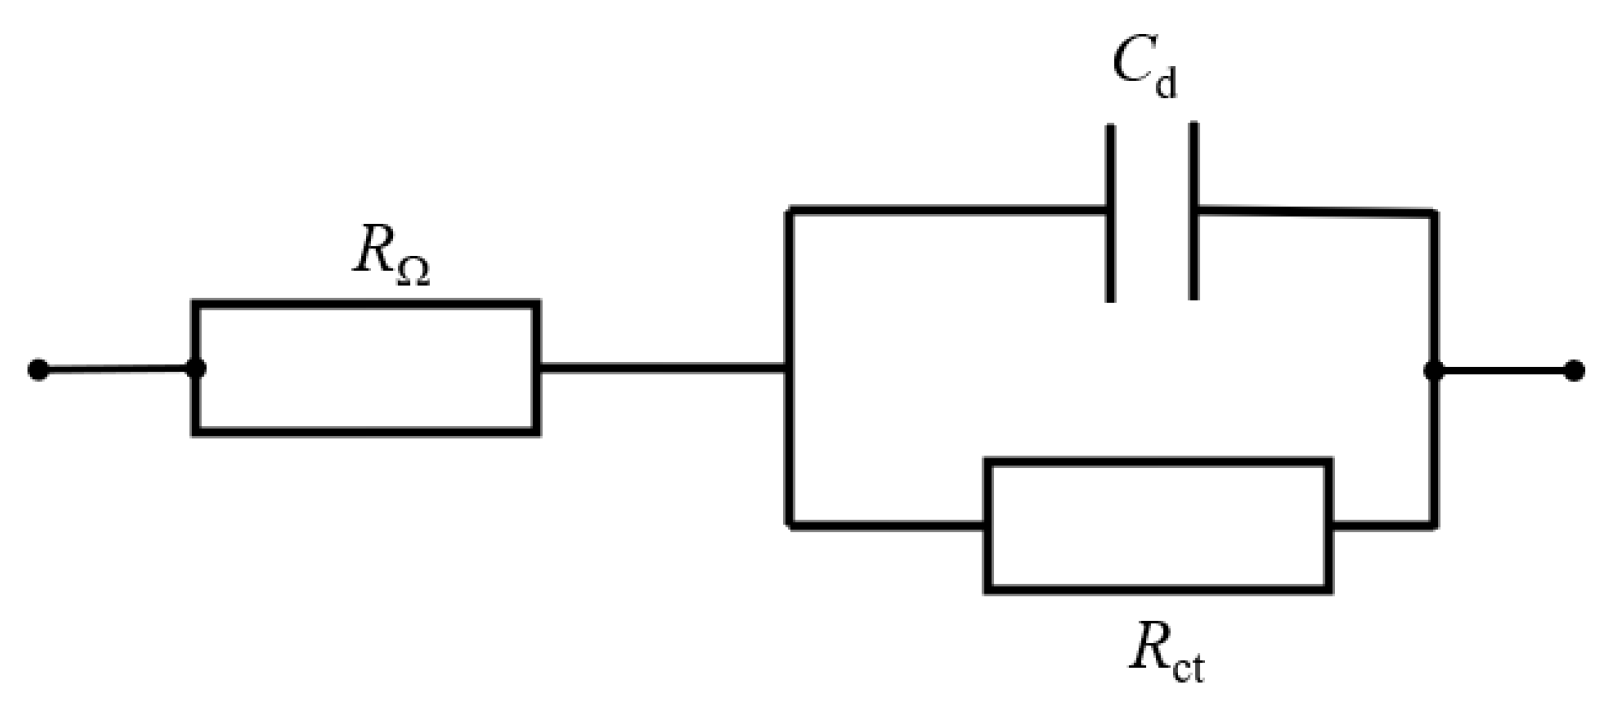
EIS was conducted in galvanostatic mode, with the perturbation amplitude set to 10% of the applied current density. When the electrode process is controlled by charge transfer, the equivalent circuit consists of ohmic resistance (RΩ), charge transfer resistance (Rct), and double-layer capacitance (Cd). Specifically, Rct and Cd are connected in parallel, and the branch is in series with RΩ, as illustrated in Figure 3.

3. Results

3.1. Oxygen Evolution Behavior on Vertical Nickel Wire Electrodes

3.1.1. Growth and Detachment Modes

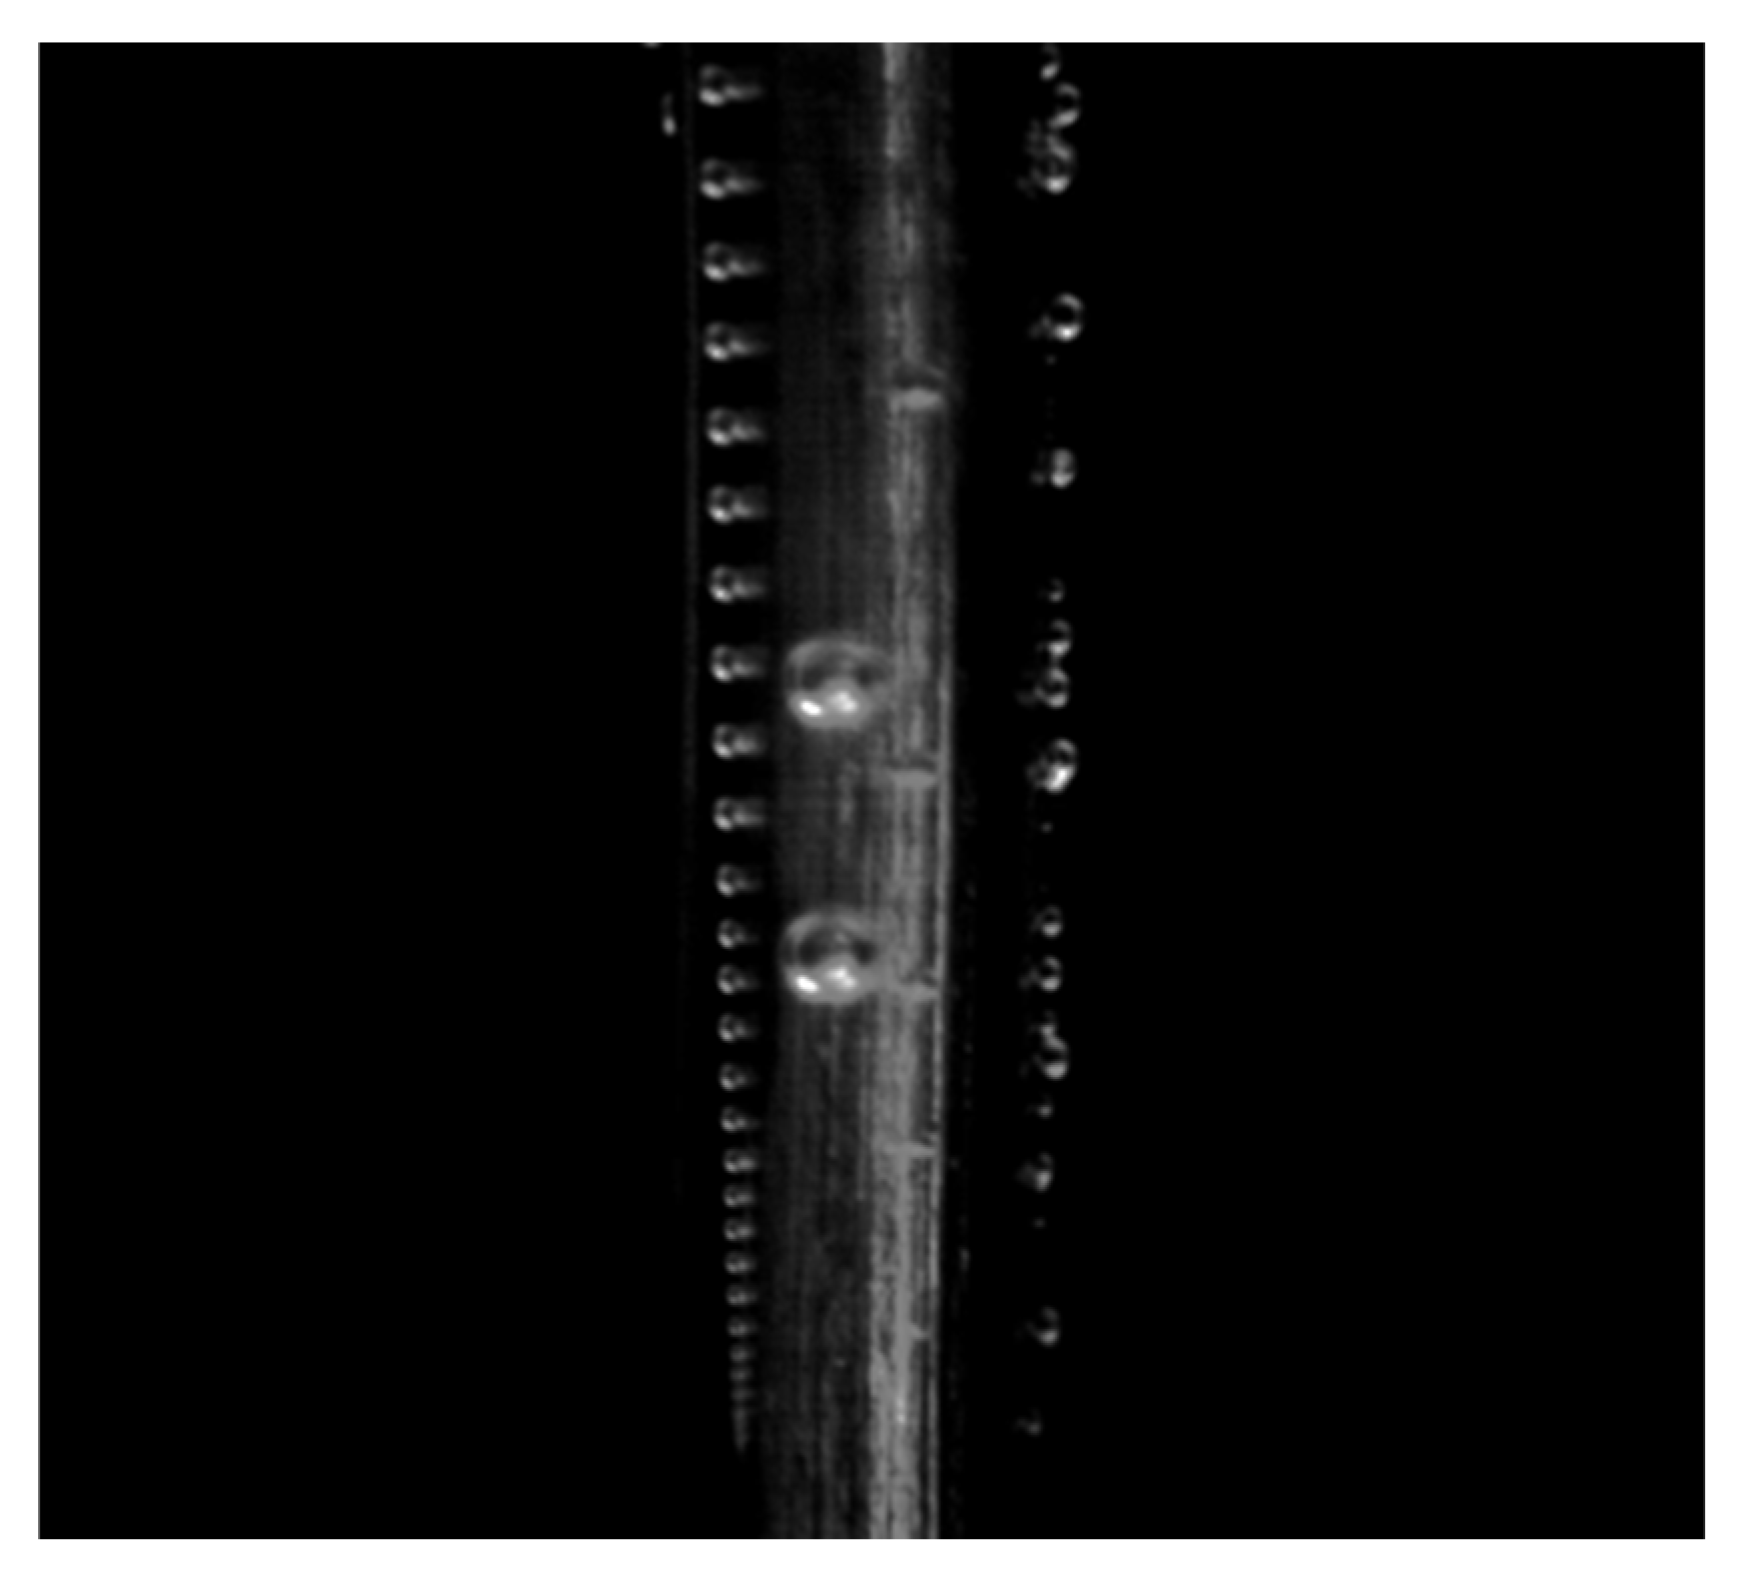
At very low current density (0.001 A·cm−2), only a few nucleation sites on the electrode surface generated bubbles, which allowed clear observation of the growth and detachment of individual bubbles. The evolution of a single bubble on the vertical nickel wire electrode can be divided into several stages. First, a small bubble nucleates at a site on the electrode surface and subsequently grows via molecular diffusion. Once the bubble reaches a critical size, the balance of forces is disrupted, and the bubble detaches from the electrode surface. The diameter at detachment is defined as the primary bubble diameter (Dorigin). After detachment, the oxygen bubble accelerates upward along the electrode surface while continuing to absorb supersaturate oxygen molecules from the electrolyte, thereby increasing in size (Figure 4 and Video S1).
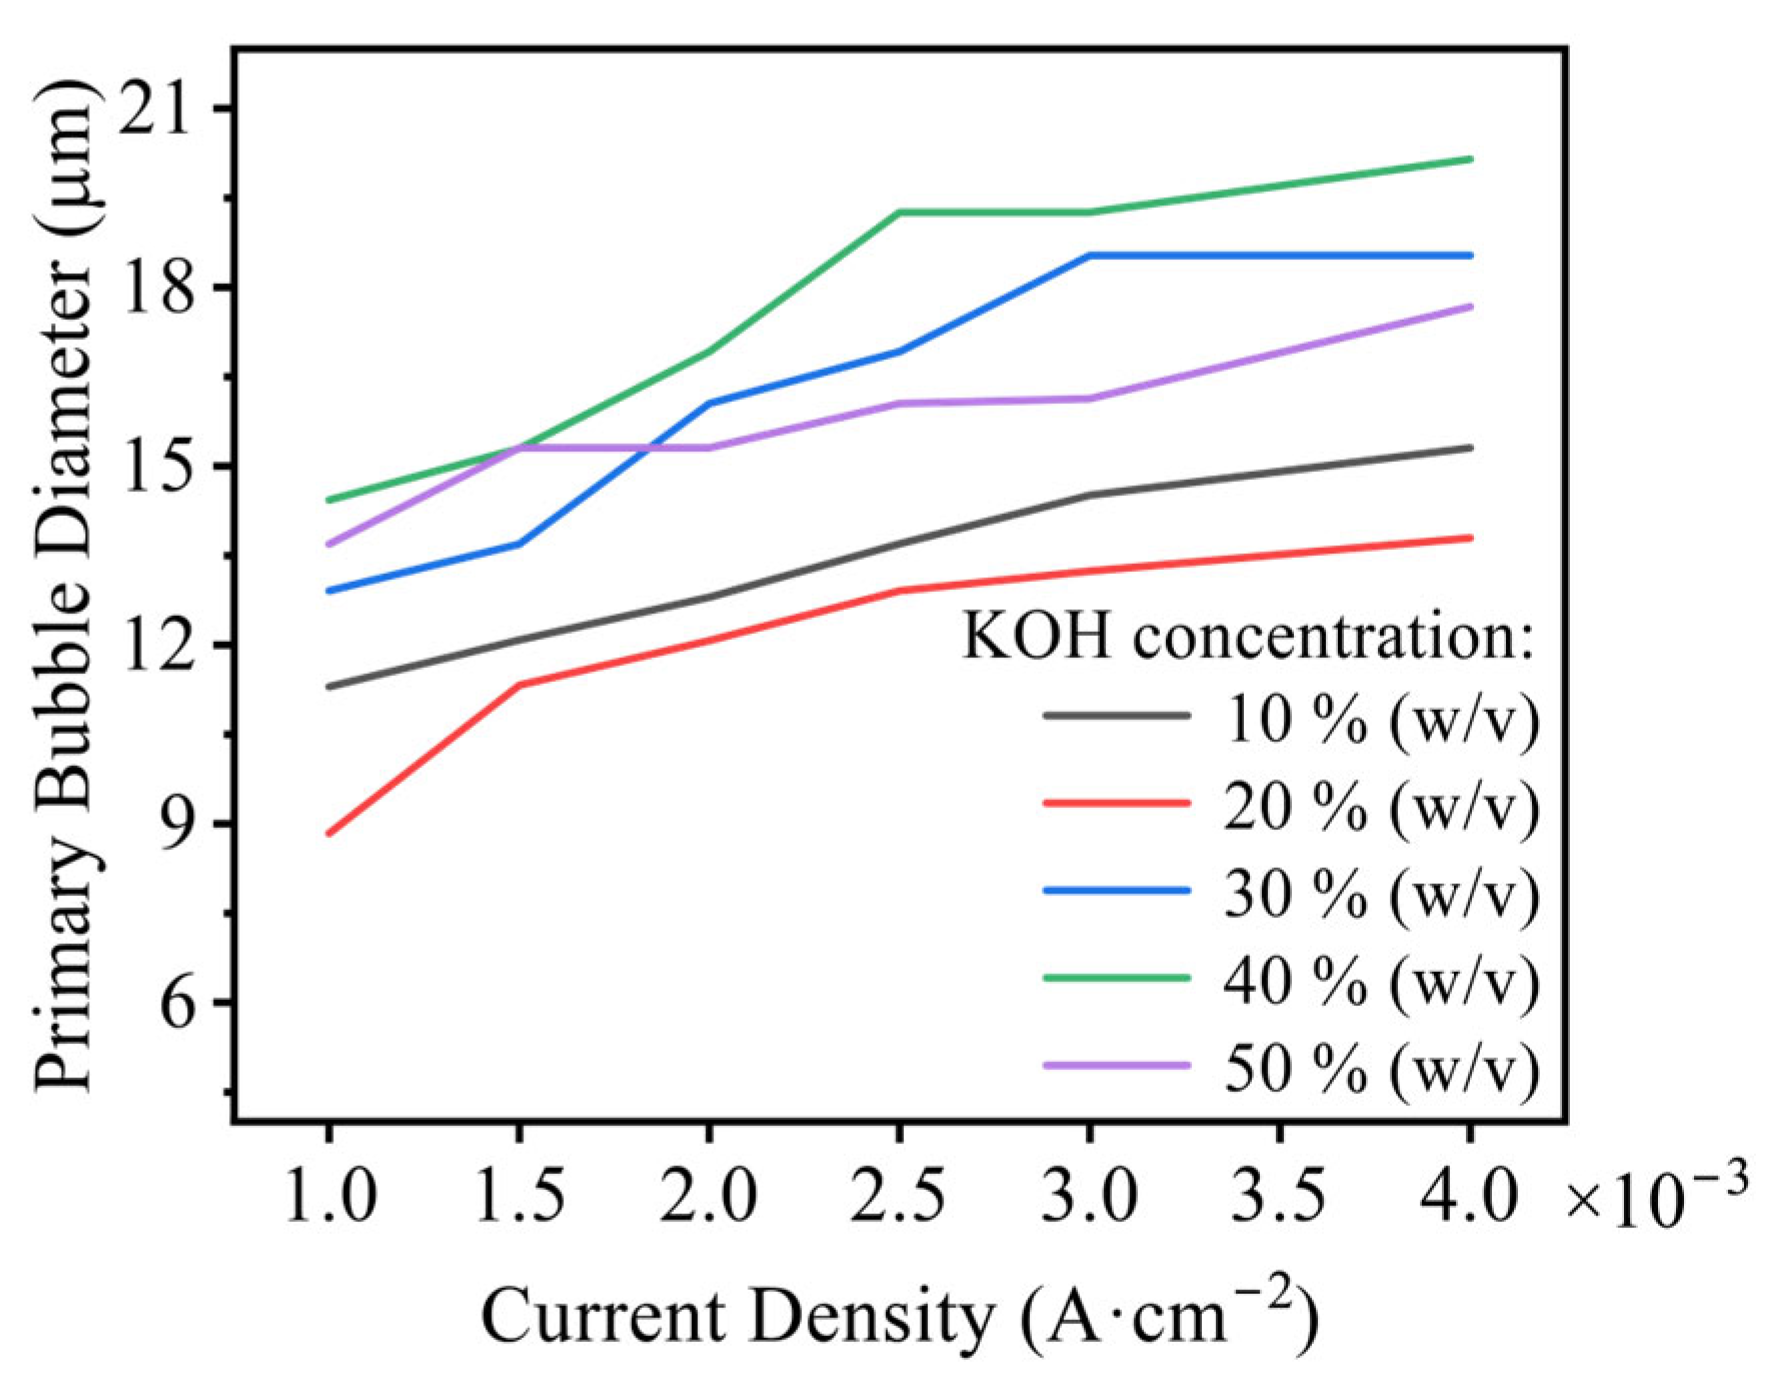
The effect of current density on the primary bubble diameter under different KOH concentrations is shown in Figure 5. Within the tested conditions, the diameters of primary bubbles ranged from 8 to 20 µm. As the current density increased, the bubble size gradually increased, though the growth rate slowed at higher current densities. The growth rate of a single bubble on the electrode surface primarily depends on the diffusion rate of oxygen molecules in the electrolyte. At higher current densities, the electrochemical reaction rate increases, producing oxygen molecules at a faster rate, which enhances the degree of supersaturation. This, in turn, accelerates molecular diffusion, supplying more material for bubble growth and leading to an increase in Dorigin.
When the concentration of KOH solution increases from 10% (w/v) to 20% (w/v), the diameter of primary oxygen bubbles decreases; as the KOH concentration further rises from 20% (w/v) to 40% (w/v), the diameter of primary oxygen bubbles gradually increases; and when the KOH solution concentration exceeds 40% (w/v), the diameter of primary bubbles decreases with the increase in KOH concentration. Since primary bubbles complete their growth and detachment independently without interactions with other bubbles, the influence of KOH solution concentration on the size of primary oxygen bubbles needs to be analyzed by considering the changes in forces acting on the bubbles. The dominant forces exerted on the bubbles include buoyancy, surface tension, and viscous drag [27]. When the KOH solution concentration is less than 40% (w/v), the variation in primary bubble diameter is dominated by the competition between two factors: (1) The increase in KOH concentration leads to a higher gas–liquid density difference, which enhances buoyancy and facilitates bubble detachment; (2) The elevation of surface tension and solution viscosity inhibits bubble detachment, allowing bubbles to remain on the electrode surface for further growth. As the density of KOH solution increases linearly with concentration, while the viscosity and surface tension increase at an accelerating rate, buoyancy enhancement becomes the dominant factor when the concentration rises from 10% (w/v) to 20% (w/v), promoting bubble detachment and resulting in a reduction in primary bubble size. In contrast, when the concentration increases from 20% (w/v) to 40% (w/v), the rapid increase in viscous drag and surface tension hinders bubble detachment, leading to an increase in primary bubble diameter. Notably, when the KOH concentration exceeds 40% (w/v), the corrosive effect of the solution on the electrode becomes excessively strong, which may induce changes in the electrode surface structure.
As current density increased, the number of nucleation sites and the bubble generation rate both rose, evolving the electrode surface into a multi-bubble system. At 0.1 A·cm−2, the electrode surface was fully covered by bubbles, forming an attached bubble layer with only a few free bubbles outside. At the bottom of the bubble layer, many small bubbles were densely distributed. These small bubbles grew into medium-sized bubbles by absorbing supersaturate oxygen molecules via diffusion. The medium-sized bubbles, being larger in volume, frequently contacted neighboring bubbles and coalesced into larger bubbles, which then migrated upward within the bubble layer. The upper part of the bubble layer was dominated by large bubbles, typically forming bubble clusters that remained close to each other without coalescence. During their upward migration, bubble clusters swept through the bubble layer, continuously merging with smaller and medium bubbles, thereby renewing the active regions of the electrode surface (Figure 6 and Video S2).
At a further increased current density of 1.0 A·cm−2, the electrode surface remained completely covered by the bubble layer. Bubbles existed as both attached bubble layers and free bubble groups. The behavior of bubbles in the attached layer was like that at medium current density (0.1 A·cm−2). Free bubbles outside the electrode grew primarily through coalescence, far from the surface. Two contacting bubbles could complete coalescence and a subsequent jumping motion within one frame (1/600 s). This bubble jumping may be attributed to the release of surface energy during coalescence, which is converted into out-of-plane kinetic energy; the horizontal momentum component drives the bubble to separate from the electrode surface. Interestingly, in some cases bubbles returned to the electrode surface after jumping, a phenomenon not fully explained here (Video S3). This phenomenon is presumably associated with multiple factors, including electrostatic forces, local fluid convection, and the Marangoni effect. Bubble surfaces are likely to adsorb charged particles from the solution. Given that the electrode surface is also charged, electrostatic attraction may drive the bubbles back to the electrode surface after their detachment. With respect to local fluid convection, a vortex region is generated in the wake of the jumping bubble, where a negative pressure zone is formed to drive the surrounding electrolyte toward the bubble’s trailing edge. Owing to the significant viscous interaction between the electrolyte and the bubble interface, the local flow field is hypothesized to facilitate the reattachment of the bubble to the electrode surface. Regarding the Marangoni effect, the detachment of the bubble exposes the underlying electrode surface, resulting in a lower OH concentration near the electrode compared to regions distant from the electrode. The establishment of this concentration gradient triggers the Marangoni effect, which may also contribute to pulling the bubble back to the electrode surface. Notably, these proposed mechanisms remain speculative and require further experimental validation and theoretical investigation.

3.1.2. Influence of Electrolytic Parameters

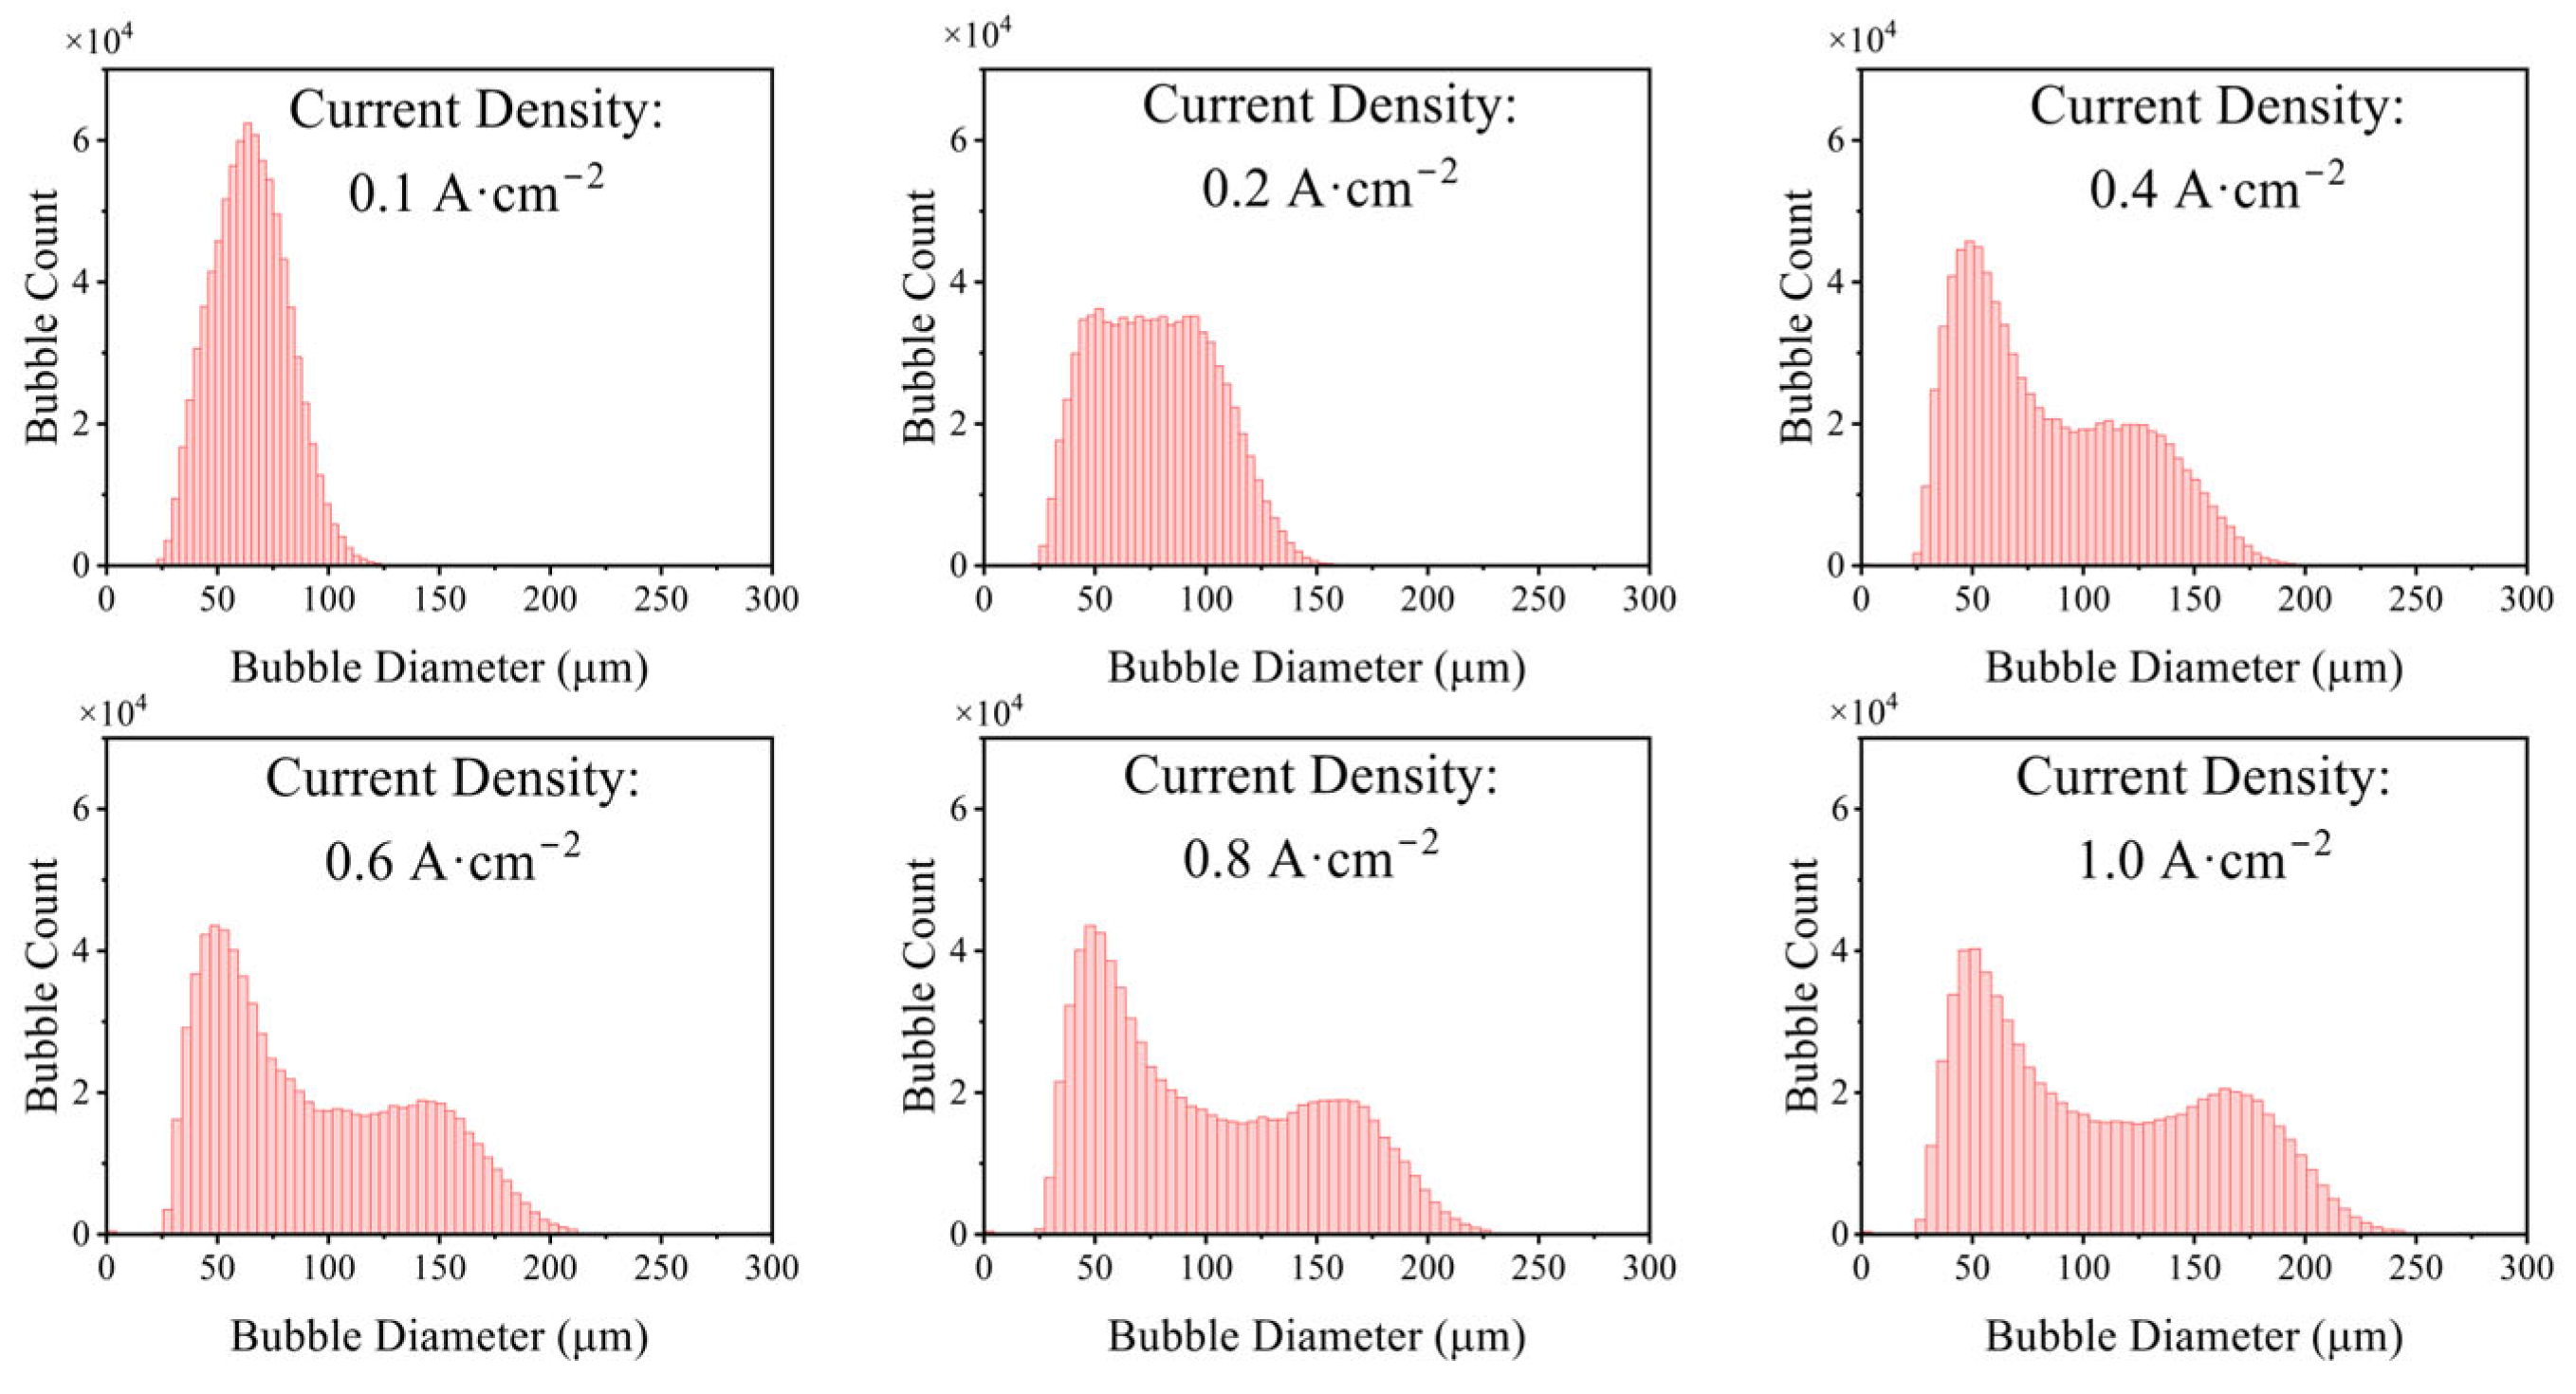
Bubble size distributions at different current densities are shown in Figure 7. As current density increased, the distribution broadened, with maximum bubble diameters increasing from 122 µm to 242 µm, accompanied by a marked rise in the frequency of large bubbles (D > 100 µm). At 0.1 A·cm−2, the bubble size distribution approximated a normal distribution. At higher current densities (i ≥ 0.4 A·cm−2), the distribution evolved into a bimodal pattern. The first peak remained stable, while the position of the second peak shifted toward larger sizes with increasing current density.
In the range of 0.1–1.0 A·cm−2, bubbles on the electrode surface mainly existed as attached bubble layers and free bubble groups. The first peak of the bimodal distribution corresponded to bubbles within the attached layer. At these current densities, the electrode surface was fully covered, nucleation sites were saturated, and space for bubble growth was limited. As a result, the maximum bubble size in the attached layer was restricted to ~50 µm, keeping the first peak essentially unchanged. The second peak corresponded with free bubbles outside the layer. As current density increased, bubble growth and coalescence became more frequent, leading to a higher number of free bubbles. Increased bubble population also enhanced coalescence, further enlarging bubble size, and shifting the second peak.
Further analysis of the distributions revealed that both the arithmetic mean diameter and the Sauter mean diameter increased monotonically with current density. As current density rose from 0.1 to 1.0 A·cm−2, the arithmetic mean diameter increased from 67.9 µm to 115.9 µm, while the Sauter mean diameter increased from 75.0 µm to 157.5 µm (a 110% increase). Beyond 0.10 A·cm−2, the arithmetic mean diameter exhibited a linear relationship with current density ( D ¯ = 43.11i + 73.39), while the Sauter mean diameter showed a good power-law relationship with the cubic root of current density (D32 = Ci0.32, error < 5%).
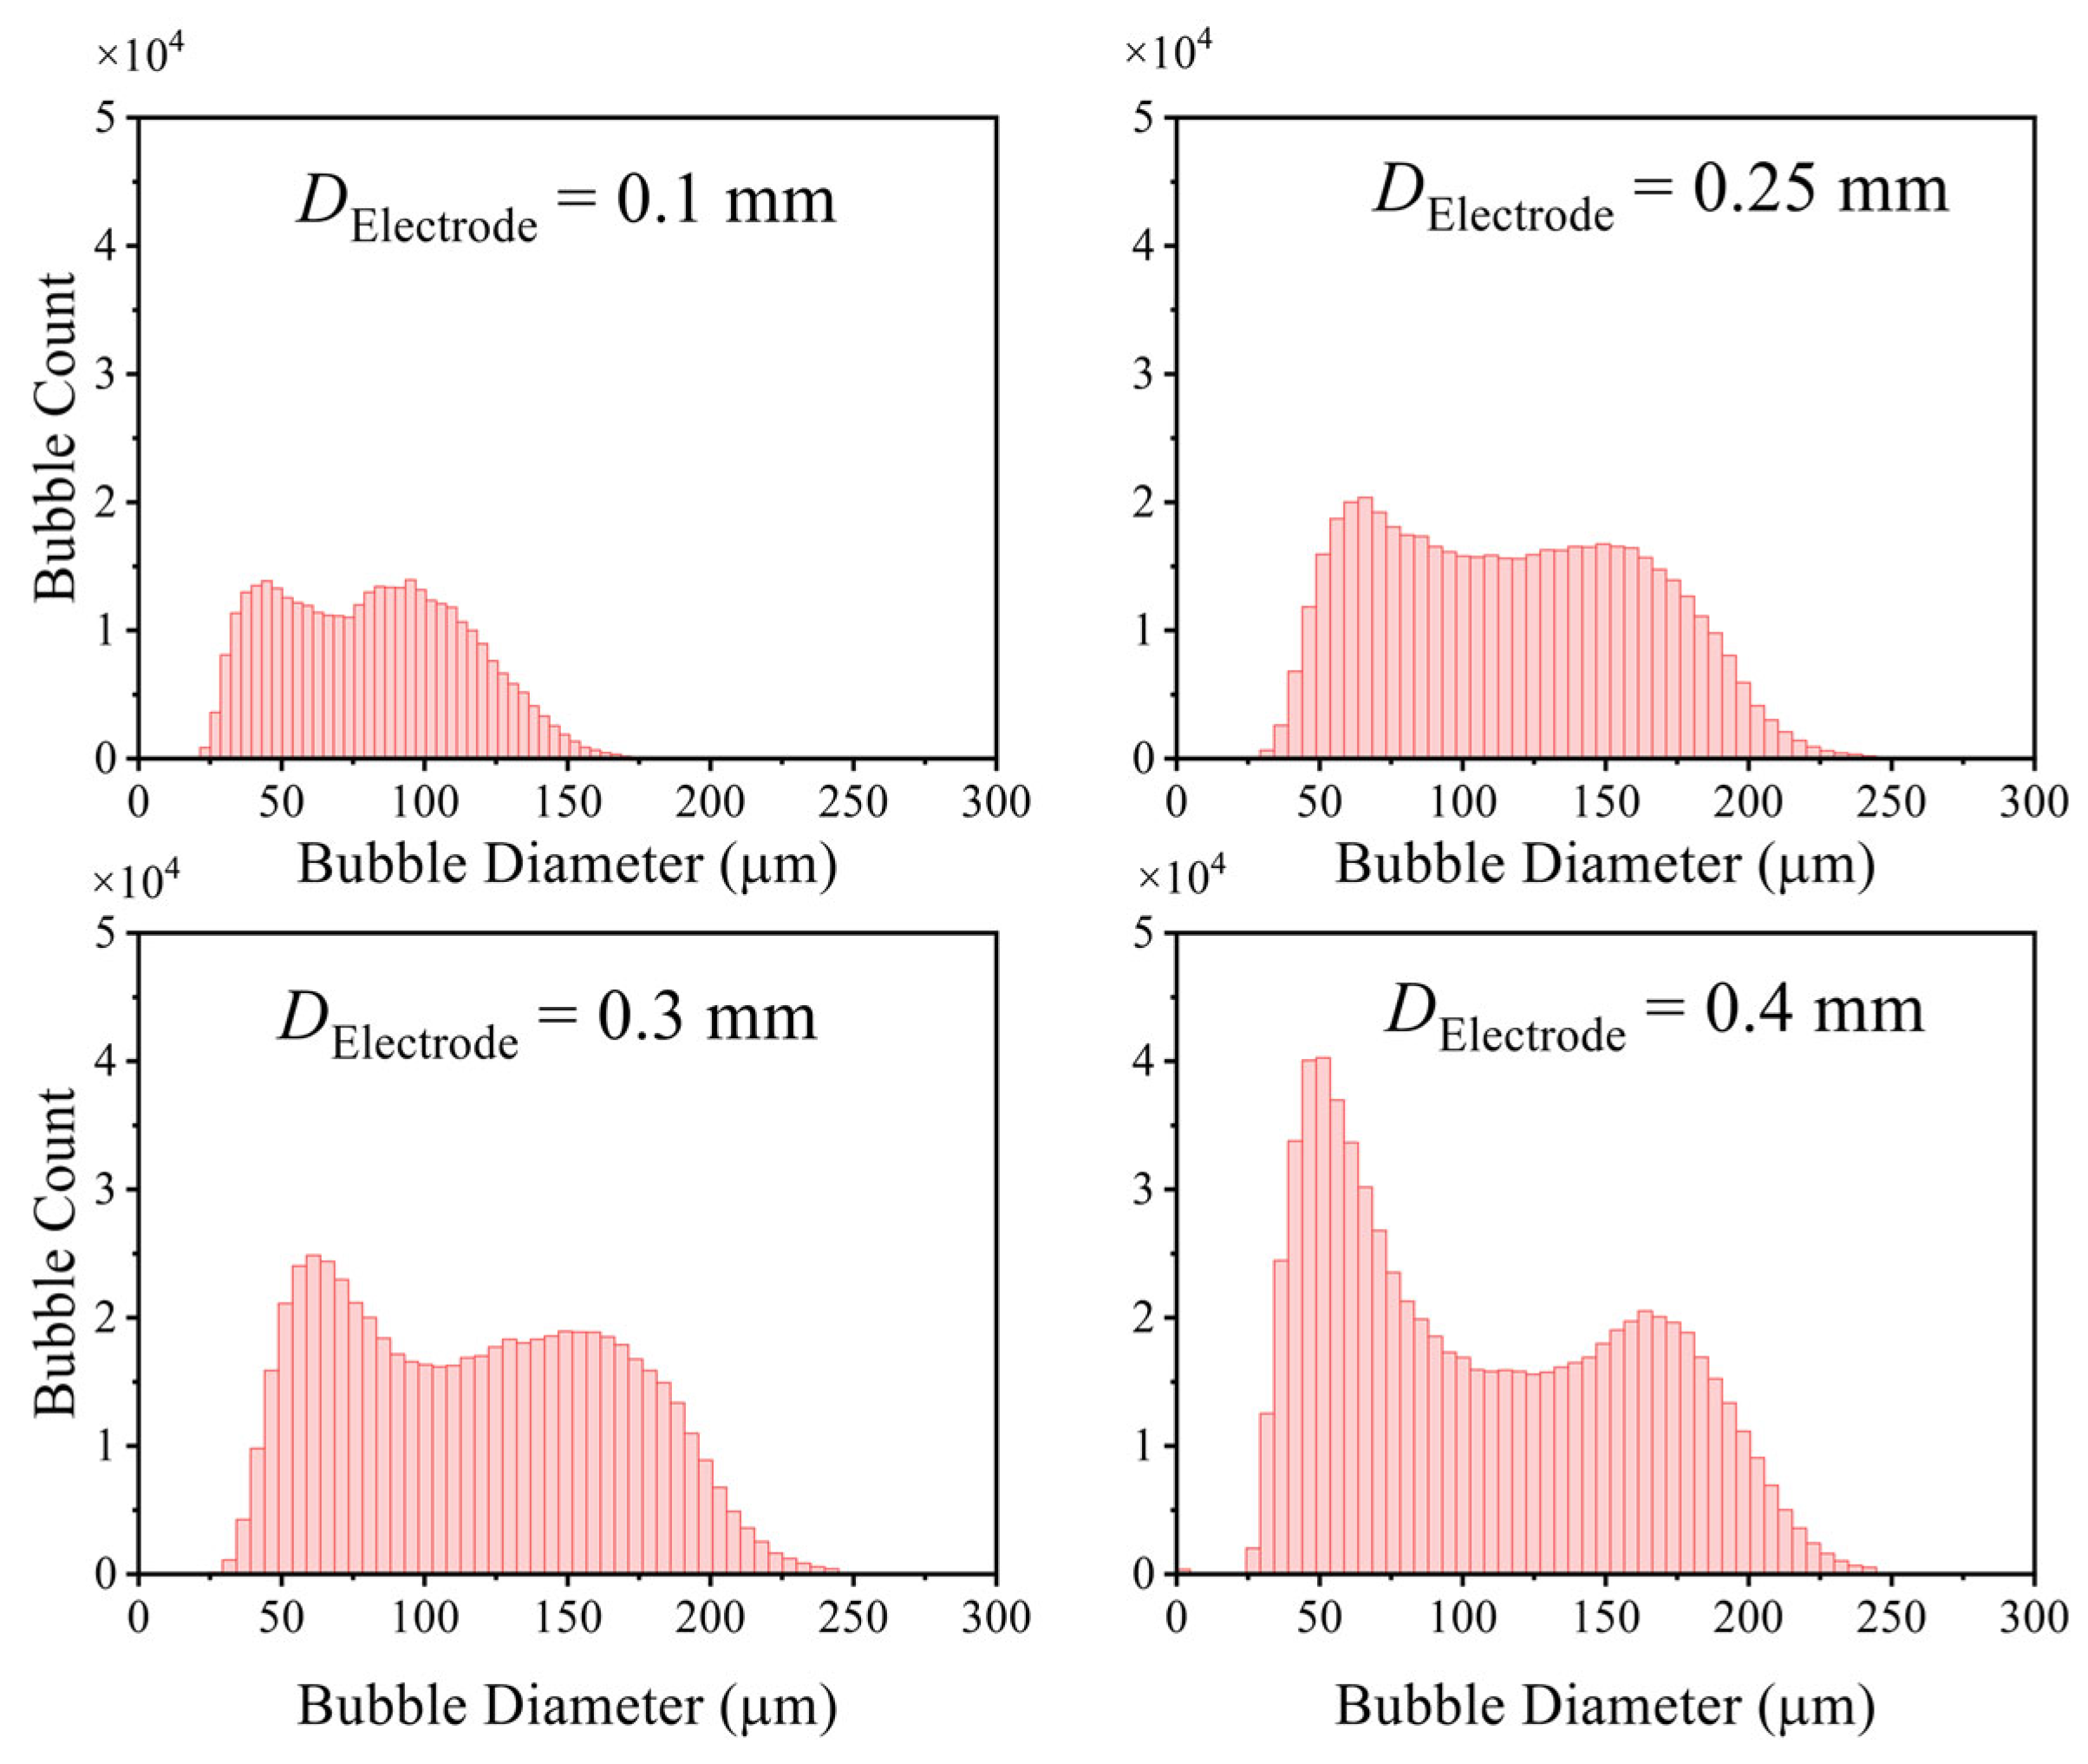
At a fixed current density of 1.0 A·cm−2 and KOH concentration of 30% (w/v), bubble size distributions on nickel wires of different diameters all displayed bimodal characteristics (Figure 8). As the wire diameter increased, both peaks became larger and shifted to the right. With larger wire diameters, the electrode surface area increased, providing more nucleation sites and producing more bubbles in the attached layer, which in turn increased the number of free bubbles. The flatter electrode surface and reduced curvature allowed more space for bubble growth and stronger adhesion, making bubble detachment more difficult and shifting the first peak. The second peak shifted rightward because of the general increase in small bubble sizes in the attached layer. As these bubbles grew and coalesced, the resulting free bubbles became larger. Thickening of the bubble layer also increased the frequency of interactions between free bubbles and the layer, further enlarging free bubble sizes.
Analysis of bubble size distributions further revealed that the total bubble volume increased linearly with current density for all electrode diameters. The slope of this relationship increased with wire diameter, from 1.842 × 10⁻¹¹ m5·A−1 at 0.1 mm to 8.303 × 10⁻¹¹ m5·A−1 at 0.4 mm, indicating that bubble volume increased more significantly on larger-diameter electrodes.
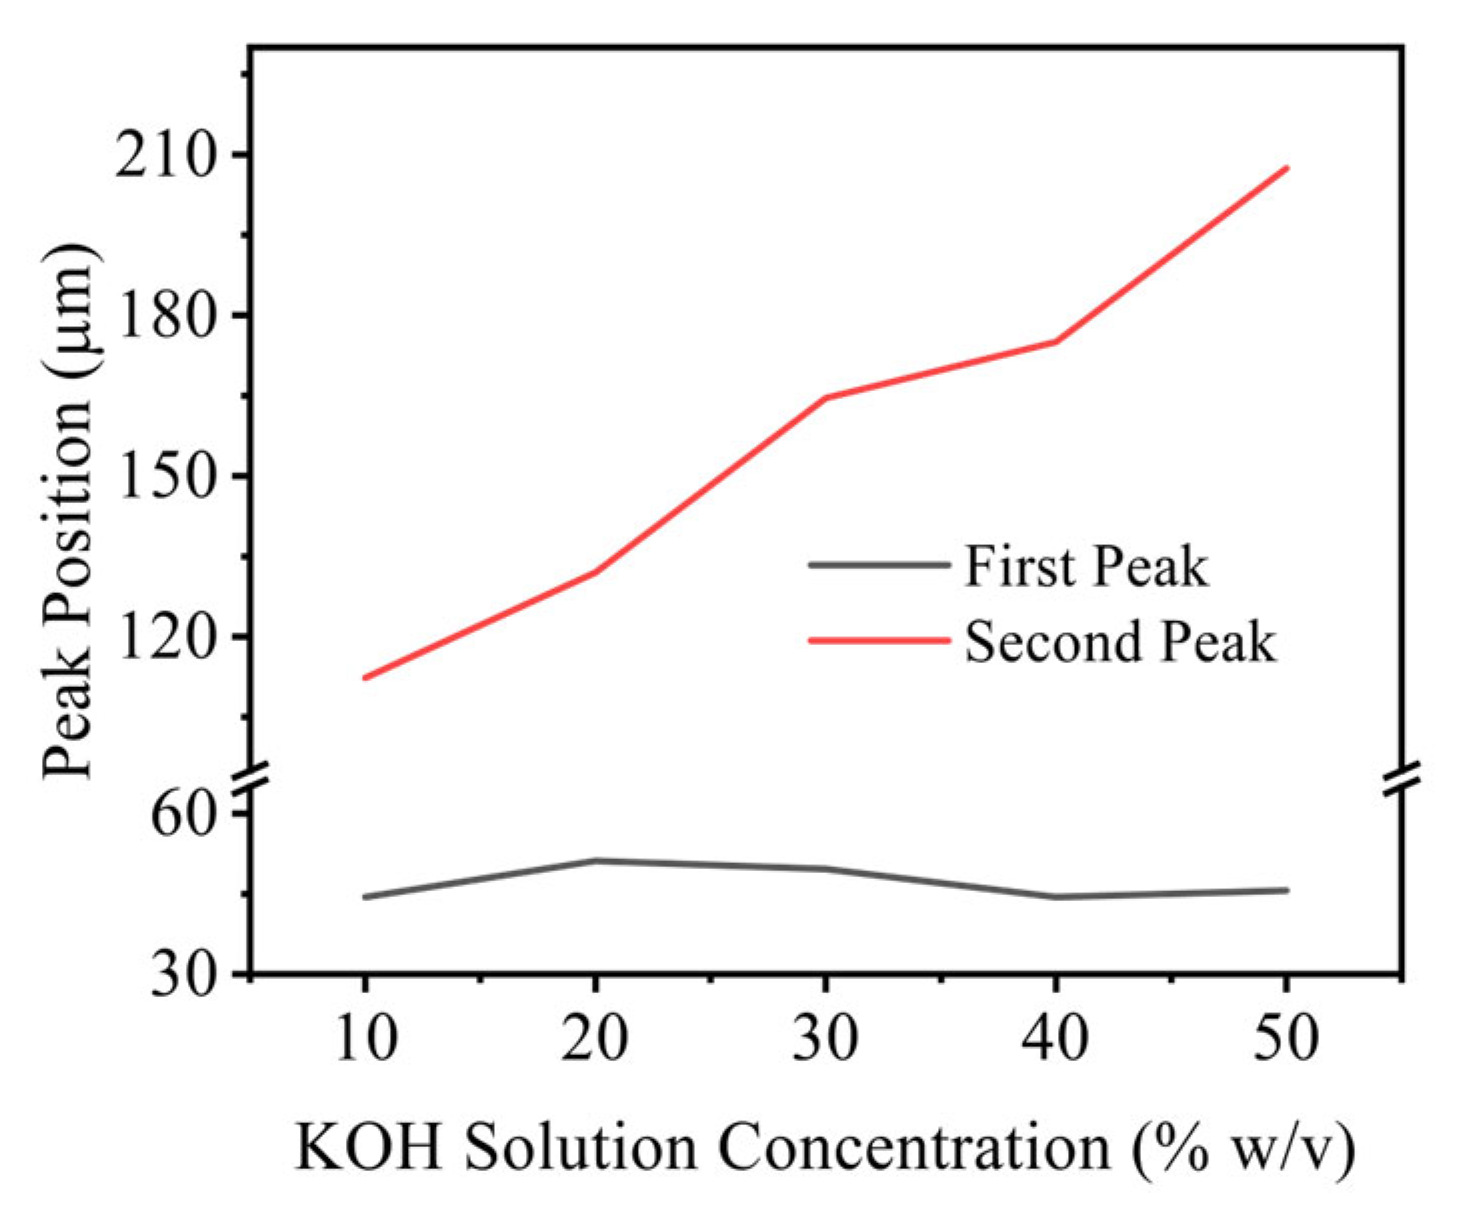
At a fixed current density of 1.0 A·cm−2 and wire diameter of 0.4 mm, bubble size distributions in all KOH solutions displayed bimodal patterns. Further analysis of the peak values and positions revealed that as KOH concentration increased, the magnitude and frequency of the first peak rose, while the second peak decreased. The position of the first peak remained essentially unchanged, while the second peak shifted to larger sizes (Figure 9).
At this current density, the electrode surface was fully covered, nucleation sites were saturated, and their density was determined mainly by electrode morphology. Consequently, bubble sizes in the attached layer remained constant, keeping the first peak position stable. With increasing KOH concentration, however, higher viscosity increased resistance to bubble cluster motion, reducing their sweeping ability. This led to more small and medium bubbles remaining in the attached layer, increasing the first peak. The second peak represented free bubbles. According to reported properties of KOH solutions [27], density, surface tension and viscosity increase monotonically with concentration (Figure 10). However, viscosity increases more sharply than density. Since buoyancy is proportional to density and drag is proportional to viscosity, viscous resistance dominates at higher concentrations, slowing bubble rise. This extended residence near the electrode promoted coalescence. In addition, as the concentration of KOH solution increases, the surface tension becomes larger, enhancing the interfacial attraction between bubbles. This makes it more prone to rupture, thereby facilitating bubble coalescence—thus promoting coalescence between bubbles. Considering the above factors, free bubble clusters remain near the electrode for a longer duration, providing more opportunities and a higher tendency to coalesce with other bubbles. Consequently, larger free bubbles are produced and the position of the second peak shifts to the right.

3.2. Influence of Gas Evolution on Electrolytic Performance

3.2.1. OER Performance Under Varying Operating Conditions

Polarization curves obtained from LSV can be divided into an activation-controlled region and an ohmic-controlled region. In the activation-controlled region, OER performance under different conditions can be compared via the Tafel slope; in the ohmic-controlled region, the overpotential increases linearly with current density, and performance is evaluated by comparing the overpotential.
We first compare the polarization curves for nickel wire electrodes of different diameters. At identical current density, the overpotential decreases as the wire diameter increases, indicating improved OER performance. At an industrially relevant current density of 0.6 A·cm−2, increasing the cylindrical wire diameter from 0.1 mm to 0.4 mm reduces the overpotential from 0.645 V to 0.441 V. Focusing on the activation-controlled region, the abscissa of the polarization curve was converted to log(i) to obtain Tafel plots (Figure 11a) and extract Tafel slopes. The Tafel slope decreases monotonically with increasing wire diameter, implying that for the same multiplicative increase in current density, larger-diameter electrodes require a smaller increase in overpotential, thus exhibiting superior electrochemical performance.
Next, we compare polarization curves measured in KOH solutions of different concentrations. As KOH concentration increases, the OER overpotential first decreases and then increases. The minimum overpotential (0.441 V) occurs at 30% KOH, which corresponds to the optimal electrolytic performance and is consistent with industrial practice where 30% KOH is commonly used. This trend arises because the conductivity of KOH solutions does not monotonically increase with concentration; above ~35%, conductivity declines [28,29]. Consistently, the Tafel slope reaches its minimum of 51.21 mV·dec−1 at 30% KOH (Figure 11b).
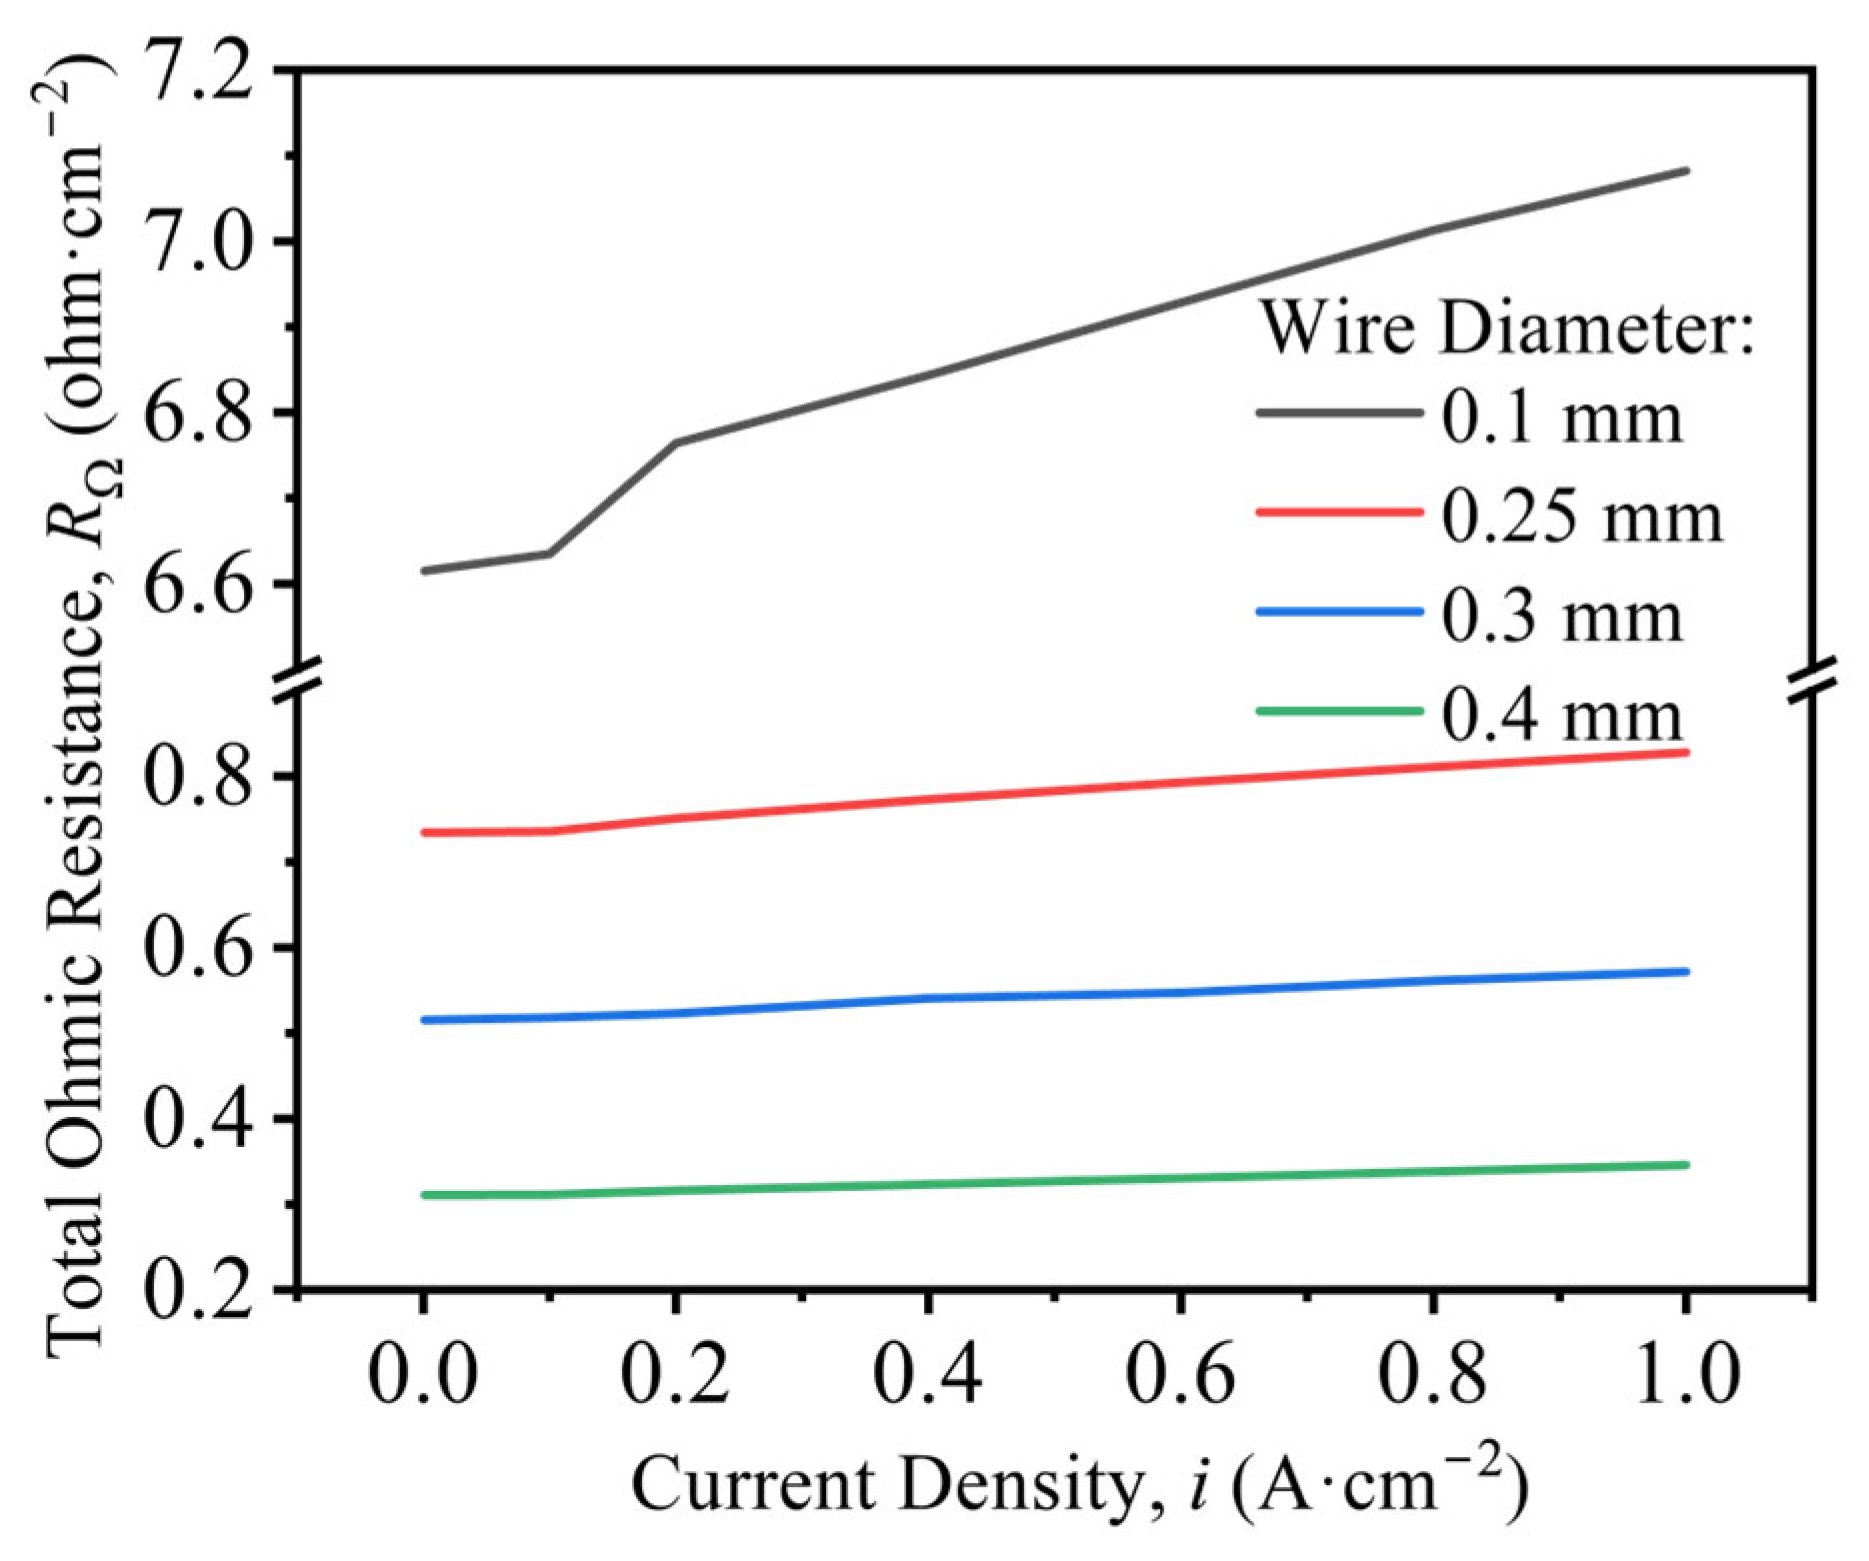
EIS spectra acquired at different current densities were fitted to obtain the ohmic resistance, RΩ. RΩ increases with current density; when the current density rises from 0.1 to 1.0 A·cm−2, the total solution resistance increases from 0.2501 Ω to 0.2781 Ω (an 11.2% increase), with a strong linear dependence on current density. A similar analysis across wire diameters and KOH concentrations shows that decreasing wire diameter leads to larger total ohmic resistance (Figure 12), likely due to a higher volume fraction of electrically insulating bubbles near the electrode. With increasing KOH concentration, the total resistance decreases and then increases, mirroring the intrinsic conductivity trend of the electrolyte.

3.2.2. Correlation Between Gas Evolution and OER Performance

Gas bubble evolution generally exerts a detrimental influence on OER: bubbles adhered to the electrode reduce the active area and raise the activation overpotential, while bubbles dispersed in the electrolyte increase the solution resistance, thereby elevating the ohmic overpotential. Here we correlate bubble evolution metrics with electrochemical measurements to elucidate these effects.
From the polarization analysis, when i < 0.1 A·cm−2, η scales linearly with log(i) (Tafel law). For i > 0.1 A·cm−2, the measured overpotential exceeds the extrapolated Tafel line. We define the excess overpotential attributable to bubbles as ΔEbub, i.e., the difference between the experimental overpotential and the Tafel extrapolation (Figure 13). High-speed imaging shows an abrupt change in surface bubble behavior near 0.1 A·cm−2, supporting the assignment of ΔEbub to bubble effects.
Comparisons of Tafel slopes under different conditions further clarify the impact of adhered bubbles in the activation-controlled regime. As shown in Section 3.2.1, the Tafel slope decreases with increasing wire diameter, indicating improved kinetics. Although smaller-diameter wires host fewer absolute bubbles at the same current, normalization by geometric area reveals a higher areal bubble coverage on smaller wires, which correlates with larger Tafel slopes due to more extensive blockage of active sites.
Finally, we analyze the ohmic loss induced by bubbles dispersed in the electrolyte using EIS. Section 3.1 established a strong linear relationship between the total bubble volume and current density; Section 3.2.1 showed that the total solution resistance also scales linearly with current density. These observations suggest a direct connection between bubble volume and ohmic loss. By correcting the measured total resistance for the intrinsic (bubble-free) electrolyte resistance, we obtain the bubble-induced ohmic contribution, Rbub (Equation (5)). A linear correlation is observed between Rbub and the total bubble volume, Vbub, confirming that increases in current density elevate the bubble volume fraction, reduce the effective conductivity of the electrolyte, and thereby increase ohmic losses.
R bub = R solution R 0

4. Conclusions

A visualized alkaline water electrolysis platform was established to observe gas evolution on electrode surfaces, enabling systematic investigation of oxygen bubble behavior on vertical nickel wire electrodes under various operating conditions and its impact on electrolytic performance. The main findings are as follows.
  • Bubble evolution modes were classified. Under very low current density (0.001 A·cm−2), isolated bubbles complete growth and detachment independently, and detachment diameter increases with current density. At higher current densities, surface coverage by bubbles increases and bubbles manifest as an attached bubble layer plus free bubble groups: bubbles in the layer grow via diffusion and coalescence, whereas free bubbles grow predominantly via coalescence.
  • Effects of current density, electrode diameter, and KOH concentration were revealed. Increasing current density thickens the bubble layer and transforms the bubble size distribution from unimodal to bimodal, with the two peaks attributable to the attached layer and the free bubble population, respectively. Increasing wire diameter raises both the number and size of bubbles in the attached layer and increases the number and size of free bubbles, due to larger active areas (more nucleation sites) and reduced curvature (stronger adhesion and more available growth space), which delays detachment. With increasing KOH concentration, the mean bubble diameter within the attached layer remains essentially constant because nucleation sites are saturated; the number of small/medium bubbles in the layer increases as higher viscosity weakens the sweeping action of bubble clusters. In contrast, the average size of free bubbles increases while their number decreases, as higher viscosity slows bubble rise, prolongs residence near the electrode, and promotes coalescence.
  • Larger wire diameters improve OER performance, reflected by lower overpotentials and smaller Tafel slopes. The effect of KOH concentration is non-monotonic: performance is optimal at 30% (w/v) KOH, where both overpotential and Tafel slope reach minimum, consistent with industrial practice. The bubble-induced overpotential, ΔEbub, increases with current density. Electrodes of smaller diameter exhibit higher areal bubble coverage and inferior activation-controlled performance. Dispersed bubbles elevate the solution resistance; correlation analysis demonstrates a linear relationship between total bubble volume and bubble-induced ohmic resistance, Rbub.
These findings provide mechanistic insights into the coupling between bubble evolution and electrochemical performance, offering guidance for the design of efficient alkaline electrolyzers. However, this work was constrained by the experimental setup and methodology. Future studies may focus on modifying the experimental system and improving the methodology to further investigate the effect of gas evolution on electrolytic performance under industrial electrode conditions. In addition, the present study only summarized and reported the coalescence behavior of oxygen bubbles, while the mechanisms underlying bubble jumping and reattachment after coalescence remain unclear. Theoretical modeling that considers the influence of Marangoni effects [30,31] and electrostatic forces could be employed in future work to gain deeper insight into the mechanisms of bubble coalescence.

Supplementary Materials

The following supporting information can be downloaded at: https://www.mdpi.com/article/10.3390/en18225888/s1. Video S1: primary bubble grows along the electrode surface; Video S2: bubble cluster sweeps through the bubble layer; Video S3: bubble jumps and returns.

Author Contributions

Conceptualization, J.L., J.Z. and Q.S.; methodology, J.L., J.Z., Y.A. and Q.S.; software, J.L. and J.Z.; validation, J.L.; formal analysis, J.L. and J.Z.; investigation, J.L. and J.Z.; resources, Y.D. and Q.S.; data curation, J.L.; writing—original draft preparation, J.L.; writing—review and editing, J.L. and Q.S.; visualization, J.L.; supervision, Q.S.; project administration, Q.S.; funding acquisition, Y.D. and Q.S. All authors have read and agreed to the published version of the manuscript.

Funding

This work was supported by Shanxi Province Science and Technology Major Projects (202401060301011) and the Fundamental Research Funds for the Central Universities of China (2022ZFJH04).

Data Availability Statement

The data supporting the findings of this study are available within the article. Further questions can be directed to the corresponding author.

Conflicts of Interest

The authors declare no conflicts of interest.

References

  1. Yin, Y.; Pang, J.; Huang, D.; Wu, D.; Dou, Q. Current Situation and Development of Large-Scale Water Electrolysis Hydrogen Production Technology. Guangdong Chem. Ind. 2022, 49, 97–98+57. [Google Scholar] [CrossRef]
  2. Beijing Jinzhengzongheng Information Consulting Co., Ltd. China Hydrogen Energy Industry Development Blue Book (2023); Beijing Jinzhengzongheng Information Consulting Co., Ltd.: Beijing, China, 2023; pp. 1–82. Available online: https://max.book118.com/html/2025/0102/8103033120007014.shtm (accessed on 22 September 2025).
  3. Yu, H.; Shao, Z.; Hou, M.; Yi, B.; Duan, F.; Yang, Y. Research Progress and Development Suggestions on Water Electrolysis for Hydrogen Production. Strateg. Study CAE 2021, 23, 146–152. [Google Scholar] [CrossRef]
  4. Sebbahi, S.; Assila, A.; Belghiti, A.A.; Laasri, S.; Kaya, S.; Hlil, E.K.; Rachidi, S.; Hajjaji, A. A Comprehensive Review of Recent Advances in Alkaline Water Electrolysis for Hydrogen Production. Int. J. Hydrog. Energy 2024, 82, 583–599. [Google Scholar] [CrossRef]
  5. Chi, J.; Yu, H.M. Water Electrolysis Based on Renewable Energy for Hydrogen Production. Chin. J. Catal. 2018, 39, 390–391. [Google Scholar] [CrossRef]
  6. Grigoriev, S.A.; Fateev, V.N.; Bessarabov, D.G.; Millet, P. Current Status, Research Trends, and Challenges in Water Electrolysis Science and Technology. Int. J. Hydrog. Energy 2020, 45, 26036–26058. [Google Scholar] [CrossRef]
  7. Bashkatov, A.; Hossain, S.S.; Mutschke, G.; Yang, X.; Rox, H.; Weidinger, I.M.; Eckert, K. On the Growth Regimes of Hydrogen Bubbles at Microelectrodes. Phys. Chem. Chem. Phys. 2022, 24, 26738–26752. [Google Scholar] [CrossRef]
  8. Ward, C.A.; Balakrishnan, A.; Hooper, F.C. On the Thermodynamics of Nucleation in Weak Gas-Liquid Solutions. J. Fluids Eng. 1970, 92, 695–701. [Google Scholar] [CrossRef]
  9. Struyven, F.; Sellier, M.; Mandin, P. Review: Interactions Between Electrogenerated Bubbles and Microfluidic Phenomena. Int. J. Hydrog. Energy 2023, 48, 32607–32630. [Google Scholar] [CrossRef]
  10. Lubetkin, S.D. Why Is It Much Easier to Nucleate Gas Bubbles Than Theory Predicts? Langmuir 2003, 19, 2575–2587. [Google Scholar] [CrossRef]
  11. Brandon, N.P.; Kelsall, G.H. Growth Kinetics of Bubbles Electrogenerated at Microelectrodes. J. Appl. Electrochem. 1985, 15, 475–484. [Google Scholar] [CrossRef]
  12. Lubetkin, S.D. The Fundamentals of Bubble Evolution. Chem. Soc. Rev. 1995, 24, 243–250. [Google Scholar] [CrossRef]
  13. Taqieddin, A.; Nazari, R.; Rajic, L.; Alshawabkeh, A. Review—Physicochemical Hydrodynamics of Gas Bubbles in Two-Phase Electrochemical Systems. J. Electrochem. Soc. 2017, 164, E448–E459. [Google Scholar] [CrossRef]
  14. Jin, L.; Cheng, Z.; Deng, L.; Sun, T.; Gao, Z.; Yang, L.; Li, F.; He, G.; Geng, Z.; Zhang, C. Electrode Morphology and Structural Engineering Accelerates Bubble Detachment Dynamics in NiFe Porous Electrodes for Alkaline Water Electrolysis. Electrochim. Acta 2025, 535, 146670. [Google Scholar] [CrossRef]
  15. Ikeda, H.; Misumi, R.; Kojima, Y.; Haleem, A.A.; Kuroda, Y.; Mitsushima, S. Microscopic High-Speed Video Observation of Oxygen Bubble Generation Behavior and Effects of Anode Electrode Shape on OER Performance in Alkaline Water Electrolysis. Int. J. Hydrog. Energy 2022, 47, 11116–11127. [Google Scholar] [CrossRef]
  16. Liu, Y.; Li, S.; Wu, H.; Shi, Y. Experimental Investigation and Analysis for the Bubble Size Distribution During Alkaline Water Electrolysis by Using a Wire Electrode. DeCarbon 2024, 5, 100052. [Google Scholar] [CrossRef]
  17. Zhang, D.K.; Zeng, K. Evaluating the Behavior of Electrolytic Gas Bubbles and Their Effect on the Cell Voltage in Alkaline Water Electrolysis. Ind. Eng. Chem. Res. 2012, 51, 13825–13832. [Google Scholar] [CrossRef]
  18. Araújo, F.; Costa Neto, R.; Moita, A.S. Alkaline Water Electrolysis: Ultrasonic Field and Hydrogen Bubble Formation. Int. J. Hydrog. Energy 2024, 78, 594–603. [Google Scholar] [CrossRef]
  19. Song, Q.; Xue, Z.; Liu, C.; Qiao, X.; Liu, L.; Huang, C.; Liu, K.; Li, X.; Lu, Z.; Wang, T. General Strategy to Optimize Gas Evolution Reaction via Assembled Striped-Pattern Superlattices. J. Am. Chem. Soc. 2020, 142, 1857–1863. [Google Scholar] [CrossRef]
  20. Sides, P.J. Phenomena and Effects of Electrolytic Gas Evolution. In Modern Aspects of Electrochemistry; Springer: Boston, MA, USA, 1986; Volume 18, pp. 303–354. [Google Scholar] [CrossRef]
  21. Haverkort, J.W.; Aghdam, A.S.; Craye, E.J.B. The Optimal Electrode Hole Size in Zero-Gap Alkaline Water Electrolysis: A Combined Electrochemical, Theoretical, and Bubble Imaging Approach. Int. J. Hydrog. Energy 2025, 171, 150919. [Google Scholar] [CrossRef]
  22. Yin, W.; Yuan, L.; Huang, H.; Cai, Y.; Pan, J.; Sun, N.; Zhang, Q.; Shu, Q.; Gu, C.; Zhuang, Z.; et al. Strategies to Accelerate Bubble Detachment for Efficient Hydrogen Evolution. Chin. Chem. Lett. 2024, 35, 108351. [Google Scholar] [CrossRef]
  23. Fogaça, W.; Ikeda, H.; Misumi, R.; Kuroda, Y.; Mitsushima, S. Enhancement of Oxygen Evolution Reaction in Alkaline Water Electrolysis by Lorentz Forces Generated by an External Magnetic Field. Int. J. Hydrog. Energy 2024, 61, 1274–1281. [Google Scholar] [CrossRef]
  24. Wang, M.; Wang, Z.; Guo, Z. Water Electrolysis Enhanced by Super Gravity Field for Hydrogen Production. Int. J. Hydrog. Energy 2010, 35, 3198–3205. [Google Scholar] [CrossRef]
  25. Bakker, M.M.; Vermaas, D.A. Gas Bubble Removal in Alkaline Water Electrolysis with Utilization of Pressure Swings. Electrochim. Acta 2019, 319, 148–157. [Google Scholar] [CrossRef]
  26. Zhao, P.; Gong, S.; Zhang, C.; Chen, S.; Cheng, P. Roles of Wettability and Wickability on Enhanced Hydrogen Evolution Reactions. ACS Appl. Mater. Interfaces 2024, 16, 27898–27907. [Google Scholar] [CrossRef]
  27. Hodges, A.; Renz, S.; Lohmann-Richters, F.; Al-Musawi, A.; Jupke, A.; Lehnert, W.; Swiegers, G.F.; Wallace, G.G. Critical Analysis of Published Physical Property Data for Aqueous Potassium Hydroxide. Collation into Detailed Models for Alkaline Electrolysis. J. Chem. Eng. Data 2023, 68, 1485–1506. [Google Scholar] [CrossRef]
  28. Gilliam, R.J.; Graydon, J.W.; Kirk, D.W.; Thorpe, S.J. A Review of Specific Conductivities of Potassium Hydroxide Solutions for Various Concentrations and Temperatures. Int. J. Hydrog. Energy 2007, 32, 359–364. [Google Scholar] [CrossRef]
  29. See, D.M.; White, R.E. Temperature and Concentration Dependence of the Specific Conductivity of Concentrated Solutions of Potassium Hydroxide. J. Chem. Eng. Data 1997, 42, 1266–1268. [Google Scholar] [CrossRef]
  30. Khalighi, F.; Vreman, A.W.; Tang, Y.; Deen, N.G. Solutal Marangoni Effects on Growing Hydrogen and Oxygen Bubbles in Alkaline Water Electrolysis. Chem. Eng. Sci. 2025, 311, 121577. [Google Scholar] [CrossRef]
  31. Lu, X.; Yadav, D.; Ma, B.; Ma, L.; Jing, D. Rapid Detachment of Hydrogen Bubbles for Electrolytic Water Splitting Driven by Combined Effects of Marangoni Force and the Electrostatic Repulsion. J. Power Sources 2024, 599, 234217. [Google Scholar] [CrossRef]
Figure 1. Schematic diagram of the experimental setup.
Energies 18 05888 g001
Figure 2. Bubble detection model: (a) Representative examples; (b) comparison of bubble size distribution obtained by manual annotation and the deep learning model.
Energies 18 05888 g002
Figure 3. Equivalent circuit model of the system under charge-transfer control.
Energies 18 05888 g003
Figure 4. Illustration of primary bubble growth along the electrode surface.
Energies 18 05888 g004
Figure 5. Relationship between primary bubble diameter and current density in KOH solutions of different concentrations.
Energies 18 05888 g005
Figure 6. Example of bubble cluster (the region marked by the red box) sweeping through the bubble layer.
Energies 18 05888 g006
Figure 7. Oxygen bubble size distributions at different current densities.
Energies 18 05888 g007
Figure 8. Oxygen bubble size distributions for nickel wires of different diameters.
Energies 18 05888 g008
Figure 9. Variation in peak positions in oxygen bubble size distributions with KOH solution concentration.
Energies 18 05888 g009
Figure 10. Density, surface tension and viscosity of KOH solutions at different concentrations.
Energies 18 05888 g010
Figure 11. Tafel plots under different electrolysis conditions: (a) Nickel wire electrodes with different diameters; (b) KOH solutions of varying concentrations.
Energies 18 05888 g011
Figure 12. Variation in solution resistance with current density for nickel wires of different diameters.
Energies 18 05888 g012
Figure 13. Schematic illustration of bubble-induced overpotential, ΔEbub.
Energies 18 05888 g013
Table 1. Experimental Instruments, Devices and Materials.
Item NameSpecificationManufacturer Information
Electrolytic CellCustomized 250 mL
Container
Custom-made, Tianjin, China
Electrochemical WorkstationReference 3000Gamry Instruments, Warminster, PA, USA
High-Speed CameraPhantomAmetek, Inc., Berwyn, PA, USA
Imaging Lens2X FMOUNTNavitar, Inc., Rochester, NY, USA
Nickel WirePurity 99.99%/Diameter 0.1~0.4 mmShenghang Research Institute of Metal Materials, Shenyang, China
Mercuric Oxide ElectrodeR0501Shanghai Ledun Industrial Co., Ltd., Shanghai, China
Potassium Hydroxide
Solution
10% and 50% (w/v)Shanghai Aladdin Biochemical Technology Co., Ltd., Shanghai, China
Potassium Hydroxide
Solution
20% and 40% (w/v)Shanghai Macklin Biochemical Technology Co., Ltd., Shanghai, China
Potassium Hydroxide
Solution
30% (w/v)Anhui Zesheng Technology Co., Ltd., Hefei, China
Disclaimer/Publisher’s Note: The statements, opinions and data contained in all publications are solely those of the individual author(s) and contributor(s) and not of MDPI and/or the editor(s). MDPI and/or the editor(s) disclaim responsibility for any injury to people or property resulting from any ideas, methods, instructions or products referred to in the content.