Article

Multi-Criteria-Based Key Transmission Section Identification and Prevention–Emergency Coordinated Optimal Control Strategy

by
Xinyu Peng
1,
Chuan He
1,*,
Honghao Zhang
1,
Lu Nan
1,
Tianqi Liu
1,
Jian Gao
2,
Biao Wang
2,
Xi Ye
2 and
Xinwei Sun
3
1
School of Electrical Engineering, Sichuan University, Chengdu 610065, China
2
State Grid Sichuan Electric Power Co., Ltd., Chengdu 610041, China
3
State Grid Sichuan Electric Power Research Institute, Chengdu 610041, China
*
Author to whom correspondence should be addressed.
Energies 2025, 18(22), 5871; https://doi.org/10.3390/en18225871
Submission received: 13 October 2025 / Revised: 2 November 2025 / Accepted: 4 November 2025 / Published: 7 November 2025

Abstract

Large-scale blackouts in power systems are often triggered by weak links susceptible to cascading failures. As the concentrated reflection of the system’s weak links, identifying key transmission sections and further implementing safety control measures are of great significance for ensuring the stable operation of the system. This paper proposes a multi-criteria-based method for identifying key transmission sections and an optimal strategy for the prevention–emergency coordinated control of key transmission sections. Firstly, a line criticality index based on three characteristics—topology, power flow, and voltage—has been established to identify critical lines. Furthermore, search for all initial transmission sections that include the critical line, and form the initial transmission section set for each critical line, then, based on the analysis of the Theil index of power flow impact rate distribution after the failure of critical lines, a key transmission section identification method integrating multiple criteria is proposed. Then, based on the anticipated faults of key transmission sections, an optimization model for the prevention–emergency coordinated control of key transmission sections is established. A constraint relaxation factor is introduced to divide the above model into two independent sub-problems, then the golden section method is applied to update the value of constraint relaxation factors, so as to iteratively search for the optimal solution of the model. Finally, the feasibility and correctness of the proposed method are verified through the simulation and analysis of the IEEE 39-bus system. The results demonstrate that the proposed method can effectively identify the key transmission sections of the system and improve the operational safety of the system through the prevention–emergency coordinated optimal control strategy.

1. Introduction

With the continuous growth of social electricity load, the scale of power systems has been expanding, gradually forming an interconnected power grid covering a wide area [1]. As a vital channel in the power grid for transmitting electrical energy from power-sending regions to power-receiving regions, key sections undertake the task of power transmission and become the bottleneck in the process of electrical energy transmission. Reference [2] points out that if a fault occurs on a line within a key section, it may cause the active power carried by this line to transfer, resulting in overload on adjacent lines and triggering the tripping of overload protection. Consequently, cascading transmission line overload faults may occur, blocking the transmission of electrical energy from power-sending regions to power-receiving regions and resulting in large-scale power outage accidents. Therefore, key sections are a concentrated manifestation of system weak links. Reference [3] points out that one of the primary causes of the “Brazilian blackout on 21 March 2018” was long-standing weak links in the grid structure. This paper aims to achieve accurate identification of key sections in the power system. Furthermore, by implementing appropriate security control measures for key sections, this study seeks to reduce failure risks and post-failure impacts, thereby improving the security and stability of the power system.
The key transmission section in the power system refers to a set of transmission lines with strong electrical correlations, transmitting power in the same direction, and spanning across regions in the power grid. Most methods for identifying key transmission sections are based on the identification of critical lines [4]. At present, research on critical lines identification can be classified into two categories: network-topology-based and system-operating-status-based. Among them, network-topology-based methods mainly measure the criticality of lines through topology evaluation indexes such as betweenness centrality [5] which is introduced from complex network theory [6]. Identification methods based on system operating status often evaluate the criticality of a line by employing indexes based on its operational parameters [7]. Meanwhile, recent studies have begun to adopt identification methods considering multiple factors [8]. On the basis of accurately identifying critical lines, references [9,10] introduced the first k shortest paths algorithm and line outage distribution factors, which can be used to identify lines exhibiting strong electrical correlation with critical lines. The identification of key transmission sections can be achieved through the methods described in the aforementioned studies. However, the issue of duplicate sections occurs in the identification process; redundant key transmission section identification results will lead to compromised monitoring efficiency of the system. Therefore, further research on key transmission section identification methods should be carried out.
To ensure the safe and stable operation of the system, safety correction for key transmission sections with potential failure risks should be carried out promptly [11]. Reference [12] proposed a sensitivity-based power flow control strategy, which screens units with high sensitivity to adjust line power flow, thereby achieving prevention control before faults. Reference [13] presented an online optimization algorithm to implement emergency control for power grids in urgent scenarios such as voltage violations or power flow violations. The aforementioned works separately implemented prevention and emergency control measures on the system. However, they failed to analyze the impact of the preventive measures on emergency control, thus overlooking the coupling relationship between prevention control and emergency control. Therefore, it is necessary to further study the optimal strategy for prevention–emergency coordinated control of key transmission sections to enhance the security of system operation.
The above studies indicate that current method for key transmission section identification has several limitations. First, the key line identification indexes established in the existing studies lack comprehensiveness [4,5,6]. Secondly, in the process of key transmission section identification, issues such as duplicate sections and inadequate electrical correlation among lines within a section exist, which reduces the efficiency of the system’s monitoring [14]. Additionally, research on the optimal strategy for prevention–emergency coordinated control of key transmission sections is lacking. To this end, a multi-criteria-based key transmission section identification method and prevention–emergency coordinated optimal control strategy is proposed to address the above challenges. The main contributions are as follows:
  • Considering the topological, power flow, and voltage importance of transmission lines. A comprehensive index is proposed to accurately identify the critical lines of the system.
  • The initial transmission section of the critical lines is subsequently identified via the cut-set search and power flow consistency verification. The distribution of the power flow impact after critical line faults is analyzed through the Theil index, then a multi-criteria-based method is proposed to identify key transmission sections among initial transmission sections.
  • Considering the coupling relationship between prevention control and emergency control, an optimal model for prevention–emergency coordinated control of key transmission sections is established. By introducing a constraint relaxation factor, the aforementioned model is decomposed, and the golden section method is then employed to update the constraint relaxation factor, thereby searching for the optimal coordinated control solution of the system.

2. Key Transmission Section Identification Considering Multiple Criteria

This section first proposes three indexes to identify critical lines. Then the Theil index is employed to analyze the imbalance of power flow impacts on lines inside and outside of each initial transmission section after faults on critical lines. On this basis, a multi-criteria method is proposed to identify key transmission sections among the initial transmission sections.

2.1. Critical Line Identification

In this section, the criticality of power lines in terms of topological, power flow, and voltage characteristics is considered, and a comprehensive evaluation index for critical lines is proposed as follows:
F l C = F l T + F l P + F l V
where   F l C represents the comprehensive criticality of line l ; F l T represents the topological criticality of the line; F l P represents the power flow criticality of the line; and F l V represents the voltage criticality of the line.

2.1.1. Topological Criticality

As a fundamental metric in complex network theory, edge betweenness centrality (EBC) reflects the criticality of a line in terms of topological connectivity through the ratio of the number of all shortest paths in the system that pass through the line to the total number of shortest paths. The topological criticality of the line is determined by EBC and the strength of its association with other lines, as shown in Equation (2):
F l T = K i K j s = 1 n t = 1 , t s n σ s t ( l ) σ s t
where node i and node j denote the two ends of line l ; K i and K j respectively represent the number of lines connected to node i and node j ,   σ s t represents the total number of the shortest paths between node s and node t ; σ s t l   represents the number those paths that pass through line l ; and n represents the number of nodes.

2.1.2. Power Flow Criticality

The power flow criticality of a line is defined by the ratio of its operating power flow to its maximum power capacity and the maximum power flow in the system:
F l P = P l P l m a x + P l P m a x
where   P l represents the power flow value of line l ; P l m a x represents the maximum capacity of line l ; P m a x represents the maximum value of power flow in the system.

2.1.3. Voltage Criticality

The line parameters and operating parameters of the type π equivalent circuit are shown in Figure 1.
The voltage equation between nodes i and j can be expressed as Equation (4) by expanding it into real and imaginary parts, respectively; Equations (5) and (6) are obtained.
U ˙ i = U ˙ j + P l + Q l U ˙ j * ( R + j X )
B R 2 U j 2 U i U j s i n δ + P l X Q l R = 0
1 B X 2 U j 2 U i U j c o s δ + P l R + Q l X = 0
δ = δ i δ j
Treating the terminal voltage as the unknown quantity in Equations (4)–(7), the conditions for the solvability of the terminal voltage are given in Equations (8) and (9).
U i 2 s i n 2 δ 2 B R ( P l X Q l R ) 0
U i 2 c o s 2 δ 4 ( 1 B X 2 ) ( P l R + Q l X ) 0
When the above solvability conditions are violated, the terminal voltage approaches collapse status; therefore, the line voltage criticality F l V can be defined by the degree to which the operating state of the line approaches the unsolvable boundary, as shown below:
F l V = m a x ( F l , 1 V , F l , 2 V )
F l , 1 V = 2 B R ( P l X Q l R ) U i 2 s i n 2 δ
F l , 2 V = 4 ( 1 B X 2 ) ( P l R + Q l X ) U i 2 c o s 2 δ

2.2. Key Transmission Section Identification Method

2.2.1. Initial Transmission Section Identification

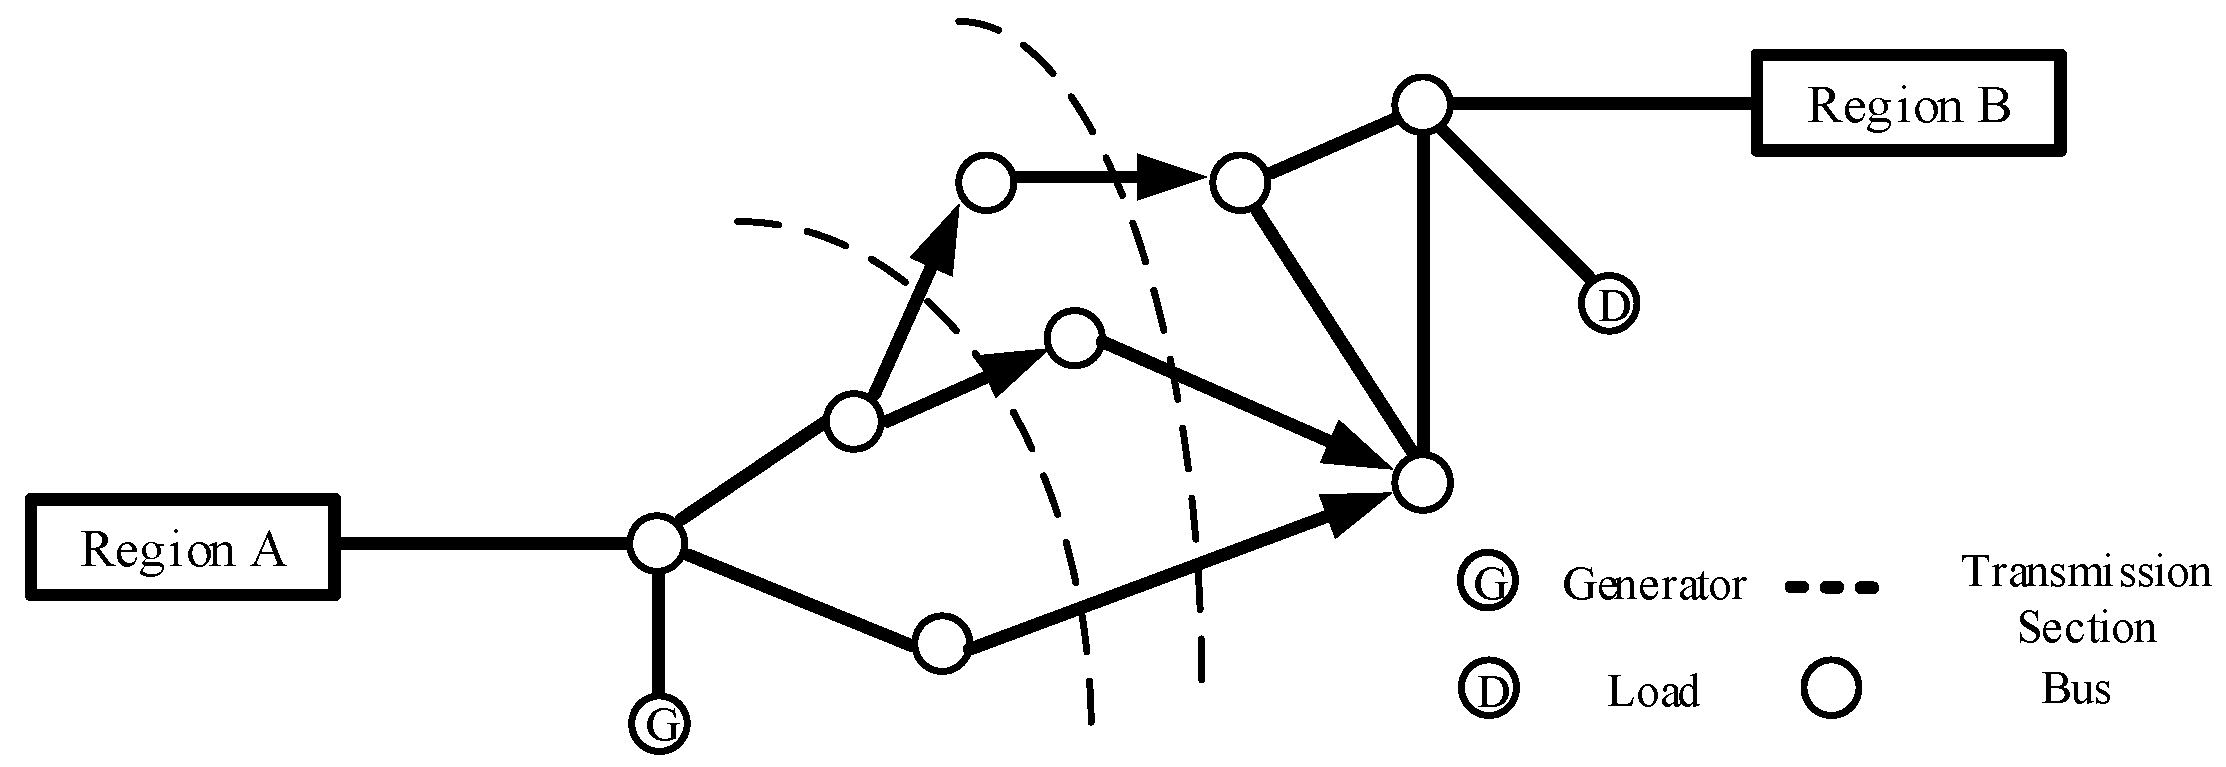
As mentioned above, the initial transmission section is defined as a cut-set in the system, composed of transmission lines that have the same power flow direction. The initial transmission section is shown in Figure 2. The arrows in the figure indicate the direction of the power flow.
The number of lines inside the section is denoted as n ( n = 2 ,   3 ,   ), and the depth-first search (DFS) algorithm is adopted to search for the initial transmission sections composed of critical lines l . The specific steps are as follows (Algorithm 1):
Algorithm 1: DFS-based Cut-set Generation Algorithm
Input: System’s undirected adjacency matrix M, critical line l, maximum number n within
      a cut-set, k = 1
Output: Initial transmission section set S(l) of critical line l
1: for  i = 1 to n do
2: Generate all possible combinations of n − 1 lines from the system
3: Count the number of all combinations and denote as h
4:   for  j = 1 to h  do
5:   Integrate the j-th combination with critical line l to form candidate set s(k)
6:   Remove all lines in s(k) from M to obtain modified graph M
7:   Starting from any generator node, perform DFS traversal on M’
8:     If at least one load node is unreachable then
9:      If all power flow directions are consistent then
10:      Add s(k) to S(l)
11:     end if
12:    end if
13:     j = j + 1
14:     k = k + 1
15:   end for
16:    i = i + 1
17: end for
18: Return S(l)

2.2.2. Key Transmission Section Identification

In addition to the characteristics of the initial transmission section, key transmission sections also exhibit strong internal electrical correlation. Due to the ability to analyze distribution equilibrium, the Theil index is employed to analyze the distribution of power flow impacts following the line faults, thereby revealing the electrical correlation between transmission lines.
The process of the key transmission section identification is shown in Figure 3.
This section proposes the power flow impact rate to reflect the impacts on other lines in the system after the failure of critical line l . Based on the initial transmission sections obtained in Section 2.2.1, the lines are divided into two categories: those inside the sections and those outside the sections. The Theil index is then used to analyze the imbalance degree of fault impact on the inside and outside of the sections, so as to further identify key transmission sections with strong internal electrical correlation among initial transmission sections.
If the absolute value of the power flow on line k increases after line l fails, the power flow impact rate on line k can be calculated by the following formula:
μ k , l = P k , l P k P k m a x P k
η k , l = μ k , l t = 1 . t l μ t , l
where   P k , l represents the power flow value of line k after line l fails; and μ k , l represents the power flow impact rate of line k after line l fails; and η k , l represents the normalized power flow impact rate.
Assuming that there are N lines in the system and the N lines are divided into m groups. This paper focuses on the imbalance of the power flow impact inside and outside of the section; therefore, taking m = 2 . Group 1 and 2, respectively, correspond to the lines inside and outside of the section, respectively. When line l fails, the Theil index of the system’s power flow impact rate can be expanded as follows:
T P = q = 1 m η q η T 1 q + q = 1 m η q η l n η q / η N q / N = T 1 + T 2
T 1 q = h = 1 N q η q h η q l n η q l / η q l 1 / N q
ε = T 1 q T P
where T P , T 1 , T 2 respectively represent the global, intra group, and inter group imbalance degree of power flow impact distributions; N q represents the number of lines in group q ; η , η q , η q h respectively represent the total power flow impact rate of the system, the total power flow impact rate of the lines in group q , and the power flow impact rate of line h in group q ; and ε represents the proportion of the power flow impact distribution imbalance degree within the lines of Group 1.
Therefore, when T 2 corresponding to a certain section is relatively large, while T 1 and ε are relatively small, it indicates that the lines inside the section are subject to a greater impact from the faulty line with a concentrated distribution. In contrast, the lines outside the section are less affected by the faulty line, with a random distribution. In this scenario, the internal electrical correlation of the section is strong, and lines outside the section exhibit low electrical correlation with the critical line. Therefore, this initial transmission section can be further screened as a key transmission section of the system.
Based on the above analysis of power flow impact rate inside and outside of the section, the specific steps for identifying key transmission sections of the system are as follows:
  • Step 1: Based on the initial transmission section set S ( l ) of the critical line l , calculate the Theil index of power flow impact rate after the critical line l fault for each initial transmission section;
  • Step 2: From the initial transmission section set S ( l ) , retain section set Ω 1 where the value of T 2 ranks in the top A%;
  • Step 3: On the basis of Ω 1 , retain section set Ω 2 where the value of ε ranks in the bottom A%;
  • Step 4: From Ω2, select section Ω3 with the smallest T 1 value and form t section Ω3 with the critical line l as the key transmission section of the system.
In the above steps, A represents the screening threshold. The selection of A depends on the size of the system case, and a reasonable value should be chosen such that the number of final candidate sections is relatively concise while maintaining a certain degree of representativeness. Since the number of cut-sets for key transmission lines in this paper ranges approximately from ten to one hundred, a screening threshold of A = 20 is selected.

3. Prevention–Emergency Coordinated Control of Key Transmission Sections

This section proposes a prevention–emergency coordinated control model for key transmission sections. A constraint relaxation factor is introduced to decompose the model. Additionally, the golden section method is used to update the constraint relaxation factor and search for the optimal solution of the model.

3.1. Coordinated Optimization Model

3.1.1. Objective Function

min C = C 1 + C 2
C 1 = i = 1 n G ( c 1 i P G , i , u p p r e + c 2 i P G , i , d o w n p r e )
C 2 = k = 1 n C p k [ i = 1 n G c 1 i P G , i , u p e m + c 2 i P G , i , d o w n e m + i = 1 n L c 3 i P L , i , c u t e m + i = 1 n G c 4 i | P G , i , c u t e m | ]
where n c , n G , and n L respectively represent the number of anticipated faults, generators, and loads; p k represents the probability of the anticipated fault k occurring; c 1 i and c 2 i respectively represent cost for increasing and decreasing the active power of generator i ; c 3 i represents the load cut cost for the load i ; c 4 i represents the cut cost of the generator i ; P G , i , u p p r e and P G , i , d o w n p r e respectively represent the up and down power of generator i during the prevention control process; P G , i , u p e m and P G , i , u p e m respectively represent the up and down power of generator i during the emergency control process; P L , i , c u t e m represents load cut of load i during the emergency control process; and P G , i , c u t e m represents power cut of generator i during the emergency control process.

3.1.2. Constraints

(1)
Load Rate Constraints
β l β l m a x
where β l and β l m a x represent the load rate and the maximum allowable load rate of line l.
(2)
System Power Balance Constraint;
P G , i P L , i V i j Ω ( i ) V j g i j c o s θ i j + b i j s i n θ i j = 0
Q G , i Q L , i V i j Ω ( i ) V j g i j s i n θ i j b i j c o s θ i j = 0
where P G , i and Q G , i represent the active and reactive power generation of node i ; P L , i and Q L , i represent the active and reactive load of node i ; V i and V j represent the voltage of node i and j ; θ i j represent the phase angle difference between node i and j ; b i j and g i j represent the susceptance and conductance between node i and j ; Ω ( i ) denotes the set of adjacent nodes of node i .
(3)
Operational Security Constraints
V i m i n V i V i m a x
P G , i m i n P G , i P G , i m a x
Q G , i m i n Q G , i Q G , i m a x
Constraints (24)–(26) represent the node voltage constraint, generator active power output constraint, and generator reactive power output constraint, respectively.
(4)
Power Adjustment Balance Constraint
i = 1 n G P G , i , u p p r e + P G , i , d o w n p r e = 0
Equation (27) represents the power adjustment balance constraint for prevention control.
| P G . i , u p e m | R G , i
| P G . i , d o w n e m | R G , i
i = 1 n G P G . i , u p e m + P G . i , d o w n e m + i = 1 n L P L , i , c u t e m + i = 1 n G P G , i , c u t e m = 0
Equations (28) and (29) represent the ramp rate constraints, R G , i represents the ramp rate for generator i . Equation (30) represents the power adjustment balance constraint for emergency control.

3.2. Solution Method

3.2.1. Model Partitioning

Within the aforementioned model, the system’s prevention control and emergency control exhibit a distinct chronological order, which poses considerable challenges to direct solution. Therefore, a load rate constraint relaxation factor ρ is introduced to decompose the established model into prevention control under specific relaxation factors, and the corresponding emergency control under the specific prevention control.
The prevention control and emergency control models under the constraint relaxation factor ρ are presented as follows.
min C 1 s . t . E q u a t i o n s   22 ( 27 )   β l ρ β l m a x
min C 2 s . t . E q u a t i o n s   22 ( 26 ) a n d   28 ( 30 ) β l β l m a x
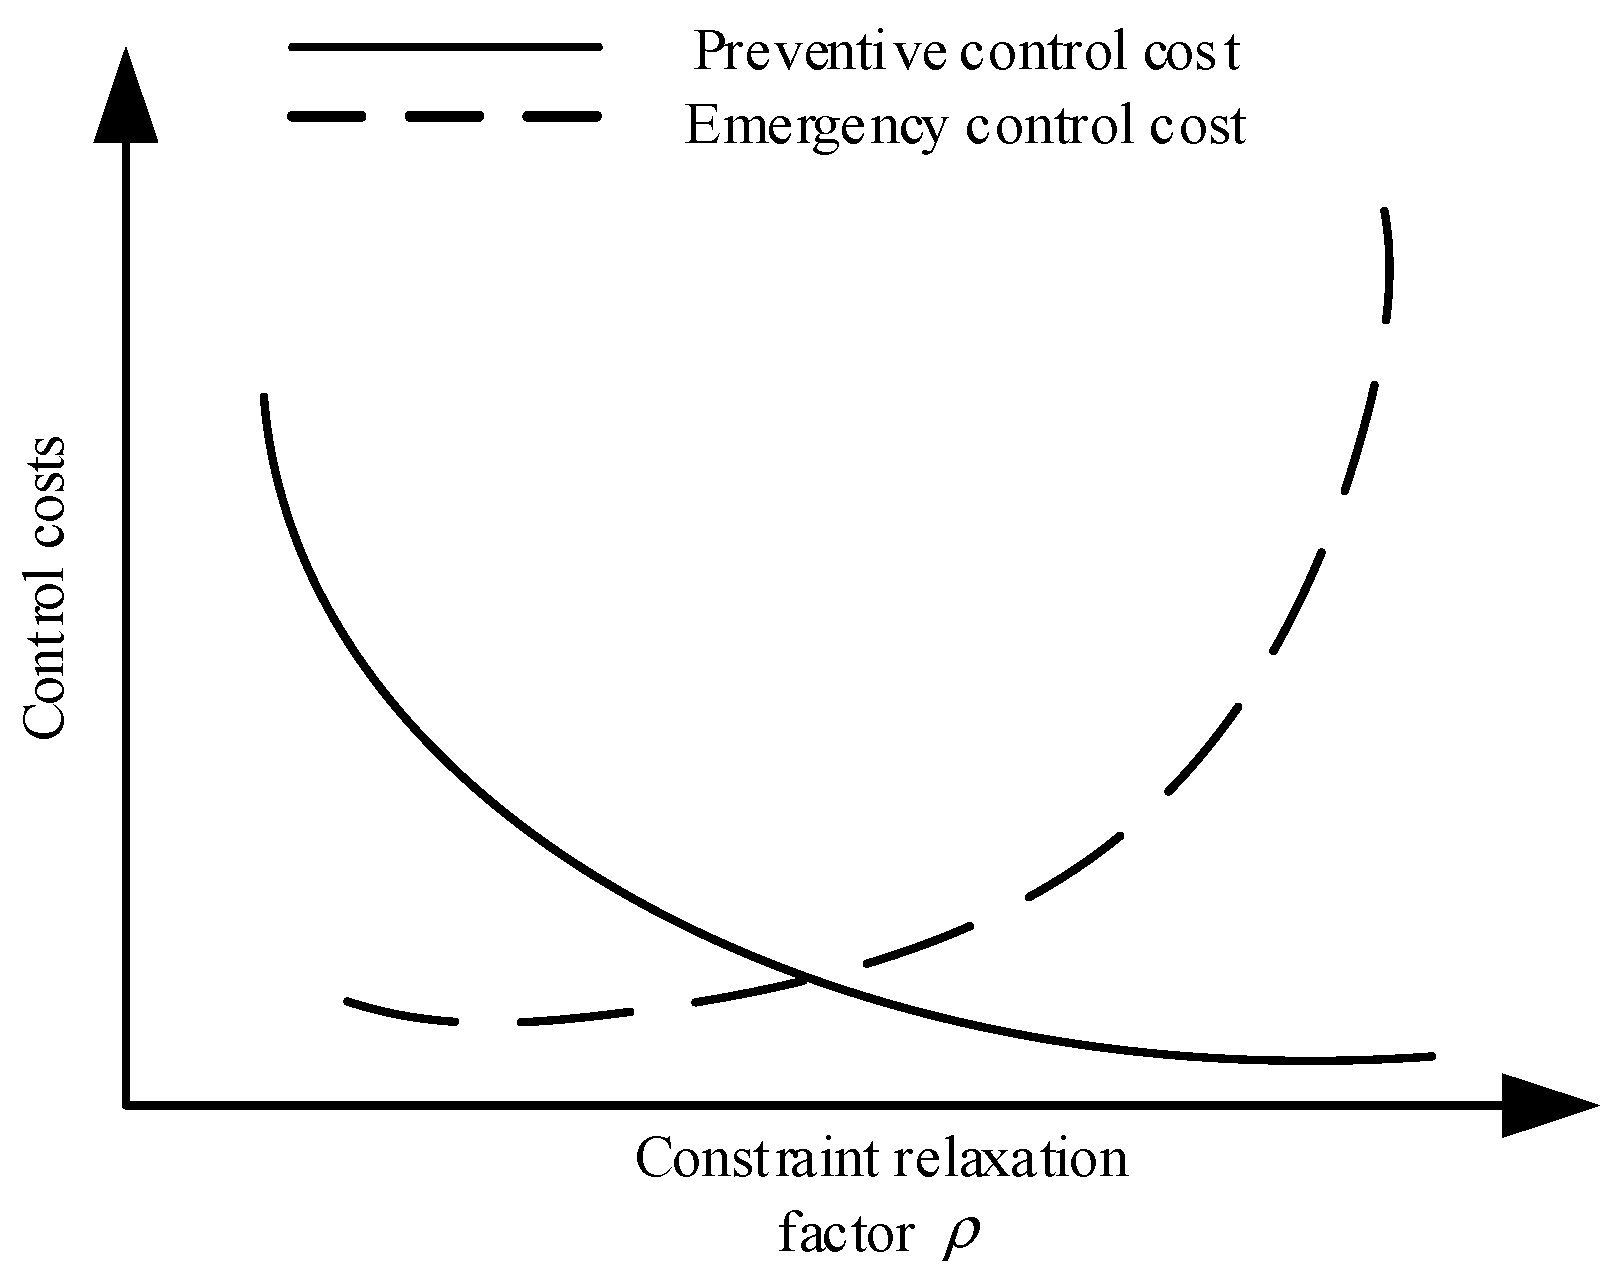
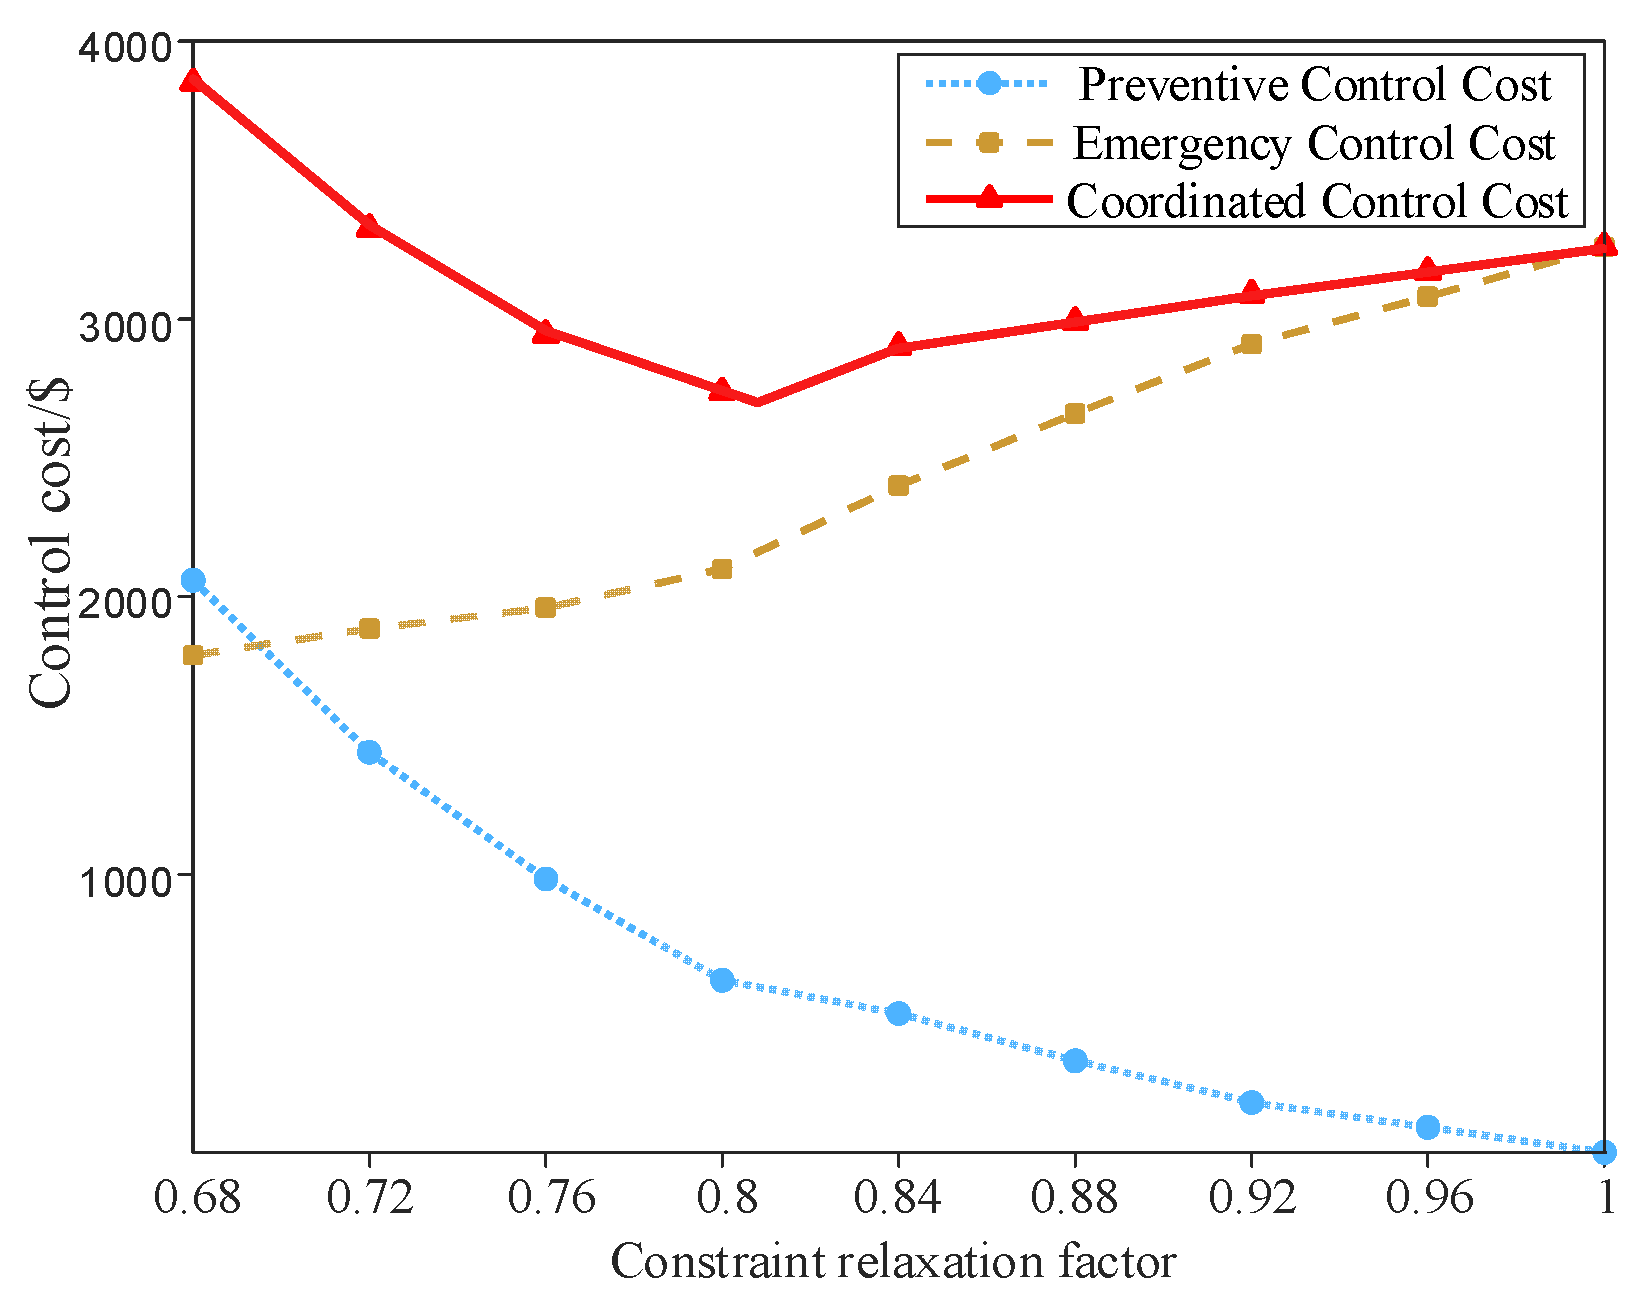
As the constraint relaxation factor ρ decreases, the security constraints for prevention control become increasingly stringent. This not only enhances the system’s security level but also drives up the cost of prevention control. Meanwhile, compared with scenarios featuring more relaxed security constraints, the cost of emergency control for overload elimination after faults occur in key transmission sections is relatively lower. Conversely, an increase in the constraint relaxation factor ρ leads to a reduction in prevention control cost, while the emergency control cost rises accordingly. Thus, the prevention control costs and emergency control costs corresponding to different values of the constraint relaxation factor ρ can be illustrated in Figure 4.
As can be inferred from Figure 4, there exists a specific constraint relaxation factor ρ that minimizes the total cost of the system’s prevention control and emergency control.

3.2.2. Solution Strategy Based on the Golden Section Method

In this section, the prevention control model under the constraint relaxation factor ρ is solved first, then, based on the prevention control results, the corresponding emergency control results are obtained based on the outcomes of the prevention control.
Compared to other interval update methods, the golden section method offers higher accuracy and greater universality. Therefore, the constraint relaxation factor ρ is updated using the golden section algorithm: two division points located at the 0.618 ratio positions within the interval are selected as candidate values of ρ , the total control cost under each candidate ρ is calculated, and the search interval is updated based on the results. This iterative selection process is repeated to find the optimal value of ρ . The specific steps are as follows:
  • Step 1: Set the iteration number to m = 1, the termination criterion to λ = 0.001, and the initial search interval for the constraint relaxation factor to [ a , b ] .
  • Step 2: Select the optimal division points as follows: ρ 1 = b 0.618   ( b a ) and ρ 2 = a + 0.618   ( b a ) .
  • Step 3: Solve the optimization model based on ρ .
    (a)
    Solve the prevention control model based on ρ , obtain the system state after prevention control, and calculate the prevention control cost C 1
    (b)
    Based on the system state after prevention control, solve the emergency control model for the system under anticipated faults, and calculate the emergency control cost C 2
    (c)
    Calculate the total cost of coordinated control as C = C 1 + C 2
  • Step 4: Update the factor interval [ a , b ] : if C ρ 1 C ρ 2 , set b = ρ 2 ; otherwise, set a = ρ 1 ;
  • Step 5: Termination check: if b a λ , terminate the iteration and output the optimal control cost; otherwise, continue the iteration.

4. Case Study

In this section, IEEE 39-bus system is used as the test system to demonstrate the effectiveness of the proposed method.

4.1. Analysis and Evaluation of Identification Results

4.1.1. Analysis and Evaluation of Critical Line Identification Methods

As generators play a crucial role in the power system, the power transmission channels of generators are considered the most critical among all lines and are therefore excluded from the identification process of critical lines.
Select the top 10 lines in the ranking of line comprehensive criticality as the critical lines; the normalized results are shown in Table 1:
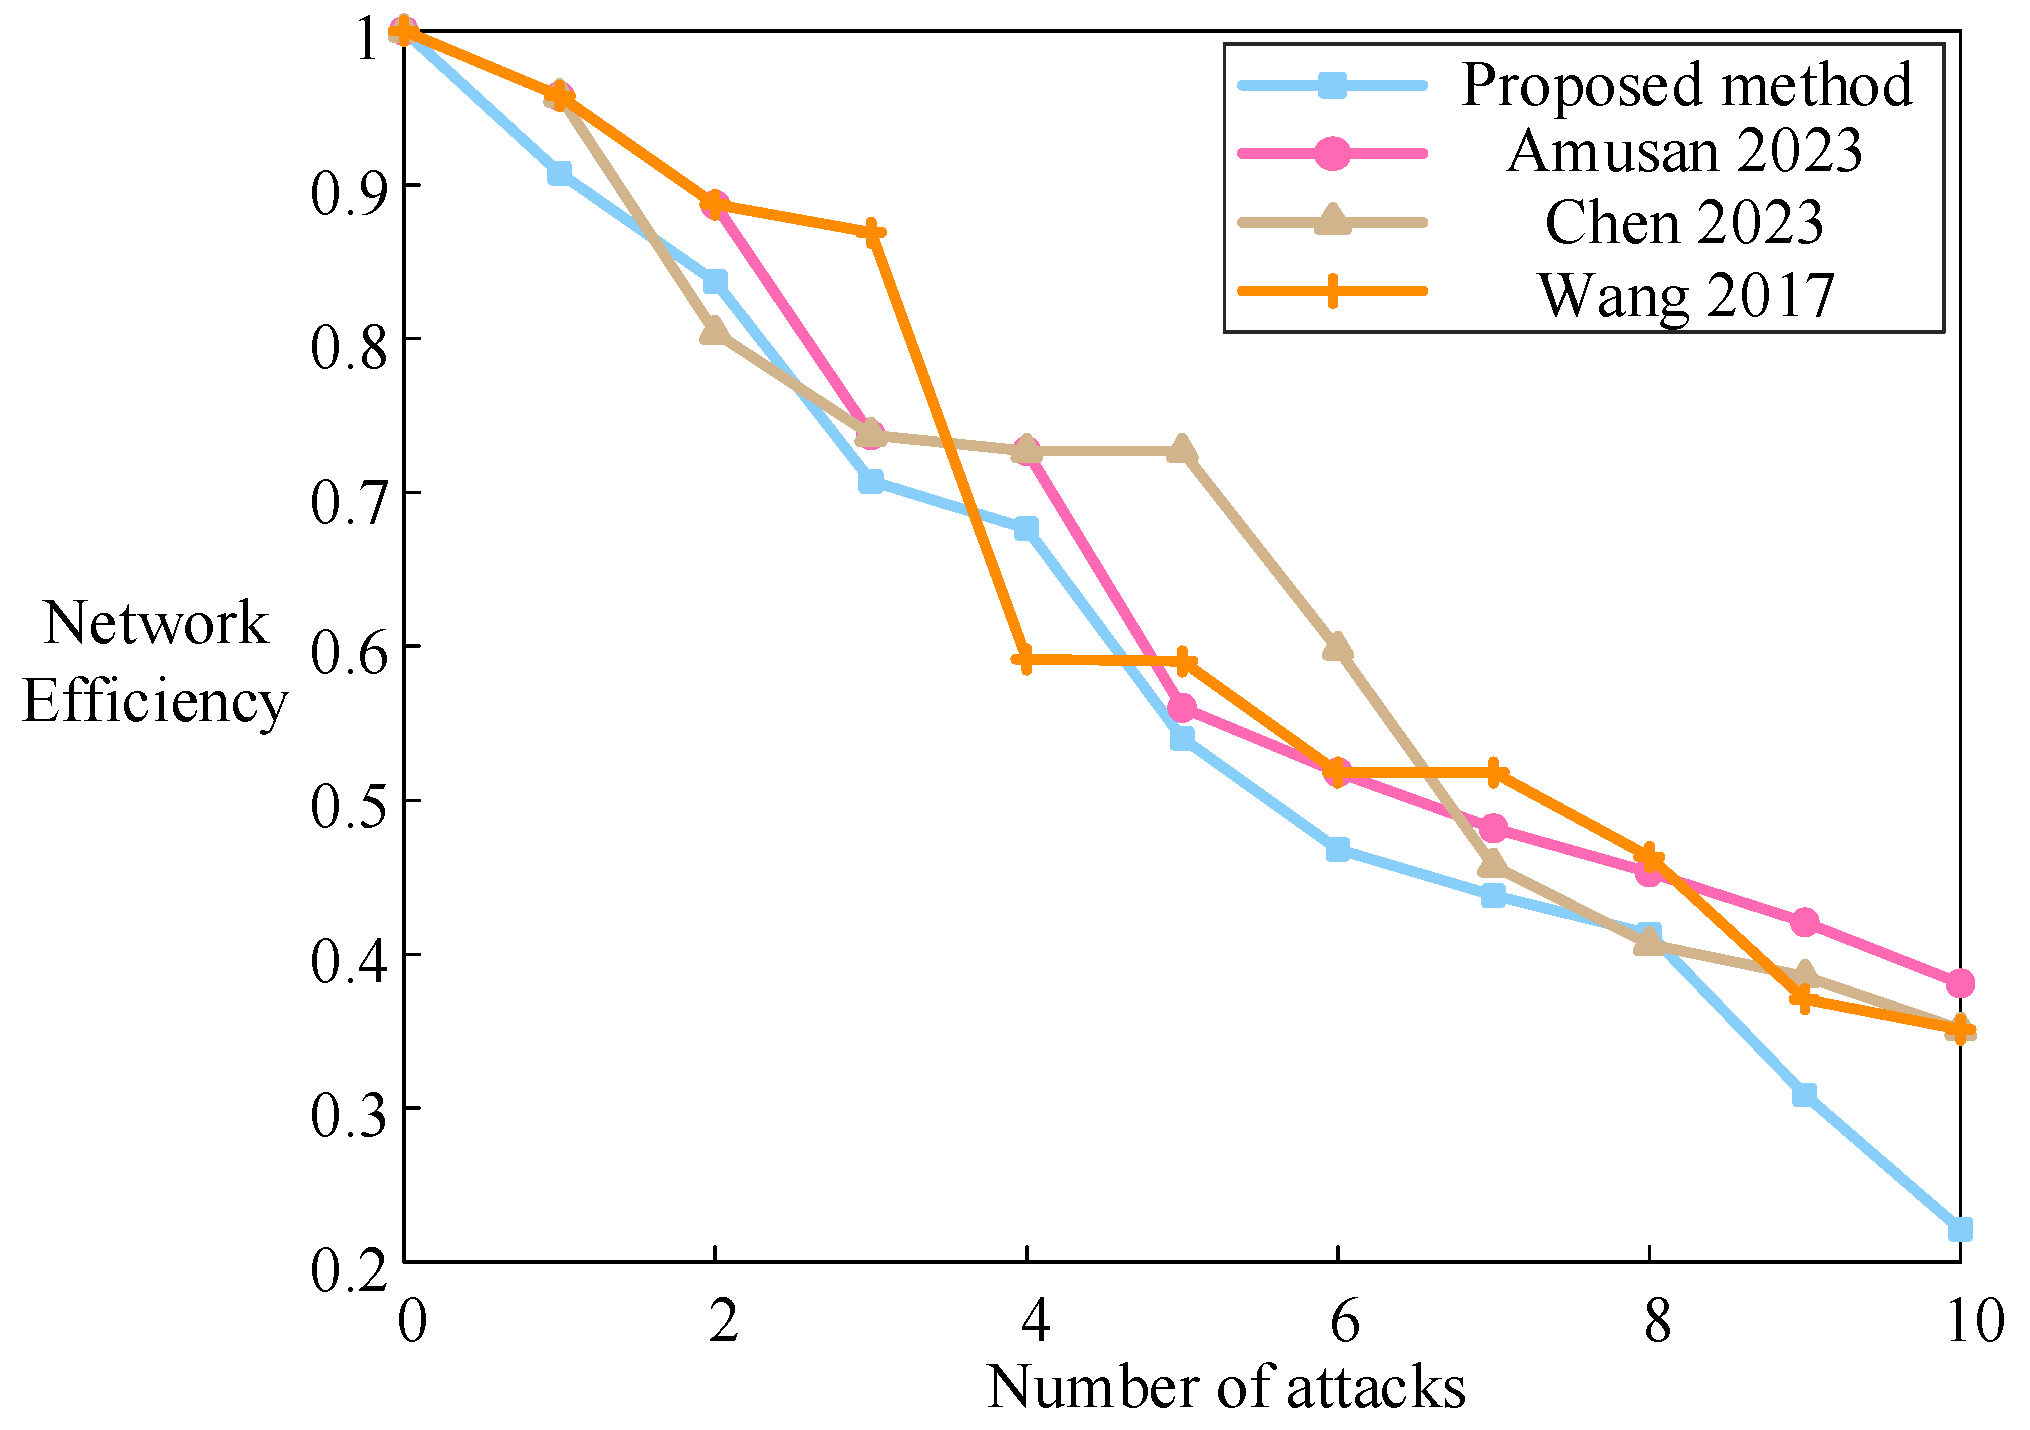
The network efficiency proposed in reference [15] was employed to quantify the significance of transmission lines by measuring the degradation in system power transmission efficiency following an attack. Reference [16] identifies critical lines based on line betweenness centrality. Reference [17] proposes an electrical betweenness measure that considers both line betweenness centrality and the importance of line power flow, providing a comprehensive evaluation of line criticality. Reference [18] establishes a line topology criticality index based on complex network theory. While the index established in these references are relatively singular, this paper comprehensively considers line characteristics including topology, power flow, and voltage, establishing a more comprehensive index for evaluating line criticality. A comparative analysis of network efficiency under deliberate attacks was conducted using critical lines identified by the method proposed in this paper and critical lines identified in references [16,17,18]; the results are shown in Figure 5.
It can be seen in Figure 5 during the process of deliberate attacks on critical lines using different evaluation methods, compared with the identification results of other methods, the method proposed in this paper causes more thorough damage to network efficiency after the attack is completed. Meanwhile, the methods proposed in references [16,17,18] all involve multiple lines that have little impact on network efficiency, which means the system is not sensitive to faults of the critical lines identified by these methods. Therefore, the identification results of these methods include lines with low criticality. This indicates that the comprehensive line criticality index proposed in this paper can identify critical lines in the system more effectively and has advantages compared with existing indexes.

4.1.2. Analysis of Key Transmission Section Identification Results

In the identification process of key transmission sections, to avoid issues such as section overlap and redundancy, the principle that lines with low criticality shall be subject to the identification results of sections composed of lines with high criticality is followed. Lines that are already part of key transmission sections will no longer be identified.
Taking l 2 3 as an example, set the maximum number of lines n to 5, 67 cut-sets can be obtained. After conducting power flow consistency check on cut-sets and further calculating the Theil index of the power flow impact rate under the initial transmission sections, the candidate key transmission sections can be obtained. Table 2 shows the candidate key sections of critical line l 2 3 based on the key transmission section identification principles proposed in Section 2.2.2.
Table 2 shows the three initial transmission sections with the largest T2 values. The initial transmission sections contain multiple lines that were subjected to high impacts after the fault of l 2 3 , while the lines outside the sections have received relatively low impacts. Therefore, the imbalance of impacts on the lines inside and outside the sections is relatively large.
Further analysis of index ε reveals that initial transmission Section 3 has a relatively high index ε . Which means the impact difference among lines within the section is also quite significant—specifically, some lines in the section are subject to an impact significantly lower than that of other lines. Therefore, the initial transmission Section 3 cannot represent the key transmission section most affected by the fault of the l 2 3 .
The T1 value of the initial transmission Section 1 is smaller than that of Section 2, which indicates that the impact distribution within Section 1 after the critical line fault is relatively concentrated. Therefore, initial transmission Section 1 is more capable of representing the key transmission section most affected by the fault of the critical line l 2 3 .
Total Transfer Capacity (TTC) refers to the maximum power that a transmission section can transfer under the static, N-1 security, and transient stability constraint. It is a multidimensional index that comprehensively reflects the security boundaries, stability margins, and resource dispatch capabilities of a power system. In reference [19], the repetitive power flow method is employed to calculate the TTC value by gradually increasing the power output of generators at the sending end and the load at the receiving end, while verifying compliance with the aforementioned security constraints. A higher TTC value corresponds to a more critical role of the transmission section in the system’s power transfer process. Following the approach proposed in reference [20], this paper calculates the TTC for the transmission section containing critical line l 2 3 , as identified by the method proposed in this study, as well as for the key section identified in reference [14]. The results are summarized in Table 3.
As shown in Table 3, during the identification process focusing on line l 2 3 , the method proposed in reference [14] identified three key sections containing l 2 3 . Due to the considerable physical distance and consequently weak electrical correlation between lines l 2 3 and l 6 11 , the identified results exhibit weak internal electrical correlation. Therefore, the method proposed in reference [14] leads to redundant identification results. In contrast, the proposed identification method systematically filters out sections with weak electrical correlations as the process evolves, thereby preventing the above-mentioned issue from occurring. Additionally, the section identified by the method proposed in this study exhibits a higher average TTC value compared to sections identified in reference [14]. This indicates that the key section identified in this paper plays a more significant role in system power transfer and is therefore considered more critical.
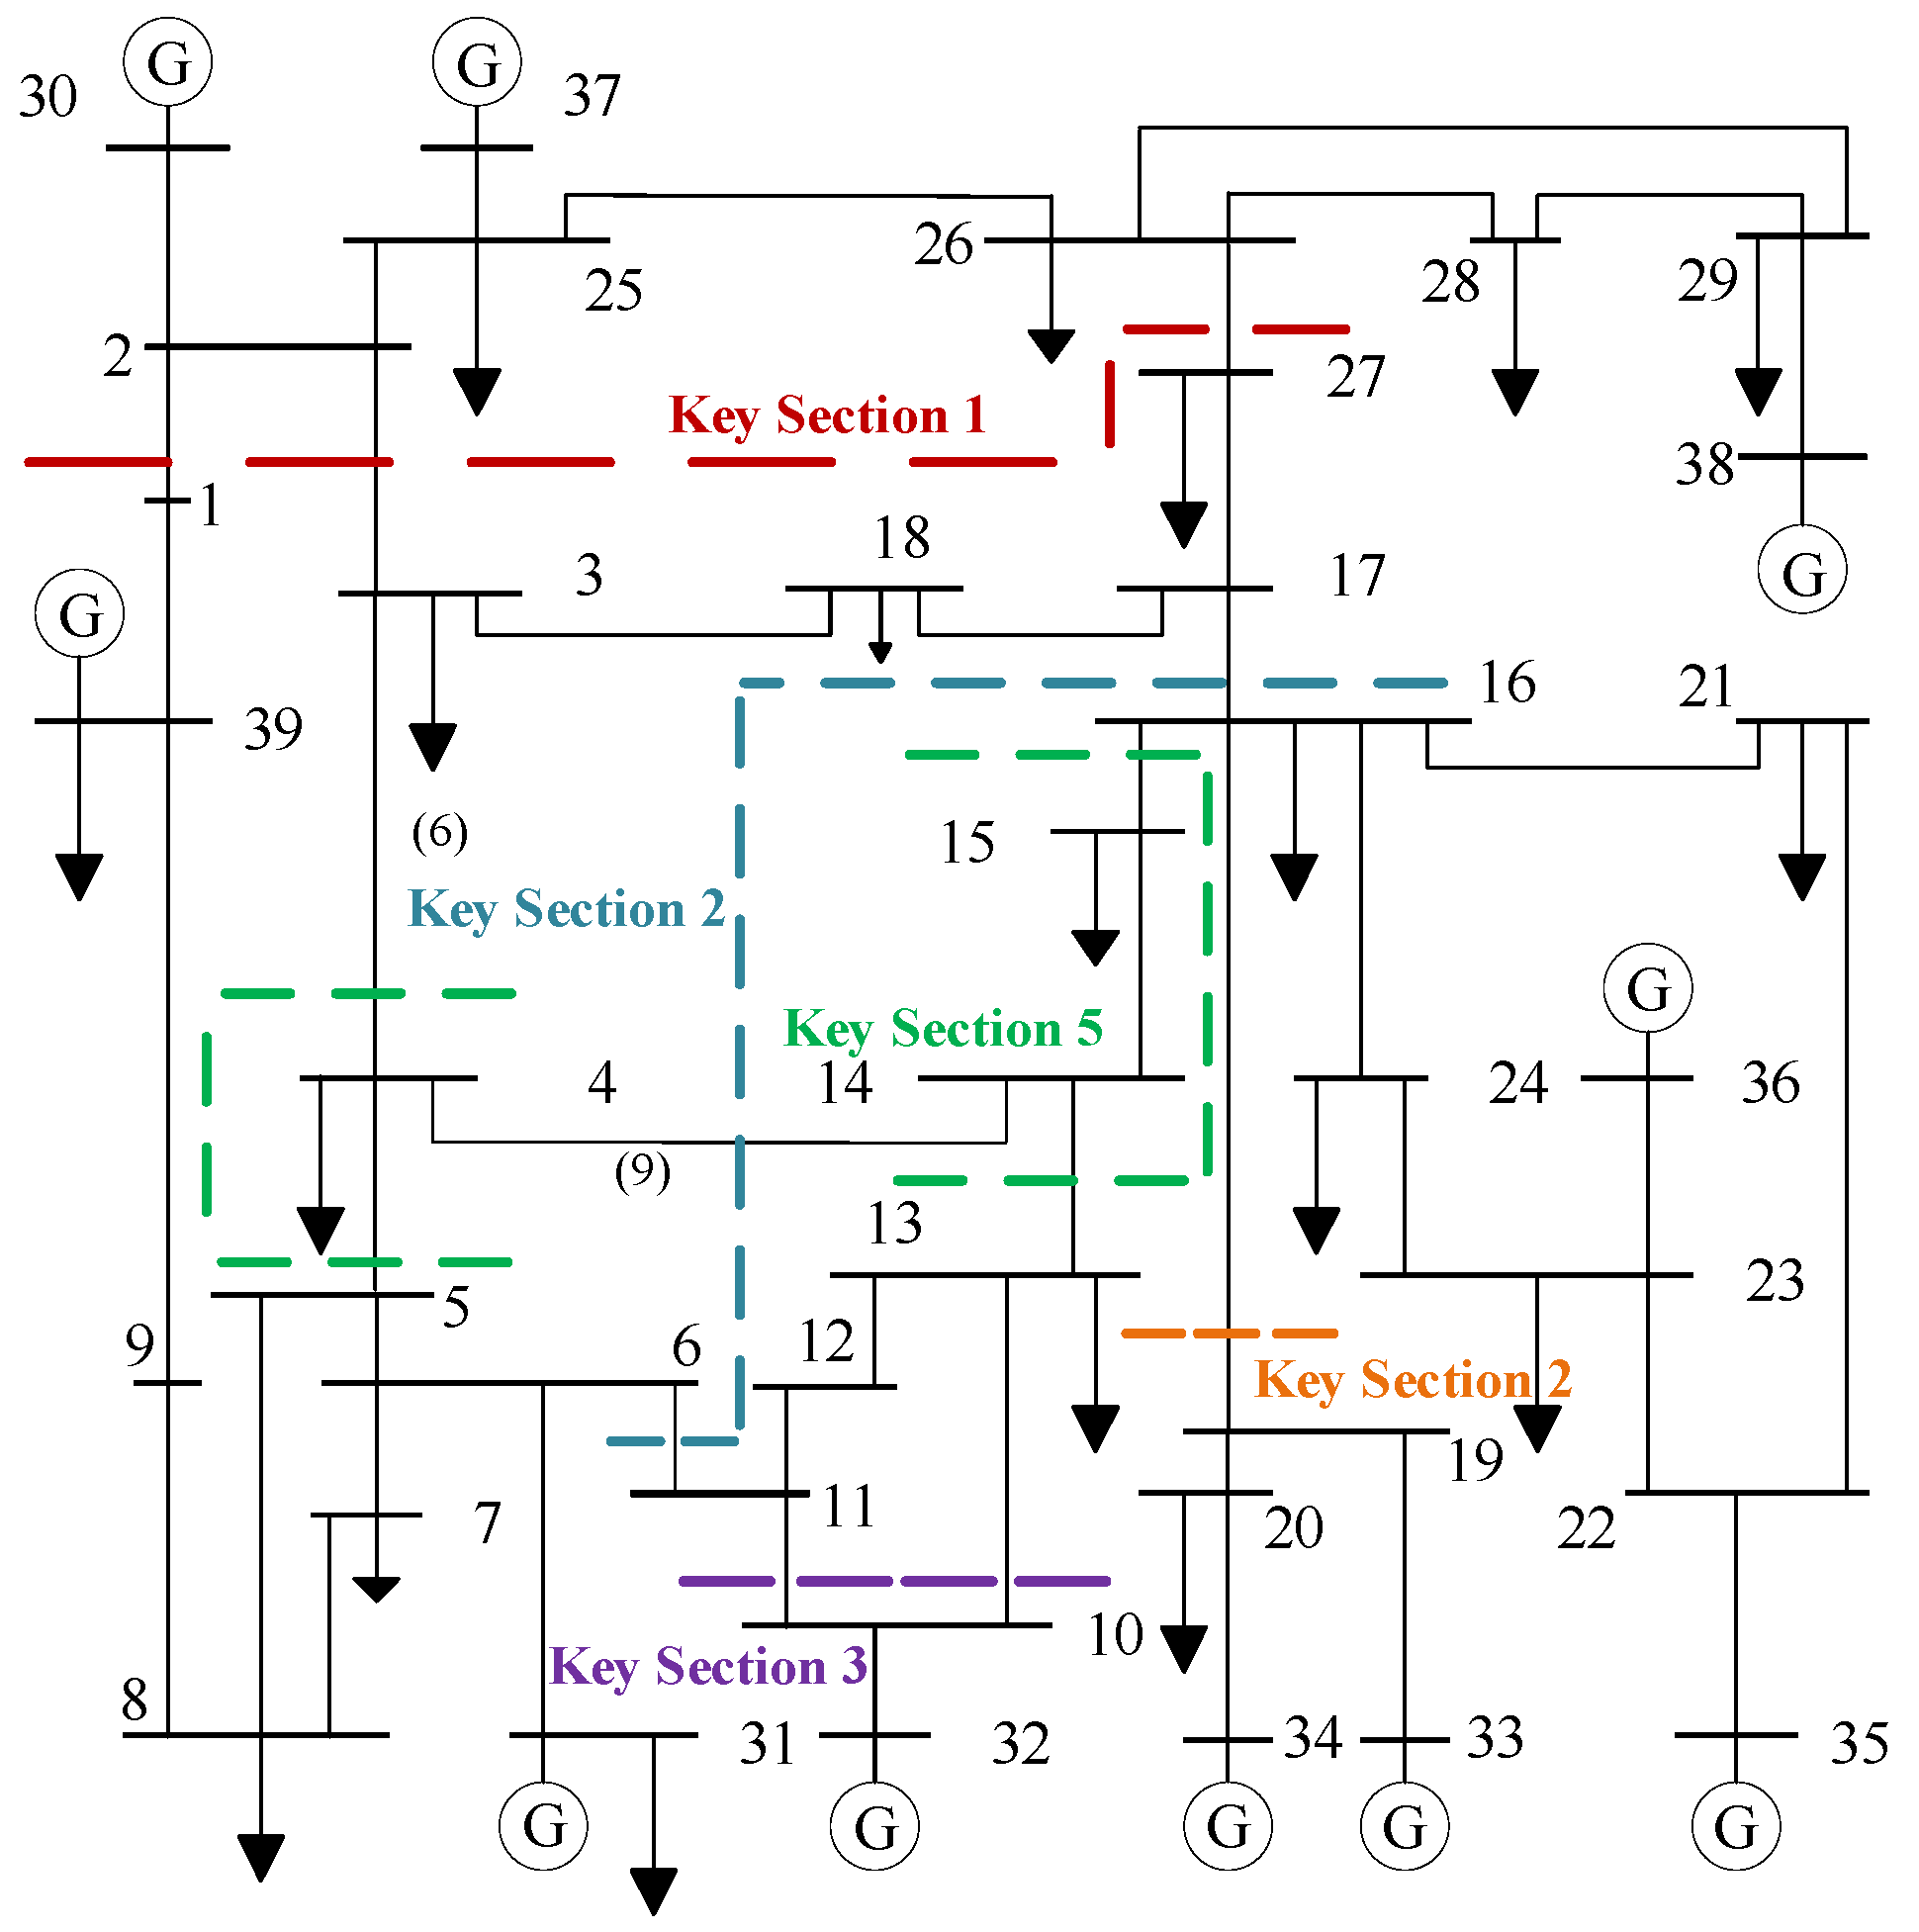
Based on the above-mentioned method, the identification results of the system’s key transmission sections are shown in Figure 6.
Key transmission Section 1 ( l 1 2 , l 2 3 , l 26 27 ): l 1 2 , l 2 3 , l 26 27 serve as the power transmission channels for the upper region of the system, responsible for transmitting power from generators 30, 37, and 38. The transmission power of this section reaches 751 MW; while the lines are undertaking a large power flow, the power transfer factor between the lines is also relatively high. Therefore, when a line fault occurs, the resulting transferred power flow is likely to cause overloading issues in other lines within the section, and may even trigger cascading faults among the lines inside the section, leading to system splitting. Meanwhile, since the power transmission from generators in the lower region of the system is close to the limit, it is impossible to achieve power balance by increasing generator output in the lower region of the system, resulting in a power shortage of approximately 500 MW.
Key transmission Section 2 ( l 6 11 , l 4 14 , l 16 17 ): l 16 17 is the most critical line in the system, serving as a key channel connecting the generator group in the lower region of the system (generators 33, 34, 35, 36) to the loads in the upper region (load 3, 18, 25, 26, 27, 28, 29). Meanwhile, lines l 6 11 , l 4 14 , l 16 17 act as power transmission channels for the lower region of the system, responsible for transmitting power from Generators 32, 33, 34, 35, and 36, with the section’s transmission power reaching 812 MW. After l 6 11 fails, the load rate of l 4 14 will reach 105.6%, resulting in line overloading, triggering cascading faults within the section, and ultimately leading to system splitting.
Key transmission Section 3 ( l 10 11 , l 10 13 ): l 10 11 and l 10 13 serve as the power transmission channels for generator 32. If either line fails, the other line will have to bear all the power from the generator. Therefore, this section is relatively vulnerable.
Key transmission Section 4 ( l 16 19 ): l 16 19 serves as the power transmission channel for Generators 33 and 34. After it fails, the system will split, and Generators 33 and 34 will form an isolated island. This will result in the system losing 480 MW of power supply, leading to a large-scale power outage in the system. Therefore, l 16 19 alone constitutes a key transmission section of the system.
Key transmission Section 5 ( l 3 4 , l 4 5 , l 13 14 , l 13 15 ): Key transmission Section 5 is responsible for transmitting power to load nodes 4 and 15. Due to the strong correlation between the lines in the section, the section is at risk of cascading faults. Such faults will cause nodes 4, 14, and 15 to be disconnected from the system, resulting in the system losing the central interconnection channel and an 820 MW load.

4.2. Analysis of Prevention–Emergency Coordinated Control Results

This section applies prevention–emergency coordinated control to the model based on the pre-defined anticipated fault set shown in Table 4; the parameters during the simulation process are shown in Table 5 [20,21,22].
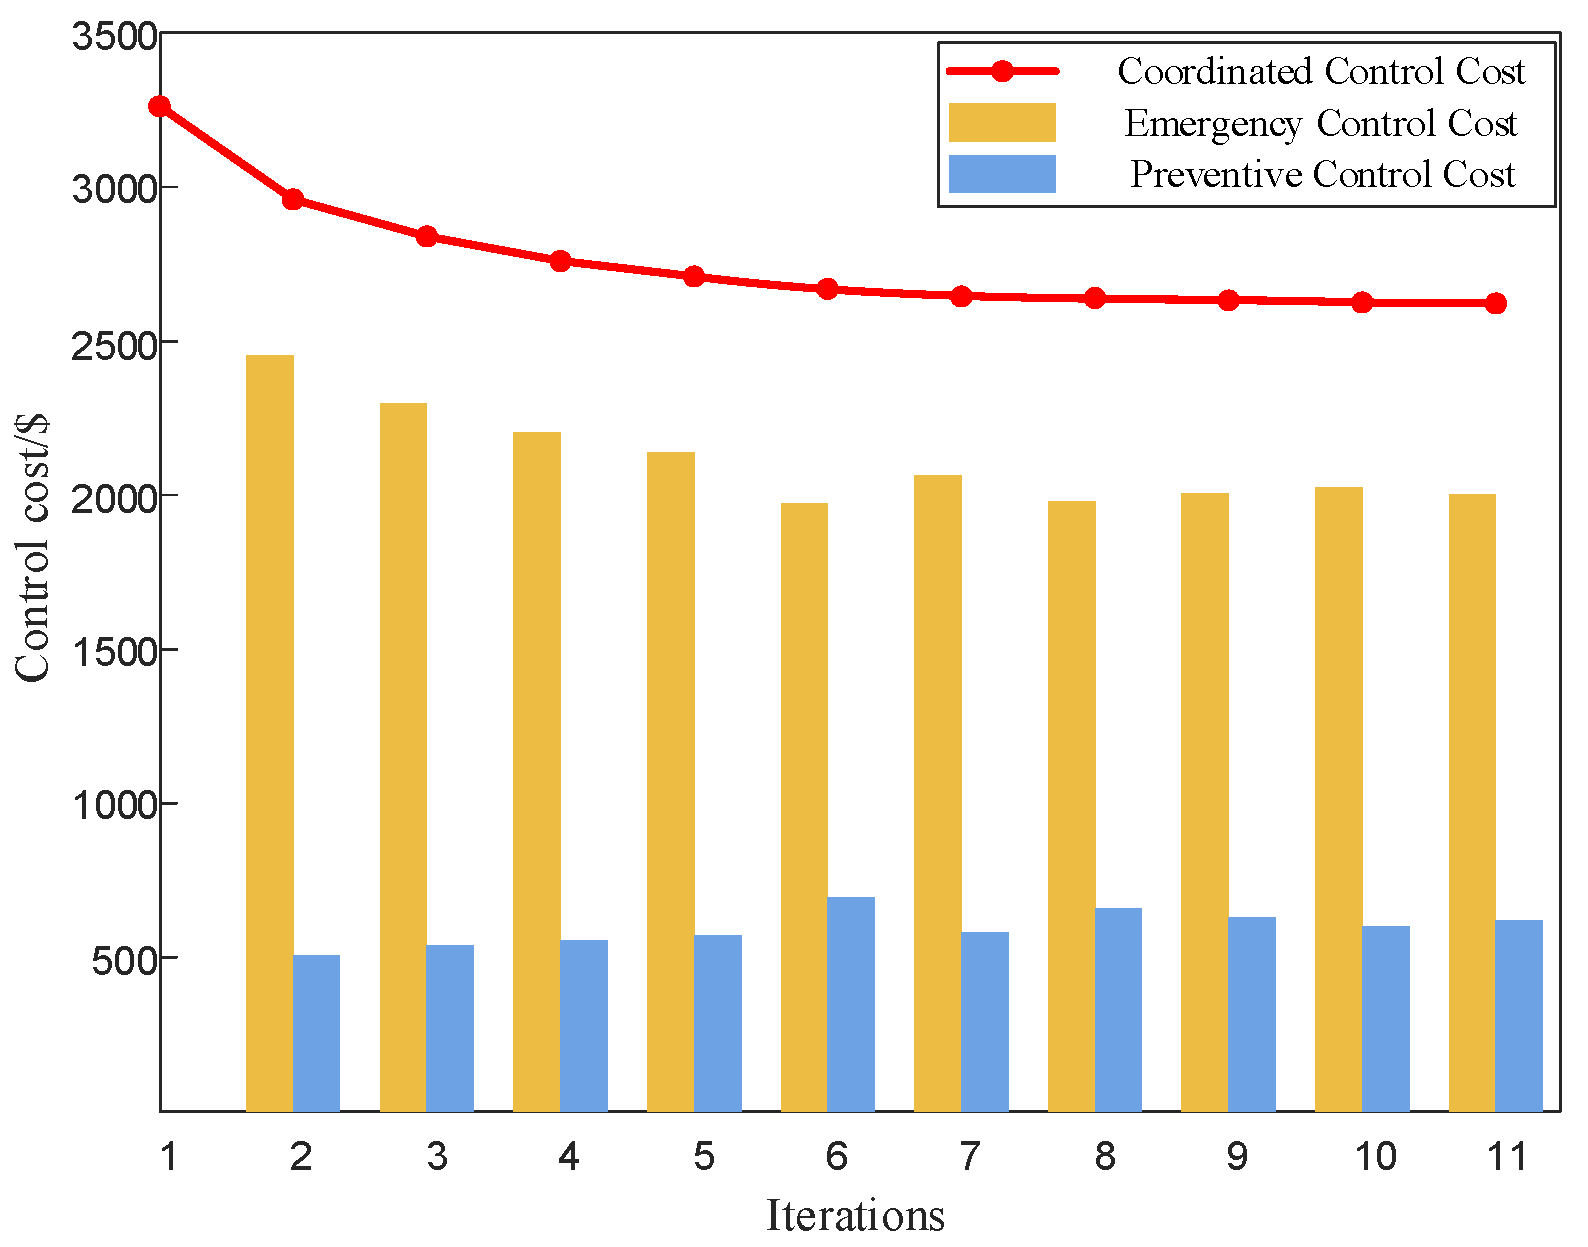
The initial interval of the relaxation factor is set to [0.618, 1]. When ρ = 0.618, there is no solution for prevention control due to overly strict constraints; when ρ = 1, the prevention–emergency coordinated control degrades to emergency control, with the prevention control cost being $0 and the emergency control cost being $3276.8. During the first iteration process, the golden ratio points are ρ = 0.7639 and ρ = 0.8542, when ρ = 0.7639, the prevention control cost is $988.6 and the emergency control cost is $1956.3; when ρ = 0.8542, the prevention control cost is $486.2 and the emergency control cost is $2453.2. Since the total control cost at ρ = 0.7639 is higher than that at= 0.8541, the relaxation factor interval is updated to [0.7639, 1]. The above iteration is repeated until the 11th iteration, where the relaxation factor interval updates to [0.8115, 0.8122], and the iteration terminates. The optimal solution is achieved at ρ = 0.8119, with a corresponding coordinated control cost of $2762.
Based on the iterative solving process described above. Figure 7 depicts the variation in the coordinated control cost with the constraint relaxation factor. It can be concluded from Figure 7 that as the relaxation factor ρ decreases, the constraints on prevention control become stricter, leading to a gradual increase in the prevention control cost. When the relaxation factor decreases further, the constraints on prevention control will become excessively strict, resulting in no feasible solution for the prevention control, further leading to the model being unsolvable. Meanwhile, stricter prevention control enables a reasonable power flow distribution and improves the system’s safety after a fault, thus leading to a gradual decrease in the emergency control cost. Therefore, with the change in the relaxation factor, the system’s total coordinated control cost shows a trend of first decreasing and then increasing. The above results prove that the method proposed in this paper can effectively reduce the emergency control cost of the system after a fault in key transmission sections by implementing reasonable prevention control on the system. Additionally, it can find a reasonable solution that minimizes the system’s prevention–emergency coordinated control cost and improve the system’s safety.
The variation in the prevention–emergency coordinated control cost with the number of iterations is shown in Figure 8. The total system control cost decreases gradually with each iteration until it converges to the optimal solution. As observed in Figure 8, the cost reduction becomes negligible after the 11th iteration, indicating the solution has stabilized. Thus, the convergence threshold set in this paper for the interval update is justified to achieve a balance between accuracy and computational efficiency.

5. Conclusions

This paper considers the topological, power flow, and voltage characteristics of transmission lines, proposes identification index for critical lines. Based on the Theil index, analysis of imbalance degree of the power flow impact after the fault on critical line is conducted, a multi-criteria-based method to identify key transmission section from initial transmission section is proposed. Furthermore, a prevention–emergency coordinated optimal control strategy for the key transmission section under expected faults is proposed, which improves the safety of the system. Simulation results demonstrate the following:
(1)
The critical line characteristics established in this paper by considering the topological, power flow, and voltage characteristics of transmission lines can identify the critical lines in the system more accurately.
(2)
By using the Theil index of power flow impact rate to analyze the impact on the initial transmission sections after critical line faults, the multi-strategy identification method for key transmission sections proposed in this paper can accurately identify the key transmission sections with strong internal electrical correlation from the initial transmission sections.
(3)
The coordinated optimal control strategy proposed in this paper for key transmission sections can effectively achieve the optimal coordinated control of prevention control and emergency control, reduce the total coordinated control cost of the system, and significantly improve the system’s safety.

Author Contributions

Conceptualization, X.P. and C.H.; methodology, X.P.; software, X.P. and H.Z.; validation, L.N., T.L., J.G., B.W., X.Y. and X.S.; formal analysis, X.P.; investigation, X.P.; resources, C.H. and H.Z.; writing—original draft preparation, X.P.; writing—review and editing, C.H., H.Z., L.N., T.L. and J.G.; visualization, X.S.; supervision, X.P. All authors have read and agreed to the published version of the manuscript.

Funding

This work is supported by State Grid Sichuan Power Company Science and Technology Project, No.521997230027 (Intelligent Identification of Control Section and Automatic Analysis and Application of Transmission Capacity in Sichuan Power Grid Considering Multiple Safety Constraints).

Data Availability Statement

The data that support the findings of this study are available on request from the corresponding author.

Conflicts of Interest

Authors Jian Gao, Biao Wang, Xi Ye were employed by the company State Grid Sichuan Electric Power Co., Ltd. The remaining authors declare that the research was conducted in the absence of any commercial or financial relationships that could be construed as a potential conflict of interest. The authors declare that this study received funding from State Grid Sichuan Power Company Science and Technology Project. The funder was not involved in the study design, collection, analysis, interpretation of data, the writing of this article or the decision to submit it for publication.

References

  1. Kumar, S.; Pandey, A.; Goswami, P.; Pentayya, P.; Kazi, F. Analysis of Mumbai Grid Failure Restoration on Oct 12, 2020: Challenges and Lessons Learnt. IEEE Trans. Power Syst. 2022, 37, 4555–4567. [Google Scholar] [CrossRef]
  2. Chen, C.; Hu, Y.; Meng, X.; Yu, J. Cascading Failures in Power Grids: A Load Capacity Model with Node Centrality. Complex Syst. Model. Simul. 2024, 4, 1–14. [Google Scholar] [CrossRef]
  3. Haes Alhelou, H.; Hamedani-Golshan, M.E.; Njenda, T.C.; Siano, P. A Survey on Power System Blackout and Cascading Events: Research Motivations and Challenges. Energies 2019, 12, 682. [Google Scholar] [CrossRef]
  4. Lin, W.; Yang, Z.; Yu, J.; Jin, L.; Li, W. Tie-Line Power Transmission Region in a Hybrid Grid: Fast Characterization and Expansion Strategy. IEEE Trans. Power Syst. 2020, 35, 2222–2231. [Google Scholar] [CrossRef]
  5. Wang, K.; Zhang, B.; Zhang, Z. An electrical betweenness approach for vulnerability assessment of power grids considering the capacity of generators and load. Phys. A Stat. Mech. Its Appl. 2011, 390, 4692–4701. [Google Scholar] [CrossRef]
  6. Luo, G.; Shi, D.; Chen, J. Automatic identification of transmission sections based on complex network theory. IET Gener. Transm. Distrib. 2014, 8, 1203–1210. [Google Scholar] [CrossRef]
  7. Fan, B.; Shu, N.; Li, Z.; Li, F. Critical Nodes Identification for Power Grid Based on Electrical Topology and Power Flow Distribution. IEEE Syst. J. 2023, 17, 4874–4884. [Google Scholar] [CrossRef]
  8. Sun, J.; Liu, J.; Li, C.; Zhi, N. An identification method for vulnerable lines based on combination weighting method and GraphSAGE algorithm. Int. J. Electr. Power Energy Syst. 2023, 149, 109035. [Google Scholar] [CrossRef]
  9. Chen, B.; Chen, X.; Chen, H. Efficient algorithm for finding k shortest paths based on re-optimization technique. Transp. Res. Part. E Logist. Transp. Rev. 2019, 133, 101819. [Google Scholar] [CrossRef]
  10. Guo, J.; Fu, Y.; Li, Z.; Shahidehpour, M. Direct calculation of line outage distribution factors. IEEE Trans. Power Syst. 2009, 24, 1633–1634. [Google Scholar] [CrossRef]
  11. Hu, J.; Wang, J.; Xiong, X.; Chen, J. A Post-Contingency Power Flow Control Strategy for AC/DC Hybrid Power Grid Considering the Dynamic Electrothermal Effects of Transmission Lines. IEEE Access 2019, 7, 65288–65302. [Google Scholar] [CrossRef]
  12. Wang, C.; Feng, C.; Zeng, Y.; Zhang, F. Improved Correction Strategy for Power Flow Control Based on Multi-Machine Sensitivity Analysis. IEEE Access 2020, 8, 82391–82403. [Google Scholar] [CrossRef]
  13. Mazzi, N.; Zhang, B.; Kirschen, D.S. An Online Optimization Algorithm for Alleviating Contingencies in Transmission Networks. IEEE Trans. Power Syst. 2018, 33, 5572–5582. [Google Scholar] [CrossRef]
  14. Zhao, X.; Ling, X.; Yan, M.; Dong, Y.; He, M.; Zhao, Y. Identification of Critical Transmission Sections Considering N-K Contingencies Under Extreme Events. Energies 2025, 18, 4342. [Google Scholar] [CrossRef]
  15. Gou, B.; Zhang, H. Fast real-time corrective control strategy for overload relief in bulk power systems. IET Gener. Transm. Distrib. 2013, 7, 1508–1515. [Google Scholar] [CrossRef]
  16. Amusan, O.; Shi, S.; Wu, D.; Liao, H. Structural Vulnerability Analysis of Interdependent Electric Power and Natural Gas Systems. Energies 2023, 16, 6918. [Google Scholar] [CrossRef]
  17. Chen, Y.; Nan, L.; He, C.; Wang, Y. Transmission Interconnections Identification for Electricity System Considering Impacts of Natural Gas Systems. IEEE Trans. Smart Grid 2023, 14, 1920–1932. [Google Scholar] [CrossRef]
  18. Wang, Z.; He, J.; Nechifor, A.; Zhang, D.; Crossley, P. Identification of Critical Transmission Lines in Complex Power Networks. Energies 2017, 10, 1294. [Google Scholar] [CrossRef]
  19. Qiu, G.; Liu, Y.; Liu, J.; Zhao, J.; Wang, L.; Liu, T.; Gao, H. Analytic Deep Learning-based Surrogate Model for Operational Planning With Dynamic TTC Constraints. IEEE Trans. Power Syst. 2021, 36, 3507–3519. [Google Scholar] [CrossRef]
  20. Yuan, H.; Xu, Y. Preventive-Corrective Coordinated Transient Stability Dispatch of Power Systems with Uncertain Wind Power. IEEE Trans. Power Syst. 2020, 35, 3616–3626. [Google Scholar] [CrossRef]
  21. Yang, L.; Li, C. Identification of Vulnerable Lines in Smart Grid Systems Based on Improved Agglomerative Hierarchical Clustering. IEEE Access 2023, 11, 13554–13563. [Google Scholar] [CrossRef]
  22. Zhou, B.; Cai, Y.; Zang, T.; Wu, J.; Li, X.; Dong, S. Reliability Optimization Method for Gas–Electric Integrated Energy Systems Considering Cyber–Physical Interactions. Energies 2023, 16, 5187. [Google Scholar] [CrossRef]
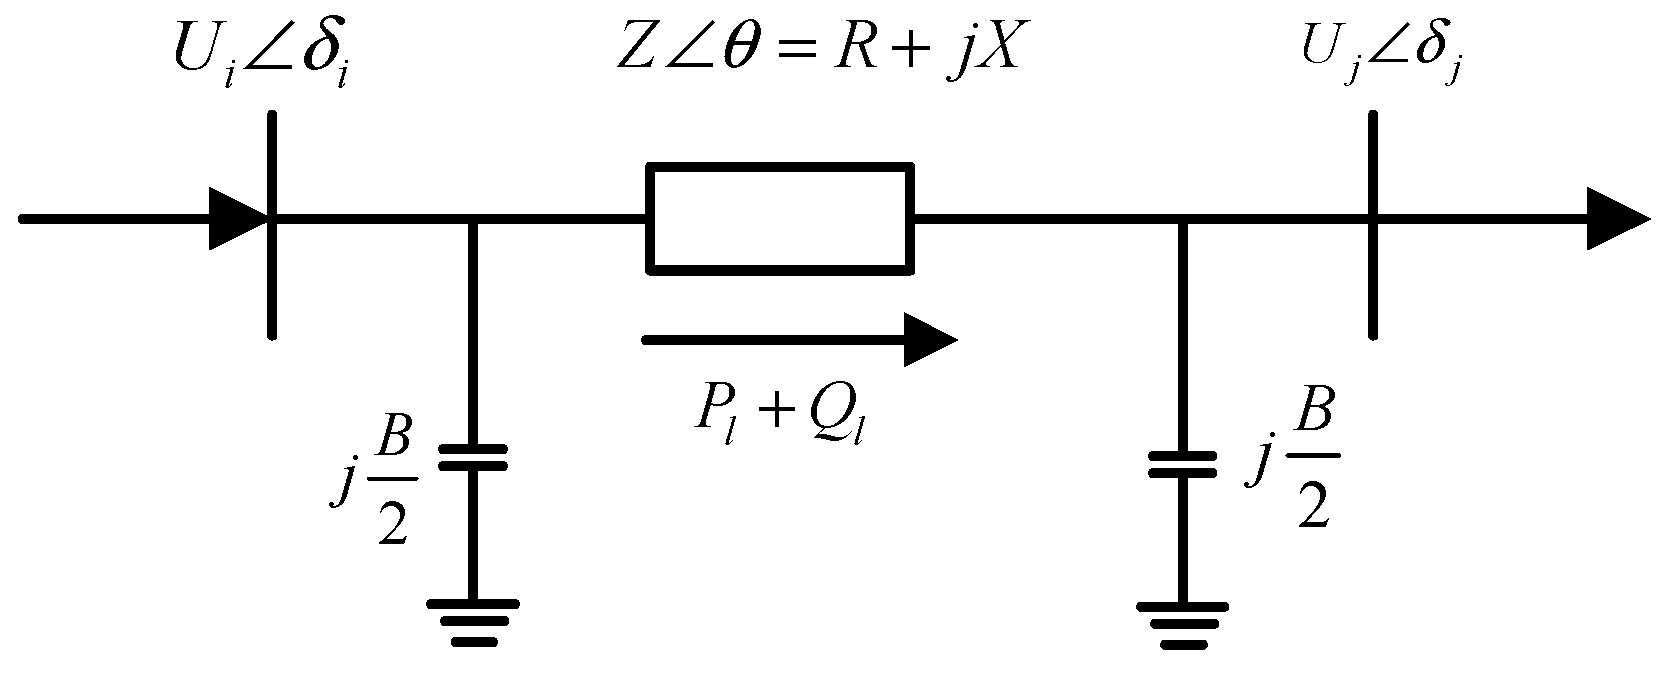
Figure 1. Equivalent line of type π .
Energies 18 05871 g001
Figure 2. Schematic diagram of power transmission section.
Energies 18 05871 g002
Figure 3. Key transmission section identification process.
Energies 18 05871 g003
Figure 4. Relationship between control cost and constraint relaxation factor.
Energies 18 05871 g004
Figure 5. Network efficiency under critical line identified in the proposed method and References [16,17,18].
Energies 18 05871 g005
Figure 6. Results of key transmission section identification.
Energies 18 05871 g006
Figure 7. Relationship between constraint factors and control costs.
Energies 18 05871 g007
Figure 8. Iterative solution results.
Energies 18 05871 g008
Table 1. Comprehensive criticality of each line.
Line F T F P F V F C
1 l 16 17 10.79480.73012.5249
2 l 2 3 0.96190.40090.79032.1531
3 l 13 14 0.44090.76920.80372.0138
4 l 10 13 0.32420.86960.77271.9665
5 l 10 11 0.141810.75371.8955
6 l 16 19 0.67890.50890.70081.8886
7 l 15 16 0.54790.52680.74281.8175
8 l 4 14 0.58360.40200.81081.7964
9 l 6 11 0.21880.97210.54931.7402
10 l 4 5 0.45960.49340.68291.7259
Table 2. Calculation results of Theil index for initial transmission sections.
Initial Transmission Sections T 1 T 2 ε
l 1 2 , l 2 3 , l 26 27 1.13610.13590.4250
l 2 3 , l 4 5 ,   l 13 14 , l 16 17 1.16760.10440.4575
l 2 3 , l 4 5 , l 4 14 , l 16 17 , l 26 27 1.18090.09110.5615
Table 3. TTC of each key section.
Key SectionsTTC
Proposed Method l 1 2 ,   l 2 3 ,   l 26 27 1224 MW
Reference [14] l 1 2 ,   l 2 3 ,   l 25 26
l 1 2 ,   l 2 3 ,   l 3 18 ,   l 6 11 ,   l 11 12 ,   l 25 26
l 1 2 ,   l 2 3 ,   l 6 11 ,   l 11 12 ,   l 25 26
1068 MW
2035 MW
1724 MW
Table 4. Anticipated fault probability.
Anticipated FaultFault TypeProbability
l 1 2 ,   l 25 26 N 2 2 × 10⁻²
l 2 3 ,   l 16 17 N 2 1.1 × 10⁻²
l 4 14 ,   l 26 27 N 2 9.6 × 10⁻³
l 6 11 ,   l 14 15 N 2 4.4 × 10⁻³
l 1 2 ,   l 4 14 ,   l 6 11 N 3 8.6 × 10⁻⁵
Table 5. Parameters associated with coordinated optimization.
Parameters Symbol Value
Cost of increase power c 1 5 $/MW
Cost of decrease power c 2 5 $/MW
Cost of load cut c 3 1000 $/MW
Cost of generator cut c 4 100 $/MW
Maximum load rate β m a x 1
Ramp rate R G 0.1   ×   P G
Disclaimer/Publisher’s Note: The statements, opinions and data contained in all publications are solely those of the individual author(s) and contributor(s) and not of MDPI and/or the editor(s). MDPI and/or the editor(s) disclaim responsibility for any injury to people or property resulting from any ideas, methods, instructions or products referred to in the content.