Abstract
A new approach for optimizing the blade profile of a horizontal axis wind turbine is proposed in this paper, based on the combination of the Blade Element Momentum (BEM) method and Proper Generalized Decomposition (PGD). The resulting algorithm was implemented in MATLAB (R2010A). To investigate the applicability of the proposed BEM-PGD method, simulations were conducted using the NREL phase VI turbine. By focusing on the tangential force coefficient as a parametrized solution, the study demonstrated a 21.7% improvement in the power coefficient relative to the baseline blade corresponding to a 20 kW turbine, while the tip speed ratio (TSR) ranged from 1 to 12, as assessed through a quantitative metric comparing the optimized and reference curves. These advancements are attributed to the algorithm’s capability to parameterize the solution and to select the appropriate airfoil type, thickness, chord, and twist, allowing for an optimized and realistic blade design.
1. Introduction
The shift to sustainable energy is gaining momentum on the global stage, and wind turbines are a key part of this transition. As one of the most efficient sources of renewable energy, wind turbines are crucial in our efforts to move away from fossil fuels and combat climate change. By harnessing the power of the wind, wind turbines convert it into a clean, efficient energy source that can power cities, towns, and homes. Optimizing wind turbine efficiency is essential to meet the rising demand for renewable energy. A significant factor in optimizing this efficiency is the design of the turbine blades. Advances in blade technology can improve the performance of turbines, allowing them to generate more energy from the wind and operate in a wider range of conditions. Additionally, reducing the environmental impact of wind turbines is a key concern in ensuring their long-term sustainability.
This paper will explore how optimizing turbine blades and other components can increase the overall efficiency of wind energy production and contribute to the broader goal of renewable energy development. A wide range of the current wind turbine design codes are based on the so-called Blade Element Momentum theory (BEM). The first description was given by Glauert [1]. A good efficiency, operating over a wide speed range, and a good lift/drag ratio are essential aerodynamic factors in turbine design. BEM is the most commonly used method in the literature to predict the aerodynamic performances of wind turbines [2,3,4,5,6,7,8,9]. Furthermore, in some studies, BEM was combined with other methods to design optimal wind turbine blades [10]. Because of its flexibility and low computing resources, the BEM method has been used in numerous aerodynamic optimization studies [11,12,13]. Several studies have investigated wind turbine blade shape optimization [14,15,16]. Chehouri et al. provided a comprehensive review of wind turbine optimization techniques [16]. Xin et al. [17] reported a study on the optimization of the aerodynamic shape of curved small wind turbine blades, aiming to increase energy output and reduce thrust. Özkan et al. [18] examined the aerodynamic design and optimization of small-scale wind turbine blades using a novel artificial bee colony (ABC) algorithm combined with BEM. Their study, which includes both experimental and numerical analysis, shows that the ABC-BEM algorithm effectively enhances aerodynamic performance, providing a new method for turbine design optimization. Wang et al. [19] presented a novel method for optimizing Horizontal Axis Wind Turbine (HAWT) rotor blades, integrating shape and topology optimization. Their approach uses beam-type Finite Element Method (FEM) and BEM method to simulate aerostructural responses and employs a multi-objective optimization model to simultaneously optimize the blade’s external shape and internal layout. Yirtici et al. [20] Optimized wind turbine blade shapes to minimize power losses from icing using a gradient-based method with XFOIL and BEM theory. They compared ice accumulation and power production for baseline versus optimized blades. This approach is applicable to both small- and large-scale wind turbines. Cao et al. [21] conducted an uncertainty quantification analysis using the BEM method. Recently, Shubham et al. [22] proposed a physics-informed neural network surrogate model to replace BEM theory for estimating aerodynamic loads in wind turbines. In the same vein, ref. [23] this study developed neural network-based surrogate models for wind turbine blade aerodynamics, with CNN and MLP achieving high accuracy and fast computation for design optimization.
The PGD is a numerical method based on separated representations; computational models can easily be enriched in the PGD framework by introducing several of the problem parameters as extra coordinates. The PGD thus produces a general solution that can be post-processed as needed for various purposes, such as optimization. Thermal processes were modeled and optimized according to Ghnatios et al. [24] using a one-time model solution which reduces computational effort greatly, without accuracy being compromised. In the works of Leygue and Verron [25], to shape optimization, thickness of the layers of the composite laminate was used as additional variables, so that for any possible geometry of these variables, the model could be solved. This demonstrates the significant potential of the PGD technique for applications such as inverse identification, optimization, and beyond. It has also been utilized in structural optimization processes, as well as in identification and simulation-based control [24,26].
To the best of our knowledge, there is no study that has employed PGD to optimize the blade profile along the spanwise direction from an aerodynamic perspective. Therefore, this paper intends to present a new approach to optimize the blade profile of HAWT for certain initial conditions. A combination of BEM and PGD algorithm is incorporated into MATLAB (R2010A) to optimize the turbine blade profiles along the blade span. This study presents a methodology that combines the PGD method with the BEM approach for the optimization of the blade profiles for the purpose of maximum power production. The PGD method gives a parametric solution, and the user can obtain the required solution by selecting specific parameter values. These values are selected initially from the BEM method and are then used in the PGD model to find the solution. Additional factors such as airfoil thickness, , and twist angle are also considered in order to ensure that the design is both optimized and realistic. This approach integrates the strengths of both PGD and BEM, offering a versatile and efficient framework for aerodynamic optimization that can be utilized in designing high performance blades.
The paper is organized as follows: first, the BEM-PGD optimization approach is presented in detail, covering its development, an explanation of the optimization methodology, and the global algorithm. Then, the results obtained are presented and discussed, and finally the main findings are summarized in the conclusion of the paper.
2. Methodology
2.1. BEM-PGD Optimization Approach Procedure
In this work, the tangential force coefficient is the solution of interest which determines the blade profile types along the span to achieve maximum power output. The objective is to find a parameterized solution for our model. These parameterized approximations can then be used to enable shape optimization. Therefore, our model becomes multidimensional; however, by solving it once in a pre-computation phase using the PGD method, the solution is made available for any configuration of the parameters and may be considered as extra coordinates. This parameterized solution can then be used in a real-time application phase for optimization purposes coupled with a BEM algorithm. The proposed approach assumes that the desired solution, Ct (r, h, w) can be expressed as an infinite sum of terms, where each term is a product of three functions: one depending on the blade radius r, another on the chord and relative wind speed as h = (Vr2 · c), and a third on the torque derivative w. The method of separation of variables, when applicable, often provides highly accurate solutions with a limited number of terms using parameterized solutions. The tangential force coefficient is derived by applying the optimal parameter values and subsequently validated using the BEM method. With these parameters, it is possible to derive the blade profile for the entire span of the blade and to generate the maximum power output. Since multiple solutions were obtained from the airfoil database for particular parameter combinations, other criteria like thickness, , chord and twist of airfoil were also considered to find out the optimized and realistic blade design.
Beyond its application to this specific case, the PGD tool is versatile in that it can have control over parameterized solutions and can also serve as a blade design generator. Thus, the PGD method seems to be a promising approach to aerodynamic optimization; it is distinguished from previous methods in the literature.
2.2. BEM Method Implementation
The BEM theory is a conventional approach to model the aerodynamic performance of wind turbine blades. In the present formulation, the Prandtl tip-loss correction [27] is included to account for the loss of circulation near the blade tips due to the finite number of blades, ensuring better agreement with experimental data. Using the combination of the Blade Element Theory and Momentum Theory it gives a simple approach to estimate the forces on various parts of the blade depending on the local flow characteristics. Based on steady, incompressible, and uniform flow, it divides the blade into several parts to study the aerodynamic forces such as lift and drag. One of the key aspects of BEM is the employment of axial and tangential induction factors. They help to account for variations in flow velocity across the rotor disk and are important for estimating aerodynamic performance. They also play a significant role in calculating parameters such as the tangential force coefficient and thrust. While the BEM theory does rely on certain simplifying assumptions, its computational efficiency makes it a popular choice for initializing parameters in wind turbine analysis. Furthermore, it serves as a starting point for more advanced optimization techniques. In this particular study, the BEM method was applied to establish parameter values for a coupled PGD-BEM framework, which aims to enhance blade design and overall performance. A MATLAB (R2010A) code program is developed based on the BEM method presented, which utilizes a converging iterative process to calculate the performance of each blade element. To run the program, initial conditions such as the upstream fluid velocity and its parameters (density and viscosity), as well as the number and diameter of blades, are introduced.
Following are the steps implemented by the program to determine the parameters for each blade element:
- Initialize axial and tangential induction factors.
- Calculate local parameters such as relative velocities and Reynolds number for each blade section.
- Apply correction factors to account for losses due to blade tip effects.
- Compute lift and drag coefficients for each blade element based on local conditions.
- Calculate aerodynamic forces, including thrust and torque, acting on the blade elements.
- Iteratively update induction factors based on the calculated forces.
- Repeat the process until convergence is achieved within a predefined tolerance.
- Integrate the contributions of all blade elements to determine global power output and efficiency.
2.3. Whole Propeller Performances
For each TSR, the overall performance of the turbine is represented by the total performance of the turbine, which the sum of the 2D performances such as torque, is obtained on each individual blade element over the entire blade span. The torque equation is expressed as follows:
Thus, torque is used to calculate wind power production and mechanical power.
From the blade element theory, the resulting elementary torque is given by:
Which gives:
We start with the weighted residual form given by the following equation:
Let us define h = (Vr2 · c) and w = (dQ/dr) as parameters by mean of an extra-coordinate, where the integration domains are explicitly defined as: Ωr = [r_root, r_tip], Ωh = [h_root, h_tip], and Ωw = [w_root, w_tip].
Our goal is to obtain a PGD approximated solution to tangential force coefficient in the separated form [28]:
To do this, we will compute each expansion term one at a time, thus enriching the PGD approximation as we go until an acceptable convergence condition is met.
For notational simplicity, the next functional product , can be rewritten as . Thus, the solution at enrichment step n is as follows:
We now wish to compute the next term , , and to obtain the enriched PGD solution. At the current enrichment step n, all functions , , and are unknown and take the form of a product. Thus, the resulting problem is nonlinear, necessitating a suitable iterative scheme.
2.3.1. Description of a Particular Alternating Direction Iteration at a Given Enrichment Step
Each iteration of the alternating direction scheme consists of the following three steps:
- Calculating from and
In this case, the approximation reads:
where all functions are known except . The simplest choice for the weight function Equation (9) is:
By essentially choosing the Galerkin form [28] for the weight function , and injecting Equations (8) and (9) into Equation (5), we obtain:
In the above expression, all the functions of h and w are known, so we can calculate the one-dimensional integrals over and included in the coefficients Equation (A1) in Appendix A. Equation (10) becomes:
Which gives, in strong formulation:
We can solve numerically the strong form Equation (12), which represents a nonlinear algebraic equation for .
- Calculating from and
The process is identical to what we did earlier. Indeed, we merely switch the roles that are served by all relevant functions of r, h and w.
As we did before, this gives us the weighted residual form, from which we can derive the strong form of a nonlinear problem defined over , whose solution is the function .
As all functions of r and w are known, the integrals over and included in the coefficients can be calculated with Equation (A2) in Appendix A.
On the other hand, this one-dimensional problem over can be written in a strong form Equation (13), and it can be solved numerically.
- Calculating from the just computed and
Once more, the process is identical to what we did above. In actuality, we only switch the roles that are served by all pertinent functions of h and w.
- Where all functions are known except . By selecting a specific test function, the Galerkin formulation is used to determine test function. As all functions of r and h are known, the integrals over and included in the coefficients can be computed from Equation (A3) in Appendix A. The corresponding strong formulation of this one-dimensional problem over :
2.3.2. Convergence Criterion for Fixed Point Iterations
By using the index p to denote a particular iteration. At enrichment step n, the PGD approximation obtained at iteration p thus reads:
The nonlinear iterations continue until a fixed point is reached, within a user specified tolerance, i.e.,
where ‖⋅‖is a suitable norm.
The enrichment step n comes to an end with the assignments:
, , and . In the present work, the fixed-point tolerance is chosen to 10−6. The limitation of the fixed-point iterations number is set to 103, thus, to ensure that we reach the fixed-point convergence parameter first.
2.3.3. Stopping Criterion for the Enrichment Process
The enrichment procedure terminates when an adequate error measurement becomes sufficiently small, i.e., . Several stopping criteria are suitable. A first stopping criterion is associated with the relative weight of the newly computed term within the PGD expansion. Thus, is given [28] by:
PGD enrichment tolerance is set to 10−6 to enforce the number of enrichments, let us call it . Maximum number of enrichments is set to a sufficiently high number of 103, to ensure that we reach the enrichment tolerance first. The PGD algorithm can be summarized as follows Figure 1.
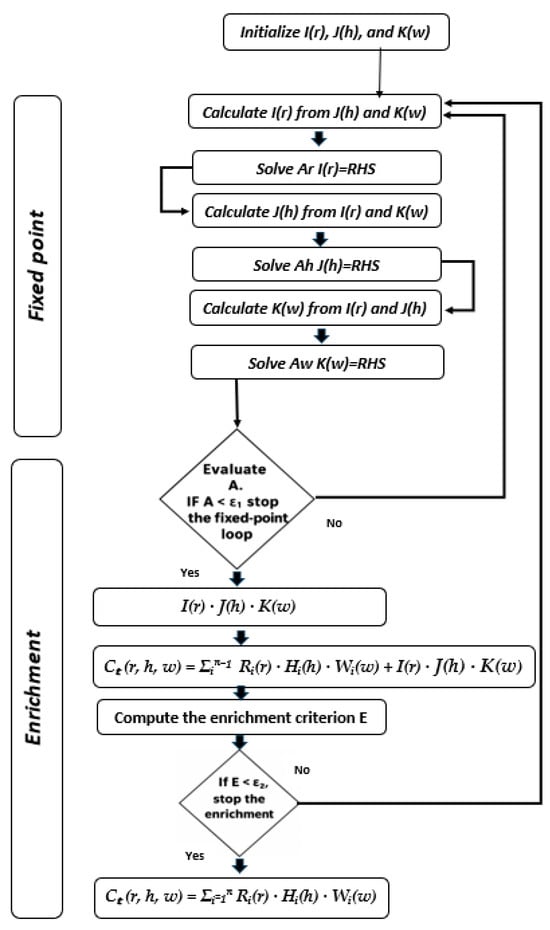
Figure 1.
PGD Algorithm.
2.3.4. Boundary Conditions
Let us now specify nonhomogeneous Dirichlet boundary conditions along a part of the domain boundary. We simply consider a function that satisfies the same Dirichlet conditions [28], i.e., but is otherwise arbitrary. Then, we compute a priori the separated representation of the function .
We need to enrich this approximation to obtain Equation (6), where , and for i > G, are calculated by using the PGD procedure. For the present work, it suffices to take the first one term for expansion where for i = 1, …, G, the remaining functions , , and for i > G, are calculated by using the PGD procedure. It suffices to take the first term of the expansion where:
With The following assignments Table 1:

Table 1.
Definition of boundary condition variables.
The two values of the tangential force coefficient at the root and tip profile constitute the boundary conditions for the PGD algorithm Figure 2, which will be used just to initiate the computation. The numerical procedure will then generate the parameterized Ct solutions along the radial length of the blade. The blade will be estimated in 24 elements in terms of BEM, and each element will be estimated at 104 nodes in terms of PGD, which means for each dimensions r, h, and w, we attribute 24 × 104 nodes. The nodal refinement allows us to have the solution very close to the first node at the root and the last node at the tip. To this effect, we just have to swap the solution at the edge node with the solution at the closest node at the tip and root to have new solutions at the edges.
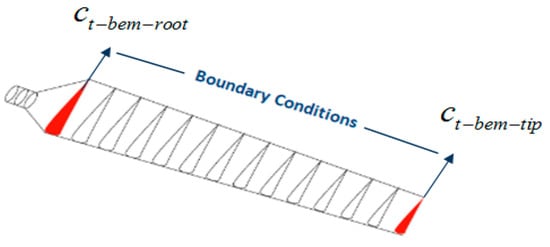
Figure 2.
Boundary conditions attribution.
2.3.5. Wind Turbine Blade Design and Optimization Methodology
Taking into consideration the design parameters provided, the recommended range for the design value of the tip speed ratio is between 4 and 10, as stated in sources [29,30]. For the purpose of this study, the design tip-speed ratio has been opted for . The Table 2 provides an overview of the design specifications that were used to optimize the wind turbine blade:

Table 2.
Initial optimization parameters.
The PGD optimization methodology goes through the following steps to determine the for each blade element using the selected parameters Figure 3:
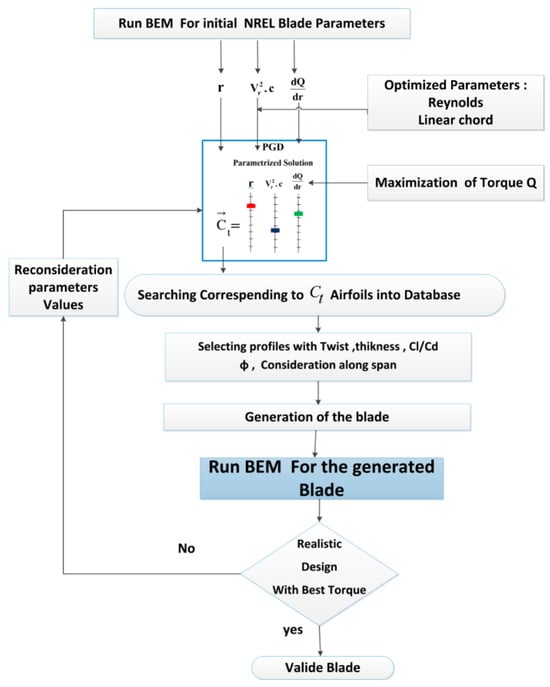
Figure 3.
Wind turbine blade optimization methodology flowchart.
- Run the BEM program with our initial NREL phase VI blade parameters for initialization with Initial optimization parameters.
- Since we have our PGD tool to have a parameterized solution calibrated and ready for use, it suffices simply to query our tool by injecting the optimal values of and maximizing the torque in order to obtain the desired solution of . There are several possible ways to maximize the torque, we will proceed by the most intuitive approach which consists of preserving the shape distribution of the span-wise torque for an optimal design value of tip-speed ratio, while increasing its values for each element blade. Maximizing the torque by modifying its derivative involves translating the torque graph along the y-axis to increase the area between the torque curve derivative and the (r/R)-axis.
- Attribution of values:
By defining the Reynolds number formulation as , and its design value by Re = 106 [31,32], it becomes possible to determine the values of relative wind velocity and by simply assigning the appropriate chord values. For practical manufacturing, the optimization constraint will involve a linear distribution of the chord, which will be based on a set of design slopes that provide the most optimal distribution of the chord along the span, as demonstrated in [32,33]. The optimized turbine employs a linear chord law, yielding a normalized slope of , selected through the PGD parametric framework, which allows instantaneous evaluation of Ct (r) for any chord slope. The linear form ensures analytical simplicity, consistent aerodynamic scaling, and practical manufacturability, while minimizing search iterations by directly considering the slope range reported by Yang et al. [33]. Then the PGD algorithm will incorporate the calculated values of relative wind velocity included in as optimization parameters.
- 3.
- Search the airfoils corresponding to the desired in the database.
- 4.
- Query the database for each solution selection, taking into consideration the twist, optimal , thickness (acceptable span regression), and best along the span. The data provided in the database (Table 3) is processed to identify and extract the appropriate values. Each value is associated with specific parameters such as the relative wind angle Equation (21), twist, thickness, and lift-to-drag ratio, all of which are all relevant for a particular profile type and a design optimal Reynolds value, assumed to be Re = 106.
 Table 3. Database structure.
According to the optimum rotor theory by Manwell et al. [34], certain equations can be derived:
where i indicates the ith blade section, is the speed ratio of the ith blade section , is the distance from the ith blade section to the rotor center, and is the angle of relative wind at the ith blade section.
- 5.
- Generate the optimized blade:
After computing at each node, a MATLAB (R2010A) routine filters and organizes the data into a sub-database containing (r, airfoil type, , twist, , and thickness information). As mentioned in step 4 the filtering only retains entries corresponding to a linearly varying twist and the optimal flow angle with maximum . Profiles are further refined by thickness regression, ensuring smooth and physically consistent variations along the span. In the PGD model, each of the 24 BEM elements is divided into nodes to increase the likelihood of capturing an optimal ; this means that one coherent and physically consistent airfoil profile is selected among possible combinations to best fit each BEM element.
- 6.
- Run BEM algorithm for our generated blade to check our optimized blade feasibility.
- 7.
- If the solutions are not adequate, the algorithm will make a slight movement of the radial nodes and then relaunch the coupled BEM-PGD procedure.
- 8.
- This iterative process continues until the desired power is obtained through the corresponding PGD parameters values of , and validated into the BEM algorithm for a realistic blade.
The PGD–BEM optimization workflow can be illustrated as follows Figure 4.
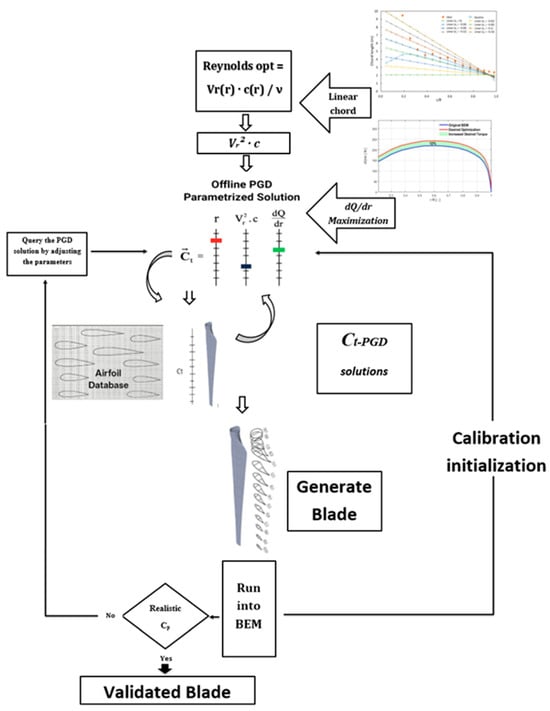
Figure 4.
PGD–BEM Optimization Workflow.
Step 3 of Section 2.3.5, goes through the following database structure in its execution Table 3.
3. Results and Discussion
In the following section, we present the results of our investigation into the primary blade design. Both BEM analysis and PGD simulation techniques are used for the operating condition indicated in Table 4, and the accuracy of the PGD simulation results is assessed. Some of our findings are compared to published experimental data; for other results they are compared to simulations to determine their relevance. The aerodynamic performance of the blade is to be analyzed, and the blade is to be optimized through analysis for our investigation.

Table 4.
The NREL Phase VI wind turbine operating condition.
Since the BEM serves as the starting point to initialize the variables to be injected into the PGD procedure as parameters on the one hand, and as the tool for adjusting the design by iteration on the other hand, the BEM algorithm validation is carried out as an initial calibration.
The algorithm calculation procedure presented in Section 2 is executed in the MATLAB (R2010A) environment considering the characteristics of the NREL Phase VI wind turbine only as a starting condition. However, the successful execution of the BEM code requires a wise prediction of the aerodynamic coefficients of the S809 airfoil profile as a function of the angle of attack. Furthermore, note that interpolation using the Viterna method [35] and 3D corrections of aerodynamic coefficients are also considered [36] in the process of executing the BEM algorithm.
In order to validate the BEM process and compare the results, experimental data collected in the scientific literature [37] to validate the model was used. Therefore, it was possible to make comparisons between the BEM results and experimental data. Figure 5.
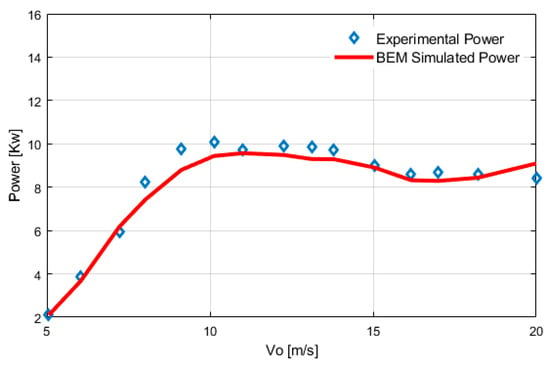
Figure 5.
NREL phase VI. Comparison between experimental and simulated power.
The analysis showed a 4.8% discrepancy between the simulated and experimental power curves. This difference between the simulated power curve based on blade element momentum theory and the experimental power curve of NREL phase VI is within an acceptable deviation range. However, the BEM theory has its limitations as it assumes steady and two-dimensional flow over the blades; whereas, in reality the flow is unsteady and three-dimensional, which can lead to some deviation in predicting lift and drag forces. However, BEM does not take into account wind shear and turbulence that can affect power production. Despite these discrepancies, BEM is a reliable method for predicting the performance of wind turbines. Even with its simplifications and assumptions, BEM is still a very useful tool for simulating wind turbines because it is both effective and computationally efficient.
3.1. PGD Algorithm Validation
To validate PGD model’s results, it is necessary to establish criteria for what constitutes an acceptable level of accuracy. Thus, for the same variable values of r, and w = dQ/dr, we are conducting a comparison between the radial distribution curves for that were obtained using both the BEM and PGD algorithms Figure 6, within the range of (4–10), which should encompass the design value of tip-speed ratio [29,30].
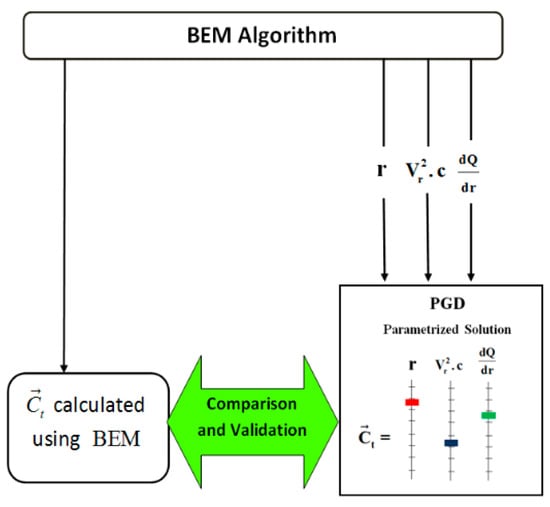
Figure 6.
PGD algorithm validation process.
The key fact which emerges from Figure 7 is the curves good agreement achieved by the PGD formulation across different values of the tip-speed ratio, which allows testing and calibrating the PGD formulation against a wide range of scenarios and inputs, increasing confidence in the model’s predictions and improving its overall utility for optimization and design decisions. This calibration process ensures that the model is ready for use (to increase torque) and performing at an optimal level.
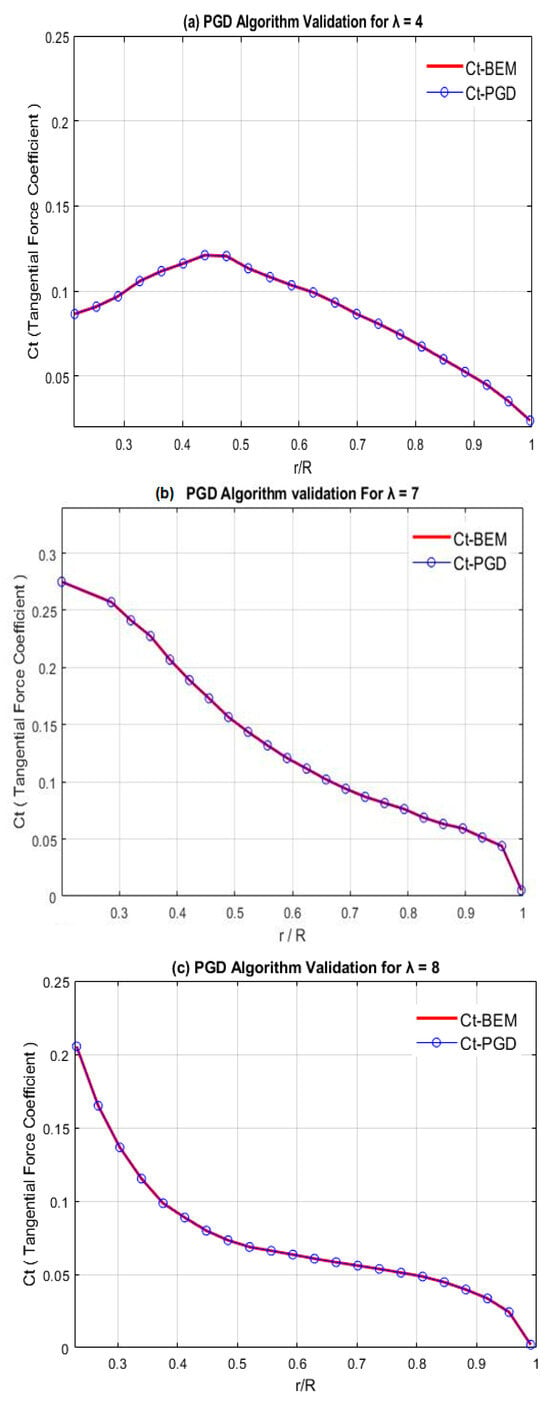
Figure 7.
PGD Algorithm Validation.
For Figure 7 the examination of the differences between the two graphs of obtained from the BEM and PGD algorithm, gave the following curve differences Table 5:

Table 5.
Ct-PGD curves precision.
Our database is constructed from airfoil geometries obtained from the University of Illinois’ open-access repository. Each profile was analyzed using XFOIL to compute lift and drag coefficients (, ) over angles of attack at the design Reynolds number. The results were then processed in MATLAB (R2010A) to extract aerodynamic data and compute the corresponding tangential force coefficients Ct Equation (A4) for each prescribed twist angle. When interrogating the database, the search tolerance was set to 3–5% of Ct-PGD, a range consistent with the cumulative numerical and aerodynamic uncertainties (dominated by polar resolution, interpolation, 3-D corrections, and minor modeling errors). Physically, although each of the 24 BEM elements is subdivided into PGD nodes, only one representative airfoil profile per element is retained, this tolerance ensures that an optimal Ct-Solution can always be captured locally and validated by BEM recomputation.
The good match between the tangential force coefficient obtained by the PGD results and the original Ct-BEM graph can indicate that the algorithm converged to a satisfactory solution, the model was appropriately defined, and the boundary conditions were correctly implemented. However, it is important to note that other factors, such as the quality and quantity of the input data, the choice of PGD parameters, and the complexity of the problem, can also affect the accuracy of the PGD results.
Also, the agreement between the two graphs illustrated in Figure 7, suggests that the simulation model was able to identify a solution that closely approximates the BEM data, based on the injected parameter values, and any small changes by mean of extra coordinates in the input data would result in a small change in the output. This alignment is a significant calibration of our simulation tool, indicating its effectiveness in processing optimization with precision. The robustness of the separated representation refers to the ability of the method to accurately capture the solution for a wide range of input parameters, allowing us to confidently use the model for optimization and exploration during the next step of torque maximization.
3.2. Torque as Extra Coordinate
The parameterization of the desired solution is carried out, with control over the elementary torque as an additional coordinate Figure 8.
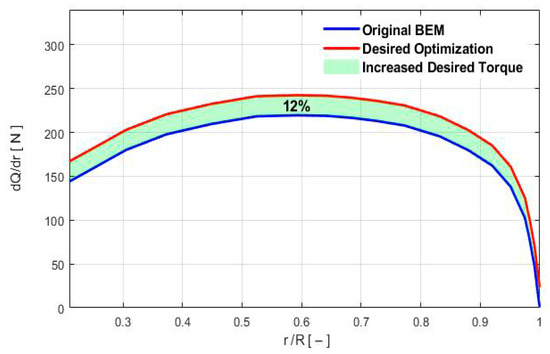
Figure 8.
Radial Distribution of Elementary Torque as a Control Parameter.
The process of shifting the graph involves translating the original elementary torque (torque per length unit) graph upwards along the y-axis by a certain distance. The amount of translation needed is determined by the condition that the area between the shifted and original dQ/dr graph must be 12% of the area between the dQ/dr graph and the r/R-axis. This condition ensures that the shift is significant enough to have a noticeable effect on the torque and, consequently, on the power. Once the translation is completed, the shifted graph is plotted alongside the original graph to provide a visual representation of the shift. Since The PGD tool enables the parameterization of the target , the resulting curve will be used as a control parameter in the proposed PGD algorithm to analyze and optimize the wind turbine blade according to the tangential force coefficient values.
After using the PGD algorithm to obtain optimized values, we processed and sorted the solutions through a database, this allowed us to achieve a linear distribution of twist values, where zero twist corresponds to the cylindrical root zone of the blade. The twist value at the root of our blade is much lower than the twist value at the root of the NREL Phase VI blade, the twist distributions for both blades twist until they approach the initial twist value at the tip of the blade. This indicates that the twist values which have a linear distribution along the radial axis are associated with the values obtained by the PGD algorithm Figure 9. From this stage, the global characteristics of the blade can be derived Figure 10.
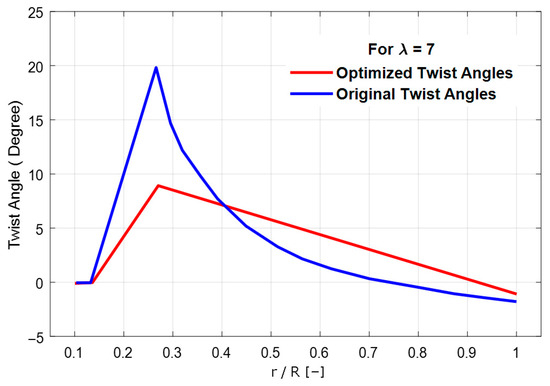
Figure 9.
Twist Angle Distribution.
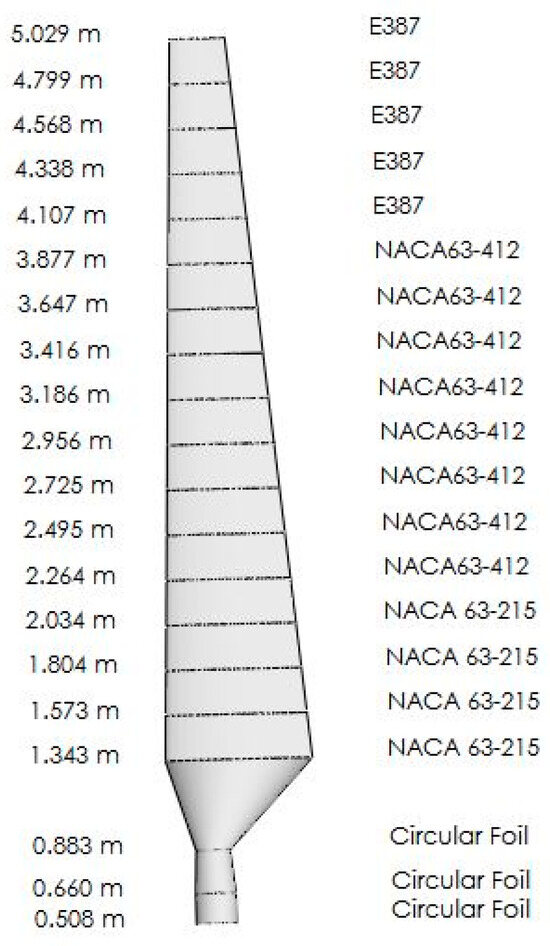
Figure 10.
Airfoil Distribution Along Optimized Blade.
The characteristic curves depicted in Figure 11, show that the power coefficient of the optimized rotors is higher than that of the reference turbine for TSR range from 1 to 12, with an increase of 21.7% to the reference turbine NREL Phase VI power coefficient. The fact that the optimized rotors perform better than the reference turbine over a range of TSR values suggests that the optimization is valid for multiple scenarios. This means that the optimized rotor design is not only effective under certain conditions but also has broad applicability across different wind conditions. Overall, a 21.7% improvement in power efficiency and the broad applicability of the optimized design are both positive indications that the optimization process was successful and has the potential to lead to more efficient wind turbines configurations. The PGD code used was launched with parameters determined by the BEM algorithm and validated by it. Therefore, the blade that we have optimized satisfies the assumptions of BEM theory that the blade operates in the linear part of the lift characteristic and does not account for dynamic stall explicitly. This study presents a PGD-based optimization approach and it is shown how it can be applied as a case study by coupling with BEM to demonstrate the flexibility of our variable separation tool for a wide range of other possible applications. To enhance the accuracy of the results, users can make their own assumptions based on the particular case they are studying. Therefore, we consider our optimized blade to be a valid design in the context of BEM assumptions.
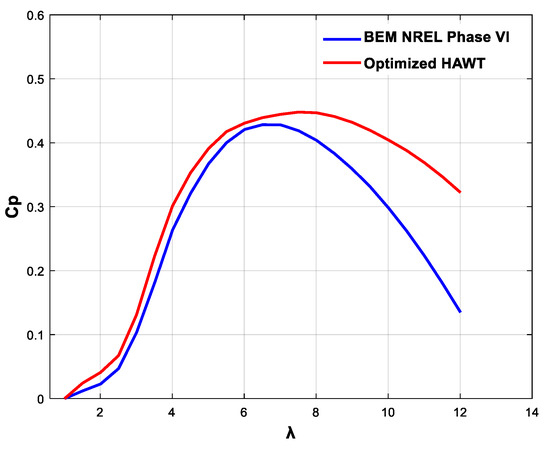
Figure 11.
Power coefficient versus TSR.
4. Conclusions
This research paper presents a new approach to improve the blade profile of horizontal wind turbines for specific starting characteristics. For this study, we use the NREL Phase VI as initial reference. By varying parameters, BEM combined with PGD enables control of desired solutions and thus is a practical aspect for optimization. By focusing on the tangential force coefficient as the desired parametric solution, the study was able to generate optimized rotor designs with higher power coefficients compared to a reference turbine, showing an increase of 21.7% of the power coefficient compared to the used reference turbine of 20 kw, for a TSR range of 1 to 12. Additional optimization constraints such as airfoil ratio, chord, twist, and thickness were also considered to achieve a realistic and optimized blade design for a linearized chord and twist distribution along the span. By way of a test case, BEM was used, which is just one of many potential applications of our separation of variables tool. The choice of different assumptions is left possible to the user depending on the specific case being studied, in order to improve its realistic accuracy. This preliminary attempt using PGD as a tool for optimization investigation sets the foundation for future research in the aerodynamic field. Overall, the study demonstrates the potential of PGD as a new approach to tackle aerodynamic optimization and distinguishes it from previous methods in the literature.
Author Contributions
Conceptualization, N.E.B. and A.S.; methodology, N.E.B. and A.S.; software, N.E.B.; formal analysis, N.E.B.; investigation, N.E.B. and A.S.; visualization, N.E.B.; validation, A.S.; writing—original draft preparation, N.E.B.; writing—review and editing, N.E.B. and A.S.; supervision, A.S. All authors have read and agreed to the published version of the manuscript.
Funding
This research received no external funding.
Data Availability Statement
The data that supports the findings of this study are available from the corresponding author upon reasonable request due to privacy restrictions.
Acknowledgments
The support from Directorate-General for Scientific Research and Technological Development (DG-RSDT) of Algerian government in the form of research grant to A. Smaili is gratefully acknowledged. The Laboratory of Green and Mechanical Development (LGMD) of National Polytechnic School (ENP) is also gratefully acknowledged for the resources and support.
Conflicts of Interest
The authors have no conflicts to disclose.
Nomenclature
| number of blade | Greek Symbols | ||
| chord of profil [m] | Angle of incidence between and the chord [deg] | ||
| drag coefficient | twist angle [deg] | ||
| lift coefficient | Pitch angle [deg] | ||
| tangential force coefficient | Chord solidity | ||
| power coefficient | Inflow (relative) angle [deg] | ||
| elementary radius [m] | Density of the fluid [kg/m3] | ||
| Power [W] | Blade rotational speed [rad/s] | ||
| torque [N.m] | Tip speed ratio | ||
| considered radius [m] | Local tip speed ratio | ||
| Reynolds number | Acronyms | ||
| thrust [N] | HAWT | Horizontal Axis Wind Turbine | |
| tangential force [N] | BEM | Blade Element Momentum theory | |
| local relative velocity [m/s] | PGD | Proper Generalized Decomposition | |
| correction loss factor | NREL | National Renewable Energy Laboratory (US) | |
| number of element | TSR | Tip Speed Ratio | |
| function of , representing the last term of the enrichment | |||
| function of , representing the last term of the enrichment | |||
| function of , representing the last term of the enrichment | |||
| calculated enrichment of | |||
| calculated enrichment of | |||
| calculated enrichment of | |||
Appendix A
Ct (r, α) = Cl (α)·sin(φ) − Cd(α)·cos(φ)

Table A1.
Optimized blade chord and twist distribution.
Table A1.
Optimized blade chord and twist distribution.
| Radial Position [m] | Chord Length [m] | Twist [Degree] | Airfoils |
|---|---|---|---|
| 0.5080 | 0.2180 | 0 | Circular Foil |
| 0.6600 | 0.2180 | 0 | Circular Foil |
| 0.883 | 0.183 | 0 | Circular Foil |
| 1.3430 | 0.7800 | 9.0255 | NACA 63-215 |
| 1.5734 | 0.7497 | 8.5724 | NACA 63-215 |
| 1.8037 | 0.7200 | 8.1980 | NACA 63-215 |
| 2.0341 | 0.6902 | 7.3733 | NACA 63-215 |
| 2.2645 | 0.6600 | 6.5458 | NACA 63-412 |
| 2.4949 | 0.6299 | 6.3125 | NACA 63-412 |
| 2.7252 | 0.6001 | 5.7184 | NACA 63-412 |
| 2.9556 | 0.5704 | 4.8909 | NACA 63-412 |
| 3.1860 | 0.5402 | 4.0635 | NACA 63-412 |
| 3.4164 | 0.5098 | 3.2387 | NACA 63-412 |
| 3.6467 | 0.4802 | 2.4113 | NACA 63-412 |
| 3.8771 | 0.4503 | 1.7547 | NACA 63-412 |
| 4.1075 | 0.4202 | 1.5838 | E387 |
| 4.3379 | 0.3900 | 0.7564 | E387 |
| 4.5682 | 0.3598 | −0.0711 | E387 |
| 4.7986 | 0.3296 | −0.2990 | E387 |
| 5.0290 | 0.3000 | −0.9745 | E387 |
References
- Glauert, H. Airplane propellers, division 1. In Aerodynamic Theory 4; Springer: Berlin/Heidelberg, Germany, 1935; pp. 169–360. [Google Scholar]
- Liu, S.; Janajreh, I. Development and application of an improved blade element momentum method model on horizontal axis wind turbines. Int. J. Energy Environ. Eng. 2012, 3, 30. [Google Scholar] [CrossRef]
- Al-Abadi, A.; Ertunç, Ö.; Weber, H.; Delgado, A. A torque matched aerodynamic performance analysis method for the horizontal axis wind turbines. Wind Energy 2014, 17, 1727–1736. [Google Scholar] [CrossRef]
- Duquette, M.M.; Visser, K.D. Visser, Numerical implications of solidity and blade number on rotor performance of horizontal-axis wind turbines. J. Sol. Energy Eng. 2003, 125, 425–432. [Google Scholar] [CrossRef]
- Lanzafame, R.; Messina, M. Fluid dynamics wind turbine design: Critical analysis, optimization and application of BEM theory. Renew. Energy 2007, 32, 2291–2305. [Google Scholar] [CrossRef]
- Ullah, T.; Sobczak, K.; Liśkiewicz, G.; Khan, A. Two-dimensional URANS numerical investigation of critical parameters on a pitch oscillating VAWT airfoil under dynamic stall. Energies 2022, 15, 5625. [Google Scholar] [CrossRef]
- Li, A.; Gaunaa, M.; Pirrung, G.R.; Lønbæk, K. How does the blade element momentum method see swept or prebent blades? J. Phys. Conf. Ser. 2024, 2767, 022033. [Google Scholar] [CrossRef]
- Davari, H.S.; Botez, R.M.; Davari, M.S.; Chowdhury, H. Wind turbine optimization by blade element momentum method and particle swarm optimization technique. J. Eng. 2025, 2025, 8779428. [Google Scholar] [CrossRef]
- Wu, J.; Sun, Z.; Zhu, W.; Fu, S.; Xu, C.; Shen, W. A New Modified Blade Element Momentum Method for Calculating the Aerodynamic Performance of a Wind Turbine in Yaw. Energies 2025, 18, 1063. [Google Scholar] [CrossRef]
- Wang, X.D.; Shen, W.Z.; Zhu, W.J.; Sørensen, J.N.; Jin, C. Shape optimization of wind turbine blades. Wind Energy Int. J. Prog. Appl. Wind. Power Convers. Technol. 2009, 12, 781–803. [Google Scholar]
- Lee, J.H.; Park, S.; Kim, D.H.; Rhee, S.H.; Kim, M.-C. Computational methods for performance analysis of horizontal axis tidal stream turbines. Appl. Energy 2012, 98, 512–523. [Google Scholar] [CrossRef]
- Batten, W.; Bahaj, A.; Molland, A.; Chaplin, J. Experimentally validated numerical method for the hydrodynamic design of horizontal axis tidal turbines. Ocean. Eng. 2007, 34, 1013–1020. [Google Scholar] [CrossRef]
- Hansen, M. Aerodynamics of Wind Turbines; Routledge: Virginia, UK, 2015. [Google Scholar]
- Clifton-Smith, M.J.; Wood, D.H. Further dual purpose evolutionary optimization of small wind turbine blades. J. Phys. Conf. Ser. 2007, 75, 012017. [Google Scholar] [CrossRef]
- Fuglsang, P.; Madsen, H. Optimization method for wind turbine rotors. J. Wind. Eng. Ind. Aerodyn. 1999, 80, 191–206. [Google Scholar] [CrossRef]
- Chehouri, A.; Younes, R.; Ilinca, A.; Perron, J. Review of performance optimization techniques applied to wind turbines. Appl. Energy 2015, 142, 361–388. [Google Scholar] [CrossRef]
- Shen, X.; Yang, H.; Chen, J.; Zhu, X.; Du, Z. Aerodynamic shape optimization of non-straight small wind turbine blades. Energy Convers. Manag. 2016, 119, 266–278. [Google Scholar] [CrossRef]
- Özkan, R.; Genç, M.S. Aerodynamic design and optimization of a small-scale wind turbine blade using a novel artificial bee colony algorithm based on blade element momentum (ABC-BEM) theory. Energy Convers. Manag. 2023, 283, 116937. [Google Scholar] [CrossRef]
- Wang, Z.; Suiker, A.S.; Hofmeyer, H.; van Hooff, T.; Blocken, B. Coupled aerostructural shape and topology optimization of horizontal-axis wind turbine rotor blades. Energy Convers. Manag. 2020, 212, 112621. [Google Scholar] [CrossRef]
- Yirtici, O.; Tuncer, I.H. Tuncer, Aerodynamic shape optimization of wind turbine blades for minimizing power production losses due to icing. Cold Reg. Sci. Technol. 2021, 185, 103250. [Google Scholar] [CrossRef]
- Cao, G.; Fei, Z.; Vogel, C. Uncertainty Quantification Analysis in the Blade Element Momentum Method. J. Phys. Conf. Ser. 2024, 250, 123181. [Google Scholar] [CrossRef]
- Baisthakur, S.; Fitzgerald, B. Physics-Informed Neural Network surrogate model for bypassing Blade Element Momentum theory in wind turbine aerodynamic load estimation. Renew. Energy 2024, 224, 120122. [Google Scholar] [CrossRef]
- Lalonde, E.R.; Vischschraper, B.; Bitsuamlak, G.; Dai, K. Comparison of neural network types and architectures for generating a surrogate aerodynamic wind turbine blade model. J. Wind. Eng. Ind. Aerodyn. 2021, 216, 104696. [Google Scholar] [CrossRef]
- Ghnatios, C.; Chinesta, F.; Cueto, E.; Leygue, A.; Poitou, A.; Breitkopf, P.; Villon, P. Methodological approach to efficient modeling and optimization of thermal processes taking place in a die: Application to pultrusion. Compos. Part A Appl. Sci. Manuf. 2011, 42, 1169–1178. [Google Scholar] [CrossRef]
- Leygue, A.; Verron, E. A first step towards the use of proper general decomposition method for structural optimization. Arch. Comput. Methods Eng. 2010, 17, 465–472. [Google Scholar] [CrossRef][Green Version]
- Pruliere, E.; Chinesta, F.; Ammar, A. On the deterministic solution of multidimensional parametric models using the proper generalized decomposition. Math. Comput. Simul. 2010, 81, 791–810. [Google Scholar] [CrossRef]
- Burton, T.; Jenkins, N.; Sharpe, D.; Bossanyi, E. Wind Energy Handbook; John Wiley & Sons: Hoboken, NJ, USA, 2011. [Google Scholar]
- Chinesta, F.; Keunings, R.; Leygue, A. The Proper Generalized Decomposition for Advanced Numerical Simulations: A Primer; Springer Science & Business Media: Berlin/Heidelberg, Germany, 2013. [Google Scholar]
- Wood, D.; Wood, D. Introduction to wind turbine technology. In Small Wind Turbines: Analysis, Design, and Application; Springer: London, UK, 2011; pp. 1–29. [Google Scholar]
- Yurdusev, M.A.; Ata, R.; Cetin, N.S. Assessment of optimum tip speed ratio in wind turbines using artificial neural networks. Energy 2006, 31, 2153–2161. [Google Scholar] [CrossRef]
- Liu, X.; Wang, L.; Tang, X. Optimized linearization of chord and twist angle profiles for fixed-pitch fixed-speed wind turbine blades. Renew. Energy 2013, 57, 111–119. [Google Scholar] [CrossRef]
- Alkhabbaz, A.; Yang, H.-S.; Weerakoon, A.S.; Lee, Y.-H. A novel linearization approach of chord and twist angle distribution for 10 kW horizontal axis wind turbine. Renew. Energy 2021, 178, 1398–1420. [Google Scholar] [CrossRef]
- Yang, K. Geometry design optimization of a wind turbine blade considering effects on aerodynamic performance by linearization. Energies 2020, 13, 2320. [Google Scholar] [CrossRef]
- Manwell, J.; Gowan, J.; Rogers, A. Wind Energy Explained England; Wiley: Hoboken, NJ, USA, 2002. [Google Scholar]
- Viterna, L.A.; Janetzke, D.C. Theoretical and Experimental Power from Large Horizontal-Axis Wind Turbines; NASA Lewis Research Center: Cleveland, OH, USA, 1982.
- Du, Z.; Selig, M. A 3-D stall-delay model for horizontal axis wind turbine performance prediction. In 1998 ASME Wind Energy Symposium; American Institute of Aeronautics and Astronautics (AIAA): Reston, VA, USA, 1998. [Google Scholar]
- Lindenburg, C. Analysis of the Stationary Measurements on the UAE Phase-VI Rotor in the NASA-Ames Wind Tunnel; ECN-C-03-025; ECN Wind Energy: Noord-Holland, The Netherlands, 2003. [Google Scholar]
Disclaimer/Publisher’s Note: The statements, opinions and data contained in all publications are solely those of the individual author(s) and contributor(s) and not of MDPI and/or the editor(s). MDPI and/or the editor(s) disclaim responsibility for any injury to people or property resulting from any ideas, methods, instructions or products referred to in the content. |
© 2025 by the authors. Licensee MDPI, Basel, Switzerland. This article is an open access article distributed under the terms and conditions of the Creative Commons Attribution (CC BY) license (https://creativecommons.org/licenses/by/4.0/).