Article

Hydrothermal Treatment of Kitchen Waste as a Strategy for Dark Fermentation Biohydrogen Production

by
Marlena Domińska
*,
Katarzyna Paździor
,
Radosław Ślęzak
and
Stanisław Ledakowicz
*
Department of Bioprocess Engineering, Faculty of Process and Environmental Engineering, Lodz University of Technology, 213 Wolczanska Street, 90-924 Lodz, Poland
*
Authors to whom correspondence should be addressed.
Energies 2025, 18(21), 5811; https://doi.org/10.3390/en18215811
Submission received: 8 October 2025 / Revised: 21 October 2025 / Accepted: 31 October 2025 / Published: 4 November 2025

Abstract

This study presents an innovative approach to the production of hydrogen from liquids following hydrothermal treatment of biowaste, offering a potential solution for renewable energy generation and waste management. By combining biological and hydrothermal processes, the efficiency of H2 production can be significantly improved, contributing to a reduced carbon footprint and lower reliance on fossil fuels. The inoculum used was fermented sludge from a wastewater treatment plant, which had been thermally pretreated to enhance microbial activity towards hydrogen production. Kitchen waste, consisting mainly of plant-derived materials (vegetable matter), was used as a substrate. The process was conducted in batch 1-L bioreactors. The results showed that higher pretreatment temperatures (up to 180 °C) increased the hydrolysis of compounds and enhanced H2 production. However, temperatures above 180 °C resulted in the formation of toxic compounds, such as catechol and hydroquinone, which inhibited H2 production. The highest hydrogen production was achieved at 180 °C (approximately 66 mL H2/gTVSKW). The standard Gompertz model was applied to describe the process kinetics and demonstrated an excellent fit with the experimental data (R2 = 0.99), confirming the model’s suitability for optimizing H2 production. This work highlights the potential of combining hydrothermal and biological processes to contribute to the development of sustainable energy systems within the circular economy.

1. Introduction

In the context of the global energy transition, hydrogen (H2) is considered one of the cleanest and most promising energy carriers. Using it as a fuel enables energy generation without carbon dioxide emissions—the only product of H2 combustion is water. As a key element of the hydrogen economy, H2 has applications in transportation, the chemical industry, energy production, and energy storage. However, widespread adoption of H2 depends on the development of sustainable production methods that can replace conventional fossil fuel-based technologies, such as steam methane reforming (SMR) and coal gasification [1,2].
Current H2 production methods can be divided into conventional (fossil fuel-based) and alternative technologies, including renewable and biological processes. Conventional processes such as SMR are relatively cost-effective and efficient but take place under harsh conditions (around 2.5 MPa and 850 °C [3] in the presence of a catalyst) and generate significant CO2 emissions as a byproduct. In contrast, alternative methods, such as renewable-powered electrolysis, photocatalysis, and biological H2 production, offer potential emission reductions in emissions and better align with sustainability goals [4,5].
Biological methods for H2 production, particularly dark fermentation (DF), are gaining attention due to their ability to use renewable substrates, such as biomass and organic waste. DF is an anaerobic process in which microorganisms convert organic materials into H2 and byproducts like butyric acid, acetic acid, and carbon dioxide [6]. This process is especially attractive because it can utilize a wide range of substrates, including simple sugars, starch, and wastewater sludge. The microorganisms responsible for DF, such as Clostridium and Enterobacter species, are capable of metabolizing a wide variety of organic compounds [7,8,9,10].
H2 production in DF is influenced by numerous biological, chemical, and technological factors. A crucial aspect is the choice of substrate, which should be rich in easily fermentable carbohydrates such as glucose, sucrose, or agro-industrial waste. As noted by Mokhtarani et al., the substrate type significantly affects microbial activity and process yield. Inoculum composition is another key factor—mixed bacterial cultures, especially after thermal or chemical pretreatment, allow the selection of strains with high hydrogenogenic activity [11]. According to Sachdeva Taggar et al., properly prepared inoculum helps to suppress competing processes such as methanogenesis or lactic acid formation [12].
Albuquerque et al. emphasize that maintaining stable physicochemical parameters, such as temperature and pH within the optimal mesophilic or thermophilic ranges, is essential for process stability [13]. In addition, advances in genetic engineering allow for the modification of metabolic pathways to enhance hydrogenase activity and overall H2 yield [14]. Implementation of modern bioreactors, including fluidized-bed and membrane systems, further improves process control and efficiency further. As highlighted by Jain et al., integrating DF with complementary technologies, such as post-fermentation methanation, can enhance the overall energy recovery of the system [15].
Despite its promising potential, DF has certain limitations, such as relatively low energy efficiency and limited ability to process lignocellulosic materials. Combining this process with other technologies, e.g., hydrothermal treatment (HTT), such as hydrothermal hydrolysis (HTH) or hydrothermal carbonization (HTC), can significantly enhance its efficiency and potential.
HTC is one of the most promising technologies for converting wet biomass under elevated temperatures (180–250 °C) and high pressures. The main products of HTC include biochar, hydrothermal liquid (HL), and gases like carbon dioxide. HL is particularly valuable as it contains a wide range of organic compounds, such as sugars, fatty acids, and furfural, which can be used as substrates for DF [16,17].
Similarly, HTH enables the breakdown of complex lignocellulosic materials at lower temperatures (130–200 °C), producing simpler sugars and other organic compounds that are more accessible for microbial fermentation. This process is particularly useful as a pretreatment step for biomass, enhancing the availability of fermentable components while reducing the content of inhibitors such as phenols or furfural [18,19,20].
Integrating DF with hydrothermal processes, such as HTC and HTH, offers new opportunities for sustainable H2 production. The waste liquids generated during HTC and HTH processes contain high concentrations of easily fermentable organic compounds, which makes them ideal substrates for anaerobic microorganisms. However, technological challenges such as the presence of inhibitors and the need to purify liquid residue require further research and optimization.
Furthermore, combining these technologies allows for the efficient utilization of organic waste, contributing to reduced greenhouse gas emissions and promoting a circular economy. Using waste HL not only increases H2 production efficiency but also minimizes waste generation, aligning with global sustainability goals [21,22,23].
In addition to H2, volatile fatty acids (VFAs) are also produced during the DF process. These acids are produced by the microbial breakdown of organic compounds, mainly carbohydrates, under anaerobic conditions. During this process, microorganisms convert complex organic materials into simpler molecules, with VFAs emerging as a significant byproduct [24].
The metabolic pathway of DF starts with the breakdown of sugars into pyruvate via glycolysis. This series of reactions not only releases energy in the form of ATP but also sets the stage for further biochemical transformations essential to the DF process. In strict anaerobic conditions, pyruvate serves as a key intermediate that is further converted into acetyl-CoA, a central metabolite. The conversion of pyruvate to acetyl-CoA is crucial for H2 production because H2 gas is released during the oxidation of pyruvate. From this point, the DF process can proceed along several distinct metabolic pathways, each of which impacts H2 production efficiency differently. When pyruvate is oxidized to form acetate, a high H2 efficiency is achieved, with 4 moles of H2 generated per mole of glucose metabolized. In contrast, when pyruvate follows a pathway that results in butyrate formation, the H2 efficiency decreases, producing only 2 moles of H2 per mole of glucose. These differences in H2 production efficiency underscore the importance of the acetate-to-butyrate ratio as an indicator of H2 generation potential in DF [13,25].
The ratio of VFAs to total organic carbon (TOC) is an important indicator used to evaluate the efficiency and progression of anaerobic fermentation processes. This ratio is particularly valuable for assessing overall microbial activity and metabolic performance in various organic-rich environments, such as sediments, organic waste, sewage sludge, and industrial wastewater. By monitoring this ratio, the microbial activity levels and the extent of organic matter transformation can be checked in these environments. This information can be used to optimize fermentation and waste treatment processes [26,27,28].
A high VFAs-to-TOC ratio indicates that intensive fermentative activity is taking place, suggesting that a substantial portion of the organic carbon is converted into simpler compounds (e.g., VFAs and H2 precursors). While H2 is mainly produced during the fermentation of sugars by H2-producing bacteria, VFAs are key intermediates for subsequent methanogenic activity and support methane formation in anaerobic systems [27,29].
The point at which this ratio is considered high can vary depending on the specific system and the conditions of the study. Generally, the ratio is considered high when it exceeds 0.5. This means that VFAs account for at least 50% (or more) of the TOC present. Such a high ratio suggests a significant conversion of organic carbon into VFAs, indicating a high level of fermentation activity in the system. A ratio below 0.5 is considered low, indicating limited fermentative activity and suggesting that a substantial portion of the organic carbon remains in more complex or non-degraded forms [26].
The kinetics of DF can be effectively described using the Gompertz model, which is a widely recognized mathematical tool for modeling microbial growth in biological processes. This sigmoidal model captures the three key phases of microbial activity: the initial lag phase, the exponential growth phase, and the deceleration phase as the system approaches an asymptotic maximum. The Gompertz model is particularly valuable in DF processes because it provides a clear framework for understanding the growth dynamics of the microorganisms involved in bioH2 production [30]. DF is an anaerobic fermentation process involving the breakdown of organic substrates by microorganisms to produce bioH2. The Gompertz model has been applied to describe the kinetics of H2 production in DF, offering insights into the maximum efficiency, growth rates, and the time required to reach peak production. By fitting experimental data to the Gompertz equation, researchers can identify key parameters, which are crucial for optimizing fermentation conditions [31,32].
In addition to Gompertz-based modeling, DF and hydrothermal fermentation processes can also be described using a broader set of kinetic approaches, including structural models, which consider detailed metabolic pathways and chemical transformations, and unstructured models, which focus on changes in microbial populations without explicitly modeling metabolism [33,34]. Other widely applied models include the ADM1, logistic, and Cone, which allow for the simultaneous analysis of gas production, substrate degradation, and biomass growth. Selecting the appropriate model depends on the purpose of the study. Simple empirical models like Gompertz are useful for rapid predictions, while more complex structural models provide a comprehensive view of fermentation dynamics [31,35].
A notable example of a more detailed structural model is the Anaerobic Biomass Fermentation (ABF) model, which has been described in the literature to characterize the complete biochemical pathways of anaerobic fermentation, including hydrolysis, acidogenesis, acetogenesis, and methanogenesis. The ABF model tracks the dynamic changes in substrates, intermediate metabolites, and gas production over time, providing a mechanistic representation of the process. Including such structured models illustrates the range of approaches available for fermentation modeling, from simple empirical formulations to detailed process-level representations suitable for in-depth analysis [36].
Applying the kinetic model to DF has proved useful for optimizing various operational parameters, such as temperature, substrate concentration, and pH, to maximize H2 production. The Gompertz model enables prediction of the time at which the maximum H2 efficiency will occur, helping to design more efficient fermentation systems. This predictive ability has been demonstrated with a variety of substrates, including simple sugars, food waste, and lignocellulosic biomass [32,37].
A notable strength of the Gompertz model is its flexibility when dealing with different types of substrates and fermentation conditions. Whether the substrate is easily degradable organic material or more complex substrates such as lignocellulosic biomass, the Gompertz model can effectively capture the growth patterns of H2-producing microorganisms. The model provides valuable insights into the rate limiting factors of the fermentation process, helping to optimize conditions and improve the overall performance of DF systems [31,38].
While the standard Gompertz model is highly effective at modeling DF kinetics, it has certain limitations, particularly in cases involving substrate inhibition or other complex microbial interactions. To address these challenges, modified versions of the Gompertz model have been developed. These modifications incorporate additional parameters to account for inhibitory effects or varying environmental conditions, providing a more accurate representation of the fermentation process under non-ideal conditions [30,39].
The production of H2 from liquids derived from thermal processes through DF represents a highly innovative and emerging approach to harnessing renewable energy resources. This concept introduces a novel pathway that combines thermal and biological conversion methods, enabling the recovery of valuable energy carriers from waste streams. Such advanced hybrid technologies can substantially reduce the overall carbon footprint, decrease dependence on fossil fuels, and promote the development of sustainable, circular bioenergy systems. Integrating thermal pretreatment with biological H2 generation, the process enhances H2 yield and promotes efficient resource utilization, which is a key element in modern circular economy strategies.
This paper presents the results of investigations into the effect of HTT of kitchen waste (KW) on the bioH2 production within the DF process, particularly with respect to the extent of hydrolysis at different thermal pretreatment temperatures. Key analyses included monitoring pH levels, assessing organic carbon levels, evaluating VFAs, and analyzing gas production. Process kinetics were also modeled to optimize DF performance.
By examining the extent of waste hydrolysis through thermal pretreatment, this method addresses specific challenges in waste management and contributes to reducing reliance on fossil fuels, supporting a more sustainable, low-carbon future.

2. Materials and Methods

All process conditions used in this study were selected based on previous optimization efforts [40,41]. Each parameter was refined in advance to ensure optimal performance and reliability throughout the experiments.

2.1. Inoculum

The inoculum used in this study was fermented sludge from the Wastewater Treatment Plant (WWTP) in Lodz. The characteristics of this sludge are presented in Table 1. Prior to its application, the sludge underwent a thermal pretreatment process, during which it was heated to a temperature of 70 °C for 30 min. This pretreatment step was essential to enhance the required microbial activity and the overall efficiency of the fermentation process.

2.2. Kitchen Waste

The substrate used in this study was a liquid obtained from the thermal pretreatment of KW. The KW was carefully gathered from households and consisted mainly of plant-derived materials such as scraps from fruits and vegetables, and other organic waste. This meticulous selection process was designed to ensure that only appropriate organic materials were used, deliberately excluding any animal waste or by-products to prevent complications during fermentation and to minimize potential variables.
The collected KW was ground to a uniform particle size of approximately 3 mm. The ground KW was then dried at 105 °C for 48 h and ground in a Pulverisette 15 mill to a particle size of less than 0.25 mm. The dry matter content in the wet KW after the drying process was equal to 15.91 ± 0.40%. This specific particle size was selected to increase the surface area of the substrate, thereby making it more accessible to the hydrolysis process. The comprehensive characteristics of the substrate are given in Table 1.
The liquid produced by the HTT of KW was used in this study. The amount of KW subjected to HTT was chosen so that the dry organic matter content of the resulting liquid, approximately 15 gTVS, was equivalent to that of 100 g of raw KW. This decision was based on the results of previous studies, which indicated that this amount was optimal for achieving the highest H2 production efficiency [41].

2.3. Experimental Setup

Thermal pretreatment of KW was performed in a Parr 4563M pressure reactor with a total volume of 0.6 L (Parr Instrument Co., Moline, IL, USA). The reactor was loaded with 40 g of dry KW and 360 g of distilled water. Prior to heating, the reactor was purged with nitrogen. The thermal pretreatment was carried out at temperatures of 25, 75, 110, 145, 180, 215, and 250 °C for a residence time of 0.5 h. Additionally, one experiment was conducted at 110 °C for 3.5 h. All experiments were performed under autogenous pressure with a stirring speed of 500 rpm. After thermal pretreatment, the liquid was separated from the hydrochar using a type 389 filter (Munktell, Falun, Sweden). A portion of the resulting liquid (150 mL) was used as a substrate for subsequent experiments.
The DF process was carried out under mesophilic conditions at 37 °C for 48 h in batch mode using glass bioreactors. Each reactor contained 900 mL of the reaction mixture. These reactors were placed in a shaker to ensure continuous agitation of the reactor contents, which is essential for maintaining homogeneous conditions and efficient interaction between substrates and microorganisms. Each reactor was equipped with a cap with two outlets: one connected to a tube with a septum, which allowed gas samples to be taken, and the other linked to a tube connecting the reactors to brine bottles, which were used to measure the volume of gas produced during the process. This volume was measured by the replacement method.
The inoculum originated from sludge that had undergone prior fermentation, without pH maintaining an approximate neutral pH of ~7. Gas production was tracked over a layer of saturated brine under standard laboratory conditions (~20–25 °C, atmospheric pressure) to limit gas absorption. Each measurement was conducted multiple times to determine mean gas volume. All experiments were carried out in triplicate to guarantee statistical accuracy and reproducibility. Throughout the fermentation process, temperature-controlled shaker ensured the even distribution of both microbes and substrates by continuously mixing the sludge.
The experimental process is summarized in a block diagram (Figure 1), showing the sequence from the thermal pretreatment of KW to fermentation.

2.4. Analysis Procedures

After HTH of KW the samples were extracted and derivatized. The composition of the liquid phase was determined using a GC/MS system according to the procedure described by Xiao et al. [42]. The mass spectra library (National Institute of Standards and Technology—NIST) was used to identify the compounds separated and detected by the GC/MS system. The compound was identified with a similarity index (SI) greater than 90.
Samples of the DF were taken from the bioreactor before and after the fermentation process. These samples were separated into solid and liquid phases using an MPW-250 centrifuge from MPW Med-Instruments (Warsaw, Poland), operating at 5000 rpm for five minutes.
For the reaction mixture, total solid (TS), total volatile solid (TVS) and pH were measured. TS and VS were analyzed using the gravimetric method [43]. The pH of the mixture was measured with a WTW pH 540 GLP electrode (WTW, Weilheim, Germany).
The liquid fraction was analyzed for TOC, TN and VFAs were measured. TOC and TN were measured using an IL 550 TOC-TN analyzer. The amount and composition of the VFAs produced were measured using a VARIAN CP4800 gas chromatograph (Varian Inc., Palo Alto, CA, USA). This chromatograph is equipped with a BP21 capillary column with a length of 25 m, 0.25 mm, and a film thickness of 0.25 µm. The liquid samples were first filtered through a membrane with a pore size of 0.2 µm, followed by acidification with formic acid. The helium flow rate was calibrated at 1.4 mL/min, and the flame ionization detector (FID) was adjusted to a temperature of 250 °C. A split ratio of 1:100 was set for the analysis, with a sample injection volume set of 1 μL. The capillary column was preheated to 110 °C and held for one minute. The temperature was then gradually increased at a rate of 10 °C per minute to 230 °C and held for two more minutes.
The volume of gas produced during the DF process was measured using the recommended displacement method. The composition was analyzed using an 8610C gas chromatograph (SRI Instruments, Torrance, CA, USA) for H2, methane (CH4) and carbon (CO2). This instrument is equipped with two shelves: one filled with silica gel only (1 m long, 1/8″ restrictive, 80/100 mesh) and the other filled with molecular sieves (also 1 m long and 1/8″ restrictive, 80/100 mesh). A thermal conductivity detector (TCD) was also built into the chromatograph. Helium was used as the carrier gas at a flow rate of 8 mL/min, with the temperature controlled at 60 °C and the TCD detector maintained at 150 °C. A volume of 0.25 mL was injected directly into the side inlet. The analysis was performed three times to ensure accuracy and the result is mean value.

3. Results and Discussion

3.1. Volatile Organic Compounds in the Liquid Fraction After Thermal Pretreatment

A GC/MS system was used to analyze the volatile organic compounds (VOCs) in the liquid fraction; 32 compounds were detected in the samples before and after thermal pretreatment at temperatures between 75–110 °C. An increase in temperature resulted in an increase in the number of compounds detected. The highest number of compounds detected (54) was detected in the liquid fraction after thermal pretreatment at 250 °C. A total number of 109 VOCs were detected in all liquid fractions after thermal pretreatment.
The exact reasons for the observed decrease in H2 production are complex due to the use of mixed microbial cultures. Different microorganisms may respond differently to the same compound, and the effect of a compound can depend on its concentration [44]. It is also concentration-dependent [45]. Due to the large number of compounds in this study, qualitative analysis was performed. Semi-quantitative analyses were carried out for potentially inhibitory compounds, by comparing the area of the peaks. In addition, interactions between compounds in a mixture may increase or decrease their overall effect [46].
During the literature review, information was found indicating that many phenolic compounds can have inhibitory effects on bacteria [47]. The mechanism of action of phenolic compounds is not fully understood, but it is thought that they may alter cell membrane permeability and change intracellular reactions [48]. The following phenolic compounds were identified: benzaldehyde, 4-hydroxy-; guaiacol, 4-butyl-; catechol; hydroquinone; phenol; phenol, 4-propyl; 1,2-benzenediol, 3-methyl; 1,4-benzenediol, 2-methyl; 1,2-benzenediol, 4-methyl.
Catechol, a compound associated with the inhibition of H2-producing bacteria [49], showed the highest peak area in the liquid fraction after pretreatment at 215 °C. It was also present after pretreatment at 180 °C, although the peak area was nearly seven times smaller. 1,2-Benzenediol, 3-methyl, which belongs to the catechol group, has moderate inhibitory properties [50]. This compound was detected after pretreatment at 215 °C and 250 °C, with a peak area that was 24% higher at 250 °C. Another catechol-related compound, 1,2-benzenediol, 4-methyl, was only detected at 250 °C; its inhibitory properties have not been reported.
Only hydroquinone [51] and 1,4-benzenediol, 2-methyl (a hydroquinone derivative) [52] were only present in the liquid after thermal pretreatment at 250 °C. The detected 1,4-benzenediol, 2-methyl is a member of the hydroquinone group with potentially inhibitory properties. Its presence was confirmed in the liquid after pretreatment at 250 °C.
Phenol is known to be toxic to many microorganisms and is used as a disinfectant [53]. In this study, phenol was detected in the liquid after pretreatment at 145 °C and 180 °C, however, no inhibition of H2 production was observed at these temperatures.
Guaiacol, 4-butyl, belongs to the phenolic compounds and was detected in the liquid after pretreatment at 250 °C. Currently, there is no literature on its inhibitory effects. Similarly, benzaldehyde, 4-hydroxy, detected at 250 °C, and phenol, 4-propyl, detected at 215 °C, have no reported inhibitory effects [54].

3.2. pH Changes

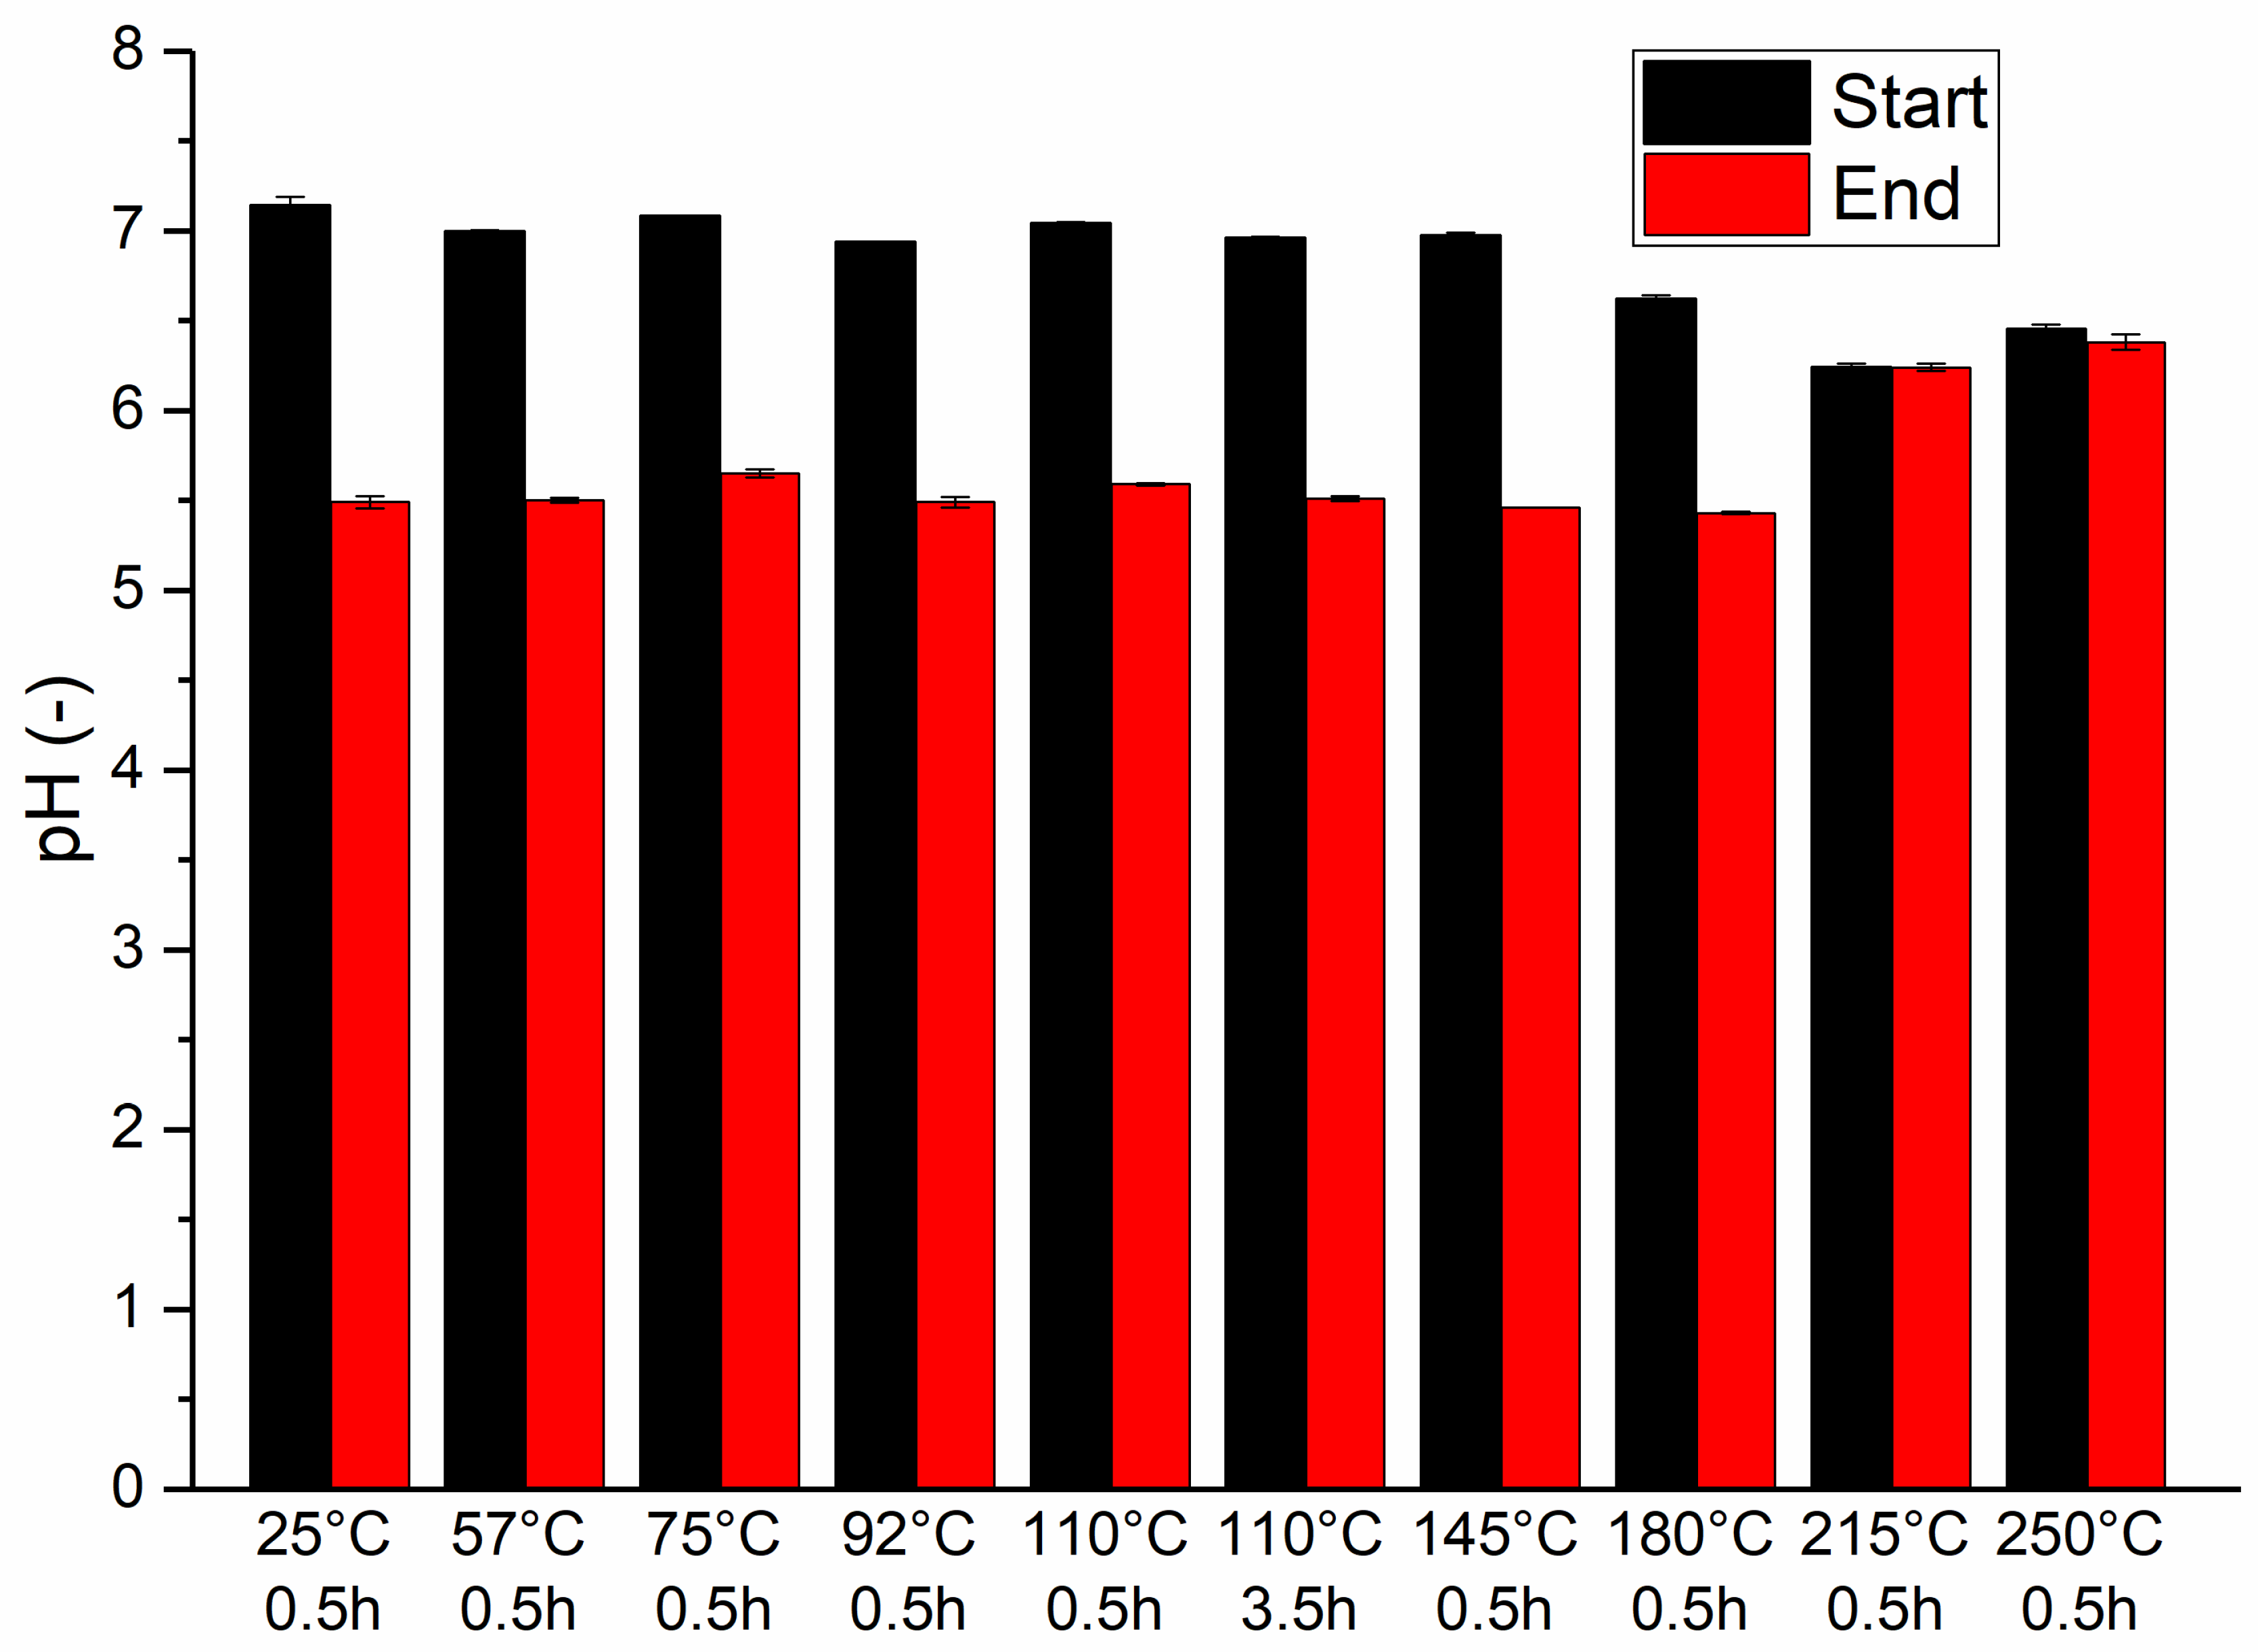
Figure 2 shows the changes in pH that occurred during the DF process. In most experimental series, the pH decreased as the process progressed, reflecting typical DF dynamics. However, exceptions were noted in series where process water was used following thermal treatments at 215 °C and 250 °C. In these cases, pH values remained relatively stable, possibly due to altered substrate properties or reduced microbial activity.
Initially, the pH of most of series (excluding those treated at 180 °C, 215 °C, and 250 °C) was approximately 7, decreasing to around 5.5 by the end of the experiment. For substrates treated at 180 °C, 215 °C, and 250 °C, the initial pH was slightly lower, ranging from 6.24 to 6.62. In the series with substrates treated at 180 °C, the pH decreased to 5.43, whereas in the higher-temperature series, the change in pH was minimal.
The observed decrease in pH may be associated with the production of VFAs, which are known to lower cellular ATP levels, potentially limiting glucose uptake and consequently reducing H2 production [13,55]. The absence of a significant pH change in the high-temperature series suggests that DF may have proceeded differently under these conditions, possibly due to the inhibition of microbial activity or changes in substrate composition.

3.3. The Amount and Composition of VFAs

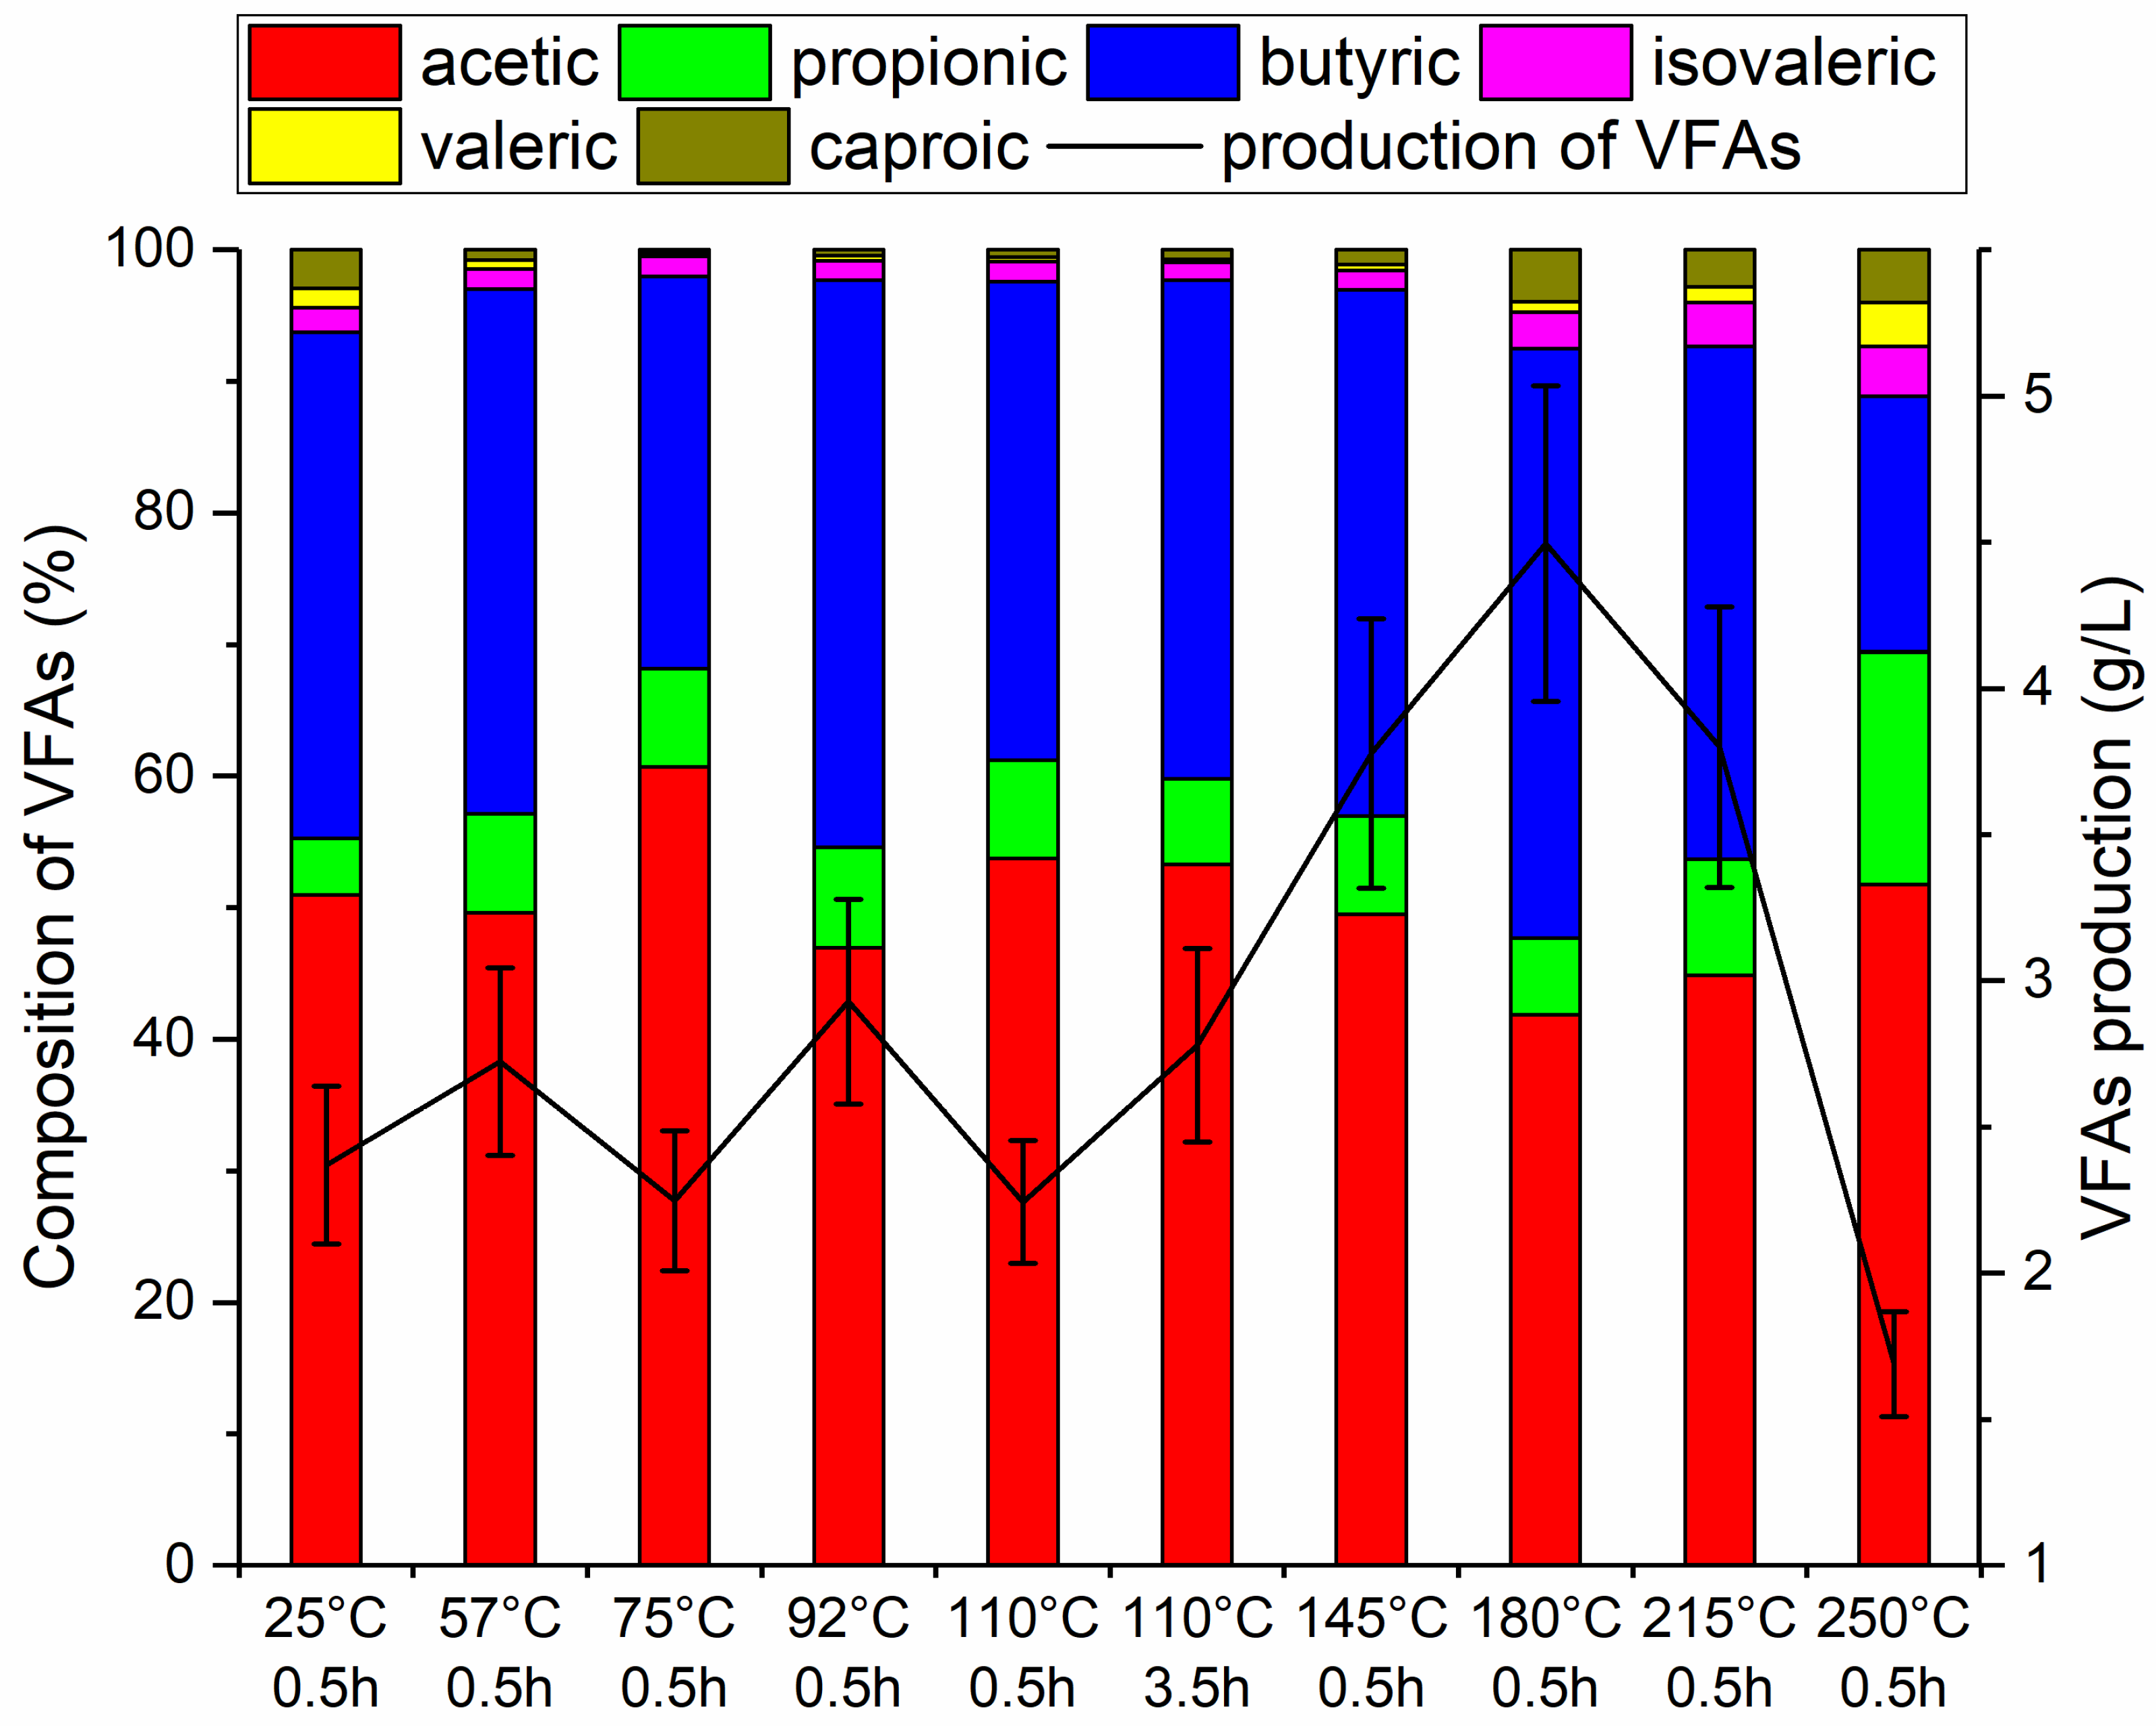
Figure 3 presents the amount and composition of VFAs in the supernatant of the reaction mixture after the DF process. The results indicate that the temperature at which the substrate is pretreated significantly affects both the course of the DF process and the quantity and composition of VFAs in the supernatant. The highest VFA production was observed in the series in which the substrate was thermally treated at 180 °C, with butyric acid predominating over acetic acid. The increased proportion of butyric acid suggests a more advanced fermentation stage, which favors gas production, including H2. These results suggest that moderate pretreatment temperatures may improve process efficiency by promoting the metabolic pathway that leads to the formation of butyric acid, CO2, and H2.
Samples subjected to lower pretreatment temperatures had higher levels of acetic acid, suggesting that fermentation terminated at an earlier stage. This incomplete fermentation likely limited the production of gases, including H2, due to less-developed bacterial metabolism under these conditions.
In contrast, in the series with substrate treated at 250 °C, VFA production was the lowest, accompanied by an increased proportion of propionic acid. The presence of propionic acid indicates a disruption in the fermentation balance, because its metabolic pathway is associated with lower H2 efficiency due to the consumption of H2 during propionate formation. Additionally, compounds generated during high-temperature pretreatment may have negatively affected microbial activity.
Overall, the data suggests that the temperature at which the substrate is pretreated plays a critical role in determining metabolic pathways during DF. An intermediate temperature (180 °C) appears optimal, facilitating the progression of the butyric acid pathway and resulting in higher H2 production and more efficient substrate utilization. Lower and higher pretreatment temperatures may hinder fermentation, reducing VFA and gas production. In particular, higher temperatures, such as 250 °C, may promote excessive propionic acid formation, thereby decreasing process efficiency [25,56].

3.4. VFAs:TOC Ratio

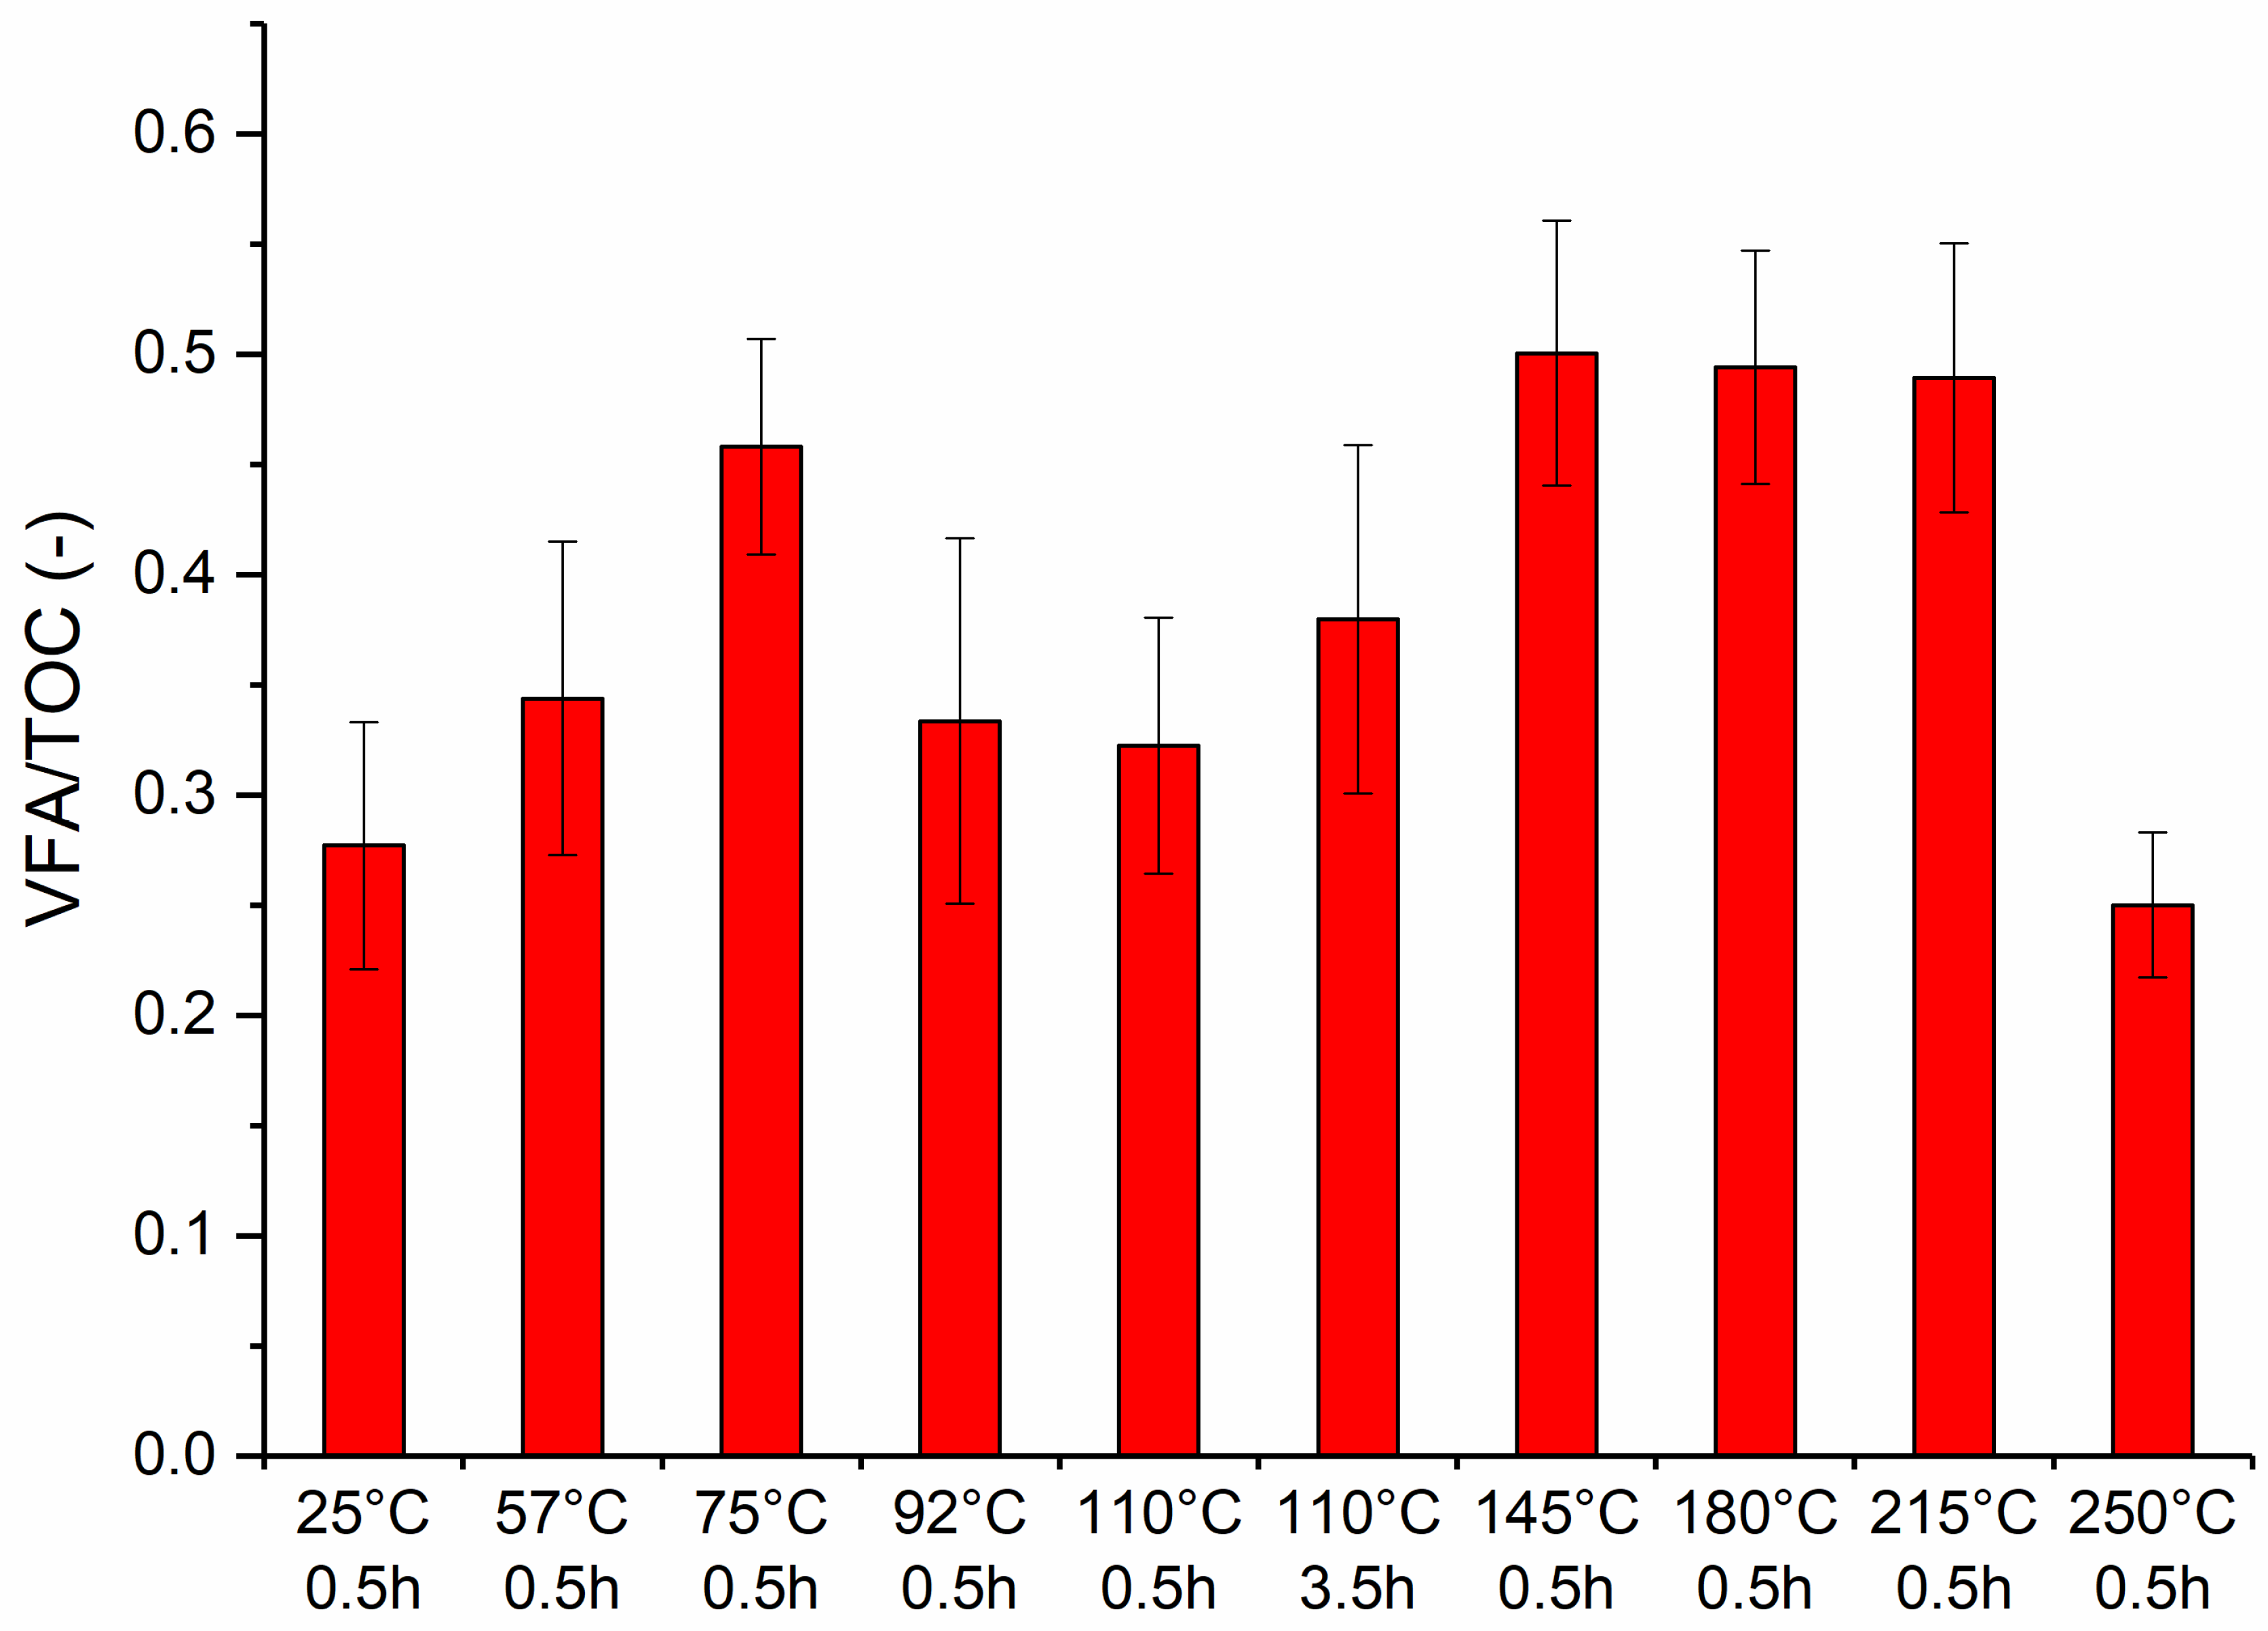
In the present study, the ratio of organic carbon converted to VFAs was 0 before the process and remained relatively low afterward (below 0.5, except for a value of 0.501 at 145 °C), as shown in Figure 4. These results suggest that the extent of fermentation was limited, reflecting either an earlier stage of fermentation or a lower overall fermentation activity compared to systems with higher VFA ratios. The low ratio may also indicate altered dynamics of organic matter decomposition, with a slower conversion of carbon into VFAs under the experimental conditions.

3.5. Hydrogen and Carbon Dioxide in Fermentation Gas

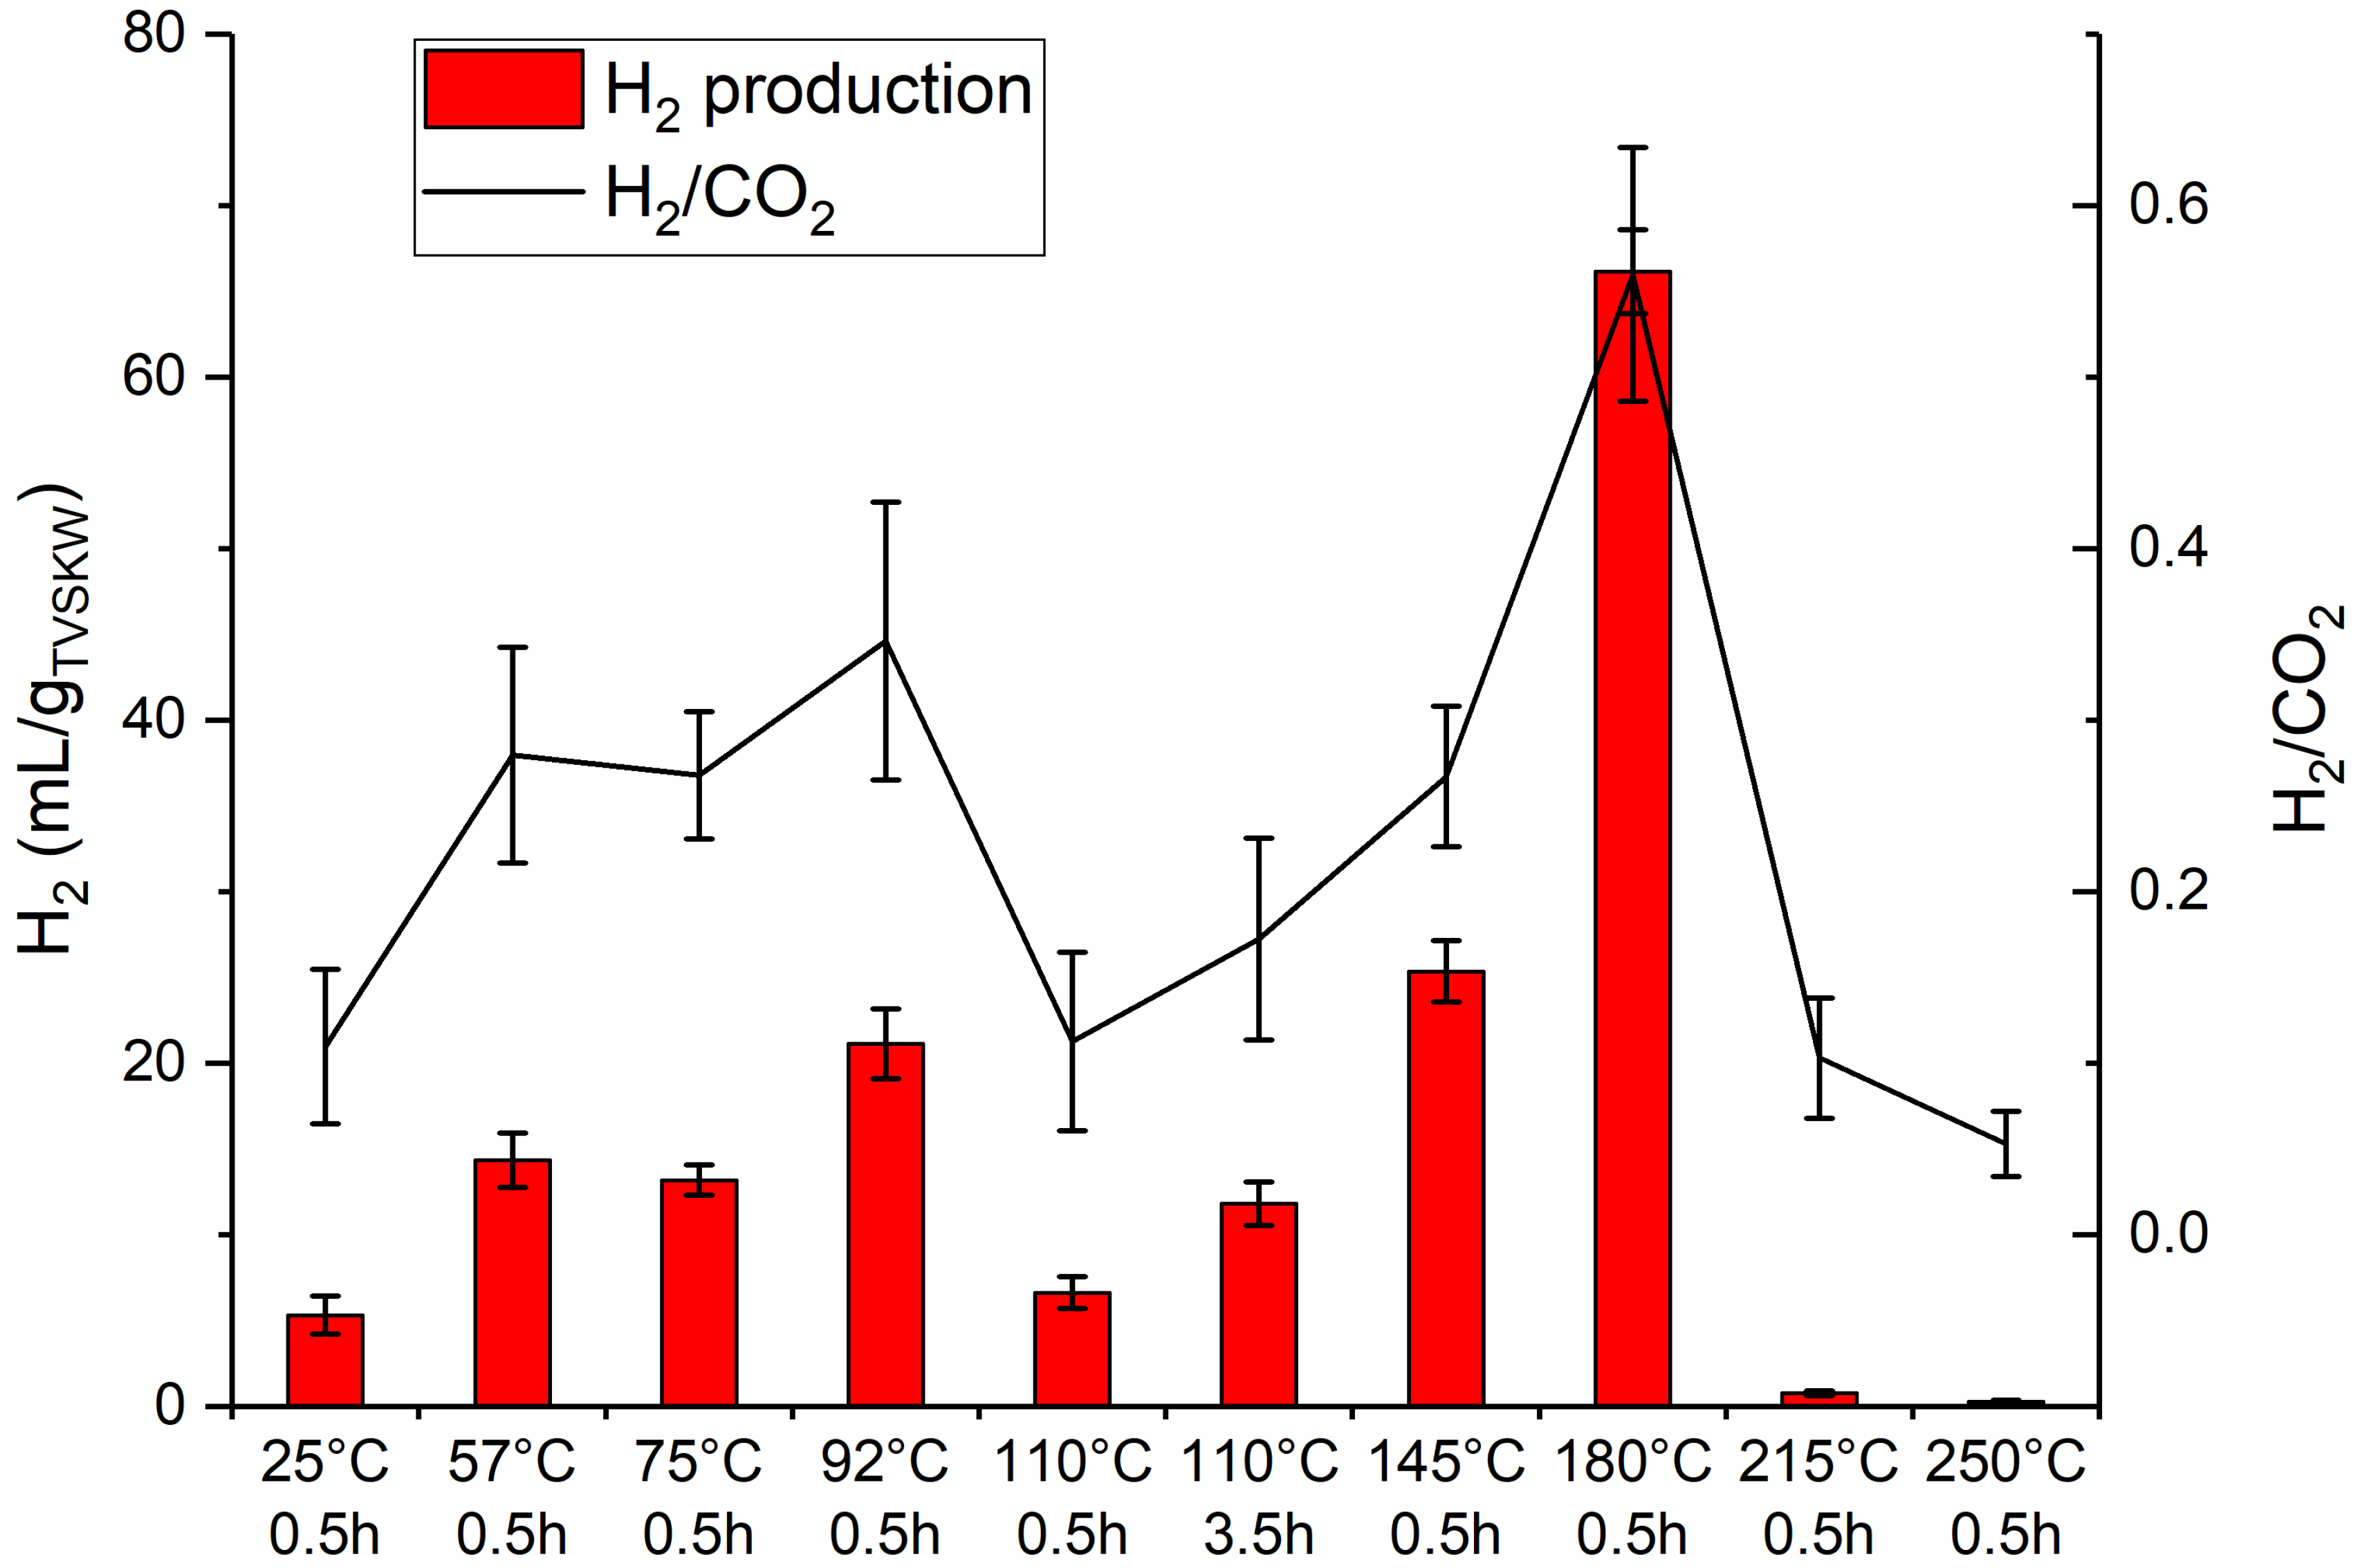
Figure 5 shows the H2 content in the fermentation gas and the H2 to CO2 ratio, revealing the influence of different substrate pretreatment temperatures. The lowest levels of H2 were measured in experiments where substrates were pretreated at the highest temperatures, specifically 215 °C and 250 °C. Additionally, minimal H2 production, in the range of 5–6 mL/gTVSKW, was observed in samples pretreated at 25 °C and 110 °C for 30 min. Interestingly, extending the pretreatment time at 110 °C nearly doubled the H2 efficiency, underscoring the significance of treatment time at this temperature level.
Apart from 110 °C, increases in the temperature of the substrate pretreatment were directly correlated with increased H2 production, peaking at 180 °C. This pattern suggests that H2 efficiency increases during DF as the temperature of the HTH increases. The optimum observed at 180 °C is likely due to the increased hydrolysis of compounds present in the waste. However, increasing the temperature increases to 215 °C and 250 °C resulted in an increase in the concentration of toxic by-products, leading to a decrease in H2 production efficiency. The observed changes in VFA profiles and H2 production with different pretreatment temperatures may be linked to shifts in microbial metabolic pathways. Moderate pretreatment temperatures (around 180 °C) likely enhance substrate solubilization, providing more fermentable sugars and amino acids that could favor acidogenic and hydrogen-producing pathways, leading to higher H2 and butyric acid formation. Homoacetogenic pathways may be less dominant under these conditions, which could further support H2 accumulation. In contrast, low pretreatment temperatures may limit substrate availability, resulting in less-developed microbial metabolism and higher acetic acid proportions, suggesting an earlier stage of fermentation with lower H2 production [57]. At high pretreatment temperatures (≥215–250 °C), inhibitory compounds such as furfural, HMF, or phenolics may accumulate. These compounds can suppress hydrogen-producing microbes and shift metabolism toward propionate-producing or other solventogenic pathways that consume H2, leading to reduced VFA yields and lower H2 efficiency [58,59]. These interpretations are somewhat speculative but provide a plausible framework for understanding the observed trends in both VFA composition and H2 production. They highlight the potential influence of pretreatment temperature on microbial metabolism and pathway selection during fermentation.
Kakar et al. confirmed that VFA production decreases at temperatures above 200 °C. Their study, which focused on thickened activated sludge, showed that hydrothermal pretreatment at lower temperatures maximizes VFA production, while higher temperatures decrease it. These results confirm the observations from the aforementioned studies [57]. They highlight the importance of optimizing the pretreatment temperature to maximize hydrolysis and minimize the formation of inhibitory substances, thereby improving the process’s overall performance.
Carbon dioxide (CO2) was identified as the second most abundant gas produced during DF after H2. As H2 production increases, so does the H2 to CO2 ratio, suggesting a proportional relationship between the two gases. This pattern indicates that higher H2 efficiency is accompanied by an increase in the relative proportion of H2 to carbon dioxide in the fermentation gas. This correlation underlines the critical role of pretreatment conditions in optimizing the fermentation process. Precise selection of parameters such as temperature and time of treatment makes it possible to increase H2 production efficiency while controlling CO2 production, especially in bioH2 systems. Therefore, understanding and adjusting the pretreatment parameters is essential not only for improving H2 efficiency but also for ensuring that the production process remains efficient and sustainable. Further investigation into the factors that influence this balance, including the nature of the substrate and the specific conditions used, is crucial for advancing the practical application of DF for H2 production [13,25,60].
However, when compared to the H2 efficiency of raw KW, which is approximately 100 mL H2/gTVSKW [41], the results of this study show a lower H2 production even under optimal conditions. In the best variant of this study, in which the substrate was pretreated at 180 °C, only about 66 mL H2/gTVSKW was obtained. This amount is significantly lower than the H2 efficiency from raw KW, indicating that while pretreatment temperatures can enhance H2 production to a certain extent, they do not fully match the H2 output achieved from raw KW. This discrepancy suggests that although pretreatment is beneficial for optimizing the fermentation process, the overall efficiency remains limited compared to that of raw biowaste. This points to the need for further research or alternative methods to increase H2 production from pretreated substrates. The H2 content in the gas mixture varied significantly depending on the conditions in the conducted experiments. In the least favorable scenario, the H2 concentration reached only 5%, whereas under the most favorable conditions, it increased to approximately 35%. This range highlights the variability in H2 production efficiency under different process setups. This variability can be explained by the fact that dried (stabilized) waste hinders the hydrolysis process. After HTH, the liquid easily separates from the solid fraction. Consequently, the substrate entering the DF process is free of suspended solids, facilitating VFAs recovery due to the lower dry matter content.
In contrast, when raw KW was used as a substrate in similar processes, the H2 content in the produced gas was consistently higher. The minimum was 30% and it reached an impressive 48% in the best performing cases. These results highlight the impact of substrate type and pretreatment on the efficiency of H2 production, showcasing the superiority of raw KW as a substrate compared to the thermally treated materials used in this study [40].

3.6. Gompertz Kinetics

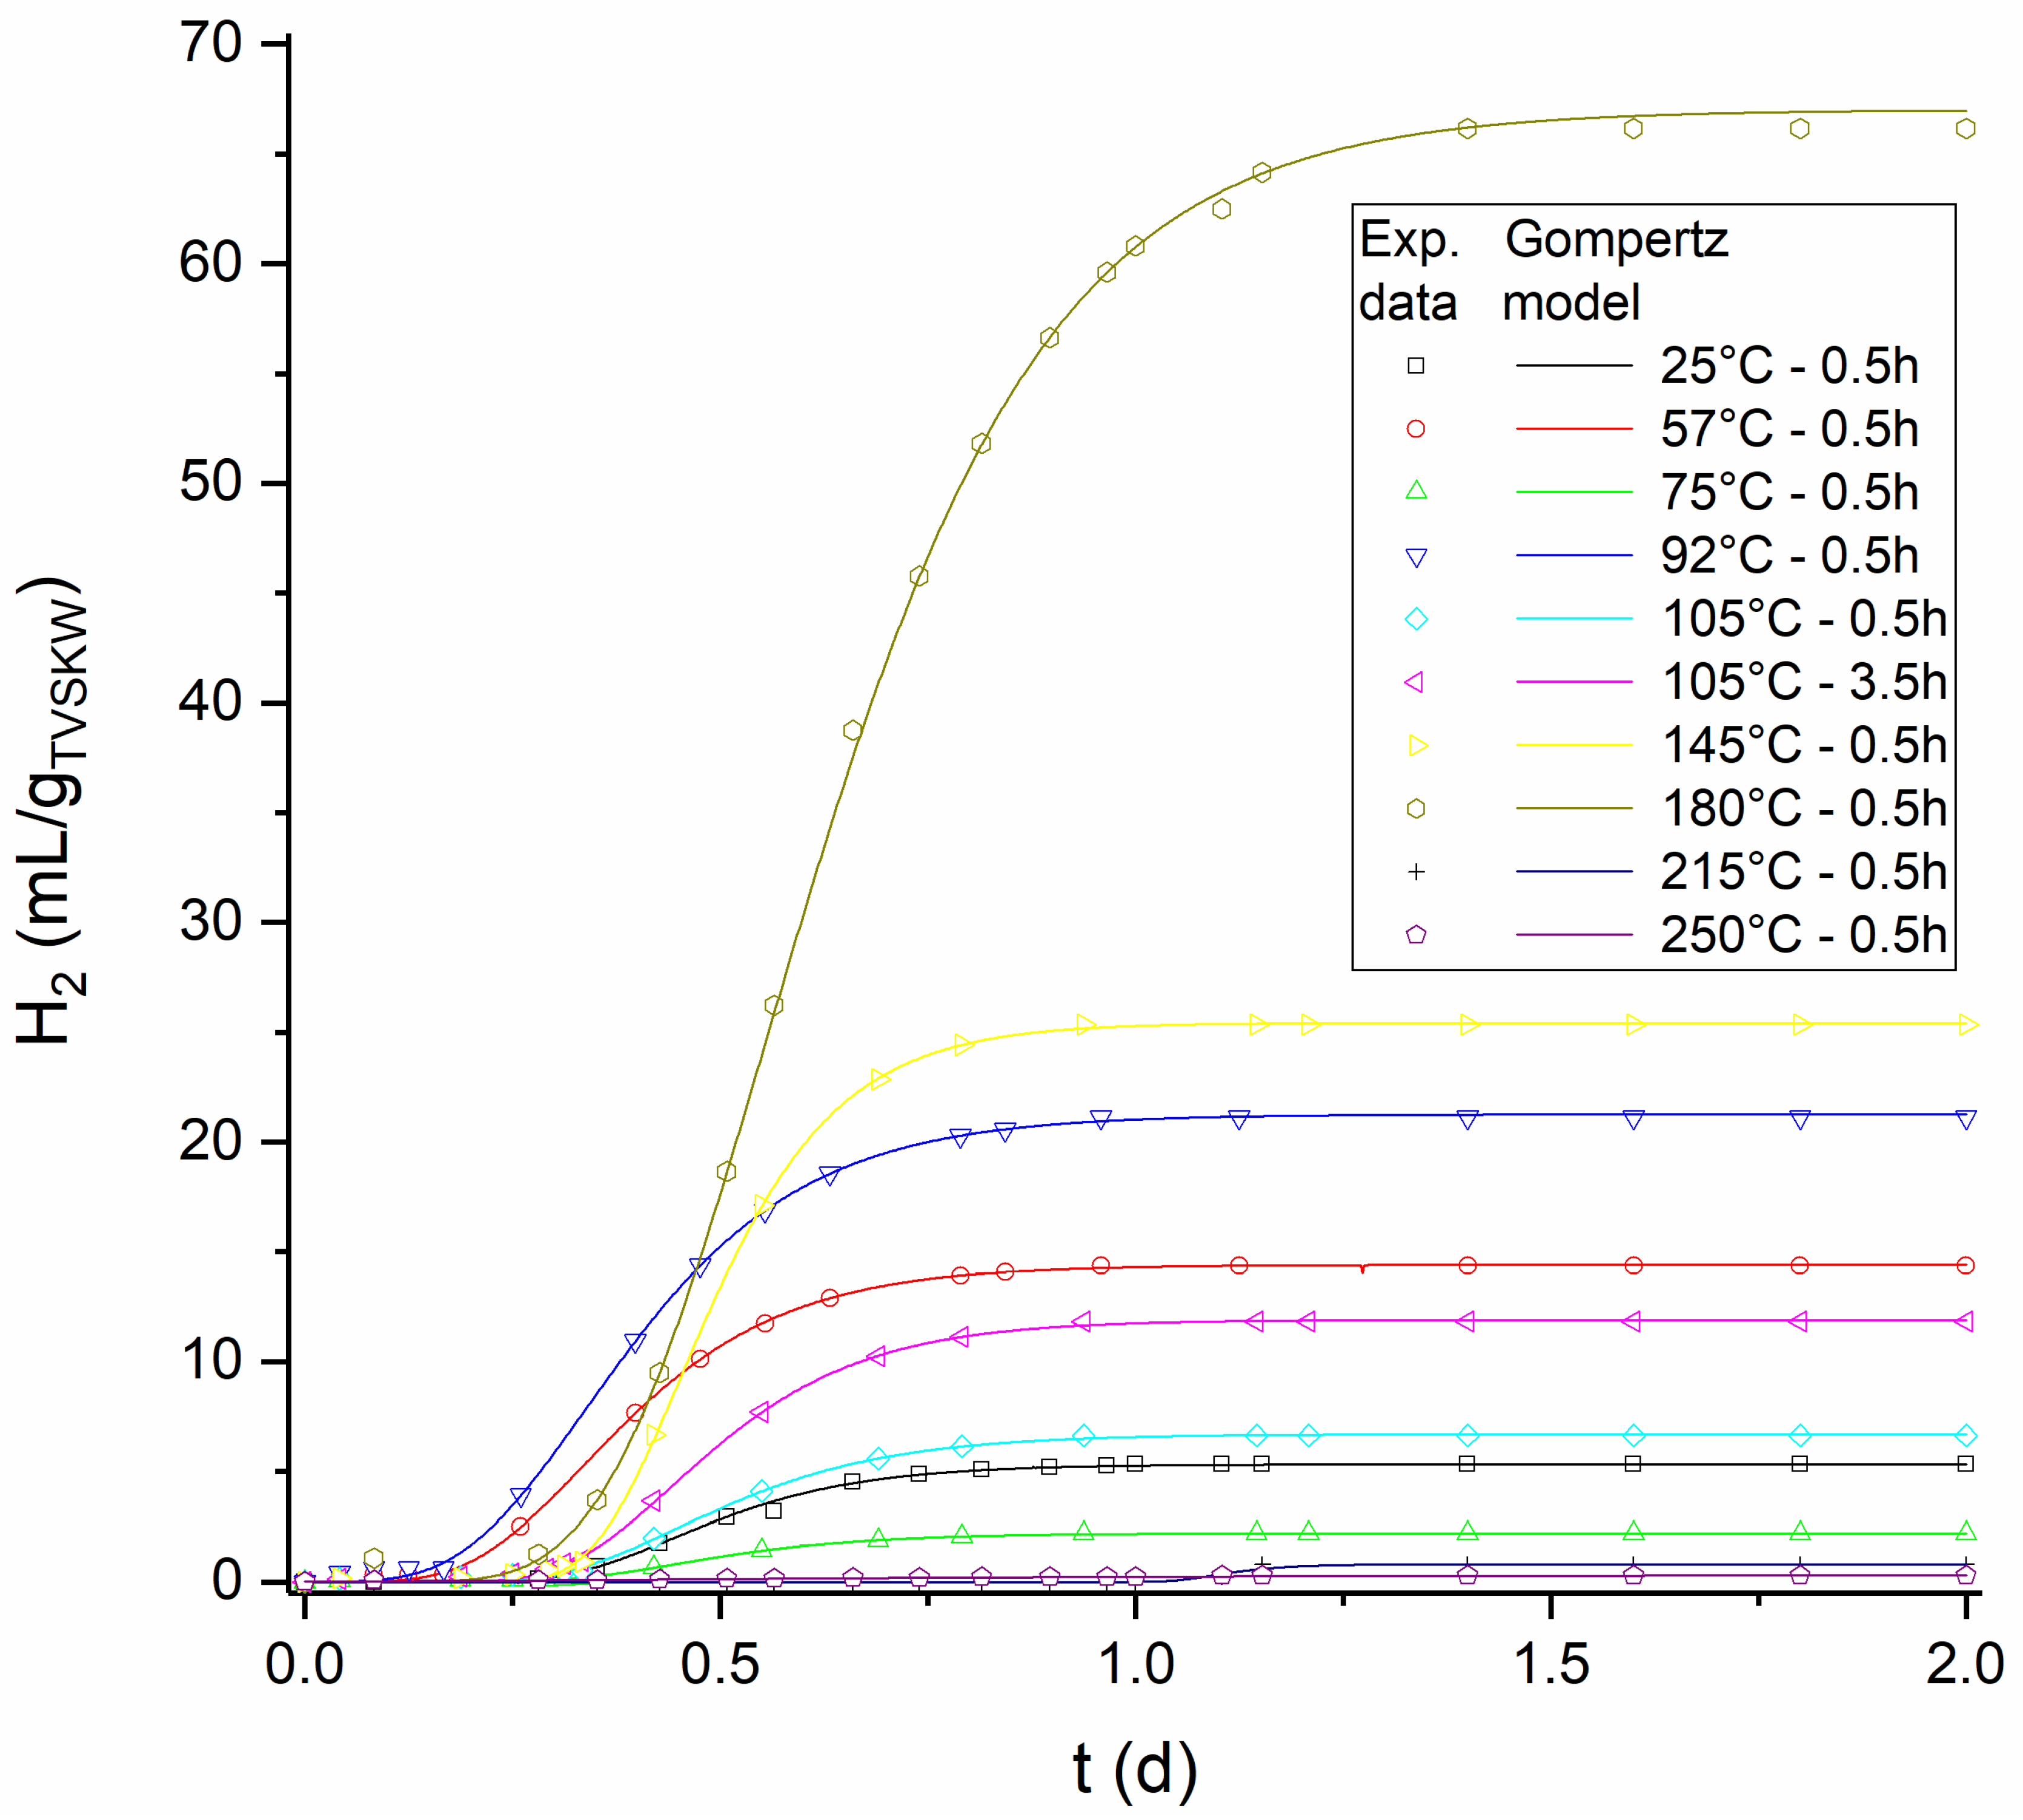
Figure 6 shows the cumulative H2 production graph, which illustrates the dynamics of H2 production over time. The graph indicates that gas production occurred in all variants tested, except for the substrate pretreated at 180 °C, in which gas production was observed in the given variant during the first 24 h of the process. For the test involving the substrate treated at 180 °C, however, H2 production continued for a slightly longer period of approximately 1.15 days (28 h). This is a shorter period than in previous studies by the same authors [40].
H2 production began in all cases after approximately 5 to 7 h (about 0.2 to 0.3 days). This early stage marks the point at which the fermentation process begins to produce measurable amounts of H2 efficiently. The variation in the duration of H2 production across different pretreatment temperatures highlights the influence of substrate conditions on the overall kinetics of H2 generation. The 180 °C pretreatment condition prolonged the production phase, however, the other tests showed rapid H2 production within the first few hours, emphasizing the dynamic nature of the fermentation process.
The Gompertz model was applied to describe the kinetics of DF of liquids from HTH pretreatment of KW. The results presented below correspond to the application of the liquid from the 180 °C pretreatment, which was identified as the optimal condition for H2 production. This temperature resulted in the highest efficiency of the fermentation process, making it the most favorable variant for maximizing H2 efficiency. Applying the Gompertz model, captured the dynamic growth patterns of the fermentation process, providing valuable insights into the biochemical kinetics and optimizing the conditions for sustainable H2 production.
Although the detailed Gompertz model fitting was fitted to the optimal condition, Figure 6 also illustrates the cumulative H2 production profiles for all tested variants As can be seen, both the maximum cumulative production (Bmax) and the maximum production rate (Rm) generally increased with pretreatment temperature up to 180 °C. After that, a marked decline occurred at 215 °C and 250 °C. This trend indicates that moderate thermal pretreatment enhances substrate biodegradability and microbial activity, whereas excessive heating likely leads to inhibitory compound formation and reduced fermentability. The lag phase (λ) values remained short (less than 0.4 days) for most treatments, showing efficient microbial adaptation. However, they were notably longer for higher temperatures, particularly at 215 °C (1.04 days), confirming the negative impact of severe thermal conditions. Thus, the 180 °C variant represents the most favorable balance between substrate modification and fermentation kinetics, as also supported by the highest Bmax, Rm, and R2 values.
The Gompertz model describing the growth dynamics of H2 production is represented by Equation (1).
B t = B m a x · exp exp R m · e B m a x · λ t + 1
where:
B(t): production at time t (mL/gTVSKW),
Bmax: maximum value (asymptote) (mL/gTVSKW),
Rm: maximum growth rate (mL/gTVSKW/d),
λ: time lag (delay) (d).
The parameters of the Gompertz model determined under different thermal treatment conditions are presented in Table 2.
Figure 6 illustrates how the model accurately captures the growth dynamics of the production process, including the initial rapid increase in production, the inflection points where the growth rate slows, and the eventual leveling off as the process approaches its maximum capacity. This high degree of fit suggests that the Gompertz equation could be effectively applied to describe the kinetic behavior of DF.
Compared to other Gompertz-based models used in the literature to describe DF or methane fermentation (MF), the application of this model shows consistent behavior with previously published studies. Other models, such as the modified Gompertz model (MGM) and the double Gompertz model, have also been used to describe the kinetics of DF and MF, achieving better fits to experimental data for specific fermentation processes [30,37]. These models often incorporate additional parameters to account for factors such as substrate inhibition or lag phases in microbial growth, which may be important in certain fermentation setups. However, the standard Gompertz model, as applied here, remains an effective and widely used approach due to its simplicity and good fit to experimental data, as evidenced by an R2 value of 0.99 [31,32,38].

4. Conclusions

Higher temperatures during the hydrothermal pretreatment of KW resulted in more compounds being hydrolyzed or released into the liquid phase. However, at temperatures above 180 °C, compounds are formed that initially shift metabolic pathways toward less favorable routes for H2 production. Further temperature increases may lead to inhibition of the DF process. A significant portion of the compounds are likely hydrolyzed from waste during biological treatment. Evidence of this comes from the lower H2 yield from liquids after thermal hydrolysis compared to the yield from raw waste (66 vs. 100 mL/gTVSKW).
An increase in pretreatment temperature also correlates with an increase in the number of detectable compounds, peaking at 250 °C, where 54 compounds were identified. H2 production was inhibited in samples treated at 215 °C and 250 °C, which is attributed to toxic compounds such as catechol (with the highest concentration at 215 °C) and hydroquinone and its derivatives (identified at 250 °C). Phenol, which was detected in liquids after pretreatment at lower temperatures (145 °C and 180 °C), did not inhibit H2 production, suggesting that its concentration and chemical properties were less detrimental. Overall, toxic phenolic compounds, particularly catechol and hydroquinone, appear to be the main factors contributing to fermentation inhibition at high temperatures. Further investigation is required to elucidate their specific effects on microbial activity.
The standard Gompertz model provided an excellent fit to the experimental data, as reflected in the high R2 value of 0.99, demonstrating its reliability and precision in describing the observed trends. This strong correlation highlights the model’s capacity to accurately represent complex system behaviors while maintaining computational efficiency, thereby reinforcing its value in experimental analysis and process optimization.

Author Contributions

Conceptualization, M.D., K.P. and R.Ś.; methodology, M.D.; validation, M.D., K.P. and R.Ś.; formal analysis, M.D. and R.Ś.; investigation, M.D.; resources, M.D.; data curation, M.D., K.P. and R.Ś.; writing—original draft preparation, M.D. and R.Ś.; writing—review and editing, K.P., R.Ś. and S.L.; visualization, M.D.; supervision, S.L.; project administration, M.D., K.P., R.Ś. and S.L.; funding acquisition, S.L. All authors have read and agreed to the published version of the manuscript.

Funding

This research was funded by the National Science Centre (2021/43/B/ST8/00298).

Data Availability Statement

The original contributions presented in this study are included in the article. Further inquiries can be directed to the corresponding authors.

Acknowledgments

The authors gratefully acknowledge the Group Wastewater Treatment Plant in Lodz (Poland) for providing the research material. This work was completed while the first author was the Doctoral Candidate in the Interdisciplinary Doctoral School at the Lodz University of Technology, Poland.

Conflicts of Interest

The authors declare no conflicts of interest. The funders had no role in the design of this study; in the collection, analyses, or interpretation of data; in the writing of the manuscript; or in the decision to publish the results.

References

  1. Das, D. Hydrogen Production by Biological Processes: A Survey of Literature. Int. J. Hydrogen Energy 2001, 26, 13–28. [Google Scholar] [CrossRef]
  2. Hallenbeck, P.C. Fermentative Hydrogen Production: Principles, Progress, and Prognosis. Int. J. Hydrogen Energy 2009, 34, 7379–7389. [Google Scholar] [CrossRef]
  3. Szablowski, L.; Wojcik, M.; Dybinski, O. Review of Steam Methane Reforming as a Method of Hydrogen Production. Energy 2025, 316, 134540. [Google Scholar] [CrossRef]
  4. Libra, J.A.; Ro, K.S.; Kammann, C.; Funke, A.; Berge, N.D.; Neubauer, Y.; Titirici, M.-M.; Fühner, C.; Bens, O.; Kern, J.; et al. Hydrothermal Carbonization of Biomass Residuals: A Comparative Review of the Chemistry, Processes and Applications of Wet and Dry Pyrolysis. Biofuels 2011, 2, 71–106. [Google Scholar] [CrossRef]
  5. Sivagurunathan, P.; Kumar, G.; Mudhoo, A.; Rene, E.R.; Saratale, G.D.; Kobayashi, T.; Xu, K.; Kim, S.-H.; Kim, D.-H. Fermentative Hydrogen Production Using Lignocellulose Biomass: An Overview of Pre-Treatment Methods, Inhibitor Effects and Detoxification Experiences. Renew. Sustain. Energy Rev. 2017, 77, 28–42. [Google Scholar] [CrossRef]
  6. Guo, Y.; Wang, S.Z.; Xu, D.H.; Gong, Y.M.; Ma, H.H.; Tang, X.Y. Review of Catalytic Supercritical Water Gasification for Hydrogen Production from Biomass. Renew. Sustain. Energy Rev. 2010, 14, 334–343. [Google Scholar] [CrossRef]
  7. Aragón-Briceño, C.I.; Pozarlik, A.K.; Bramer, E.A.; Niedzwiecki, L.; Pawlak-Kruczek, H.; Brem, G. Hydrothermal Carbonization of Wet Biomass from Nitrogen and Phosphorus Approach: A Review. Renew. Energy 2021, 171, 401–415. [Google Scholar] [CrossRef]
  8. Claassen, P.A.M.; van Lier, J.B.; Lopez Contreras, A.M.; van Niel, E.W.J.; Sijtsma, L.; Stams, A.J.M.; de Vries, S.S.; Weusthuis, R.A. Utilisation of Biomass for the Supply of Energy Carriers. Appl. Microbiol. Biotechnol. 1999, 52, 741–755. [Google Scholar] [CrossRef]
  9. Chen, W.; Chen, S.; Kumarkhanal, S.; Sung, S. Kinetic Study of Biological Hydrogen Production by Anaerobic Fermentation. Int. J. Hydrogen Energy 2006, 31, 2170–2178. [Google Scholar] [CrossRef]
  10. Logan, B.E.; Oh, S.-E.; Kim, I.S.; Van Ginkel, S. Biological Hydrogen Production Measured in Batch Anaerobic Respirometers. Environ. Sci. Technol. 2002, 36, 2530–2535. [Google Scholar] [CrossRef]
  11. Mokhtarani, B.; Zanganeh, J.; Moghtaderi, B. A Review on Biohydrogen Production Through Dark Fermentation, Process Parameters and Simulation. Energies 2025, 18, 1092. [Google Scholar] [CrossRef]
  12. Taggar, M.S.; Kaur, A.; Jain, C.; Kalia, A.; Sooch, S.S. Hydrogen Production Via Dark Fermentation: A Review of Influential Factors. Cellul. Chem. Technol. 2024, 58, 1051–1063. [Google Scholar] [CrossRef]
  13. Albuquerque, M.M.; Sartor, G.D.; Martinez-Burgos, W.J.; Scapini, T.; Edwiges, T.; Soccol, C.R.; Medeiros, A.B. Biohydrogen Produced via Dark Fermentation: A Review. Methane 2024, 3, 500–532. [Google Scholar] [CrossRef]
  14. Cao, Y.; Liu, H.; Liu, W.; Guo, J.; Xian, M. Debottlenecking the Biological Hydrogen Production Pathway of Dark Fermentation: Insight into the Impact of Strain Improvement. Microb. Cell Fact. 2022, 21, 166. [Google Scholar] [CrossRef] [PubMed]
  15. Jain, R.; Panwar, N.L.; Jain, S.K.; Gupta, T.; Agarwal, C.; Meena, S.S. Bio-Hydrogen Production through Dark Fermentation: An Overview. Biomass Convers. Biorefinery 2024, 14, 12699–12724. [Google Scholar] [CrossRef]
  16. Funke, A.; Ziegler, F. Hydrothermal Carbonization of Biomass: A Summary and Discussion of Chemical Mechanisms for Process Engineering. Biofuels Bioprod. Biorefining 2010, 4, 160–177. [Google Scholar] [CrossRef]
  17. Lynam, J.G.; Reza, M.T.; Yan, W.; Vásquez, V.R.; Coronella, C.J. Hydrothermal Carbonization of Various Lignocellulosic Biomass. Biomass Convers. Biorefinery 2015, 5, 173–181. [Google Scholar] [CrossRef]
  18. Hrnčič, M.K.; Kravanja, G.; Knez, Ž. Hydrothermal Treatment of Biomass for Energy and Chemicals. Energy 2016, 116, 1312–1322. [Google Scholar] [CrossRef]
  19. Wu, S.; Wang, Q.; Fang, M.; Wu, D.; Cui, D.; Pan, S.; Bai, J.; Xu, F.; Wang, Z. Hydrothermal Carbonization of Food Waste for Sustainable Biofuel Production: Advancements, Challenges, and Future Prospects. Sci. Total Environ. 2023, 897, 165327. [Google Scholar] [CrossRef]
  20. Zhang, B.; Biswal, B.K.; Zhang, J.; Balasubramanian, R. Hydrothermal Treatment of Biomass Feedstocks for Sustainable Production of Chemicals, Fuels, and Materials: Progress and Perspectives. Chem. Rev. 2023, 123, 7193–7294. [Google Scholar] [CrossRef]
  21. Guilayn, F.; Jimenez, J.; Monlau, F.; Vaneeckhaute, C. Valorisation of Anaerobic Digestate: Towards Value-Added Products. In Renewable Energy Technologies for Energy Efficient Sustainable Development; Springer Nature: Cham, Switzerland, 2022; pp. 227–262. [Google Scholar]
  22. Kumar, S. Hydrothermal Processing of Biomass for Biofuels. Biofuel Res. J. 2014, 1, 43. [Google Scholar] [CrossRef]
  23. Patel, S.K.S.; Das, D.; Kim, S.C.; Cho, B.-K.; Kalia, V.C.; Lee, J.-K. Integrating Strategies for Sustainable Conversion of Waste Biomass into Dark-Fermentative Hydrogen and Value-Added Products. Renew. Sustain. Energy Rev. 2021, 150, 111491. [Google Scholar] [CrossRef]
  24. Chalima, A.; Oliver, L.; Fernández de Castro, L.; Karnaouri, A.; Dietrich, T.; Topakas, E. Utilization of Volatile Fatty Acids from Microalgae for the Production of High Added Value Compounds. Fermentation 2017, 3, 54. [Google Scholar] [CrossRef]
  25. Gopalakrishnan, B.; Khanna, N.; Das, D. Dark-Fermentative Biohydrogen Production. In Biohydrogen; Elsevier: Amsterdam, The Netherlands, 2019; ISBN 9780444642035. [Google Scholar]
  26. Grossule, V.; Lavagnolo, M.C. Optimised Management of Semi-Aerobic Landfilling under Tropical Wet-Dry Conditions. Detritus 2020, 10, 160–169. [Google Scholar] [CrossRef]
  27. Moeller, L.; Zehnsdorf, A. Process Upsets in a Full-Scale Anaerobic Digestion Bioreactor: Over-Acidification and Foam Formation during Biogas Production. Energy. Sustain. Soc. 2016, 6, 30. [Google Scholar] [CrossRef]
  28. Slezak, R.; Grzelak, J.; Krzystek, L.; Ledakowicz, S. Influence of Initial PH on the Production of Volatile Fatty Acids and Hydrogen during Dark Fermentation of Kitchen Waste. Environ. Technol. 2021, 42, 4269–4278. [Google Scholar] [CrossRef]
  29. Md, M.R.; Mohamad, A.M.S.; Nasrin, S.; Kim, M.J.; Chang, S.R. Estimation of Total Volatile Fatty Acid (VFA) from Total Organic Carbons (TOCs) Assessment through in Vitro Fermentation of Livestock Feeds. African J. Microbiol. Res. 2013, 7, 1378–1384. [Google Scholar] [CrossRef]
  30. Wang, J.; Guo, X. The Gompertz Model and Its Applications in Microbial Growth and Bioproduction Kinetics: Past, Present and Future. Biotechnol. Adv. 2024, 72, 108335. [Google Scholar] [CrossRef]
  31. Boshagh, F.; Rostami, K.; van Niel, E.W.J. Application of Kinetic Models in Dark Fermentative Hydrogen Production–A Critical Review. Int. J. Hydrogen Energy 2022, 47, 21952–21968. [Google Scholar] [CrossRef]
  32. Kim, B.; Jeong, J.; Kim, J.; Hee Yoon, H.; Khanh Thinh Nguyen, P.; Kim, J. Mathematical Modeling of Dark Fermentation of Macroalgae for Hydrogen and Volatile Fatty Acids Production. Bioresour. Technol. 2022, 354, 127193. [Google Scholar] [CrossRef]
  33. González-Figueredo, C.; Alejandro Flores-Estrella, R.A.; Rojas-Rejón, O. Fermentation: Metabolism, Kinetic Models, and Bioprocessing. In Current Topics in Biochemical Engineering; IntechOpen: London, UK, 2019. [Google Scholar]
  34. Mu, Y.; Wang, G.; Yu, H.-Q. Kinetic Modeling of Batch Hydrogen Production Process by Mixed Anaerobic Cultures. Bioresour. Technol. 2006, 97, 1302–1307. [Google Scholar] [CrossRef]
  35. Pradhan, N.; Dipasquale, L.; D’Ippolito, G.; Fontana, A.; Panico, A.; Pirozzi, F.; Lens, P.N.L.; Esposito, G. Model Development and Experimental Validation of Capnophilic Lactic Fermentation and Hydrogen Synthesis by Thermotoga neapolitana. Water Res. 2016, 99, 225–234. [Google Scholar] [CrossRef] [PubMed]
  36. Li, W.; Zou, Y.; Yang, H.; Fu, X.; Xiang, S.; Li, Z. Two-Stage Stochastic Energy Scheduling for Multi-Energy Rural Microgrids With Irrigation Systems and Biomass Fermentation. IEEE Trans. Smart Grid 2025, 16, 1075–1087. [Google Scholar] [CrossRef]
  37. Huang, X.-Y.; Liu, C.-G.; Lin, Y.-H. A Novel Explainable Kinetic Model for Two-Stage Fermentation Profile. Chem. Eng. J. 2024, 493, 152745. [Google Scholar] [CrossRef]
  38. Wang, J.; Wan, W. Kinetic Models for Fermentative Hydrogen Production: A Review. Int. J. Hydrogen Energy 2009, 34, 3313–3323. [Google Scholar] [CrossRef]
  39. Lim, S.W.; Nandong, J. Modeling of Biohydrogen Production Using Generalized Multi-Scale Kinetic Model: Impacts of Fermentation Conditions. Int. J. Hydrogen Energy 2022, 47, 17926–17945. [Google Scholar] [CrossRef]
  40. Domińska, M.; Ślęzak, R.; Świątkiewicz, J.; Paździor, K.; Ledakowicz, S. Influence of Inoculum Thermal Pretreatment Time on Hydrogen Production in Dark Fermentation. Energies 2024, 17, 974. [Google Scholar] [CrossRef]
  41. Domińska, M.; Paździor, K.; Ślęzak, R.; Ledakowicz, S. The Influence of Inoculum Source and Pretreatment on the Biohydrogen Production in the Dark Fermentation Process. Chem. Process Eng. New Front. 2024, 45, e63. [Google Scholar] [CrossRef]
  42. Xiao, L.-P.; Shi, Z.-J.; Xu, F.; Sun, R.-C. Hydrothermal Carbonization of Lignocellulosic Biomass. Bioresour. Technol. 2012, 118, 619–623. [Google Scholar] [CrossRef]
  43. Broekaert, J.A.C.; Daniel, C. Harris: Quantitative Chemical Analysis, 9th ed. Anal. Bioanal. Chem. 2015, 407, 8943–8944. [Google Scholar] [CrossRef]
  44. Ikryannikova, L.N.; Kurbatov, L.K.; Gorokhovets, N.V.; Zamyatnin, A.A. Contact-Dependent Growth Inhibition in Bacteria: Do Not Get Too Close! Int. J. Mol. Sci. 2020, 21, 7990. [Google Scholar] [CrossRef]
  45. Bernier, S.P.; Surette, M.G. Concentration-Dependent Activity in Natural Environments. Front. Microbiol. 2013, 4, 20. [Google Scholar] [CrossRef]
  46. Tian, D.; Lin, Z.; Yu, J.; Yin, D. Influence Factors of Multicomponent Mixtures Containing Reactive Chemicals and Their Joint Effects. Chemosphere 2012, 88, 994–1000. [Google Scholar] [CrossRef]
  47. Bouarab-Chibane, L.; Forquet, V.; Lantéri, P.; Clément, Y.; Léonard-Akkari, L.; Oulahal, N.; Degraeve, P.; Bordes, C. Antibacterial Properties of Polyphenols: Characterization and QSAR (Quantitative Structure–Activity Relationship) Models. Front. Microbiol. 2019, 10, 829. [Google Scholar] [CrossRef] [PubMed]
  48. Cushnie, T.P.T.; Lamb, A.J. Recent Advances in Understanding the Antibacterial Properties of Flavonoids. Int. J. Antimicrob. Agents 2011, 38, 99–107. [Google Scholar] [CrossRef] [PubMed]
  49. Sharma, P.; Melkania, U. Effect of Phenolic Compounds on Hydrogen Production from Municipal Solid Waste. Waste Manag. 2018, 78, 115–123. [Google Scholar] [CrossRef]
  50. Brandt, K. Final Report on the Safety Assessment of Hydroquinone and Pyrocatechol. J. Am. Coll. Toxicol. 1986, 5, 123–165. [Google Scholar] [CrossRef]
  51. Chen, H.; Yao, J.; Wang, F.; Zhou, Y.; Chen, K.; Zhuang, R.; Choi, M.M.F.; Zaray, G. Toxicity of Three Phenolic Compounds and Their Mixtures on the Gram-Positive Bacteria Bacillus Subtilis in the Aquatic Environment. Sci. Total Environ. 2010, 408, 1043–1049. [Google Scholar] [CrossRef]
  52. Torres-Vargas, J.A.; Cheng-Sánchez, I.; Martínez-Poveda, B.; Medina, M.Á.; Sarabia, F.; García-Caballero, M.; Quesada, A.R. Characterization of the Activity and the Mechanism of Action of a New Toluquinol Derivative with Improved Potential as an Antiangiogenic Drug. Biomed. Pharmacother. 2022, 155, 113759. [Google Scholar] [CrossRef]
  53. Nweke, C.O.; Okpokwasili, G.C. Influence of Exposure Time on Phenol Toxicity to Refinery Wastewater Bacteria. J. Environ. Chem. Ecotoxicol. 2010, 2, 20–27. [Google Scholar]
  54. Api, A.M.; Belsito, D.; Botelho, D.; Bruze, M.; Burton, G.A.; Cancellieri, M.A.; Chon, H.; Dagli, M.L.; Dekant, W.; Deodhar, C.; et al. RIFM Fragrance Ingredient Safety Assessment, 4-Hydroxybenzaldehyde, CAS Registry Number 123-08-0. Food Chem. Toxicol. 2023, 176, 113794. [Google Scholar] [CrossRef]
  55. Dzulkarnain, E.L.N.; Audu, J.O.; Wan Dagang, W.R.Z.; Abdul-Wahab, M.F. Microbiomes of Biohydrogen Production from Dark Fermentation of Industrial Wastes: Current Trends, Advanced Tools and Future Outlook. Bioresour. Bioprocess. 2022, 9, 16. [Google Scholar] [CrossRef]
  56. Detman, A.; Laubitz, D.; Chojnacka, A.; Kiela, P.R.; Salamon, A.; Barberan, A.; Chen, Y.; Yang, F.; Blaszczyk, M.K.; Sikora, A. Dynamics of Dark Fermentation Microbial Communities in the Light of Lactate and Butyrate Production. Microbiome 2021, 9, 158. [Google Scholar] [CrossRef]
  57. Laqa, K.F.; Razavi, A.S.; Hosseini Koupaie, E.; Hafez, H.; Elbeshbishy, E. Effect of Hydrothermal Pretreatment on Volatile Fatty Acids and Methane Production from Thickened Waste Activated Sludge. In Proceedings of the 93rd Water Environment Federation Technical Exhibition and Conference (WEFTEC 2020), New Orleans, LA, USA, 5–9 October 2020; pp. 1082–1087. [Google Scholar]
  58. Jilani, S.B.; Olson, D.G. Mechanism of Furfural Toxicity and Metabolic Strategies to Engineer Tolerance in Microbial Strains. Microb. Cell Fact. 2023, 22, 221. [Google Scholar] [CrossRef]
  59. Zeng, X.; Borole, A.P.; Pavlostathis, S.G. Biotransformation of Furanic and Phenolic Compounds with Hydrogen Gas Production in a Microbial Electrolysis Cell. Environ. Sci. Technol. 2015, 49, 13667–13675. [Google Scholar] [CrossRef]
  60. Mohanakrishna, G.; Sneha, N.P.; Rafi, S.M.; Sarkar, O. Dark Fermentative Hydrogen Production: Potential of Food Waste as Future Energy Needs. Sci. Total Environ. 2023, 888, 163801. [Google Scholar] [CrossRef]
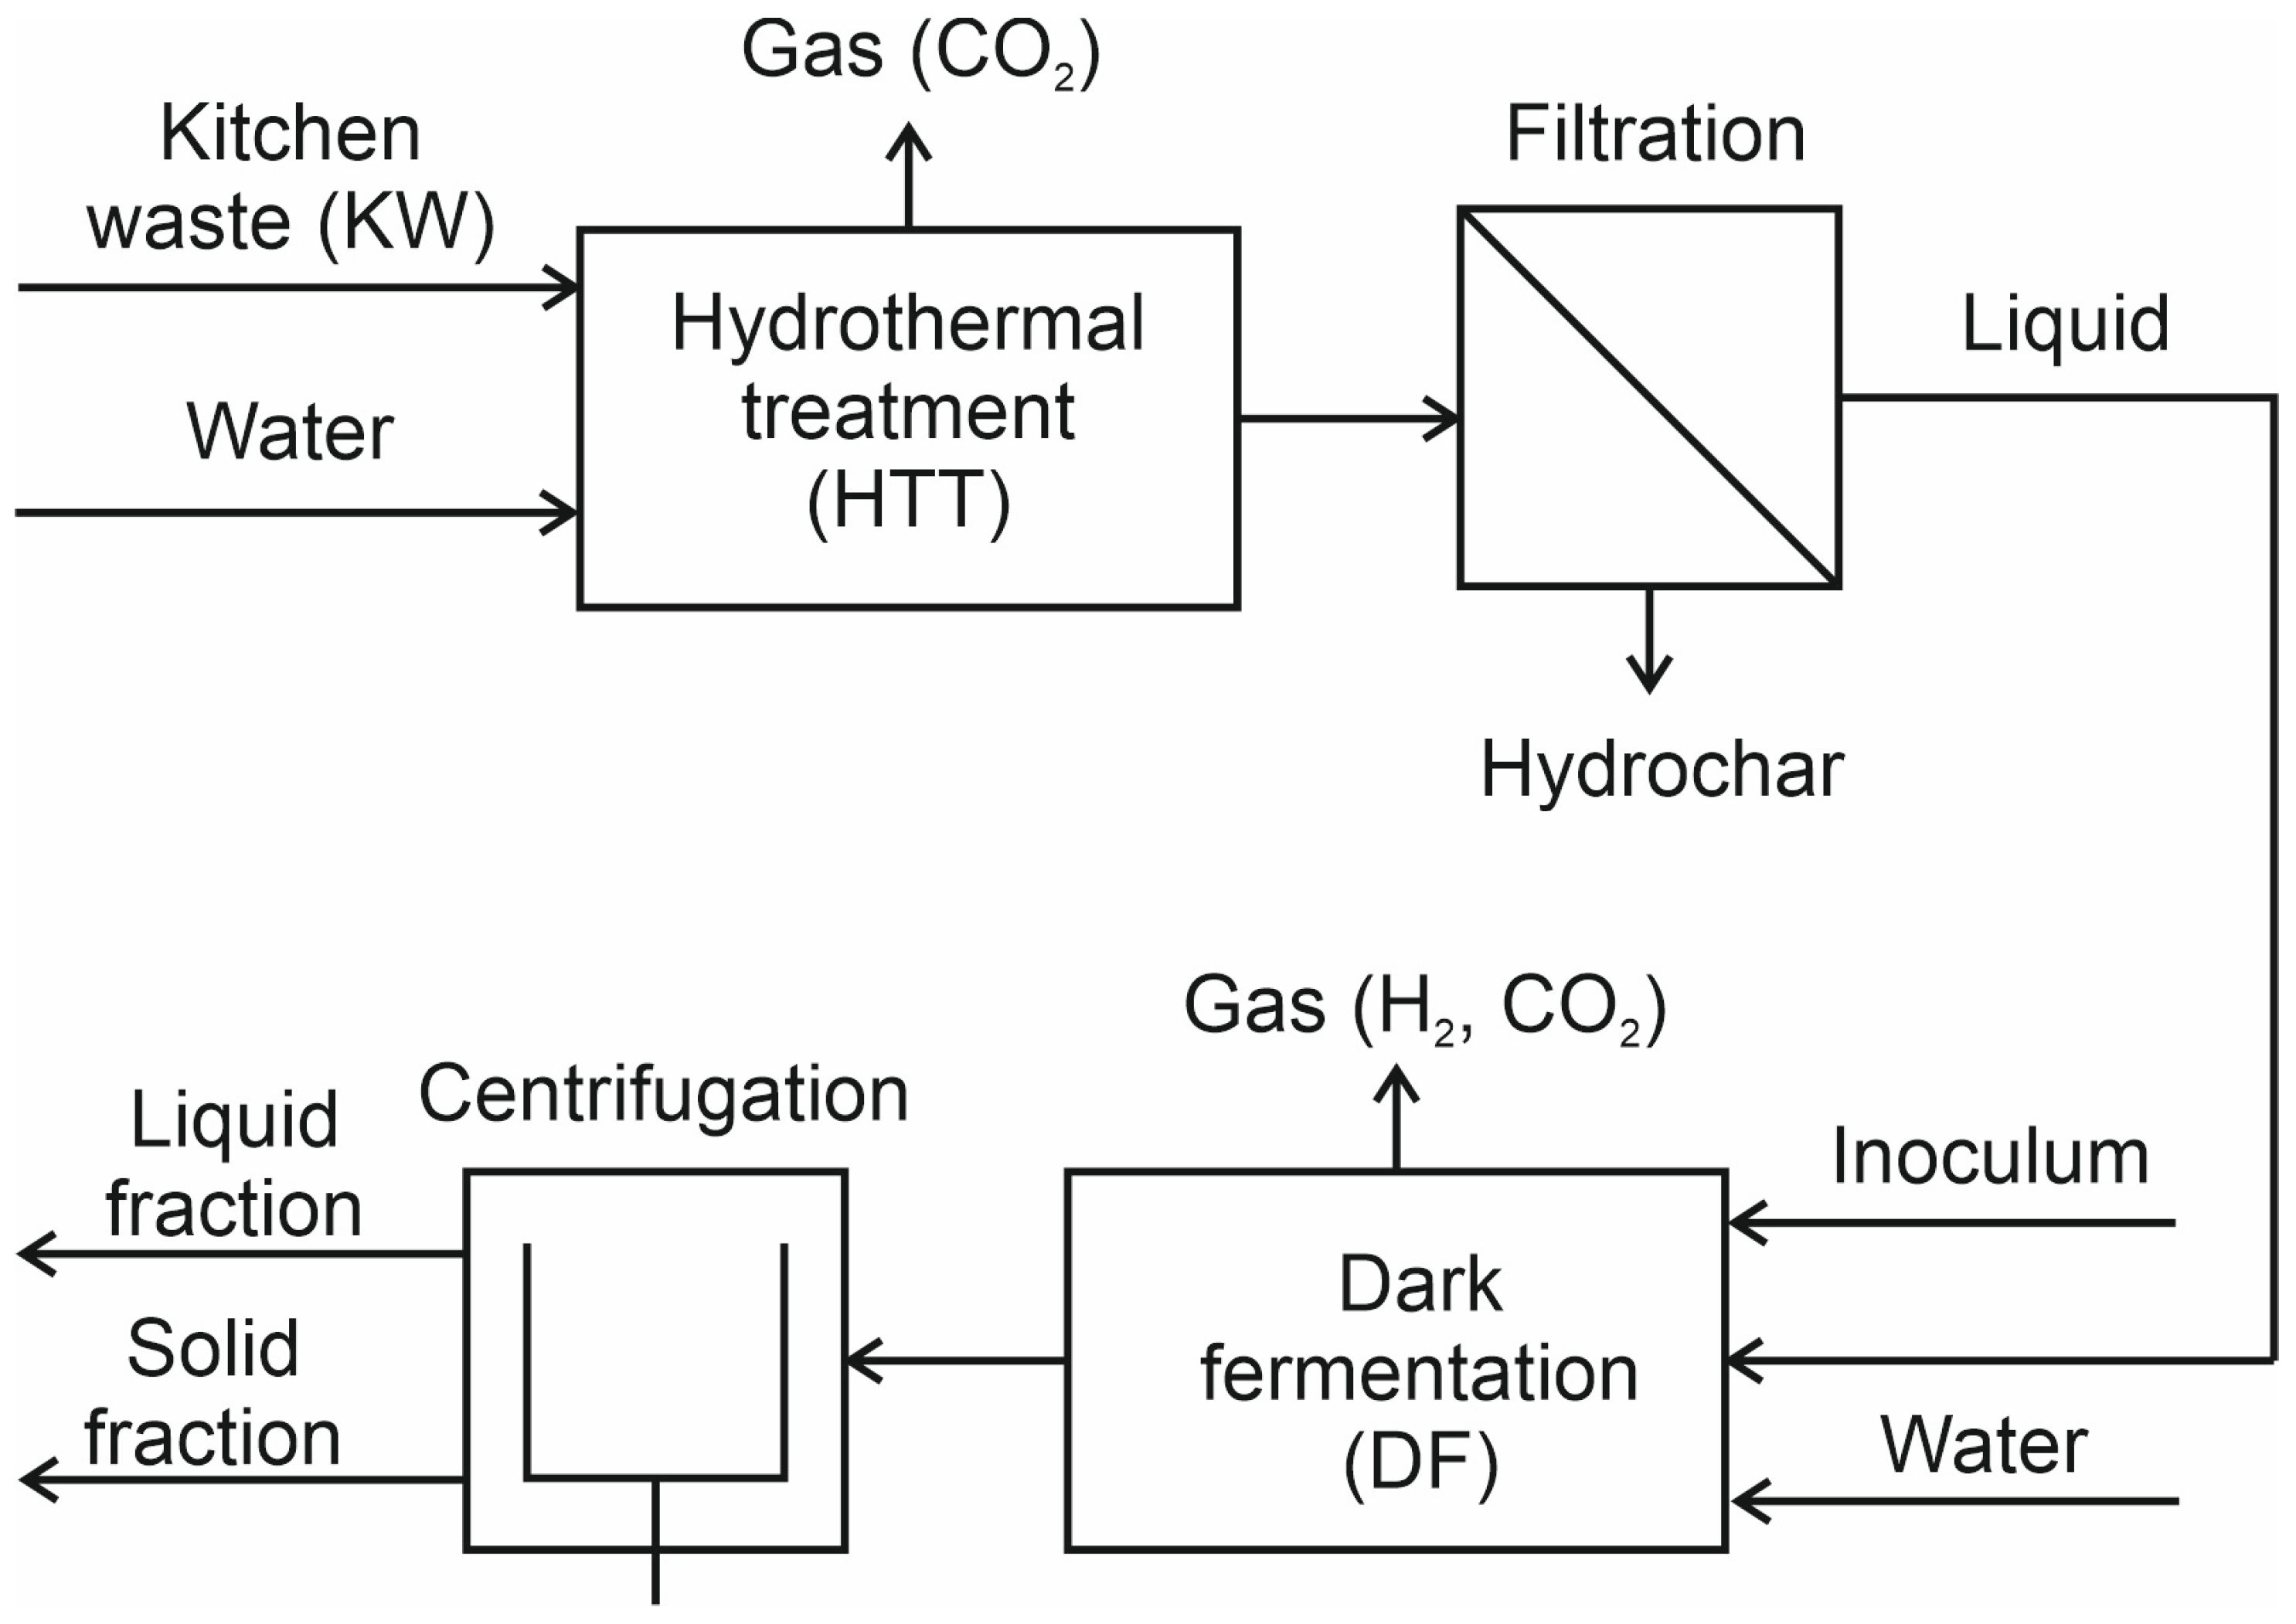
Figure 1. Block diagram illustrating the experimental workflow, from thermal pretreatment of KW to DF.
Energies 18 05811 g001
Figure 2. Monitoring pH changes before and after dark fermentation.
Energies 18 05811 g002
Figure 3. The amount and composition of VFAs after DF.
Energies 18 05811 g003
Figure 4. The VFAs-to-TOC ratio after DF.
Energies 18 05811 g004
Figure 5. Hydrogen content in fermentation gas and H2 to CO2 ratio.
Energies 18 05811 g005
Figure 6. Cumulative hydrogen production and Gompertz model fitting to experimental data from liquid after HTC.
Energies 18 05811 g006
Table 1. Characteristics of the inoculum and kitchen waste.
ParameterInoculumKitchen Waste
pH7.14 ± 0.044.86 ± 0.05
TS (g/L)27.91 ± 0.310.158 ± 0.002
TVS (g/L)17.49 ± 0.300.147 ± 0.002
C (%TS)32.09 ± 0.1345.48 ± 0.19
N (%TS)3.96 ± 0.031.83 ± 0.01
H (%TS)5.20 ± 0.046.13 ± 0.06
C/N6.17 ± 0.1724.85 ± 0.11
Table 2. Calculated parameters of the Gompertz equation.
Parameter25 °C57 °C75 °C92 °C110 °C 0.5 h110 °C 3.5 h145 °C180 °C215 °C250 °CUnit
Bmax5.3214.412.221.266.711.925.4367.020.80.297mL/gTVSKW
Rm15.6439.286.3353.0317.5833.9788.98128.475.890.267mL/gTVSKW/d
λ0.320.200.320.190.310.310.350.361.040.03d
R20.9990.9990.9990.9990.9990.9990.9990.9990.9360.921-
Disclaimer/Publisher’s Note: The statements, opinions and data contained in all publications are solely those of the individual author(s) and contributor(s) and not of MDPI and/or the editor(s). MDPI and/or the editor(s) disclaim responsibility for any injury to people or property resulting from any ideas, methods, instructions or products referred to in the content.